Embed Size (px)
Citation preview

Annual ReportTHE WHARF (HOLDINGS) LIMITED
Stock Code: 4
THE WHARF (HOLDINGS) LIMITED Stock Code: 4
2015

Founded in 1886, The Wharf (Holdings) Limited (Stock code: 4) is a premier company with HK$444 billion of total assets. Backed by a long standing mission of “Building for Tomorrow” and a proven execution track record, the Group has produced consistent and productive performance over the years. As one of only seven constituent stocks from the original Hang Seng Index of 50 years ago, Wharf is among the top local blue chips that are most actively traded and widely held. Over the past 10 years, earnings per share have doubled and dividends per share have increased by 138%, for a compound annual growth rate of 9%.
The Group is active in Hong Kong and Mainland China with prime real estate as primary strategic focus. Site acquisition, development and marketing are its core competencies while mall development and retail management remain its strategic differentiation. The Group also owns an emerging hotel business under Wharf Hotels, valuable port assets under Modern Terminals, and Communications, Media & Entertainment assets in Hong Kong.
Investment Properties (“IP”) in Hong Kong and China continues to grow over the years and has been a key growth driver for the Group. With a book value of HK$310 billion, it accounted for 76% of the Group’s core profit in 2015.
Harbour City and Times Square are flagships in this portfolio. The former is a global landmark with international showcase effect for retailers and a regional landmark for shoppers. The latter, with its prominent 17-level mall design and expertly-managed trade mix, is among the most successful vertical malls globally.
The portfolio also extends to the prime Central business district, the Peak and the new CBD2 in Kowloon East.
In Central, recent acquisitions included the iconic Murray Building (for conversion into a unique urban chic hotel) in 2013, Crawford House in Queen’s Road Central in 2014 and the office tower and a prime shop in Wheelock House in Pedder Street subsequent to the year end.
On the Peak, home to the ultimate in exclusive and exquisite residences, the portfolio displays a landmark collection of the most luxurious residences with a total attributable GFA of about 400,000 square feet.
In Kowloon East, immense untapped potential is being unlocked with the exceptional “Kowloon East Waterfront Portfolio” which comprises Kowloon Godown and Wharf T&T Square, as well as parent company Wheelock’s One Bay East, all located in the new vibrant CBD2 and span a 500-metre coastline with a stunning Victoria Harbour view.
CORPORATE PROFILE

China IP has started to bear fruit, with addition of a series of five IFSs. Phase one of Chengdu opened in early 2014 and the smaller Wuxi opened in late 2014. Chongqing is scheduled to open in 2017, followed by Changsha and Suzhou. Among them, Chengdu IFS and Changsha IFS are set to match Harbour City in scale and dominance to become landmarks. Times Outlet represents another product strategy with Chengdu having already established itself and Changsha to open soon.
On China Development Properties (“DP”), attributable contracted sales in 2015 increased to a record RMB26 billion, 21% over 2014. Net order book at year-end increased to RMB25 billion (net of business tax). With a land bank of about 8.4 million square metres spanning 15 cities in the Mainland, the Group continues to be selective in land acquisition focusing on first-tier and top second-tier cities.
Marco Polo currently operates 14 hotels in the Asia Pacific region, six of which owned by the Group. A solid pipeline of new hotels is set to expand Marco Polo’s portfolio in Asia Pacific over the next few years. The Group introduces an exclusive collection of “sophisticated urban chic” hotels under the luxury brand Niccolo, with the first one opening in Chengdu IFS in April 2015. Conversion of Murray Building in Central, Hong Kong, into a Niccolo hotel is scheduled for opening in 2017.
“Building for Tomorrow” also extends to Wharf’s ”Business-in-Community” pursuit. In addition to the flagship school improvement programme “Project WeCan”, the Wharf Hong Kong Secondary School Art Competition and Wharf Architectural Design Internship have gained traction over the years. Backed by 1,000 staff volunteers, the Group has also supported a series of “Business-in-Community” initiatives benefitting different segments of society. The Group was named a constituent member of the “Hang Seng Corporate Sustainability Index” in 2015, an index that covers the top 30 corporate sustainability leaders in Hong Kong, in recognition of the Group’s sound performance in corporate social responsibility.

1 Corporate Profi le
4 Corporate Information
5 Group Business Structure
7 Chairman’s Statement
12 Financial Highlights
14 Business Review
64 Awards and Recognitions
68 Corporate Social Responsibility
80 Financial Review
86 Corporate Governance Report
106 Directors’ Report
123 Independent Auditor’s Report
124 Consolidated Income Statement
125 Consolidated Statement of
Comprehensive Income
126 Consolidated Statement of Financial Position
127 Consolidated Statement of Changes in Equity
128 Consolidated Statement of Cash Flows
130 Notes to the Financial Statements
170 Principal Accounting Policies
183 Principal Subsidiaries, Associates and
Joint Ventures
188 Schedule of Principal Properties
198 Ten-year Financial Summary
C O N T E N T S
16 HARBOUR CITY
24 TIMES SQUARE
32 PLAZA HOLLYWOOD
34 THE PEAK PORTFOLIO & OTHER HK PROPERTIES
40 CHINA INVESTMENT PROPERTIES
50 CHINA DEVELOPMENT PROPERTIES
54 WHARF HOTELS
58 MODERN TERMINALS
62 COMMUNICATIONS, MEDIA & ENTERTAINMENT

The Wharf (Holdings) L imited | Annual Report 20154
CORPORATE INFORMATION
BOARD OF DIRECTORS
Mr Stephen T H Ng, Chairman & Managing DirectorMr Andrew O K Chow, Deputy ChairmanMs Doreen Y F Lee, Vice ChairmanMr Paul Y C Tsui, Vice Chairman & Group Chief Financial OfficerMs Y T Leng
Mr K P Chan
Independent Non-executive Directors
Mr Alexander S K Au, OBE
Professor Edward K Y Chen, GBS, CBE, JP
Hon Vincent K Fang, SBS, JP
Mr Hans Michael Jebsen, BBS
Mr David M Turnbull
Professor E K Yeoh, GBS, OBE, JP
COMPANY SECRETARY
Mr Kevin C Y Hui, FCCA, CPA
AUDITORS
KPMG, Certified Public Accountants
PRINCIPAL BANKER
The Hongkong and Shanghai Banking Corporation Limited
REGISTRARS
Tricor Tengis Limited
Level 22, Hopewell Centre
183 Queen’s Road East
Hong Kong
REGISTERED OFFICE
16th Floor, Ocean Centre, Harbour City,
Canton Road, Kowloon, Hong Kong
Telephone: (852) 2118 8118
Fax: (852) 2118 8018
Website: www.wharfholdings.com
The Wharf (Holdings) L imited | Annual Report 2015 5
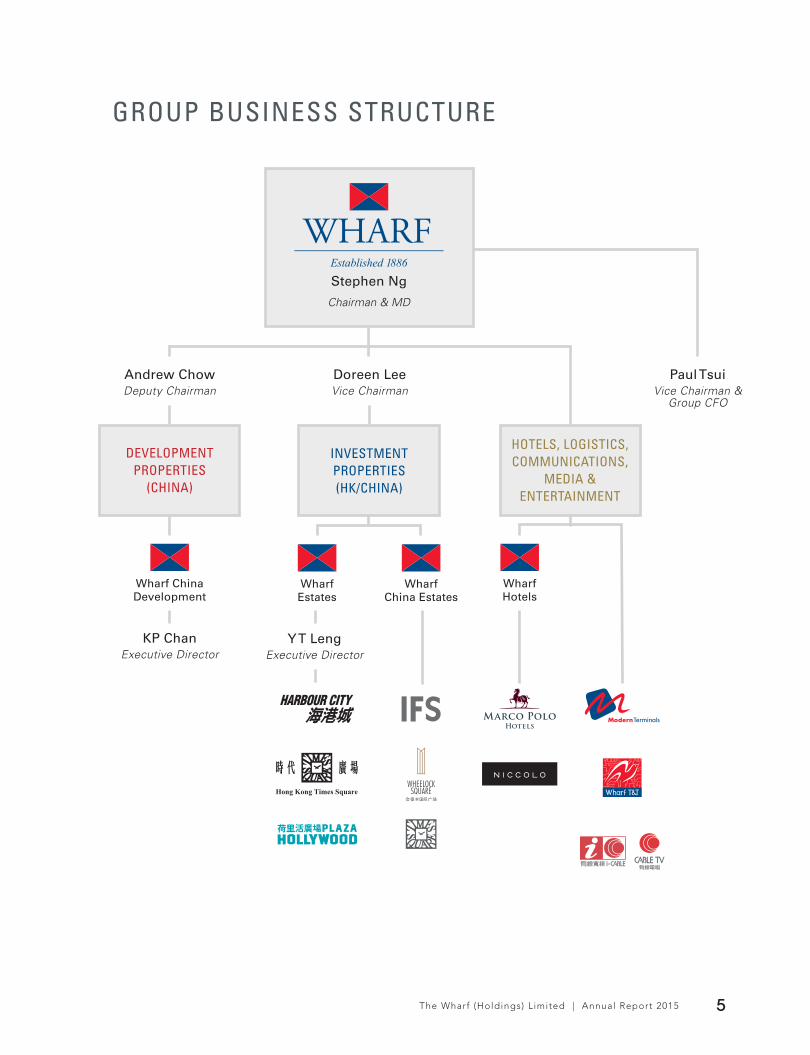
GROUP BUSINESS STRUCTURE
Paul TsuiVice Chairman &
Group CFO
Andrew ChowDeputy Chairman
Wharf China Development
KP ChanExecutive Director
DEVELOPMENTPROPERTIES
(CHINA)
Stephen Ng
Chairman & MD
HOTELS, LOGISTICS,COMMUNICATIONS,
MEDIA &ENTERTAINMENT
WharfHotels
Doreen LeeVice Chairman
INVESTMENTPROPERTIES(HK/CHINA)
WharfChina Estates
Y T LengExecutive Director
WharfEstates
In Building for Tomorrow, Wharf has achieved a few
“firsts” in the past decades. That includes the f irst al l -
weather mall in Hong Kong (Ocean Terminal) , the f irst
and only mall with retail sales reaching 7% of Hong Kong
retai l sales (Harbour City), the f irst 17-storey vertical
mall in Hong Kong (T imes Square) and the f irst 40-storey
industrial building in Hong Kong (CABLE TV Tower).
Wharf has also been Building for Tomorrow in other
sectors. That includes building and operating of the f irst
cruise terminal in Hong Kong (Ocean Terminal) , the f irst
container terminal in Hong Kong (Modern Terminals),
the f irst cross-harbour tunnel in Hong Kong (Hunghom
Tunnel) , the f irst electronic tol l collection system in
Hong Kong (Autopass), the f irst multi-channel Pay TV
service in Hong Kong (CABLE TV), and the f irst 24-hour
news channel in Cantonese in the world ( i -CABLE News).
CHAIRMAN'S STATEMENT
The Wharf (Holdings) L imited | Annual Report 20158
CHAIRMAN'S STATEMENT
It is my great honour to present my first statement to Shareholders as Chairman of Wharf. I wish to begin by expressing my sincerest gratitude to my predecessor, Hon Peter K C Woo. Mr Woo retired from the Board, after 37 years, at the AGM in May 2015. His leadership during these years has transformed the Company and taken it to the forefront among local companies.
GENERAL ECONOMY2015 was a tough year on all fronts for Hong Kong. The global economy had entered an era of low growth. Developed economies remained stagnant and emerging economies were slowing down. Interest rate hike in the U.S., currency instability, as well as the reform in transition in China further clouded the global economic outlook.
China’s economy grew by 6.9% in 2015, its slackest pace in a quarter century, underlining a “new normal” of slower but high-quality growth for a more sustainable and environmentally friendly development. A structural transition towards services and consumption was making good headway as consumer spending contributed 66% of GDP growth, the biggest contribution since 2001. For the fi rst time, a booming services sector accounted for over half of the economy, climbing to 50.5%. In the property market, against the backdrop of a slowing economy, a string of easing measures stimulated buying activities. However, it would be prudent to plan on a slower-growth China as the substantial catch up phase of China’s development has concluded several years ago.
In Hong Kong, the economy recorded a modest 2.4% growth rate in 2015. An increase in outbound travels by locals and a decrease in tourist arrivals, caused principally by a strong Hong Kong dollar, combined to cast a further shadow on the bumpy retail and hospitality sectors. The perceptions of an unwelcoming or even unsafe Hong Kong, which worried some travellers, have worsened the situation. As a result, total visitor arrivals decreased by 2.5% to 59.3 million and total retail sales dropped by 3.7% to HK$475.2 billion. Some have described the market as facing its worst retail woes since the 1997 fi nancial crisis.
BUSINESS PERFORMANCEOur proven management and execution capabilities have guided our businesses well through tough times. Resilience of Investment Properties (“IP”), our principal core business, underpinned group performance. Our malls in Hong Kong (Harbour City, Times Square and Plaza Hollywood) reported solid rental growth backed by our unique advantageous elements that include critical mass, showcase effect and best-positioned destination retail, despite a dip in retail sales amidst diffi cult trading conditions. In addition, offi ce performance during the year was gratifying.
IP core profi t increased by 9% to HK$8.3 billion. That helped to increase IP contribution to core profi t to 76% (2014: 73%) and underpinned a net IP revaluation surplus of HK$6.2 billion in an uncertain market. As a proactive operator, we rolled out a range of mall enhancement initiatives and innovative marketing programmes to uplift exhilarating one-stop “Shoppertainment” experiences in our malls that enchant new and regular shoppers.
Harbour City remains a global retail landmark and one of the most coveted destinations for top brands. Its unique positioning as an international showcase in the region attracted new and sought-after brands. We continued to improve retail offer with the most differentiating and aspirational brands and dedicated special efforts in spicing up our culinary offerings to bring surprises and enjoyment to visitors. A series of value-accretive initiatives are underway, including the 4-storey extension building at Ocean Terminal, and they are set to enhance the competitive edge of the one-stop shopping mecca.

The Wharf (Holdings) L imited | Annual Report 2015 9
Times Square remains one of the world’s most successful vertical malls. A slew of trade mix revamp and enhancement works, including the conversion of 9th-10th fl oors into a lifestyle hub, creation of a kids zone on 13A fl oor, and relocation of some tenants with new images, are progressing well and will further unlock the hidden value of the shopping landmark, offering latest fashion and new culinary options to visitors.
In China, the Group’s IP started to bear fruit, lifting revenue by 16% to HK$2.3 billion and operating profi t by 25% to HK$1.2 billion. Chengdu IFS stood out to post stellar results, with retail performance exceeding the Group’s expectation. Its superb location and distinguished positioning outshine the competition. Office leasing is well on track, particularly with fi nancial services tenant. Less than a year from opening, Niccolo Chengdu, the Group’s fi rst “sophisticated urban chic” hotel, is already leading the city on room yield and won prestigious awards, such as the “Best Luxury Wedding Hotel” by CHINA MAG, “Best New Hotel Brand – Luxury” at the 5th China Hotel Awards, as well as “Best New Hotels” at the 2015 China Travel Awards, hosted by Travel+ Magazine.
China retail is a pillar of the Group’s new engine for revenue and valuation growth. Times Outlet and IFS complex in Chengdu showed continued strength and the retail-oriented IFS complexes in Chongqing and Changsha are poised to tap strong experience-oriented consumption in the years to come. Ideally located at the heart of their respective core CBD, Chengdu IFS and Changsha IFS are set to match Harbour City and Times Square in scale and market positioning.
On the Development Properties (“DP”) front, the Group’s attributable interest in contracted sales surged to a record RMB26 billion, 21% over 2014 and above target. Net order book at year-end increased to RMB25 billion (net of business tax). Inclusive of joint ventures and associates on an attributable basis, revenue increased by 18% to HK$27.4 billion and operating profi t by 51% to HK$4.2 billion. The Group continued to pursue a prudent approach to further land purchases to focus on fewer target cities, with seven DP sites acquired in 2015/16 in Beijing, Hangzhou and Foshan directly or through joint ventures for RMB6.8 billion on an attributable basis.
FINANCIAL RESULTSGroup core profi t increased by 5% to HK$11.0 billion on solid rental operations and Mainland completions. Together with the net surplus from IP revaluation and other exceptional items, profi t attributable to Shareholders was HK$16.0 billion and earnings per share were HK$5.29. Total assets were stable at HK$444 billion, with IP portfolio increasing by 3% to HK$310 billion and DP portfolio (excluding joint ventures and associates) decreasing to HK$38 billion. Book net asset value increased to HK$308 billion (or HK$101.53 per share) net of decreases in exchange and investment reserves.
The Group maintains robust fi nancial health. Net debt at year-end decreased by HK$12 billion to HK$47 billion. Gearing ratio fell to 14.9% (2014: 18.9%).
In lieu of a fi nal dividend, a second interim dividend of HK$1.35 per share (2014: HK$1.26) has been declared to bring the total dividend for the year to HK$1.90 per share (2014: HK$1.81).
BUSINESS-IN-COMMUNITYWe are honoured to be recognised by the community for our effort in community investment. Our long-standing mission of “Building for Tomorrow” creates a solid pathway to Corporate Social Responsibility (CSR). With our “Business-in-Community” initiatives, we adopt a long-term vision in generating positive impact and lasting value to the society.

The Wharf (Holdings) L imited | Annual Report 201510
CHAIRMAN'S STATEMENT
Project WeCan is designed to provide assistance to the underprivileged students in society. Launched in 2011, it has scaled up to serve a total of 50 less advantageous secondary schools, supporting over 42,000 deserving students in Hong Kong. A wide variety of activities have been organised to nurture students’ confi dence and inspire them to pursue higher studies and fulfi lling careers. A joint annual school event “Young Innovators Bazaar” was held in January at Plaza Hollywood, where 500 students from 25 Project WeCan participating schools gained fi rst hand experience in setting up and running their own businesses for a few days. Company visits, job-tasting and other career development opportunities, as well as a host of summer programmes, were also organized to help the students create meaningful life. On top of that, a Joint School Teachers’ Development Day was held to offer more all-rounded support to more than 2,600 teachers and headmasters from 50 partner schools who attended the event.
The Group supported Hong Kong Ocean Day 2015 in September by sending a corporate team to join other professional divers to clean the ocean around Sharp Island in Sai Kung. About 200 Project WeCan students took part in an eco-tour and scuba-dived to witness the beauty under the water thereby raising their awareness of marine conservation.
These efforts would not have been possible without the support of our corporate partners and colleagues of our business units. I wish to applaud their efforts to serve the community and express my sincerest gratitude.
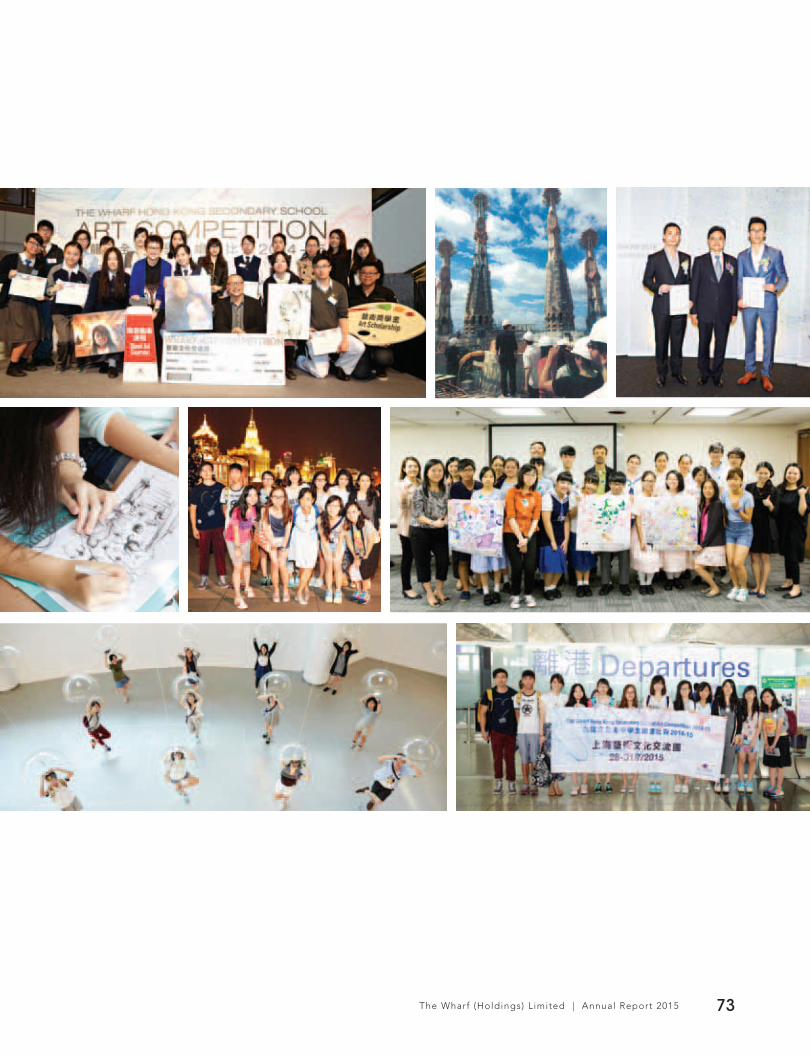
The Wharf Hong Kong Secondary School Art Competition has continued to raise public awareness on art and
culture as well as to cultivate home-grown young talents. The top 18 finalists are eligible to apply for the Wharf
Art Scholarship to pursue further studies in art-related bachelor programmes in local and overseas universities.
For the past four years since the scholarship is available, nine have been fully funded to pursue art and design
related studies in top notch universities.
Since 2011, the Group has sponsored 12 outstanding architectural postgraduates via The Architectural Design Internship Programme to intern in renowned architectural fi rms in different parts of the world, France, Germany, Italy, Switzerland and the United Kingdom, to India and Japan.
We also published our fi rst standalone CSR Report in accordance with the internationally recognised guidelines Global Reporting Initiative (GRI). The report covers the economic, environmental and social performances across the Group’s major businesses in Hong Kong.
OUTLOOKAn uneven recovery, the divergence in monetary policy instilling more volatile fund flows, weak oil prices and interest rate hikes are adding to uncertainties over the global economic outlook in 2016. It is important to stay alert to "competitive devaluation" as this would result in the pie getting smaller. The U.S. and China need to take leadership to steer other nations to avoid that trap. As quantitative easing phases out in the U.S., a gradual move towards suitable fi scal stimulus is the direction the world needs.
The second largest economy in the world at our door step will continue to buttress Hong Kong. China pledged to maintain an annual GDP growth of at least 6.5% and to create a moderately prosperous society by 2020 in its latest fi ve-year plan (2016–2020). While China is moving towards a domestically and market-driven model, the “new normal” will bring both new challenges and risks. That said, a healthier domestic market will usher in new sources of growth, putting China on a more competitive trajectory. Across a range of issues, the commitment to double per-capita income by 2020 over 2010 levels will accelerate urbanization and wealth accumulation for coming decades. Hong Kong is the world’s leading super service platform, hitting the sweet spot on needs in China brought by urbanization, service sector intensifi cation and consumerism. The Group is well poised to tap these opportunities.
The Wharf (Holdings) L imited | Annual Report 2015 11
Back in Hong Kong, the local economy is projected to expand by 1–2% in 2016 and by 3% per annum from 2017 to 2020. In the near term, Hong Kong’s retail and hospitality industries may remain weak but the government is allocating funding and taking additional initiatives to resuscitate the fl agging tourism industry. Construction of the Hong Kong-Zhuhai-Macau Bridge is underway, which will foster closer co-operation among the three places and stimulate economic activities for our retail and personal services platform.
The substantial devaluation of the Yen and the Euro in recent years is hurting Hong Kong and particularly its retail sector. International brands are making product price adjustments and the process continues. Nobody sees this as a permanent structural situation.
Furthermore, our proven management and execution track record provide confi dence to our tenants, shoppers and investors, offering consistencies and productivity by our destination and well-located properties. This is manifested in positive lease renewals which add to the traction and continuing demand, keeping our showcase status resilient.
On behalf of all Shareholders and my fellow Directors, I wish to pay special tribute to all Staff for their high levels of dedication, professionalism and contribution throughout the year.
Wharf has successfully weathered cycles in the past. I am immensely grateful to Mr Woo for the solid foundation he has laid for the Group. We have remarkable assets in unique and prime locations, a seasoned management team, and dedicated and professional staff. I have worked with them for many years and have every confi dence the Group will continue to rise to the challenge.
Stephen T H NgChairman and Managing DirectorHong Kong9 March 2016
The Wharf (Holdings) L imited | Annual Report 201512
FINANCIAL HIGHLIGHTS
2015 2014
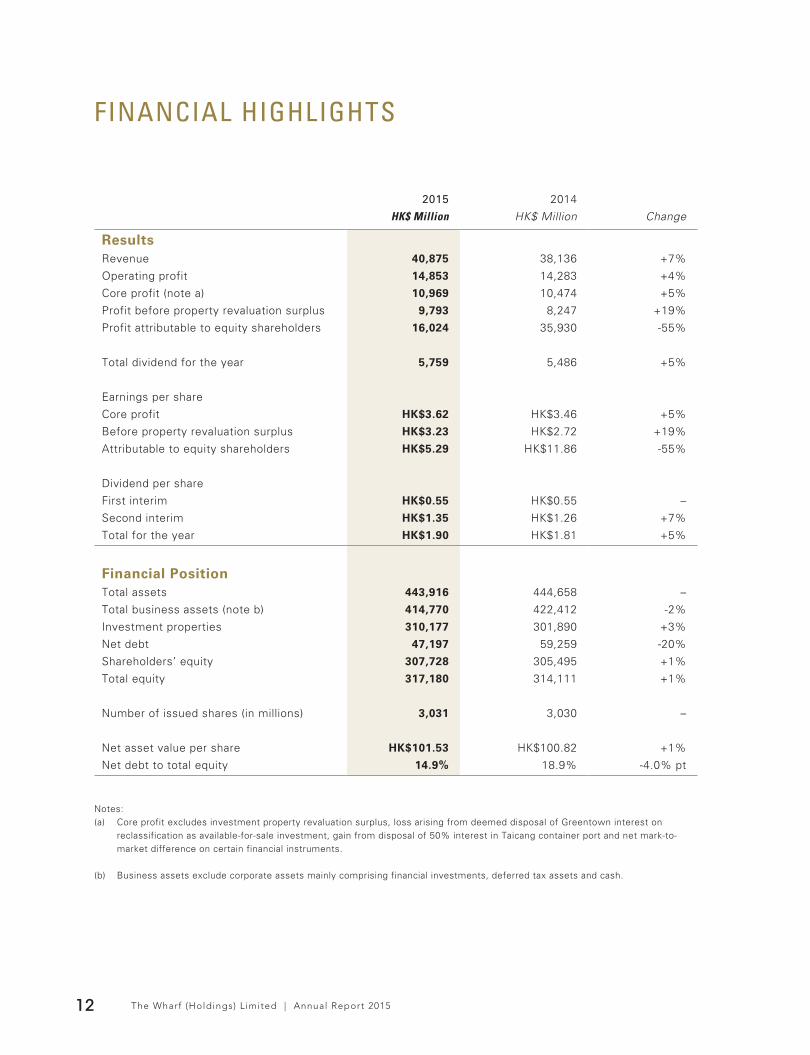
HK$ Million HK$ Million Change ResultsRevenue 40,875 38,136 +7%
Operating profit 14,853 14,283 +4%
Core profit (note a) 10,969 10,474 +5%
Profit before property revaluation surplus 9,793 8,247 +19%
Profit attributable to equity shareholders 16,024 35,930 -55%
Total dividend for the year 5,759 5,486 +5%
Earnings per share
Core profit HK$3.62 HK$3.46 +5%
Before property revaluation surplus HK$3.23 HK$2.72 +19%
Attributable to equity shareholders HK$5.29 HK$11.86 -55%
Dividend per share
First interim HK$0.55 HK$0.55 –
Second interim HK$1.35 HK$1.26 +7%
Total for the year HK$1.90 HK$1.81 +5%
Financial PositionTotal assets 443,916 444,658 –
Total business assets (note b) 414,770 422,412 -2%
Investment properties 310,177 301,890 +3%
Net debt 47,197 59,259 -20%
Shareholders’ equity 307,728 305,495 +1%
Total equity 317,180 314,111 +1%
Number of issued shares (in millions) 3,031 3,030 –
Net asset value per share HK$101.53 HK$100.82 +1%
Net debt to total equity 14.9% 18.9% -4.0% pt
Notes:(a) Core profit excludes investment property revaluation surplus, loss arising from deemed disposal of Greentown interest on
reclassification as available-for-sale investment, gain from disposal of 50% interest in Taicang container port and net mark-to-market difference on certain financial instruments.
(b) Business assets exclude corporate assets mainly comprising financial investments, deferred tax assets and cash.

The Wharf (Holdings) L imited | Annual Report 2015 13
CORE PROFIT(HK$ Million)
0 2,000 4,000 6,000 8,000 10,000 12,000
10,9691514
10
13
09
12
08
11
0706
DIVIDENDPER SHARE(HK$)
0.0 0.5 1.0 1.5 2.0
1.901514
10
13
09
12
08
11
0706
REVENUE(HK$ Million)
1514
10
13
09
12
08
11
0706
0 10,000 20,000 30,000 40,000 50,000
40,875
OPERATING PROFIT(HK$ Million)
0 3,000 6,000 9,000 12,000 15,000
14,8531514
10
13
09
12
08
11
0706
EARNINGS PER SHARECORE PROFIT(HK$)
0.0 0.5 1.0 1.5 2.0 2.5 3.0 3.5 4.0
3.621514
10
13
09
12
08
11
0706
PROFIT ATTRIBUTABLE TO EQUITY SHAREHOLDERS(HK$ Million)
0 10,000 20,000 30,000 40,000 50,000
16,0241514
10
13
09
12
08
11
0706
SHAREHOLDERS' EQUITY(HK$ Million)
0 50,000 100,000 150,000 200,000250,000300,000350,000
307,7281514
10
13
09
12
08
11
0706
EARNINGS PER SHAREATTRIBUTABLE TO EQUITY SHAREHOLDERS(HK$)
0 5 10 15 20
1514
10
13
09
12
08
11
0706
5.29
NET ASSET VALUE PER SHARE(HK$)
0 20 40 60 80 100 120
101.531514
10
13
09
12
08
11
0706

16 HARBOUR CITY
24 TIMES SQUARE
32 PLAZA HOLLYWOOD
34 THE PEAK PORTFOLIO & OTHER HK PROPERTIES
40 CHINA INVESTMENT PROPERTIES
50 CHINA DEVELOPMENT PROPERTIES
54 WHARF HOTELS
58 MODERN TERMINALS
62 COMMUNICATIONS, MEDIA & ENTERTAINMENT
BUSINESSREVIEW

The Wharf (Holdings) L imited | Annual Report 2015 15
• Hong Kong Investment Properties (“IP”) experienced a slowdown in growth amidst a
weak market but still produced solid results. Revenue increased by 7% to HK$12,165
million and operating profit by 6% to HK$10,516 million. The Group’s prime and quality
malls continued to provide the best operating environment for retailers to trade, to have
effect market presence and to enhance one-stop lifestyle experience for shoppers. Office
performance added impetus.
• China IP began to bear fruit, lifting revenue by 16% to HK$2,305 million, and operating
profit by 25% to HK$1,243 million. In particular, Chengdu IFS showed continued strength,
with retail performance exceeding expectation. Its distinguished positioning makes it
stand out in a competitive market.
• For China Development Properties, inclusive of joint ventures and associates on an
attributable basis, revenue increased by 18% to HK$27,404 million and operating profit by
51% to HK$4,200 million.
• Through Marco Polo Hotels, the Group currently operates 14 hotels in the Asia Pacific
region, six of which are owned by Wharf Hotels. A solid pipeline of new hotels is set to
expand this portfolio in Asia Pacific over the next few years.
• The subdued global trade flows amid the wobbling economies in Europe and the US
resulted to the drop of South China’s container throughput by 4% from a year earlier.
Shenzhen’s throughput increased by 2% while Kwai Tsing’s declined by 12%.
• The Communications, Media and Entertainment segment under Wharf Communications
represented 9% of Group turnover and 1% of Group operating profit.

172,292 HK$ million
BUSINESS ASSETS
9,882HK$ million
GROSS REVENUE
7,846HK$ million
OPERATING PROFIT
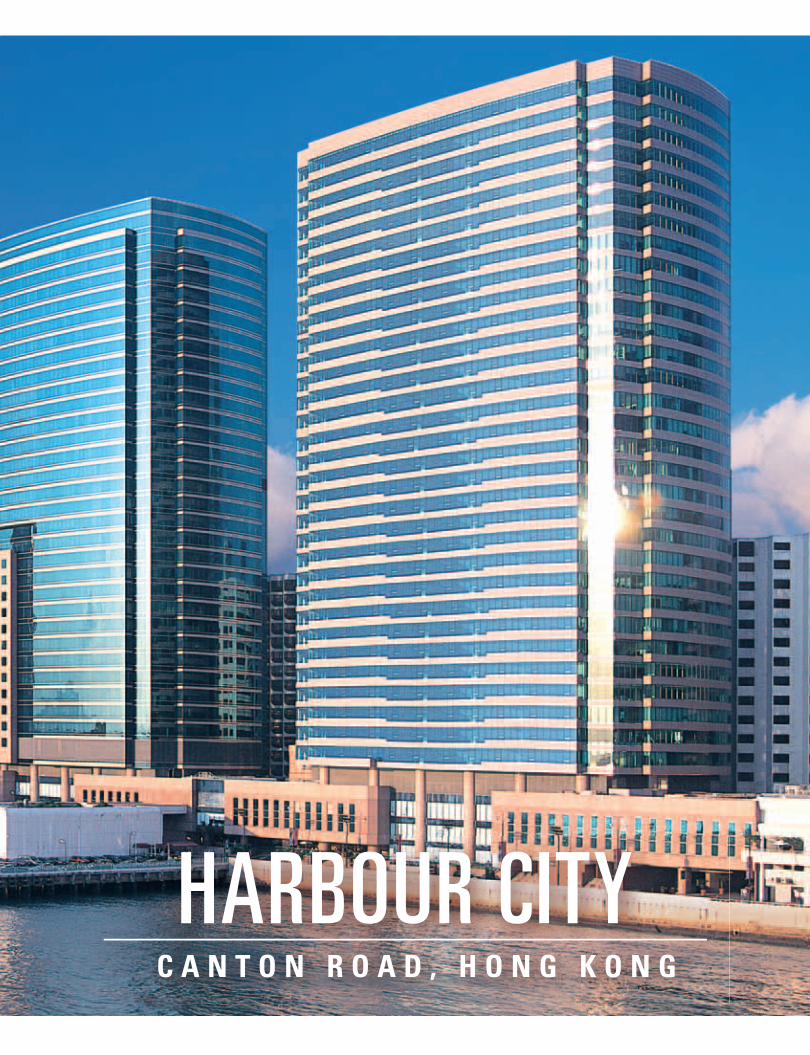
C A N T O N R O A D , H O N G K O N G
HARBOUR CITY
HARBOUR CITYBUSINESS REVIEW
The Wharf (Holdings) L imited | Annual Report 201518
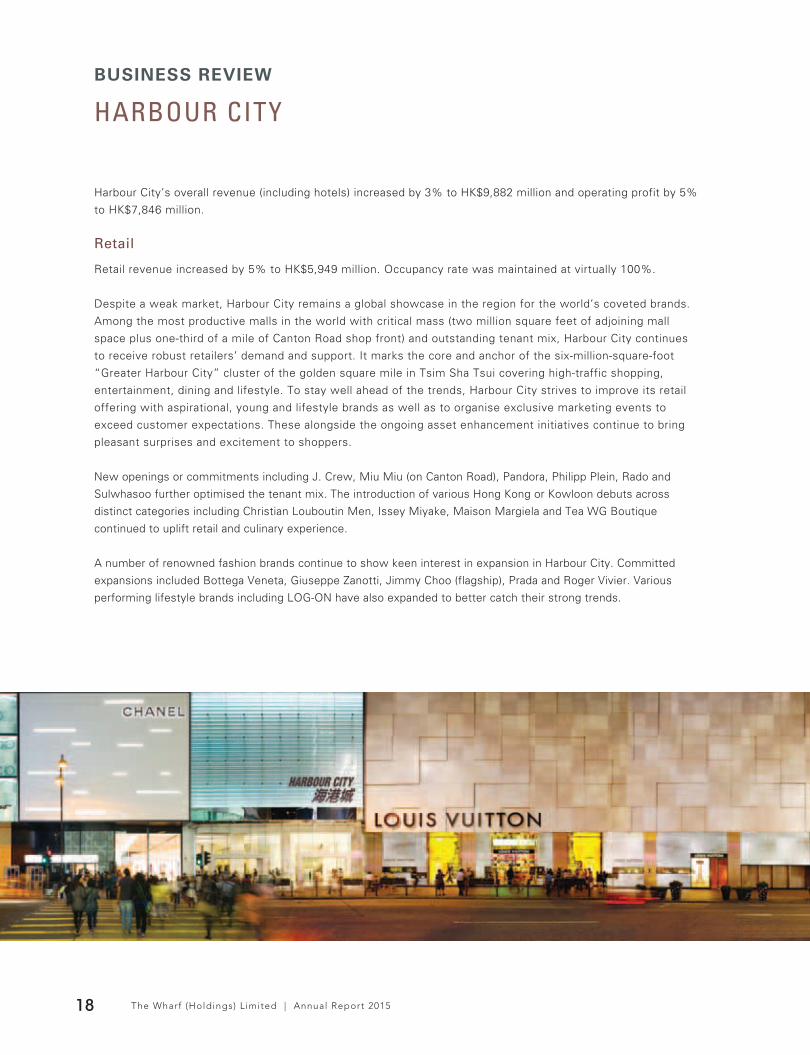
Harbour City’s overall revenue (including hotels) increased by 3% to HK$9,882 million and operating profit by 5%
to HK$7,846 million.
Retail
Retail revenue increased by 5% to HK$5,949 million. Occupancy rate was maintained at virtually 100%.
Despite a weak market, Harbour City remains a global showcase in the region for the world’s coveted brands.
Among the most productive malls in the world with critical mass (two million square feet of adjoining mall
space plus one-third of a mile of Canton Road shop front) and outstanding tenant mix, Harbour City continues
to receive robust retailers’ demand and support. It marks the core and anchor of the six-million-square-foot
“Greater Harbour City” cluster of the golden square mile in Tsim Sha Tsui covering high-traffic shopping,
entertainment, dining and lifestyle. To stay well ahead of the trends, Harbour City strives to improve its retail
offering with aspirational, young and lifestyle brands as well as to organise exclusive marketing events to
exceed customer expectations. These alongside the ongoing asset enhancement initiatives continue to bring
pleasant surprises and excitement to shoppers.
New openings or commitments including J. Crew, Miu Miu (on Canton Road), Pandora, Philipp Plein, Rado and
Sulwhasoo further optimised the tenant mix. The introduction of various Hong Kong or Kowloon debuts across
distinct categories including Christian Louboutin Men, Issey Miyake, Maison Margiela and Tea WG Boutique
continued to uplift retail and culinary experience.
A number of renowned fashion brands continue to show keen interest in expansion in Harbour City. Committed
expansions included Bottega Veneta, Giuseppe Zanotti, Jimmy Choo (flagship), Prada and Roger Vivier. Various
performing lifestyle brands including LOG-ON have also expanded to better catch their strong trends.
The Wharf (Holdings) L imited | Annual Report 2015 19
Ocean Terminal’s enhancement works, poised for further value creation, are taking shape and progressing to plan.
Premises improvement including the retail and culinary upgrade on the third floor is making good headway while new
exciting offerings including Ballin, Leonard Paris, MM6, Pleats Please and Vivienne Westwood Café are attracting
incremental patronage. The extension building, targeted for opening by mid-2017, will create new culinary options
with a wondrous panoramic view of Victora Harbour and city skyline.
Conversion works on the fourth floor at Gateway were completed. Adidas (flagship), China Tang (Kowloon debut) and
other pleasant retail concepts will be opened in 2016.
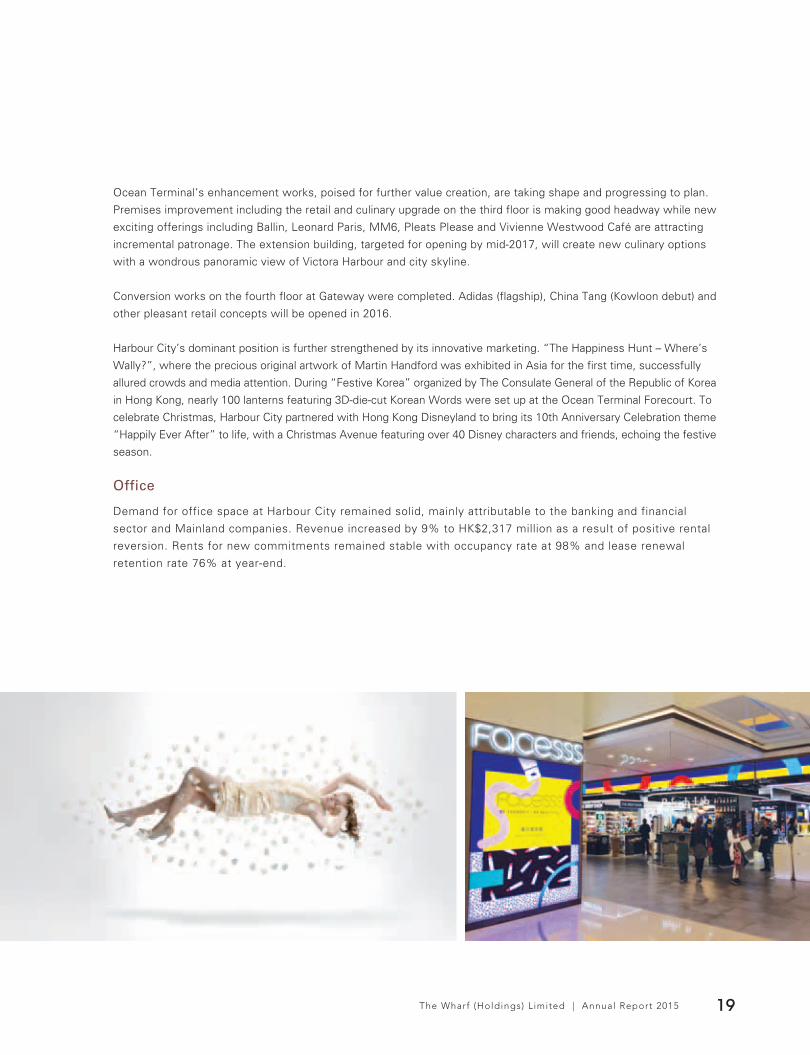
Harbour City’s dominant position is further strengthened by its innovative marketing. “The Happiness Hunt – Where’s
Wally?”, where the precious original artwork of Martin Handford was exhibited in Asia for the first time, successfully
allured crowds and media attention. During “Festive Korea” organized by The Consulate General of the Republic of Korea
in Hong Kong, nearly 100 lanterns featuring 3D-die-cut Korean Words were set up at the Ocean Terminal Forecourt. To
celebrate Christmas, Harbour City partnered with Hong Kong Disneyland to bring its 10th Anniversary Celebration theme
“Happily Ever After” to life, with a Christmas Avenue featuring over 40 Disney characters and friends, echoing the festive
season.
Office
Demand for office space at Harbour City remained solid, mainly attributable to the banking and financial
sector and Mainland companies. Revenue increased by 9% to HK$2,317 million as a result of positive rental
reversion. Rents for new commitments remained stable with occupancy rate at 98% and lease renewal
retention rate 76% at year-end.
HARBOUR CITYBUSINESS REVIEW
The Wharf (Holdings) L imited | Annual Report 201520
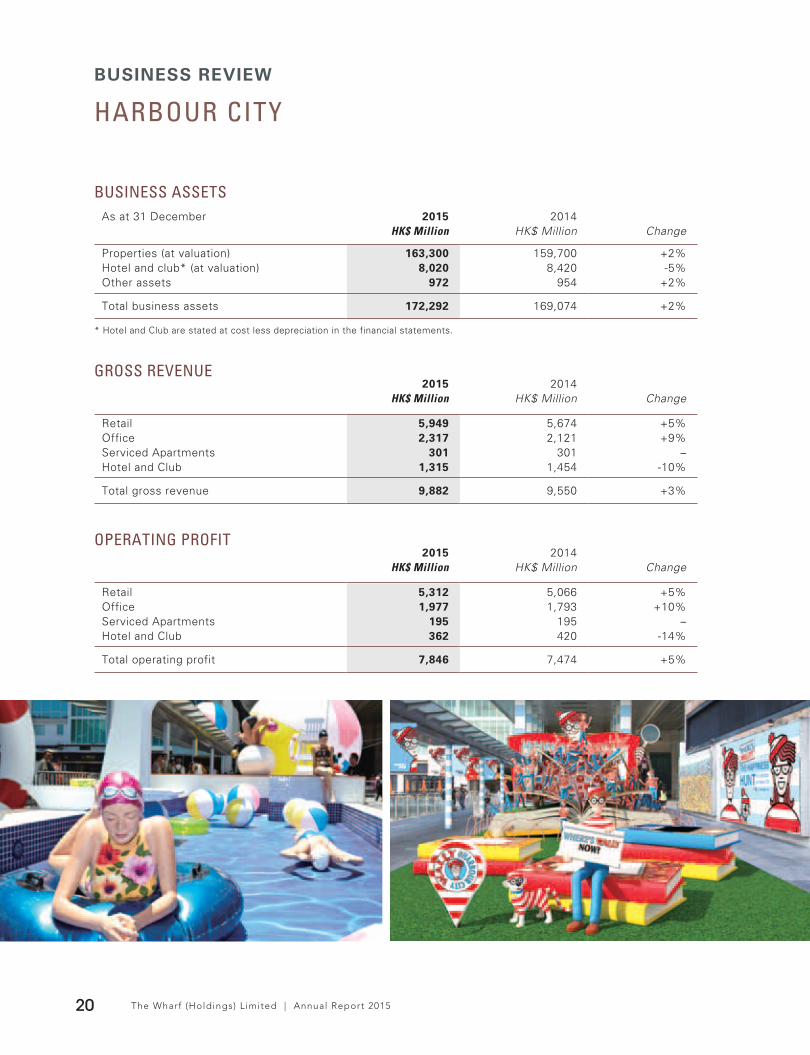
BUSINESS ASSETSAs at 31 December 2015 2014
HK$ Million HK$ Million Change
Properties (at valuation) 163,300 159,700 +2%Hotel and club* (at valuation) 8,020 8,420 -5%Other assets 972 954 +2%
Total business assets 172,292 169,074 +2% * Hotel and Club are stated at cost less depreciation in the financial statements.
GROSS REVENUE2015 2014
HK$ Million HK$ Million Change
Retail 5,949 5,674 +5%Office 2,317 2,121 +9%Serviced Apartments 301 301 –Hotel and Club 1,315 1,454 -10%
Total gross revenue 9,882 9,550 +3%
OPERATING PROFIT2015 2014
HK$ Million HK$ Million Change
Retail 5,312 5,066 +5%Office 1,977 1,793 +10%Serviced Apartments 195 195 –Hotel and Club 362 420 -14%
Total operating profit 7,846 7,474 +5%
The Wharf (Holdings) L imited | Annual Report 2015 21
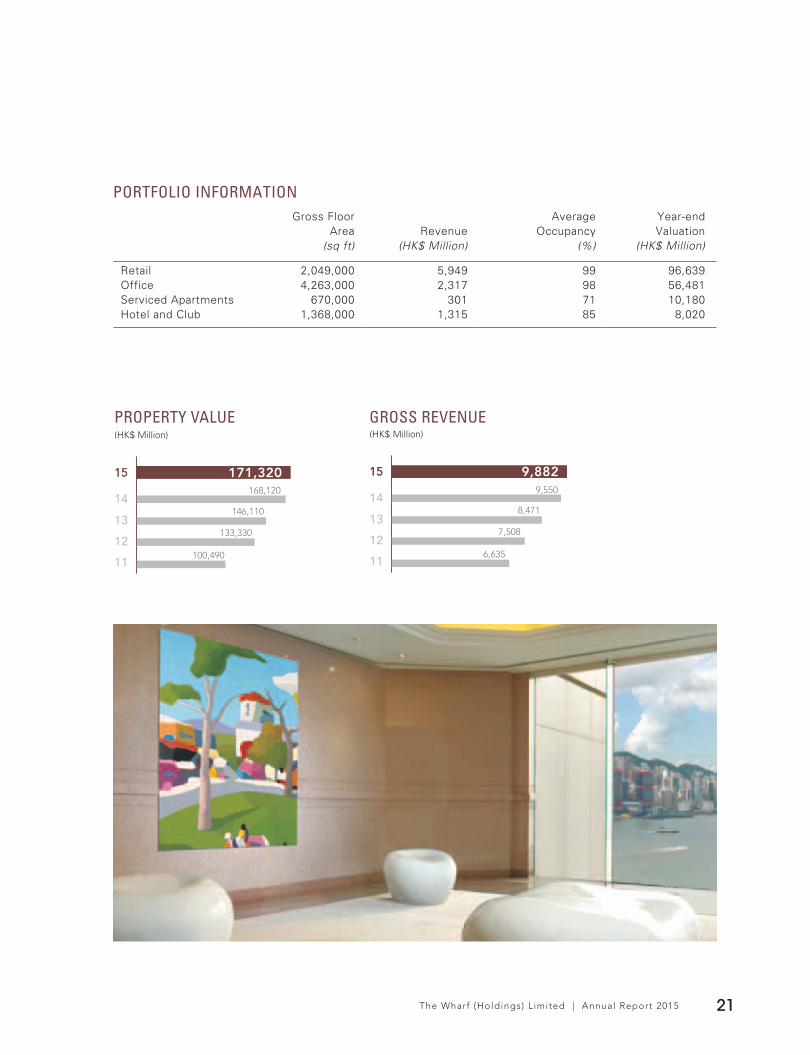
PROPERTY VALUE(HK$ Million)
1515
14
13
12
11
168,120
146,110
133,330
100,490
171,320
GROSS REVENUE(HK$ Million)
15159,550
8,471
7,508
6,635
9,882
14
13
12
11
PORTFOLIO INFORMATIONGross Floor
Area RevenueAverage
OccupancyYear-endValuation
(sq ft) (HK$ Million) (%) (HK$ Million)
Retail 2,049,000 5,949 99 96,639Office 4,263,000 2,317 98 56,481Serviced Apartments 670,000 301 71 10,180Hotel and Club 1,368,000 1,315 85 8,020
HARBOUR CITYBUSINESS REVIEW
The Wharf (Holdings) L imited | Annual Report 201522
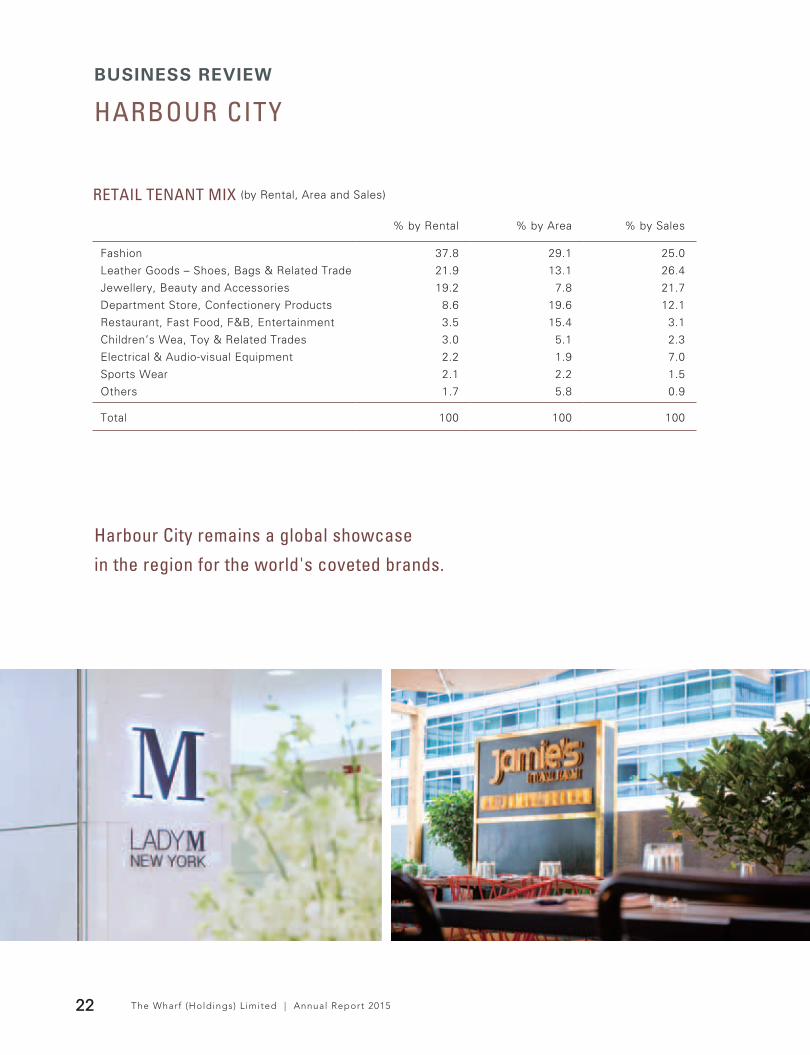
RETAIL TENANT MIX (by Rental, Area and Sales)
% by Rental % by Area % by Sales
Fashion 37.8 29.1 25.0
Leather Goods – Shoes, Bags & Related Trade 21.9 13.1 26.4
Jewellery, Beauty and Accessories 19.2 7.8 21.7
Department Store, Confectionery Products 8.6 19.6 12.1
Restaurant, Fast Food, F&B, Entertainment 3.5 15.4 3.1
Children’s Wea, Toy & Related Trades 3.0 5.1 2.3
Electrical & Audio-visual Equipment 2.2 1.9 7.0
Sports Wear 2.1 2.2 1.5
Others 1.7 5.8 0.9
Total 100 100 100
Harbour City remains a global showcase
in the region for the world's coveted brands.

The Wharf (Holdings) L imited | Annual Report 2015 23
Total retail sales of
HK$ 30.7 BILLION
Average retail sales of
HK$ 2,377
per square foot per month
80+ MILLION
Total GFA of
8.35
with an annual footfall of
High fashion retail frontage of
1/3 MILE
equivalent to the most prime section of Ginza, Tokyo; Avenue Montaigne, Paris; and Fifth Avenue, New York
MILLION SQUARE FEET
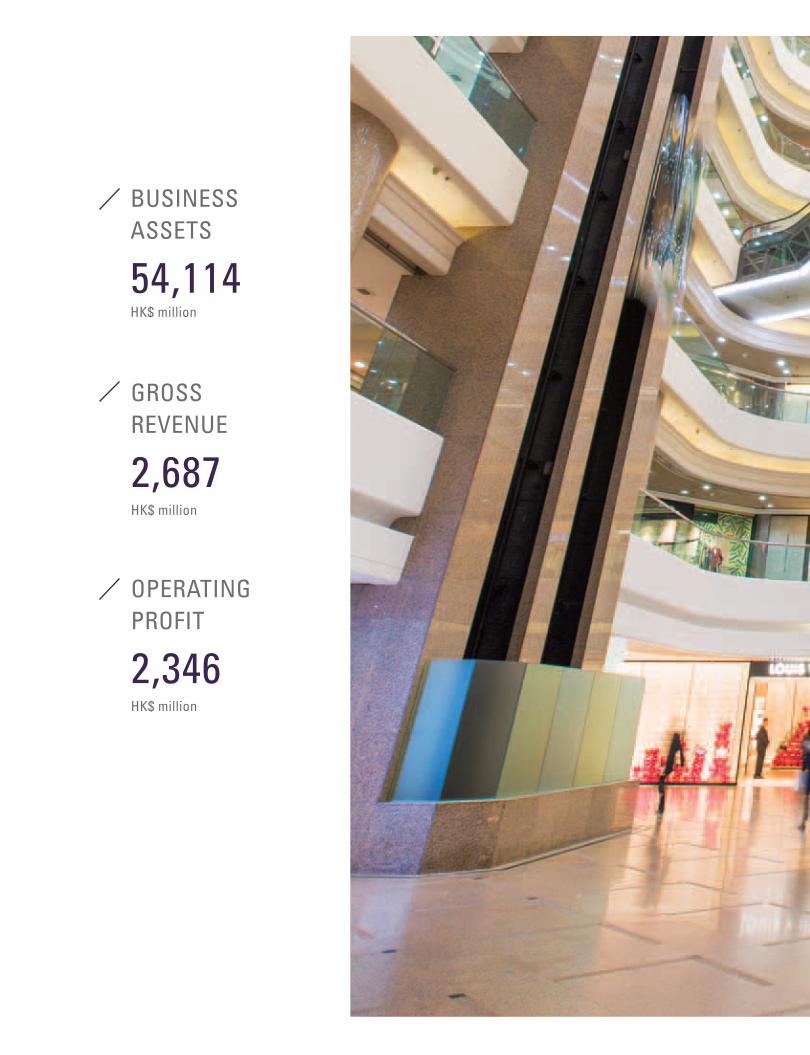
54,114 HK$ million
BUSINESS ASSETS
2,687HK$ million
GROSS REVENUE
2,346HK$ million
OPERATING PROFIT

C A U S E W A Y B A Y, H O N G K O N G
TIMES SQUARE
TIMES SQUAREBUSINESS REVIEW
The Wharf (Holdings) L imited | Annual Report 201526
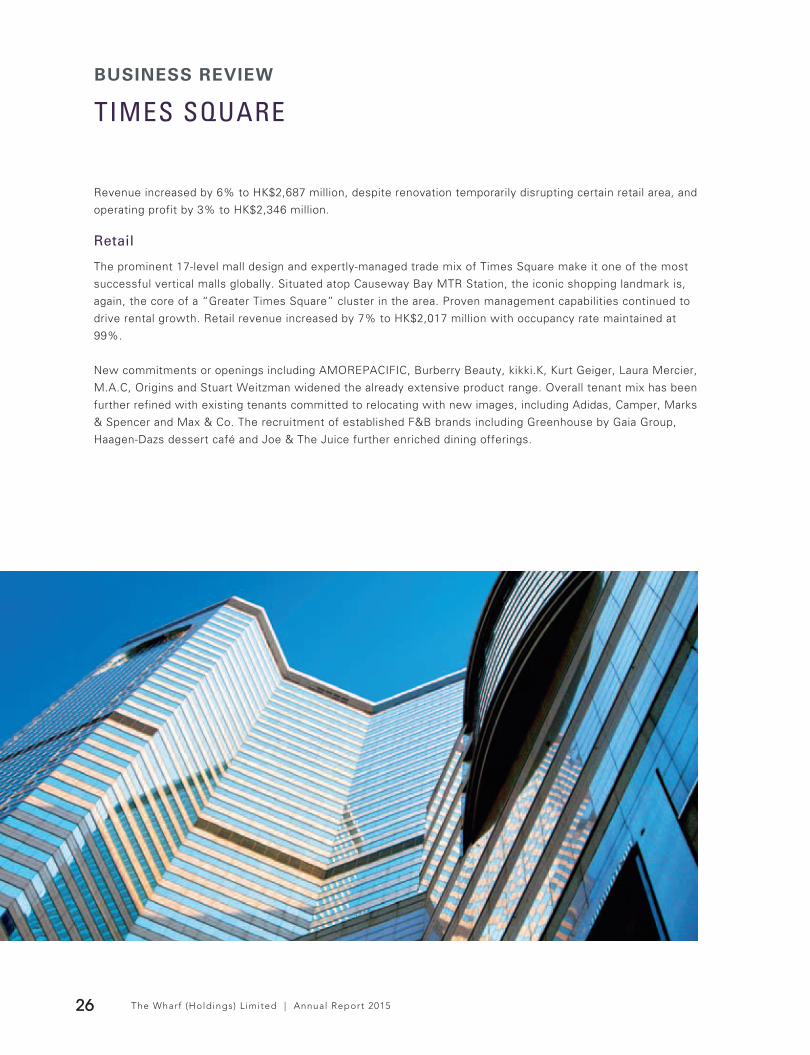
Revenue increased by 6% to HK$2,687 million, despite renovation temporarily disrupting certain retail area, and
operating profit by 3% to HK$2,346 million.
Retail
The prominent 17-level mall design and expertly-managed trade mix of Times Square make it one of the most
successful vertical malls globally. Situated atop Causeway Bay MTR Station, the iconic shopping landmark is,
again, the core of a “Greater Times Square” cluster in the area. Proven management capabilities continued to
drive rental growth. Retail revenue increased by 7% to HK$2,017 million with occupancy rate maintained at
99%.
New commitments or openings including AMOREPACIFIC, Burberry Beauty, kikki.K, Kurt Geiger, Laura Mercier,
M.A.C, Origins and Stuart Weitzman widened the already extensive product range. Overall tenant mix has been
further refined with existing tenants committed to relocating with new images, including Adidas, Camper, Marks
& Spencer and Max & Co. The recruitment of established F&B brands including Greenhouse by Gaia Group,
Haagen-Dazs dessert café and Joe & The Juice further enriched dining offerings.
The Wharf (Holdings) L imited | Annual Report 2015 27
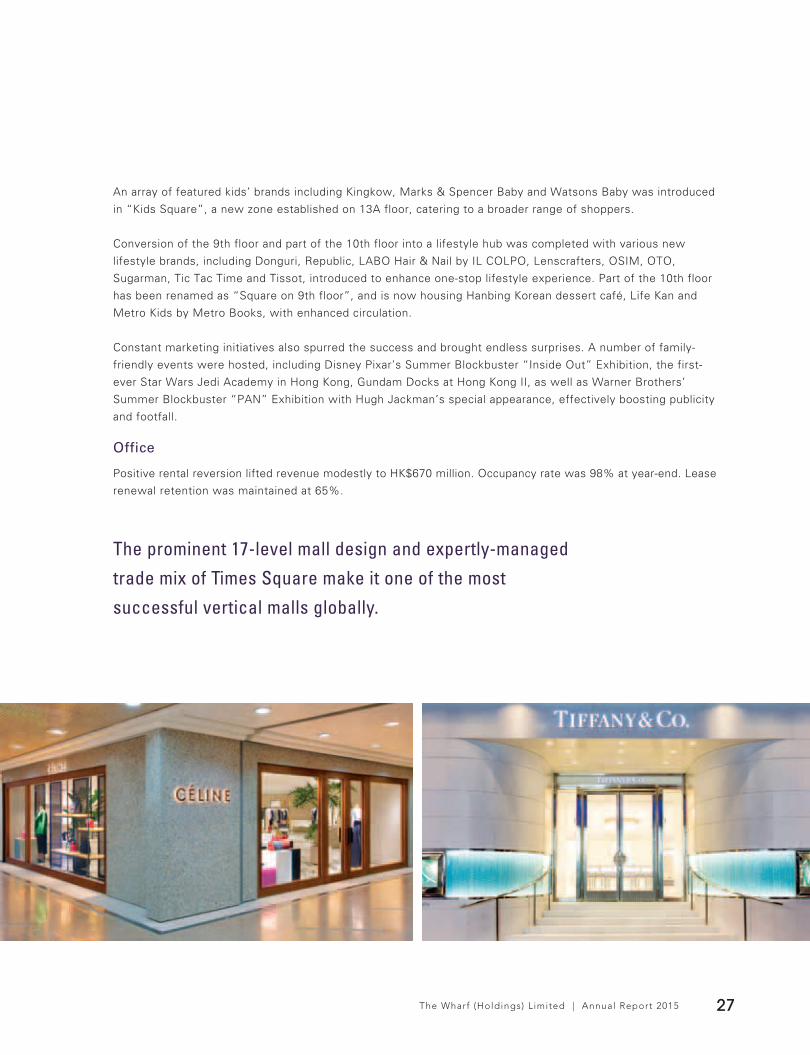
An array of featured kids’ brands including Kingkow, Marks & Spencer Baby and Watsons Baby was introduced
in “Kids Square”, a new zone established on 13A floor, catering to a broader range of shoppers.
Conversion of the 9th floor and part of the 10th floor into a lifestyle hub was completed with various new
lifestyle brands, including Donguri, Republic, LABO Hair & Nail by IL COLPO, Lenscrafters, OSIM, OTO,
Sugarman, Tic Tac Time and Tissot, introduced to enhance one-stop lifestyle experience. Part of the 10th floor
has been renamed as “Square on 9th floor”, and is now housing Hanbing Korean dessert café, Life Kan and
Metro Kids by Metro Books, with enhanced circulation.
Constant marketing initiatives also spurred the success and brought endless surprises. A number of family-
friendly events were hosted, including Disney Pixar’s Summer Blockbuster “Inside Out” Exhibition, the first-
ever Star Wars Jedi Academy in Hong Kong, Gundam Docks at Hong Kong II, as well as Warner Brothers’
Summer Blockbuster “PAN” Exhibition with Hugh Jackman’s special appearance, effectively boosting publicity
and footfall.
Office
Positive rental reversion lifted revenue modestly to HK$670 million. Occupancy rate was 98% at year-end. Lease
renewal retention was maintained at 65%.
The prominent 17-level mall design and expertly-managed
trade mix of Times Square make it one of the most
successful vertical malls globally.
FOR LAYOUT
ONLY
TIMES SQUAREBUSINESS REVIEW
The Wharf (Holdings) L imited | Annual Report 201528
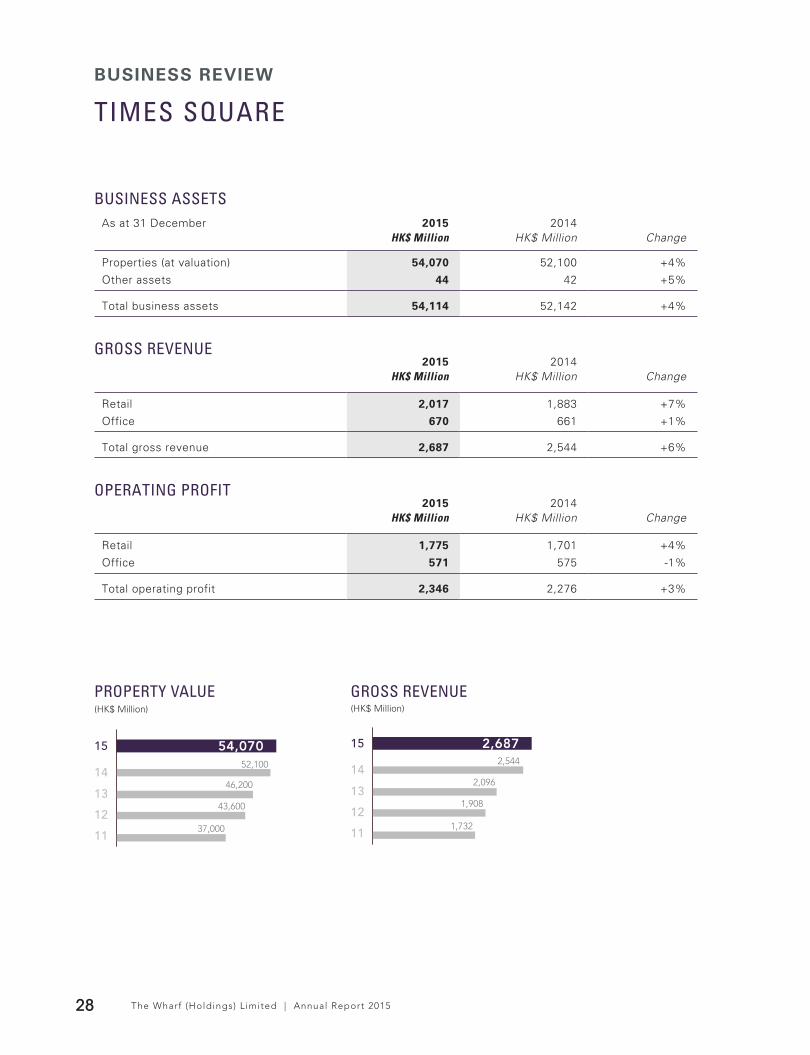
BUSINESS ASSETSAs at 31 December 2015 2014
HK$ Million HK$ Million Change
Properties (at valuation) 54,070 52,100 +4%
Other assets 44 42 +5%
Total business assets 54,114 52,142 +4%
GROSS REVENUE2015 2014
HK$ Million HK$ Million Change
Retail 2,017 1,883 +7%
Office 670 661 +1%
Total gross revenue 2,687 2,544 +6%
OPERATING PROFIT2015 2014
HK$ Million HK$ Million Change
Retail 1,775 1,701 +4%
Office 571 575 -1%
Total operating profit 2,346 2,276 +3%
PROPERTY VALUE(HK$ Million)
15
14
13
12
11
52,100
46,200
43,600
37,000
54,070
GROSS REVENUE(HK$ Million)
15
14
13
12
11
2,544
2,096
1,908
1,732
2,687

The Wharf (Holdings) L imited | Annual Report 2015 29
Box offi ce
#1 on Hong Kong Island5-screen, 898-seat sky cinema on 13th fl oor
Total retail sales of
HK$ 9.1 BILLION
Average retail sales of
HK$ 1,517per square foot per month
Total GFA of
1.97
with an annual footfall of
65+ MILLION
MILLION SQUARE FEET

TIMES SQUAREBUSINESS REVIEW
The Wharf (Holdings) L imited | Annual Report 201530
RETAIL TENANT MIX (by Rental, Area and Sales)
% by Rental % by Area % by Sales
Fashion 34.3 23.7 22.6
Jewellery, Beauty, Healthcare and Accessories 33.2 16.6 26.6
Department Store, Confectionery Products 14.1 21.1 26.0
Restaurant, Fast Food, F&B, Entertainment 7.3 25.9 7.6
Electrical & Audio-visual Equipment 5.0 5.4 12.6
Sports Wear 4.6 3.4 3.8
Others 1.5 3.9 0.8
Total 100 100 100
The Wharf (Holdings) L imited | Annual Report 2015 31
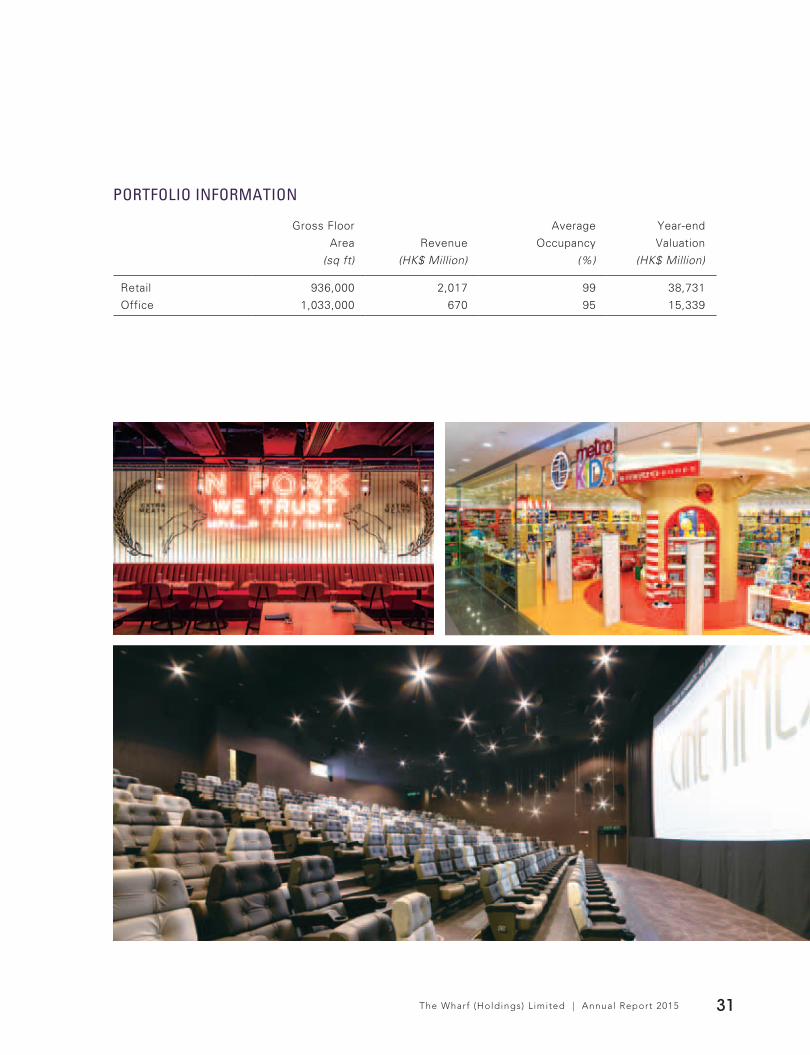
PORTFOLIO INFORMATION
Gross Floor
Area Revenue
Average
Occupancy
Year-end
Valuation
(sq ft) (HK$ Million) (%) (HK$ Million)
Retail 936,000 2,017 99 38,731
Office 1,033,000 670 95 15,339

PLAZA HOLLYWOODBUSINESS REVIEW
The Wharf (Holdings) L imited | Annual Report 201532
K O W L O O N E A S T , H O N G K O N G
PLAZA HOLLYWOODK O W L O O N E A S T H O N G K O N G

The Wharf (Holdings) L imited | Annual Report 2015 33
Plaza Hollywood, a leading mall in Kowloon East, performed solidly. Revenue increased by 3% to HK$529 million
and operating profit was maintained at HK$398 million. Occupancy rate was 96% at year-end. Meticulous tenant
mix enhancement further unleashed growth opportunities.
The prime location in Kowloon East, where a vibrant CBD2 is emerging in a populous middle class residential
area, affirms the enormous growth potential for Plaza Hollywood. The malls in served by excellent transport
connections with its favourable location atop Diamond Hill MTR Station, the future interchange hub for the new
Shatin-Central link with the existing MTR network, and its direct linkage with the Diamond Hill bus terminus.
It is also in close proximity to the Tate’s Cairn tunnel, a vehicular artery connecting Kowloon East with the
New Territories and beyond to Shenzhen. Various adjacent cultural landmarks and tourist attractions further
distinguish Plaza Hollywood from other malls in the region.
The deliberate design without towers atop it provides Plaza Hollywood with maximum planning flexibility. With a
highly efficient layout (65% of GFAs is lettable), the mall’s competitive edge also lies in its valuable critical mass
for shoppers and retailers (over 250 retail outlets, 20 restaurants, and a purpose-built stadium seating six-screen
cinema multiplex with 1,614 seats that tops the box office chart in Kowloon East).
PLAZA HOLLYWOODBUSINESS REVIEW
RETAIL TENANT MIX (by rental, area and sales)
% by Rental % by Area % by Sales
Restaurant, Fast Food, F&B, Entertainment 22.2 34.5 21.2
Jewellery, Beauty and Accessories 21.5 12.6 18.4
Fashion 20.1 21.2 14.2
Department Store, Healthecare, Confectionery Products 13.6 13.3 15.6
Travel, Telecommunication and
Other Services 7.9 4.8 7.5
Electrical & Audio-visual Equipment 6.7 5.7 16.7
Sports Wear 5.3 4.7 4.3
Others 2.7 3.2 2.1
Total 100 100 100
Total retail sales of
HK$ 2.6 BILLION
Annual footfall of
20+ MILLION

THE PEAKPORTFOLIO & OTHER HK PROPERTIES
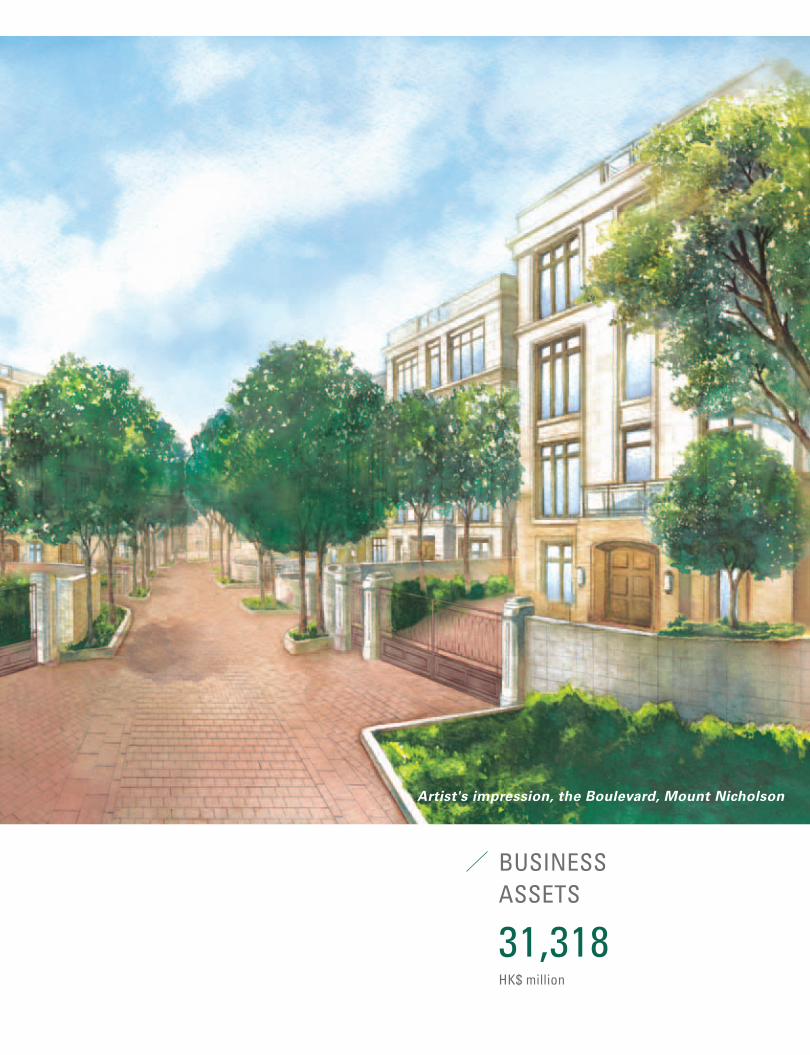
31,318HK$ million
BUSINESS ASSETS
Artist's impression, the Boulevard, Mount Nicholson

THE PEAK PORTFOLIOBUSINESS REVIEW
The Wharf (Holdings) L imited | Annual Report 201536
Wharf’s peak portfolio prides itself on the display
of a landmark collection of the most luxurious
residences nestled on the Peak.
“When you’re talking about building a house,
you’re talking about dreams”-Robert A.M. Stern

The Wharf (Holdings) L imited | Annual Report 2015 37
Peak Portfolio
Wharf’s Peak Portfolio prides itself on the display of a landmark
collection of the most luxurious residences nestled on the Peak.
These premier developments (attributable GFA: about 400,000
square feet) with an estimated combined value of HK$28 billion
(or about HK$70,000 per square foot of GFA) epitomize exclusive
and exquisite living.
Mount Nicholson, a 50:50 joint venture development with Nan
Fung Group (attributable GFA: 162,000 square feet), offers
exclusive, prestigious residences boasting a fantastic view
towards Victoria Harbour. Occupation permit has been obtained.
Sale commenced in February 2016 on a targeted basis and the
first villa has been sold for HK$830 million or HK$87,800 per
square foot.
Superstructure/Foundation works for the re-development of
the Peak Portfolio including 1 Plantation Road (20 houses), 11
Plantation Road (7 houses) and 77 Peak Road (8 houses) are in
good progress.
Attributable GFA
397,200square feet
77 PEAK ROAD42,200 sq ft
STRAWBERRY HILL13,000 sq ft
1 PLANTATION ROAD91,000 sq ft
8 MOUNT NICHOLSON ROAD162,000 sq ft
11 PLANTATION ROAD46,000 sq ft
CHELSEA COURT43,000 sq ft
THE PEAK PORTFOLIO & OTHER HONG KONG PROPERTIESBUSINESS ASSETS
As at 31 December 2015 2014
HK$ Million HK$ Million Change
Properties 25,514 24,472 +4%
Interest in associates/joint ventures 3,838 3,739 +3%
Property inventory and development 1,194 856 +39%
Other assets 772 239 +223%
Total business assets 31,318 29,306 +7%

BUSINESS REVIEW
The Wharf (Holdings) L imited | Annual Report 201538
OTHER HK PROPERTIES
CENTRAL
The Group has been increasing its presence in the prime central business district since 2013. In 2013, it acquired
for HK$4.4 billion the iconic Murray Building on Garden Road with 330,000 square feet of GFA for conversion
into a unique urban chic hotel. In 2014, it acquired for HK$5.8 billion Crawford House in Queen’s Road Central
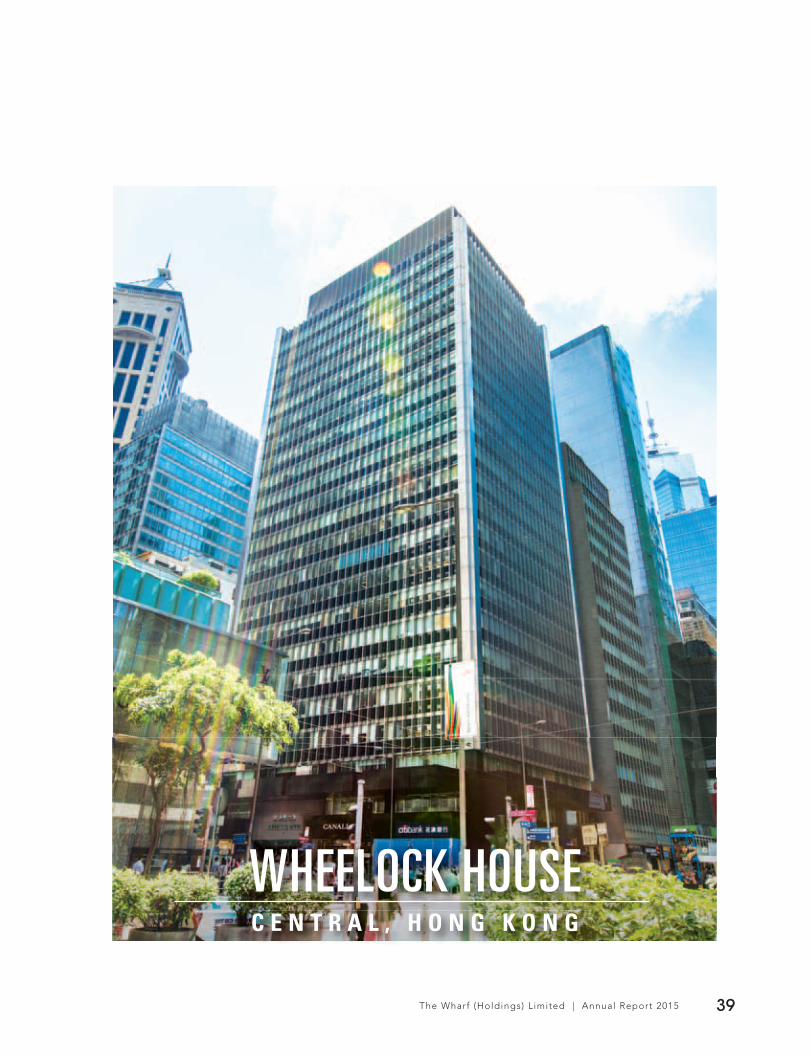
with 189,000 square feet of prime retail and office GFA. In March 2016, the Group acquired for HK$6.2 billion
the entire office tower and a prime shop in Wheelock House at the intersection of Pedder Street and Des Voeux
Road Central with 204,000 square feet of GFA at a gross yield of about 3.2% p.a.
KOWLOON EAST
The immense untapped potential in Kowloon East is being gradually unlocked, supporting the Group’s
exceptional “Kowloon East Waterfront Portfolio”. This portfolio, comprising the Group’s Kowloon Godown and
Wharf T&T Square as well as parent company Wheelock’s One Bay East, is located at the heart of the vibrant
CBD2 and spans a 500-metre coastline with a stunning Victoria Harbour view. Foundation works for the re-
development of Wharf T&T Square is progressing well. Peninsula East, a residential-property redevelopment
project in close proximity to Yau Tong MTR station, is scheduled for completion in 2016. All 256 units were sold
out promptly in the first two days of its launch in April 2015, generating total proceeds of HK$2.0 billion.
Properties Highlights Retail Office Residential Attributable GFA (sq ft)
Central, Hong Kong
Crawford House • • 189,000
Wheelock House (acquired in March 2016) • • 204,000
Kowloon East
Wharf T&T Square (under development) • • 534,000
Kowloon Godown (planning for re-development) • • 829,000
Peninsula East (under development) • • 256,000
Yau Tong JV Project (planning for re-development) • • 596,000
C E N T R A L , H O N G K O N G
CRAWFORD HOUSEC E N T R A L H O N G K O N G
The Wharf (Holdings) L imited | Annual Report 2015 39
C E N T R A L , H O N G K O N G
WHEELOCK HOUSEC E N T R A L H O N G K O N G

40 The Wharf (Holdings) L imited | Annual Report 2015
C H E N G D U
I F S

CHINAINVESTMENTPROPERTIES
CHINA INVESTMENT PROPERTIESBUSINESS REVIEW
42 The Wharf (Holdings) L imited | Annual Report 2015
China IP began to bear fruit, lifting revenue by 16% to HK$2,305 million, and operating profit by 25% to
HK$1,243 million. In particular, Chengdu IFS showed continued strength, with retail performance exceeding
expectation. Its distinguished positioning makes it stand out in a competitive market.
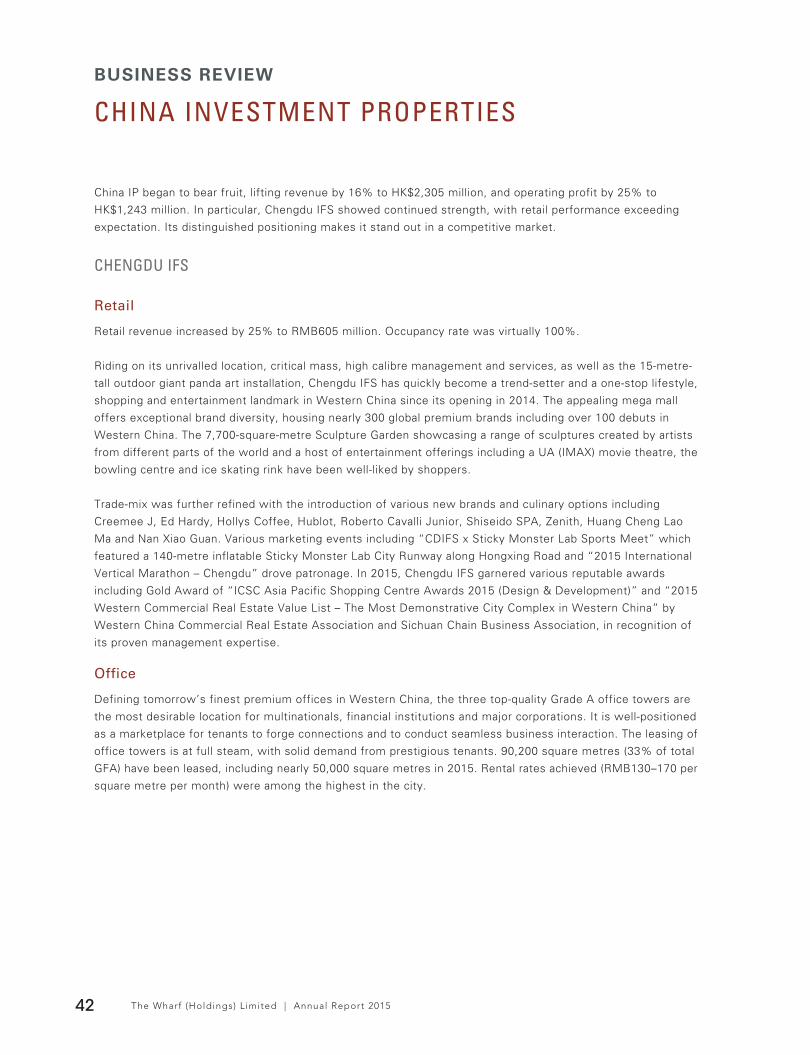
CHENGDU IFS
Retail
Retail revenue increased by 25% to RMB605 million. Occupancy rate was virtually 100%.
Riding on its unrivalled location, critical mass, high calibre management and services, as well as the 15-metre-
tall outdoor giant panda art installation, Chengdu IFS has quickly become a trend-setter and a one-stop lifestyle,
shopping and entertainment landmark in Western China since its opening in 2014. The appealing mega mall
offers exceptional brand diversity, housing nearly 300 global premium brands including over 100 debuts in
Western China. The 7,700-square-metre Sculpture Garden showcasing a range of sculptures created by artists
from different parts of the world and a host of entertainment offerings including a UA (IMAX) movie theatre, the
bowling centre and ice skating rink have been well-liked by shoppers.
Trade-mix was further refined with the introduction of various new brands and culinary options including
Creemee J, Ed Hardy, Hollys Coffee, Hublot, Roberto Cavalli Junior, Shiseido SPA, Zenith, Huang Cheng Lao
Ma and Nan Xiao Guan. Various marketing events including “CDIFS x Sticky Monster Lab Sports Meet” which
featured a 140-metre inflatable Sticky Monster Lab City Runway along Hongxing Road and “2015 International
Vertical Marathon – Chengdu” drove patronage. In 2015, Chengdu IFS garnered various reputable awards
including Gold Award of “ICSC Asia Pacific Shopping Centre Awards 2015 (Design & Development)” and “2015
Western Commercial Real Estate Value List – The Most Demonstrative City Complex in Western China” by
Western China Commercial Real Estate Association and Sichuan Chain Business Association, in recognition of
its proven management expertise.
Office
Defining tomorrow’s finest premium offices in Western China, the three top-quality Grade A office towers are
the most desirable location for multinationals, financial institutions and major corporations. It is well-positioned
as a marketplace for tenants to forge connections and to conduct seamless business interaction. The leasing of
office towers is at full steam, with solid demand from prestigious tenants. 90,200 square metres (33% of total
GFA) have been leased, including nearly 50,000 square metres in 2015. Rental rates achieved (RMB130–170 per
square metre per month) were among the highest in the city.

43The Wharf (Holdings) L imited | Annual Report 2015
CHENGDU TIMES OUTLET
Chengdu Times Outlet, offering over 250 top international luxury brands at outlet prices, ranked among the most
visited shopping destinations. This 63,000-square-metre mall posted a 16% growth rate in retail sales during
2015 over 2014.
C H E N G D U I N T ' L A I R P O R T
CHENGDU TIMES OUTLET
CHINA INVESTMENT PROPERTIESBUSINESS REVIEW
44 The Wharf (Holdings) L imited | Annual Report 2015
N A N J I N G X I R O A D , P U X I
SHANGHAI WHEELOCK SQUARE

45The Wharf (Holdings) L imited | Annual Report 2015
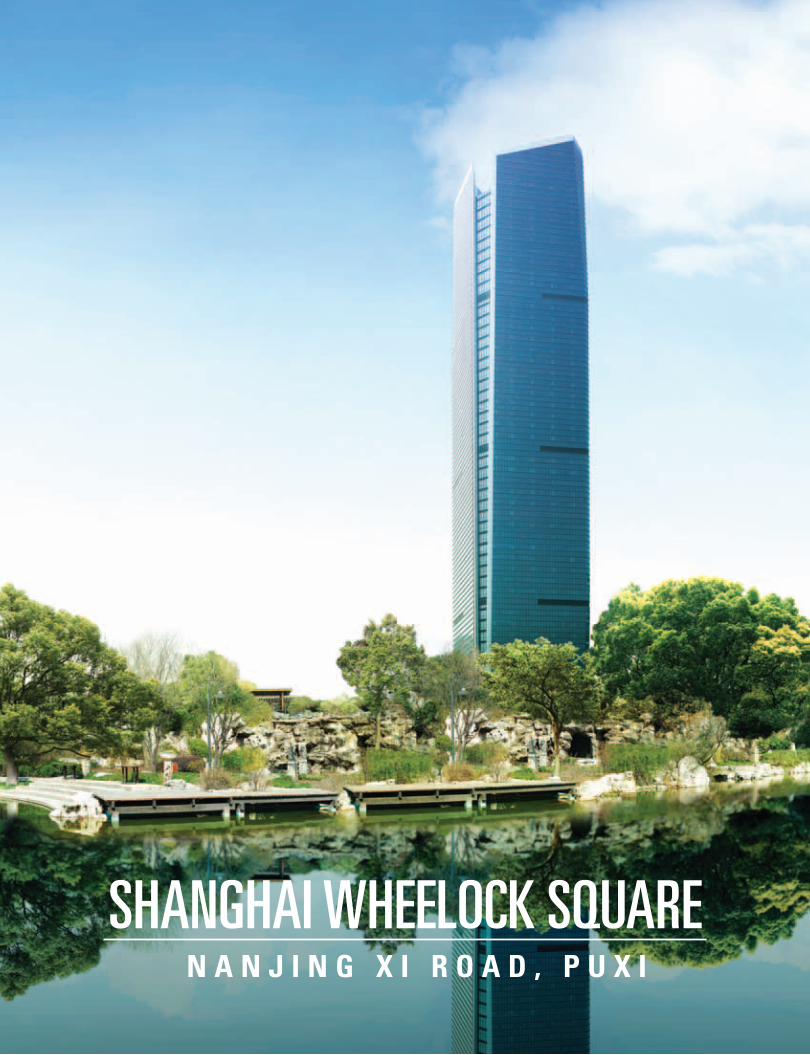
SHANGHAI WHEELOCK SQUARE
Representing the tallest and finest premium office address in Puxi, the 270-metre iconic tower with excellent
transportation network remains the most preferred location for multinationals and major corporations. It is
conveniently located right opposite to Jing’an Temple Metro Station from where frequent trains commute to
Pudong International Airport and is adjacent to the Yan’an elevated expressway. It also sits between the Bund
and Zhongshan Xi Road with Hongqiao International Airport further to the west.
Occupancy rate was maintained at 98% at year-end. Lease renewal retention rate was 81% with solid rental
reversion (11%). Thanks to its top-notch service and management, Wheelock Square was awarded “The
Safe Unit in Jing’an District 2014” by the Shanghai Jing’an District Security Governed Committee and “The
Integrated Security Access Liability 2014 — Excellence Class” by the Jing’an Road and Street Governed
Committee.
SHANGHAI TIMES SQUARE
The elite retail destination, strategically located on Huaihai Zhong Road, is home to the largest Lane Crawford
store in Mainland China and a mega lifestyle specialty store CitySuper. The mall was virtually fully let. Constant
refinement of tenant mix and culinary experiences added excitement. Character-themed marketing events
successfully garnered young customers’ attention and sustained interaction with families and kids. Ju Ming
Exhibition, the fourth stop in China, further drove traffic and sales. The offices were nearly 100% occupied at year-
end. Lease renewal retention rate was 82%.
H U A I H A I Z H O N G R O A D , P U X I
SHANGHAI TIMES SQUARE

CHINA INVESTMENT PROPERTIESBUSINESS REVIEW
46 The Wharf (Holdings) L imited | Annual Report 2015
UNDER DEVELOPMENT
The Group has a relatively full pipeline of IFS and Times Outlet developments which are progressing at full
speed to accelerate growth momentum. These are expected to be a significant earnings and valuation growth
driver. Both Times Outlet and IFS in Chengdu delivered strong results. The Group continued to implement
best practices on retail-oriented IFS complexes in Chongqing and Changsha to tap strong experience-oriented
consumption in the Western and Central China metropolis in the years to come.
Strategically located at the heart of their respective core CBDs, Chengdu IFS and Changsha IFS (designed by
renowned architects) are set to transcend Harbour City and Times Square in Hong Kong in terms of scale and
local market positioning. Please refer to the table below.
Multi-use Developments
Harbour City, Hong Kong Chengdu IFS Changsha IFS
Development Area &Project Nature
9.1M square feet(Mall: 2.0M, Office: 4.3M, 3 hotels with 1,455 rooms, Serviced apartments & private sports club)
8.2M square feet(Mall: 2.2M, Office: 3.1M, 1 luxury hotel with 230 rooms & Serviced apartments)
11.0M square feet(Mall: 2.5M, Office: 4.8M & 2 hotels with 417 rooms)
Retail Street Frontage 1/3 mile 1/3 mile nearly 1/2 mile
Location Tsim Sha Tsui,adjacent to Star Ferry Pier and bus terminus
Intersection of Hongxing Road, Dacisi Road and Beishamao Street, busiest pedestrian shopping area and Chunxi Road commercial circle*
Jiefang Road, Furong District*. Close proximity to Huangxing Road, one of the busiest pedestrian streets. Flanked by financial institutions and a traditional shopping cluster
Mass Transit Linkage 5-minute walk to TST MTR Station
Directly connected to MTR station (Lines 2 and 3 intersect)
Underground linkage to future Wuyi Plaza Station Line 1 (under construction) and Line 2
*Comparable to Hong Kong’s Central CBD, Causeway Bay and Tsim Sha Tsui combined.
47The Wharf (Holdings) L imited | Annual Report 2015
CHANGSHA IFS
Changsha IFS, the most sizable mixed-use IFS complex with a 230,000-square-metre mega mall, is well
positioned to be the ultimate shopping, dining, lifestyle and leisure destination in Hunan province. Currently,
over 75% of total retail area was under offer to tenants or discussion.
Setting a new standard for future offices, the premier office towers will be among the most coveted addresses
for financial institutions based in the province.
The third luxury Niccolo hotel is set to open at Changsha IFS.
CHONGQING IFS
Prominently located in Jiangbei District (Chongqing’s new CBD), the 50%-owned Chongqing IFS will comprise
an iconic 300-metre landmark tower and four other towers above a 102,000-square-metre retail podium, making
it the largest mixed-use complex in the region. The development will feature a mega mall (a boutique-sized
Harbour City), Grade A offices and the second Niccolo luxury hotel. Over 85% of the retail floor plates were
under offer to tenants or in serious discussion with key anchors and various major players. Over 80% of office
Tower Two and Three was sold. Full completion is scheduled for 2016. The mall is poised to open in early 2017.
SUZHOU IFS
Ideally located in the CBD overlooking Jinji Lake, the 80%-owned Suzhou IFS (total GFA: 278,000 square
metres) is a 450-metre landmark development comprising international Grade A offices, luxury apartments and
a 133-room luxury Niccolo hotel. In close proximity to Xinghu Street MTR Station (Line 1), the development is
scheduled for full completion in 2017.
CHANGSHA TIMES OUTLET
Located at the northwest of Changsha, the 70,000-square-metre Changsha Times Outlet has direct access to
multiple major motorways (including metro and high-speed expressway) connecting Changsha to various popular
tourist attractions nationwide including Zhangjiajie and Donting Lake. Construction work is underway with
completion scheduled for 2016.

CHINA INVESTMENT PROPERTIESBUSINESS REVIEW
48 The Wharf (Holdings) L imited | Annual Report 2015
C H O N G Q I N G W U X I
I F S I F S

49The Wharf (Holdings) L imited | Annual Report 2015
SUZHOU CHANGSHA
I F S I F S

50 The Wharf (Holdings) L imited | Annual Report 2015
CHINA CONTRACTED SALES BREAKDOWN BY REGION
Region CityNo. of projects
on saleContracted
Sales (%) GFA Sold (%)
East Changzhou, Hangzhou, Ningbo,
Shanghai, Suzhou & Wuxi 29 78 67
West Chengdu & Chongqing 10 9 16
South Foshan & Guangzhou 8 4 8
North and
Other Regions
Beijing, Tianjin,
Dalian & Wuhan 7 9 9
CHINADEVELOPMENTPROPERTIES
Inclusive of joint ventures and associates on an attributable basis, revenue increased by 18% to HK$27,404
million and operating profit by 51% to HK$4,200 million. 1,587,000 square metres of GFA were completed and
recognized in 2015 (2014: 1,662,000 square metres).
Against the backdrop of a slowing economy, the government’s easing measures supported the property market
in 2015. The Group’s attributable interest in contracted sales increased by 21% to RMB26 billion, above target
by 21%. The net order book (net of business tax) increased to RMB25 billion for 1.4 million square metres at
year-end.

51The Wharf (Holdings) L imited | Annual Report 2015
In China East, favourable responses were received for the projects in Shanghai, Suzhou and Hangzhou. In
Shanghai, Shanghai Pudong Huangpujiang Project, Zhoupu and Songjiang Xianhe Road projects, in aggregate,
sold another 131,800 square metres for RMB5.8 billion. On an attributable basis, South Station and Magnolia
Mansion sold a further 32,700 square metres for combined proceeds of RMB1.3 billion. In Suzhou, Times
City, Bellagio and Ambassador Villa, in aggregate, sold a further 290,600 square metres for RMB5.5 billion. In
Hangzhou, Palazzo Pitti and Royal Seal sold another 86,400 square metres for combined proceeds of RMB2.9
billion. The projects on sale in other regions of China also met with positive responses.
In 2015, the Group acquired six sites in Beijing, Hangzhou and Foshan directly or through joint ventures
for RMB4.7 billion (GFA: 0.26 million square metres) on an attributable basis. In February 2016, the Group
purchased a site in Beijing through a joint venture for RMB2.1 billion on an attributable basis (GFA: 47,800
square metres). The current DP land bank was maintained at 5.9 million square metres, spanning 14 cities.
The Group will continue to adopt a selective and disciplined approach to further land purchases, with focus on
fewer target cities.
Shanghai Pudong Huangpujiang Project

BUSINESS REVIEW
52 The Wharf (Holdings) L imited | Annual Report 2015
CHINA DEVELOPMENT PROPERTIES
MAJOR CHINA DEVELOPMENT PROPERTIES LIST
Attributable GFA (sqm)
Eastern China – Changzhou
Changzhou Feng Huang Hu 245,000 (Formerly known as Feng Huang Hu Site 03 Project) Feng Huang Hu Shu 183,000 Changzhou Times Palace 132,000
Eastern China – Hangzhou
Junting 155,000 Greentown Zhijiang No.1 114,000 Greentown Wharf Qian Tang Bright Moon 94,000 Hangzhou Royal Seal 82,000 Palazzo Pitti 77,000 Park Mansion 62,000 Shi Ji Hua Fu 52,000 Longxi (Site GS05-R21-A01, Shenhua Unit, Gongshu District) 52,000
Eastern China – Ningbo
Park Mansion 104,000 Eastern China – Shanghai
Shanghai Pudong Huangpujiang Project 136,000 Shanghai South Station 133,000 Shanghai Zhoupu 98,000 Jingan Garden 71,000
Eastern China – Suzhou
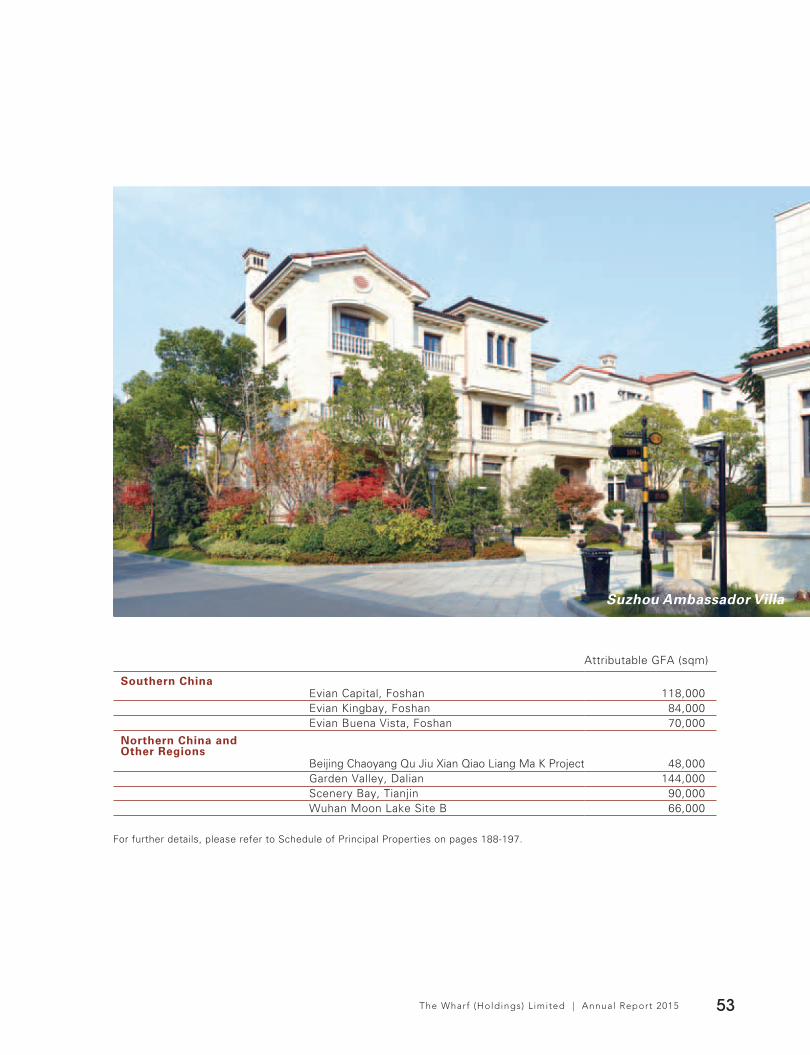
Suzhou Times City 347,000 Bellagio 260,000 Suzhou Ambassador Villa 52,000
Eastern China – Wuxi
River Pitti 322,000 Wuxi Times City 252,000 Wuxi Glory of Time 151,000
Western China – Chengdu
Times Town 397,000 Chengdu ICC 340,000 Chengdu Times City 222,000 Le Palais 84,000
Western China – Chongqing
International Community 267,000 The Throne 260,000 The U World 76,000
53The Wharf (Holdings) L imited | Annual Report 2015
Attributable GFA (sqm)
Southern ChinaEvian Capital, Foshan 118,000 Evian Kingbay, Foshan 84,000 Evian Buena Vista, Foshan 70,000
Northern China and Other Regions
Beijing Chaoyang Qu Jiu Xian Qiao Liang Ma K Project 48,000 Garden Valley, Dalian 144,000 Scenery Bay, Tianjin 90,000 Wuhan Moon Lake Site B 66,000
For further details, please refer to Schedule of Principal Properties on pages 188-197.
Suzhou Ambassador Villa

WHARF HOTELS
’ MARCO POLO HOTELS NICCOLOHong Kong Niccolo, ChengduMarco Polo Hongkong Hotel The Murray, Hong Kong* (a Niccolo hotel, 2017)Gateway Hotel Niccolo Chongqing* (2017)Prince Hotel Niccolo Changsha* (2017)
Niccolo Suzhou* (2018)ChinaMarco Polo Parkside, BeijingMarco Polo Changsha* (2019)Marco Polo ChangzhouMarco Polo Lingnan Tiandi, FoshanMarco Polo JinjiangMarco Polo ShenzhenMarco Polo XiamenMarco Polo Wuhan
The PhilippinesMarco Polo Plaza, CebuMarco Polo DavaoMarco Polo Ortigas, Manila
* under development
19 hotels
OWNED AND MANAGED

Niccolo, Chengdu
WHARF HOTELSBUSINESS REVIEW
The Wharf (Holdings) L imited | Annual Report 201556
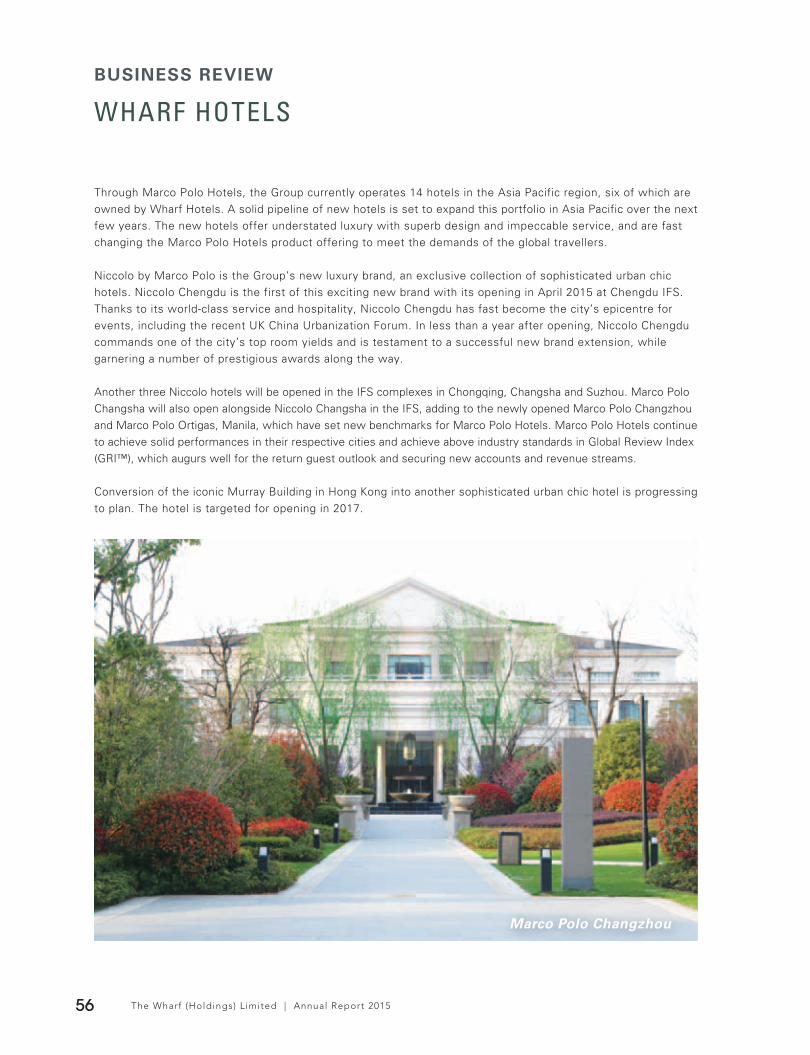
Through Marco Polo Hotels, the Group currently operates 14 hotels in the Asia Pacific region, six of which are owned by Wharf Hotels. A solid pipeline of new hotels is set to expand this portfolio in Asia Pacific over the next few years. The new hotels offer understated luxury with superb design and impeccable service, and are fast changing the Marco Polo Hotels product offering to meet the demands of the global travellers.
Niccolo by Marco Polo is the Group’s new luxury brand, an exclusive collection of sophisticated urban chic hotels. Niccolo Chengdu is the first of this exciting new brand with its opening in April 2015 at Chengdu IFS. Thanks to its world-class service and hospitality, Niccolo Chengdu has fast become the city’s epicentre for events, including the recent UK China Urbanization Forum. In less than a year after opening, Niccolo Chengdu commands one of the city’s top room yields and is testament to a successful new brand extension, while garnering a number of prestigious awards along the way.
Another three Niccolo hotels will be opened in the IFS complexes in Chongqing, Changsha and Suzhou. Marco Polo Changsha will also open alongside Niccolo Changsha in the IFS, adding to the newly opened Marco Polo Changzhou and Marco Polo Ortigas, Manila, which have set new benchmarks for Marco Polo Hotels. Marco Polo Hotels continue to achieve solid performances in their respective cities and achieve above industry standards in Global Review Index (GRI™), which augurs well for the return guest outlook and securing new accounts and revenue streams.
Conversion of the iconic Murray Building in Hong Kong into another sophisticated urban chic hotel is progressing to plan. The hotel is targeted for opening in 2017.
Marco Polo Changzhou
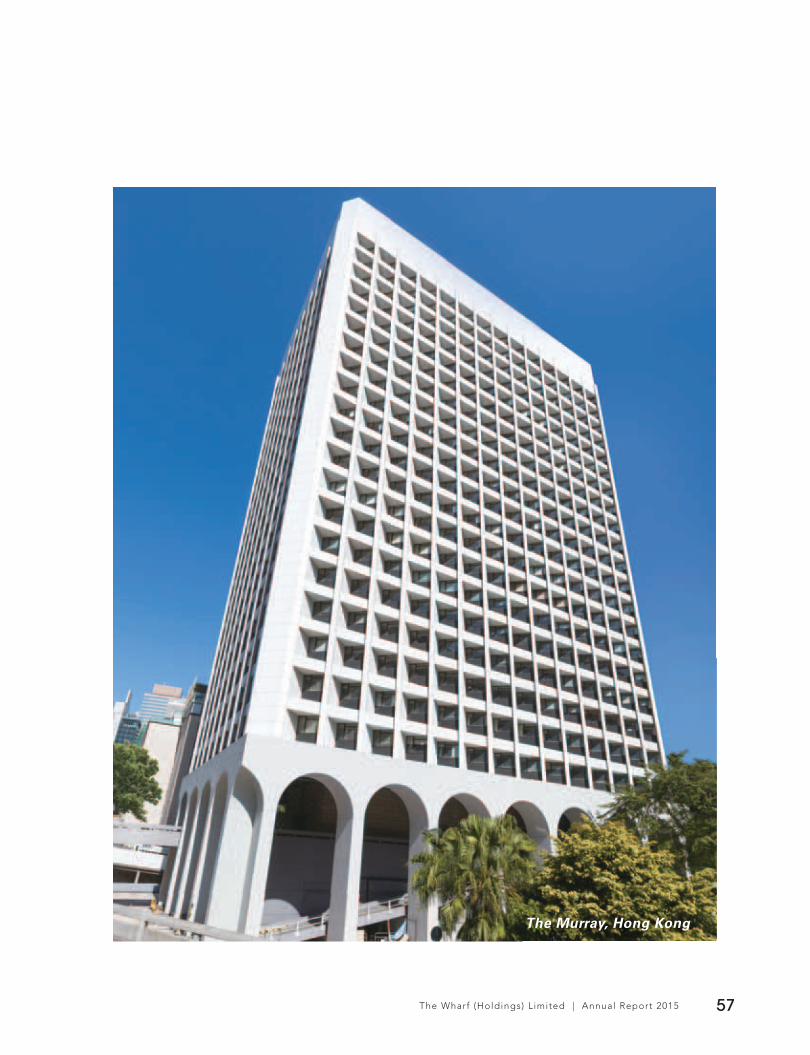
The Wharf (Holdings) L imited | Annual Report 2015 57
The Murray, Hong Kong

The first container terminal operator
in Hong Kong, established more than
40 years ago.
MODERNTERMINALS
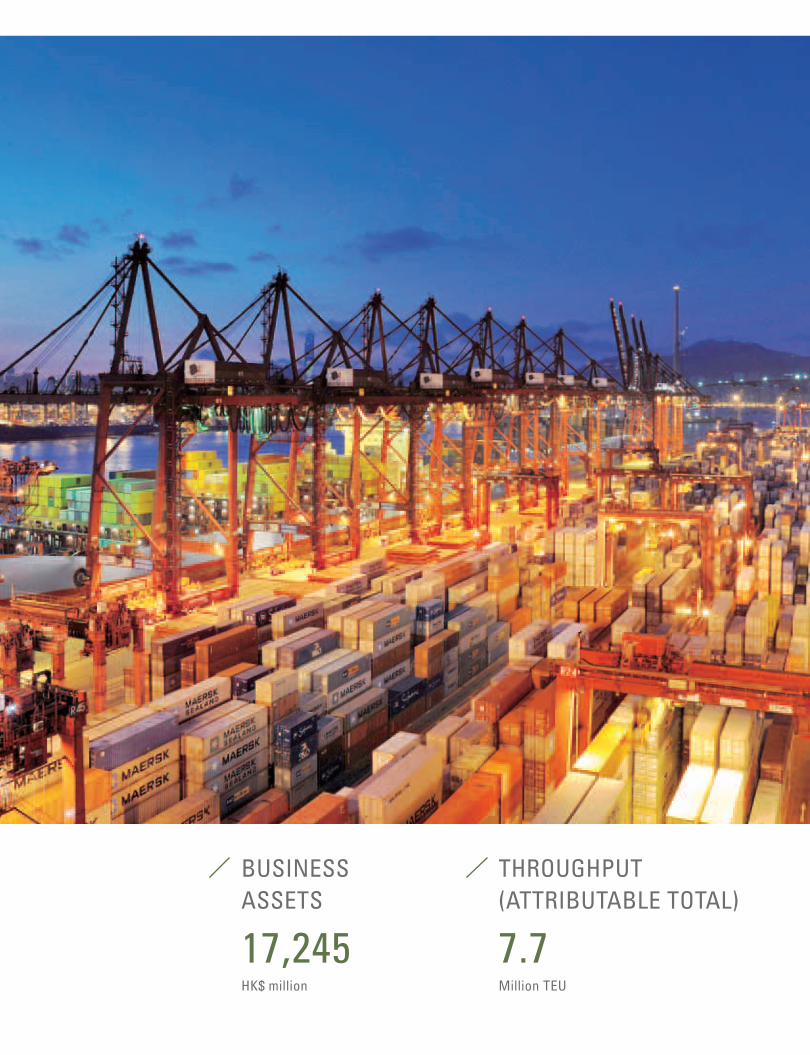
7.7Million TEU
THROUGHPUT(ATTRIBUTABLE TOTAL)
17,245HK$ million
BUSINESS ASSETS
MODERN TERMINALSBUSINESS REVIEW
The Wharf (Holdings) L imited | Annual Report 201560
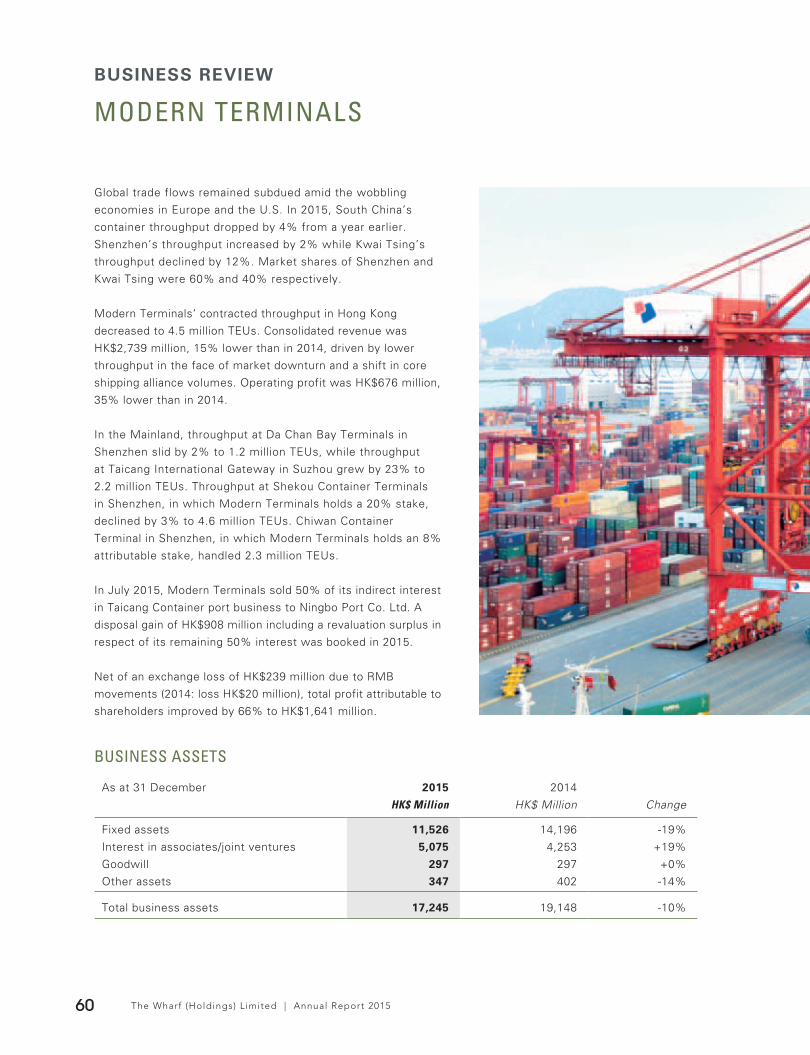
Global trade flows remained subdued amid the wobbling
economies in Europe and the U.S. In 2015, South China’s
container throughput dropped by 4% from a year earlier.
Shenzhen’s throughput increased by 2% while Kwai Tsing’s
throughput declined by 12%. Market shares of Shenzhen and
Kwai Tsing were 60% and 40% respectively.
Modern Terminals’ contracted throughput in Hong Kong
decreased to 4.5 million TEUs. Consolidated revenue was
HK$2,739 million, 15% lower than in 2014, driven by lower
throughput in the face of market downturn and a shift in core
shipping alliance volumes. Operating profit was HK$676 million,
35% lower than in 2014.
In the Mainland, throughput at Da Chan Bay Terminals in
Shenzhen slid by 2% to 1.2 million TEUs, while throughput
at Taicang International Gateway in Suzhou grew by 23% to
2.2 million TEUs. Throughput at Shekou Container Terminals
in Shenzhen, in which Modern Terminals holds a 20% stake,
declined by 3% to 4.6 million TEUs. Chiwan Container
Terminal in Shenzhen, in which Modern Terminals holds an 8%
attributable stake, handled 2.3 million TEUs.
In July 2015, Modern Terminals sold 50% of its indirect interest
in Taicang Container port business to Ningbo Port Co. Ltd. A
disposal gain of HK$908 million including a revaluation surplus in
respect of its remaining 50% interest was booked in 2015.
Net of an exchange loss of HK$239 million due to RMB
movements (2014: loss HK$20 million), total profit attributable to
shareholders improved by 66% to HK$1,641 million.
BUSINESS ASSETS
As at 31 December 2015 2014
HK$ Million HK$ Million Change
Fixed assets 11,526 14,196 -19%
Interest in associates/joint ventures 5,075 4,253 +19%
Goodwill 297 297 +0%
Other assets 347 402 -14%
Total business assets 17,245 19,148 -10%
The Wharf (Holdings) L imited | Annual Report 2015 61
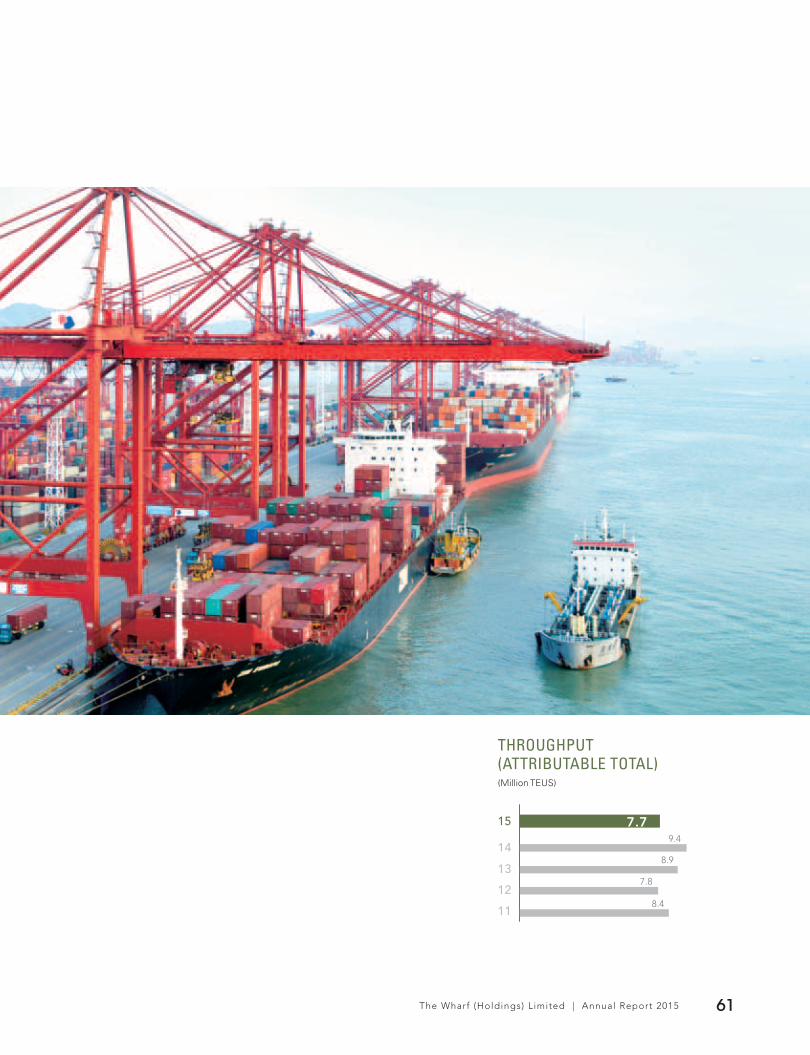
THROUGHPUT(ATTRIBUTABLE TOTAL)(Million TEUS)
15
14
13
12
11
9.4
8.9
7.8
8.4
7.7

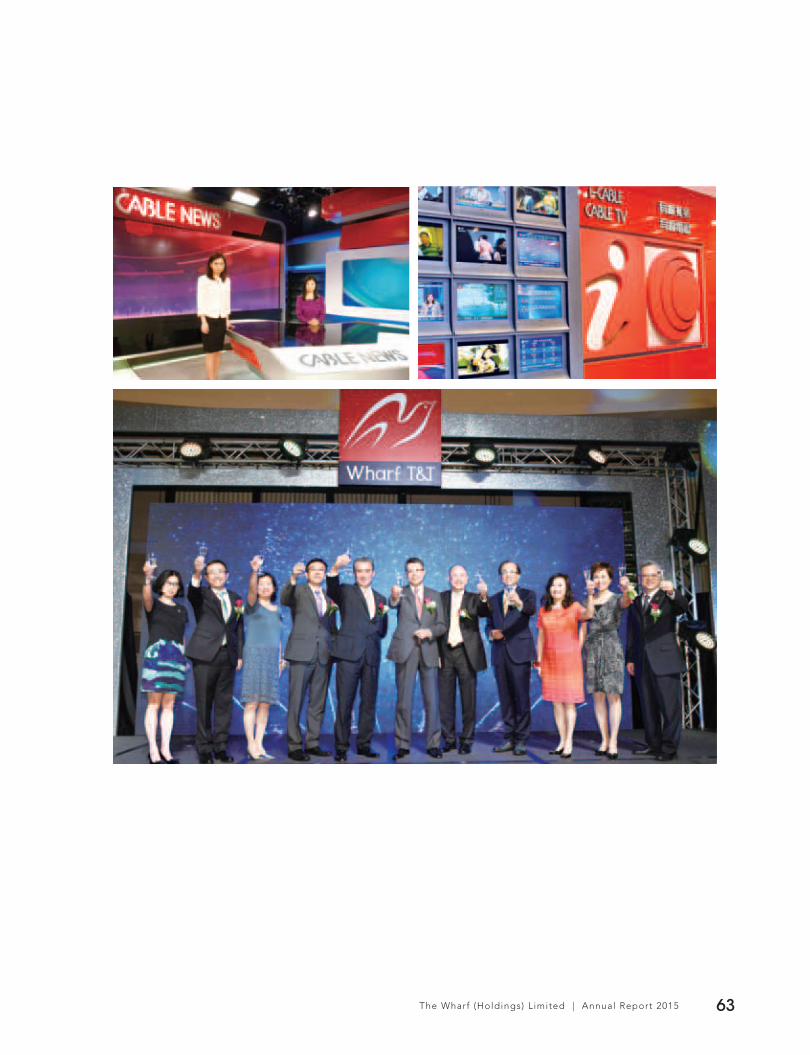
COMMUNICATIONS, MEDIA &ENTERTAINMENT
BUSINESS REVIEW
The Wharf (Holdings) L imited | Annual Report 201562
i-CABLE
i-CABLE’s airtime and subscription sales were affected as Hong Kong’s economy dipped and competition
intensified. This has made it harder to turn around i-CABLE’s financial performance in the near future.
Notwithstanding a contraction of subscriber base, early signs of subscription revenue stabilization were seen
towards the end of 2015 as a result of i-CABLE’s efforts to drive up price points. That said, it is still too early
to tell when subscription revenues might bottom out. i-CABLE will continue to make smart investments in
HD channels, network infrastructures and content to enhance its services and brand.
WHARF T&T
Wharf T&T experienced a challenging 20th Anniversary as business customers were prudent on new ICT
investment in a slowed economy. However, underpinned by its ability to provide a rich portfolio of superior ICT
solutions, Wharf T&T continued to register resilient progress in its growth journey against a very competitive
market. Total turnover rose by 2% to HK$1,991 million and operating profit by 3% to HK$362 million. Core fixed
line revenue posted solid growth with data business further gaining ground in market penetration backed by its
extensive Fibre-to-the-Desk (FTTD) coverage. Free cash flow improved by 18% to HK$450 million.
Subsequent to the end of 2015, Wharf T&T has acquired PIHK Network Limited, which operates a very
successful non-network infrastructure-based business internet service. This inorganic addition to the customer
base, revenue and profitability will provide even better scale to compete and win in this market. It will bring the
Company’s customer base close to 60,000 business enterprises in Hong Kong.
STRATEGIC REVIEW
In 2015, the Communications, Media & Entertainment segment under Wharf Communications represented 9%
of Group turnover and 1% of Group operating profit. The market has changed drastically since these businesses
started over 20 years ago and the pace of change has accelerated. We have recently commenced a strategic
review to evaluate different options to enhance these businesses. The review does not have any definite
timetable of completion and the Group will remain focused on executing its operations and business plan in the
ordinary course of business during the review.
The Wharf (Holdings) L imited | Annual Report 2015 63
The Wharf (Holdings) L imited | Annual Report 201564
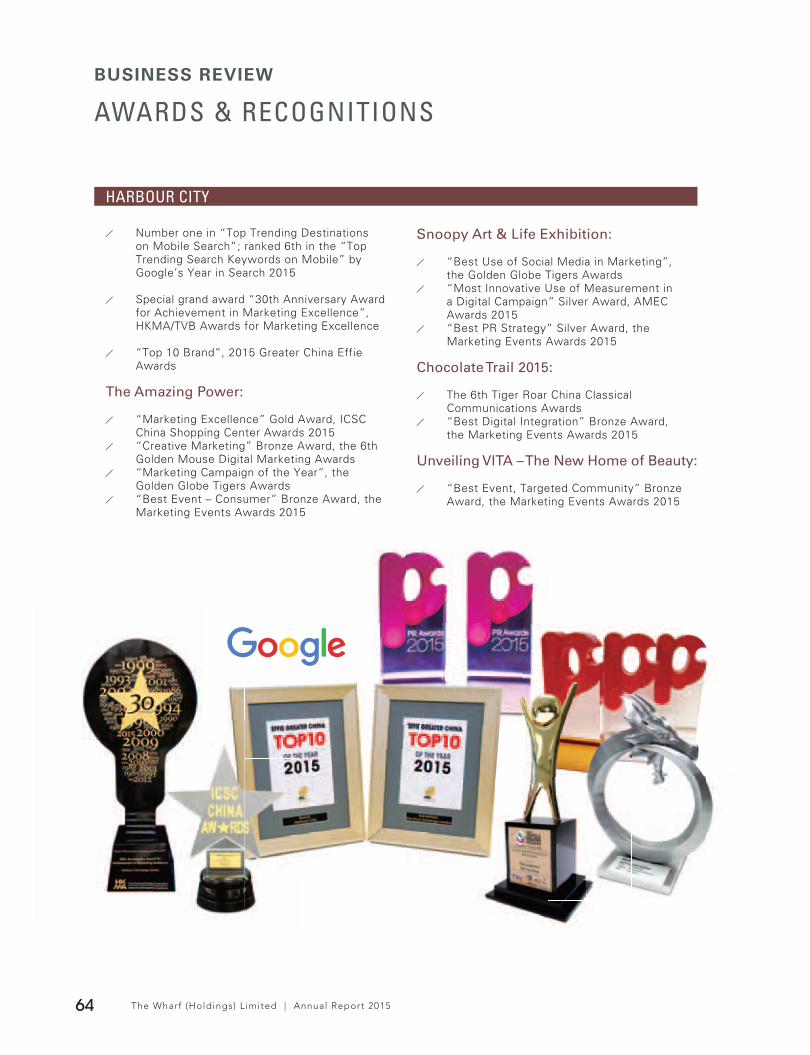
AWARDS & RECOGNITIONSBUSINESS REVIEW
Number one in “Top Trending Destinations on Mobile Search”; ranked 6th in the “Top Trending Search Keywords on Mobile” by Google’s Year in Search 2015
Special grand award “30th Anniversary Award for Achievement in Marketing Excellence”, HKMA/TVB Awards for Marketing Excellence
“Top 10 Brand”, 2015 Greater China Effie Awards
The Amazing Power:
“Marketing Excellence” Gold Award, ICSC China Shopping Center Awards 2015
“Creative Marketing” Bronze Award, the 6th Golden Mouse Digital Marketing Awards
“Marketing Campaign of the Year”, the Golden Globe Tigers Awards
“Best Event – Consumer” Bronze Award, the Marketing Events Awards 2015
Snoopy Art & Life Exhibition:
“Best Use of Social Media in Marketing”, the Golden Globe Tigers Awards
“Most Innovative Use of Measurement in a Digital Campaign” Silver Award, AMEC Awards 2015
“Best PR Strategy” Silver Award, the Marketing Events Awards 2015
Chocolate Trail 2015:
The 6th Tiger Roar China Classical Communications Awards
“Best Digital Integration” Bronze Award, the Marketing Events Awards 2015
Unveiling VITA – The New Home of Beauty:
“Best Event, Targeted Community” Bronze Award, the Marketing Events Awards 2015
HARBOUR CITY

The Wharf (Holdings) L imited | Annual Report 2015 65The Wharf (Holdings) L imite
The Legend of Lion Dance:
“Award for Brand Excellence in Retail Sector”, Global Awards for Brand Excellence
“Best PR Idea” Gold Award; “Best PR Campaign – Consumer” and “Best PR Campaign – Public Services” Silver Awards, PR Awards 2015
“Most Creative Event” Bronze Award, the Marketing Events Awards 2015
One Piece Docks at Hong Kong:
“Best Use of Public Relations” Silver Award, 2015 PMAA Dragons of Asia Award
“Best Stunt” Silver Award, the Marketing Events Awards 2015
TIMES SQUARE
“INCHEON 2014 Asian Para Games – Dare
to Dream”:
“Best Engagement – Targeted Community” and “Best PR Campaign – Corporate Social Responsibility” Silver Awards, PR Awards 2015
“Best Event – CSR” Bronze Award, the Marketing Events Awards 2015
PLAZA HOLLYWOOD
CHENGDU IFS
CHONGQING TIMES SQUARE
“Design & Development Excellence – New Developments” Gold Award, ICSC Asia Pacific Shopping Center Awards 2015, a finalist for the global award
“Design & Development – New Developments” Gold Award; and “Marketing Excellence” Silver Award for “I AM HERE!”, ICSC China Shopping Center Awards 2015
“Cross Media Marketing” Bronze Award, the 6th Golden Mouse Digital Marketing Awards for its “100 Doraemon Secret Gadget Expo”
“Benchmarking City Commercial Real Estate of China”, the 12th China Commercial Real Estate Summit
“6S Management Innovation Award 2015” and “Golden Keys China Luxury Collection Property Awards 2015” by Golden Key International Alliance
“Excellent Property Management Building 2015 of Jing’an District, Shanghai” by Shanghai Property Management Industry Association
Report 2015 65ed | Annual R
SHANGHAI WHEELOCK SQUARE
“The Best Micromarketing”, Sina Chongqing
“Chongqing’s Most Favourite Mall”, Chongqing Ribao Group, Chongqing Guidao Group and Chongqing Metro News
The Wharf (Holdings) L imited | Annual Report 201566
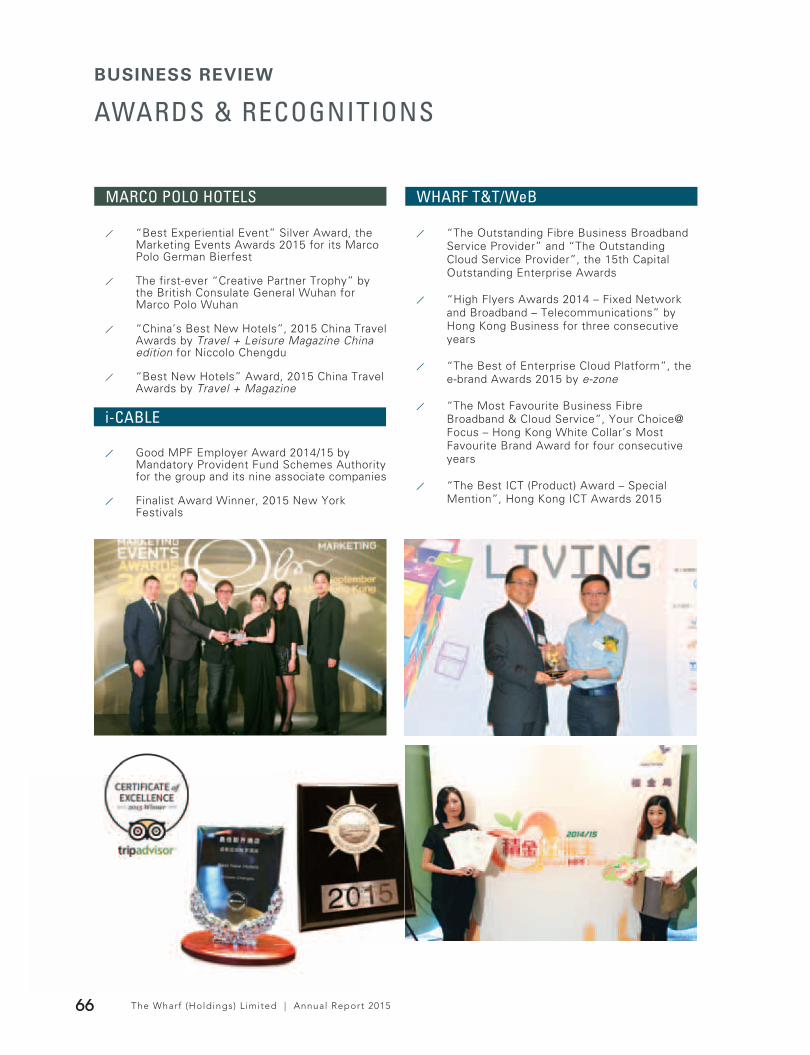
AWARDS & RECOGNITIONSBUSINESS REVIEW
“Best Experiential Event” Silver Award, the Marketing Events Awards 2015 for its Marco Polo German Bierfest
The first-ever “Creative Partner Trophy” by the British Consulate General Wuhan for Marco Polo Wuhan
“China’s Best New Hotels”, 2015 China Travel Awards by Travel + Leisure Magazine China edition for Niccolo Chengdu
“Best New Hotels” Award, 2015 China Travel Awards by Travel + Magazine
MARCO POLO HOTELS
“The Outstanding Fibre Business Broadband Service Provider” and “The Outstanding Cloud Service Provider”, the 15th Capital Outstanding Enterprise Awards
“High Flyers Awards 2014 – Fixed Network and Broadband – Telecommunications” by Hong Kong Business for three consecutive years
“The Best of Enterprise Cloud Platform”, the e-brand Awards 2015 by e-zone
“The Most Favourite Business Fibre Broadband & Cloud Service”, Your Choice@ Focus – Hong Kong White Collar’s Most Favourite Brand Award for four consecutive years
“The Best ICT (Product) Award – Special Mention”, Hong Kong ICT Awards 2015
WHARF T&T/WeB
i-CABLE
Good MPF Employer Award 2014/15 by Mandatory Provident Fund Schemes Authority for the group and its nine associate companies
Finalist Award Winner, 2015 New York Festivals
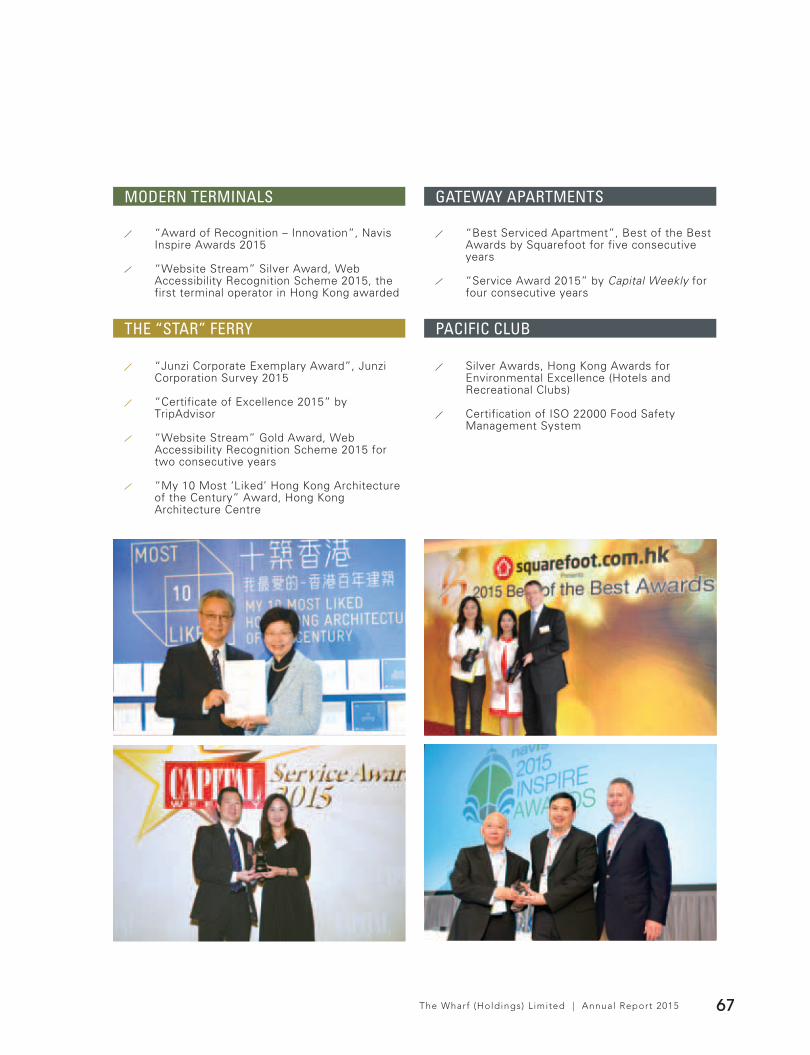
The Wharf (Holdings) L imited | Annual Report 2015 67
GATEWAY APARTMENTS
“Best Serviced Apartment”, Best of the Best Awards by Squarefoot for five consecutive years
“Service Award 2015” by Capital Weekly for four consecutive years
THE “STAR” FERRY
“Award of Recognition – Innovation”, Navis Inspire Awards 2015
“Website Stream” Silver Award, Web Accessibility Recognition Scheme 2015, the first terminal operator in Hong Kong awarded
MODERN TERMINALS
“Junzi Corporate Exemplary Award”, Junzi Corporation Survey 2015
“Certificate of Excellence 2015” by TripAdvisor
“Website Stream” Gold Award, Web Accessibility Recognition Scheme 2015 for two consecutive years
“My 10 Most ‘Liked’ Hong Kong Architecture of the Century” Award, Hong Kong Architecture Centre
PACIFIC CLUB
Silver Awards, Hong Kong Awards for Environmental Excellence (Hotels and Recreational Clubs)
Certification of ISO 22000 Food Safety Management System

Building a sustainable community
for our future generations
CORPORATESOCIAL RESPONSIBILITY


CORPORATE SOCIAL RESPONSIBILITY
The Wharf (Holdings) L imited | Annual Report 201570
OUR CSR APPROACHGuided by our corporate mission “Building for Tomorrow”, our businesses strive to contribute to sustainable development and create positive impact in the society. Under the banner of “Business-in-Community”, our Corporate Social Responsibility (“CSR”) efforts aim to bring lasting value to our community, environment and people.
The Wharf CSR Steering Committee, established in 2014, is chaired by the Group’s senior executives including the Chairman, Vice Chairman, the CFO and representatives from key business units. The Committee may invite representatives from functions such as Procurement, Projects, Operations of key business units to meetings to ensure the Group’s objectives are aligned and fulfiled.
The Committee strategises the overall CSR efforts for the Group and business units, as well as aligning our business development with the Group’s CSR goals and commitments.
In 2015 we published the first standalone CSR report in accordance with the Global Reporting Initiative (GRI) standard to discourse our CSR performance. Wharf was selected a constituent member of the Hang Seng Corporate Sustainability Index, an index that covers the top 30 corporate sustainability leaders in Hong Kong.
CSR STRUCTURE
BUSINESS-IN-COMMUNITY
Project WeCan
Project WeCan (“PWC”) is an open-platform Business-in-Community programme initiated by Wharf. It is a pioneering multi-facet school improvement project to empower local secondary school students who are disadvantaged in learning with opportunities. Six more schools joined the programme in 2015, bringing the total number of schools to 50, corporate and other partners to 35, and benefiting about 42,000 students.
In collaboration with The Chinese University of Hong Kong (“CUHK”), a tailor-made English WeCan programme was launched in May 2015 to help Form 1 students who have been identified to be particularly weak in the language by boasting their confidence in English learning. About 200 Form 1 students from 25 PWC schools participated in a 15-week tutorial. Most graduated with discernible improvements with face-to-face help from 40 CUHK students and 20 corporate volunteers throughout the programme. A new scholarship scheme has been set up in 2015 to relieve financial burden of 58 PWC students who are admitted to local universities.
WHARF CSR STEERING COMMITTEE
Business Development Business ‐in-Community Products and ServicesEnvironmentPeople
Our CSR focus
Cross ‐business unit CSR group
35
partners
50
PWC schools
42,000
benefi ciary students

The Wharf (Holdings) L imited | Annual Report 2015 71

CORPORATE SOCIAL RESPONSIBILITY
The Wharf (Holdings) L imited | Annual Report 201572
The Group and our business units have been supporting community activities unrelentingly, focusing on
nurturing the youth, supporting the needy and promoting art and culture. During the year, more than 1,000
employees have clocked 12,000 hours of voluntary services.
Youth development
Since 2011, the Group has sponsored 12 outstanding architectural postgraduates via The Architectural Design
Internship Programme to intern in renowned architectural firms in different parts of the world, ranging from
France, Germany, Italy, Switzerland and the United Kingdom, to India and Japan.
Art and culture
The Wharf Hong Kong Secondary School Art Competition has continued to raise public awareness on art and
culture as well as to cultivate home-grown young talents. The top 18 finalists of last year’s competition were
invited to participate in a short art course, and arts and cultural exchange tour to Shanghai. They are also eligible
to apply for the Wharf Art Scholarship to pursue further studies in art-related bachelor programmes in local and
overseas universities. For the past four years since the scholarship is available, nine have been fully funded to
pursue art and design related studies in top notch universities such as School of Art Institute of Chicago and
Central Saint Martins, University of the Arts London.
12 architectural postgraduates and
young art talentshave been sponsored to pursue their dreams9
The Wharf (Holdings) L imited | Annual Report 2015 73
CORPORATE SOCIAL RESPONSIBILITY
The Wharf (Holdings) L imited | Annual Report 201574
OUR ENVIRONMENT
At Wharf, we are committed to optimising the use of natural resources and minimising the impact our operations
might have on the environment. We strive to surpass regulatory compliance and adopt international standards
in managing energy, water, materials consumption as well as controlling emissions and waste. The Group
is among the first movers in disclosing carbon footprint via the website of the Environmental Protection
Department of the HKSAR Government. Modern Terminals and Wharf T&T are certified with ISO 14001
Environmental Management System in recognition of their green efforts.
Better resources management
The Group is committed to operating a greener business through better resources management and continual
monitoring. Environmental initiatives are well in place in our business units commensurate with their scale and
operations. We have been upgrading lighting and air-conditioning systems for more efficient energy use; testing
the use of solar energy as a supplementary power source for our buildings; replacing vehicles, machineries and
equipment to lower fuel consumption and the corresponding air emissions and; installing more water efficient
facilities to reduce water use. We also continued to implement waste recycling and collection programmes to
alleviate the burden on Hong Kong landfills and to create awareness of waste reduction across our business.
HKQAA CSR INDEXP LU S
|
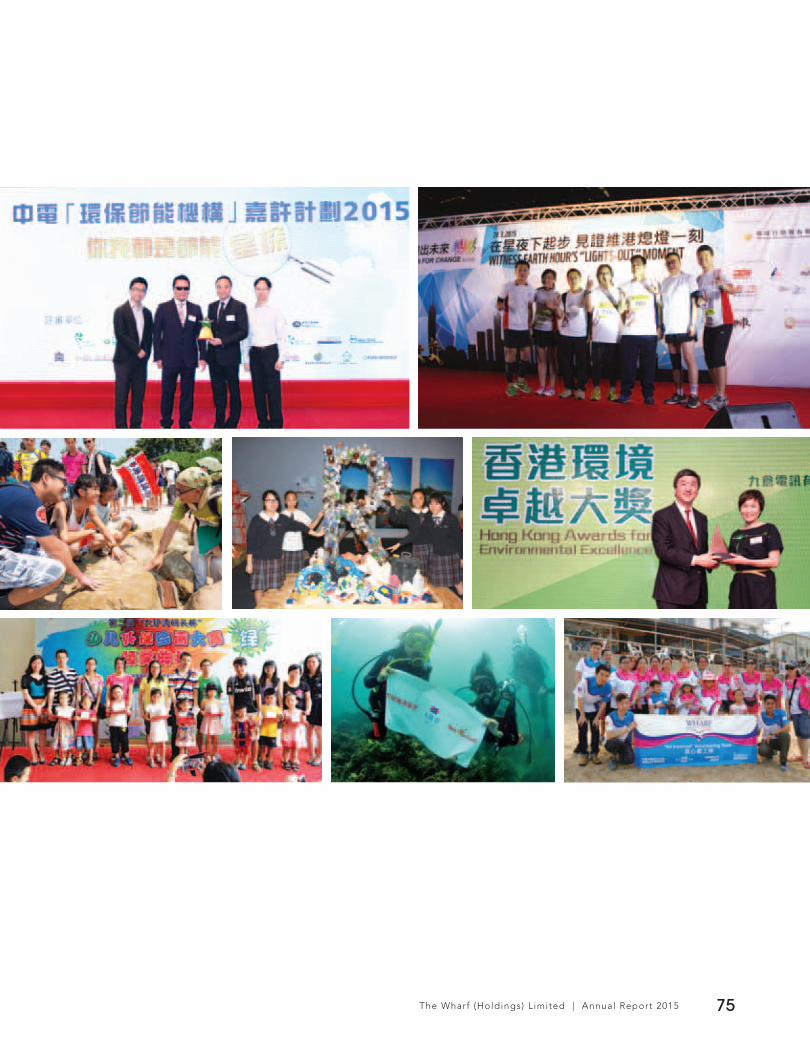
The Wharf (Holdings) L imited | Annual Report 2015 75

CORPORATE SOCIAL RESPONSIBILITY
The Wharf (Holdings) L imited | Annual Report 201576
OUR PEOPLE
Wharf is an equal opportunity employer. We recruit candidates based on their ability and eligibility for the job.
The Group has put in place policies and procedures which set labour and employment practice standards and
requirements including, but not limited to, anti-corruption, anti-discrimination, human rights, talent recruitment
and promotion, decent workplace, grievance mechanism and employee wellbeing.
Training and development
We are committed to building greater capacity and providing better opportunities for our people through
different training and career development programmes. In 2015, a variety of training programmes were offered
to our employees, covering skills enhancement, professional development, workplace health and safety and
anti-corruption, etc. Induction training and mentorship programmes are in place in various units to help new
employees adapt to company culture and work environment. The Wharf Institute of Service Excellence (WISE)
offers a wide range of training to our frontline staff.
Staff engagement and wellbeing
We believe our staff can perform the best in a workplace environment that encourages open communications
and work-life balance. Engagement channels such as staff newsletter, staff survey, focus group discussion and
luncheons are conducted across the Group and business units to understand employees’ concerns as well as to
improve our management practice. Various recreational activities and support services were also organised to
foster an inclusive workplace and lessen stress of our staff. In 2015, The Wharf Staff Recreational Committee
organised about 30 activities for our staff and their family members across the Group while respective business
units also arranged various kinds of recreational events in their respective units.
1,000+ EMPLOYEES
clocked
12,000+ VOLUNTEER HOURS
to help the needy
The Wharf (Holdings) L imited | Annual Report 2015 77
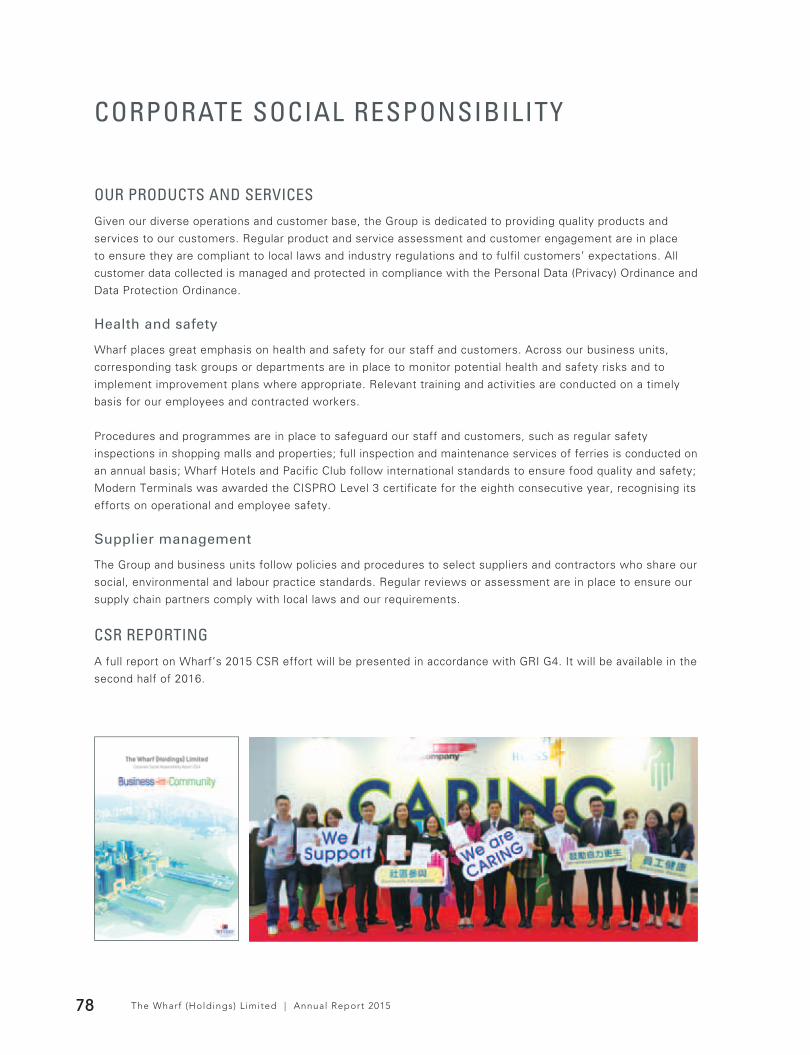
CORPORATE SOCIAL RESPONSIBILITY
The Wharf (Holdings) L imited | Annual Report 201578
OUR PRODUCTS AND SERVICES
Given our diverse operations and customer base, the Group is dedicated to providing quality products and
services to our customers. Regular product and service assessment and customer engagement are in place
to ensure they are compliant to local laws and industry regulations and to fulfil customers’ expectations. All
customer data collected is managed and protected in compliance with the Personal Data (Privacy) Ordinance and
Data Protection Ordinance.
Health and safety
Wharf places great emphasis on health and safety for our staff and customers. Across our business units,
corresponding task groups or departments are in place to monitor potential health and safety risks and to
implement improvement plans where appropriate. Relevant training and activities are conducted on a timely
basis for our employees and contracted workers.
Procedures and programmes are in place to safeguard our staff and customers, such as regular safety
inspections in shopping malls and properties; full inspection and maintenance services of ferries is conducted on
an annual basis; Wharf Hotels and Pacific Club follow international standards to ensure food quality and safety;
Modern Terminals was awarded the CISPRO Level 3 certificate for the eighth consecutive year, recognising its
efforts on operational and employee safety.
Supplier management
The Group and business units follow policies and procedures to select suppliers and contractors who share our
social, environmental and labour practice standards. Regular reviews or assessment are in place to ensure our
supply chain partners comply with local laws and our requirements.
CSR REPORTING
A full report on Wharf’s 2015 CSR effort will be presented in accordance with GRI G4. It will be available in the
second half of 2016.
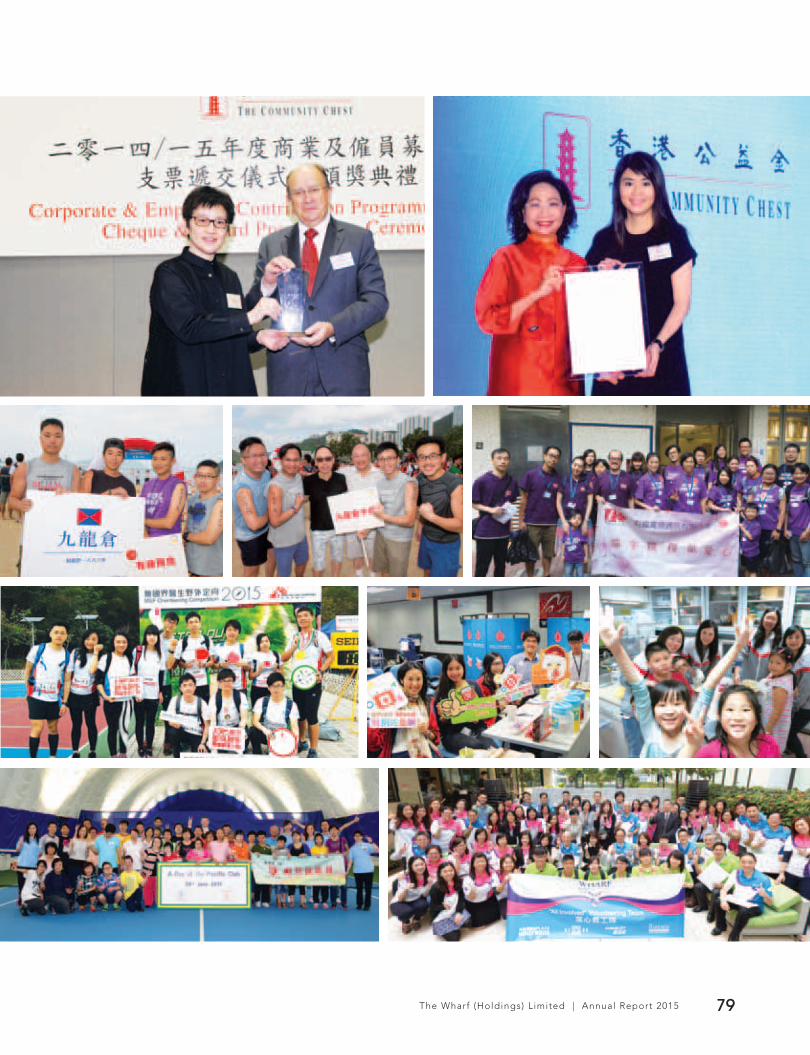
The Wharf (Holdings) L imited | Annual Report 2015 79

The Wharf (Holdings) L imited | Annual Report 201580
FINANCIAL REVIEW
(I) REVIEW OF 2015 RESULTSGroup core profit grew year-on-year by 5% to HK$10,969 million (2014: HK$10,474 million) in 2015. The increase reflected the resilience of Investment Properties (“IP”) gaining 9% core profit growth to HK$8,346 million, representing 76% (2014: 73%) of the Group’s core profit. Development Property (“DP”) core profit, including joint ventures and associates but excluding Greentown, grew by 48% to HK$1,211 million with more phased completion and revenue recognition for higher margin projects.
Profit attributable to shareholders was HK$16,024 million (2014: HK$35,930 million), decreasing by 55% mainly as a result of lower IP revaluation surplus arising from the year end revaluation.
Revenue and Operating Profit
IP revenue grew at slower pace than previous years but managed to increase by 8% to HK$14,470 million (2014: HK$13,397 million). Hong Kong increased by 7% to HK$12,165 million, attributable to the firm retail base rent persistently achieved from lease commitments and stable positive rental reversion for offices in both Harbour City and Times Square. In Mainland, revenue increased by 16% to HK$2,305 million, benefitting from the escalating revenue from Chengdu IFS. Operating profit grew by 8% to HK$11,759 million (2014: HK$10,896 million) with Hong Kong increasing by 6% to HK$10,516 million and Mainland by 25% to HK$1,243 million.
DP reported 16% higher property sales recognition to HK$18,018 million (2014: HK$15,539 million). Operating profit increased by 27% to HK$2,241 million (2014: HK$1,762 million) with overall higher margins from Mainland projects. Including the attributable sales recognised by joint ventures and associates, total China DP sales recognition increased by 18% to HK$27,404 million (2014: HK$23,270 million) and operating profit increased by 51% to HK$4,200 million (2014: HK$2,779 million).
Hotel revenue dropped by 3% to HK$1,549 million (2014: HK$1,600 million). Revenue from Hong Kong was adversely impacted by the weak market but compensated by the new source of revenue from the hotels newly opened in Mainland China. Operating profit decreased by 28% to HK$278 million (2014: HK$387 million), partly affecting by the decline in Hong Kong revenue and partly by pre-maturity operating losses from Marco Polo Changzhou and Niccolo Chengdu.
Logistics revenue fell by 14% to HK$2,848 million (2014: HK$3,319 million) and operating profit by 34% to HK$689 million (2014: HK$1,051 million), principally reflecting lower throughput handled by Modern Terminals as a result of the sluggish global trade flows.
CME revenue fell by 3% to HK$3,501 million (2014: HK$3,616 million). Wharf T&T’s revenue increased by 2% against i-CABLE’s 9% decrease. Operating profit shrank by 47% to HK$112 million (2014: HK$211 million) as i-CABLE’s operating loss widened to HK$246 million though Wharf T&T’s operating profit increased by 3% to HK$362 million.
Investment and others revenue fell by 24% to HK$787 million (2014: HK$1,035 million) and operating profit by 35% to HK$464 million (2014: HK$714 million), primarily due to decrease in interest income.
Consolidated revenue and operating profit rose by 7% and 4% to HK$40,875 million and HK$14,853 million, respectively.
China DP Contracted Sales
Inclusive of joint ventures and associates (other than Greentown) on an attributable basis, the Group recorded a 21% increase in contracted property sales of RMB26,044 million (2014: RMB21,454 million). Net order book increased to RMB24,635 million (2014: RMB21,921 million), which is available for revenue recognition in stages on completion of relevant DP projects.
Fair Value Gain of Investment Properties
The book value of the Group’s IP portfolio as at 31 December 2015 slightly increased to HK$310.2 billion (2014: HK$301.9 billion) with HK$292.9 billion thereof stated at fair value based on independent valuations as at that date, which produced a revaluation gain of HK$6,729 million (2014: HK$28,293 million). The attributable net revaluation gain of HK$6,231 million (2014: HK$27,683 million), after deducting related deferred tax and non-controlling interests, was credited to the consolidated income statement.
IP under development in the amount of HK$17.3 billion is carried at cost and will not be carried at fair value until the earlier of their fair values first becoming reliably measurable or the dates of completion.
Other Net Charge
Other net charge of HK$460 million (2014: HK$1,743 million) mainly included a non-recurrent accounting loss of HK$1,620 million arising from the deemed disposal of the Group’s entire 24.3% interest in Greentown at the prevailing market value upon classification of such interest as a financial investment instead of as an associate in June 2015. The Greentown interest was acquired in June 2012 at cost of HK$2,729 million with an accounting gain representing the negative goodwill of HK$2,233 million when the equity-interest was accounted for as an associate.
The Wharf (Holdings) L imited | Annual Report 2015 81
Partly offsetting the above charge is a gain of HK$908 million arising from Modern Terminals’ partial disposal of its equity interests in the Taicang container port businesses and a net profit of HK$187 million from disposals of available-for-sale investment.
Included in the net charge of 2014 was a provision for diminution in value of certain Mainland DP projects of HK$1,812 million.
Finance Costs
Finance costs charged to the consolidated income statement amounted to HK$1,879 million (2014: HK$1,930 million), including an unrealised mark-to-market loss of HK$406 million (2014: HK$230 million) on the cross currency/interest rate swaps in accordance with the prevailing accounting standards. Net of non-controlling interests, the mark-to-market loss is HK$405 million (2014: HK$229 million).
Excluding the unrealised mark-to-market loss, finance costs before capitalisation were HK$2,151 million (2014: HK$2,604 million), representing a decrease of HK$453 million. The Group’s effective borrowing rate for the year was 2.8% (2014: 3.2%).
Excluding the unrealised mark-to-market loss, finance costs after capitalisation of HK$678 million (2014: HK$904 million) in respect of the Group’s related assets were HK$1,473 million (2014: HK$1,700 million), representing a decrease of HK$227 million.
Share of Results (after tax) of Associates and Joint Ventures
Associates recorded attributable profit decrease of 8% to HK$1,156 million (2014: HK$1,262 million), mainly due to non-equity-accounting of Greentown upon classification of it as a financial investment instead of an associate since June 2015. Other Mainland DP reported a growth to HK$742 million (2014: HK$247 million).
Joint ventures reported a profit of HK$236 million (2014: loss of HK$11 million) benefitting from higher profit contributions of Mainland DP.
Income Tax
Taxation charge for the year was HK$3,829 million (2014: HK$3,730 million), which included deferred taxation of HK$488 million (2014: HK$543 million) provided for the current period’s revaluation gain attributable to investment properties in the Mainland.
Excluding the above deferred tax, the tax charge increased by 5% to HK$3,341 million (2014: HK$3,187 million) mainly due to higher profits from the IP and DP segments.
Non-controlling Interests
Group profit attributable to non-controlling interests increased by 58% to HK$782 million (2014: HK$494 million), reflecting the increase in net profits of certain non-wholly-owned subsidiaries.
Profit Attributable to Equity Shareholders
Group profit attributable to equity shareholders for the year ended 31 December 2015 amounted to HK$16,024 million (2014: HK$35,930 million), decreasing by 55% mainly as a result of lower IP revaluation surplus arising from the year end revaluations. Basic earnings per share were HK$5.29, based on weighted average of 3,031 million shares (2014: HK$11.86 based on 3,030 million shares).
Excluding the net IP revaluation gain of HK$6,231 million (2014: HK$27,683 million), Group profit attributable to shareholders for the year was HK$9,793 million (2014: HK$8,247 million), representing an increase of 19%.
Group’s core profit rose by 5% year-on-year to HK$10,969 million (2014: HK$10,474 million), of which 76% was attributable to IP and 11% was attributable to DP. IP core profit increased by 9% to HK$8,346 million (2014: HK$7,624 million) and DP core profit, including contributions from joint ventures and associates but excluding Greentown investment, increased by 48% to HK$1,211 million (2014: HK$816 million). Core earnings per share were HK$3.62 (2014: HK$3.46).
Core profit is a performance indicator of the Group’s major business segments and arrived at after excluding the net IP revaluation gain, loss of HK$1,620 million (2014: Nil) arising from the deemed disposal of Greentown, attributable disposal gain of HK$613 million (2014: Nil) from Modern Terminals’ disposal of its interest in Taicang container port businesses and attributable net mark-to-market loss and exchange of HK$169 million (2014: HK$229 million) on certain financial instruments.

The Wharf (Holdings) L imited | Annual Report 201582
FINANCIAL REVIEW
(II) LIQUIDITY, FINANCIAL RESOURCES AND CAPITAL COMMITMENTSShareholders’ and Total Equity
As at 31 December 2015, shareholders’ equity increased by HK$2.2 billion or 1% to HK$307.7 billion (2014: HK$305.5 billion), equivalent to HK$101.53 per share based on 3,031 million issued shares (2014: HK$100.82 per share based on 3,030 million issued shares). Included in the shareholders’ equity was a net exchange deficit of HK$6.5 billion arising from translation of RMB net assets and an investment revaluation deficit of HK$2.0 billion in the current year.
The Group’s total equity including the non-controlling interests increased by HK$3.1 billion to HK$317.2 billion (2014: HK$314.1 billion).
Assets
The Group’s total assets as at 31 December 2015 amounted to HK$443.9 billion (2014: HK$444.7 billion). Total business assets, excluding bank deposit and cash, certain available-for-sale investments, deferred tax assets and other derivative financial assets, amounted to HK$414.8 billion (2014: HK$422.4 billion).
Including in the Group’s total assets is the IP portfolio of HK$310.2 billion, representing 75% of its total business assets. The core assets in this portfolio are Harbour City and Times Square in Hong Kong, which were valued at HK$163.3 billion (excluding the three Marco Polo hotels) and HK$54.1 billion, respectively, together representing 70% of the IP portfolio. Mainland IP amounted to HK$58.1 billion, including those under development at a cost of HK$17.1 billion.
DP (mainly in the Mainland) amounted to HK$37.8 billion (2014: HK$47.5 billion). In addition, Mainland DP undertaken through associates and joint ventures amounted to HK$25.5 billion (2014: HK$32.4 billion). Other major business assets included property, plant and equipment of HK$22.8 billion.
Geographically, the Mainland business assets, mainly comprising properties and terminals, amounted to HK$139.8 billion (2014: HK$155.1 billion), representing 34% (2014: 37%) of the Group’s total business assets.
Debt and Gearing
The Group’s net debt as at 31 December 2015 decreased by HK$12.1 billion or 20% to HK$47.2 billion (2014: HK$59.3 billion), which was made up of HK$70.7 billion in debt and HK$23.5 billion in bank deposits and cash. Included in the net debt was HK$7.3 billion (2014: HK$10.3 billion) attributable to Modern Terminals, HCDL and other subsidiaries, which are without recourse to the Company and its other subsidiaries. Excluding these non-recourse debts, the Group’s net debt was HK$39.9 billion (2014: HK$49.0 billion). An analysis of the net debt is set out below:
31 December 2015
31 December 2014
Net debt/(cash) HK$ Million HK$ Million
Wharf (excluding below subsidiaries) 39,863 48,965Modern Terminals 8,763 11,023HCDL (1,647) (767)i-CABLE 218 38
47,197 59,259
As at 31 December 2015, the ratio of net debt to total equity declined to 14.9% (2014: 18.9%).

The Wharf (Holdings) L imited | Annual Report 2015 83
Finance and Availability of Facilities
The Group’s total available loan facilities and issued debt securities as at 31 December 2015 amounted to HK$93.3 billion, of which HK$70.7 billion was utilised, are analysed below:
31 December 2015
Available Total UndrawnFacilities Debt Facilities
HK$ Billion HK$ Billion HK$ Billion
Company/wholly-owned subsidiariesCommitted bank facilities 41.6 25.6 16.0Debt securities 31.0 31.0 –
72.6 56.6 16.0
Non-wholly-owned subsidiariesCommitted and uncommitted– Modern Terminals 14.3 9.0 5.3– HCDL 5.8 4.8 1.0– i-CABLE 0.6 0.3 0.3
93.3 70.7 22.6
Of the above debt, HK$4.0 billion (2014: HK$7.8 billion) was secured by mortgages over certain IP, DP and property, plant and equipment with total carrying value of HK$24.3 billion (2014: HK$39.9 billion).
The Group diversified the debt portfolio across a bundle of currencies including primarily United States dollar (“USD”), Hong Kong dollar (“HKD”) and Renminbi (“RMB”). The funding sourced from such debt portfolio was mainly used to finance the Group’s IP, DP and port investments.
The use of derivative financial instruments is strictly monitored and controlled. The majority of the derivative financial instruments entered into by the Group are primarily used for management of the Group’s interest rate and foreign currency exposures.
The Group continued to maintain a strong financial position with ample surplus cash denominated principally in RMB, HKD and USD and undrawn committed facilities to facilitate the Group’s business and investment activities. In addition, the Group also maintained a portfolio of available-for-sale investments with an aggregate market value of HK$8.1 billion (2014: HK$3.7 billion), which is immediately available for liquidation for the Group’s use when in need.
Cash Flows for the Group’s Operating and Investing Activities
For the year under review, the Group recorded net cash inflows before changes in working capital of HK$16.0 billion (2014: HK$15.1 billion). The changes in working capital increased the net cash inflow from operating activities to HK$24.1 billion (2014: HK$18.3 billion). For investing activities, the Group recorded a cash outflow of HK$7.3 billion (2014: HK$10.7 billion), mainly for construction costs of IP in Mainland, net purchase of available-for-sale investments, compensated by proceeds from Modern Terminal’s disposal of Taicang.

The Wharf (Holdings) L imited | Annual Report 201584
FINANCIAL REVIEW
Major Capital and Development Expenditure and Commitments
The Group’s major capital and development expenditure incurred in 2015 is analysed as follows:
A. Major capital and development expenditure
Hong Kong Mainland China TotalHK$ Million HK$ Million HK$ Million
Properties IP 1,218 4,137 5,355DP 889 15,912 16,801
2,107 20,049 22,156
Others Hotels 357 15 372Modern Terminals 257 37 294Wharf T&T 330 1 331i-CABLE 207 – 207
1,151 53 1,204
Group total 3,258 20,102 23,360
i. IP expenditure incurred during the year was mainly for the renovation of Harbour City and construction costs of the Mainland IFS projects.
ii. DP expenditure in 2015 included HK$8.5 billion attributable to DP projects undertaken by associates and joint ventures.
iii. Modern Terminals’ capital expenditure was mainly for terminal equipment while those of Wharf T&T and i-CABLE were incurred substantially for facilities and equipment.
B. Commitments to capital and development expenditure
As at 31 December 2015, the Group’s major commitments to capital and development expenditure that are to be incurred in the forthcoming years was estimated at HK$47.8 billion, of which HK$25.3 billion was committed. By segment, the commitments are analysed as follows:
As at 31 December 2015
Committed Uncommitted TotalHK$ Million HK$ Million HK$ Million
IP Hong Kong 2,027 477 2,504Mainland China 8,714 5,144 13,858
10,741 5,621 16,362
DP Hong Kong 459 – 459Mainland China 11,800 16,289 28,089
12,259 16,289 28,548
Others Hotels 1,999 235 2,234Modern Terminals 150 24 174Wharf T&T 119 50 169i-CABLE 25 245 270
2,293 554 2,847
Group total 25,293 22,464 47,757
Properties commitments are mainly for land and construction costs, inclusive of attributable commitments to associates and joint ventures, to be incurred by stages in the forthcoming years.
The above commitments and planned expenditure will be funded by the Group’s internal financial resources including its surplus cash, cash flows from operations, as well as bank and other financings with the construction costs self-financed mainly by pre-sale proceeds and project loans. Other available resources include available-for-sale investments.

The Wharf (Holdings) L imited | Annual Report 2015 85
(III) HUMAN RESOURCESThe Group had approximately 14,600 employees as at 31 December 2015, including about 2,400 employed by managed operations. Employees are remunerated according to their job responsibilities and the market pay trend with a discretionary annual performance bonus as variable pay for rewarding individual performance and contributions to the respective group’s achievement and results.
(IV) BUSINESS MODELSelect investment properties form the backbone of Wharf’s business model. The total value they offer combine rental yield growth with capital value appreciation. The recurrent cash flow they generate underpins a stable and rising dividend to shareholders. The conservatively leveraged equity cushion offers ample financial capacity to seize new investment opportunities in a timely and selective manner.
Including capital value appreciation, the investment properties in operation offered a total return of HK$16 billion in 2015 on an asset base of HK$296 billion at the beginning of the year. Harbour City and Times Square in Hong Kong together contributed over 80% of that total return (with HK$13 billion), from an asset base of HK$225 billion. With a combined GFA of over 10 million square feet, they generated HK$12.6 billion of revenue and HK$10.2 billion of operating cash flow in 2015.
New investment properties under development are a series of International Finance Squares (IFSs) led by those in the very heart of Chengdu and Changsha. At a combined development cost of HK$40 billion, Chengdu and Changsha IFSs will be as large as Harbour City and are designed to be as dominant in their respective markets. At Chengdu IFS, a retail mall and three office towers, including a new hotel Niccolo Chengdu, have already been completed. Changsha IFS is scheduled to open in phases from 2016. Two other IFSs are under development in Chongqing and Suzhou. A fifth was completed in Wuxi in 2014.
This prized portfolio of investment properties has also provided the financial capacity to enable Wharf to build other businesses.
From a near standing start in 2007, Wharf has built itself into one of the most active Hong Kong developers in the Mainland. Contracted sales in 2015 totalled RMB26.0 billion to bring aggregate attributable sales since 2007 to over RMB112 billion. Wharf’s current portfolio of development properties in the Mainland total 5.9 million square metres with a book value of RMB59 billion.
In Hong Kong, the development land bank with a much higher unit value comprises 3.2 million square feet. In particular, the Peak portfolio is a unique collection of properties.
Outside of properties, main business interests include hotels, parts and communications. All of them generate recurrent earnings and many are land based.
(V) BUSINESS STRATEGYThe Group endeavours to continuously enhance its competitiveness and drive sustainable growth through:
1. Continuous product leadership for existing and new investment properties from planning, design, tenancy management and marketing to maximise the value of protfolio;
2. Replicating the success of Harbour City and Times Square, location advantage, and special relationship with leading tenants to expand the portfolio of investment properties selectively to create substantial new value;
3. Applying core competencies in site selection and acquisition, development planning and design, construction, premium branding and marketing to operate a property development business in the Mainland to dovetail with the urbanisation programme;
4. Continuous development of sustainable and localised organisations with local market know how and international standards and execution expertise; and
5. Exercising prudent and disciplined financial management to ensure sustainability at all times.
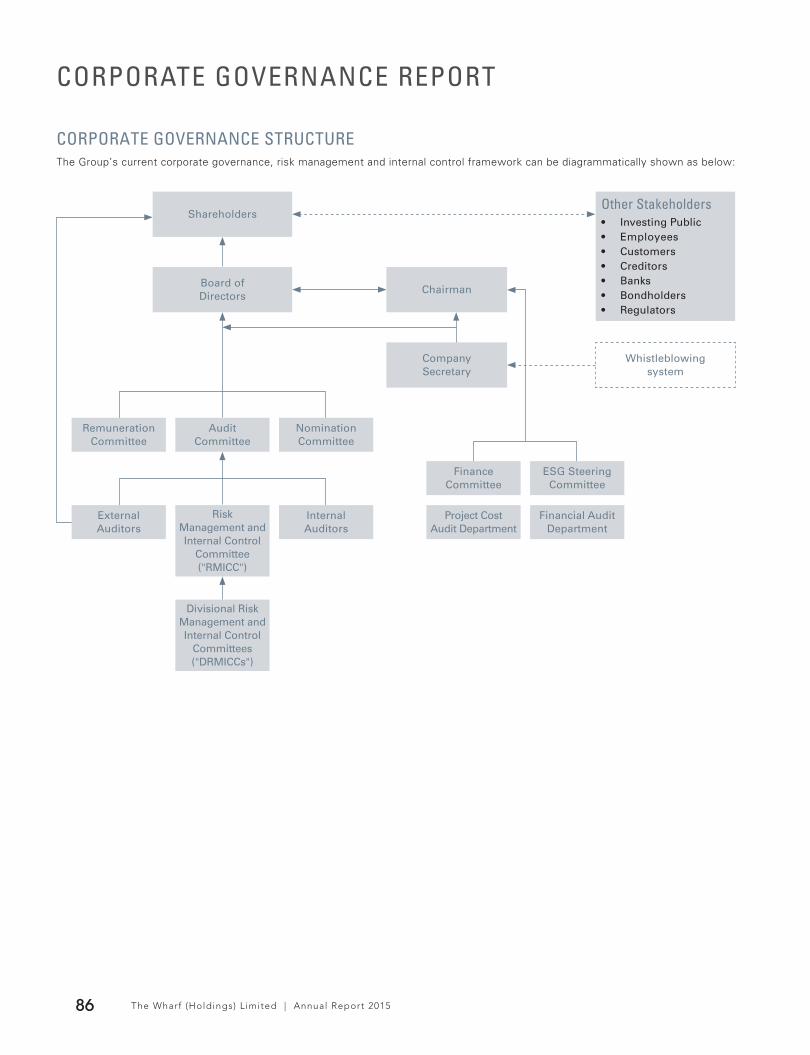
The Wharf (Holdings) L imited | Annual Report 201586
CORPORATE GOVERNANCE REPORT
CORPORATE GOVERNANCE STRUCTUREThe Group’s current corporate governance, risk management and internal control framework can be diagrammatically shown as below:
RemunerationCommittee
ExternalAuditors
AuditCommittee
Risk Management and Internal Control
Committee ("RMICC")
Divisional Risk Management and Internal Control
Committees ("DRMICCs")
NominationCommittee
Project Cost Audit Department
Finance Committee
Financial Audit Department
ESG SteeringCommittee
Internal Auditors
Shareholders
Board ofDirectors
CompanySecretary
Whistleblowingsystem
Chairman
Other Stakeholders• Investing Public• Employees• Customers• Creditors• Banks• Bondholders• Regulators

The Wharf (Holdings) L imited | Annual Report 2015 87
CORPORATE GOVERNANCE PRACTICESDuring the financial year ended 31 December 2015, all the code provisions in the Corporate Governance Code (the “Code”) as set out in Appendix 14 of the Rules (the “Listing Rules”) Governing the Listing of Securities on The Stock Exchange of Hong Kong Limited (the “Stock Exchange”) then in force, were met by the Company, with the exception of two deviations as set out under sections A.2.1 and F.1.3 respectively.
The application of the relevant principles and the reasons for the abovementioned deviations from the Code provisions are stated in the relevant sections below. Key corporate governance principles and corporate governance practices of the Company during the financial year are summarized below:
I. Code Provisions
Code Ref. Code Provisions
A.
A.1
DIRECTORS
The Board
Corporate Governance Principle
The board should assume responsibility for its leadership and control and is collectively responsible for promoting its success by directing and supervising its affairs. Directors should take decisions objectively in the best interests of the company.
The board should regularly review the contribution required from a director to perform his responsibilities to the company, and whether he is spending sufficient time performing them.
Compliance Status
Corporate Governance Practices
Exceed Requirement
Four regular meetings of the board of directors of the Company (the “Board”) were held during the financial year ended 31 December 2015, all of which were attended by the large majority of the directors of the Company (the “Directors”) entitled to attend. Please refer to the table set out on page 93 for details of the attendance records of the Directors.
The Directors may attend meetings in person, by phone or through other means of electronic communication in accordance with the Company’s Articles of Association.
All Directors are consulted as to whether they may want to include any matter in the agenda before the agenda for each regular Board meeting is issued.
One month formal notice would be given before each regular meeting and reasonable notices are given for all other ad hoc meetings.
The company secretary of the Company (the “Company Secretary”) prepares minutes and/or written resolutions and keeps records of matters discussed and decisions resolved at all Board and Board Committee meetings.
Board and Board Committee minutes/resolutions are sent to all Directors/Board Committee members for their comments and record within a reasonable time after each Board and Board Committee meeting.
Board and Board Committee minutes/resolutions are available for inspection by Directors/Board Committee members. Final version of Board minutes is put on record within a reasonable time after the Board meeting.
Minutes record in sufficient detail of the matters considered by the Board/Board Committees and decisions reached.
The Company Secretary can arrange independent professional advice at the expense of the Company should such advice be considered necessary by any Director.
The Wharf (Holdings) L imited | Annual Report 201588
CORPORATE GOVERNANCE REPORT
Important matters are decided by Directors by way of resolutions passed at Directors’ meetings, or, on some occasions, dealt with by way of written resolutions so that all Directors (including Independent Non-executive Directors (“INEDs”)) can note and comment, as appropriate, the matters before approval is granted.
Under the Company’s Articles of Association, a Director shall not vote or be counted in the quorum in respect of any contract or arrangement in which he/she or any of his/her associate is/are materially interested.
The Company has arranged appropriate insurance cover of Directors’ and Officers’ liability.
Code Ref. Code Provisions
A.2 Chairman and Chief Executive
Corporate Governance Principle
There are two key aspects of the management of every issuer – the management of the board and the day-to-day management of business. There should be a clear division of responsibilities to ensure a balance of power and authority, so that power is not concentrated in any one individual.
Compliance Status
Corporate Governance Practices
Comply with Requirement
The Chairman is responsible for the Board, focuses on Group strategies and Board issues, ensures a cohesive working relationship between members of the Board and management, and also in his capacity as Managing Director, he directly has responsibilities in certain major business units of the Group.
The Executive Directors have full executive responsibilities in the business directions and operational efficiency of the business units under their respective responsibilities and are accountable to the Chairman.
With the support of the Executive Directors and the Company Secretary, the Chairman seeks to ensure that all Directors are properly briefed on issues arising at Board meetings and receive accurate, clear, adequate and reliable information on a timely basis.
The Chairman takes into account, where appropriate, any matters proposed by other Directors for inclusion in the agenda. The Chairman may delegate this responsibility to a designated Director or the Company Secretary.
The Chairman takes primary responsibility for ensuring that good corporate governance practices and procedures are established.
The Chairman encourages all Directors to make a full and active contribution to the Board’s affairs and takes the lead to ensure that it acts in the best interests of the Company. The Chairman encourages Directors with different views to voice their concerns, allow sufficient time for discussion of issues and ensure that Board decisions fairly reflect Board consensus.
The Chairman ensures that appropriate steps are taken to provide effective communication with shareholders of the Company (the “Shareholders”) and that their views are communicated to the Board as a whole.
The Chairman promotes a culture of openness and debate by facilitating the effective contribution of Non-Executive Directors in particular and ensuring constructive relations between Executive and Non-Executive Directors.
The Chairman at least annually holds meetings with Non-Executive Directors (including INEDs) without the Executive Directors present.

The Wharf (Holdings) L imited | Annual Report 2015 89
Code Ref. Code Provisions
A.2.1 The roles of chairman and chief executive should be separate and should not be performed by the same individual.
Compliance Status
Corporate Governance Practices
Not Comply with
Requirement
Hon Peter K C Woo, before his retirement on 15 May 2015, had served as the Chairman and also as the de facto chief executive of the Company and thereafter Mr Stephen T H Ng succeeded the chairmanship whilst retaining his role as the Managing Director of the Company. This is a deviation from the Code provision with respect to the roles of chairman and chief executive to be performed by different individuals. Such deviation is deemed appropriate as it is considered to be more efficient to have one single person to be the Chairman of the Company as well as to discharge the executive functions of a chief executive. The Board believes that the balance of power and authority is adequately ensured by the operations of the Board which comprises experienced and high calibre individuals, with half of them being INEDs.
Code Ref. Code Provisions
A.3 Board composition
Corporate Governance Principle
The board should have a balance of skills, experience and diversity of perspective appropriate for the requirements of the company’s business and should include a balanced composition of executive and non-executive directors so that independent judgement can effectively be exercised.
Compliance Status
Corporate Governance Practices
Exceed Requirement
The Board has a balance of skills and experience appropriate for the Company’s business. Given below are names of the Directors in office during the year:
Ex-ChairmanHon Peter K C Woo (retired on 15 May 2015)
Chairman & Managing DirectorMr Stephen T H Ng (designated on 15 May 2015)
Deputy ChairmanMr Andrew O K Chow (designated on 15 May 2015)
Vice ChairmanMs Doreen Y F Lee (designated on 15 May 2015)
Vice Chairman & Group Chief Financial OfficerMr Paul Y C Tsui (designated on 15 May 2015)
DirectorsMs Y T LengMr K P Chan (appointed effective from 15 May 2015)
Independent Non-executive DirectorsMr Alexander S K AuProfessor Edward K Y ChenHon Vincent K FangMr Hans Michael JebsenMr David M TurnbullProfessor E K YeohDr Raymond K F Ch’ien (resigned on 1 January 2016)Mr Wyman Li (resigned on 2 September 2015)

The Wharf (Holdings) L imited | Annual Report 201590
CORPORATE GOVERNANCE REPORT
The Directors’ biographical information is set out on pages 109 to 112.
As at the date of this Corporate Governance Report, the Board consists of a total of twelve Directors, comprising six INEDs.
The structure, size and composition of the Board are reviewed from time to time to ensure the Board has a balanced composition of skills and experience appropriate for the requirements of the businesses of the Company. The independence of the INEDs is assessed according to the relevant rules and requirements under the Listing Rules.
The composition of the Board, by category and position of Directors including the names of the Chairman and Managing Director, the Deputy Chairman, the Vice Chairmen, the INEDs, is disclosed in all corporate communications.
The Company maintains on its corporate website and on the Stock Exchange’s website an updated list of Directors identifying their roles and functions and whether they are INEDs.
Code Ref. Code Provisions
A.4 Appointments, re-election and removal
Corporate Governance Principle
There should be a formal, considered and transparent procedure for the appointment of new directors and plans in place for orderly succession for appointments. All directors should be subject to re-election at regular intervals. An issuer must explain the reasons for the resignation or removal of any director.
Compliance Status
Corporate Governance Practices
Comply with Requirement
All Directors, including the INEDs, are subject to retirement once every three years and are subject to re-election.
The Board as a whole is responsible for the appointment of new Directors and Directors’ nomination for re-election by Shareholders at the general meeting of the Company. Under the Company’s Articles of Association, the Board may from time to time appoint a Director either to fill a casual vacancy or as an addition to the Board. Any such new Director shall hold office until the next following general meeting of the Company (in the case of filling a casual vacancy) or until the next following annual general meeting of the Company (“Annual General Meeting”) (in the case of an addition to the Board) and shall then be eligible for re-election at the same general meeting.
Each of the INEDs makes an annual confirmation of independence pursuant to the requirements of the Listing Rules. The Company is of the view that all INEDs meet the independence guidelines set out in the relevant requirements of the Listing Rules and are independent in accordance with the terms of the guidelines.
Non-Executive Directors have their respective terms of appointment coming to an end normally three years after their appointment to the Board or (in the case of Directors who were re-elected to the Board at previous Annual General Meetings) their last re-election as Directors.
The re-election of each of those INEDs who has served on the Board for more than nine years is subject to (1) a separate resolution to be approved by Shareholders at the relevant Annual General Meeting; and (2) further information being given to Shareholders together with the notice of meeting regarding the reasons why the Board believes the relevant Director is still independent and should be re-elected.

The Wharf (Holdings) L imited | Annual Report 2015 91
Code Ref. Code Provisions
A.5 Nomination Committee
Compliance Status
Corporate Governance Practices
Comply with Requirement
In accordance with the Code, the Company has set up a nomination committee (the “Nomination Committee”) with the majority of its members being INEDs. The Nomination Committee comprises the Chairman and Managing Director of the Company, namely, Mr Stephen T H Ng (the chairman of the Nomination Committee), and two INEDs, namely, Mr Hans Michael Jebsen and Mr David M Turnbull.
The terms of reference of the Nomination Committee are aligned with the Code provisions set out in the Code. The Nomination Committee is principally responsible for nominating candidates, for the Board’s approval, to fill Board vacancies as and when they arise. Given below are the main duties of the Nomination Committee:
(a) to review the structure, size and composition (including the skills, knowledge and experience) of the Board at least annually and make recommendations on any proposed changes to the Board to complement the Company’s corporate strategy;
(b) to identify individuals suitably qualified to become Board members and select or make recommendations to the Board on the selection of individuals nominated for directorships;
(c) to assess the independence of INEDs; and
(d) to make recommendations to the Board on the appointment or re-appointment of Directors and succession planning for Directors, in particular the Chairman of the Board and the chief executive.
The roles and authorities of the Nomination Committee are set out in its terms of reference which are available at the Company’s corporate website at www.wharfholdings.com.
During the year ended 31 December 2015, no Nomination Committee meeting was held and the decisions recommended by the Nomination Committee by way of resolutions in writing are summarized below:
(a) the relinquishment of Hon Peter K C Woo from the office of Chairman and the appointment of Mr Stephen T H Ng as the succeeding Chairman effective from 15 May 2015;
(b) the re-designations of Mr Andrew O K Chow as the Deputy Chairman, and Mr Paul Y C Tsui and Ms Doreen Y F Lee as the Vice Chairmen effective from 15 May 2015; and
(c) the appointment of Mr K P Chan as a Director effective from 15 May 2015.
The Board has adopted the Board Diversity Policy in 2014. Under the Policy, the Company recognizes and embraces the benefits of having a diverse Board towards enhancement of its overall performance. With a vision to achieving a sustainable and balanced development, the Company regards increasing diversity at the Board level as an essential element of its strategic goals. Appointments of Directors are made on merits having due regard for the benefits of diversity on the Board.
At present, half of the Directors on the Board are INEDs. They represent diverse career experiences in both international and local enterprises. They bring with them diverse professional backgrounds, spanning property development and investment, banking, logistics and transportation, health services, academia and entrepreneurship. They also hold or have held important public service positions in Hong Kong and China, covering business, industry and commerce, educations, regulatory and politics.
The Board composition reflects various cultural and educational backgrounds, professional development, length of service, knowledge of the Company and a broad range of individual attributes, interests and values. The Board considers the current Board composition has provided the Company with a good balance and diversity of skills and experience appropriate to the requirements of its business. The Board will continue to review its composition from time to time taking into consideration specific needs for the Group’s business.

The Wharf (Holdings) L imited | Annual Report 201592
CORPORATE GOVERNANCE REPORT
Code Ref. Code Provisions
A.6 Responsibilities of directors
Corporate Governance Principle
Every director must always know his/her responsibilities as a director of the company and its conduct, business activities and development.
Compliance Status
Corporate Governance Practices
Comply with Requirement
Newly appointed Directors receive briefings and orientation on their legal and other responsibilities as a Director and the role of the Board. The Company has also provided appropriate information in a timely manner to the Directors to enable them to make an informed decision and to discharge their duties and responsibilities as Directors.
The Company’s management has closely monitored changes to regulations that affect its corporate affairs and businesses, and changes to accounting standards, and adopted an appropriate reporting format in its interim report, annual report and other related documents to present a balanced, clear and comprehensible assessment of the Group’s performance, position and prospects. Where these changes are pertinent to the Company or Directors’ disclosure obligations, the Directors are either briefed during Board meetings or issued with regular updates and materials to keep them abreast of their responsibilities and of the conduct, business activities and development of the Group.
The Company has also arranged for Directors to attend training sessions and forums which place emphasis on the roles, functions and duties of a listed company director, as well as the development of regulatory updates and issues. Since January 2012, all Directors have been required to provide training records to the Company and the training records have been maintained by the Company Secretary.
According to the records of training maintained by the Company Secretary, all the current Directors have, during the financial year under review, pursued continuous professional development and relevant details are set out below:
Directors Type of trainings (See Remarks)
Mr Stephen T H Ng BMr Andrew O K Chow A, BMs Doreen Y F Lee A, BMr Paul Y C Tsui A, BMs Y T Leng A, BMr K P Chan (appointed effective from 15 May 2015) A, BMr Alexander S K Au A, BProfessor Edward K Y Chen A, BHon Vincent K Fang A, BMr Hans Michael Jebsen A, BMr David M Turnbull BProfessor E K Yeoh A, B
Remarks:A: attending seminars and/or conferences and/or forumsB: reading journals, updates, articles and/or materials, etc
The INEDs exercise their independent judgement and advise on the future business direction and strategic plans of the Company.
The INEDs review the financial information and operational performance of the Company on a regular basis.
The INEDs are invited to serve on the Board Committees of the Company.
Every Executive Director has hands-on knowledge and expertise in the areas and operation in which he/she is charged with. Appropriate attention to the affairs of the Company is measured in terms of time as well as the quality of such attention and the ability of the Directors to contribute with reference to his/her necessary knowledge and expertise.

The Wharf (Holdings) L imited | Annual Report 2015 93
The Company has established written guideline, no less exacting the Model Code for Securities Transactions by Directors of Listed Issuers (“Model Code”) in Appendix 10 of the Listing Rules, for all the staff regarding dealings in securities issued by the Group and its associated companies.
Each Director discloses to the Company at the time of his/her appointment, and in a timely manner for any change, the number and nature of offices held in public companies or organisations and other significant commitments with indication of relevant time commitment.
Individual attendance records of our Directors at Board meetings, Board Committees meetings and Annual General Meeting during the financial year ended 31 December 2015, are set out below:
Numbers of Meetings (Attended/Eligible to attend)
Name of DirectorsBoard
meeting
Audit Committee
meeting
Remuneration Committee
meeting
Annual General Meeting
Hon Peter K C Woo (retired on 15 May 2015)
2/2 n/a 1/1 1/1
Mr Stephen T H Ng 4/4 n/a n/a 1/1Mr Andrew O K Chow 3/4 n/a n/a 1/1Ms Doreen Y F Lee 4/4 n/a n/a 1/1Mr Paul Y C Tsui 4/4 n/a n/a 1/1Ms Y T Leng 4/4 n/a n/a 1/1Mr K P Chan
(appointed effective from 15 May 2015)1/2 n/a n/a n/a
Mr Alexander S K Au 4/4 4/4 n/a 1/1Professor Edward K Y Chen 3/4 n/a n/a 1/1Dr Raymond K F Ch’ien
(resigned with effect from 1 January 2016)1/4 n/a n/a 1/1
Hon Vincent K Fang 3/4 3/4 n/a 1/1Mr Hans Michael Jebsen 2/4 1/4 1/1 0/1Mr Wyman Li
(resigned with effect from 2 September 2015)0/3 2/3 1/1 0/1
Mr David M Turnbull 4/4 n/a n/a 1/1Professor E K Yeoh 3/4 1/1 n/a 0/1 Total No. of Meetings Held 4 4 1 1
A majority of our INEDs attended the last Annual General Meeting held in May 2015, with absence of three INEDs, due to their other important engagements at the relevant time. Please refer to the table set out above for details of attendance records of all Directors at the last Annual General Meeting held in May 2015.
Code Ref. Code Provisions
A.7 Supply of and access to informationCorporate Governance Principle
Directors should be provided in a timely manner with appropriate information in the form and quality to enable them to make an informed decision and perform their duties and responsibilities.
Compliance Status Corporate Governance Practices
Comply with Requirement
Board papers are circulated not less than three days before regular Board meetings to enable the Directors to make informed decisions on matters to be raised at the Board meetings.
The Company Secretary and the Group Financial Controller attend all regular Board meetings to advise on corporate governance, statutory compliance, and accounting and financial matters, as appropriate.
Communications between Directors on the one hand, and the Company Secretary, who acts as co-ordinator for the business units of the Group on the other, is a dynamic and interactive process to ensure that queries raised and clarification sought by the Directors are dealt with and that further supporting information is provided if appropriate.

The Wharf (Holdings) L imited | Annual Report 201594
CORPORATE GOVERNANCE REPORT
Code Ref. Code Provisions
B.
B.1
REMUNERATION OF DIRECTORS AND SENIOR MANAGEMENT AND BOARD EVALUATION
The level and make-up of remuneration and disclosure
Corporate Governance Principle
The procedure for setting policy on executive directors’ remuneration and all directors’ remuneration packages should be formal and transparent.
Compliance Status
Corporate Governance Practices
Comply with Requirement
The Company has set up a remuneration committee (the “Remuneration Committee”) with majority of the members being INEDs.
The Remuneration Committee comprises the Chairman of the Company, Hon Peter K C Woo (retired on 15 May 2015) and Mr Stephen T H Ng (appointed effective from 15 May 2015) and two INEDs, namely, Mr Hans Michael Jebsen (the chairman of the Remuneration Committee), Mr Wyman Li (resigned effective from 2 September 2015) and Mr David M Turnbull (appointed effective from 2 September 2015).
The principal responsibilities of the Remuneration Committee include making recommendations to the Board on the Company’s policy and structure for the remuneration of Directors and senior management of the Company (“Senior Management”), and reviewing the specific remuneration packages of all Executive Directors and Senior Management by reference to corporate goals and objectives resolved by the Board from time to time.
The terms of reference of the Remuneration Committee are aligned with the Code provisions set out in the Code. Given below are the main duties of the Remuneration Committee:
(a) to make recommendations to the Board on the Company’s policy and structure for all Directors’ and Senior Management remuneration and on the establishment of a formal and transparent procedure for developing remuneration policy;
(b) to review and approve the management’s remuneration proposals by reference to the Board’s corporate goals and objectives;
(c) either:
(i) to determine, with delegated responsibility, the remuneration packages of individual Executive Directors and Senior Management; or
(ii) to make recommendations to the Board on the remuneration packages of individual Executive Directors and Senior Management.
This should include benefits in kind, pension rights and compensation payments, including any compensation payable for loss or termination of their office or appointment;
(d) to make recommendations to the Board on the remuneration of Non-Executive Directors;
(e) to consider salaries paid by comparable companies, time commitment and responsibilities and employment conditions elsewhere in the Group;
(f) to review and approve compensation payable to Executive Directors and Senior Management for any loss or termination of office or appointment to ensure that it is consistent with contractual terms and is otherwise fair and not excessive;
The Wharf (Holdings) L imited | Annual Report 2015 95
(g) to review and approve compensation arrangements relating to dismissal or removal of Directors for misconduct to ensure that they are consistent with contractual terms and are otherwise reasonable and appropriate;
(h) to ensure that no Director or any of his/her associates is involved in deciding his/her own remuneration; and
(i) to advise Shareholders on how to vote with respect to any service contracts of Directors that require Shareholders’ approval under the Listing Rules.
The roles and authorities of the Remuneration Committee are set out in its terms of reference which are available at the Company’s corporate website at www.wharfholdings.com.
There were one Remuneration Committee meeting held during the financial year ended 31 December 2015. Please refer to the table set out on page 93 for the details of attendance of the Remuneration Committee members.
The work performed by the Remuneration Committee, which has the delegated authority and responsibility, for the financial year ended 31 December 2015 is summarised below:
(a) review of the Company’s policy and structure for all remuneration of Directors and Senior Management; and
(b) consideration and approval of the emoluments for all Directors and Senior Management.
The Remuneration Committee has consulted the Chairman of the Company about proposals relating to the remuneration packages and other human resources issues of the Directors and Senior Management, including, without limitation, succession plan and key personnel movements as well as policies for recruiting and retaining qualified personnel.
The basis of determining the emoluments payable to its Directors and Senior Management by the Company is by reference to the level of emoluments normally paid by a listed company in Hong Kong to directors and senior executives of comparable calibre and job responsibilities so as to ensure a fair and competitive remuneration package as is fit and appropriate. The basis of determining the fee payable to the Chairman of the Company, currently at the rate of HK$225,000 per annum, the fee payable to each of the other Directors, currently at the rate of HK$150,000 per annum, and the fee payable to each of those Directors who are also members of the Audit Committee, currently at the rate of HK$75,000 per annum, is by reference to the level of fees of similar nature normally paid by a listed company in Hong Kong to its directors. In respect of the remuneration payable to the Senior Management, please refer to Note 2(b) to the financial statements on page 135 for details.
To enable it to better advise on the Group’s future remuneration policy and related strategies, the Remuneration Committee has been advised of the Group’s existing remuneration policy and succession plan, such as guidelines on designing employees’ remuneration packages and related market trends and information.
The Personnel Department provides administrative support and implements the approved remuneration packages and other human resources related decisions approved by the Remuneration Committee.

The Wharf (Holdings) L imited | Annual Report 201596
CORPORATE GOVERNANCE REPORT
Code Ref. Code Provisions
C.
C.1
ACCOUNTABILITY AND AUDIT
Financial reporting
Corporate Governance Principle
The board should present a balanced, clear and comprehensible assessment of the company’s performance, position and prospects.
Compliance Status
Corporate Governance Practices
Comply with Requirement
All Directors are provided with a review of the Group’s major business activities and key financial information on a monthly basis.
The Directors are responsible for overseeing the preparation of the financial statements for the financial year ended 31 December 2015, which give a true and fair view of the financial position of the Group and of the Group’s financial performance and cash flows for the year then ended and in compliance with the requirements of the Hong Kong Companies Ordinance and the applicable disclosure provisions of the Listing Rules.
In preparing the financial statements for the financial year ended 31 December 2015:
(i) appropriate accounting policies are selected, applied consistently and in accordance with the Hong Kong Financial Reporting Standards;
(ii) appropriate and reasonable judgments and estimates are made; and
(iii) the reasons for any significant departure from applicable accounting standards are stated, if applicable.
The Directors are not aware of material uncertainties relating to events or conditions that may cast significant doubt upon the Company’s ability to continue as a going concern as referred to in C.1.3 of the Code.
The Directors are satisfied with the Group’s performance on the basis that the Company generates or preserves value over the longer term (the business model) and delivers the Company’s objectives as referred to in C.1.4 of the Code.
With the assistance of the Company’s Accounts Department which is under the supervision of the Group Financial Controller who is a professional accountant, the Directors ensure the preparation of the financial statements of the Group which are in accordance with statutory requirements and applicable accounting standards.
The Directors also ensure the publication of the financial statements of the Group is in a timely manner.
The statement by the external auditors of the Company regarding its reporting responsibilities on the financial statements of the Group is set out in the Independent Auditor’s Report on page 123.
The Board aims to present a clear, balanced and understandable assessment of the Group’s performance and financial position in all shareholder communications.
The Board is aware of the requirements under the applicable rules and regulations about timely disclosure of price-sensitive information or matters regarding the Company and will authorise the publication of such announcements as and when the occasion arises. The Company Secretary works closely and in consultation with legal advisers to review the materiality and sensitivity of transactions and proposed transactions and advise the Board accordingly.

The Wharf (Holdings) L imited | Annual Report 2015 97
Code Ref. Code Provisions
C.2 Risk Management and Internal Control
Corporate Governance Principle
The board should ensure that the company maintains sound and effective risk management and internal control systems to safeguard shareholders’ investments and the company’s assets.
Compliance Status
Corporate Governance Practices
Exceed Requirement
During the year under review, the Group has enhanced its systems and practices in respect of risk management and internal control taking into account the requirements of the revised Code to be applicable to the Company for the financial year ending on 31 December 2016. Please refer to the sub-section headed “Risk Management and Internal Control Systems” as set out on pages 104 to 105 for the details.
Code Ref. Code Provisions
C.3 Audit Committee
Corporate Governance Principle
The board should establish formal and transparent arrangements to consider how it will apply financial reporting, risk management and internal control principles and maintain an appropriate relationship with the auditors.
Compliance Status
Corporate Governance Practices
Exceed Requirement
Minutes drafted by the Company Secretary are circulated to members of the Audit Committee (the “Audit Committee”) within a reasonable time after each meeting.
The Company has set up an Audit Committee with all members being INEDs, namely, Hon Vincent K Fang (the chairman of the Audit Committee), Mr Alexander S K Au, Mr Han Michael Jebsen, Mr Wyman Li (resigned effective from 2 September 2015) and Professor E K Yeoh (appointed effective from 2 September 2015).
No member of the Audit Committee is a former partner of the existing auditing firm of the Company. All members have sufficient experience in reviewing audited financial statements as aided by the auditors of the Group whenever required.
A revised set of terms of reference of the Audit Committee (the “Revised AC Terms of Reference”) has been adopted by the Company during the year to align with the recent amendments to the Code. The Revised AC Terms of Reference is aligned with provisions set out in the Code and the recommendations set out in “A Guide for Effective Audit Committees” issued by the Hong Kong Institute of Certified Public Accountants. Given below are the main duties of the Audit Committee:
(I) Relationship with the Company’s external auditors
(a) to be primari ly responsible for making recommendations to the Board on the appointment, reappointment and removal of the external auditors, and to approve the remuneration and terms of engagement of the external auditors, and any questions of their resignation or dismissal;
(b) to review and monitor the external auditors’ independence and objectivity and the effectiveness of the audit process in accordance with applicable standards. The Audit Committee should discuss with the external auditor the nature and scope of the audit and reporting obligations before the audit commences; and
(c) to develop and implement policy on engaging an external auditor to supply non-audit services. For this purpose, “external auditor” includes any entity that is under common control, ownership or management with the audit firm or any entity that a reasonable and informed third party knowing all relevant information would reasonably conclude to be part of the audit firm nationally or internationally. The Audit Committee should report to the Board, identifying and making recommendations on any matters where action or improvement is needed.

The Wharf (Holdings) L imited | Annual Report 201598
CORPORATE GOVERNANCE REPORT
(II) Review of the Company’s financial information
(a) to monitor integrity of the Company’s financial statements and annual report and accounts, half-year report and, if prepared for publication, quarterly reports, and to review significant financial reporting judgements contained in them. In reviewing these reports before submission to the Board, the Audit Committee should focus particularly on:
(i) any changes in accounting policies and practices;
(ii) major judgmental areas;
(iii) significant adjustments resulting from the audit;
(iv) the going concern assumptions and any qualifications;
(v) compliance with accounting standards; and
(vi) compliance with the Listing Rules and legal requirements in relation to financial reporting;
(b) regarding (II) (a) above:–
(i) members of the Audit Committee should liaise with the Board and Senior Management and the Audit Committee must meet, at least twice a year, with the Company’s external auditors; and
(ii) the Audit Committee should consider any significant or unusual items that are, or may need to be, reflected in the report and accounts, it should give due consideration to any matters that have been raised by the Company’s staff responsible for the accounting and financial reporting function, or for compliance function, or auditors (internal or external).
(III) Oversight of the Company’s financial reporting system, and risk management and internal control systems
(a) to review the Company’s risk management and internal control systems covering all controls, including financial, operational and compliance controls, with the support of the Risk Management and Internal Control Committee;
(b) to discuss the risk management and internal control systems with management to ensure that management has performed its duty to have effective systems. This discussion should include the adequacy of resources, staff qualifications and experience, training programmes and budgets of the Company’s accounting, internal audit and financial reporting functions;
(c) to consider major investigation findings on risk management and internal control matters as delegated by the Board or on its own initiative and management’s response to these findings and review the statements concerning risk management and internal control to be included in the annual report;
(d) to ensure co-ordination between the internal and external auditors, to review and approve the annual internal audit plan, to ensure that the internal audit function is adequately resourced and has appropriate standing within the Company for it to carry out an analysis and independent appraisal of the adequacy and effectiveness of the Company’s financial reporting system and risk management and internal control systems, and to review and monitor the effectiveness of the internal audit function;
(e) to review the Group’s financial and accounting policies and practices;
(f) to review the external auditors’ management letter, any material queries raised by the auditors to management about accounting records, financial accounts or systems of control and management’s response;
(g) to ensure that the Board will provide a timely response to the issues raised in the external auditors’ management letter;
(h) to report to the Board on the matters in the Code provision in the Listing Rules;
The Wharf (Holdings) L imited | Annual Report 2015 99
(i) to review arrangements employees of the Company can use, in confidence, to raise concerns about possible improprieties in financial reporting, internal control or other matters. The Audit Committee should ensure that proper arrangements are in place for fair and independent investigation of these matters and for appropriate follow-up action;
(j) to act as the key representative body for overseeing the Company’s relations with the external auditors; and
(k) to consider other topics, as defined by the Board.
(IV) Oversight of the Company’s Corporate Governance Matters
(a) to develop and review the Company’s policies and practices on corporate governance and make recommendations to the Board;
(b) to review and monitor the training and continuous professional development of Directors and Senior Management;
(c) to review and monitor the Company’s policies and practices on compliance with legal and regulatory requirements;
(d) to develop, review and monitor the code of conduct and compliance manual (if any) applicable to employees and Directors; and
(e) to consider other topics, as defined by the Board.
The roles and authorities of the Audit Committee, including those set out in the Code provision of C.3.3 of the Code, are set out in its terms of reference which are available at the Company’s corporate website at www.wharfholdings.com.
There were four Audit Committee meetings held during the financial year ended 31 December 2015. Please refer to the table set out on page 93 for the details of attendance of the Audit Committee members.
The work performed by the Audit Committee for the financial year ended 31 December 2015 is summarised below:
(a) review of the annual audit plan of the external auditors before the audit commenced, and discussion with them about the nature and scope of the audit;
(b) approval of the remuneration and terms of engagement of the external auditors;
(c) review of the external auditors’ independence and objectivity and the effectiveness of audit process in accordance with applicable standards;
(d) review of the half-year and annual financial statements before submission to the Board, with particular consideration of the points mentioned C.3(II)(a) above regarding the duties of the Audit Committee;
(e) review of the audit programme of the internal audit function;
(f) review of the Group’s financial controls, risk management and internal control systems;
(g) meeting with the external auditors without executive Board members present;
(h) review of the whistle-blowing cases and relevant investigation results;
(i) review of the corporate governance matters and the relevant reports of the Group;
(j) review of and monitoring of the Group’s compliance with legal and regulatory requirements; and
(k) review and recommend the Board to approve the Revised AC Terms of Reference.
The Wharf (Holdings) L imited | Annual Report 2015100
CORPORATE GOVERNANCE REPORT
The Audit Committee recommended to the Board that, subject to Shareholders’ approval at the forthcoming Annual General Meeting, KPMG be re-appointed as the Company’s external auditor for 2016.
For the financial year ended 31 December 2015, the external auditors of the Company received approximately HK$23 million for audit services and HK$2 million for tax and other services.
The Company Secretary can arrange independent professional advice at the expense of the Company should the seeking of such advice be considered necessary by the Audit Committee.
Code Ref. Code Provisions
D.
D.1
DELEGATION BY THE BOARD
Management functions
Corporate Governance Principle
The company should have a formal schedule of matters specifically reserved for board approval and those delegated to management.
Compliance Status
Corporate Governance Practices
Comply with Requirement
There is a clear division of responsibilities between the Board and the management. Decisions on important matters are specifically reserved to the Board while decisions on the Group’s general operations are delegated to the management. Important matters include those affecting the Group’s strategic policies, major investment and funding decisions and major commitments relating to the Group’s operations.
Code Ref. Code Provisions
D.2 Board Committees
Corporate Governance Principle
Board committees should be formed with specific written terms of reference which deal clearly with their authority and duties.
Compliance Status
Corporate Governance Practices
Comply with Requirement
Three Board Committees, namely, Audit Committee, Remuneration Committee and Nomination Committee have been established with specific terms of reference as mentioned in C.3, B.1 and A.5 of above.
Board Committees report to the Board of their decisions and recommendations at the Board meetings.
Code Ref. Code Provisions
D.3 Corporate Governance Functions
Compliance Status
Corporate Governance Practices
Comply with Requirement
While the Board is and remains to be principally responsible for the corporate governance functions of the Company, it has delegated the relevant duties to the Audit Committee to ensure the proper performance of corporate governance functions of the Company. In this connection, the terms of reference of the Audit Committee includes various duties relating to corporate governance matters which are set out in paragraph “(IV) Oversight of the Company’s Corporate Governance Matters” on page 99.
The Wharf (Holdings) L imited | Annual Report 2015 101
Code Ref. Code Provisions
E.
E.1
COMMUNICATION WITH SHAREHOLDERS
Effective communication
Corporate Governance Principle
The board should be responsible for maintaining an on-going dialogue with shareholders and in particular, use annual general meetings or other general meetings to communicate with them and encourage their participation.
Compliance Status
Corporate Governance Practices
Comply with Requirement
The Company encourages its Shareholders to attend Annual General Meetings to ensure a high level of accountability and to stay informed of the Group’s strategy and goals.
The Company’s notice to Shareholders for the 2015 Annual General Meeting (“2015 AGM”) of the Company was sent at least 20 clear business days before the meeting.
Separate resolutions are proposed at the general meetings of the Company on each substantially separate issue, including the election of individual Directors.
The 2015 AGM was held on 15 May 2015 in the Centenary Room, Ground Floor, The Marco Polo Hongkong Hotel, 3 Canton Road, Kowloon, Hong Kong. The Directors, including the Chairman of the Company, the Chairmen of the Board Committees attended the 2015 AGM, with exception that Mr Hans Michael Jebsen being the chairman of the Remuneration Committee was absent due to other important engagement but was represented by other two Remuneration Committee members during the meeting. Please refer to the table set out on page 93 for the details of attendance of the Directors in the 2015 AGM. The external auditors of the Company, Messrs KPMG, attended the 2015 AGM, during which its representative read out the report of the auditors and was available to answer questions raised by the shareholders.
The Company recognises the fundamental importance of transparency and accountability. Management believes that Shareholders’ value can best be enhanced by articulating the corporate strategies, business strengths and weaknesses, growth opportunities and threats, and future prospects through a continuous and active dialogue with the investment community, the media and the public. To achieve this, the Company is committed to providing Shareholders and the general public access to key information that is reasonably required to make an investment decision on a fair and timely basis.
The Company is aware of its statutory obligations in relation to the disclosure of inside information which is likely to have a material price effect and has established procedures to ensure that all communications with the public, including the investment community and the media, are fair, and that material non-public information is not disseminated on a selective basis.
The Group uses several formal channels to ensure fair disclosure and comprehensive and transparent reporting of its performance and activities. Annual and interim reports are published/printed and printed copies of such reports or notifications of publication thereof on the Company’s corporate website are sent to all Shareholders. Press releases are posted and available for download at the Company’s corporate website www.wharfholdings.com. In addition, the Company makes full use of the Internet to make information broadly available to Shareholders. The Company’s corporate website provides email address, postal address, fax number and telephone number by which enquiries may be put to the Board. Constantly being updated in a timely manner, the website also contains a wide range of additional information on the Group’s business activities. As a standard part of the investor relations programme to maintain a constant dialogue on the Group’s performance and objectives, senior executives hold regular briefings and attend conferences with institutional investors and financial analysts.
A Shareholders Communication Policy has been adopted by the Company to ensure that Shareholders are provided with ready, equal and timely access to balanced and understandable information about the Company (including its financial performance, strategic goals and plans, material developments, governance and risk profile), in order to enable Shareholders and the investment community to engage actively with the Company.

The Wharf (Holdings) L imited | Annual Report 2015102
CORPORATE GOVERNANCE REPORT
Code Ref. Code Provisions
E.2 Voting by poll
Corporate Governance Principle
The company should ensure that shareholders are familiar with the detailed procedures for conducting a poll.
Compliance Status
Corporate Governance Practices
Comply with Requirement
Shareholders have the opportunity to participate effectively and vote in general meetings and are informed of the rules, including voting procedures, that govern general meetings:
(a) Shareholders are furnished with sufficient and timely information concerning the date, location and agenda of general meetings, as well as full and timely information regarding the issues to be decided at the meetings;
(b) Shareholders have the opportunity to ask questions to the Board, including questions relating to the annual external audit, to place items on the agenda of general meetings, and to propose resolutions, subject to reasonable limitations;
(c) Effective Shareholder participation in key corporate governance decisions;
(d) Shareholders can make their view known on the remuneration policy for Board members and key executives; and
(e) Shareholders can vote in person or by proxy, and equal effect is given to votes whether cast in person or by proxy.
The Company has the following procedures to Shareholders to vote by poll:
(a) All resolutions put to Shareholders in general meetings are voted by a poll demanded by the Chairman at the beginning of the meetings. The circulars and notices of the general meetings express the Chairman’s intention to call for voting by poll.
(b) The Chairman or the Company Secretary explains the procedures for voting by poll to Shareholders and answer any questions from Shareholders before a poll is required to be conducted at the meetings.
(c) The Company ensures votes cast are properly counted and recorded. Independent scrutineers are appointed to count the number of votes cast at general meetings.
(d) Poll results are announced on the same day and also published on the Company’s and the Stock Exchange’s websites not later than the business day following the general meetings.
Code Ref. Code Provisions
F. Company Secretary
Corporate Governance Principle
The company secretary plays an important role in supporting the board by ensuring good information flow within the board and that board policy and procedures are followed. The company secretary is responsible for advising the board through the chairman and/or the chief executive on governance matters and should also facilitate induction and professional development of directors.
Compliance Status
Corporate Governance Practices
Comply with Requirement
The Company Secretary is an experienced employee of the Company and has day-to-day knowledge of the Company’s affairs. All Directors have access to the advice and services of the Company Secretary to ensure that Board procedures, and all applicable law, rules and regulations, are followed.
The Company Secretary has also played the role of coordinator to arrange for Directors’ participation in the training sessions organised by the Company’s auditors.

The Wharf (Holdings) L imited | Annual Report 2015 103
Code Ref. Code Provisions
F.1.3 The company secretary should report to the board chairman and/or the chief executive.
Compliance Status
Corporate Governance Practices
Not Comply with
Requirement
The Company Secretary of the Company had formerly directly reported to the Deputy Chairman of the Company, which was considered appropriate and reasonable given the size of the Group. Following the change of Chairman of the Company with effect from 15 May 2015, the Company Secretary commenced reporting to the Chairman of the Company directly and the Company is now in full compliance of Code Provision F.1.3.
MODEL CODE FOR DIRECTORS’ DEALING IN SECURITIESDuring the financial year ended 31 December 2015, the Company adopted its own set of code of conduct regarding Directors’ securities transactions (the “Company’s Code”) with terms thereof being no less exacting than the required standard set out in the Model Code. The Company has made specific enquiry of all Directors and all Directors have complied with the required standard set out in the Model Code and/or the Company’s Code during the financial year.
SHAREHOLDERS’ RIGHTSI. Convene an Extraordinary General Meeting
Pursuant to Section 566 of the Companies Ordinance (Chapter 622 of the Laws of Hong Kong) (the “CO”), on written requisition by Shareholders representing at least 5% of the total voting rights of all Shareholders having a right to vote at general meetings, the Directors must convene an extraordinary general meeting.
II. Send Enquiries to the Board
The Company’s corporate website (www.wharfholdings.com) provides email address (for enquiry purpose only), postal address, fax number and telephone number by which Shareholders may at any time address their enquiries to the Company’s Board.
III. Make Proposals at General Meetings
(i) The procedures for proposing candidate(s) for election as Director(s) at a Shareholders’ meeting are set out in the Corporate Governance section of the Company’s corporate website.
(ii) The procedures for proposing resolution(s) to be moved at the Company’s annual general meeting(s) are as follows:
Pursuant to Section 615 of the CO, Shareholder(s) can submit a written requisition to move a resolution at the Company’s annual general meeting(s) if they represent:
• at least 2.5% of the total voting rights of all Shareholders who have a right to vote at the annual general meeting to which the requests relate; or
• at least 50 members who have a right to vote on the resolution at the annual general meeting to which the requests relate.
The relevant written requisition must–
(a) identify the resolution of which notice is to be given;
(b) be authenticated by the person or persons making it; and
(c) be received by the Company not later than 6 weeks before the relevant annual general meeting to which the requests relate; or if later, the time at which notice is given of that meeting.
Any written requisitions from Shareholders to the Company pursuant to Sections 566 and 615 of the CO must be deposited at the Company’s registered office (16th Floor, Ocean Centre, Harbour City, Canton Road, Kowloon, Hong Kong).

The Wharf (Holdings) L imited | Annual Report 2015104
CORPORATE GOVERNANCE REPORT
AMENDMENTS TO CONSTITUTIONAL DOCUMENTSThere is no significant change in the Company’s constitutional documents during the financial year ended 31 December 2015.
RISK MANAGEMENT AND INTERNAL CONTROL SYSTEMS(I) Risk Governance Structure
The Board has overall responsibilities for the Group’s risk management and internal control systems to safeguard the interests of the Company and its Shareholders as a whole. To this end, the Board oversees and approves the Group’s risk management and internal control strategies and policies, which are aimed at evaluating and determining the nature and extent of the risks that are compatible with the Group’s strategic objectives and risk appetite, with the main purpose of providing of reasonable assurance against material misstatement or loss rather than absolute elimination of the risk of failure to achieve business objectives.
Reporting to the Board, the Audit Committee is delegated with the authority and responsibility for ongoing monitoring and evaluation of the effectiveness of the relevant systems, with assistance of the Risk Management and Internal Control Committee. In November 2015, the terms of reference of the Audit Committee were updated to formally incorporate risk management into its scope of duties.
In adherence to its long standing principle for prudent management, the Group has put in place a robust and inclusive framework to manage risks at different business operations in diversified segments within the organization.
Risk Management and Internal Control Committee (“RMICC”)
In 2015, RMICC was formally established to replace the former Internal Control Committee as an initiative to further enhance the Group’s risk management and internal control systems. It was principally an evolvement from the pre-existing internal control framework, which has been in operation ever since 2004, comprising the divisional internal control committees of the business units and various control functional departments at corporate level, including, inter alia, Finance Committee, Project Cost Audit Department and Financial Audit Department.
Under the enhanced framework, RMICC plays a central role in the ongoing management of risk management and internal control systems of the Group with the following features:
Objective Assist the Audit Committee in discharge of its oversight responsibility over the risk management and internal control systems of the Group
Composition Chaired by the Vice Chairman and Group Chief Financial Officer
Three other members comprising two Executive Directors and the Company Secretary
Structure Accountable to the Audit Committee on all matters relating to risk management and internal control
Supervision of Divisional Risk Management and Internal Control Committees (“DRMICCs”) which in turn are responsible for the identification and reporting of functional risks, and the ongoing supervision and monitoring of the risk management and internal control systems
Scope and Duties Assist the Audit Committee to conduct periodical reviews of the effectiveness of the risk management and internal control systems of the Group based on the certification procedure as further explained below
Report to the Audit Committee on identified risks, relevant evaluations and risk management strategy
Direct and monitor the proper functioning of DRMICCs and report to the Audit Committee on any major internal control issues from time to time
Assume an advisory role on objective settings, formulation of internal control framework, policies and procedures
Divisional Risk Management Internal Control Committees (“DRMICCs”) are set up at the level of business units with composition of the respective key management staff together with those charged with the internal control functions. Acting as divisional advisory bodies, DRMICCs are entrusted with implementation of the Group’s control policies and on-going assessment of control activities in the relevant business units.

The Wharf (Holdings) L imited | Annual Report 2015 105
(II) Practices & Processes
As a conglomerate with diversified range of business activities, the Group is operating in dynamic environments with varying risk exposures according to different business segments. Risk management and internal controls within the Group are not just serial processes but dynamic and integrated operations embedded in the day-to-day routines with the primary ownership vested on the respective business units under stewardship residing with the Board.
Areas of responsibility of each operational unit are clearly defined with specific limits of authority in place to ensure effective checks and balances. Procedures have been designed for safeguarding assets against unauthorised use or disposition, maintenance of proper accounting records, assurance of the reliability of financial information for internal use or publication and compliance with relevant legislation and regulations. Risk management system, internal control measures and procedures are continuously under review and being improved where necessary in response to changes in business, operating and regulatory environments.
Furthermore, a Whistleblowing Policy and Procedures has been adopted by the Group, with the authority and responsibility being delegated to the Audit Committee. Such Whistleblowing Policy is for employees and those who deal with the Company (e.g. customers and suppliers) to raise concerns, in confidence, with the Company Secretary, and any and all relevant complaints received may then be referred to the Audit Committee and/or the Chairman and Managing Director and/or Group Chief Financial Officer about possible improprieties in any matter related to the Company.
The internal audit function monitors compliance with policies and standards and the effectiveness of internal control structures across the whole Group. Findings regarding internal control matters are reported to the Audit Committee. The external auditors have access to a full set of internal audit reports.
(III) Periodical Reviews
Under the leadership of RMICC, system reviews in a comprehensive approach on the basis of COSO (Committee of Sponsoring Organizations of the Treadway Commission) framework are conducted throughout the Group at least annually. Each business unit, through the co-ordination of DRMICCs, makes a self-assessment by a process as illustrated in the following flow diagram.
Setting of business
objectives>
Identify risk factors
>
Assess likelihood
of each risk factor
>Examine control
activities>
Evaluation and
conclusion
DRMICCs report on their reviews and findings, with the conclusions as to the effectiveness of the risk management and control activities of each individual business unit, while RMICC will draw an overall review and conclusion for reporting to the Audit Committee and the Board. Such reviewing exercise is carried out on regular basis and affords good opportunities for the Group to identify and prioritise risks, and to develop and manage appropriate measures to control risks within acceptable levels and with a greater focus on anti-fraud measures.
(IV) Annual Confirmation
During the financial year ended 31 December 2015, the Audit Committee, with assistance of RMICC and DRMICCs, has conducted a review of the effectiveness of the Group’s risk management and internal control systems and procedures covering all controls, including financial, operational and compliance and risk management, and the adequacy of, inter alia, resources, qualifications, experience and training of staff of the Company’s accounting, internal audit and financial reporting function. Confirmations from management in the form of certification that risk management and internal control procedures are functioning effectively to meet the respective financial reporting, operational and compliance needs, are submitted by business and corporate unit heads to RMICC for consolidation and reporting to the Audit Committee.
Based on the result of the review as reported by the Audit Committee, in respect of the financial year ended 31 December 2015, the Directors considered that the risk management and internal control systems and procedures of the Group were effective and adequate.
A discussion on the principal risks and uncertainties encountered by the Group are set out on pages 120 to 122 in the Directors’ Report.
The Wharf (Holdings) L imited | Annual Report 2015106
DIRECTORS’ REPORT
The Board of Directors has pleasure in submitting their Report and the Audited Financial Statements for the financial year ended 31 December 2015.
PRINCIPAL ACTIVITIESThe principal activity of the Company is investment holding and those of its principal subsidiaries are set out on pages 183 to 186.
RESULTS AND APPROPRIATIONSThe results of the Group for the financial year ended 31 December 2015 are set out in the Consolidated Income Statement and Consolidated Statement of Comprehensive Income on pages 124 to 125.
Appropriations of profits during the financial year are set out in the Consolidated Statement of Change in Equity on page 127.
DIVIDENDSA first interim dividend of HK$0.55 per share was paid on 21 September 2015. In lieu of a final dividend, a second interim dividend of HK$1.35 per share will be paid on 26 April 2016 to Shareholders on record as at 6 April 2016. Total distribution for the year of 2015 will amount to HK$1.90 (2014: HK$1.81) per share.
DONATIONSThe Group made donations during the financial year totalling HK$37 million.
SHARE CAPITALDuring the financial year, 900,000 ordinary shares of the Company were issued at the subscription price of HK$55.15 per share for a total consideration of HK$49,635,000 on the exercise of options previously granted under the Company’s Share Option Scheme (the “Scheme”).
Details of movement in share capital of the Company during the financial year are set out in Note 24 to the Financial Statements on page 164.
EQUITY-LINKED AGREEMENTNo equity-linked agreement which may result in the Company issuing shares was entered into or existed during the financial year, save for the share option scheme of the Company as disclosed on pages 116 to 117 and any outstanding options granted thereunder.
The Wharf (Holdings) L imited | Annual Report 2015 107
BUSINESS REVIEWDiscussion and analysis of the Group’s business in accordance with Schedule 5 of the Companies Ordinance (Chapter 622 of the Laws of Hong Kong) are covered in different sections of this Annual Report as set out below, which shall form an integral part of this Directors’ Report:
– Corporate Profile (page 1 and 2)– Chairman’s Statement (pages 7 to 11)– Business Review (pages 14 to 67)– Financial Highlights (pages 12 to 13) and Financial Review (pages 80 to 85)– Principal Risks and Uncertainties (pages 120 to 122)– Events after the reporting period – Note 31 to the consolidated financial statements (page 169)
In addition, a Corporate Social Responsibility Report, which gives detailed account of the Group’s performance in environmental, social and governance areas, is available for download on the Company’s corporate website (www.wharfholdings.com).
DIRECTORSThe Directors of the Company during the financial year and up to the date of this report are Hon Peter K C Woo (retired on 15 May 2015), Mr Stephen T H Ng, Mr Andrew O K Chow, Ms Doreen Y F Lee, Mr Paul Y C Tsui, Ms Y T Leng, Mr K P Chan (appointed on 15 May 2015), Mr Alexander S K Au, Professor Edward K Y Chen, Dr Raymond K F Ch’ien (resigned effective from 1 January 2016), Hon Vincent K Fang, Mr Hans Michael Jebsen, Mr Wyman Li (resigned effective from 2 September 2015), Mr David M Turnbull and Professor E K Yeoh.
Mr K P Chan (appointed as Director after 2015 AGM) is due to retire from the Board in accordance with Article 97 of the Company’s Articles of Association and Messrs. Alexander S K Au, Edward K Y Chen, Hans Michael Jebsen and Ms Y T Leng will retire from the Board in accordance with Article 106(A) of the Company’s Articles of Association, at the forthcoming Annual General Meeting (“AGM”). The retiring Directors, being eligible, offer themselves for re-election. None of the retiring Directors proposed for re-election at the AGM has a service contract with the Company which is not determinable by the employer within one year without payment of compensation (other than statutory compensation).
A list of persons who have served as directors of the Company’s subsidiaries during the financial year and up to the date of this report is set out in the sub-section headed “(L) Directors of Subsidiaries” on page 122.
INTERESTS IN TRANSACTIONS, ARRANGEMENTS OR CONTRACTSSave as disclosed in the sub-section headed “(J) Disclosure of Connected Transactions” on pages 119 to 120, no transaction, arrangement or contract of significance in relation to the Company’s business to which any subsidiaries of the Company, the ultimate holding company of the Company or any subsidiary of such ultimate holding company was a party and in which a Director or any connected entities of a Director had a material interest, whether directly or indirectly, subsisted at the end of the financial year or at any time during that financial year.

The Wharf (Holdings) L imited | Annual Report 2015108
DIRECTORS’ REPORT
MANAGEMENT CONTRACTSNo contract for the management and administration of the whole or any substantial part of any business of the Company were entered into or existed during the financial year.
ARRANGEMENTS TO PURCHASE SHARES OR DEBENTURESAt no time during the financial year was the Company, its subsidiaries or its ultimate holding company or any subsidiary of such ultimate holding company a party to any arrangement to enable the Directors to acquire benefits by means of acquisition of shares in or debentures of the Company or any other body corporate, with the exception that during the year, there existed certain outstanding options to subscribe for ordinary shares of the Company and of Wheelock and Company Limited (“Wheelock”) granted under the Scheme and Wheelock’s share option scheme respectively to certain employees/directors of companies in the Group, some of whom were Directors during the financial year.
Under the respective rules of the two schemes (such rules being subject to the relevant laws and rules applicable from time to time), shares of the Company and/or Wheelock would be issued at such respective prices as being not less than the highest of (a) the indicative price as specified in the written offer; (b) the closing price on the Stock Exchange on the date of grant of the options; and (c) the average closing price on the Stock Exchange for the five trading days immediately preceding the date of grant; and the relevant options would be exercisable during such periods, not being beyond the expiration of 10 years from the date of grant of relevant options, as determined by the boards of directors of the Company and/or Wheelock respectively.
During the financial year, no shares of the Company and/or Wheelock were allotted and issued under the Scheme and/or Wheelock’s share option scheme to any person who was a Director during the financial year.
PERMITTED INDEMNITY PROVISIONPursuant to the Company’s Articles of Association, every Director is entitled to be indemnified out of the assets of the Company against all costs, expenses, losses or liabilities, which he or she may sustain or incur in or about the execution and discharge of the duties of his/her office, to the extent as permitted by laws.
The Company has, together with its holding company (Wheelock) and two listed subsidiaries (Harbour Centre Development Limited and i-CABLE Communications Limited), maintained directors’ liability insurance which has been in force throughout the financial year and up to the date of this report to provide appropriate insurance cover for directors of their respective group companies, including inter alia the Directors.
PURCHASE, SALE OR REDEMPTION OF SHARESNeither the Company nor any of its subsidiaries has purchased, sold or redeemed any of its listed securities during the financial year.
AUDITORSThe Financial Statements now presented have been audited by KPMG, Certified Public Accountants, who retire and being eligible, offer themselves for re-appointment.
OTHER CORPORATE INFORMATIONOther corporate information supplementary to this Directors’ Report are set out on pages 109 to 122.
By Order of the BoardKevin C Y HuiCompany Secretary
Hong Kong, 9 March 2016

The Wharf (Holdings) L imited | Annual Report 2015 109
OTHER CORPORATE INFORMATION(A) Biographical Details of Directors and Senior Managers
(i) Directors
Mr Stephen Tin Hoi Ng, Chairman & Managing Director (Age: 63)Mr Ng joined the Company in 1981. He has been Managing Director of the Company since 1989 and became Chairman in 2015. He also serves as a member and the chairman of the Company’s Nomination Committee and as a member of the Company’s Remuneration Committee.
Among other listed companies in Hong Kong and Singapore, he is deputy chairman of Wheelock and Company Limited (“Wheelock”), holding company of the Company, chairman of Harbour Centre Development Limited (“HCDL”), i-CABLE Communications Limited (“i-CABLE“), Joyce Boutique Holdings Limited (“JBHL”) and Wheelock Properties (Singapore) Limited (“WPSL”), as well as a non-executive director of Hotel Properties Limited (a publicly listed associate of Wheelock). He formerly served as a non-executive director of Greentown China Holdings Limited (“Greentown”) (a company publicly listed in Hong Kong) until his resignation effective in March 2015.
Mr Ng was born in Hong Kong in 1952 and grew up in Hong Kong. He attended Ripon College in Ripon, Wisconsin, U.S.A. and the University of Bonn, Germany, from 1971 to 1975, and graduated with a major in mathematics. He is deputy chairman of the Hong Kong General Chamber of Commerce and a council member of the Employers’ Federation of Hong Kong.
Under the existing service contract between the Group and Mr Ng, his basic salary and various allowances for the year 2016, calculated on an annualised basis, would be approximately HK$7.82 million (2015: HK$7.24 million) per annum.
Mr Andrew On Kiu Chow, Deputy Chairman (Age: 65)Mr Chow has been a Director of the Company since July 2011 and become Deputy Chairman in May 2015. As chairman of Wharf China Development Limited, he oversees the Group’s development property business in Mainland China. He joined the Group in 2006.
Mr Chow has extensive experience in the finance and property sectors in Hong Kong and Mainland China, and formerly held senior executive positions in Tian An China Investment Limited and Next Media Limited. He is a graduate of The University of Hong Kong where he obtained his bachelor’s degree in Social Science. He is also an independent non-executive director of Hong Kong Economic Times Holdings Limited, publicly listed in Hong Kong. He was formerly a non-executive director and vice chairman of Greentown from March 2015 to July 2015.
Under the existing service contract between the Group and Mr Chow, his basic salary and various allowances for the year 2016, calculated on an annualised basis, would be approximately HK$5.66 million (2015: HK$5.44 million) per annum.
Ms Doreen Yuk Fong Lee, Vice Chairman (Age: 59)Ms Lee has been a Director of the Company since 2003 and became a Vice Chairman in May 2015. As chairman of Wharf Estates Limited and Wharf China Estates Limited, she oversees the Group’s portfolio of investment properties in Hong Kong and Mainland China.
Ms Lee was formerly a director of HCDL (a publicly listed subsidiary of the Company) from July 2010 to July 2012. She is a graduate of The University of Hong Kong where she obtained her bachelor’s degree in Arts (Hon). She is also a director of JBHL, publicly listed in Hong Kong.
Under the existing service contract between the Group and Ms Lee, her basic salary and various allowances for the year 2016, calculated on an annualised basis, would be approximately HK$5.96 million (2015: HK$5.6 million) per annum.
Mr Paul Yiu Cheung Tsui, Vice Chairman & Group Chief Financial Officer (Age: 69)Mr Tsui, FCCA, FCPA, FCMA, CGMA, FCIS, CGA-Canada, is a Vice Chairman & Group Chief Financial Officer of the Company and is also an executive director & group chief financial officer of Wheelock, holding company of the Company. He joined the and Wheelock/Wharf group in 1996 and became a director of Wheelock in 1998. He is also a director of i-CABLE and JBHL, both publicly-listed in Hong Kong as well as a vice chairman of Wheelock Properties Limited. He formerly served as a director of HCDL and WPSL until his resignations in August 2015; and also a director of Greentown until his resignation in July 2015.
Under the existing service contract between the Group and Mr Tsui, his basic salary and various allowances for the year 2016, exclusive of the amounts which would be borne by Wheelock and/or its wholly-owned subsidiary(ies) and calculated on an annualised basis, would be approximately HK$4.08 million (2015: HK$3.83 million) per annum.

The Wharf (Holdings) L imited | Annual Report 2015110
DIRECTORS’ REPORT
Ms Yen Thean Leng, Director (Age: 44)Ms Leng, BSc(Hons), MRICS, MHKIS, RPS, has been a Director of the Company since 11 April 2013. She joined the Group in 2004. Being an executive director of Wharf Estates Limited, Ms Leng is responsible, inter alia, for managing the Group’s core investment properties in Hong Kong, namely, Harbour City, Times Square and Plaza Hollywood. She was formerly a director of HCDL from 1 July 2012 to 10 April 2013. Ms Leng is a chartered surveyor and holds a Bachelor Degree in Land Management with first class honors and has extensive experience in the real estate industry.
Under the existing service contract between the Group and Ms Leng, her basic salary and various allowances for the year 2016, calculated on an annualised basis, would be approximately HK$3.88 million (2015: HK$3.7 million) per annum.
Mr Kwok Pong Chan, Director (Age: 55)Mr Chan joined the Group in 1993 and has been a Director of the Company since May 2015. He has been involved in various property development projects of the Group in both China and Hong Kong. He is an executive director of Wharf China Development Limited and Wharf China Estates Limited, both wholly-owned subsidiaries of the Company. He is now working on the Group’s China Development Property strategy as well as to oversee the Group’s massive China Investment Property construction projects. He was formerly a director of HCDL, a publicly listed subsidiary of the Company, from April 2013 to May 2015.
Mr Chan graduated from the Polytechnic University of Hong Kong with Associateship in Civil & Structural Engineering. He is a member of the Hong Kong Institution of Engineers as well as the Institution of Civil Engineers, UK and also a chartered engineer of the Engineering Council UK.
Under the existing service contract between the Group and Mr Chan, his basic salary and various allowances for the year 2016, calculated on an annualised basis, would be approximately HK$3.39 million (2015: HK$3.2 million) per annum.
Mr Alexander Siu Kee Au, OBE, Director (Age: 69)Mr Au, ACA, FCCA, FCPA, AAIA, FCIB, FHKIB, has been an Independent Non-executive Director of the Company since 22 October 2012. He also serves as a member of the Company’s Audit Committee. A banker by profession, he was the chief executive officer of Hang Seng Bank Limited from October 1993 to March 1998 and of Oversea-Chinese Banking Corporation Limited in Singapore from September 1998 to April 2002.
Currently, Mr Au is the chairman and non-executive director of Henderson Sunlight Asset Management Limited, being the manager of the publicly-listed Sunlight Real Estate Investment Trust. He is an independent non-executive director of publicly-listed Henderson Investment Limited, and also a non-executive director of two other companies publicly-listed in Hong Kong, namely, Hong Kong Ferry (Holdings) Company Limited and Miramar Hotel and Investment Company, Limited. Mr Au was formerly an independent non-executive director of Wheelock, which is the Company’s holding company, from September 2002 to October 2012 and of Henderson Land Development Company Limited from December 2012 to June 2015, both publicly listed in Hong Kong. An accountant by training, Mr Au is a Chartered Accountant as well as a fellow of The Association of Chartered Certified Accountants and the Hong Kong Institute of Certified Public Accountants.
Professor Edward Kwan Yiu Chen, GBS, CBE, JP, Director (Age: 71)Professor Chen has been an Independent Non-executive Director of the Company since 2002. He was the president of Lingnan University in Hong Kong from September 1995 to August 2007. He is an honorary professor of the Open University of Hong Kong and a distinguished fellow of the Hong Kong Institute for the Humanities and Social Sciences at The University of Hong Kong. He is now Chairman of HKU SPACE and President of the Qianhai Institute for Innovative Research in Shenzhen. He was a member of the Legislative Council of Hong Kong from 1991 to 1992, and a member of the Executive Council of Hong Kong from 1992 to 1997. He is a director of a publicly-listed company in Hong Kong, namely, First Pacific Company Limited. He was formerly a director of publicly listed Asia Satellite Telecommunications Holdings Limited.
Professor Chen was educated at The University of Hong Kong (Bachelor of Arts and Master of Social Science) and Oxford University (Doctor of Philosophy). He was appointed a Justice of the Peace in 1993 and awarded a CBE in 1995. In 2003, he was awarded the Gold Bauhinia Star Medal by the Hong Kong SAR Government.

The Wharf (Holdings) L imited | Annual Report 2015 111
Hon Vincent Kang Fang, SBS, JP, Director (Age: 72)Mr Fang has been an Independent Non-executive Director of the Company since 1993. He also serves as the chairman and a member of the Company’s Audit Committee. He is the chief executive officer of Toppy Company (Hong Kong) Limited and managing director of Fantastic Garments Limited.
Mr Fang currently serves as a member of Legislative Council representing Wholesale and Retail in Functional Constituency. He is the advisor of the Quality Tourism Services Association, a functional constituency representative for retail and wholesale of Hong Kong Retail Management Association and a director of The Federation of Hong Kong Garment Manufacturers. Mr Fang formerly served as the chairman of Hospital Governing Committee of Princess Margaret Hospital and Kwai Chung Hospital, and a member of the Hospital Authority, Hong Kong Tourism Board, the Operations Review Committee of the Independent Commission Against Corruption and the Airport Authority of Hong Kong.
Mr Fang is a graduate of North Carolina State University where he obtained both his bachelor’s and master’s degrees in Science of Textiles Engineering. Mr Fang was awarded the Silver Bauhinia Star by the Hong Kong SAR Government in 2008. He is also a Justice of the Peace.
Mr Hans Michael Jebsen, BBS, Director (Age: 59)Mr Jebsen has been an Independent Non-executive Director of the Company since 2001. He also serves as a member of the Company’s Audit Committee, Nomination Committee and Remuneration Committee. He is the chairman of Jebsen and Company Limited and also a non-executive director of publicly-listed Hysan Development Company Limited. He currently holds a number of public offices, namely, a trustee of World Wide Fund for Nature Hong Kong, the vice chairman and a board member of the Asian Cultural Council Board of Trustees, affiliate of the Rockefeller Brothers Fund, New York; a member of the Advisory Council of the Business School of The Hong Kong University of Science and Technology and a member of Hong Kong-Europe Business Council of the Hong Kong Trade Development Council, Advisory Council as well as Board of Trustees of Asia Society Hong Kong Center and Advisory Board of the Hong Kong Red Cross.
After schooling in Germany and Denmark, he received a two-year banking education in Germany and the UK and studied Business Administration at the University of St. Gallen in Switzerland from 1978 to 1981.
Mr Jebsen was awarded the Bronze Bauhinia Star by the Hong Kong SAR Government in 2001, made a Knight of the Dannebrog by receiving the Silver Cross of the Order of Dannebrog by H. M. The Queen of Denmark in 2006, was awarded the Merit Cross of the Order of the Merit of the Federal Republic of Germany in 2008 and received the title “Hofjægermester” by H. M. The Queen of Denmark in January 2011. In 2014, Mr Jebsen was awarded the Knight of 1st Class of the Order of Dannebrog, Denmark. Since 2015, he has also been a member of the Operations Review Committee of the Independent Commission Against Corruption. In 2015, Mr Jebsen was also awarded Doctor of Business Administration honoris causa of The Hong Kong University of Science & Technology.
Mr David Muir Turnbull, Director (Age: 60)Mr Turnbull has been an Independent Non-executive Director (“INED”) of the Company since 18 November 2013. He also serves as a member of the Company’s Nomination Committee and Remuneration Committee. Mr Turnbull graduated from Cambridge University in 1976 with a Bachelor of Arts degree in Economics and subsequently earned a Master of Arts degree. He joined the Swire Group upon graduation and held various senior management positions with international responsibilities covering aviation, shipping and property during his 30 years’ service thereof. He was appointed as a director of Cathay Pacific Airways Limited in 1994 and took up the positions of deputy managing director in 1994, managing director in 1996 and deputy chairman and chief executive in 1998 before his appointment as the chairman in 2005. He is also the former chairman of Swire Pacific Limited from January 2005 to January 2006, and of Hong Kong Aircraft Engineering Company Limited from March 1995 to August 2006. He was formerly an INED of Sands China Ltd. from October 2009 to March 2016.
Mr Turnbull is currently the executive chairman of Pacific Basin Shipping Limited, being publicly-listed in Hong Kong. Mr Turnbull also serves as non-executive director of Green Dragon Gas Limited and Greka Drilling Limited, both being companies publicly-listed on London Stock Exchange and Alternative Investment Market, a sub-market of the London Stock Exchange respectively.
The Wharf (Holdings) L imited | Annual Report 2015112
DIRECTORS’ REPORT
Professor Eng Kiong Yeoh, GBS, OBE, JP, Director (Age: 69)Professor Yeoh, MBBS(HK), FHKAM, FHKCCM, FHKCP, FFPHM(UK), FRCP(Edin), FRCP(Lond), FRCP(Glasg), FRACMA, FRACP, is Professor of Public Health, Director at the JC School of Public Health and Primary Care of The Chinese University of Hong Kong (CUHK) and also Head of Division of Health System, Policy and Management at the JC School of Public Health and Primary Care. His research is in health systems, services and policy with an interest in applying systems thinking in studying how the complex components of health systems interact and interrelate to improve health. He is involved in collaborative work with research networks such as the Association of Pacific Rim Universities World Institute and World Bank Institute Asia Network for Capacity Building in Health Systems Strengthening (ANHSS) in studies on health systems and training for policy. He was Chairman of the ANHSS from July 2009 – June 2014, and serves as Cluster Leader for the Knowledge Events. He is also a member of the International Advisory Board of the National University of Singapore Initiative to improve health in Asia, which seeks to contribute to thinking and policy formulation in public health & health systems development in Asia.
Professor Yeoh served as Secretary for Health, Welfare and Food of the Government of the Hong Kong Special Administrative Region (“HK Government”) between 1999 and 2004. From 1990 to 1999, he was Head of the Hong Kong Hospital Authority with responsibility for the management and transformation of the public hospital system.
As a clinician, Professor Yeoh pioneered public health programmes in the prevention of Hepatitis B and HIV/AIDS. He has held many key positions in professional bodies, both locally and internationally. Professor Yeoh was appointed a Justice of the Peace in 1993 and awarded an Order of the British Empire in 1997. In 2005, he was awarded the Gold Bauhinia Star Medal by HK Government in recognition of his public service.
Notes:
(1) Wheelock (of which Mr Stephen T H Ng and Mr Paul Y C Tsui are directors) has interests in the share capital of the Company discloseable to the Company under the provisions of Divisions 2 and 3 of Part XV of the Securities and Futures Ordinance (the “SFO”).
(2) All of Mr Stephen T H Ng, Mr Andrew O K Chow, Ms Doreen Y F Lee, Mr Paul Y C Tsui, Ms Y T Leng and Mr K P Chan are currently directors of certain subsidiaries of the Company.
(3) The Company confirms that it has received written confirmation from each of the INEDs confirming their independence pursuant to Rule 3.13 of the Rules Governing the Listing of Securities on the Stock Exchange (the “Listing Rules”) and considers them independent.
(ii) Senior Management
Various businesses of the Group are respectively under the direct responsibility of the first six Directors named under (A)(i) above, led by the Chairman and Managing Director. Only those six Directors are regarded as members of the Group’s senior management.
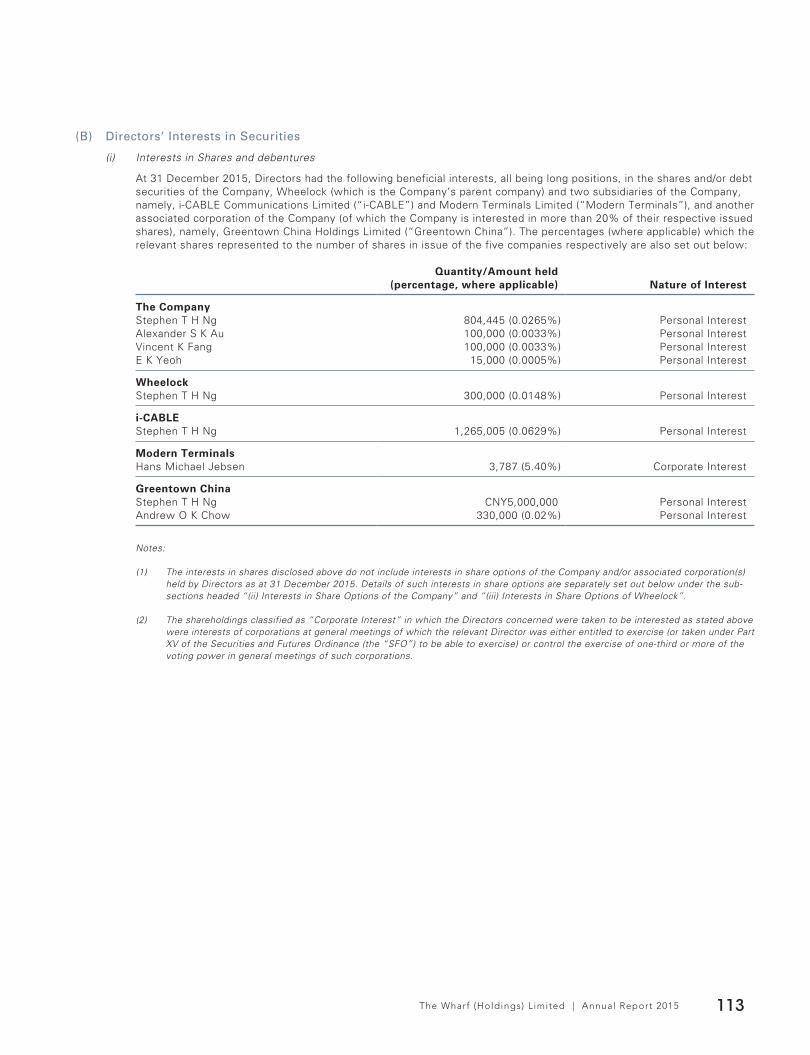
The Wharf (Holdings) L imited | Annual Report 2015 113
(B) Directors’ Interests in Securities
(i) Interests in Shares and debentures
At 31 December 2015, Directors had the following beneficial interests, all being long positions, in the shares and/or debt securities of the Company, Wheelock (which is the Company’s parent company) and two subsidiaries of the Company, namely, i-CABLE Communications Limited (“i-CABLE”) and Modern Terminals Limited (“Modern Terminals”), and another associated corporation of the Company (of which the Company is interested in more than 20% of their respective issued shares), namely, Greentown China Holdings Limited (“Greentown China”). The percentages (where applicable) which the relevant shares represented to the number of shares in issue of the five companies respectively are also set out below:
Quantity/Amount held(percentage, where applicable) Nature of Interest
The CompanyStephen T H Ng 804,445 (0.0265%) Personal InterestAlexander S K Au 100,000 (0.0033%) Personal InterestVincent K Fang 100,000 (0.0033%) Personal InterestE K Yeoh 15,000 (0.0005%) Personal Interest
WheelockStephen T H Ng 300,000 (0.0148%) Personal Interest
i-CABLEStephen T H Ng 1,265,005 (0.0629%) Personal Interest
Modern TerminalsHans Michael Jebsen 3,787 (5.40%) Corporate Interest
Greentown ChinaStephen T H Ng CNY5,000,000 Personal InterestAndrew O K Chow 330,000 (0.02%) Personal Interest
Notes:
(1) The interests in shares disclosed above do not include interests in share options of the Company and/or associated corporation(s) held by Directors as at 31 December 2015. Details of such interests in share options are separately set out below under the sub-sections headed “(ii) Interests in Share Options of the Company” and “(iii) Interests in Share Options of Wheelock”.
(2) The shareholdings classified as “Corporate Interest” in which the Directors concerned were taken to be interested as stated above were interests of corporations at general meetings of which the relevant Director was either entitled to exercise (or taken under Part XV of the Securities and Futures Ordinance (the “SFO”) to be able to exercise) or control the exercise of one-third or more of the voting power in general meetings of such corporations.

The Wharf (Holdings) L imited | Annual Report 2015114
DIRECTORS’ REPORT
(ii) Interests in Share Options of the Company
Set out below are particulars of interests (all being personal interests) in options held during the financial year ended 31 December 2015 by present Directors of the Company to subscribe for ordinary shares of the Company granted/exercisable under the Share Option Scheme of the Company:
No. of Shares under Option
Name of Director
Total no. as at 31 December 2015 (percentage based
on no. of shares in issue)
Date of grant (Day/Month/Year)
As at 1 January
2015
As at 31 December
2015
Subscription Price per
Share (HK$)
Vesting/Exercise Period
(Day/Month/Year)
Stephen T H Ng 3,500,000 (0.12%) 04/07/2011 1,500,000 1,500,000 55.15 05/07/2011 – 04/07/2016(1)
05/06/2013 2,000,000 2,000,000 70.20 06/06/2013 – 05/06/2018(2)
Andrew O K Chow 3,500,000 (0.12%) 04/07/2011 1,500,000 1,500,000 55.15 05/07/2011 – 04/07/2016(1)
05/06/2013 2,000,000 2,000,000 70.20 06/06/2013 – 05/06/2018(2)
Doreen Y F Lee 3,320,000 (0.11%) 04/07/2011 1,320,000 1,320,000 55.15 05/07/2011 – 04/07/2016(1)
05/06/2013 2,000,000 2,000,000 70.20 06/06/2013 – 05/06/2018(2)
Paul Y C Tsui 2,200,000 (0.07%) 04/07/2011 1,200,000 1,200,000 55.15 05/07/2012 – 04/07/2016(1)
05/06/2013 1,000,000 1,000,000 70.20 06/06/2013 – 05/06/2018(2)
Y T Leng 1,250,000 (0.04%) 04/07/2011 500,000 500,000 55.15 05/07/2011 – 04/07/2016(1)
05/06/2013 750,000 750,000 70.20 06/06/2013 – 05/06/2018(2)
K P Chan 1,250,000 (0.04%) 04/07/2011 500,000 500,000 55.15 05/07/2011 – 04/07/2016(1)
05/06/2013 750,000 750,000 70.20 06/06/2013 – 05/06/2018(2)
Notes:
(1) The options granted by the Company on 4 July 2011, being outstanding as at both 1 January 2015 and 31 December 2015, were/are vested in five tranches within a period of 5 years, with each tranche covering one-fifth of the relevant options, i.e. exercisable to the extent of one-fifth of the relevant total number of shares and with the 1st, 2nd, 3rd, 4th and 5th tranche being exercisable from 5th of July in the years 2011, 2012, 2013, 2014 and 2015 respectively, with the exception that:
(i) the relevant options held by Mr Paul Y C Tsui as at 31 December 2015 were/are vested in four tranches, with each tranche covering options for 300,000 Shares being exercisable from 5th of July in the years 2012, 2013, 2014 and 2015 respectively; and
(ii) the relevant options held by Ms Doreen Y F Lee as at 31 December 2015 were/are vested in five tranches, with the 1st tranche covering options for 120,000 Shares being exercisable from 5 July 2011, and the remaining four tranches each covering options for 300,000 Shares being exercisable from 5th July in the years 2012, 2013, 2014 and 2015 respectively.
(2) The options granted by the Company on 5 June 2013, being outstanding as at 1 January 2015 and 31 December 2015, were/will be vested in five tranches within a period of 5 years, with each tranche covering one-fifth of the relevant options, i.e. exercisable to the extent of one-fifth of the relevant total number of shares and with the 1st, 2nd, 3rd, 4th and 5th tranche becoming exercisable from 6th of June in the years 2013, 2014, 2015, 2016 and 2017 respectively.
(3) Except as disclosed above, no option of the Company held by Directors (and/or their associate(s)) lapsed or was exercised or cancelled during the financial year, and no option of the Company was granted to any Director and/or their associate(s) during the financial year.
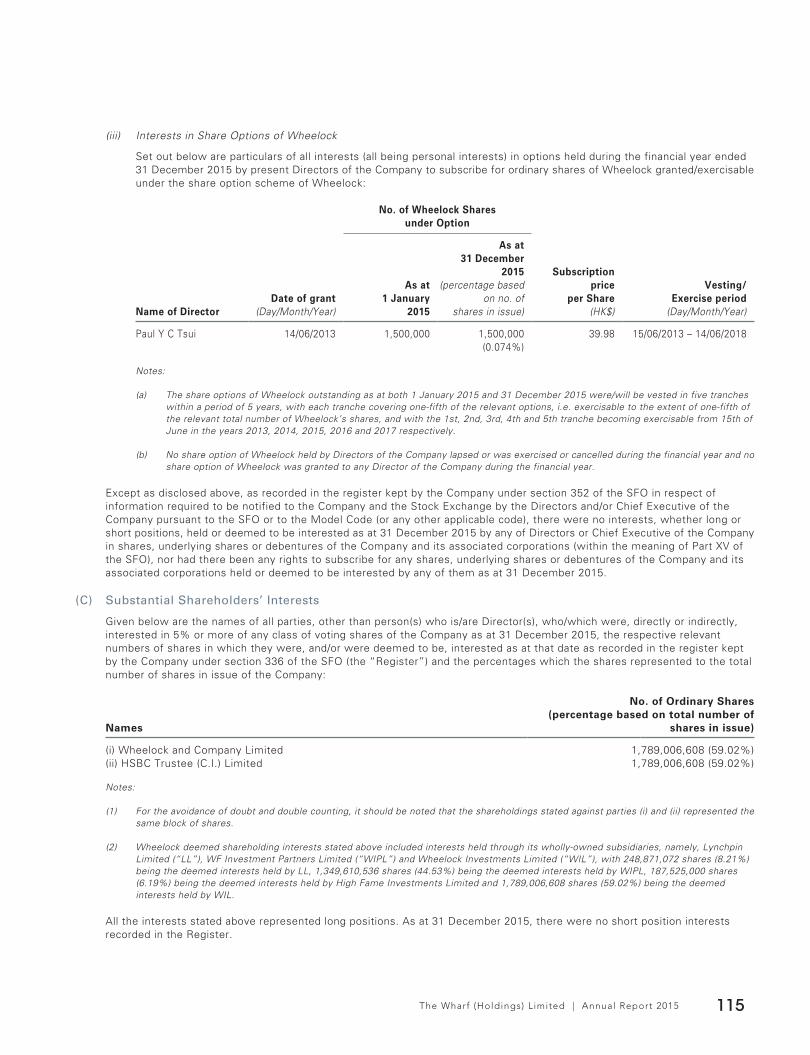
The Wharf (Holdings) L imited | Annual Report 2015 115
(iii) Interests in Share Options of Wheelock
Set out below are particulars of all interests (all being personal interests) in options held during the financial year ended 31 December 2015 by present Directors of the Company to subscribe for ordinary shares of Wheelock granted/exercisable under the share option scheme of Wheelock:
No. of Wheelock Shares under Option
Name of DirectorDate of grant
(Day/Month/Year)
As at 1 January
2015
As at 31 December
2015 (percentage based
on no. of shares in issue)
Subscription price
per Share (HK$)
Vesting/Exercise period
(Day/Month/Year)
Paul Y C Tsui 14/06/2013 1,500,000 1,500,000 (0.074%)
39.98 15/06/2013 – 14/06/2018
Notes:
(a) The share options of Wheelock outstanding as at both 1 January 2015 and 31 December 2015 were/will be vested in five tranches within a period of 5 years, with each tranche covering one-fifth of the relevant options, i.e. exercisable to the extent of one-fifth of the relevant total number of Wheelock’s shares, and with the 1st, 2nd, 3rd, 4th and 5th tranche becoming exercisable from 15th of June in the years 2013, 2014, 2015, 2016 and 2017 respectively.
(b) No share option of Wheelock held by Directors of the Company lapsed or was exercised or cancelled during the financial year and no share option of Wheelock was granted to any Director of the Company during the financial year.
Except as disclosed above, as recorded in the register kept by the Company under section 352 of the SFO in respect of information required to be notified to the Company and the Stock Exchange by the Directors and/or Chief Executive of the Company pursuant to the SFO or to the Model Code (or any other applicable code), there were no interests, whether long or short positions, held or deemed to be interested as at 31 December 2015 by any of Directors or Chief Executive of the Company in shares, underlying shares or debentures of the Company and its associated corporations (within the meaning of Part XV of the SFO), nor had there been any rights to subscribe for any shares, underlying shares or debentures of the Company and its associated corporations held or deemed to be interested by any of them as at 31 December 2015.
(C) Substantial Shareholders’ Interests
Given below are the names of all parties, other than person(s) who is/are Director(s), who/which were, directly or indirectly, interested in 5% or more of any class of voting shares of the Company as at 31 December 2015, the respective relevant numbers of shares in which they were, and/or were deemed to be, interested as at that date as recorded in the register kept by the Company under section 336 of the SFO (the “Register”) and the percentages which the shares represented to the total number of shares in issue of the Company:
Names
No. of Ordinary Shares (percentage based on total number of
shares in issue)
(i) Wheelock and Company Limited 1,789,006,608 (59.02%)(ii) HSBC Trustee (C.I.) Limited 1,789,006,608 (59.02%)
Notes:
(1) For the avoidance of doubt and double counting, it should be noted that the shareholdings stated against parties (i) and (ii) represented the same block of shares.
(2) Wheelock deemed shareholding interests stated above included interests held through its wholly-owned subsidiaries, namely, Lynchpin Limited (“LL”), WF Investment Partners Limited (“WIPL”) and Wheelock Investments Limited (“WIL”), with 248,871,072 shares (8.21%) being the deemed interests held by LL, 1,349,610,536 shares (44.53%) being the deemed interests held by WIPL, 187,525,000 shares (6.19%) being the deemed interests held by High Fame Investments Limited and 1,789,006,608 shares (59.02%) being the deemed interests held by WIL.
All the interests stated above represented long positions. As at 31 December 2015, there were no short position interests recorded in the Register.

The Wharf (Holdings) L imited | Annual Report 2015116
DIRECTORS’ REPORT
(D) Share Option Scheme
(I) Summary of the Share Option Scheme (the “Scheme”)
(a) Purpose of the Scheme:To provide directors and/or employees with the opportunity of acquiring an equity interest in the Company, to continue to provide them with the motivation and incentive to give their best contribution towards the Group’s continued growth and success.
(b) Eligibility:Eligible participants include any person(s) who is/are full-time and/or part-time employee(s) and/or director(s) of the Company, any of its subsidiary(ies), and/or any of its associate(s). “Associates” include jointly-controlled entities and subsidiary(ies) of associates and of jointly-controlled entity(ies).
(c) (i) Total number of ordinary shares in the capital of the Company (the “Shares”) available for issue under the Scheme as at the date of this annual report:281,024,732
(ii) Percentage of the issued share capital that it represents as at the date of this annual report:9.27%
(d) Maximum entitlement of each eligible participant under the Scheme:Not to exceed 1% of the Shares in issue in any 12-month period unless approved by Shareholders of the Company
(e) Period within which the Shares must be taken up under an option:Within 10 years from the date on which the option is offered or such shorter period as the Directors may determine
(f) Minimum period for which an option must be held before it can be exercised:No minimum period unless otherwise determined by the Board
(g) (i) Price payable on application or acceptance of the option:HK$10.00
(ii) The period within which payments or calls must or may be made:28 days after the offer date of an option or such shorter period as the Directors may determine
(iii) The period within which loans for the purposes of the payments or calls must be repaid:Not applicable
(h) Basis of determining the subscription price:The subscription price shall be determined by the Directors at the time of offer but shall not be less than whichever is the highest of:
(i) the indicative price per share for subscription of Shares under the option as specified in the written offer containing the offer of the grant of the option to an eligible participant;
(ii) the closing price of the Shares as stated in the Stock Exchange’s daily quotation sheet on the date of grant of an option, which must be a Stock Exchange trading day;
(iii) the average closing price of the Shares as stated in the Stock Exchange’s daily quotation sheets for the five Stock Exchange trading days immediately preceding the date of grant of an option; and
(iv) the nominal value of a Share (not applicable due to the abolition of par value upon implementation of the new Companies Ordinance, Cap 622 of the Laws of Hong Kong on 3 March 2014).
(i) The remaining life of the Scheme:Approximately 5 years (expiring on 8 June 2021)
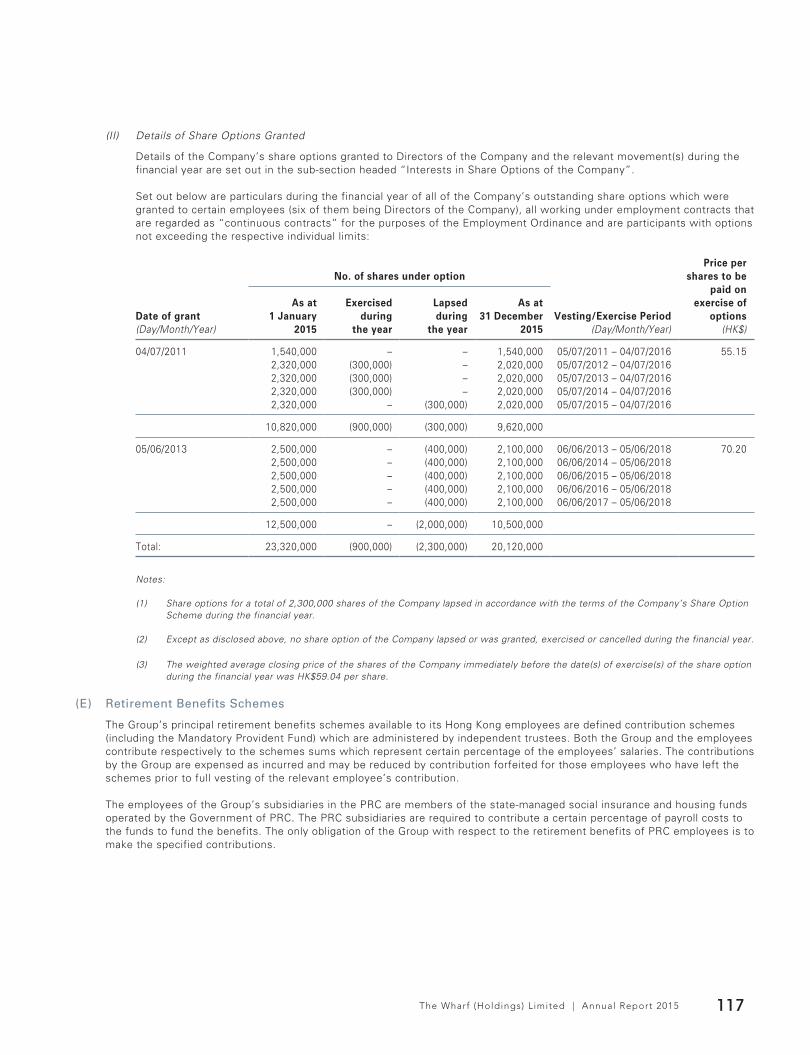
The Wharf (Holdings) L imited | Annual Report 2015 117
(II) Details of Share Options Granted
Details of the Company’s share options granted to Directors of the Company and the relevant movement(s) during the financial year are set out in the sub-section headed “Interests in Share Options of the Company”.
Set out below are particulars during the financial year of all of the Company’s outstanding share options which were granted to certain employees (six of them being Directors of the Company), all working under employment contracts that are regarded as “continuous contracts” for the purposes of the Employment Ordinance and are participants with options not exceeding the respective individual limits:
Date of grant (Day/Month/Year)
No. of shares under option
Vesting/Exercise Period(Day/Month/Year)
Price per shares to be
paid on exercise of
options (HK$)
As at 1 January
2015
Exercised during
the year
Lapsed during
the year
As at 31 December
2015
04/07/2011 1,540,000 – – 1,540,000 05/07/2011 – 04/07/2016 55.152,320,000 (300,000) – 2,020,000 05/07/2012 – 04/07/20162,320,000 (300,000) – 2,020,000 05/07/2013 – 04/07/20162,320,000 (300,000) – 2,020,000 05/07/2014 – 04/07/20162,320,000 – (300,000) 2,020,000 05/07/2015 – 04/07/2016
10,820,000 (900,000) (300,000) 9,620,000
05/06/2013 2,500,000 – (400,000) 2,100,000 06/06/2013 – 05/06/2018 70.202,500,000 – (400,000) 2,100,000 06/06/2014 – 05/06/20182,500,000 – (400,000) 2,100,000 06/06/2015 – 05/06/20182,500,000 – (400,000) 2,100,000 06/06/2016 – 05/06/20182,500,000 – (400,000) 2,100,000 06/06/2017 – 05/06/2018
12,500,000 – (2,000,000) 10,500,000
Total: 23,320,000 (900,000) (2,300,000) 20,120,000
Notes:
(1) Share options for a total of 2,300,000 shares of the Company lapsed in accordance with the terms of the Company’s Share Option Scheme during the financial year.
(2) Except as disclosed above, no share option of the Company lapsed or was granted, exercised or cancelled during the financial year.
(3) The weighted average closing price of the shares of the Company immediately before the date(s) of exercise(s) of the share option during the financial year was HK$59.04 per share.
(E) Retirement Benefits Schemes
The Group’s principal retirement benefits schemes available to its Hong Kong employees are defined contribution schemes (including the Mandatory Provident Fund) which are administered by independent trustees. Both the Group and the employees contribute respectively to the schemes sums which represent certain percentage of the employees’ salaries. The contributions by the Group are expensed as incurred and may be reduced by contribution forfeited for those employees who have left the schemes prior to full vesting of the relevant employee’s contribution.
The employees of the Group’s subsidiaries in the PRC are members of the state-managed social insurance and housing funds operated by the Government of PRC. The PRC subsidiaries are required to contribute a certain percentage of payroll costs to the funds to fund the benefits. The only obligation of the Group with respect to the retirement benefits of PRC employees is to make the specified contributions.

The Wharf (Holdings) L imited | Annual Report 2015118
DIRECTORS’ REPORT
(F) Directors’ Interests in Competing Business
Set out below is information disclosed pursuant to Rule 8.10 of the Listing Rules.
Five Directors of the Company, namely, Messrs Stephen T H Ng, Andrew O K Chow, Paul Y C Tsui, K P Chan and Ms Doreen Y F Lee, being directors of Wheelock and/or certain subsidiary(ies) and/or associate(s) of Wheelock (“Wheelock Group”), are considered as having an interest in Wheelock Group under Rule 8.10(2) of the Listing Rules of the Hong Kong Stock Exchange.
The development and/or investment in property assets and hotel businesses by Wheelock Group are considered as competing businesses for the Group. However, the Group itself has adequate experience in property and hotel businesses, which it is capable of carrying on independently of the Wheelock Group.
For safeguarding the interests of the Group, the INEDs and the Audit Committee of the Company would on a regular basis review the business and operational results of the Group to ensure, inter alia, that the Group’s (i) development of properties for sale and/or investment; (ii) property leasing businesses; and (iii) hotel businesses are and continue to be run at arm’s length from those of the Wheelock Group.
(G) Major Customers and Suppliers
For the financial year ended 31 December 2015:
(i) the aggregate amount of purchases (not including the purchases of items which are of a capital nature) attributable to the Group’s five largest suppliers represented less than 30% of the Group’s total purchases; and
(ii) the aggregate amount of turnover attributable to the Group’s five largest customers represented less than 30% of the Group’s total turnover.
(H) Debentures, Bank Loans, Overdrafts and other Borrowings
Particulars of any and all debentures, bank loans, overdrafts and/or other borrowings of the Company and of the Group as at 31 December 2015 which are repayable on demand or within a period not exceeding one year are set out in Note 20 to the Financial Statements on pages 154 and 155. Those which would fall due for repayment after a period of one year are particularised in Note 20 to the Financial Statements on pages 154 and 155.
(I) Public Float
Based on information that is publicly available to the Company and within the knowledge of the Directors as at the date of this report, the Company has maintained the prescribed public float under the Listing Rules throughout the financial year ended 31 December 2015.

The Wharf (Holdings) L imited | Annual Report 2015 119
(J) Disclosure of Connected Transactions
Set out below is information in relation to connected transactions involving the Company and/or its subsidiaries, particulars of which were previously disclosed in announcements of the Company dated 5 January 2015, 30 December 2011 and 26 September 2014 respectively and are required under the Listing Rules to be disclosed in the Annual Report and Financial Statements of the Company.
(i) Beijing Land Joint Venture
On 5 January 2015, the Group and China Merchants Property Development Co., Ltd. (“CMP”) group together with two independent partners, 北京華潤曙光房地產開發有限公司 (“BJCR”) and 深圳平安不動產有限公司 (“SZPA”) (collectively the “Parties”) entered into two co-operation agreements (“Co-operation Agreements”) for the purpose of joint bidding and development of two pieces of land in Beijing with total site area of about 117,226.1 square metres and total maximum developable gross floor area of about 338,174 square metres (the “Beijing Lands”), through two project companies with the share of ownership being 25:24:26:25 and 25:26:24:25 amongst the Group, CMP, BJCR and SZPA respectively. The two project companies would have initial registered capitals of RMB100 million (equal to about HK$127 million) and RMB10 million (equal to about HK$13 million) respectively, which would be contributed by each of the Parties in proportion to their respective ownership percentage. Upon completion of the capital contribution, both the project companies became owned as to 25% by the Group. The purpose of the relevant transaction is for broadening the asset and earnings base of the Group.
The Beijing Lands were acquired by the Parties via a government land auction in Beijing in the PRC on 5 January 2015 at an aggregate price of RMB8,690 million (equal to about HK$11,016 million). Pursuant to the term of the Co-operation Agreements, such land costs will be borne by the two project companies, which are to be financed by way of shareholders’ loan from the Parties in amounts proportionate to their respective ownership percentage.
As CMP is a 51.89%-owned subsidiary of China Merchants Group Co., Ltd. which in turn is an indirect substantial shareholder of a non-wholly-owned subsidiary of the Company, CMP was regarded as a connected person of the Company at the time when the Co-operation Agreements were entered into by the Group. Therefore, the relevant transactions constituted connected transactions for the Company under the Listing Rules.
(ii) Master Tenancy Agreements
During the financial year, there existed various tenancy agreements entered into between certain subsidiaries of the Company as landlords and certain subsidiaries, associates and/or affiliates of Wisdom Gateway Limited (“WGL”) as tenants (the “Eligible Tenants”) for the purpose of the letting by the landlords to the tenants certain retail/commercial premises owned by the Group for operating various retail businesses, including Lane Crawford stores and City Super stores.
On 30 December 2011, the Company entered into a master tenancy agreement (the “MTA”) with WGL for a term of three years from 1 January 2012 to 31 December 2014. The MTA is for the purpose of, inter alia, regulating various continuing connected transactions in respect of the leasing of premises owned by members of the Group to the Eligible Tenants and providing for the aggregate annual cap amount of rentals in relation thereto during the said three-year term.
Also on 26 September 2014, the Company entered into a renewal master tenancy agreement (the “Renewal MTA”) with WGL for a new term of three years commencing on 1 January 2015 and expiring on 31 December 2017. The Renewal MTA is for the purpose of providing, inter alia, for the aggregate annual cap amount of rentals, which is fixed at HK$1,580 million per annum, in respect of the leasing of premises owned by members of the Group to members of WGL group and its associated or affiliated companies during the said three-year term.
As WGL is indirectly wholly-owned by a trust, the settlor of which is the previous Director of the Company, namely, Hon Peter K C Woo, the MTA and the Supplemental Agreement and various transactions contemplated and/or governed thereunder (collectively, the “MTA Transactions”), and also the Renewal MTA, constitute continuing connected transactions for the Company under the Listing Rules.
The annual aggregate amount of rental under the MTA, which is subject to the relevant aggregate annual cap amount previously disclosed in the abovementioned announcement dated 26 September 2014, received by Wharf group from WGL group for the financial year ended 31 December 2015 amounted to HK$1,050 million.
The Wharf (Holdings) L imited | Annual Report 2015120
DIRECTORS’ REPORT
(iii) Confirmation from the Directors and the Auditors
(a) The Directors, including the Independent Non-executive Directors, of the Company have reviewed the MTA Transactions mentioned under Section (J)(ii) above and confirmed that the MTA Transactions were entered into:
(1) by the Group in the ordinary and usual course of its business;
(2) on normal commercial terms or better; and
(3) according to the agreements governing the MTA Transactions on terms that are fair and reasonable and in the interests of the Shareholders of the Company as a whole.
(b) In accordance with paragraph 14A.56 of the Listing Rules, the Board of Directors engaged the Company’s auditors to perform procedures on the Group’ s continuing connected transactions in accordance with Hong Kong Standard on Assurance Engagements 3000 “Assurance Engagements Other Than Audits or Reviews of Historical Financial Information” and with reference to Practice Note 740 “Auditor’s Letter on Continuing Connected Transactions under the Hong Kong Listing Rules” issued by the Hong Kong Institute of Certified Public Accountants.
The auditors of the Company have advised the nothing has come to their attention that causes them to believe that:
(1) the MTA Transactions had not been approved by the Company’s Board of Directors;
(2) the MTA Transactions were not, in all material respects, entered into in accordance with the terms of the related agreements governing the MTA Transactions;
(3) the relevant cap amounts, where applicable, have been exceeded during the financial year ended 31 December 2015; and
(4) in the event that there would be any transactions involving the provision of goods and services by the Group, the transactions were not, in any material respects, in accordance with the pricing policies of the Group.
(iv) With regard to the Related Party Transactions as disclosed under Note 26 to the Financial Statements on page 167, the transactions stated under paragraph (a) therein constitute connected transactions (as defined under the Listing Rules) of the Company/and the one under paragraph (b) constitute a fully exempt connected transaction of the Company, for all of which the applicable requirements under the Listing Rules have been duly complied with.
(K) Principal Risks and Uncertainties
The following is a list of principal risks and uncertainties that are considered to be of significance and have potential to affect the Group’s businesses, results of operations and financial conditions. However, this is non-exhaustive as there may be other risks and uncertainties arise resulting from changes in economic and other conditions over time. The Group employs a risk management and internal control framework to identify current and foreseeable risks at different levels of the organization so as to take preventive actions to avoid or mitigate their adverse impacts.
Risks pertaining to Investment Properties (“IP”)
IP segment is the Group’s core business with IP assets accounted for over 70% of the Group’s total. With the majority of the properties located in Hong Kong and Mainland China, the general economic climate, regulatory changes, government policies and the political conditions in both Hong Kong and Mainland China may have a significant impact on the Group’s overall financial results and condition. The Group’s rental income may experience more frequent adjustments resulting from competition arising from oversupply in retail and office areas. Furthermore, rental levels may also be impacted by external economic and market conditions including but not limited to the fluctuations in general supply and demand, performance in stock markets and financial volatility, which may indirectly affect the Group’s IP performance.
IPs are stated at their fair values in accordance with the Hong Kong Financial Reporting Standards in the statement of financial position at each reporting period. The fair values are provided by independent professional surveyors, using the income capitalization approach which capitalized the net income of properties and takes into account the significant adjustments on term yield to account for the risk upon reversion and the changes in fair value are recognised in the income statement. Given the size of the Group’s IP portfolio, any significant change in the IP values may overwhelmingly affect the Group’s results that may not be able to reflect the Group’s operating and cash flow performance.
The Wharf (Holdings) L imited | Annual Report 2015 121
In this respect, the Group regularly assesses changes in the economic environment and keeps alert to market needs and competitors’ offensives in order to maintain competitiveness. Continuously maintaining the quality of the assets and building up a diversified and high-quality tenant-mix also help the Group to grow revenue and to resist a sluggish economy. In addition, long-range planned and tactical promotions are seamlessly executed for maintaining the IPs’ leading brands and value.
Risks pertaining to Development Properties (“DP”)
DP segment is the Group’s another major business, particularly in Mainland China. Accordingly, the DP segment is subject to economic, political and legal developments in Mainland China as well as in the economies in the surrounding region. In recent years, the DP market movements in Mainland China have been concurrently affected by the economic trend and government policies including but not limited to the adoption of category-based regulatory measures and the bilateral regulatory measures for the real estate market, policy changes in mortgage levels and ownership, interest rate changes, supply and demand conditions as well as the overall economic volatility in Mainland China. The Group’s DP segment is expected to continue exposing to these risks, which may affect the Group’s investment strategy and business model as well as the performance in DP.
In this respect, the Group actively assesses the overall economic, political and legal developments as well as the property markets both in Hong Kong and other provinces in Mainland China for deciding viable acquisitions and selling strategies. For each potential project, detailed feasibility studies and stress tests with regard to all aspects will be carried out before an acquisition to minimize the commercial and legal risks.
Risks pertaining to Logistic segment
The Group operates container terminals both in Hong Kong and Mainland China. The low global trade growth environment is likely to continue through 2016, impacting volume growth and putting pressure on shipping lines to economise and rationalise their networks further. With more downside than upside risks in the macro economic landscape there is little chance that global trade growth will recover this year and increasing uncertainty in Europe could weaken sentiment further.
Network rationalisation results in an environment where there is a high risk of business churn, particularly in the transhipment segment. As discussions on new alliances also involve those shipping lines not directly impacted by these deals there is uncertainty on the net impact for individual terminal operators.
While continuing to seek additional throughput, Modern Terminals will remain focused on improving operational performance and delivering on customer requirements to maximise cash flow and strengthen the company’s balance sheet. We have already commenced the next steps in our multi-year programme to increase our operational efficiency and infrastructure capability, the benefits of which will flow through in 2016 and 2017.
Risks pertaining to Hotel Segment
The Group operates 14 hotels in the Asia Pacific region, six of which are owned by the Group. Hotel performance is usually subject to a high degree of fluctuations caused by both predictable and unpredictable factors including seasonality, social stability, epidemic diseases and changes in economic conditions. For instance, the recent Central Government Anti-corruption drive in Mainland, the policy change on the grant of multiple-entry permits to Shenzhen residents, together with the change in the foreign exchanges of the surrounding regions have varied the development pattern of the tourism and hospitality industry with heavily relied on the growth of visitor arrivals from Mainland.
In this respect, Hotel Segment closely assesses the impact of the geopolitical outlook and economic development of different countries for building its portfolios and exposures to match with the Group’s risk appetite. It also takes continual reviews of competition, legal and political changes as well as market trends for setting its business strategies including marketing and pricing to protect and drive profitability.
Risks pertaining to CME segment
The Group’s CME segment is faced with fast changing user behaviour enabled by new technologies in a crowded market.
This is particularly the case for i-CABLE operating in a highly competitive TV market with an abundant supply of fresh programs and channels created locally and a good number of these over free TV. A weak user demand combined with an over-supplied market has made it harder for i-CABLE to return to profitability. This has in turn adversely affected its cash position, at a time when continual investment is important to sustain its competitiveness and build for the future. Nevertheless, i-CABLE is committed to make smarter investments in content and infrastructure. When a free TV licence is issued in the near future, it should help i-CABLE leverage on its production expertise and broadcasting infrastructure, to develop a new revenue stream and to reinforce its reputation in local content.
The Wharf (Holdings) L imited | Annual Report 2015122
DIRECTORS’ REPORT
On the other hand, Wharf T&T is facing two major threats that can harm its profitability, viz. drastic or continuous economic slowdown, which may result in an increase in company closures or downsizing, and competitive price pressure that leads to yield reduction. However, with the ability to provide a rich portfolio of ICT products and solutions and a superior Fibre-To-The-Desk (FTTD) coverage compared to most of its competitors, Wharf T&T possesses unique bundling capabilities and market share gain potential to generate additional quality income to neutralize any adverse impact arising from any change in macro market landscape.
Legal and Regulatory Compliance risk
Whilst the Group has a diversified portfolio of business operations across Hong Kong, various Mainland cities and various Asia Pacific regions, any failure to anticipate the trend of regulatory changes or cope with relevant requirements may result in non-compliance of a local laws or regulation, leading to not only financial loss but also reputational damage to the Group. In mitigation of relevant risks, the Group has actively assesses the effect of relevant developments and engages closely with regulatory authorities and external advisors on new laws and regulations and also trending legislations to ensure relevant requirements are properly complied with in an effective manner.
Financial risk
The Group is exposed to financial risks related to interest rate risks, foreign currency risks, equity price and credit in the normal course of its business. For further details of such risks and relevant management policies, please refer to note 23 to the financial statements from pages 159 to 164.
(L) Directors of Subsidiaries
The names of all persons who, during the financial year and up to 9 March 2016 (the date of the Directors’ Report of the Company), served as directors of all those companies included as subsidiaries in the consolidated financial statements of the Company for the financial year ended 31 December 2015 are set out below:-
Andrea LimitedCHAN King Chuen LouriceCHAN Kwok PongCHAN Sik WahCHAN Wing Sang Wilson*CHAN Wing Yee AlmiraChavalit UttasartCHEUNG Ka Lung Tom*CHEUNG Mark QuintinCHIU Ying Chun RonaldCHOI MargaretCHOW On KiuCHOW Ming Kuen JosephDENG Weidong*de LACY STAUNTON Hugh Maurice VictorDOMMESTRUP Anders*FU Chi Yuen PatrickFU Wai HungGUO YongHAO Jian MinHENNIG Hans HelmuthHU Shao Ming HermanHUANG XuanHUI Chung Ying KevinHUNG Hing On*KELLY Sean AloysiusKWAN Hon Kong William*KWAN Jut HoLAI Tse Ming BenjaminLAM Chun OnLAM Yuk LauLEE Yuk Fong DoreenLENG Yen Thean
LEUNG Kam CheungLEUNG Kwan Yuen AndrewLEVESQUE Peter JonLI LeiLI JunLI QinganLI YongqianLI Yubin*LING Miu NganLO Wai ManLUK Koon Hoo RogerMA Wai Shin VincentMILLIKEN, AndrewNG Tin Hoi StephenNG Tze Yuen*NGAN Chiu Long Sunny*OON Hock NeoPAO Zen Kwok PeterSHOU Bainian*SIT Kien Ping PeterSIU Wing KoonSIU Yau Chung JosephSUN QiSZE Tsai Ping MichaelTAM Wai ChoiTAN Bee KimTANG See KingTANG Sing Ming ShermanTSANG Chin Cheung SamuelTSO Hok Chiu VivianTSOI Kwong KiTSUI Yiu CheungWEI Qing Shan
WONG Che KwongWONG Chi KitWONG Kwong YiuWONG Pui Chee GigiWONG Sin Yue Cynthia*WOO Chun Kuen DouglasWOO Kwong Ching Peter*WU Fu Liang*WU GuanWU Yung Wei PatrickXIAO Zheng Guang*YE Zhong XiaoYEUNG HO Ingrid Poi YanYICK Chi Ming FrankieYIM KongYOUNG Stephen Ying YuenYU Ka Kai SimonZEMAN AllanZERBE Jared HeathZHANG LuZHANG Vicky YuanyuanZHANG YiZUO Yong Quan王玲
毛立鵬
毛滿金*李春農*郭志成
凌學風
陳小平
高璟山*陸美麗
趙長清*
* ceased to be a director as at 9 March 2016.
The Wharf (Holdings) L imited | Annual Report 2015 123
INDEPENDENT AUDITOR’S REPORT
TO THE SHAREHOLDERS OF THE WHARF (HOLDINGS) LIMITED(INCORPORATED IN HONG KONG WITH LIMITED LIABILITY)
We have audited the consolidated financial statements of The Wharf (Holdings) Limited (“the Company”) and its subsidiaries (together “the Group”) set out on pages 124 to 187, which comprise the consolidated statement of financial position as at 31 December 2015, the consolidated income statement, the consolidated statement of comprehensive income, the consolidated statement of changes in equity and the consolidated statement of cash flows for the year then ended and a summary of significant accounting policies and other explanatory information.
DIRECTORS’ RESPONSIBILITY FOR THE CONSOLIDATED FINANCIAL STATEMENTSThe directors of the Company are responsible for the preparation of consolidated financial statements that give a true and fair view in accordance with Hong Kong Financial Reporting Standards issued by the Hong Kong Institute of Certified Public Accountants and the Hong Kong Companies Ordinance and for such internal control as the directors determine is necessary to enable the preparation of consolidated financial statements that are free from material misstatement, whether due to fraud or error.
AUDITOR’S RESPONSIBILITYOur responsibility is to express an opinion on these consolidated financial statements based on our audit. This report is made solely to you, as a body, in accordance with section 405 of the Hong Kong Companies Ordinance, and for no other purpose. We do not assume responsibility towards or accept liability to any other person for the contents of this report.
We conducted our audit in accordance with Hong Kong Standards on Auditing issued by the Hong Kong Institute of Certified Public Accountants. Those standards require that we comply with ethical requirements and plan and perform the audit to obtain reasonable assurance about whether the consolidated financial statements are free from material misstatement.
An audit involves performing procedures to obtain audit evidence about the amounts and disclosures in the consolidated financial statements. The procedures selected depend on the auditor’s judgement, including the assessment of the risks of material misstatement of the consolidated financial statements, whether due to fraud or error. In making those risk assessments, the auditor considers internal control relevant to the entity’s preparation of the consolidated financial statements that give a true and fair view in order to design audit procedures that are appropriate in the circumstances, but not for the purpose of expressing an opinion on the effectiveness of the entity’s internal control. An audit also includes evaluating the appropriateness of accounting policies used and the reasonableness of accounting estimates made by the directors, as well as evaluating the overall presentation of the consolidated financial statements.
We believe that the audit evidence we have obtained is sufficient and appropriate to provide a basis for our audit opinion.
OPINIONIn our opinion, the consolidated financial statements give a true and fair view of the financial position of the Group as at 31 December 2015 and of the Group’s financial performance and cash flows for the year then ended in accordance with Hong Kong Financial Reporting Standards and have been properly prepared in compliance with the Hong Kong Companies Ordinance.
KPMGCertified Public Accountants8th Floor, Prince’s Building10 Chater RoadCentral, Hong Kong9 March 2016
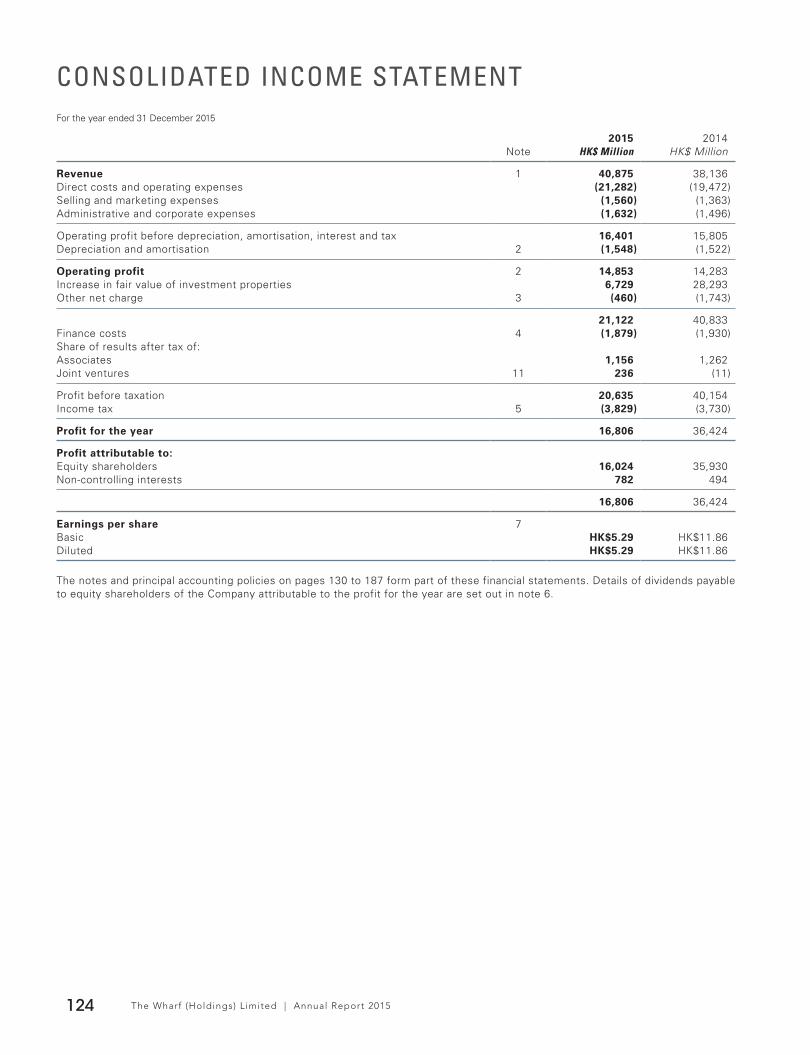
For the year ended 31 December 2015
The Wharf (Holdings) L imited | Annual Report 2015124
CONSOLIDATED INCOME STATEMENT
2015 2014Note HK$ Million HK$ Million
Revenue 1 40,875 38,136Direct costs and operating expenses (21,282) (19,472)Selling and marketing expenses (1,560) (1,363)Administrative and corporate expenses (1,632) (1,496)
Operating profit before depreciation, amortisation, interest and tax 16,401 15,805Depreciation and amortisation 2 (1,548) (1,522)
Operating profit 2 14,853 14,283Increase in fair value of investment properties 6,729 28,293Other net charge 3 (460) (1,743)
21,122 40,833Finance costs 4 (1,879) (1,930)Share of results after tax of:Associates 1,156 1,262Joint ventures 11 236 (11)
Profit before taxation 20,635 40,154Income tax 5 (3,829) (3,730)
Profit for the year 16,806 36,424
Profit attributable to:Equity shareholders 16,024 35,930Non-controlling interests 782 494
16,806 36,424
Earnings per share 7Basic HK$5.29 HK$11.86Diluted HK$5.29 HK$11.86
The notes and principal accounting policies on pages 130 to 187 form part of these financial statements. Details of dividends payable to equity shareholders of the Company attributable to the profit for the year are set out in note 6.

The Wharf (Holdings) L imited | Annual Report 2015 125
For the year ended 31 December 2015
CONSOLIDATED STATEMENT OFCOMPREHENSIVE INCOME
2015 2014HK$ Million HK$ Million
Profit for the year 16,806 36,424
Other comprehensive incomeItems that may be reclassified subsequently to profit or loss:Exchange difference on: (5,554) (426)
Translation of foreign operations (5,437) (426)Transferred to profit or loss on disposal of a subsidiary (117) –Net deficit on available-for-sale investments: (2,032) (76)
Deficit on revaluation (1,508) (76)Transferred to profit or loss on disposal (524) –
Share of other comprehensive income of associates/joint ventures (1,272) (288)Others 10 9
Other comprehensive income for the year (8,848) (781)
Total comprehensive income for the year 7,958 35,643
Total comprehensive income attributable to:Equity shareholders 7,629 35,157Non-controlling interests 329 486
7,958 35,643
The notes and principal accounting policies on pages 130 to 187 form part of these financial statements.

At 31 December 2015
The Wharf (Holdings) L imited | Annual Report 2015126
CONSOLIDATED STATEMENT OF FINANCIAL POSITION
31 December2015
31 December2014
Note HK$ Million HK$ Million
Non-current assetsInvestment properties 8 310,177 301,890Property, plant and equipment 9 22,779 25,027Interest in associates 10 17,785 22,449Interest in joint ventures 11 17,612 19,030Available-for-sale investments 12 8,102 3,740Goodwill and other intangible assets 13 305 305Deferred tax assets 22 700 673Derivative financial assets 16 585 885Other non-current assets 237 209
378,282 374,208
Current assetsProperties for sale 14 37,768 47,543Inventories 46 48Trade and other receivables 15 3,974 3,851Derivative financial assets 16 336 283Bank deposits and cash 17 23,510 18,725
65,634 70,450
Total assets 443,916 444,658
Non-current liabilitiesDerivative financial liabilities 16 (1,558) (1,071)Deferred tax liabilities 22 (10,748) (10,425)Other deferred liabilities (334) (315)Bank loans and other borrowings 20 (62,244) (69,331)
(74,884) (81,142)
Current liabilitiesTrade and other payables 18 (22,681) (23,664)Deposits from sale of properties 19 (18,854) (14,496)Derivative financial liabilities 16 (612) (1,116)Taxation payable 5(d) (1,242) (1,476)Bank loans and other borrowings 20 (8,463) (8,653)
(51,852) (49,405)
Total liabilities (126,736) (130,547)
NET ASSETS 317,180 314,111
Capital and reservesShare capital 24 29,441 29,376Reserves 278,287 276,119
Shareholders’ equity 307,728 305,495Non-controlling interests 9,452 8,616
TOTAL EQUITY 317,180 314,111
The notes and principal accounting policies on pages 130 to 187 form part of these financial statements.
Stephen T H Ng Paul Y C TsuiChairman & Managing Director Vice Chairman & Group Chief Financial Officer

The Wharf (Holdings) L imited | Annual Report 2015 127
For the year ended 31 December 2015
CONSOLIDATED STATEMENT OF CHANGES IN EQUITY
Shareholders’ equity
Share capital
Share premium
Capital redemption
reserves
Investments revaluation
and other reserves
Exchange reserves
Revenue reserves
Total shareholders’
equity
Non-controlling
interestsTotal
equityHK$ Million HK$ Million HK$ Million HK$ Million HK$ Million HK$ Million HK$ Million HK$ Million HK$ Million
At 1 January 2014 3,030 26,339 7 1,080 9,332 235,769 275,557 8,698 284,255
Changes in equity for 2014:Profit – – – – – 35,930 35,930 494 36,424Other comprehensive income – – – (314) (464) 5 (773) (8) (781)
Total comprehensive income – – – (314) (464) 35,935 35,157 486 35,643
Equity settled share-based payments – – – 84 – – 84 – 84
Share option lapse – – – (11) – 11 – – –Redemption of convertible bond – – – (99) – 99 – – –2013 second interim dividend paid – – – – – (3,636) (3,636) – (3,636)2014 first interim dividend paid – – – – – (1,667) (1,667) – (1,667)Dividends paid to
non-controlling interests – – – – – – – (568) (568)Transition to no-par value regime
on 3 March 2014 (Note 24(a)) 26,346 (26,339) (7) – – – – – –
At 31 December 2014 and 1 January 2015 29,376 – – 740 8,868 266,511 305,495 8,616 314,111
Changes in equity for 2015:Profit – – – – – 16,024 16,024 782 16,806Other comprehensive income – – – (1,855) (6,546) 6 (8,395) (453) (8,848)
Total comprehensive income – – – (1,855) (6,546) 16,030 7,629 329 7,958
Shares issued under the share option scheme 65 – – (15) – – 50 – 50
Equity settled share-based payments – – – 40 – – 40 – 40
Share option lapse – – – (28) – 28 – – –2014 second interim dividend paid – – – – – (3,819) (3,819) – (3,819)2015 first interim dividend paid – – – – – (1,667) (1,667) – (1,667)Capital contribution from
non-controlling interests of a subsidiary – – – – – – – 876 876
Dividends paid to non-controlling interests – – – – – – – (365) (365)
Disposal of a subsidiary – – – – – – – (4) (4)
At 31 December 2015 29,441 – – (1,118) 2,322 277,083 307,728 9,452 317,180
The notes and principal accounting policies on pages 130 to 187 form part of these financial statements.

For the year ended 31 December 2015
The Wharf (Holdings) L imited | Annual Report 2015128
CONSOLIDATED STATEMENT OF CASH FLOWS
2015 2014Note HK$ Million HK$ Million
Operating cash inflow (a) 15,951 15,108Changes in working capital (a) 11,887 6,992
Cash generated from operations (a) 27,838 22,100Net interest paid (1,808) (1,797)Interest paid (2,172) (2,527)Interest received 364 730
Dividends received from associates/joint ventures 1,061 824Dividends received from investments 174 154Hong Kong profits tax paid (1,730) (1,367)Overseas tax paid (1,482) (1,661)
Net cash generated from operating activities 24,053 18,253
Investing activitiesAdditions to investment properties (5,436) (9,463)Additions to property, plant and equipment (1,297) (1,696)Additions to programming library (116) (118)Net increase in interest in associates (1,592) (2,103)Net decrease in interest in joint ventures 252 25Net proceeds from disposal of property, plant and equipment 5 9Purchase of available-for-sale investments (5,827) (73)Redemption of convertible securities – 2,729Acquisition of interest in a subsidiary – (6)Net proceeds from disposal of a subsidiary and a joint venture (c) 1,275 –Proceeds from disposal of investment properties – 47Proceeds from disposal of available-for-sale investments 5,447 –Net placement of bank deposits with maturity greater than three months (1) (70)
Net cash used in investing activities (7,290) (10,719)
Financing activitiesProceeds from the issue of shares under the share option scheme 50 –Drawdown of bank loans and other borrowings 19,261 26,961Repayment of bank loans and other borrowings (25,361) (34,417)Capital contribution from non-controlling interests of a subsidiary 876 –Dividends paid to equity shareholders (5,486) (5,303)Dividends paid to non-controlling interests (365) (568)
Net cash used in financing activities (11,025) (13,327)
Increase/(decrease) in cash and cash equivalents 5,738 (5,793)Cash and cash equivalents at 1 January 18,625 24,485Effect of exchange rate changes (954) (67)
Cash and cash equivalents at 31 December 23,409 18,625
Analysis of the balance of cash and cash equivalentsBank deposits and cash (b) 23,409 18,625
The notes and principal accounting policies on pages 130 to 187 form part of these financial statements.

The Wharf (Holdings) L imited | Annual Report 2015 129
NOTE TO THE CONSOLIDATED STATEMENT OF CASH FLOWSa. Reconciliation of operating profit to cash generated from operations
2015 2014HK$ Million HK$ Million
Operating profit 14,853 14,283Adjustments for:Interest income (363) (633)Dividends receivable from investments (174) (152)Depreciation and amortisation 1,548 1,522Loss on disposal of property, plant and equipment 2 4Impairment of property, plant and equipment 45 –Equity settled share-based payment expenses 40 84 Operating cash inflow 15,951 15,108 Increase in properties under development for sale (8,337) (7,653)Decrease in completed properties for sale 15,038 13,291Decrease/(increase) in inventories 2 (1)(Increase)/decrease in trade and other receivables (188) 103Increase in trade and other payables 1,363 2,035Increase/(decrease) in deposits from sale of properties 4,358 (834)(Decrease)/increase in derivative financial instruments (334) 37Other non-cash items (15) 14 Changes in working capital 11,887 6,992 Cash generated from operations 27,838 22,100
b. Cash and cash equivalents
2015 2014HK$ Million HK$ Million
Bank deposits and cash in the consolidated statement of financial position (Note 17) 23,510 18,725Less: Bank deposits with maturity greater than three months (101) (100) Cash and cash equivalents in the consolidated statement of cash flows 23,409 18,625
c. Net proceeds from disposal of a subsidiary and a joint venture
During the year ended 31 December 2015, the Group disposed of its equity interests in a subsidiary and a joint venture to third parties. The cash flows and the net assets of the subsidiary and joint venture were as follows:
HK$ Million Property, plant and equipment 2,064Other assets 360Liabilities (2,130)Non-controlling interests (4) Net assets disposed of 290
Total consideration 744Fair value of remaining equity interest realised 328Carrying amount of net assets disposed of (290)Direct expenses (29)Exchange reserves derecognised 155 Gain on disposal 908 Analysis of the net inflow of cash and cash equivalents in respect of the disposal
of a subsidiary and a joint venture:Total consideration 744Less: cash and cash equivalents disposed of (22)Less: direct expenses and others (46)
676Settlement of shareholder loan from the purchaser 599 Net inflow of cash and cash equivalents on disposal of a subsidiary and a joint venture 1,275

The Wharf (Holdings) L imited | Annual Report 2015130
NOTES TO THE FINANCIAL STATEMENTS
1. SEGMENT INFORMATIONThe Group manages its diversified businesses according to the nature of services and products provided. Management has determined five reportable operating segments for measuring performance and allocating resources. The segments are investment property (“IP”), development property (“DP”), hotels, logistics and communications and media and entertainment (“CME”). No operating segments have been aggregated to form the reportable segments.
Investment property segment primarily includes property leasing operations. Currently, the Group’s properties portfolio, which mainly consists of retail, office and serviced apartments is primarily located in Hong Kong and Mainland China.
Development property segment encompasses activities relating to the acquisition, development, design, construction, sale and marketing of the Group’s trading properties primarily in Hong Kong and Mainland China.
Hotels segment includes hotel operations in the Asia Pacific region. Currently, the Group operates 14 hotels in the Asia Pacific region, six of which owned by the Group.
Logistics segment mainly includes the container terminal operations in Hong Kong and Mainland China undertaken by Modern Terminals Limited (“Modern Terminals”), Hong Kong Air Cargo Terminals Limited (“Hactl”) and other public transport operations.
CME segment comprises pay television, internet and multimedia and other businesses operated by i-CABLE Communications Limited (“i-CABLE”) and the telecommunication businesses operated by Wharf T&T Limited.
Management evaluates performance primarily based on operating profit as well as the equity share of results of associates and joint ventures of each segment. Inter-segment pricing is generally determined on an arm’s length basis.
Segment business assets principally comprise all tangible assets, intangible assets and current assets directly attributable to each segment with the exception of bank deposits and cash, certain financial investments, deferred tax assets and other derivative financial assets.
Revenue and expenses are allocated with reference to sales generated by those segments and expenses incurred by those segments or which arise from the depreciation of assets attributable to those segments.

The Wharf (Holdings) L imited | Annual Report 2015 131
a. Analysis of segment revenue and results
For the year ended RevenueOperating
profit
Investment properties fair value
Other net charge
Finance costs Associates
Joint ventures
Profit before
taxation31 December 2015 HK$ Million HK$ Million HK$ Million HK$ Million HK$ Million HK$ Million HK$ Million HK$ Million
Investment property 14,470 11,759 6,729 111 (1,255) – – 17,344
Hong Kong 12,165 10,516 5,761 – (1,246) – – 15,031Mainland China 2,305 1,243 968 111 (9) – – 2,313
Development property 18,018 2,241 – (1,542) (93) 890 201 1,697
Hong Kong – (25) – – – 18 (57) (64)Mainland China 18,018 2,266 – (1,542) (93) 872 258 1,761
Hotels 1,549 278 – – (4) – – 274Logistics 2,848 689 – 627 (194) 266 35 1,423
Terminals 2,739 676 – 668 (194) 188 35 1,373Others 109 13 – (41) – 78 – 50
CME 3,501 112 – 2 (34) – – 80
i-CABLE 1,510 (246) – 2 (3) – – (247)Telecommunications 1,991 362 – – (31) – – 331Others – (4) – – – – – (4)
Inter-segment revenue (298) – – – – – – –
Segment total 40,088 15,079 6,729 (802) (1,580) 1,156 236 20,818Investment and others 787 464 – 342 (299) – – 507Corporate expenses – (690) – – – – – (690)
Group total 40,875 14,853 6,729 (460) (1,879) 1,156 236 20,635
For the year ended 31 December 2014
Investment property 13,397 10,896 28,293 69 (1,303) – – 37,955
Hong Kong 11,413 9,905 27,864 18 (1,269) – – 36,518Mainland China 1,984 991 429 51 (34) – – 1,437
Development property 15,539 1,762 – (1,778) (100) 930 (64) 750
Hong Kong 113 93 – – – 9 (23) 79Mainland China 15,426 1,669 – (1,778) (100) 921 (41) 671
Hotels 1,600 387 – – (6) – – 381Logistics 3,319 1,051 – (61) (246) 332 53 1,129
Terminals 3,206 1,034 – (20) (246) 234 53 1,055Others 113 17 – (41) – 98 – 74
CME 3,616 211 – 1 (37) – – 175
i-CABLE 1,666 (140) – 1 – – – (139)Telecommunications 1,950 352 – – (37) – – 315Others – (1) – – – – – (1)
Inter-segment revenue (370) – – – – – – –
Segment total 37,101 14,307 28,293 (1,769) (1,692) 1,262 (11) 40,390Investment and others 1,035 714 – 26 (238) – – 502Corporate expenses – (738) – – – – – (738)
Group total 38,136 14,283 28,293 (1,743) (1,930) 1,262 (11) 40,154
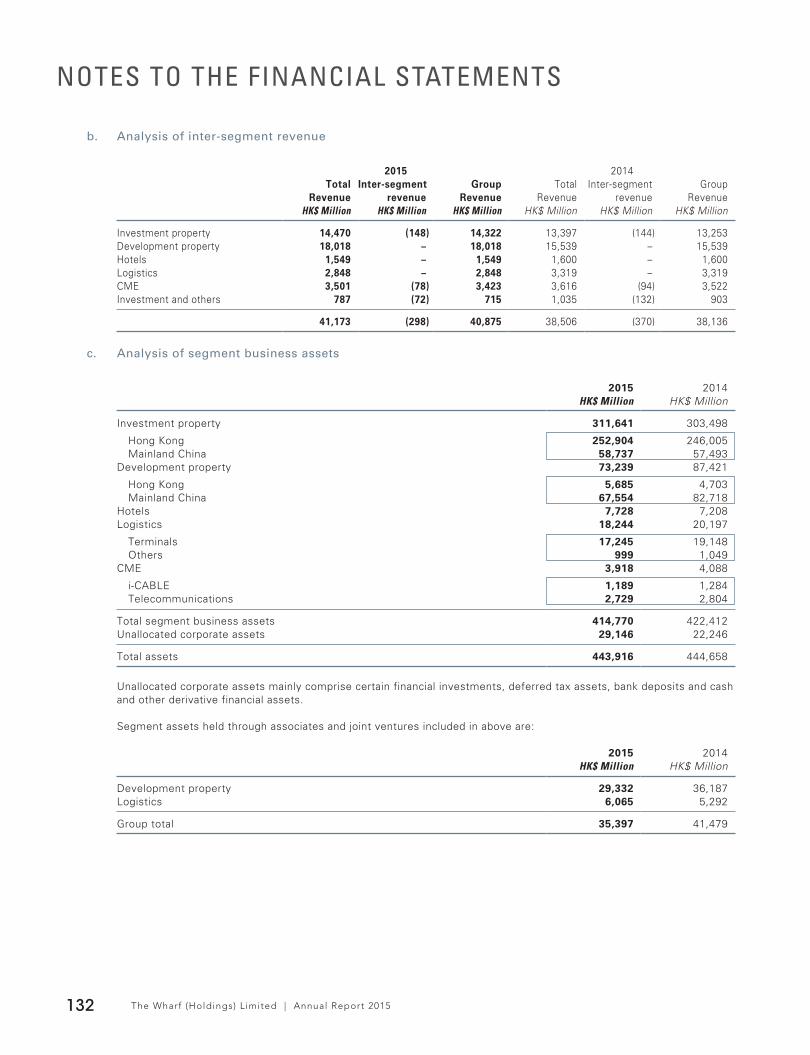
The Wharf (Holdings) L imited | Annual Report 2015132
NOTES TO THE FINANCIAL STATEMENTS
b. Analysis of inter-segment revenue
2015 2014Total
RevenueInter-segment
revenueGroup
RevenueTotal
RevenueInter-segment
revenueGroup
RevenueHK$ Million HK$ Million HK$ Million HK$ Million HK$ Million HK$ Million
Investment property 14,470 (148) 14,322 13,397 (144) 13,253Development property 18,018 – 18,018 15,539 – 15,539Hotels 1,549 – 1,549 1,600 – 1,600Logistics 2,848 – 2,848 3,319 – 3,319CME 3,501 (78) 3,423 3,616 (94) 3,522Investment and others 787 (72) 715 1,035 (132) 903
41,173 (298) 40,875 38,506 (370) 38,136
c. Analysis of segment business assets
2015 2014HK$ Million HK$ Million
Investment property 311,641 303,498
Hong Kong 252,904 246,005Mainland China 58,737 57,493
Development property 73,239 87,421
Hong Kong 5,685 4,703Mainland China 67,554 82,718
Hotels 7,728 7,208Logistics 18,244 20,197
Terminals 17,245 19,148Others 999 1,049
CME 3,918 4,088
i-CABLE 1,189 1,284Telecommunications 2,729 2,804
Total segment business assets 414,770 422,412Unallocated corporate assets 29,146 22,246
Total assets 443,916 444,658
Unallocated corporate assets mainly comprise certain financial investments, deferred tax assets, bank deposits and cash and other derivative financial assets.
Segment assets held through associates and joint ventures included in above are:
2015 2014HK$ Million HK$ Million
Development property 29,332 36,187Logistics 6,065 5,292
Group total 35,397 41,479

The Wharf (Holdings) L imited | Annual Report 2015 133
d. Other segment information
Capital expenditure
Increase in interests in associates and joint ventures
Depreciation and amortisation
2015 2014 2015 2014 2015 2014HK$ Million HK$ Million HK$ Million HK$ Million HK$ Million HK$ Million
Investment property 5,355 13,316 – – 118 98
Hong Kong 1,218 6,757 – – 32 23Mainland China 4,137 6,559 – – 86 75
Development property – – 3,487 4,644 – –
Hong Kong – – 155 201 – –Mainland China – – 3,332 4,443 – –
Hotels 372 759 – – 208 204Logistics 294 403 8 2 457 469
Terminals 294 402 8 2 454 466Others – 1 – – 3 3
CME 538 504 – – 765 751
i-CABLE 207 188 – – 351 348Telecommunications 331 316 – – 414 403
Group total 6,559 14,982 3,495 4,646 1,548 1,522
In addition, the CME segment incurred HK$116 million (2014: HK$152 million) for its programming library. The Group had no significant non-cash expenses other than (i) a non-recurrent accounting loss of HK$1,620 million arising from the deemed disposal of the Group’s entire 24.3% equity interest in Greentown China Holdings Limited (“Greentown”), (ii) in 2014, the provision for diminution in value of HK$1,812 million made for development properties undertaken by the Group’s subsidiaries in the Mainland China and (iii) depreciation and amortisation.
e. Geographical information
Revenue Operating Profit
2015 2014 2015 2014HK$ Million HK$ Million HK$ Million HK$ Million
Hong Kong 19,152 19,126 11,409 11,549Mainland China 21,685 18,977 3,406 2,701Singapore 38 33 38 33
Group total 40,875 38,136 14,853 14,283
Specified non-current assets Total business assets
2015 2014 2015 2014HK$ Million HK$ Million HK$ Million HK$ Million
Hong Kong 271,671 264,523 275,016 267,328Mainland China 101,340 106,443 139,754 155,084
Group total 373,011 370,966 414,770 422,412
Specified non-current assets excludes deferred tax assets, certain available-for-sale investments, derivative financial assets and certain non-current assets.
The geographical location of revenue and operating profit is analysed based on the location at which services are provided and in the case of equity instruments, where they are listed. The geographical location of specified non-current assets and total business assets is based on the physical location of operations.
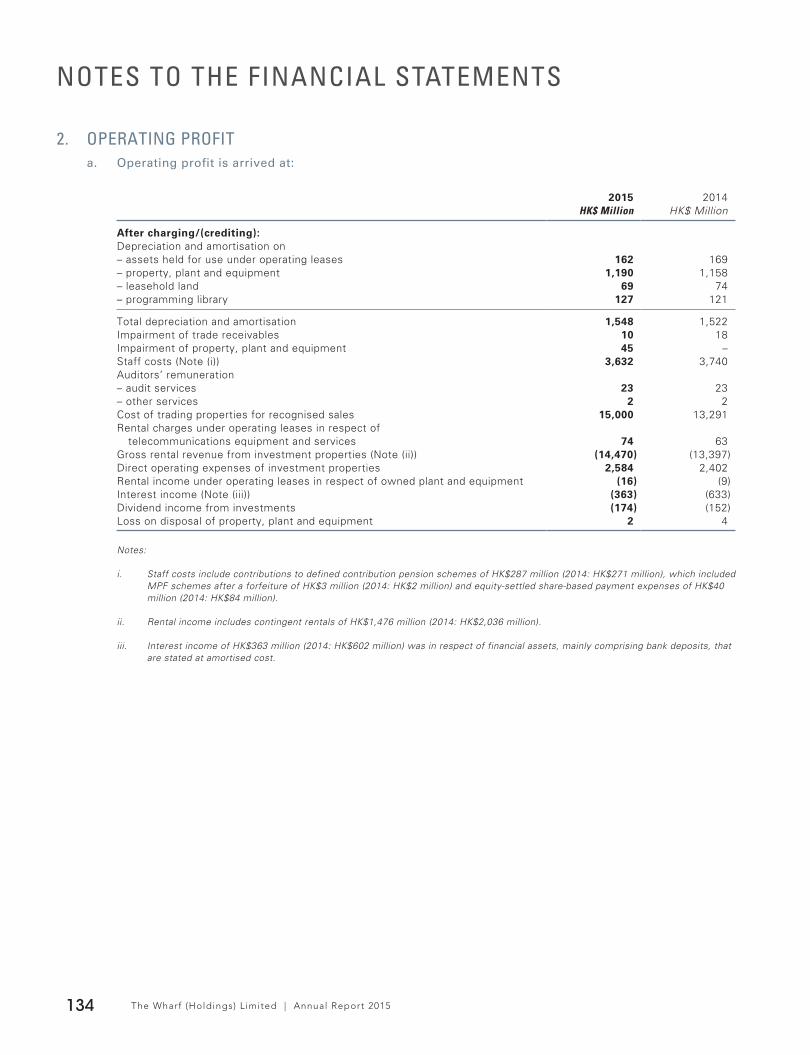
The Wharf (Holdings) L imited | Annual Report 2015134
NOTES TO THE FINANCIAL STATEMENTS
2. OPERATING PROFITa. Operating profit is arrived at:
2015 2014HK$ Million HK$ Million
After charging/(crediting):Depreciation and amortisation on– assets held for use under operating leases 162 169– property, plant and equipment 1,190 1,158– leasehold land 69 74– programming library 127 121
Total depreciation and amortisation 1,548 1,522Impairment of trade receivables 10 18Impairment of property, plant and equipment 45 –Staff costs (Note (i)) 3,632 3,740Auditors’ remuneration– audit services 23 23– other services 2 2Cost of trading properties for recognised sales 15,000 13,291Rental charges under operating leases in respect of
telecommunications equipment and services 74 63Gross rental revenue from investment properties (Note (ii)) (14,470) (13,397)Direct operating expenses of investment properties 2,584 2,402Rental income under operating leases in respect of owned plant and equipment (16) (9)Interest income (Note (iii)) (363) (633)Dividend income from investments (174) (152)Loss on disposal of property, plant and equipment 2 4
Notes:
i. Staff costs include contributions to defined contribution pension schemes of HK$287 million (2014: HK$271 million), which included MPF schemes after a forfeiture of HK$3 million (2014: HK$2 million) and equity-settled share-based payment expenses of HK$40 million (2014: HK$84 million).
ii. Rental income includes contingent rentals of HK$1,476 million (2014: HK$2,036 million).
iii. Interest income of HK$363 million (2014: HK$602 million) was in respect of financial assets, mainly comprising bank deposits, that are stated at amortised cost.
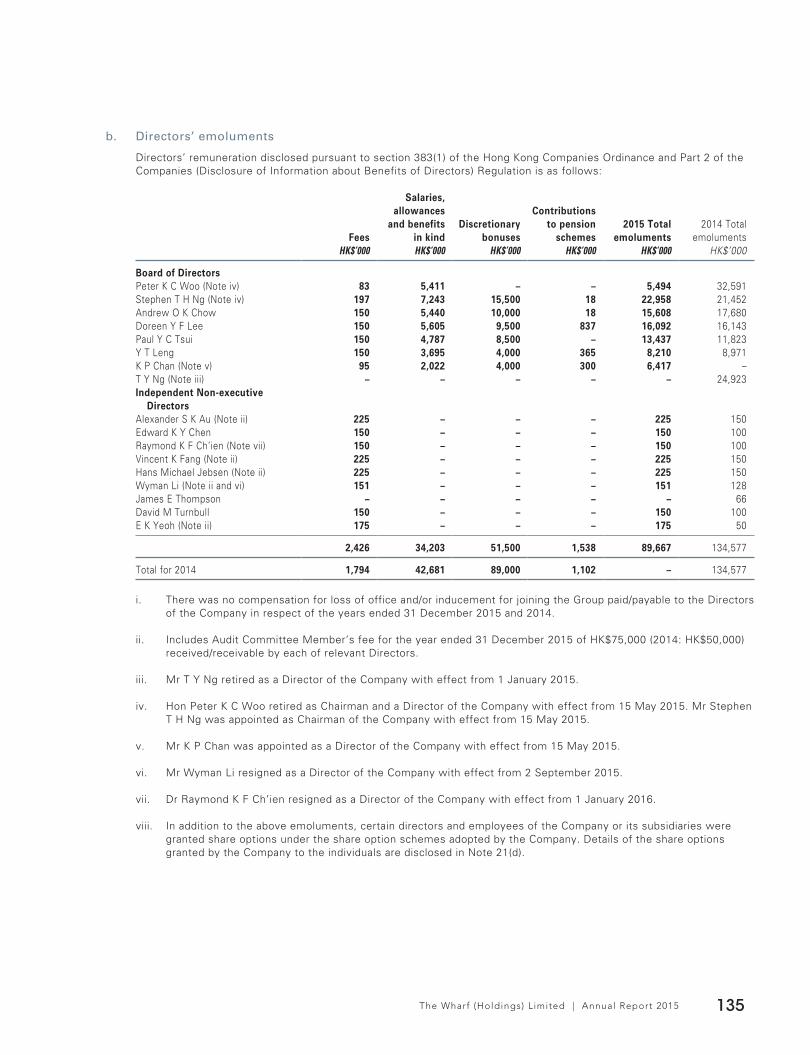
The Wharf (Holdings) L imited | Annual Report 2015 135
b. Directors’ emoluments
Directors’ remuneration disclosed pursuant to section 383(1) of the Hong Kong Companies Ordinance and Part 2 of the Companies (Disclosure of Information about Benefits of Directors) Regulation is as follows:
Fees
Salaries, allowances
and benefitsin kind
Discretionary bonuses
Contributions to pension
schemes2015 Total
emoluments2014 Total
emolumentsHK$’000 HK$’000 HK$’000 HK$’000 HK$’000 HK$’000
Board of DirectorsPeter K C Woo (Note iv) 83 5,411 – – 5,494 32,591Stephen T H Ng (Note iv) 197 7,243 15,500 18 22,958 21,452Andrew O K Chow 150 5,440 10,000 18 15,608 17,680Doreen Y F Lee 150 5,605 9,500 837 16,092 16,143Paul Y C Tsui 150 4,787 8,500 – 13,437 11,823Y T Leng 150 3,695 4,000 365 8,210 8,971K P Chan (Note v) 95 2,022 4,000 300 6,417 –T Y Ng (Note iii) – – – – – 24,923Independent Non-executive
DirectorsAlexander S K Au (Note ii) 225 – – – 225 150Edward K Y Chen 150 – – – 150 100Raymond K F Ch’ien (Note vii) 150 – – – 150 100Vincent K Fang (Note ii) 225 – – – 225 150Hans Michael Jebsen (Note ii) 225 – – – 225 150Wyman Li (Note ii and vi) 151 – – – 151 128James E Thompson – – – – – 66David M Turnbull 150 – – – 150 100E K Yeoh (Note ii) 175 – – – 175 50
2,426 34,203 51,500 1,538 89,667 134,577
Total for 2014 1,794 42,681 89,000 1,102 – 134,577
i. There was no compensation for loss of office and/or inducement for joining the Group paid/payable to the Directors of the Company in respect of the years ended 31 December 2015 and 2014.
ii. Includes Audit Committee Member’s fee for the year ended 31 December 2015 of HK$75,000 (2014: HK$50,000) received/receivable by each of relevant Directors.
iii. Mr T Y Ng retired as a Director of the Company with effect from 1 January 2015.
iv. Hon Peter K C Woo retired as Chairman and a Director of the Company with effect from 15 May 2015. Mr Stephen T H Ng was appointed as Chairman of the Company with effect from 15 May 2015.
v. Mr K P Chan was appointed as a Director of the Company with effect from 15 May 2015.
vi. Mr Wyman Li resigned as a Director of the Company with effect from 2 September 2015.
vii. Dr Raymond K F Ch’ien resigned as a Director of the Company with effect from 1 January 2016.
viii. In addition to the above emoluments, certain directors and employees of the Company or its subsidiaries were granted share options under the share option schemes adopted by the Company. Details of the share options granted by the Company to the individuals are disclosed in Note 21(d).

The Wharf (Holdings) L imited | Annual Report 2015136
NOTES TO THE FINANCIAL STATEMENTS
c. Emoluments of the highest paid employees
For the years ended 31 December 2015, information regarding emoluments of 2 (2014: Nil) employees of the Group who, not being Directors of the Company, were among the top five highest paid individuals (including Directors of the Company and other employees of the Group) employed by the Group has been set out below:
2015 2014HK$ Million HK$ Million
Aggregate emolumentsSalaries, allowances and benefits in kind 10 –Contributions to pension scheme 1 –Discretionary bonuses 20 –
Total 31 –
2015 2014Number Number
Bands (in HK$)$13,500,001 – $14,000,000 1 –$17,000,001 – $17,500,000 1 –
2 –
3. OTHER NET CHARGEOther net charge for the year which amounted to HK$460 million (2014: HK$1,743 million) mainly comprises:
a. A non-recurrent accounting loss of HK$1,620 million which arose from the deemed disposal of the Group’s entire 24.3% equity interest in Greentown upon reclassification of such interest as an available-for-sale investment at the prevailing market value when the Group ceased to have significant influence over Greentown in June 2015.
The Greentown equity interest was acquired by the Group in June 2012 at cost of HK$2,729 million, with an accounting gain representing negative goodwill of HK$2,233 million when the equity interest was equity-accounted for as an associate.
b. A gain of HK$908 million arose from Modern Terminals’ disposal of 50% of its equity interest in its Taicang container port businesses.
c. Net foreign exchange gains of HK$111 million (2014: HK$123 million) which included a fair value gain on forward foreign exchange contracts of HK$24 million (2014: loss of HK$29 million).
d. Net profit on disposal of available-for-sale investments of HK$187 million (2014: Nil) which included a revaluation surplus of HK$524 million transferred from the investments revaluation reserves of the Group.
e. Included in the net charge for 2014 was a provision of HK$1,812 million made in respect of certain development projects in the Mainland China undertaken by the Group’s subsidiaries.

The Wharf (Holdings) L imited | Annual Report 2015 137
4. FINANCE COSTS
2015 2014HK$ Million HK$ Million
Interest charged on:Bank loans and overdrafts 1,018 1,091Other borrowings 938 1,196
Total interest charge 1,956 2,287Other finance costs 195 317Less: Amount capitalised (678) (904)
1,473 1,700Fair value loss:Cross currency interest rate swaps 379 97Interest rate swaps 27 133
406 230
Total 1,879 1,930
a. Interest was capitalised at an average annual rate of approximately 2.4% (2014: 2.0%).
b. Included in the total interest charge are amounts totalling HK$1,605 million (2014: HK$1,893 million) in respect of interest bearing borrowings that are stated at amortised cost.
c. The above interest charge has taken into account the interest paid/received in respect of interest rate swaps and cross currency interest rate swaps.

The Wharf (Holdings) L imited | Annual Report 2015138
NOTES TO THE FINANCIAL STATEMENTS
5. INCOME TAXTaxation charged to the consolidated income statement includes:
2015 2014HK$ Million HK$ Million
Current income taxHong Kong– provision for the year 1,592 1,540– overprovision in respect of prior years (21) (56)
Outside Hong Kong– provision for the year 1,073 860– (Over)/under-provision in respect of prior years (5) 9
2,639 2,353
Land appreciation tax (“LAT”) (Note 5(c)) 411 515
Deferred taxChange in fair value of investment properties 488 543Origination and reversal of temporary differences 304 375Benefit of previously unrecognised tax losses now recognised (13) (56)
779 862
Total 3,829 3,730
a. The provision for Hong Kong profits tax is based on the profit for the year as adjusted for tax purposes at a rate of 16.5% (2014: 16.5%).
b. Income tax on profits assessable outside Hong Kong is mainly China corporate income tax calculated at a rate of 25% (2014: 25%) and China withholding tax at a rate of up to 10%.
c. Under the Provisional Regulations on LAT, all gains arising from transfer of real estate property in Mainland China are subject to LAT at progressive rates ranging from 30% to 60% on the appreciation of the land value, being the proceeds on sales of properties less deductible expenditure including cost of land use rights, borrowing costs and all property development expenditure.
d. Taxation recoverable/payable in the statement of financial position is expected to be recovered/settled within one year.
e. Tax attributable to associates and joint ventures for the year ended 31 December 2015 of HK$1,082 million (2014: HK$1,389 million) is included in the share of results of associates and joint ventures.
f. The China tax law imposes a withholding tax at 10%, unless reduced by a treaty or agreement, for dividends distributed by a PRC-resident enterprise to its immediate holding company outside Mainland China for earnings generated since 1 January 2008. Undistributed earnings generated prior to 1 January 2008 are exempt from such withholding tax. For the year ended 31 December 2015, the Group has provided HK$145 million (2014: HK$154 million) for withholding taxes on accumulated earnings generated by its Mainland China subsidiaries which will be distributed to their immediate holding companies outside Mainland China in the foreseeable future.
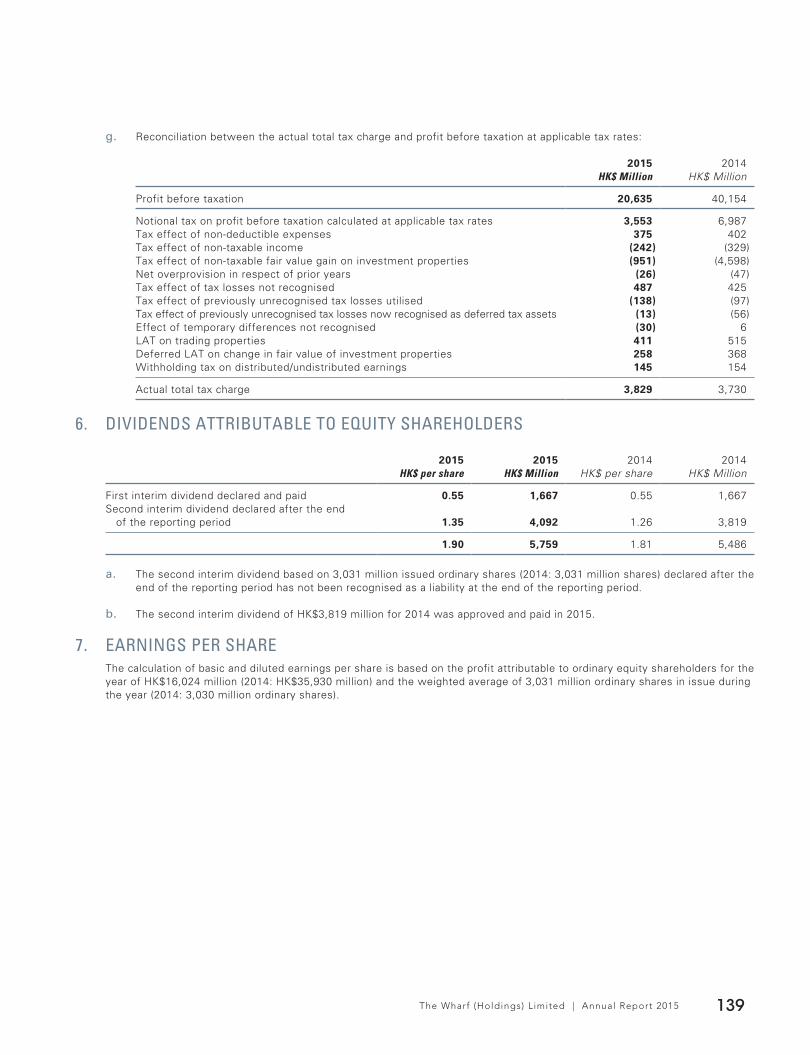
The Wharf (Holdings) L imited | Annual Report 2015 139
g. Reconciliation between the actual total tax charge and profit before taxation at applicable tax rates:
2015 2014HK$ Million HK$ Million
Profit before taxation 20,635 40,154
Notional tax on profit before taxation calculated at applicable tax rates 3,553 6,987Tax effect of non-deductible expenses 375 402Tax effect of non-taxable income (242) (329)Tax effect of non-taxable fair value gain on investment properties (951) (4,598)Net overprovision in respect of prior years (26) (47)Tax effect of tax losses not recognised 487 425Tax effect of previously unrecognised tax losses utilised (138) (97)Tax effect of previously unrecognised tax losses now recognised as deferred tax assets (13) (56)Effect of temporary differences not recognised (30) 6LAT on trading properties 411 515Deferred LAT on change in fair value of investment properties 258 368Withholding tax on distributed/undistributed earnings 145 154
Actual total tax charge 3,829 3,730
6. DIVIDENDS ATTRIBUTABLE TO EQUITY SHAREHOLDERS
2015 2015 2014 2014HK$ per share HK$ Million HK$ per share HK$ Million
First interim dividend declared and paid 0.55 1,667 0.55 1,667Second interim dividend declared after the end
of the reporting period 1.35 4,092 1.26 3,819
1.90 5,759 1.81 5,486
a. The second interim dividend based on 3,031 million issued ordinary shares (2014: 3,031 million shares) declared after the end of the reporting period has not been recognised as a liability at the end of the reporting period.
b. The second interim dividend of HK$3,819 million for 2014 was approved and paid in 2015.
7. EARNINGS PER SHAREThe calculation of basic and diluted earnings per share is based on the profit attributable to ordinary equity shareholders for the year of HK$16,024 million (2014: HK$35,930 million) and the weighted average of 3,031 million ordinary shares in issue during the year (2014: 3,030 million ordinary shares).
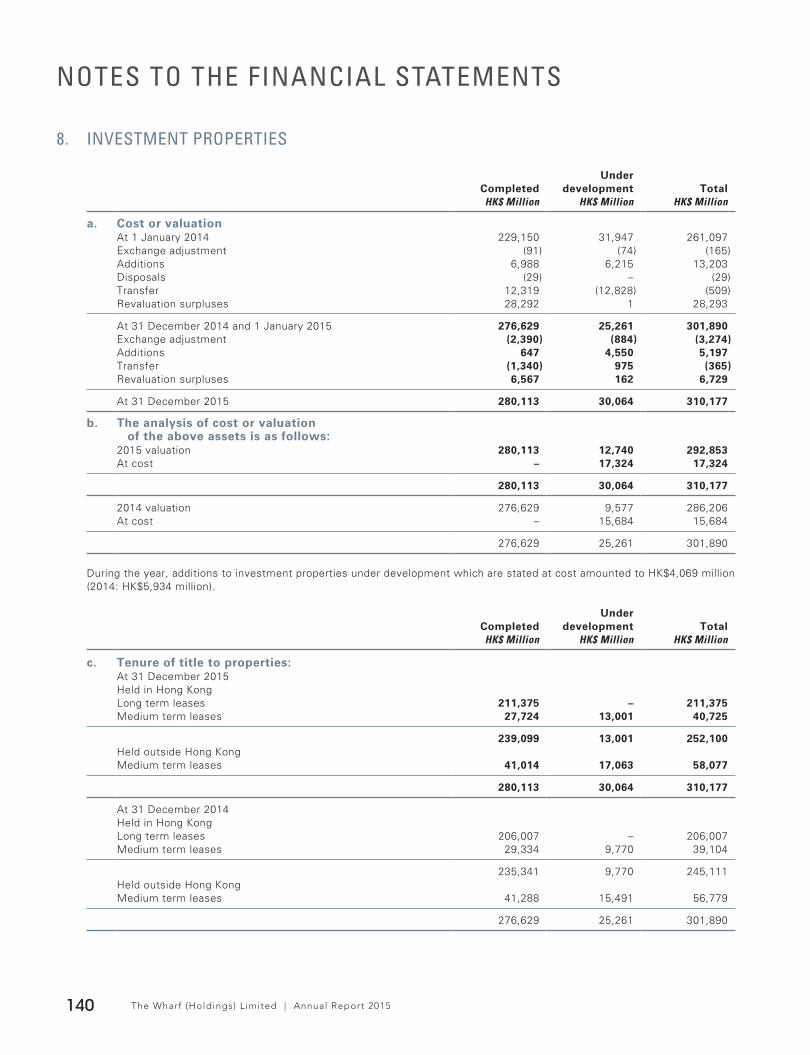
The Wharf (Holdings) L imited | Annual Report 2015140
NOTES TO THE FINANCIAL STATEMENTS
8. INVESTMENT PROPERTIES
CompletedUnder
development TotalHK$ Million HK$ Million HK$ Million
a. Cost or valuationAt 1 January 2014 229,150 31,947 261,097Exchange adjustment (91) (74) (165)Additions 6,988 6,215 13,203Disposals (29) – (29)Transfer 12,319 (12,828) (509)Revaluation surpluses 28,292 1 28,293
At 31 December 2014 and 1 January 2015 276,629 25,261 301,890Exchange adjustment (2,390) (884) (3,274)Additions 647 4,550 5,197Transfer (1,340) 975 (365)Revaluation surpluses 6,567 162 6,729
At 31 December 2015 280,113 30,064 310,177
b. The analysis of cost or valuation of the above assets is as follows:
2015 valuation 280,113 12,740 292,853At cost – 17,324 17,324
280,113 30,064 310,177
2014 valuation 276,629 9,577 286,206At cost – 15,684 15,684
276,629 25,261 301,890
During the year, additions to investment properties under development which are stated at cost amounted to HK$4,069 million (2014: HK$5,934 million).
CompletedUnder
development TotalHK$ Million HK$ Million HK$ Million
c. Tenure of title to properties:At 31 December 2015Held in Hong KongLong term leases 211,375 – 211,375Medium term leases 27,724 13,001 40,725
239,099 13,001 252,100Held outside Hong KongMedium term leases 41,014 17,063 58,077
280,113 30,064 310,177
At 31 December 2014Held in Hong KongLong term leases 206,007 – 206,007Medium term leases 29,334 9,770 39,104
235,341 9,770 245,111Held outside Hong KongMedium term leases 41,288 15,491 56,779
276,629 25,261 301,890

The Wharf (Holdings) L imited | Annual Report 2015 141
d. Investment properties revaluation
The Group’s investment properties under development are stated at fair value at the earlier of when the fair value first becomes reliably measurable and the date of completion of the property.
The investment properties stated at fair value as at 31 December 2015 were revalued by Knight Frank Petty Limited (“Knight Frank”), an independent firm of professional surveyors who have among their staff Fellows of the Hong Kong Institute of Surveyors with extensive experience in valuing properties in Hong Kong and Mainland China. Knight Frank has valued the investment properties on a market value basis and has taken into account the net income of the respective properties, allowing for reversionary potential and the redevelopment potential of the properties where appropriate.
The revaluation surplus or deficit arising on revaluation on investment properties is recognised in the line item “Increase in fair value of investment properties” on the face of the consolidated income statement.
The following table presents the investment properties which are measured at fair value at the end of the reporting period across the three levels of the inputs to the revaluation methodologies in accordance with HKFRS13, Fair value measurement. The levels are defined as follows:
Level 1 valuations: Fair value measured using only level 1 inputs i.e. unadjusted quoted prices in active markets for identical assets or liabilities at the measurement date.
Level 2 valuations: Fair value measured using level 2 inputs i.e. observable inputs which fail to meet level 1, and not using significant unobservable inputs. Unobservable inputs are inputs for which market data is not available.
Level 3 valuations: Fair value measured using significant unobservable inputs.
None of the Group’s investment properties measured at fair value are categorised as Level 1 and Level 2 input. The Group’s investment properties which are at Level 3 valuation are analysed as below:
Level 3Retail Office Residential Others Total
HK$ Million HK$ Million HK$ Million HK$ Million HK$ Million
Recurring fair value measurementsAt 31 December 2015Hong Kong 149,325 76,982 25,282 250 251,839Mainland China 18,292 21,493 1,229 – 41,014
167,617 98,475 26,511 250 292,853
At 31 December 2014Hong Kong 145,296 74,897 24,487 238 244,918Mainland China 18,237 21,752 1,299 – 41,288
163,533 96,649 25,786 238 286,206

The Wharf (Holdings) L imited | Annual Report 2015142
NOTES TO THE FINANCIAL STATEMENTS
The movements during the year in the balance of Level 3 fair value measurements are as follows:–
CompletedUnder
development TotalHK$ Million HK$ Million HK$ Million
At 1 January 2014 229,150 13,193 242,343Exchange adjustment (91) – (91)Additions 6,988 281 7,269Disposals (29) – (29)Transfer 12,319 (3,898) 8,421Revaluation surplus 28,292 1 28,293
At 31 December 2014 and 1 January 2015 276,629 9,577 286,206Exchange adjustment (2,390) – (2,390)Additions 647 481 1,128Transfer (1,340) 2,520 1,180Revaluation surplus 6,567 162 6,729
At 31 December 2015 280,113 12,740 292,853
During the years ended 31 December 2014 and 2015, there were no transfers between Level 1 and Level 2 or transfers into or out of Level 3.
The Group’s policy is to recognise transfers between levels of fair value hierarchy as at the end of the reporting period in which they occur.
Valuation processes
The Group reviews the valuations performed by the independent valuers for financial reporting purposes by verifying all major inputs and assessing the reasonableness of the property valuations. A valuation report with an analysis of changes in fair value measurement is prepared at each interim and annual reporting date and is reviewed and approved by the senior management.
Valuation methodologies
The valuations of completed office and retail properties in Hong Kong and Mainland China were based on the income capitalisation approach which capitalised the net income of the properties and takes into account the significant adjustments on term yield to account for the risk upon reversion.
For certain office and residential properties in Hong Kong which are still under development/redevelopment, the valuations were based on the redevelopment basis by taking into account the fair value of properties under development/redevelopment assuming they had been completed as at the date of valuation and then deducting from that amount the estimated costs to complete construction, financing costs and profit and margin for risk.
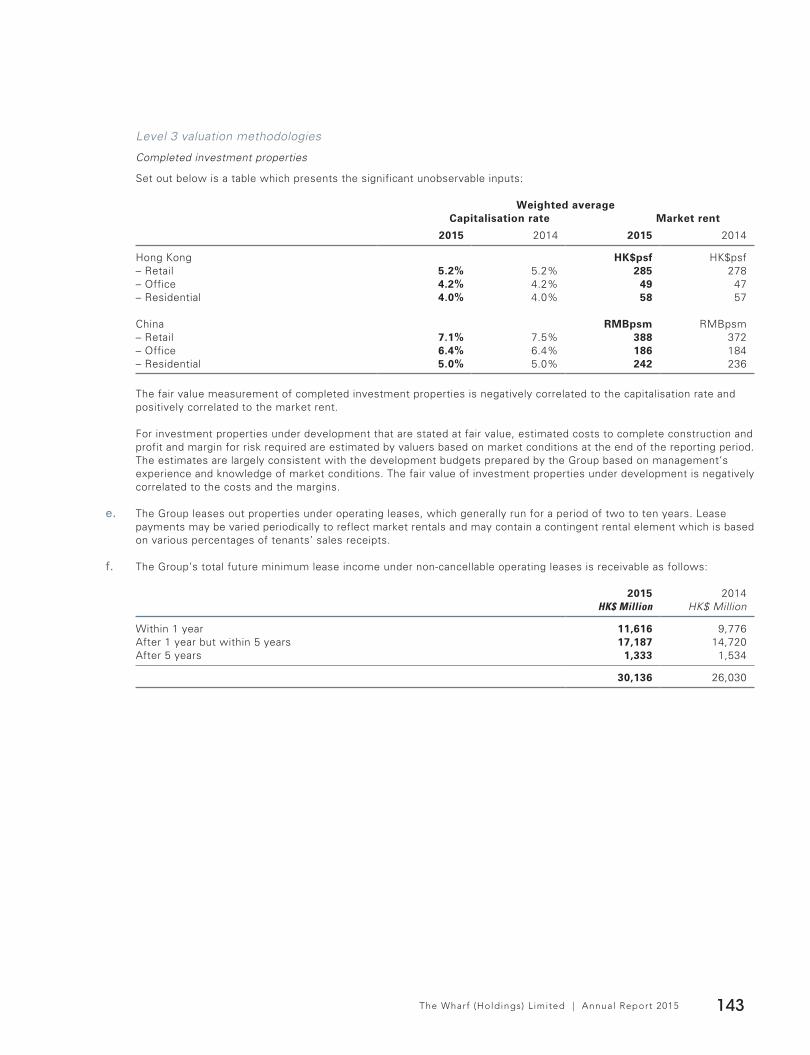
The Wharf (Holdings) L imited | Annual Report 2015 143
Level 3 valuation methodologies
Completed investment properties
Set out below is a table which presents the significant unobservable inputs:
Weighted averageCapitalisation rate Market rent
2015 2014 2015 2014
Hong Kong HK$psf HK$psf– Retail 5.2% 5.2% 285 278– Office 4.2% 4.2% 49 47– Residential 4.0% 4.0% 58 57
China RMBpsm RMBpsm– Retail 7.1% 7.5% 388 372– Office 6.4% 6.4% 186 184– Residential 5.0% 5.0% 242 236
The fair value measurement of completed investment properties is negatively correlated to the capitalisation rate and positively correlated to the market rent.
For investment properties under development that are stated at fair value, estimated costs to complete construction and profit and margin for risk required are estimated by valuers based on market conditions at the end of the reporting period. The estimates are largely consistent with the development budgets prepared by the Group based on management’s experience and knowledge of market conditions. The fair value of investment properties under development is negatively correlated to the costs and the margins.
e. The Group leases out properties under operating leases, which generally run for a period of two to ten years. Lease payments may be varied periodically to reflect market rentals and may contain a contingent rental element which is based on various percentages of tenants’ sales receipts.
f. The Group’s total future minimum lease income under non-cancellable operating leases is receivable as follows:
2015 2014HK$ Million HK$ Million
Within 1 year 11,616 9,776After 1 year but within 5 years 17,187 14,720After 5 years 1,333 1,534
30,136 26,030

The Wharf (Holdings) L imited | Annual Report 2015144
NOTES TO THE FINANCIAL STATEMENTS
9. PROPERTY, PLANT AND EQUIPMENT
Leaseholdland
Hoteland club
properties
Propertiesunder
redevelopment
Otherproperty,plant and
equipmentCME
equipment TotalHK$ Million HK$ Million HK$ Million HK$ Million HK$ Million HK$ Million
a. CostAt 1 January 2014 4,904 6,770 2,089 17,562 11,786 43,111Exchange adjustment (11) (5) (7) (19) – (42)Additions 4 704 42 621 408 1,779Disposals – – – (367) (47) (414)Acquisition of a subsidiary – – – 36 – 36Reclassification – 517 (14) 38 (1) 540
At 31 December 2014 and 1 January 2015 4,897 7,986 2,110 17,871 12,146 45,010
Exchange adjustment (160) (143) (119) (214) – (636)Additions 5 344 32 553 428 1,362Disposals – – – (107) (42) (149)Disposal of a subsidiary (606) – – (2,148) – (2,754)Written off – – – (14) – (14)Reclassification 12 447 – 70 – 529
At 31 December 2015 4,148 8,634 2,023 16,011 12,532 43,348
Accumulated depreciation and impairment losses
At 1 January 2014 909 1,355 – 7,714 8,972 18,950Exchange adjustment (1) (2) – (3) – (6)Charge for the year 74 78 – 708 541 1,401Written back on disposals – – – (356) (45) (401)Acquisition of a subsidiary – – – 34 – 34Reclassification – – – 5 – 5
At 31 December 2014 and 1 January 2015 982 1,431 – 8,102 9,468 19,983
Exchange adjustment (19) (45) – (57) – (121)Charge for the year 69 92 – 717 543 1,421Written back on disposals – – – (102) (40) (142)Disposal of a subsidiary (117) – – (573) – (690)Written off – – – (14) – (14)Impairment – – – 44 1 45Reclassification – – – 87 – 87
At 31 December 2015 915 1,478 – 8,204 9,972 20,569
Net book valueAt 31 December 2015 3,233 7,156 2,023 7,807 2,560 22,779
At 31 December 2014 3,915 6,555 2,110 9,769 2,678 25,027
The hotel properties under development comprise the Murray Building Project totalling HK$4,947 million (2014: HK$4,625 million) included in hotel and club properties for which the costs attributable to land and buildings cannot be allocated reliably. This amount is not subject to depreciation.
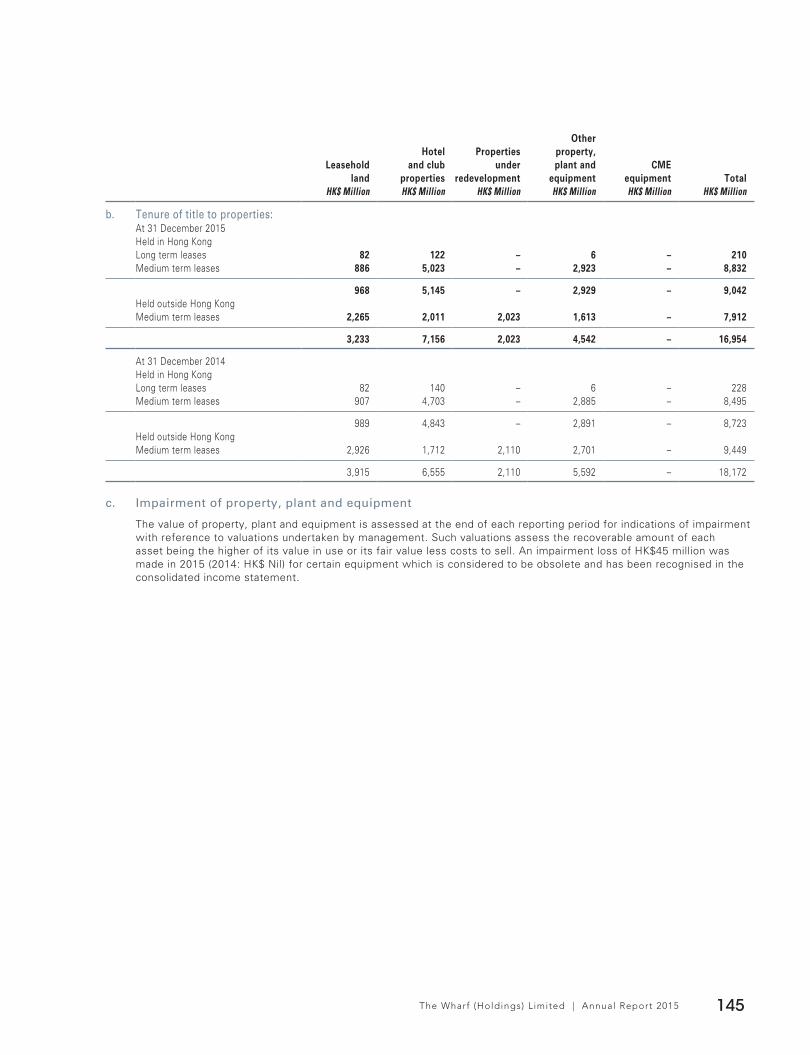
The Wharf (Holdings) L imited | Annual Report 2015 145
Leaseholdland
Hoteland club
properties
Propertiesunder
redevelopment
Otherproperty,plant and
equipmentCME
equipment TotalHK$ Million HK$ Million HK$ Million HK$ Million HK$ Million HK$ Million
b. Tenure of title to properties:At 31 December 2015Held in Hong KongLong term leases 82 122 – 6 – 210Medium term leases 886 5,023 – 2,923 – 8,832
968 5,145 – 2,929 – 9,042Held outside Hong KongMedium term leases 2,265 2,011 2,023 1,613 – 7,912
3,233 7,156 2,023 4,542 – 16,954
At 31 December 2014Held in Hong KongLong term leases 82 140 – 6 – 228Medium term leases 907 4,703 – 2,885 – 8,495
989 4,843 – 2,891 – 8,723Held outside Hong KongMedium term leases 2,926 1,712 2,110 2,701 – 9,449
3,915 6,555 2,110 5,592 – 18,172
c. Impairment of property, plant and equipment
The value of property, plant and equipment is assessed at the end of each reporting period for indications of impairment with reference to valuations undertaken by management. Such valuations assess the recoverable amount of each asset being the higher of its value in use or its fair value less costs to sell. An impairment loss of HK$45 million was made in 2015 (2014: HK$ Nil) for certain equipment which is considered to be obsolete and has been recognised in the consolidated income statement.
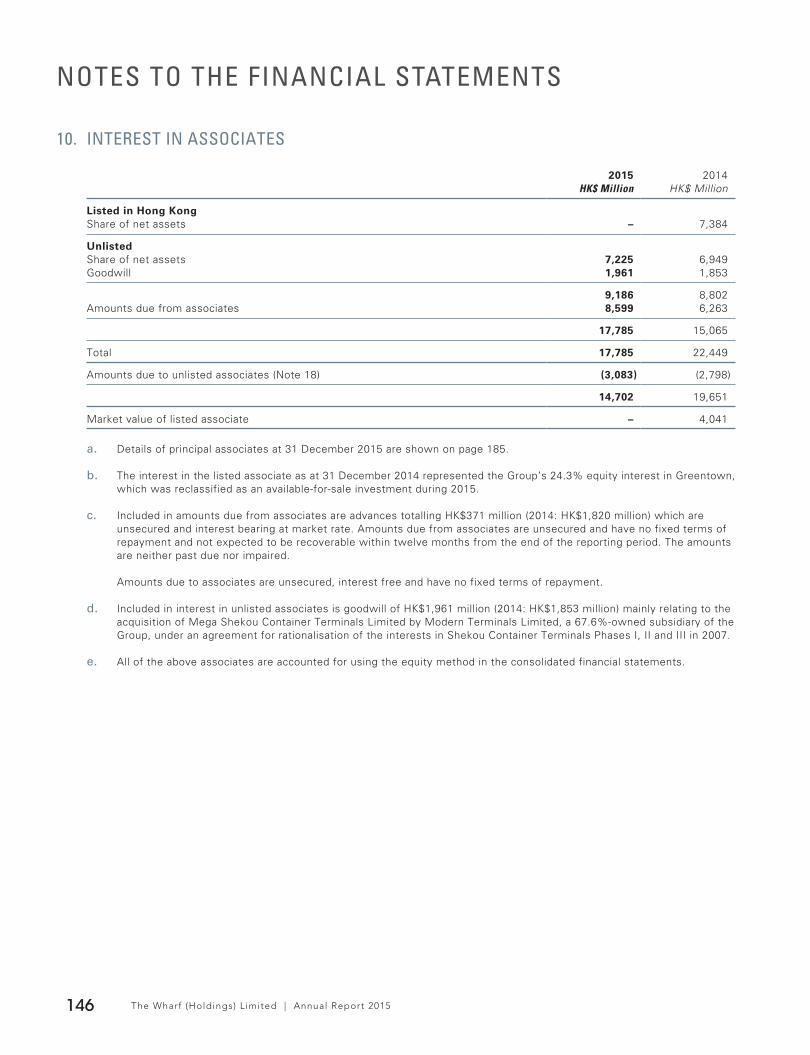
The Wharf (Holdings) L imited | Annual Report 2015146
NOTES TO THE FINANCIAL STATEMENTS
10. INTEREST IN ASSOCIATES
2015 2014HK$ Million HK$ Million
Listed in Hong KongShare of net assets – 7,384
UnlistedShare of net assets 7,225 6,949Goodwill 1,961 1,853
9,186 8,802Amounts due from associates 8,599 6,263
17,785 15,065
Total 17,785 22,449
Amounts due to unlisted associates (Note 18) (3,083) (2,798)
14,702 19,651
Market value of listed associate – 4,041
a. Details of principal associates at 31 December 2015 are shown on page 185.
b. The interest in the listed associate as at 31 December 2014 represented the Group’s 24.3% equity interest in Greentown, which was reclassified as an available-for-sale investment during 2015.
c. Included in amounts due from associates are advances totalling HK$371 million (2014: HK$1,820 million) which are unsecured and interest bearing at market rate. Amounts due from associates are unsecured and have no fixed terms of repayment and not expected to be recoverable within twelve months from the end of the reporting period. The amounts are neither past due nor impaired.
Amounts due to associates are unsecured, interest free and have no fixed terms of repayment.
d. Included in interest in unlisted associates is goodwill of HK$1,961 million (2014: HK$1,853 million) mainly relating to the acquisition of Mega Shekou Container Terminals Limited by Modern Terminals Limited, a 67.6%-owned subsidiary of the Group, under an agreement for rationalisation of the interests in Shekou Container Terminals Phases I, II and III in 2007.
e. All of the above associates are accounted for using the equity method in the consolidated financial statements.

The Wharf (Holdings) L imited | Annual Report 2015 147
f. Summary financial information on associates
At 31 December 2015, no associate is considered to be individually material to the Group. Set out below is the summarised financial information of a material associate in 31 December 2014, Greentown China Holdings Limited (“Greentown”), adjusted for any differences in accounting policies and reconciled to the carrying amounts in the consolidated financial statements. Greentown ceased to be an associate during 2015 (Note 3(a)).
2014RMB Million
Current assets 106,328Non-current assets 20,816Current liabilities (67,775)Non-current liabilities (24,524)
Net assets 34,845
Revenue 32,049Profit from continuing operations and total comprehensive income 3,210
Dividends received from associate 284
2014RMB Million
Reconciled to the Group’s interests in the associate
Gross amounts of net assets of the associate 34,845Non-controlling interests of the associate (8,190)Perpetual securities issued by the associate (3,015)
Net assets of the associate after deducting non-controlling interests and perpetual securities 23,640HK$Million equivalent 29,965
Group’s effective interest 24.3%
2014HK$ Million
Group’s share of net assets of the associate 7,304Revaluation surplus on acquisition 80
Carrying amount in the consolidated financial statements 7,384
Aggregate information of associates that are not individually material:
2015 2014HK$ Million HK$ Million
Aggregate carrying amount of individually immaterial associates in the consolidated financial statements 9,186 8,802
Aggregate amounts of the Group’s share of those associates’Profit from continuing operations 1,156 588Other comprehensive income (462) (19)
Total comprehensive income 694 569

The Wharf (Holdings) L imited | Annual Report 2015148
NOTES TO THE FINANCIAL STATEMENTS
11. INTEREST IN JOINT VENTURES
2015 2014HK$ Million HK$ Million
Share of net assets 7,999 9,864Goodwill – 54
7,999 9,918Amounts due from joint ventures 9,613 9,112
17,612 19,030Amounts due to joint ventures (Note 18) (2,524) (2,045)
15,088 16,985
Details of principal joint ventures at 31 December 2015 are shown on page 186. The Group’s interest in the principal joint ventures are accounted for using the equity method in the consolidated financial statements.
Included in amounts due from joint ventures are advances totalling HK$3,121 million (2014: HK$2,973 million) which are interest bearing. The amounts due from joint ventures are unsecured and have no fixed terms of repayment. They are not expected to be recovered within the next twelve months. The amounts are neither past due nor impaired.
Amounts due to joint ventures are unsecured, interest free and have no fixed terms of repayment.
No joint venture is individually material to the Group. Aggregate information of joint ventures is summarised below:
2015 2014HK$ Million HK$ Million
Aggregate carrying amount of individually immaterial joint ventures in the consolidated financial statements 7,999 9,918
Aggregate amounts of the Group’s share of those joint ventures’Profit/(loss) from continuing operations 236 (11)Other comprehensive income (810) (68)
Total comprehensive income (574) (79)
12. AVAILABLE-FOR-SALE INVESTMENTS
2015 2014HK$ Million HK$ Million
Listed investments stated at market value– in Hong Kong 6,493 2,468– outside Hong Kong 1,583 1,246
Unlisted investment at cost 26 26
8,102 3,740
Available-for-sale investments totalling HK$26 million (2014: HK$26 million) are stated at cost less impairment losses, if any.

The Wharf (Holdings) L imited | Annual Report 2015 149
13. GOODWILL AND OTHER INTANGIBLE ASSETS
Goodwill
Otherintangible
assets TotalHK$ Million HK$ Million HK$ Million
CostAt 1 January 2014 297 12 309Addition 8 – 8
At 31 December 2014 and 31 December 2015 305 12 317
Accumulated amortisationAt 1 January 2014, 31 December 2014 and 31 December 2015 – 12 12
Net carrying valueAt 31 December 2015 305 – 305
At 31 December 2014 305 – 305
Goodwill mainly relates to the Group’s terminals business. As at 31 December 2015, an impairment test was performed by comparing the attributable carrying amount of the business with the recoverable amount. The recoverable amount of the terminals business is based on its value in use. No impairment was recorded.
14. PROPERTIES FOR SALE
2015 2014HK$ Million HK$ Million
Properties under development for sale 32,289 40,797Completed properties for sale 5,479 6,746
37,768 47,543
a. At 31 December 2015, properties under development for sale of HK$17,781 million (2014: HK$25,321 million) are expected to be completed after more than one year.
b. Included in properties under development for sale are deposits of HK$394 million (2014: HK$506 million) paid for the acquisition of certain land sites/properties located in Mainland China.
c. Properties under development for sale and completed properties for sale are stated at the lower of cost and net realisable value. The total carrying value of properties stated at net realisable value at 31 December 2015 was HK$6,640 million (2014: HK$6,529 million).
d. At 31 December 2015, the carrying value of leasehold land and land deposits included in properties under development for sale and completed properties for sale is summarised as follows:
2015 2014HK$ Million HK$ Million
Held in Hong KongMedium term leases 566 588
Held outside Hong KongLong term leases 24,955 31,979Medium term leases 626 1,384
26,147 33,951

The Wharf (Holdings) L imited | Annual Report 2015150
NOTES TO THE FINANCIAL STATEMENTS
15. TRADE AND OTHER RECEIVABLESa. Ageing analysis
Included in this item are trade receivables (net of allowance for bad and doubtful debts) with an ageing analysis based on the invoice date as at 31 December 2015 as follows:
2015 2014HK$ Million HK$ Million
Trade receivables0 – 30 days 625 74931 – 60 days 167 16561 – 90 days 74 74Over 90 days 105 79
971 1,067Other receivables and prepayments 3,003 2,784
3,974 3,851
The Group has established credit policies for each of its core businesses. The general credit terms allowed range from 0 to 60 days, except for sale of properties the proceeds from which are receivable pursuant to the terms of the agreements. All the receivables are expected to be recoverable within one year.
b. Impairment of trade receivables
Impairment losses in respect of trade receivables are recorded using an allowance account unless the Group is satisfied that recovery of the amount is remote, in which case the impairment loss is written off against trade receivables directly.
The movement in the allowance account for the bad and doubtful debts during the year, including both specific and collective loss components, is as follows:
2015 2014HK$ Million HK$ Million
At 1 January 91 91Impairment loss recognised 10 18Uncollectible amounts written off (15) (18)
At 31 December 86 91
c. Trade receivables that are not impaired
As at 31 December 2015, 94% (2014: 93%) of the Group’s trade receivables was not impaired, of which 86% (2014: 91%) was either not past due or less than two months past due.
Based on past experience of the Group, it is determined that no impairment allowance is necessary in respect of past due balances as there has not been a significant change in credit quality of the customers and the balances are still considered to be fully recoverable. The Group does not hold any collateral over these balances.
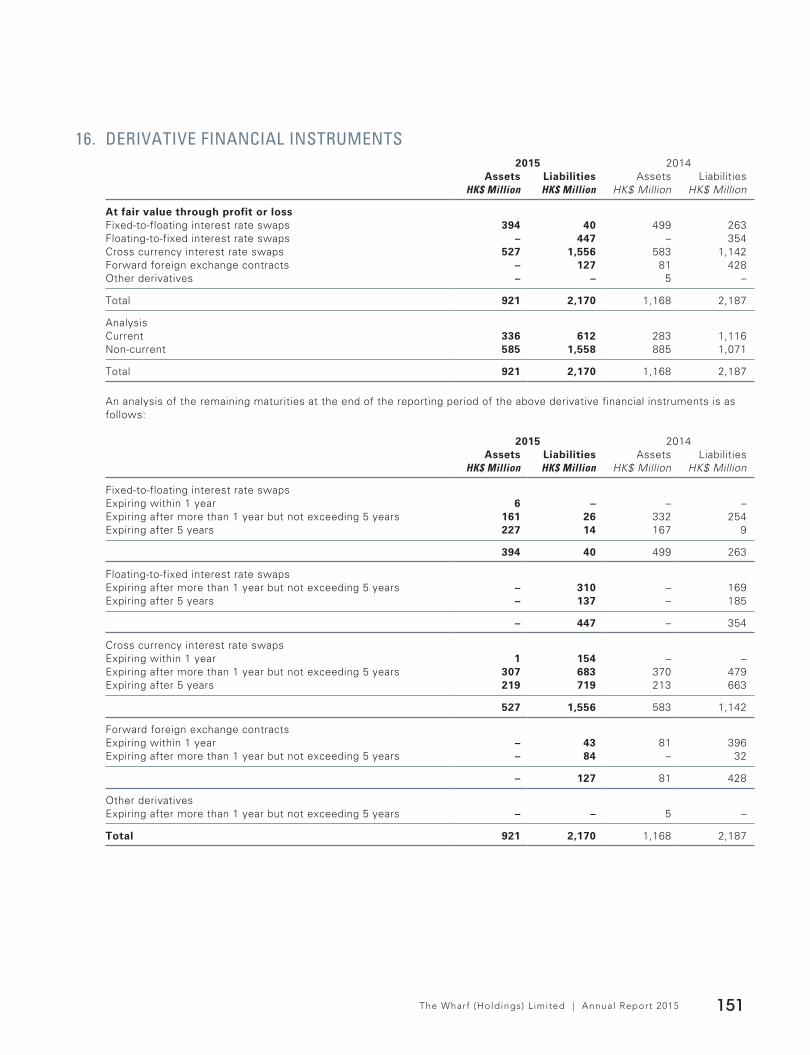
The Wharf (Holdings) L imited | Annual Report 2015 151
16. DERIVATIVE FINANCIAL INSTRUMENTS2015 2014
Assets Liabilities Assets LiabilitiesHK$ Million HK$ Million HK$ Million HK$ Million
At fair value through profit or lossFixed-to-floating interest rate swaps 394 40 499 263Floating-to-fixed interest rate swaps – 447 – 354Cross currency interest rate swaps 527 1,556 583 1,142Forward foreign exchange contracts – 127 81 428Other derivatives – – 5 –
Total 921 2,170 1,168 2,187
AnalysisCurrent 336 612 283 1,116Non-current 585 1,558 885 1,071
Total 921 2,170 1,168 2,187
An analysis of the remaining maturities at the end of the reporting period of the above derivative financial instruments is as follows:
2015 2014Assets Liabilities Assets Liabilities
HK$ Million HK$ Million HK$ Million HK$ Million
Fixed-to-floating interest rate swapsExpiring within 1 year 6 – – –Expiring after more than 1 year but not exceeding 5 years 161 26 332 254Expiring after 5 years 227 14 167 9
394 40 499 263
Floating-to-fixed interest rate swapsExpiring after more than 1 year but not exceeding 5 years – 310 – 169Expiring after 5 years – 137 – 185
– 447 – 354
Cross currency interest rate swapsExpiring within 1 year 1 154 – –Expiring after more than 1 year but not exceeding 5 years 307 683 370 479Expiring after 5 years 219 719 213 663
527 1,556 583 1,142
Forward foreign exchange contractsExpiring within 1 year – 43 81 396Expiring after more than 1 year but not exceeding 5 years – 84 – 32
– 127 81 428
Other derivativesExpiring after more than 1 year but not exceeding 5 years – – 5 –
Total 921 2,170 1,168 2,187
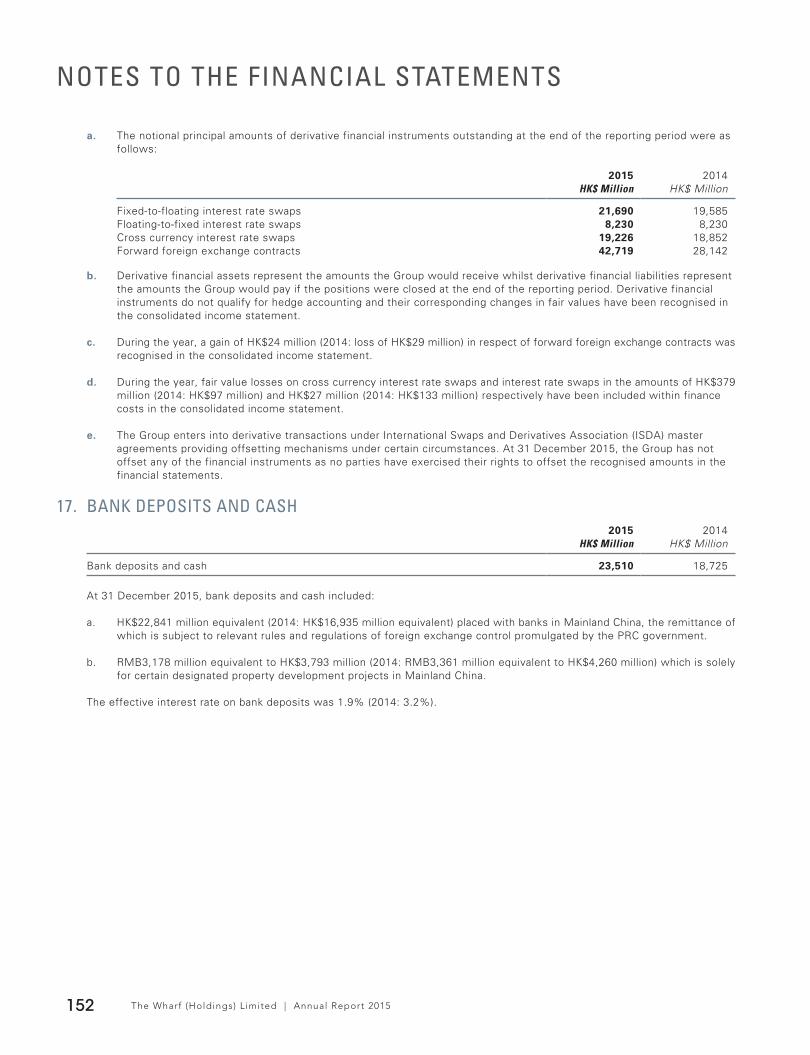
The Wharf (Holdings) L imited | Annual Report 2015152
NOTES TO THE FINANCIAL STATEMENTS
a. The notional principal amounts of derivative financial instruments outstanding at the end of the reporting period were as follows:
2015 2014HK$ Million HK$ Million
Fixed-to-floating interest rate swaps 21,690 19,585Floating-to-fixed interest rate swaps 8,230 8,230Cross currency interest rate swaps 19,226 18,852Forward foreign exchange contracts 42,719 28,142
b. Derivative financial assets represent the amounts the Group would receive whilst derivative financial liabilities represent the amounts the Group would pay if the positions were closed at the end of the reporting period. Derivative financial instruments do not qualify for hedge accounting and their corresponding changes in fair values have been recognised in the consolidated income statement.
c. During the year, a gain of HK$24 million (2014: loss of HK$29 million) in respect of forward foreign exchange contracts was recognised in the consolidated income statement.
d. During the year, fair value losses on cross currency interest rate swaps and interest rate swaps in the amounts of HK$379 million (2014: HK$97 million) and HK$27 million (2014: HK$133 million) respectively have been included within finance costs in the consolidated income statement.
e. The Group enters into derivative transactions under International Swaps and Derivatives Association (ISDA) master agreements providing offsetting mechanisms under certain circumstances. At 31 December 2015, the Group has not offset any of the financial instruments as no parties have exercised their rights to offset the recognised amounts in the financial statements.
17. BANK DEPOSITS AND CASH2015 2014
HK$ Million HK$ Million
Bank deposits and cash 23,510 18,725
At 31 December 2015, bank deposits and cash included:
a. HK$22,841 million equivalent (2014: HK$16,935 million equivalent) placed with banks in Mainland China, the remittance of which is subject to relevant rules and regulations of foreign exchange control promulgated by the PRC government.
b. RMB3,178 million equivalent to HK$3,793 million (2014: RMB3,361 million equivalent to HK$4,260 million) which is solely for certain designated property development projects in Mainland China.
The effective interest rate on bank deposits was 1.9% (2014: 3.2%).

The Wharf (Holdings) L imited | Annual Report 2015 153
Bank deposits and cash are denominated in the following currencies:
2015 2014HK$ Million HK$ Million
RMB 22,772 16,350HKD 435 1,919USD 288 440SGD 11 9Other currencies 4 7
23,510 18,725
18. TRADE AND OTHER PAYABLESIncluded in this item are trade payables with an ageing analysis as at 31 December 2015 as follows:
2015 2014HK$ Million HK$ Million
Trade payables0 – 30 days 390 39631 – 60 days 258 23561 – 90 days 32 48Over 90 days 128 123
808 802Rental and customer deposits 3,982 3,552Construction costs payable 7,980 9,599Amounts due to associates 3,083 2,798Amounts due to joint ventures 2,524 2,045Other payables 4,304 4,868
22,681 23,664
The amount of trade and other payables that is expected to be settled after more than one year is HK$3,819 million (2014: HK$3,460 million), which is mainly for rental and customer deposits. The Group considers the effect of discounting these items would be immaterial. All of the other trade and other payables are expected to be settled or recognised as income within one year or are payable on demand.
19. DEPOSITS FROM SALE OF PROPERTIESDeposits from sale of properties in the amount of HK$4,281 million (2014: HK$1,322 million) are expected to be recognised as income in the consolidated income statement after more than one year.
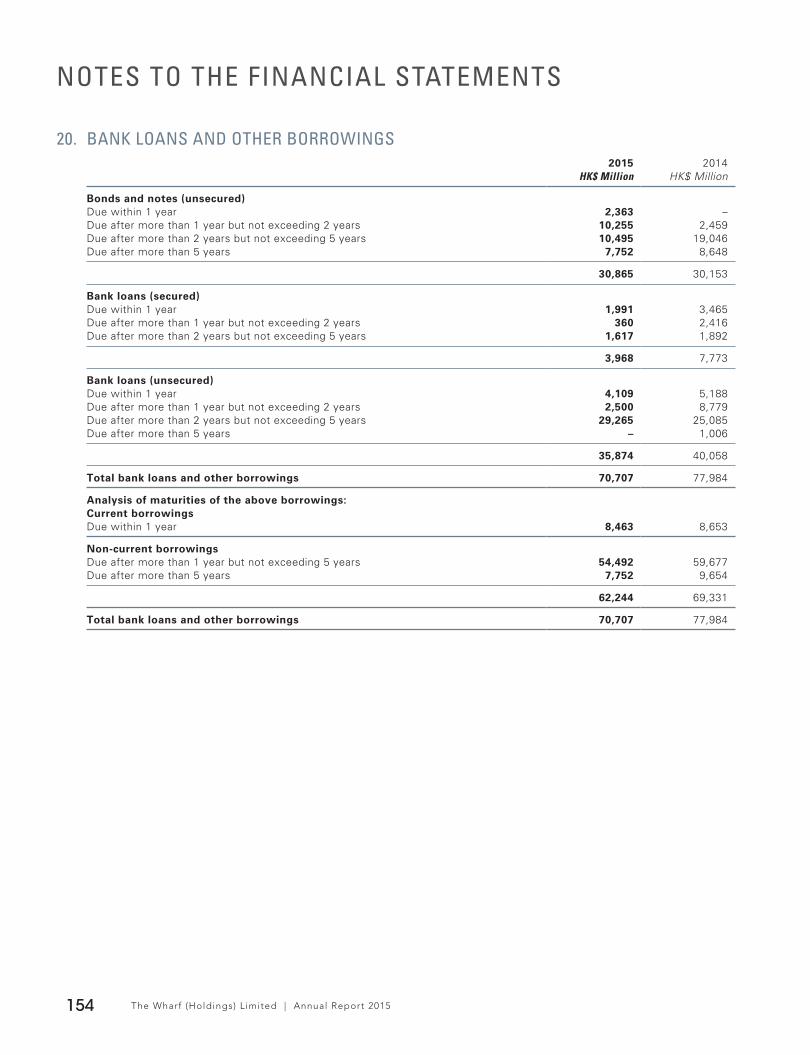
The Wharf (Holdings) L imited | Annual Report 2015154
NOTES TO THE FINANCIAL STATEMENTS
20. BANK LOANS AND OTHER BORROWINGS2015 2014
HK$ Million HK$ Million
Bonds and notes (unsecured)Due within 1 year 2,363 –Due after more than 1 year but not exceeding 2 years 10,255 2,459Due after more than 2 years but not exceeding 5 years 10,495 19,046Due after more than 5 years 7,752 8,648
30,865 30,153
Bank loans (secured)Due within 1 year 1,991 3,465Due after more than 1 year but not exceeding 2 years 360 2,416Due after more than 2 years but not exceeding 5 years 1,617 1,892
3,968 7,773
Bank loans (unsecured)Due within 1 year 4,109 5,188Due after more than 1 year but not exceeding 2 years 2,500 8,779Due after more than 2 years but not exceeding 5 years 29,265 25,085Due after more than 5 years – 1,006
35,874 40,058
Total bank loans and other borrowings 70,707 77,984
Analysis of maturities of the above borrowings:Current borrowingsDue within 1 year 8,463 8,653
Non-current borrowingsDue after more than 1 year but not exceeding 5 years 54,492 59,677Due after more than 5 years 7,752 9,654
62,244 69,331
Total bank loans and other borrowings 70,707 77,984

The Wharf (Holdings) L imited | Annual Report 2015 155
a. The Group’s borrowings are considered by the management to be denominated in the following currencies (after the effects of cross currency interest rate swaps and forward foreign exchange contracts arrangements as detailed in Note 23(b)):
2015 2014HK$ Million HK$ Million
HKD 68,579 29,366RMB 2,128 3,376USD – 41,670JPY – 3,572
70,707 77,984
b. The interest rate profile of the Group’s borrowings (after the effects of interest rate swaps and cross currency interest rate swaps as detailed in Notes 23(a) and (b)) were as follows:
2015 2014Effective
interest rateEffective
interest rate% HK$ Million % HK$ Million
Fixed rate borrowingsBonds and notes 3.0 3,787 3.0 3,809Bank loans 2.6 8,230 2.6 8,230
12,017 12,039
Floating rate borrowingsBonds and notes 3.0 27,078 3.0 26,344Bank loans 2.0 31,612 2.3 39,601
58,690 65,945
Total borrowings 70,707 77,984
c. All the interest bearing borrowings are carried at amortised cost except for loans in an amount of HK$15,145 million (2014: HK$14,095 million) which are carried at their fair values. None of the non-current interest bearing borrowings are expected to be settled within one year.
d. Included in the Group’s total loans are bank loans totalling HK$14,476 million (2014: HK$16,504 million) borrowed by certain subsidiaries in Mainland China, Modern Terminals, i-CABLE and Harbour Centre Development Limited. The loans are without recourse to the Company and its other subsidiaries.
e. As at 31 December 2015, certain banking facilities of the Group are secured by mortgages over certain properties under development, investment properties and property, plant and equipment with an aggregate carrying value of HK$24,278 million (2014: HK$39,863 million).
f. Certain of the above borrowings are attached with financial covenants which require that at any time, the consolidated tangible net worth is not less than and the ratio of borrowings to consolidated tangible net worth is not more than certain required levels of the relevant groups. During the year under review, all these covenants have been complied with by the Group.
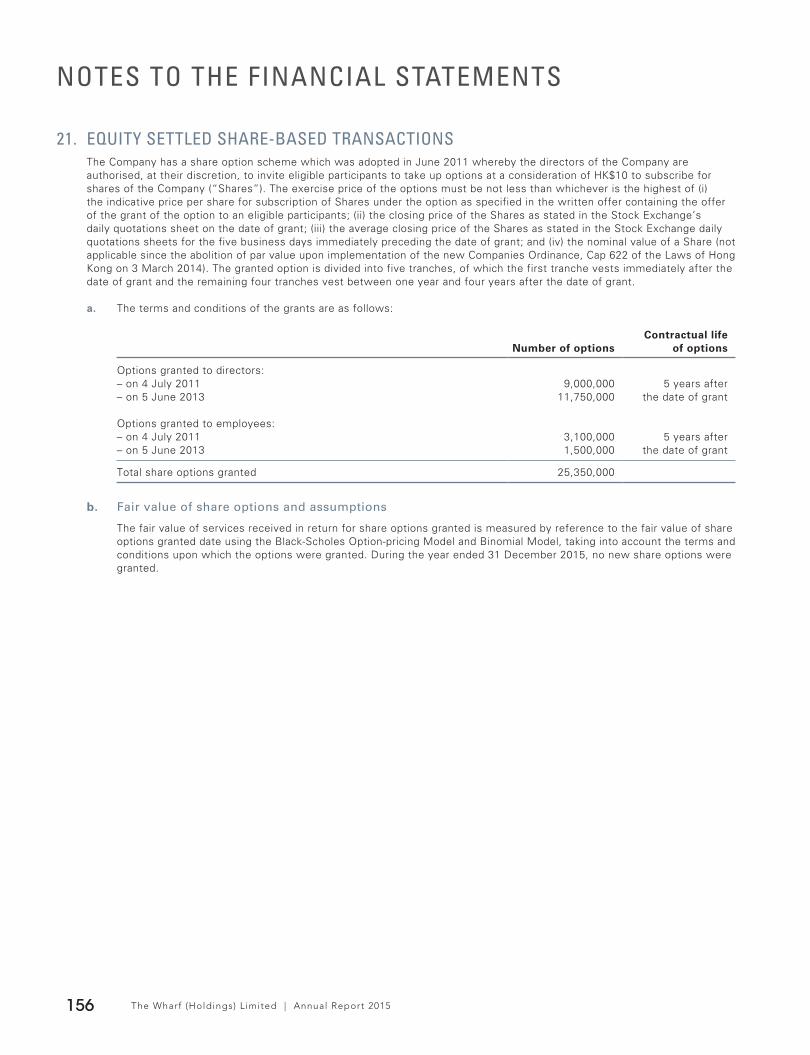
The Wharf (Holdings) L imited | Annual Report 2015156
NOTES TO THE FINANCIAL STATEMENTS
21. EQUITY SETTLED SHARE-BASED TRANSACTIONSThe Company has a share option scheme which was adopted in June 2011 whereby the directors of the Company are authorised, at their discretion, to invite eligible participants to take up options at a consideration of HK$10 to subscribe for shares of the Company (“Shares”). The exercise price of the options must be not less than whichever is the highest of (i) the indicative price per share for subscription of Shares under the option as specified in the written offer containing the offer of the grant of the option to an eligible participants; (ii) the closing price of the Shares as stated in the Stock Exchange’s daily quotations sheet on the date of grant; (iii) the average closing price of the Shares as stated in the Stock Exchange daily quotations sheets for the five business days immediately preceding the date of grant; and (iv) the nominal value of a Share (not applicable since the abolition of par value upon implementation of the new Companies Ordinance, Cap 622 of the Laws of Hong Kong on 3 March 2014). The granted option is divided into five tranches, of which the first tranche vests immediately after the date of grant and the remaining four tranches vest between one year and four years after the date of grant.
a. The terms and conditions of the grants are as follows:
Number of optionsContractual life
of options
Options granted to directors:– on 4 July 2011 9,000,000 5 years after– on 5 June 2013 11,750,000 the date of grant
Options granted to employees:– on 4 July 2011 3,100,000 5 years after– on 5 June 2013 1,500,000 the date of grant
Total share options granted 25,350,000
b. Fair value of share options and assumptions
The fair value of services received in return for share options granted is measured by reference to the fair value of share options granted date using the Black-Scholes Option-pricing Model and Binomial Model, taking into account the terms and conditions upon which the options were granted. During the year ended 31 December 2015, no new share options were granted.
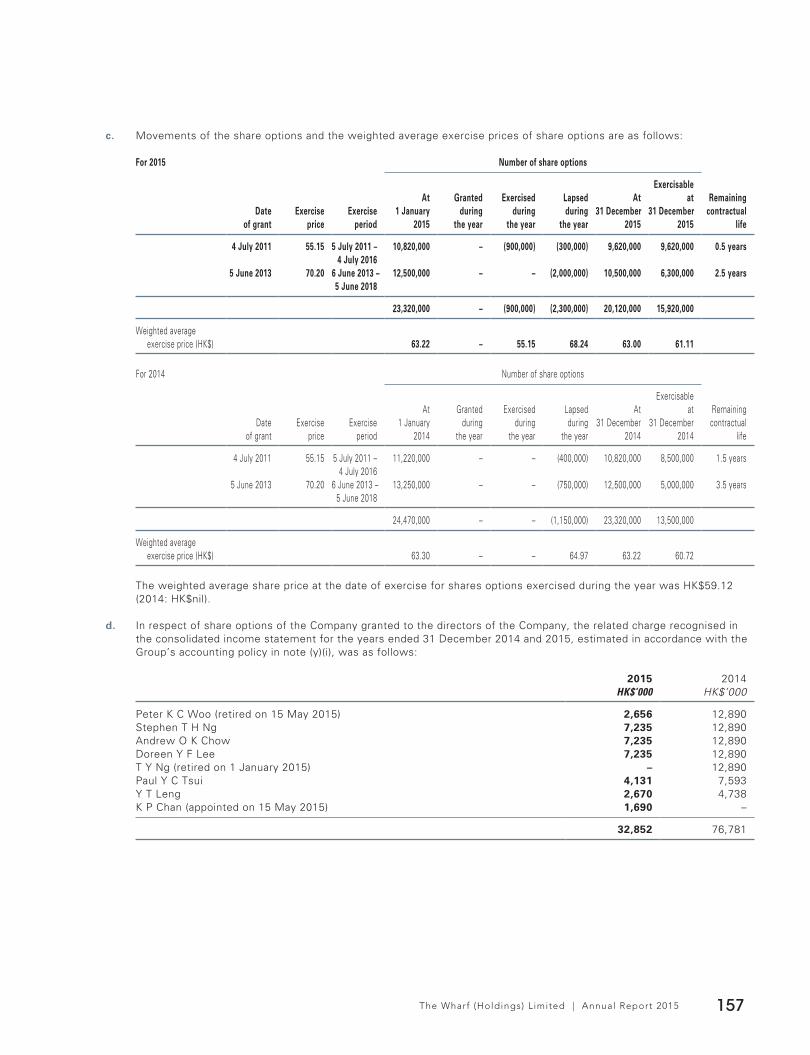
The Wharf (Holdings) L imited | Annual Report 2015 157
c. Movements of the share options and the weighted average exercise prices of share options are as follows:
For 2015 Number of share options
Date of grant
Exercise price
Exercise period
At 1 January
2015
Granted during
the year
Exercised during
the year
Lapsed during
the year
At 31 December
2015
Exercisable at
31 December 2015
Remaining contractual
life
4 July 2011 55.15 5 July 2011 – 4 July 2016
10,820,000 – (900,000) (300,000) 9,620,000 9,620,000 0.5 years
5 June 2013 70.20 6 June 2013 – 5 June 2018
12,500,000 – – (2,000,000) 10,500,000 6,300,000 2.5 years
23,320,000 – (900,000) (2,300,000) 20,120,000 15,920,000
Weighted average exercise price (HK$) 63.22 – 55.15 68.24 63.00 61.11
For 2014 Number of share options
Date of grant
Exercise price
Exercise period
At 1 January
2014
Granted during
the year
Exercised during
the year
Lapsed during
the year
At 31 December
2014
Exercisable at
31 December 2014
Remaining contractual
life
4 July 2011 55.15 5 July 2011 – 4 July 2016
11,220,000 – – (400,000) 10,820,000 8,500,000 1.5 years
5 June 2013 70.20 6 June 2013 – 5 June 2018
13,250,000 – – (750,000) 12,500,000 5,000,000 3.5 years
24,470,000 – – (1,150,000) 23,320,000 13,500,000
Weighted average exercise price (HK$) 63.30 – – 64.97 63.22 60.72
The weighted average share price at the date of exercise for shares options exercised during the year was HK$59.12 (2014: HK$nil).
d. In respect of share options of the Company granted to the directors of the Company, the related charge recognised in the consolidated income statement for the years ended 31 December 2014 and 2015, estimated in accordance with the Group’s accounting policy in note (y)(i), was as follows:
2015 2014HK$’000 HK$’000
Peter K C Woo (retired on 15 May 2015) 2,656 12,890Stephen T H Ng 7,235 12,890Andrew O K Chow 7,235 12,890Doreen Y F Lee 7,235 12,890T Y Ng (retired on 1 January 2015) – 12,890Paul Y C Tsui 4,131 7,593Y T Leng 2,670 4,738K P Chan (appointed on 15 May 2015) 1,690 –
32,852 76,781

The Wharf (Holdings) L imited | Annual Report 2015158
NOTES TO THE FINANCIAL STATEMENTS
22. DEFERRED TAXATIONa. Net deferred tax (assets)/liabilities recognised in the consolidated statement of financial position:
2015 2014HK$ Million HK$ Million
Deferred tax liabilities 10,748 10,425Deferred tax assets (700) (673)
Net deferred tax liabilities 10,048 9,752
The components of deferred tax (assets)/liabilities and the movements during the year are as follows:
Depreciation allowances in
excess of the related
depreciation
Surplus on investment properties Others
Future benefit of tax losses Total
HK$ Million HK$ Million HK$ Million HK$ Million HK$ Million
At 1 January 2014 2,644 6,976 (109) (602) 8,909Charged to the consolidated
income statement 255 543 (14) 78 862Acquisition of a subsidiary 3 – – – 3Exchange adjustment – (21) (1) – (22) At 31 December 2014 and 1 January 2015 2,902 7,498 (124) (524) 9,752Charged to the consolidated
income statement 270 488 (4) 25 779Exchange adjustment (39) (456) 11 1 (483)
At 31 December 2015 3,133 7,530 (117) (498) 10,048
b. Deferred tax assets not recognised
Deferred tax assets have not been recognised in respect of the following items:
2015 2014Deductible temporary
differences/ tax losses
Deferred tax assets
Deductible temporary
differences/ tax losses
Deferred tax assets
HK$ Million HK$ Million HK$ Million HK$ Million
Deductible temporary differences 446 111 552 137
Future benefit of tax losses– Hong Kong 4,481 739 3,970 655– Outside Hong Kong 3,110 778 3,208 802
7,591 1,517 7,178 1,457
8,037 1,628 7,730 1,594
The Group has not recognised the deferred tax assets attributable to the future benefit of tax losses sustained in the operations of certain subsidiaries as the availability of future taxable profits against which the assets can be utilised is uncertain at 31 December 2015. The tax losses arising from Hong Kong operations do not expire under current tax legislation. The tax losses arising from operations in Mainland China can be carried forward to offset against taxable profits of subsequent years for up to five years from the year in which they arose.
The Wharf (Holdings) L imited | Annual Report 2015 159
23. FINANCIAL RISK MANAGEMENT AND FAIR VALUESThe Group is exposed to financial risks related to interest rate, foreign currency, equity price, liquidity and credit in the normal course of business. To manage some of these risks, the Group Finance Committee develops, maintains and monitors the Group’s financial management policies designed to facilitate cost efficient funding to the Group and to mitigate the impact of fluctuations in interest rates and exchange rates. The financial management policies are implemented by the Group’s Treasury department, which operates as a centralised service unit in close co-operation with the Group’s operating units for managing the day-to-day treasury functions and financial risks and for providing cost efficient funding to the Group.
The Group uses derivatives, principally forward currency contracts and interest rate and cross currency interest rate swaps, as deemed appropriate, for financing and hedging transactions and for managing risks associated with the Group’s assets and liabilities. It is the Group’s policy not to enter into derivative transactions and invest in financial products with significant underlying leverage which are commercially speculative.
a. Interest rate risk
The Group’s main exposure to interest rate risk relates principally to the Group’s borrowings. Borrowings at variable rates expose the Group to cash flow interest rate risk whilst borrowings at fixed rate expose the Group to fair value interest rate risk. The Group manages its interest rate risk exposure in accordance with defined policies and reviews this exposure with a focus on reducing the Group’s overall cost of funding as well as maintaining to the floating/fixed rate mix appropriate to its current business portfolio.
In line with the Group’s prevailing strategy, the Group has entered into a number of interest rate swaps (“IRS”) and cross currency interest rate swaps (“CCS”) which have the economic effect of converting certain fixed rate interest bearing notes with notional amounts totalling HK$11,910 million (2014: HK$10,627 million) into floating rate borrowings. For each of the IRS and CCS entered into by the Group, the tenor and timing of the IRS and CCS cash flows matches those of the notes.
To ensure the certainty of a proportion of funding costs in the forthcoming years, the Group has entered into various floating-to-fixed IRS with notional amounts totalling HK$8,230 million with maturities of 10 to 15 years together with another HK$8,230 million fixed-to-floating IRS with a maturity of 2 years. Effectively, this arrangement has locked in fixed interest rates ranging from 2.1% to 3.6% per annum for a certain portion of the Group’s floating rate loan portfolio for a period of 8 to 13 years from 2011 to 2012 onwards.
As at 31 December 2015, after taking into account of IRS and CCS, approximately 83% (2014: 85%) of the Group’s borrowings were at floating rates and the remaining 17% (2014: 15%) were at fixed rates (see Note 20(b)).
Based on a sensitivity analysis performed as at 31 December 2015, it was estimated that a general increase/decrease of 1% (2014: 1%) in interest rates, with all other variables held constant, would have decreased/increased the Group’s post-tax profit and total equity by approximately HK$473 million (2014: HK$421 million). This takes into account the effect of interest bearing bank deposits.
The sensitivity analysis above indicates the instantaneous change in the Group’s post-tax profit and total equity that would have arisen assuming that the change in interest rates had occurred at the end of the reporting period and had been applied to re-measure those financial instruments held by the Group which expose the Group to fair value interest rate risk at the end of the reporting period. In respect of the exposure to cash flow interest rate risk arising from floating rate non-derivative instruments held by the Group at the end of the reporting period, the impact on the Group’s post-tax profit and total equity is estimated as an annualised impact on interest expense or income of such a change in interest rates. The analysis has been performed on the same basis as for 2014.
b. Foreign currency risk
The Group owns assets and conducts its businesses primarily in Hong Kong and secondarily in Mainland China, with its cash flows denominated substantially in HKD and RMB which exposes the Group to foreign currency risk with respect to RMB related to its property development and port-related operations and investments in Mainland China.
The Group is also exposed to foreign currency risk in respect of its borrowings denominated in USD, JPY and SGD. Anticipated foreign exchange payments relate primarily to interest expense payments, repayment of principal and capital expenditure. Where appropriate or available in a cost-efficient manner, the Group may enter into forward foreign exchange and swap contracts to manage its foreign currency risk arising from above anticipated transactions denominated in currencies other than its entities’ functional currencies.

The Wharf (Holdings) L imited | Annual Report 2015160
NOTES TO THE FINANCIAL STATEMENTS
The Group’s borrowings are predominantly denominated in the functional currency of the entity taking out the borrowings. In the case of group companies whose functional currencies are HKD, their borrowings are mostly denominated in HKD or USD. For managing the overall financing costs of existing and future capital requirements for the projects in Mainland China, the Group has adopted a diversified funding approach and has entered into certain cross currency interest rate swaps and forward foreign exchange contracts. Based on the prevailing accounting standards, the swaps and forward foreign exchange contracts are marked to market with the valuation movement recognised in the consolidated income statement.
The following table details the Group’s exposure at the end of the reporting period to currency risk arising from recognised assets/(liabilities) denominated in a currency other than the functional currency of the Group’s entities to which they relate. Differences resulting from the translation of the financial statements of foreign operations into the Group’s presentation currency and exposure arising from inter-company balances which are considered to be in the nature of investment in a subsidiary are excluded.
2015 2014USD RMB JPY SGD AUD USD RMB JPY SGD GBP AUD EURO
Million Million Million Million Million Million Million Million Million Million Million Million
The GroupBank deposits and cash 6 147 – – – 4 11 – – – – –Available-for-sale investments 203 – – – – 160 – – – – – –Trade and other receivables 7 – – – – 14 – – – 1 – –Trade and other payables (32) – (4) – (2) (36) (2) (4) – – (2) –Bank loans and other borrowings (3,279) (1,950) (11,955) (420) (110) (3,793) (1,650) (11,951) (420) – (110) –Inter-company balances 23 330 – (250) – 51 326 – (250) – – (8)
Gross exposure arising from recognised assets and liabilities (3,072) (1,473) (11,959) (670) (112) (3,600) (1,315) (11,955) (670) 1 (112) (8)
Notional amount of forward foreign exchange contracts– at fair value through profit or loss 4,636 – 52,764 – – (4,594) – 52,764 – – – –
Notional amount of cross currency IRS (938) 1,950 (40,764) 670 110 (899) 1,450 (40,764) 930 – 110 –Highly probable forecast purchases (82) – – – – (44) – – – – – –
Overall net exposure 544 477 41 – (2) (9,137) 135 45 260 1 (2) (8)
In addition, at 31 December 2015, the PRC subsidiaries of the Group with RMB as their functional currency are exposed to foreign currency risk with respect to HKD/USD by holding HKD/USD denominated bank deposits and cash, trade and other payables, bank loans and inter-company borrowings in the amount of HK$332 million, HK$8 million, HK$1,851 million and HK$328 million respectively (2014: HK$413 million, HK$13 million, HK$4,227 million and HK$555 million respectively).
Based on the sensitivity analysis performed on 31 December 2015. It was estimated that the impact on the Group’s post-tax profit and total equity would not be material in response to possible changes in the foreign exchange rates of foreign currencies to which the Group is exposed.
It is further analysed that the sensitivity on the translation of the Mainland operations from 1% increase/decrease of exchange rate of RMB against HKD, the Group’s total equity would have increased/decreased by HK$1,137 million (2014: HK$1,252 million).

The Wharf (Holdings) L imited | Annual Report 2015 161
c. Equity price risk
The Group is exposed to equity price changes arising from equity investments classified as available-for-sale investments.
Listed investments held in the available-for-sale portfolio have been chosen for their long term growth potential and returns and are monitored regularly for performance. Given that the volatility of the stock markets may not have a direct correlation with the Group’s investment portfolio, it is impractical to determine the impact that the changes in stock market indices would have on the Group’s portfolio of equity investments.
Based on a sensitivity analysis performed as at 31 December 2015, it is estimated that an increase/decrease of 10% in the market value of the Group’s listed available-for-sale investments, with all other variables held constant, would not have affected the Group’s post-tax profit unless there were impairments but would have increased/decreased the Group’s total equity by HK$808 million (2014: HK$371 million). The analysis has been performed on the same basis as for 2014.
d. Liquidity risk
The Group adopts a prudent liquidity risk management policy, maintaining sufficient reserves of cash and readily realisable marketable securities and adequate committed lines of funding with staggered maturities to reduce refinancing risk in any year from major financial institutions and to maintain flexibility for meeting its liquidity requirements in the short and longer term. The Group’s cash management is substantially centralised within the Group Treasury department, which regularly monitors the current and expected liquidity requirements and its compliance with lending covenants.
Certain non-wholly-owned subsidiaries are responsible for their own cash management, including the short term investment of cash surpluses with creditworthy financial institutions and the raising of loans to cover expected cash demands, in accordance with the established policies and strategies with the concurrence of the Company.
The following tables detail the remaining contractual maturities at the end of the reporting period of the Group’s derivative and non-derivative financial liabilities, which are based on contractual undiscounted cash flows (including interest payments computed using contractual rates or, if floating, based on rates at the end of the reporting period and carried at the exchange rates prevailing at the end of the reporting period) and the earliest date the Group can be required to pay:
Contractual undiscounted cash flow
Carrying amount Total
Within 1 year or on demand
More than 1 year
but less than 2 years
More than 2 years
but less than 5 years
More than 5 years
HK$ Million HK$ Million HK$ Million HK$ Million HK$ Million HK$ Million
At 31 December 2015Bank loans and other borrowings (70,707) (74,345) (7,443) (14,856) (43,460) (8,586)Trade and other payables (22,681) (22,681) (18,862) (2,091) (1,529) (199)Forward foreign exchange contracts (127) (127) (43) (14) (43) (27)Cross currency interest rate swaps (1,029) (501) (9) 123 (284) (331)Interest rate swaps (93) 48 (9) 48 (52) 61
(94,637) (97,606) (26,366) (16,790) (45,368) (9,082)
At 31 December 2014Bank loans and other borrowings (77,984) (78,265) (9,438) (13,069) (46,976) (8,782)Trade and other payables (23,664) (23,664) (20,204) (1,955) (1,267) (238)Forward foreign exchange contracts (347) (347) (315) (32) – –Cross currency interest rate swaps (559) 80 151 73 120 (264)Interest rate swaps (118) (543) (82) (89) (244) (128)Other derivatives 5 5 – 5 – –
(102,667) (102,734) (29,888) (15,067) (48,367) (9,412)
The Company is exposed to liquidity risk that arises from financial guarantees given by the Company on behalf of subsidiaries. The guarantees are callable if the respective subsidiary is unable to meet its obligations and the maximum amount callable as at 31 December 2015 was HK$64.8 billion (2014: HK$71.0 billion).
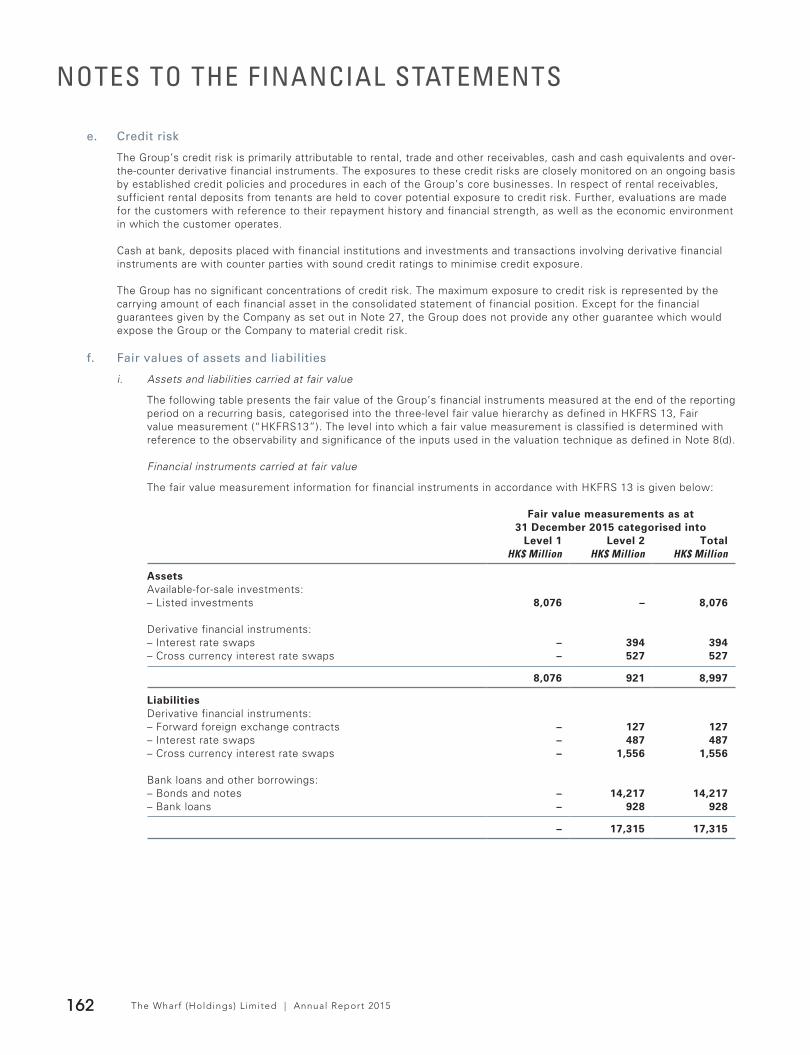
The Wharf (Holdings) L imited | Annual Report 2015162
NOTES TO THE FINANCIAL STATEMENTS
e. Credit risk
The Group’s credit risk is primarily attributable to rental, trade and other receivables, cash and cash equivalents and over-the-counter derivative financial instruments. The exposures to these credit risks are closely monitored on an ongoing basis by established credit policies and procedures in each of the Group’s core businesses. In respect of rental receivables, sufficient rental deposits from tenants are held to cover potential exposure to credit risk. Further, evaluations are made for the customers with reference to their repayment history and financial strength, as well as the economic environment in which the customer operates.
Cash at bank, deposits placed with financial institutions and investments and transactions involving derivative financial instruments are with counter parties with sound credit ratings to minimise credit exposure.
The Group has no significant concentrations of credit risk. The maximum exposure to credit risk is represented by the carrying amount of each financial asset in the consolidated statement of financial position. Except for the financial guarantees given by the Company as set out in Note 27, the Group does not provide any other guarantee which would expose the Group or the Company to material credit risk.
f. Fair values of assets and liabilities
i. Assets and liabilities carried at fair value
The following table presents the fair value of the Group’s financial instruments measured at the end of the reporting period on a recurring basis, categorised into the three-level fair value hierarchy as defined in HKFRS 13, Fair value measurement (“HKFRS13”). The level into which a fair value measurement is classified is determined with reference to the observability and significance of the inputs used in the valuation technique as defined in Note 8(d).
Financial instruments carried at fair value
The fair value measurement information for financial instruments in accordance with HKFRS 13 is given below:
Fair value measurements as at 31 December 2015 categorised into
Level 1 Level 2 TotalHK$ Million HK$ Million HK$ Million
AssetsAvailable-for-sale investments:– Listed investments 8,076 – 8,076
Derivative financial instruments:– Interest rate swaps – 394 394– Cross currency interest rate swaps – 527 527
8,076 921 8,997
LiabilitiesDerivative financial instruments:– Forward foreign exchange contracts – 127 127– Interest rate swaps – 487 487– Cross currency interest rate swaps – 1,556 1,556
Bank loans and other borrowings:– Bonds and notes – 14,217 14,217– Bank loans – 928 928
– 17,315 17,315

The Wharf (Holdings) L imited | Annual Report 2015 163
Fair value measurements as at 31 December 2014 categorised intoLevel 1 Level 2 Total
HK$ Million HK$ Million HK$ Million
AssetsAvailable-for-sale investments:– Listed investments 3,714 – 3,714
Derivative financial instruments:– Forward foreign exchange contracts – 81 81– Interest rate swaps – 499 499– Cross currency interest rate swaps – 583 583– Other derivatives 5 – 5
3,719 1,163 4,882
LiabilitiesDerivative financial instruments:– Forward foreign exchange contracts – 428 428– Interest rate swaps – 617 617– Cross currency interest rate swaps – 1,142 1,142
Bank loans and other borrowings:– Bonds and notes – 13,170 13,170– Bank loans – 925 925
– 16,282 16,282
During the years ended 31 December 2014 and 2015, there were no transfers of instruments between Level 1 and Level 2 or transfers into or out of Level 3.
The Group’s policy is to recognise transfers into and out of fair value hierarchy levels as at the end of the reporting period in which they occur.
Valuation techniques and inputs used in Level 2 fair value measurements:
The fair value of forward foreign exchange contracts in Level 2 is determined by using the forward exchange rates at the end of the reporting period and comparing them to the contractual rates.
The fair value of interest rate swaps and cross currency interest rate swaps in Level 2 is determined based on the amount that the Group would receive or pay to terminate the swaps at the end of the reporting period taking into account current interest rates and current creditworthiness of the swap counter-parties.
The fair values of bank loans and other borrowings in Level 2 is determined based on cash flows discounted using the Group’s current incremental borrowing rates for similar types of borrowings with maturities consistent with those remaining for the debt being valued.
ii. Assets and liabilities carried at other than fair value
The carrying amounts of the Group’s financial assets and liabilities carried at cost or amortised cost are not materially different from their fair values as at 31 December 2015 and 2014.

The Wharf (Holdings) L imited | Annual Report 2015164
NOTES TO THE FINANCIAL STATEMENTS
g. Capital management
The Group’s primary objective when managing capital is to safeguard the Group’s ability to continue as a going concern, to meet its financial obligations and continue to provide returns for shareholders and benefits for other stakeholders, by pricing products and services commensurately with the level of risk and by securing access to finance at a reasonable cost.
The Group actively and regularly reviews and manages its capital structure to maintain a balance between the higher shareholders’ returns that might be possible with higher levels of borrowings and the advantages and security afforded by a sound capital position, and makes adjustments to the capital structure in the light of changes in the Group’s business portfolio and economic conditions.
The Group monitors its capital structure by reviewing its net debt-to-equity ratios and cash flow requirements, taking into account of its future financial obligations and commitments. For this purpose, the Group defines net debt as total loans less bank deposits and cash. Shareholders’ equity comprises issued share capital and reserves attributable to equity shareholders of the Company. Total equity comprises shareholders’ equity and non-controlling interests.
The net debt-to-equity ratios as at 31 December 2015 and 2014 were as follows:
2015 2014HK$ Million HK$ Million
Bank loans and other borrowings (Note 20) 70,707 77,984Less: Bank deposits and cash (Note 17) (23,510) (18,725)
Net debt 47,197 59,259
Shareholders’ equity 307,728 305,495Total equity 317,180 314,111
Net debt-to-shareholders’ equity ratio 15.3% 19.4%Net debt-to-total equity ratio 14.9% 18.9%
Neither the Company nor any of its subsidiaries are subject to externally imposed capital requirements.
24. SHARE CAPITAL AND RESERVESa. Share capital
2015 No. of shares
2014 No. of shares 2015 2014
Million Million HK$ Million HK$ Million
Issued and fully paid ordinary sharesAt 1 January 3,030 3,030 29,376 3,030Transfer to no-par value regime on 3 March 2014 – – – 26,346Shares issued under the share option scheme 1 – 65 –
At 31 December 3,031 3,030 29,441 29,376
The transition to the no-par value regime under the Hong Kong Companies Ordinance (Cap. 622) occurred automatically on 3 March 2014. On that date, the share premium account and any capital redemption reserve were subsumed into share capital in accordance with section 37 of Schedule 11 to the Ordinance. These changes did not impact on the number of shares in issue or the relative entitlement of any of the shareholders. Since that date, all changes in share capital have been made in accordance with the requirements of Parts 4 and 5 of the Ordinance. The holders of ordinary shares are entitled to receive dividends as declared from time to time and are entitled to one vote per share at meetings of the Company. All ordinary shares rank equally with regard to the Company’s residual assets.

The Wharf (Holdings) L imited | Annual Report 2015 165
b. The Group’s equity, apart from share capital and other statutory capital reserves, includes investments revaluation reserves for dealing with the movements on revaluation of available-for-sale investments, other capital reserves for dealing with the grant date fair value of the granted unexercised share options in accordance with accounting policy note (y)(i) and the exchange reserves mainly for dealing with the exchange differences arising from the translation of the financial statements of foreign operations in accordance with the accounting policy note (r).
The revenue reserves of the Group at 31 December 2015 included HK$1,382 million (2014: HK$934 million) in respect of statutory reserves of the subsidiaries in Mainland China.
The reconciliation between the opening and closing balances of each component of the Group’s consolidated equity is set out in the consolidated statement of changes in equity.
The Company’s equity and the details of the changes in the individual components between the beginning and the end of the year are set out below:
Share capital
Share premium
Capital redemption
reserve
Other capital
reservesRevenue reserves Total
HK$ Million HK$ Million HK$ Million HK$ Million HK$ Million HK$ Million
The CompanyAt 1 January 2014 3,030 26,339 7 344 29,894 59,614Profit – – – – 10,216 10,216Equity settled share-based payments – – – 84 – 84Share option lapse – – – (11) – (11)Redemption of convertible bonds – – – (99) 99 –2013 second interim dividend paid – – – – (3,636) (3,636)2014 first interim dividend paid – – – – (1,667) (1,667)Transition to no-par value regime on
3 March 2014 26,346 (26,339) (7) – – – At 31 December 2014 and 1 January 2015 29,376 – – 318 34,906 64,600Profit – – – – 12,147 12,147Shares issued under the share option scheme 65 – – (15) – 50Equity settled share-based payments – – – 40 – 40Share option lapse – – – (28) – (28)2014 second interim dividend paid – – – – (3,819) (3,819)2015 first interim dividend paid – – – – (1,667) (1,667)
At 31 December 2015 29,441 – – 315 41,567 71,323
c. Reserves of the Company available for distribution to equity shareholders of the Company as at 31 December 2015 amounted to HK$41,567 million (2014: HK$34,906 million).
d. After the end of the reporting period, the Directors declared a second interim dividend of HK$1.35 per share (2014: second interim dividend of HK$1.26 per share) amounting to HK$4,092 million based on 3,031 million issued ordinary shares (2014: HK$3,819 million based on 3,031 million issued ordinary shares). This dividend has not been recognised as a liability at the end of the reporting period.

The Wharf (Holdings) L imited | Annual Report 2015166
NOTES TO THE FINANCIAL STATEMENTS
25. COMPANY LEVEL–STATEMENT OF FINANCIAL POSITION2015 2014
Note HK$ Million HK$ Million
Non-current assetsInterest in subsidiaries 91,927 88,697Amount due from an associate 371 371
92,298 89,068Current assetsReceivables 2 8Bank deposits and cash 23 2
25 10
Total assets 92,323 89,078
Current liabilitiesPayables (51) (45)Amounts due to subsidiaries (20,416) (23,900)Amount due to an associate (533) (533)
(21,000) (24,478)
NET ASSETS 71,323 64,600
Capital and reservesShare capital 24 29,441 29,376Reserves 41,882 35,224
TOTAL EQUITY 71,323 64,600
Stephen T H Ng Paul Y C TsuiChairman & Managing Director Vice Chairman & Group Chief Financial Officer

The Wharf (Holdings) L imited | Annual Report 2015 167
26. MATERIAL RELATED PARTIES TRANSACTIONSTransactions between the Company and its subsidiaries have been eliminated on consolidation. Material transactions between the Group and other related parties during the year ended 31 December 2015 are as follows:
a. In respect of the year ended 31 December 2015, the Group earned rental income totalling HK$1,199 million (2014: HK$1,143 million) from various tenants which are wholly or partly owned by companies which in turn are wholly-owned by the family interests of close family members of, or by a trust the settlor of which is a close family member of, the chairman of the Company’s ultimate holding company. Such transactions are considered to be related party transactions, of which HK$1,050 million (2014: HK$998 million) also constitute connected transactions as defined under the Listing Rules.
b. Remuneration for key management personnel of the Group, including amounts paid to the Directors of the Company and the five highest paid employees are disclosed in Notes 2(b) and 2(c).
In addition to the above transactions, details of the Group’s amounts due from and to related parties are disclosed in Notes 10 and 11.
27. CONTINGENT LIABILITIESAs at 31 December 2015, there were contingent liabilities in respect of guarantees given by the Company on behalf of subsidiaries relating to overdrafts, short term loans and credit facilities, bonds and notes of up to HK$75,027 million (2014: HK$79,339 million). There were also contingent liabilities in respect of guarantees given by the Company on behalf of joint ventures and associates of HK$9,401 million (2014: HK$9,914 million) of which HK$8,494 million (2014: HK$9,259 million) had been drawn.
As at 31 December 2015, there were guarantees of HK$8,883 million (2014: HK$7,839 million) provided by the Group to the banks in favour of their customers in respect of the mortgage loans provided by the banks to those customers for the purchase of the Group’s development properties. There were also mortgage loan guarantees of HK$1,428 million (2014: HK$1,228 million) provided by joint ventures and associates of the Group to the banks in favour of their customers.
The Group and the Company have not recognised any deferred income of the above guarantees for subsidiaries, joint ventures and associates as their fair value cannot be reliably measured and their transaction price was HK$Nil.
As at the end of the reporting period, the Directors do not consider it is probable that a claim will be made against the Group and the Company under any of the guarantees.

The Wharf (Holdings) L imited | Annual Report 2015168
NOTES TO THE FINANCIAL STATEMENTS
28. COMMITMENTSThe Group’s outstanding commitments as at 31 December 2015 are detailed as below:–
a. Planned expenditure
2015 2014Committed Uncommitted Total Committed Uncommitted Total
HK$ Million HK$ Million HK$ Million HK$ Million HK$ Million HK$ Million
(I) PropertiesInvestment propertiesHong Kong 2,027 477 2,504 1,598 1,011 2,609Mainland China 8,714 5,144 13,858 6,221 9,909 16,130
10,741 5,621 16,362 7,819 10,920 18,739
Development propertiesHong Kong 459 – 459 1,123 – 1,123Mainland China 11,800 16,289 28,089 12,520 25,325 37,845
12,259 16,289 28,548 13,643 25,325 38,968
Properties totalHong Kong 2,486 477 2,963 2,721 1,011 3,732Mainland China 20,514 21,433 41,947 18,741 35,234 53,975
23,000 21,910 44,910 21,462 36,245 57,707
(II) Non-propertiesHotels 1,999 235 2,234 173 2,042 2,215Modern Terminals 150 24 174 277 16 293Wharf T&T 119 50 169 106 109 215i-CABLE 25 245 270 5 208 213
2,293 554 2,847 561 2,375 2,936
Total 25,293 22,464 47,757 22,023 38,620 60,643
i. Properties commitments are mainly for construction costs to be incurred in the forthcoming years and HK$1.2 billion (2014: HK$0.7 billion) attributable land costs payable by 2016.
ii. The expenditure for development properties included attributable amounts for developments undertaken by joint ventures and associates of HK$136 million (2014: HK$479 million) in Hong Kong and of HK$11,350 million (2014: HK$14,910 million) in Mainland China.
b. In addition to the above, the CME segment is committed to programming and other expenditure totalling HK$734 million (2014: HK$836 million) with HK$670 million (2014: HK$766 million) being authorised and contracted for.
c. The Group leases a number of properties and telecommunication network facilities under operating leases. The leases typically run for an initial period of two to fifteen years, with an option to renew each lease upon expiry when all terms are renegotiated. Lease payments are usually increased annually to reflect market rentals. None of the leases includes contingent rentals. Total operating leases commitments are detailed as below:–
2015 2014HK$ Million HK$ Million
Expenditure for operating leasesWithin one year 50 52After one year but within five years 97 127Over five years 24 33
171 212

The Wharf (Holdings) L imited | Annual Report 2015 169
29. CHANGES IN ACCOUNTING POLICIESThe HKICPA has issued certain amendments to Hong Kong Financial Reporting Standards (“HKFRSs”) which are first effective for the current accounting period of the Group.
Annual Improvements to HKFRSs 2010 – 2012 CycleAnnual Improvements to HKFRSs 2011 – 2013 Cycle
The amendments do not have a significant impact on the Group’s results and financial position for the current or prior periods have been prepared or presented.
The Group has not applied any new standard or interpretation that is not yet effective for the current accounting period.
The “Principal accounting policies” set out on pages 170 to 182 summarise the accounting policies of the Group after the adoption of these policies to the extent that they are relevant to the Group.
30. FUTURE CHANGES IN ACCOUNTING POLICIESUp to the date of issue of these financial statements, the HKICPA has issued a number of amendments and new standards which are not yet effective for the year ended 31 December 2015 and which have not been adopted in these financial statements. These include the following which may be relevant to the Group.
Effective for accounting periodsbeginning on or after
Annual improvements to HKFRSs 2012 – 2014 cycle 1 January 2016Amendments to HKFRS 10 and HKAS 28, Sales or contribution of assets
between an investor and its associate or joint venture 1 January 2016Amendments to HKFRS 11, Accounting for acquisitions of interests in joint operations 1 January 2016Amendments to HKAS 1, Disclosure initiative 1 January 2016Amendments to HKAS 16 and HKAS 38, Clarification of acceptable methods of
depreciation and amortisation 1 January 2016HKFRS 15, Revenue from contracts with customers 1 January 2018HKFRS 9, Financial instruments 1 January 2018
The adoption of the amendments is not expected to have any material impact of the Group’s consolidated financial statements. The Group is in the process of making an assessment of the impact of HKFRS 9 and HKFRS 15.
31. EVENTS AFTER THE REPORTING PERIODAfter the end of the reporting period the Directors declared a second interim dividend. Further details are disclosed in Note 6.
32. PARENT AND ULTIMATE HOLDING COMPANYThe Directors consider the parent and ultimate holding company at 31 December 2015 to be Wheelock and Company Limited, which is incorporated and listed in Hong Kong. Wheelock and Company Limited produces financial statements available for public use.
33. APPROVAL OF THE FINANCIAL STATEMENTSThe financial statements were approved and authorised for issue by the Directors on 9 March 2016.
PRINCIPAL ACCOUNTING POLICIES
The Wharf (Holdings) L imited | Annual Report 2015170
a. Statement of compliance
These financial statements have been prepared in accordance with all applicable Hong Kong Financial Reporting Standards (“HKFRSs”), which collective term includes all applicable individual Hong Kong Financial Reporting Standards, Hong Kong Accounting Standards (“HKASs”) and Interpretations issued by the Hong Kong Institute of Certified Public Accountants (“HKICPA”), accounting principles generally accepted in Hong Kong and the requirements of the Hong Kong Companies Ordinance. These financial statements also comply with the applicable disclosure provisions of the Rules Governing the Listing of Securities on The Stock Exchange of Hong Kong Limited. A summary of the principal accounting policies adopted by the Group is set out below.
The HKICPA has issued certain new and revised HKFRSs that are first effective or available for early adoption for the current accounting period of the Group and the Company. Note 29 to the financial statements provides information on any changes in accounting policies resulting from initial application of these developments to the extent that they are relevant to the Group for the current and prior accounting periods reflected in these financial statements.
b. Basis of preparation of the financial statements
The consolidated financial statements made up to 31 December comprise the Company and its subsidiaries (together referred to as the “Group”) and the Group’s interest in associates and joint ventures.
The measurement basis used in the preparation of the financial statements is the historical cost basis except where stated otherwise in the accounting policies set out below.
The preparation of financial statements in conformity with HKFRSs requires management to make judgements, estimates and assumptions that affect the application of policies and reported amounts of assets, liabilities, income and expenses. The estimates and associated assumptions are based on historical experience and various other factors that are believed to be reasonable under the circumstances, the results of which form the basis of making the judgements about carrying values of assets and liabilities that are not readily apparent from other sources. Actual results may differ from these estimates.
The estimates and underlying assumptions are reviewed on an ongoing basis. Revisions to accounting estimates are recognised in the period in which the estimate is revised if the revision affects only that period, or in the period of the revision and future periods if the revision affects both current and future periods.
Judgements made by management in the application of HKFRSs that have significant effect on the financial statements and major sources of estimation uncertainty are discussed in note (z).
c. Basis of consolidation
i. Subsidiaries and non-controlling interests
Subsidiaries are entities controlled by the Group. The Group controls an entity when it is exposed, or has rights, to variable returns from its involvement with the entity and has the ability to affect those returns through its power over the entity. When assessing whether the Group has power, only substantive rights (held by the Group and other parties) are considered.
An investment in a subsidiary is consolidated into the consolidated financial statements from the date that control commences until the date that control ceases. Intra-group balances and transactions and cash flows, and any unrealised profits arising from intra-group transactions, are eliminated in full in preparing the consolidated financial statements. Unrealised losses resulting from intra-group transactions are eliminated in the same way as unrealised gains, but only to the extent that there is no evidence of impairment.
Non-controlling interests represent the equity in a subsidiary not attributable directly or indirectly to the Company, and in respect of which the Group has not agreed any additional terms with the holders of those interests which would result in the Group as a whole having a contractual obligation in respect of those interests that meets the definition of a financial liability. For each business combination, the Group can elect to measure any non-controlling interests either at fair value or at the non-controlling interest’s proportionate share of the subsidiary’s net identifiable assets.
Non-controlling interests are presented in the consolidated statement of financial position within equity, separately from equity attributable to the equity shareholders of the Company. Non-controlling interests in the results of the Group are presented on the face of the consolidated income statement and the consolidated statement of comprehensive income as an allocation of the total profit or loss and total comprehensive income for the year between non-controlling interests and the equity shareholders of the Company. Loans from holders of non-controlling interests and other contractual obligations towards these holders are presented as financial liabilities in the consolidated statement of financial position in accordance with notes (o) or (p) depending on the nature of the liability.

The Wharf (Holdings) L imited | Annual Report 2015 171
Changes in the Group’s interests in a subsidiary that do not result in a loss of control are accounted for as equity transactions, whereby adjustments are made to the amounts of controlling and non-controlling interests within consolidated equity to reflect the change in relative interests, but no adjustments are made to goodwill and no gain or loss is recognised.
When the Group loses control of a subsidiary, it is accounted for as a disposal of the entire interest in that subsidiary, with a resulting gain or loss being recognised in profit or loss. Any interest retained in that former subsidiary at the date when control is lost is recognised at fair value and this amount is regarded as the fair value on initial recognition of a financial asset (see note (f)) or, when appropriate, the cost on initial recognition of an investment in an associate or joint venture (see note (c)(ii)).
In the Company’s statement of financial position, an investment in a subsidiary is stated at cost less impairment losses.
ii. Associates and joint ventures
An associate is an entity in which the Group or Company has significant influence, but not control or joint control, over its management, including participation in the financial and operating policy decisions.
A joint venture is an arrangement whereby the Group or Company and other parties contractually agree to share control of the arrangement and have rights to the net assets of the arrangement.
An investment in an associate or a joint venture is accounted for in the consolidated financial statements under the equity method, unless it is classified as held for sale (or included in a disposal group that is classified as held for sale). Under the equity method, the investment is initially recorded at cost, adjusted for any excess of the Group’s share of the acquisition-date fair values of the investee’s identifiable net assets over the cost of the investment (if any). Thereafter, the investment is adjusted for the post acquisition change in the Group’s share of the investee’s net assets and any impairment loss relating to the investment (see notes (c)(iii) and (k)). Any acquisition-date excess over cost, the Group’s share of the post-acquisition, post-tax results of the investees and any impairment losses for the year are recognised in the consolidated income statement, whereas the Group’s share of the post-acquisition post-tax items of the investees’ other comprehensive income is recognised in the consolidated statement of comprehensive income. Adjustments are made on consolidation to the financial information of associates and joint ventures where necessary to ensure consistency with the accounting policies adopted by the Group.
When the Group’s share of losses exceeds its interest in an associate or a joint venture, the Group’s interest is reduced to nil and recognition of further losses is discontinued except to the extent that the Group has incurred legal or constructive obligations or made payments on behalf of the investee. For this purpose, the Group’s interest in the associate or joint venture is the carrying amount of the investment under the equity method together with the Group’s long-term interests that, in substance, form part of the Group’s net investment in the associate or joint venture.
Unrealised profits and losses resulting from transactions between the Group and its associates and joint ventures are eliminated to the extent of the Group’s interest in the investee, except where unrealised losses provide evidence of an impairment of the asset transferred, in which case they are recognised immediately in the consolidated income statement.
If an investment in an associate becomes an investment in a joint venture or vice versa, the retained interest is not remeasured. Instead, the investment continues to be accounted for under the equity method.
In all other cases, when the Group ceases to have significant influence over an associate or joint control over a joint venture, it is accounted for as a disposal of the entire interest in that investee, with a resulting gain or loss being recognised in profit or loss. Any interest retained in that former investee at the date when significant influence or joint control is lost is recognised at fair value and this amount is regarded as the fair value on initial recognition of a financial asset (see note (f)).
In the individual Company’s statement of financial position, investments in associates and joint ventures are stated at cost less impairment losses.
iii. Goodwill
Goodwill represents the excess of
(a) the aggregate of the fair value of the consideration transferred, the amount of any non-controlling interest in the acquiree and the fair value of the Group’s previously held equity interest in the acquiree; over
(b) the net fair value of the acquiree’s identifiable assets and liabilities measured as at the acquisition date.
When (b) is greater than (a), then this excess is recognised immediately in profit or loss as a gain on a bargain purchase.
PRINCIPAL ACCOUNTING POLICIES
The Wharf (Holdings) L imited | Annual Report 2015172
Goodwill is stated at cost less accumulated impairment losses. Goodwill arising on a business combination is allocated to each cash-generating unit, or groups of cash generating units, that is expected to benefit from the synergies of the combination and is tested annually for impairment (note (k)).
On disposal of a cash generating unit during the year, any attributable amount of purchased goodwill is included in the calculation of the profit or loss on disposal.
d. Investment properties and property, plant and equipment
i. Investment properties
Investment properties are land and/or buildings which are owned or held under a leasehold interest to earn rental income and/or for capital appreciation. These include land held for a currently undetermined future use and property that is being constructed or developed for future use as investment property.
Investment properties are stated in the statement of financial position at fair value, unless they are still in the course of construction or development at the end of the reporting period and their fair value cannot be reliably measured at that time. Investment properties under development are stated at cost less impairment (see note (k)) if the fair value cannot be measured reliably. Any gain or loss arising from a change in fair value or from the retirement or disposal of an investment property is recognised in the consolidated income statement. Rental income from investment properties is accounted for as described in note (s)(i).
When the Group holds a property interest under an operating lease to earn rental income and/or for capital appreciation, the interest is classified and accounted for as an investment property on a property-by-property basis. Any such property interest which has been classified as an investment property is accounted for as if it were held under a finance lease, and the same accounting policies are applied to that interest as are applied to other investment properties leased under finance leases. Lease payments are accounted for as described in note (i).
ii. Hotel and club properties
Hotel and club properties are stated at cost less accumulated depreciation and impairment losses. Hotel properties under development are stated at cost less impairment losses.
iii. Broadcasting and communications equipment
Broadcasting and communications equipment is stated at cost less accumulated depreciation and impairment losses. Cost includes materials, direct labour and an appropriate proportion of overheads and borrowing costs directly attributable to the acquisition, construction or production of such equipment which necessarily takes a substantial period of time to get ready for its intended use.
iv. Other property, plant and equipment held for own use
Other property, plant and equipment held for own use is stated at cost less accumulated depreciation and impairment losses.
v. Gains or losses arising from the retirement or disposal of an item of property, plant and equipment are determined as the difference between the net disposal proceeds and the carrying amount of the asset and are recognised in the consolidated income statement on the date of retirement or disposal.
e. Depreciation of property, plant and equipment
Depreciation is calculated to write-off the cost of items of property, plant and equipment, less their estimated residual value, if any, using a straight line method over their estimated useful lives as follows:
i. Investment properties
No depreciation is provided on investment properties.
ii. Hotel and club properties
Depreciation is provided on the cost of the leasehold land of hotel and club properties over the unexpired period of the lease. Costs of buildings thereon are depreciated on a straight line basis over their estimated useful lives of not more than 40 years.
Depreciation of hotel properties under development commences when they are available for use.

The Wharf (Holdings) L imited | Annual Report 2015 173
iii. Broadcasting and communications equipment
Depreciation is provided on a straight line basis on the cost of the equipment at rates determined by the estimated useful lives of the assets of 2 to 20 years.
iv. Other property, plant and equipment held for own use
Depreciation is provided on the cost of the leasehold land of all other properties held for own use over the unexpired period of the lease. Costs of the buildings thereon are depreciated on a straight line basis over their unexpired period of leases or estimated useful live whichever is shorter.
Depreciation is provided on a straight line basis on the cost of other property, plant and equipment held for own use at rates determined by the estimated useful lives of these assets of 3 to 25 years.
Where parts of an item of property, plant and equipment have different useful lives, the cost or valuation of the item is allocated on a reasonable basis between the parts and each part is depreciated separately. Both the useful life of an asset and its residual value, if any, are reviewed annually.
f. Investments in debt and equity securities
The Group’s and the Company’s policies for investments in debt and equity securities, other than investments in subsidiaries, associates and joint ventures, are as follows:
Investments in debt and equity securities (other than investments in subsidiaries, associates and joint ventures) are initially stated at fair value, which is their transaction price unless it is determined that the fair value at initial recognition differs from the transaction price and that fair value is evidenced by a quoted price in an active market for an identical asset or liability or based on a valuation technique that uses only data from observable markets. Cost includes attributable transaction costs, except where indicated otherwise below. These investments are subsequently accounted for as follows, depending on their classification.
Investments in securities held for trading are classified as current assets. Any attributable transaction costs are recognised in the consolidated income statement as incurred. At the end of each reporting period the fair value is remeasured, with any resultant gain or loss being recognised in the consolidated income statement. The net gain or loss recognised in the consolidated income statement does not include any dividends or interest earned as these are recognised in accordance with the policies set out in notes (s)(iv) and (v).
Dated debt securities that the Group and/or the Company has the positive ability and intention to hold to maturity are classified as held-to-maturity securities. Held-to-maturity securities are stated in the statement of financial position at amortised cost less impairment losses.
Investments in securities which do not fall into any of the above categories are classified as available-for-sale securities. At the end of each reporting period the fair value is remeasured, with any resultant gain or loss being recognised in other comprehensive income and accumulated separately in equity in the investments revaluation reserve. As an exception to this, investments in equity securities that do not have a quoted price in an active market for an identical instrument and whose fair value cannot otherwise be reliably measured are recognised in the statement of financial position at cost less impairment losses (see note (k)). Dividend income from equity securities and interest income from debt securities calculated using the effective interest method are recognised in profit or loss in accordance with the policies set out in note (s)(iv) and (v), respectively. Foreign exchange gains and losses resulting from changes in the amortised cost of debt securities are also recognised in profit or loss.
When the investments are derecognised or impaired (see note (k)), the cumulative gain or loss recognised in equity is reclassified to profit or loss. Investments are recognised/derecognised on the date the Group commits to purchase/sell the investments or they expire.
g. Derivative financial instruments
Derivative financial instruments are recognised initially at fair value. At the end of each reporting period, the fair value is remeasured. The gain or loss on remeasurement to fair value is recognised immediately in profit or loss, except where the derivatives qualify for cash flow hedge accounting or hedge the net investment in a foreign operation, in which case recognition of any resultant gain or loss depends on the nature of the item being hedged (note (h)).
PRINCIPAL ACCOUNTING POLICIES
The Wharf (Holdings) L imited | Annual Report 2015174
h. Hedging
i. Fair value hedge
A fair value hedge is a hedge of the exposure to changes in fair value of a recognised asset or liability or an unrecognised firm commitment, or an identified portion of such an asset, liability or firm commitment, that is attributable to a particular risk and could affect the consolidated income statement. The gain or loss from remeasuring the hedging instrument at fair value together with the gain or loss on the hedged item attributable to the hedged risk are recorded in the consolidated income statement.
ii. Cash flow hedge
Where a derivative financial instrument is designated as a hedge of the variability in cash flows of a recognised asset or liability or a highly probable forecast transaction or the foreign currency risk of a committed future transaction, the effective portion of any gain or loss on remeasurement of the derivative financial instrument to fair value is recognised directly in other comprehensive income and accumulated separately in equity. The ineffective portion of any gain or loss is recognised immediately in the profit or loss.
If a hedge of a forecast transaction subsequently results in the recognition of a non-financial asset or non-financial liability, the associated gain or loss is reclassified from equity to be included in the initial cost or other carrying amount of the non-financial asset or liability.
If a hedge of a forecast transaction subsequently results in the recognition of a financial asset or a financial liability, the associated gain or loss is reclassified from equity to the consolidated income statement in the same period or periods during which the asset acquired or liability assumed affects the consolidated income statement (such as when interest income or expense is recognised).
For cash flow hedges, other than those covered by the preceding two policy statements, the associated gain or loss is reclassified from equity to the consolidated income statement in the same period or periods during which the hedged forecast transaction affects profit or loss.
When a hedging instrument expires or is sold, terminated or exercised, or the Group revokes designation of the hedge relationship but the hedged forecast transaction is still expected to occur, the cumulative gain or loss at that point remains in equity until the transaction occurs and it is recognised in accordance with the above policy. If the hedged transaction is no longer expected to take place, the cumulative unrealised gain or loss is reclassified from equity to the consolidated income statement immediately.
iii. Hedge of net investment in a foreign operation
The portion of the gain or loss on remeasurement to fair value of an instrument used to hedge a net investment in a foreign operation that is determined to be an effective hedge is recognised directly in other comprehensive income and accumulated separately in equity in the exchange reserve until the disposal of the foreign operation, at which time the cumulative gain or loss is reclassified from equity to the consolidated income statement. The ineffective portion is recognised immediately in profit or loss.
i. Leased assets
An arrangement comprising a transaction or a series of transactions is or contains a lease if the Group determines that the arrangement conveys a right to use a specific asset or assets for an agreed period of time in return for a payment or a series of payments. Such a determination is made based on an evaluation of the substance of the arrangement and is regardless of whether the arrangement takes the legal form of a lease.
i. Classification of leased assets
Assets that are held by the Group under leases which transfer to the Group substantially all the risks and rewards of ownership are classified as being held under finance leases. Leases which do not transfer substantially all the risks and rewards of ownership to the Group are classified as operating leases, with the following exceptions:
– property held under operating leases that would otherwise meet the definition of an investment property is classified as an investment property on a property-by-property basis and, if classified as an investment property, is accounted for as if held under a finance lease (see note (d)(i)); and
– land held for own use under an operating lease, the fair value of which cannot be measured separately from the fair value of a building situated thereon at the inception of the lease, is accounted for as being held under a finance lease, unless the building is also clearly held under an operating lease. For these purposes, the inception of the lease is the time that the lease was first entered into by the Group, or taken over from the previous lessee.
The Wharf (Holdings) L imited | Annual Report 2015 175
ii. Assets held under operating leases
Where the Group has the use of assets held under operating leases, payments made under the leases are charged to profit or loss in equal instalments over the accounting periods covered by the lease term, except where an alternative basis is more representative of the pattern of benefits to be derived from the leased asset. Lease incentives received are recognised in profit or loss as an integral part of the aggregate net lease payments made. Contingent rentals are charged to profit or loss in the accounting period in which they are incurred.
The cost of acquiring land held under an operating lease is amortised on a straight-line basis over the period of the lease term except where the property is classified as an investment property or is held for development for sale.
iii. Assets held under finance leases
Where the Group acquires the use of assets under finance leases, the amounts representing the fair value of the leased asset, or, if lower, the present value of the minimum lease payments, of such assets are included in recognised as property, plant and equipment and the corresponding liabilities, net of finance charges, are recorded as obligations under finance leases. Depreciation is provided at rates which write off the cost or valuation of the assets over the term of the relevant lease or, where it is likely the Group will obtain ownership of the asset, the life of the asset, as set out in note (e). Impairment losses are accounted for in accordance with the accounting policy as set out in note (k). Finance charges implicit in the lease payments are charged to profit or loss over the period of the leases so as to produce an approximately constant periodic rate of charge on the remaining balance of the obligations for each accounting period. Contingent rentals are charged to profit or loss in the accounting period in which they are incurred.
j. Programming library
Programming library consists of presentation rights for commissioned programmes and acquired programmes for showing on the Group’s television channel and commissioned programmes and films for licensing purposes.
Presentation rights are stated in the statement of financial position at cost less accumulated amortisation (where the estimated useful life is other than indefinite) and any impairment losses. Amortisation is charged to profit or loss on an accelerated basis over the licence period or over the estimated number of future showings. Subsequent expenditure on programmes after initial acquisition is recognised as an expense when incurred. Costs of in-house programmes are written-off in the period in which they are incurred.
Commissioned programmes and films for licensing purposes comprise direct production costs and production overheads and are stated at the lower of amortised cost or net realisable value. Costs are amortised on an individual programme/film basis in the ratio of the current year’s gross revenues to management’s forecast of the total ultimate gross revenues from all sources.
Both the period and method of amortisation are reviewed annually.
k. Impairment of assets
i. Impairment of investments in debt and equity securities and other receivables
Investments in debt and equity securities and other current and non-current receivables that are stated at cost or amortised cost or are classified as available-for-sale investments are reviewed at each of the end of the reporting period to determine whether there is objective evidence of impairment. If any such evidence exists, any impairment loss is determined and recognised as follows:
– For investments in associates and joint ventures accounted for under the equity method in the consolidated financial statements (see note (c)(ii)), the impairment loss is measured by comparing the recoverable amount of the investment with its carrying amount in accordance with note (k)(ii). The impairment loss is reversed if there has been a favourable change in the estimates used to determine the recoverable amount in accordance with note (k)(ii).
– For unquoted equity securities and other financial assets carried at cost, the impairment loss is measured as the difference between the carrying amount of the financial asset and the estimated future cash flows, discounted at the current market rate of return for a similar financial asset where the effect of discounting is material. Impairment losses arising on equity securities carried at cost are not reversed.
PRINCIPAL ACCOUNTING POLICIES
The Wharf (Holdings) L imited | Annual Report 2015176
– For trade and other current receivables and other financial assets carried at amortised cost, the impairment loss is measured as the difference between the asset’s carrying amount and the present value of estimated future cash flows, discounted at the financial asset’s original effective interest rate (i.e. the effective interest rate computed at initial recognition of these assets) where the effect of discounting is material.
If in a subsequent period the amount of an impairment loss decreases and the decrease can be linked objectively to an event occurring after the impairment loss was recognised, the impairment loss is reversed through profit or loss. A reversal of an impairment loss shall not result in the asset’s carrying amount exceeding that which would have been determined had no impairment loss been recognised in prior years.
– For available-for-sale investments, the cumulative loss that has been recognised directly in the investments revaluation reserve is reclassified to profit or loss. The amount of the cumulative loss that is recognised in the consolidated income statement is the difference between the acquisition cost (net of any principal repayment and amortisation) and current fair value, less any impairment loss on that asset previously recognised in profit or loss.
Impairment losses recognised in profit or loss in respect of available-for-sale equity investments are not reversed through profit or loss. Any subsequent increase in the fair value of such assets is recognised directly in other comprehensive income.
Impairment losses in respect of available-for-sale debt securities are reversed if the subsequent increase in fair value can be objectively related to an event occurring after the impairment loss was recognised. Reversals of impairment losses in such circumstances are recognised in profit or loss.
Impairment losses are written off against the corresponding assets directly, except for impairment losses recognised in respect of trade receivables whose recovery is considered doubtful but not remote. In this case, the impairment losses for doubtful debts are recorded using an allowance account. When the Group is satisfied that recovery is remote, the amount considered irrecoverable is written off against trade receivables directly and any amounts held in the allowance account relating to that debt are reversed. Subsequent recoveries of amounts previously charged to the allowance account are reversed against the allowance account. Other changes in the allowance account and subsequent recoveries of amounts previously written off directly are recognised in the consolidated income statement.
ii. Impairment of other assets
The carrying amounts of non-current assets, other than properties carried at revalued amounts and deferred tax assets, are reviewed at the end of each reporting period to determine whether there is any indication of impairment. If any such indication exists, the recoverable amount is estimated. In addition, for goodwill, intangible assets that are not yet available for use and intangible assets that have indefinite useful lives, the recoverable amount is estimated annually whether or not there is any indication of impairment.
– Calculation of recoverable amountThe recoverable amount of an asset is the greater of its fair value less costs of disposal and value in use. In assessing value in use, the estimated future cash flows are discounted to their present value using a pre-tax discount rate that reflects current market assessments of the time value of money and the risks specific to the asset. Where an asset does not generate cash inflows largely independent of those from other assets, the recoverable amount is determined for the smallest group of assets that generates cash inflows independently (i.e. a cash-generating unit).
– Recognition of impairment lossesAn impairment loss is recognised in profit or loss if the carrying amount of an asset, or the cash-generating unit to which it belongs, exceeds the recoverable amount. Impairment losses recognised in respect of cash-generating units are allocated first to reduce the carrying amount of any goodwill allocated to the cash-generating unit (or group of units) and then, to reduce the carrying amount of the other assets in the unit (or group of units) on a pro rata basis, except that the carrying value of an asset will not be reduced below its individual fair value less costs of disposal (if measurable), or value in use (if determinable).
– Reversals of impairment lossesIn respect of assets other than goodwill, an impairment loss is reversed if there has been a favourable change in the estimates used to determine the recoverable amount. An impairment loss in respect of goodwill is not reversed (including those provided during the interim financial reporting).
A reversal of an impairment loss is limited to the asset’s carrying amount that would have been determined had no impairment loss been recognised in prior years. Reversals of impairment losses are credited to profit or loss in the year in which the reversals are recognised.
The Wharf (Holdings) L imited | Annual Report 2015 177
– Interim financial reporting and impairmentUnder the Rules Governing the Listing of Securities on The Stock Exchange of Hong Kong Limited, the Group is required to prepare an interim financial report in compliance with HKAS 34, Interim financial reporting, in respect of the first six months of the financial year. At the end of the interim period, the Group applies the same impairment testing, recognition, and reversal criteria as it would at the end of the financial year.
Impairment losses recognised in an interim period in respect of goodwill, available-for-sale equity securities and unquoted equity securities carried at cost are not reversed in a subsequent period. This is the case even if no loss, or a smaller loss, would have been recognised had the impairment been assessed only at the end of the financial year to which the interim period relates. Consequently, if the fair value of an available-for-sale equity security increases in the remainder of the annual period, or in any other period subsequently, the increase is recognised in other comprehensive income and not profit or loss.
l. Properties for sale
i. Completed properties for sale
Completed properties for sale are stated at the lower of cost and net realisable value. Cost is determined by apportionment of the total development costs, including borrowing costs capitalised, attributable to unsold units. Net realisable value is estimated by the management, based on prevailing market conditions which represents the estimated selling price less costs to be incurred in selling the property. Cost of completed properties for sale comprises all costs of purchase, costs of conversion and costs incurred in bringing the inventories to their present location and condition.
The amount of any write down of or provision for properties held for sale is recognised as an expense in the period the write down or loss occurs. The amount of any reversal of any write down or provision arising from an increase in net realisable value is recognised in the consolidated income statement in the period in which the reversal occurs.
ii. Properties under development for sale
Properties under development for sale are classified as current assets and stated at the lower of cost and net realisable value. Cost includes identified costs including the acquisition cost of land, aggregate cost of development, borrowing costs capitalised, material and supplies, wages, other direct expenses and an appropriate proportion of overheads. Net realisable value is estimated by management, taking into account the expected price that can ultimately be achieved, based on prevailing market conditions and the anticipated costs of completion and costs to be incurred in selling the property.
The amount of any write down of or provision for properties under development for sale is recognised as an expense in the period the write down or loss occurs. The amount of any reversal of any write down or provision arising from an increase in net realisable value is recognised in the consolidated income statement in the period in which the reversal occurs.
m. Inventories
Inventories are stated at the lower of cost and net realisable value. Cost comprises all costs of purchase, cost of conversion and other costs incurred in bringing the inventories to their present location and condition. Net realisable value is estimated by the management, based on the expected selling price in the ordinary course of business less the anticipated costs of completion and the estimated costs necessary to make the sale.
n. Trade and other receivables
Trade and other receivables are initially recognised at fair value and thereafter stated at amortised cost less allowance for impairment of bad and doubtful debts, except where the receivables are interest-free loans made to related parties without any fixed repayment terms or the effect of discounting would be immaterial. In such cases, the receivables are stated at cost less allowance for impairment of bad and doubtful debts.
o. Interest-bearing borrowings
Interest-bearing borrowings for which there is a hedging relationship with a derivative financial instrument, which does not qualify for hedge accountings are initially recognised at fair value less transaction costs. At the end of each reporting period the fair value is remeasured and any change in fair value is recognised in the consolidated income statement.
Other interest-bearing borrowings are initially recognised at fair value less transaction costs. Subsequent to initial recognition, the interest-bearing borrowings are stated at amortised cost with any difference between the amount initially recognised and redemption value being recognised in the consolidated income statement over the period of the borrowings together with any interest and fees payable using the effective interest method.

PRINCIPAL ACCOUNTING POLICIES
The Wharf (Holdings) L imited | Annual Report 2015178
p. Trade and other payables
Trade and other payables are initially recognised at fair value and subsequently stated at amortised cost unless the effect of discounting would be immaterial, in which case they are stated at cost.
q. Cash and cash equivalents
Cash and cash equivalents comprise cash at bank and on hand, demand deposits with banks and other financial institutions and short-term, highly liquid investments that are readily convertible into known amounts of cash and which are subject to an insignificant risk of changes in value, having been within three months of maturity at acquisition. Bank overdrafts that are repayable on demand and form an integral part of the Group’s cash management are also included as a component of cash and cash equivalents for the purpose of the consolidated statement of cash flows.
r. Foreign currencies
Foreign currency transactions during the year are translated into Hong Kong dollars at the exchange rates ruling at the transaction dates. Monetary foreign currency balances and the statements of financial position of foreign operations are translated into Hong Kong dollars at the exchange rates ruling at the end of the reporting period. Non-monetary assets and liabilities denominated in foreign currencies that are stated at fair value are translated using the foreign exchange rates ruling at the dates the fair value was measured.
The results of foreign operations are translated into Hong Kong dollars at the monthly weighted average exchange rates for the year. Statement of financial position items, including goodwill arising on consolidation of foreign operations acquired on or after 1 January 2005, are translated into Hong Kong dollars at the closing foreign exchange rates at the end of the reporting period. Differences arising from the translation of the financial statements of foreign operations are recognised in other comprehensive income and accumulated separately in equity in the exchange reserve and those arising from the financing of properties under development by foreign currency borrowings are capitalised as part of the development costs. All other exchange differences are dealt with in the consolidated income statement.
On disposal of a foreign operation, the cumulative amount of the exchange differences recognised in equity which relate to that foreign operation is reclassified from equity to the consolidated income statement and is included in the calculation of the profit or loss on disposal.
s. Recognition of revenue
Revenue is measured at the fair value of the consideration received or receivable. Provided it is probable that the economic benefits will flow to the Group and the revenue and costs, if applicable, can be measured reliably, revenue is recognised in the consolidated income statement as follows:
i. Rental income under operating leases is recognised in equal instalments over the accounting periods covered by the lease term, except where an alternative basis is more representative of the pattern of benefits to be derived from the use of the leased asset. Lease incentives granted are recognised as an integral part of the aggregate net lease payments receivable. Contingent rentals are recognised in the accounting period in which they are earned.
ii. Income arising from the sale of properties held for sale is recognised upon the later of the execution of the formal sale and purchase agreement and the issue of occupation permit/completion certificate by the relevant government authorities, which is taken to be the point in time when the risks and rewards of ownership of the property have passed to the buyer. Deposits and instalments received on properties sold prior to the date of revenue recognition are included in the statement of financial position.
iii. Income from communications, media and entertainment operations, logistics operations and hotels operations is recognised at the time when the services are provided.
iv. Dividend income from unlisted investments is recognised when the shareholder’s right to receive payment is established.
Dividend income from listed investments is recognised when the share price of the investment goes ex-dividend.
v. Interest income is recognised as it accrues using the effective interest method.
vi. Income received in advance attributable to long term service contracts is deferred and recognised over the contract period on a straight line basis.

The Wharf (Holdings) L imited | Annual Report 2015 179
t. Borrowing costs
Borrowing costs that are directly attributable to the acquisition, construction or production of an asset which necessarily takes a substantial period of time to get ready for its intended use or sale are capitalised as part of the cost of that asset. Other borrowing costs are expensed in the period in which they incurred.
The capitalisation of borrowing costs as part of the cost of a qualifying asset commences when expenditure for the asset is being incurred, borrowing costs are being incurred and activities that are necessary to prepare the asset for its intended use or sale are in progress. Capitalisation of borrowing costs is suspended or ceases when substantially all the activities necessary to prepare the qualifying asset for its intended use or sale are interrupted or complete.
u. Income tax
i. Income tax for the year comprises current tax and movements in deferred tax assets and liabilities. Current tax and movements in deferred tax assets and liabilities are recognised in the consolidated income statement except to the extent that they relate to items recognised in other comprehensive income or directly in equity, in which case the relevant amounts of tax are recognised in other comprehensive income or directly in equity, respectively.
ii. Current tax is the expected tax payable on the taxable income for the year, using tax rates enacted or substantively enacted at the end of the reporting period, and any adjustment to tax payable in respect of previous years.
iii. Deferred tax assets and liabilities arise from deductible and taxable temporary differences between the carrying amounts of assets and liabilities for financial reporting purposes and the tax bases respectively. Deferred tax assets also arise from unused tax losses and unused tax credits.
Apart from certain limited exceptions, all deferred tax liabilities and all deferred tax assets, to the extent that it is probable that future taxable profits will be available against which the asset can be utilised, are recognised. Future taxable profits that may be capable to support the recognition of deferred tax assets arising from deductible temporary differences include those that will arise from the reversal of existing taxable temporary differences.
The limited exceptions to recognition of deferred tax assets and liabilities are those temporary differences arising from goodwill not deductible for tax purposes and the initial recognition of assets or liabilities that affect neither accounting nor taxable profit (provided that they are not part of a business combination).
Where investment properties are carried at their fair value in accordance with the accounting policy set out in note (d)(i), the amount of deferred tax recognised is measured using the tax rates that would apply on sale of those assets at their carrying value at the reporting period unless the property is depreciable and is held within a business model whose objective is to consume substantially all of the economic benefits embodied in the property over time, rather than through sale. In all other cases, the amount of deferred tax recognised is measured based on the expected manner of realisation or settlement of the carrying amount of the assets and liabilities, using tax rates enacted or substantively enacted at the end of the reporting period. Deferred tax assets and liabilities are not discounted.
The carrying amount of a deferred tax asset is reviewed at each of reporting period and is reduced to the extent that it is no longer probable that sufficient taxable profits will be available to allow the related tax benefit to be utilised. Any such reduction is reversed to the extent that it becomes probable that sufficient taxable profits will be available.
Additional income taxes that will probably arise from the distribution of dividends are recognised when the related dividends are likely to be payable in the foreseeable future.
iv. Current tax balances and deferred tax balances, and movements therein, are presented separately from each other and are not offset. Current tax assets are offset against current tax liabilities and deferred tax assets against deferred tax liabilities if, and only if, the Group has the legally enforceable right to set off current tax assets against current tax liabilities.
v. Related parties
i. A person, or a close member of that person’s family, is related to the Group if that person:
(a) has control or joint control over the Group;
(b) has significant influence over the Group; or
(c) is a member of the key management personnel of the Group or the Group’s parent.
PRINCIPAL ACCOUNTING POLICIES
The Wharf (Holdings) L imited | Annual Report 2015180
ii. An entity is related to the Group if any of the following conditions applies:
(a) The entity and the Group are members of the same Group (which means that each parent, subsidiary and fellow subsidiary is related to the others).
(b) One entity is an associate or joint venture of the other entity (or an associate or a joint venture of a member of a Group of which the other entity is a member).
(c) Both entities are joint ventures of the same third party.
(d) One entity is a joint venture of a third entity and the other entity is an associate of the third entity.
(e) The entity is a post-employment benefit plan for the benefit of employees of either the Group or an entity related to the Group.
(f) The entity is controlled or jointly controlled by a person identified in (i).
(g) A person identified in (i)(a) has significant influence over the entity or is a member of the key management personnel of the entity (or of a parent of the entity).
(h) The entity, or any member of a Group of which it is a part, provides key management personnel services to the Group or to the Group’s parent.
w. Financial guarantees issued, provisions and contingent liabilities
i. Financial guarantees issued
Financial guarantees are contracts that require the issuer (i.e. the guarantor) to make specified payments to reimburse the beneficiary of the guarantee (the “holder”) for a loss the holder incurs because a specified debtor fails to make payment when due in accordance with the terms of a debt instrument.
Where the Group issues a financial guarantee, the fair value of the guarantee is initially recognised as deferred income within trade and other payables. The fair value of financial guarantees issued at the time of issuance is determined by reference to fees charged in an arm’s length transaction for similar services, when such information is obtainable, or is otherwise estimated by reference to interest rate differentials, by comparing the actual rates charged by lenders when the guarantee is made available with the estimated rates that lenders would have charged, had the guarantees not been available, where reliable estimates of such information can be made. Where consideration is received or receivable for the issuance of the guarantee, the consideration is recognised in accordance with the Group’s policies applicable to that category of asset. Where no such consideration is received or receivable, an immediate expense is recognised in profit or loss on initial recognition of any deferred income.
ii. Other provisions and contingent liabilities
Provisions are recognised for other liabilities of uncertain timing or amount when the Group or the Company has a legal or constructive obligation arising as a result of a past event, it is probable that an outflow of economic benefits will be required to settle the obligation and a reliable estimate can be made. Where the time value of money is material, provisions are stated at the present value of the expenditure expected to settle the obligation.
Where it is not probable that an outflow of economic benefits will be required, or the amount cannot be estimated reliably, the obligation is disclosed as a contingent liability, unless the probability of outflow of economic benefits is remote. Possible obligations, whose existence will only be confirmed by the occurrence or nonoccurrence of one or more future events are also disclosed as contingent liabilities unless the probability of outflow of economic benefits is remote.
x. Segment reporting
Operating segments, and the amounts of each segment item reported in the financial statements, are identified from the financial information provided regularly to the Group’s top management for the purposes of allocating resources to, and assessing the performance of, the Group’s various lines of business and geographical locations.
Individually material operating segments are not aggregated for financial reporting purposes unless the segments have similar economic characteristics and are similar in respect of the nature of products and services, the nature of production processes, the type or class of customers, the methods used to distribute the products or provide the services, and the nature of the regulatory environment. Operating segments which are not individually material may be aggregated if they share a majority of these criteria.

The Wharf (Holdings) L imited | Annual Report 2015 181
y. Employee benefits
i. Shared based payments
The fair value of share options granted to employees is recognised as an employee cost with a corresponding increase in a capital reserve within equity. The fair value is measured at grant date using the Black-Scholes Option-pricing Model and Binomial Model, taking into account the terms and conditions upon which the options were granted. Where the employees have to meet vesting conditions before becoming unconditionally entitled to the options, the total estimated fair value of the share options is spread over the vesting period, taking into account the probability that the options will vest.
During the vesting period, the number of share options that is expected to vest is reviewed. Any resulting adjustment to the cumulative fair value recognised in prior years is charged/credited to the consolidated income statement for the year of the review, unless the original employee expenses qualify for recognition as an asset, with a corresponding adjustment to the capital reserve. On vesting date, the amount recognised as an expense is adjusted to reflect the actual number of options that vest (with a corresponding adjustment to the capital reserve) except where forfeiture is only due to not achieving vesting conditions that relate to the market price of the Company’s shares. The equity amount is recognised in the capital reserve until either the option is exercised (when it is transferred to the other statutory capital reserves) or the option expires (when it is released directly to revenue reserves).
ii. Employee benefits and contributions to defined contribution retirement plans
Short-term employee benefits, including salaries, annual bonuses, paid annual leave, leave passage, contributions to defined contribution retirement plans and the cost of non-monetary benefits are accrued in the year in which the associated services are rendered by employees of the Group. Where payment or settlement is deferred and the effect would be material, these amounts are stated at their present values.
z. Significant accounting estimates and judgements
Note 23 contain information about the assumptions and their risk relating to financial instruments. Other key sources of estimation uncertainty are as follows:
– Valuation of investment properties
Investment properties are included in the statement of financial position at their market value, unless they are still in the course of construction or development at the end of the reporting period and their fair value cannot be reliably determined at that time. The market value of investment properties is assessed annually by independent qualified valuers, after taking into consideration the net income allowing for reversionary potential and redevelopment potential of the properties.
The assumptions adopted in the property valuations are based on the market conditions existing at the end of the reporting period, with reference to current market sales prices and the appropriate capitalisation rate.
– Assessment of the useful economic lives for depreciation of property, plant and equipment
In assessing the estimated useful lives of property, plant and equipment, management takes into account factors such as the expected usage of the asset by the Group based on past experience, the expected physical wear and tear (which depends on operational factors), technical obsolescence arising from changes or improvements in production or from a change in the market demand for the product or service output of the asset. The estimation of the useful life is a matter of judgement based on the experience of the Group.
Management reviews the useful lives of property, plant and equipment annually and if expectations are significantly different from previous estimates of useful economic lives, the useful lives and, therefore, the depreciation rate for the future periods will be adjusted accordingly.
– Assessment of impairment of non-current assets
Management assesses the recoverable amount of each asset based on its value in use (using relevant rates) or on its net selling price (by reference to market prices), depending upon the anticipated future plans for the asset. Estimating the value in use of an asset involves estimating the future cash inflows and outflows to be derived from continuing use of the asset and from its ultimate disposal and applying the appropriate discount rate to these future cash flows. Cash flow projections for the remaining useful life of the asset and the most recent financial budgets/forecasts are approved by management.
PRINCIPAL ACCOUNTING POLICIES
The Wharf (Holdings) L imited | Annual Report 2015182
– Assessment of provision for properties for sale
Management determines the net realisable value of properties for sale by using (i) prevailing market data such as most recent sale transactions and market survey reports available from independent property valuers; and (ii) internal estimates of costs based on quotes by suppliers.
Management’s assessment of the net realisable value of properties under development for sale requires the application of a risk-adjusted discount rate to estimate future discounted cash flows to be derived from the properties under development for sale. These estimates require judgement as to the anticipated sale prices by reference to recent sale transactions in nearby locations, rate of new property sales, marketing costs (including price discounts required to stimulate sales) and the expected costs to completion of properties, the legal and regulatory framework and general market conditions. The Group’s estimates may be inaccurate and estimates may need to be adjusted in later periods.
– Recognition of deferred tax assets
The recognition of deferred tax assets requires formal assessment by the Group of the future profitability of related operations. In making this judgement, the Group evaluates, amongst other factors, the forecast financial performance, changes in technology and operational and financing cashflows.

PRINCIPAL SUBSIDIARIES, ASSOCIATES AND JOINT VENTURES
The Wharf (Holdings) L imited | Annual Report 2015 183
At 31 December 2015
SubsidiariesPlace of incorporation/operation
Issued ordinary share capital/registered and paid up capital
Percentage of equity
attributable to shareholders Principal activities
Properties# Wharf Estates Limited Hong Kong HK$2 divided into 2 shares 100 Holding company
Harbour City Estates Limited Hong Kong HK$330,100,000 divided into 20,000 shares
100 Property
Wharf Realty Limited Hong Kong HK$2 divided into 2 shares 100 PropertyTimes Square Limited Hong Kong HK$20 divided into 2 shares 100 PropertyPlaza Hollywood Limited Hong Kong HK$10,000,000 divided into
10,000,000 shares100 Property
Ridge Limited Hong Kong HK$10,000 divided into 10,000 shares
100 Property
# Wharf Development Limited Hong Kong HK$7,000,000,000 divided into 7,000,000,000 shares
100 Holding company
Wharf Peak Properties Limited Hong Kong HK$30,000,000 divided into 3,000,000 shares
100 Property
Hong Tai Yuen Limited Hong Kong HK$500,000 divided into 500,000 shares
100 Property
Olinda Limited Hong Kong HK$20 divided into 2 shares 100 PropertyNew Tech Centre Limited Hong Kong HK$10,000 divided into
10,000 shares100 Property
# Wharf China Holdings Limited British Virgin Islands 5,129,000,000 US$1 shares 100 Holding companyWharf China Estates Limited British Virgin Islands 1,000,000 US$1 shares 100 Holding company
iii Shanghai Long Xing Property Development Company Limited The People’s Republic of China US$45,000,000 100 Propertyii Dalian Times Square Development Company Limited The People’s Republic of China RMB200,000,000 100 Propertyii Long Qing Property Development (Chongqing) Company Limited The People’s Republic of China RMB223,533,440 100 Propertyi Shanghai Wheelock Square Development Limited The People’s Republic of China US$240,000,000 98 Propertyii 龍昌綜合開發(成都)有限公司 The People’s Republic of China HK$330,000,000 100 Propertyii 龍錦綜合開發(成都)有限公司 The People’s Republic of China US$2,377,000,000 100 Propertyii 成都時代奧特萊斯商業有限公司 The People’s Republic of China HK$170,000,000 100 Propertyii 長沙時代奧特萊斯商業有限公司 The People’s Republic of China US$40,000,000 100 Propertyii 九龍倉(長沙)置業有限公司 The People’s Republic of China US$1,192,000,000 100 Propertyii 龍潤房地產開發(成都)有限公司 The People’s Republic of China RMB20,000,000 100 Property
Wharf China Development Limited British Virgin Islands 1,000,000 US$1 shares 100 Holding companyii 漢龍實業綜合開發(武漢)有限公司 The People’s Republic of China US$33,100,000 100 Propertyii 九龍倉(武漢)置業有限公司 The People’s Republic of China US$165,000,000 100 Propertyiii 上海九洲物業發展有限公司 The People’s Republic of China US$3,500,000 85 Propertyi 上海龍申房地產發展有限公司 The People’s Republic of China US$22,330,000 55 Propertyii 上海莉源房地產開發有限公司 The People’s Republic of China US$745,000,000 100 Propertyii 上海萊源房地產開發有限公司 The People’s Republic of China US$155,000,000 100 Propertyii 上海清源房地產開發有限公司 The People’s Republic of China US$220,000,000 100 Propertyii 九龍倉(無錫)置業有限公司 The People’s Republic of China US$307,580,000 100 Propertyii 龍茂房地產開發(成都)有限公司 The People’s Republic of China HK$26,000,000 100 Propertyii 龍悅房地產開發(成都)有限公司 The People’’s Republic of China US$240,000,000 100 Propertyii 龍嘉房地產開發(成都)有限公司 The People’’s Republic of China HK$537,500,000 100 Propertyii 蘇州蘇龍地產發展有限公司 The People’s Republic of China US$166,800,000 100 Propertyii 蘇州瑞龍地產發展有限公司 The People’s Republic of China US$187,000,000 100 Propertyii 蘇州銀龍地產發展有限公司 The People’s Republic of China US$274,000,000 100 Propertyii 無錫港龍置業有限公司 The People’s Republic of China US$140,900,000 100 Propertyii 無錫河畔置業有限公司 The People’s Republic of China US$111,400,000 100 Propertyii 無錫都會置業有限公司 The People’s Republic of China US$144,600,000 100 Propertyii 港盈房地產(杭州)有限公司 The People’s Republic of China US$146,990,000 100 Propertyii 九龍倉(杭州)置業有限公司 The People’s Republic of China US$310,000,000 100 Propertyii 堡盈房地產(杭州)有限公司 The People’s Republic of China US$320,000,000 100 Propertyii 錦興房地產開發(杭州)有限公司 The People’s Republic of China US$126,000,000 100 Propertyii 洋立房地產(杭州)有限公司 The People’s Republic of China HK$418,000,000 100 Propertyii 望華房地產(杭州)有限公司 The People’s Republic of China HK$1,080,000,000 100 Propertyii 富景房地產開發(富陽)有限公司 The People’s Republic of China US$106,000,000 100 Propertyii 常州湖畔置業有限公司 The People’s Republic of China US$180,000,000 100 Propertyii 常州河畔置業有限公司 The People’s Republic of China US$69,300,000 100 Propertyii 寧波立成置業有限公司 The People’s Republic of China US$172,000,000 100 Property

At 31 December 2015
PRINCIPAL SUBSIDIARIES, ASSOCIATES AND JOINT VENTURES
The Wharf (Holdings) L imited | Annual Report 2015184
SubsidiariesPlace of incorporation/operation
Issued ordinary share capital/registered and paid up capital
Percentage of equity
attributable to shareholders Principal activities
* Harbour Centre Development Limited Hong Kong HK$3,641,350,047 divided into 708,750,000 shares
71 Holding company
i 蘇州高龍房產發展有限公司 The People’s Republic of China RMB4,000,000,000 57 Propertyii 九龍倉(常州)置業有限公司 The People’s Republic of China US$229,800,000 71 Propertyii 上海綠源房地產開發有限公司 The People’s Republic of China RMB70,000,000 71 Property
LogisticsWharf Transport Investments Limited Hong Kong HK$2 divided into 2 shares 100 Holding companyThe “Star” Ferry Company, Limited Hong Kong HK$7,200,000 divided into
1,440,000 shares100 Public transport
Modern Terminals Limited Hong Kong HK$82,049,200 divided into 70,116 shares
68 Container terminal
i Shenzhen Dachan Bay Modern Port Development Company, Limited The People’s Republic of China RMB4,095,195,813 44 Container terminal
Hotels# Wharf Hotels Limited British Virgin Islands 500 US$1 shares 100 Holding company
Wharf Hong Kong Hotels Limited (Formerly named Marco Polo Hotels Limited)
Cayman Islands 500,000,000 US$1 shares 100 Holding company
Marco Polo Hotels Management Limited Hong Kong HK$20 divided into 2 shares 100 HotelThe Hongkong Hotel Limited Hong Kong HK$100,000 divided into
100,000 shares71 Hotel and property
The Marco Polo Hotel (Hong Kong) Limited Hong Kong HK$1,000 divided into 1,000 shares
100 Hotel
The Prince Hotel Limited Hong Kong HK$2 divided into 2 shares 100 HotelSmart Event Investments Limited Hong Kong HK$1 divided into 1 share 71 Hotel
ii 武漢馬哥孛羅酒店有限公司 The People’s Republic of China US$3,850,000 100 Hotelii 成都馬哥孛羅酒店有限公司 The People’s Republic of China US$8,000,000 100 Hotelii 常州馬哥孛羅酒店有限公司 The People’s Republic of China US$7,000,000 71 Hotel
CME# Wharf Communications Limited Hong Kong HK$10,000,000 divided into
1,000,000 shares100 Holding company
* i-CABLE Communications Limited Hong Kong HK$6,857,598,956 divided into 2,011,512,400 shares
74 Holding company
Hong Kong Cable Television Limited Hong Kong HK$750,000,000 divided into 750,000,000 shares
74 Pay TV and Internet and multimedia
Wharf T&T Limited Hong Kong HK$740,000,000 divided into 740,000,000 shares
100 Telecommunication
COL Limited Hong Kong HK$20,000,000 divided into 40,000 shares
100 IT services
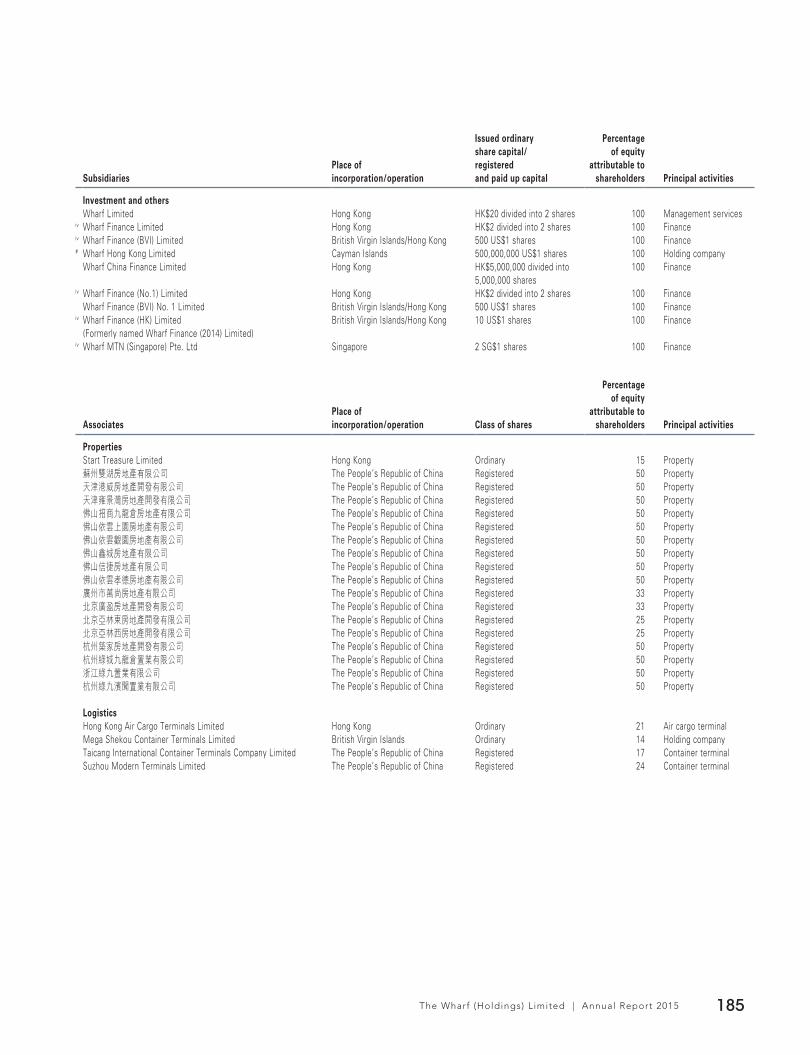
The Wharf (Holdings) L imited | Annual Report 2015 185
SubsidiariesPlace of incorporation/operation
Issued ordinary share capital/registered and paid up capital
Percentage of equity
attributable to shareholders Principal activities
Investment and othersWharf Limited Hong Kong HK$20 divided into 2 shares 100 Management services
iv Wharf Finance Limited Hong Kong HK$2 divided into 2 shares 100 Financeiv Wharf Finance (BVI) Limited British Virgin Islands/Hong Kong 500 US$1 shares 100 Finance# Wharf Hong Kong Limited Cayman Islands 500,000,000 US$1 shares 100 Holding company
Wharf China Finance Limited Hong Kong HK$5,000,000 divided into 5,000,000 shares
100 Finance
iv Wharf Finance (No.1) Limited Hong Kong HK$2 divided into 2 shares 100 FinanceWharf Finance (BVI) No. 1 Limited British Virgin Islands/Hong Kong 500 US$1 shares 100 Finance
iv Wharf Finance (HK) Limited (Formerly named Wharf Finance (2014) Limited)
British Virgin Islands/Hong Kong 10 US$1 shares 100 Finance
iv Wharf MTN (Singapore) Pte. Ltd Singapore 2 SG$1 shares 100 Finance
AssociatesPlace of incorporation/operation Class of shares
Percentage of equity
attributable to shareholders Principal activities
PropertiesStart Treasure Limited Hong Kong Ordinary 15 Property蘇州雙湖房地產有限公司 The People’s Republic of China Registered 50 Property天津港威房地產開發有限公司 The People’s Republic of China Registered 50 Property天津雍景灣房地產開發有限公司 The People’s Republic of China Registered 50 Property佛山招商九龍倉房地產有限公司 The People’s Republic of China Registered 50 Property佛山依雲上園房地產有限公司 The People’s Republic of China Registered 50 Property佛山依雲觀園房地產有限公司 The People’s Republic of China Registered 50 Property佛山鑫城房地產有限公司 The People’s Republic of China Registered 50 Property佛山信捷房地產有限公司 The People’s Republic of China Registered 50 Property佛山依雲孝德房地產有限公司 The People’s Republic of China Registered 50 Property廣州市萬尚房地產有限公司 The People’s Republic of China Registered 33 Property北京廣盈房地產開發有限公司 The People’s Republic of China Registered 33 Property北京亞林東房地產開發有限公司 The People’s Republic of China Registered 25 Property北京亞林西房地產開發有限公司 The People’s Republic of China Registered 25 Property杭州築家房地產開發有限公司 The People’s Republic of China Registered 50 Property杭州綠城九龍倉置業有限公司 The People’s Republic of China Registered 50 Property浙江綠九置業有限公司 The People’s Republic of China Registered 50 Property杭州綠九濱聞置業有限公司 The People’s Republic of China Registered 50 Property
LogisticsHong Kong Air Cargo Terminals Limited Hong Kong Ordinary 21 Air cargo terminalMega Shekou Container Terminals Limited British Virgin Islands Ordinary 14 Holding companyTaicang International Container Terminals Company Limited The People’s Republic of China Registered 17 Container terminalSuzhou Modern Terminals Limited The People’s Republic of China Registered 24 Container terminal
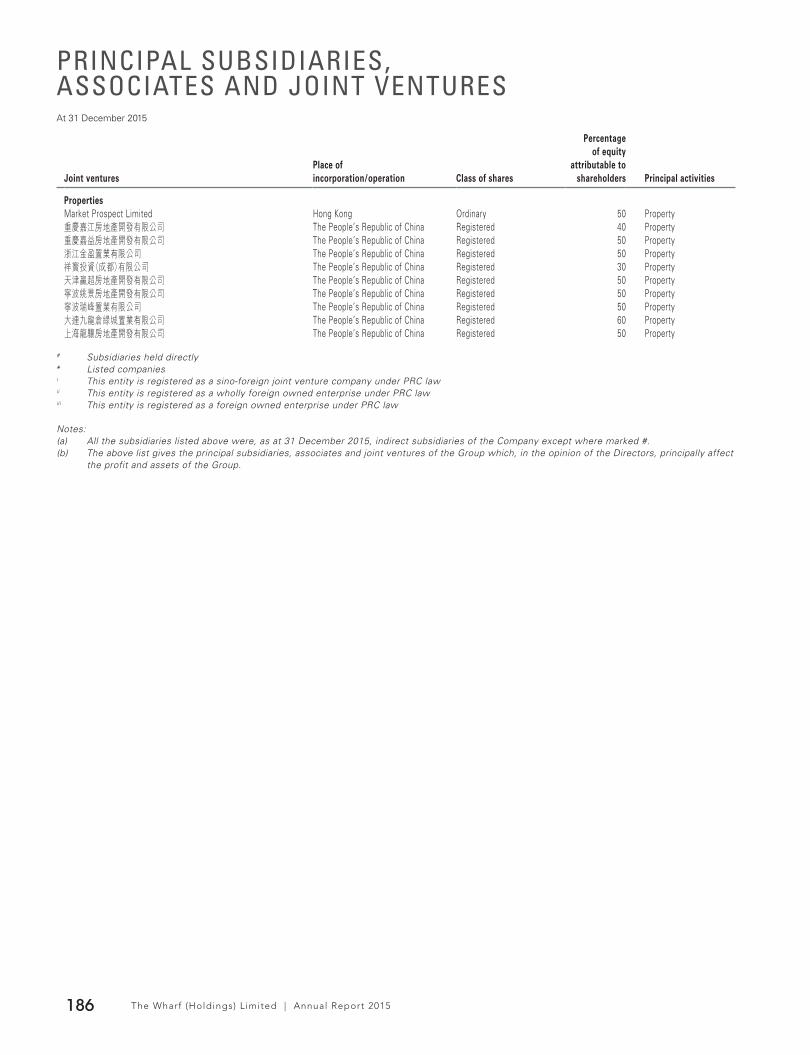
At 31 December 2015
PRINCIPAL SUBSIDIARIES, ASSOCIATES AND JOINT VENTURES
The Wharf (Holdings) L imited | Annual Report 2015186
Joint venturesPlace of incorporation/operation Class of shares
Percentage of equity
attributable to shareholders Principal activities
PropertiesMarket Prospect Limited Hong Kong Ordinary 50 Property重慶嘉江房地產開發有限公司 The People’s Republic of China Registered 40 Property重慶嘉益房地產開發有限公司 The People’s Republic of China Registered 50 Property浙江金盈置業有限公司 The People’s Republic of China Registered 50 Property祥寳投資(成都)有限公司 The People’s Republic of China Registered 30 Property天津贏超房地產開發有限公司 The People’s Republic of China Registered 50 Property寧波姚景房地產開發有限公司 The People’s Republic of China Registered 50 Property寧波瑞峰置業有限公司 The People’s Republic of China Registered 50 Property大連九龍倉綠城置業有限公司 The People’s Republic of China Registered 60 Property上海龍驤房地產開發有限公司 The People’s Republic of China Registered 50 Property
# Subsidiaries held directly* Listed companiesi This entity is registered as a sino-foreign joint venture company under PRC lawii This entity is registered as a wholly foreign owned enterprise under PRC lawiii This entity is registered as a foreign owned enterprise under PRC law
Notes:(a) All the subsidiaries listed above were, as at 31 December 2015, indirect subsidiaries of the Company except where marked #.(b) The above list gives the principal subsidiaries, associates and joint ventures of the Group which, in the opinion of the Directors, principally affect
the profit and assets of the Group.

The Wharf (Holdings) L imited | Annual Report 2015 187
(c) Set out below is details of debt securities issued by wholly-owned subsidiaries of and guaranteed by the Company:
Name of subsidiary/Borrower Description of debt securitiesOutstanding principal amount
Wharf Finance (BVI) Limited HK$ Guaranteed Fixed Rate Notes due 2016 HK$250 MillionHK$ Guaranteed Fixed Rate Notes due 2022 HK$200 Million
Wharf Finance Limited HK$ Guaranteed Fixed Rate Notes due 2016 HK$430 MillionUS$ Guaranteed Fixed Rate Notes due 2017 US$400 MillionUS$ Guaranteed Fixed Rate Notes due 2017 US$300 MillionUS$ Guaranteed Fixed Rate Notes due 2017 US$600 MillionHK$ Guaranteed Fixed Rate Notes due 2018 HK$160 MillionHK$ Guaranteed Fixed Rate Notes due 2018 HK$326 MillionHK$ Guaranteed Fixed Rate Notes due 2018 HK$300 MillionHK$ Guaranteed Floating Rate Notes due 2018 HK$100 MillionJPY Guaranteed Fixed Rate Notes due 2018 JPY2,000 MillionHK$ Guaranteed Fixed Rate Notes due 2018 HK$300 MillionHK$ Guaranteed Fixed Rate Notes due 2018 HK$100 MillionHK$ Guaranteed Fixed Rate Notes due 2018 HK$150 MillionUS$ Guaranteed Fixed Rate Notes due 2019 US$400 MillionAUD Guaranteed Fixed Rate Notes due 2019 AUD70 MillionAUD Guaranteed Fixed Rate Notes due 2019 AUD25 MillionAUD Guaranteed Floating Rate Notes due 2019 AUD15 MillionUS$ Guaranteed Floating Rate Notes due 2019 US$10 MillionUS$ Guaranteed Floating Rate Notes due 2020 US$20 MillionUS$ Guaranteed Fixed Rate Notes due 2021 US$50 MillionHK$ Guaranteed Fixed Rate Notes due 2021 HK$345 MillionHK$ Guaranteed Fixed Rate Notes due 2022 HK$424 MillionHK$ Guaranteed Fixed Rate Notes due 2022 HK$60 MillionHK$ Guaranteed Fixed Rate Notes due 2022 HK$312 MillionHK$ Guaranteed Fixed Rate Notes due 2022 HK$382 MillionUS$ Guaranteed Fixed Rate Notes due 2022 US$60 MillionHK$ Guaranteed Fixed Rate Notes due 2023 HK$100 MillionHK$ Guaranteed Fixed Rate Notes due 2023 HK$100 MillionHK$ Guaranteed Fixed Rate Notes due 2024 HK$500 MillionHK$ Guaranteed Fixed Rate Notes due 2024 HK$200 MillionHK$ Guaranteed Fixed Rate Notes due 2024 HK$195 MillionHK$ Guaranteed Fixed Rate Notes due 2024 HK$185 MillionHK$ Guaranteed Fixed Rate Notes due 2024 HK$177 MillionHK$ Guaranteed Fixed Rate Notes due 2025 HK$800 MillionHK$ Guaranteed Fixed Rate Notes due 2027 HK$230 MillionHK$ Guaranteed Fixed Rate Notes due 2040 HK$250 Million
Wharf Finance (No. 1) Limited HK$ Guaranteed Fixed Rate Notes due 2016 HK$167 MillionSG$ Guaranteed Fixed Rate Notes due 2016 SG$160 MillionRMB Guaranteed Fixed Rate Notes due 2016 RMB150 MillionUS$ Guaranteed Floating Rate Notes due 2016 US$58 MillionHK$ Guaranteed Fixed Rate Notes due 2017 HK$113 MillionRMB Guaranteed Fixed Rate Notes due 2018 RMB800 MillionHK$ Guaranteed Fixed Rate Notes due 2018 HK$300 MillionRMB Guaranteed Fixed Rate Notes due 2019 RMB200 MillionHK$ Guaranteed Fixed Rate Notes due 2019 HK$240 MillionHK$ Guaranteed Fixed Rate Notes due 2020 HK$550 MillionHK$ Guaranteed Fixed Rate Notes due 2020 HK$180 MillionHK$ Guaranteed Fixed Rate Notes due 2020 HK$200 MillionHK$ Guaranteed Fixed Rate Notes due 2020 HK$100 MillionRMB Guaranteed Fixed Rate Notes due 2020 RMB100 MillionRMB Guaranteed Fixed Rate Notes due 2020 RMB200 MillionRMB Guaranteed Fixed Rate Notes due 2020 RMB300 MillionSG$ Guaranteed Fixed Rate Notes due 2021 SG$260 MillionRMB Guaranteed Fixed Rate Notes due 2023 RMB200 MillionJPY Guaranteed Fixed Rate Notes due 2026 JPY10,000 Million
Wharf MTN (Singapore) Pte. Ltd. SG$ Guaranteed Fixed Rate Notes due 2018 SG$250 Million
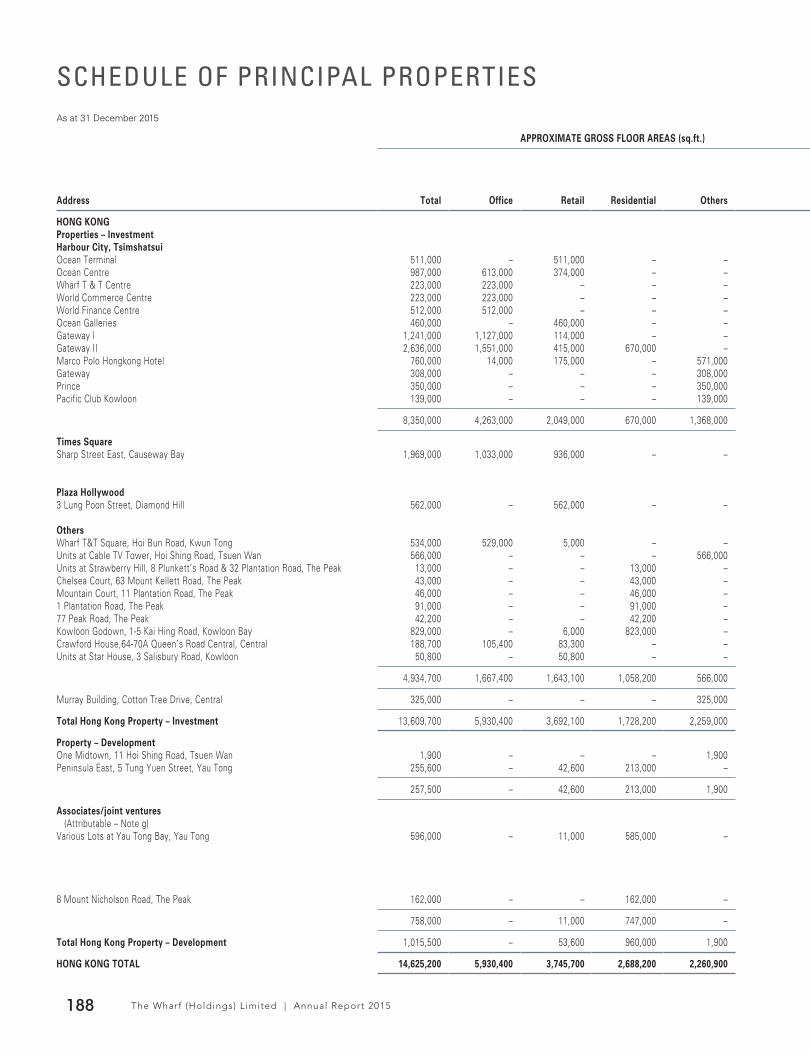
As at 31 December 2015
The Wharf (Holdings) L imited | Annual Report 2015188
SCHEDULE OF PRINCIPAL PROPERTIES
APPROXIMATE GROSS FLOOR AREAS (sq.ft.)
Address Total Office Retail Residential Others
HONG KONGProperties – InvestmentHarbour City, TsimshatsuiOcean Terminal 511,000 – 511,000 – –Ocean Centre 987,000 613,000 374,000 – –Wharf T & T Centre 223,000 223,000 – – –World Commerce Centre 223,000 223,000 – – –World Finance Centre 512,000 512,000 – – –Ocean Galleries 460,000 – 460,000 – –Gateway I 1,241,000 1,127,000 114,000 – –Gateway II 2,636,000 1,551,000 415,000 670,000 –Marco Polo Hongkong Hotel 760,000 14,000 175,000 – 571,000Gateway 308,000 – – – 308,000Prince 350,000 – – – 350,000Pacific Club Kowloon 139,000 – – – 139,000
8,350,000 4,263,000 2,049,000 670,000 1,368,000
Times SquareSharp Street East, Causeway Bay 1,969,000 1,033,000 936,000 – –
Plaza Hollywood3 Lung Poon Street, Diamond Hill 562,000 – 562,000 – –
OthersWharf T&T Square, Hoi Bun Road, Kwun Tong 534,000 529,000 5,000 – –Units at Cable TV Tower, Hoi Shing Road, Tsuen Wan 566,000 – – – 566,000Units at Strawberry Hill, 8 Plunkett’s Road & 32 Plantation Road, The Peak 13,000 – – 13,000 –Chelsea Court, 63 Mount Kellett Road, The Peak 43,000 – – 43,000 –Mountain Court, 11 Plantation Road, The Peak 46,000 – – 46,000 –1 Plantation Road, The Peak 91,000 – – 91,000 –77 Peak Road, The Peak 42,200 – – 42,200 –Kowloon Godown, 1-5 Kai Hing Road, Kowloon Bay 829,000 – 6,000 823,000 –Crawford House,64-70A Queen’s Road Central, Central 188,700 105,400 83,300 – –Units at Star House, 3 Salisbury Road, Kowloon 50,800 – 50,800 – –
4,934,700 1,667,400 1,643,100 1,058,200 566,000
Murray Building, Cotton Tree Drive, Central 325,000 – – – 325,000
Total Hong Kong Property – Investment 13,609,700 5,930,400 3,692,100 1,728,200 2,259,000
Property – DevelopmentOne Midtown, 11 Hoi Shing Road, Tsuen Wan 1,900 – – – 1,900Peninsula East, 5 Tung Yuen Street, Yau Tong 255,600 – 42,600 213,000 –
257,500 – 42,600 213,000 1,900
Associates/joint ventures(Attributable – Note g)
Various Lots at Yau Tong Bay, Yau Tong 596,000 – 11,000 585,000 –
8 Mount Nicholson Road, The Peak 162,000 – – 162,000 –
758,000 – 11,000 747,000 –
Total Hong Kong Property – Development 1,015,500 – 53,600 960,000 1,900
HONG KONG TOTAL 14,625,200 5,930,400 3,745,700 2,688,200 2,260,900

The Wharf (Holdings) L imited | Annual Report 2015 189
Year of Completion/ Effective Equity
Site Area Expected Interest to (Remarks) (Sq.ft.) Lot Number Lease Expiry Completion Stage of Completion the Company
346,719 KPP 83 2033 1966 N/A 100%126,488 KML 11 S.A. 2880 1977 N/A 100%
(a) KML 11 S.B. 2880 1981 N/A 100%(a) KML 11 S.B. 2880 1981 N/A 100%(a) KML 11 S.D. 2880 1983 N/A 100%(a) KML 11 S.B. & D. 2880 1981/83 N/A 100%(a) KML 11 R.P. 2880 1994 N/A 100%(a) KML 11 S.B. & D. 2880 1998/99 N/A 100%
(A 665-room hotel) 58,814 KML 91 S.A. & KML 10 S.B. 2863 1969 N/A 71%(A 397-room hotel) (a) KML 11 S.B. 2880 1981 N/A 100%(A 393-room hotel) (a) KML 11 S.D. 2880 1983 N/A 100%(Club House) 48,309 KIL 11179 2021 1990 N/A 100%
112,441 IL 731, IL 728, IL 727, 2850/60/80 1993 N/A 100%IL 725 S.A. & R.P., IL 724 S.A.
280,510 NKIL 6160 2047 1997 N/A 100%
48,438 KTIL 713 2047 2019 Foundation in progress 100%(Industrial) N/A TWTL 218 2047 1992 N/A 100%
N/A RBL 512 & 1004 2027/28 1974/77 N/A 100%29,640 RBL 556 S.A.R.P. & S.B. 2035 2001 N/A 100%32,145 RBL 522, 639, 661 2027 2017 Superstructure in progress 100%97,670 RBL 534 S.E., S.F. & R.P. 2028 2020 Foundation in progress 100%76,726 RBL 836 2029 2017 Superstructure in progress 100%
165,809 NKIL 5805, 5806 & 5982 2047 1984 Planning for redevelopment 100%12,286 IL 7 R.P. & IL 45 S.A.R.P. 2842 1977 N/A 100%
N/A KML 10 S.A. 2863 1966 N/A 71%
68,136 9036 2063 2017 Renovation in progress 71%
66,000 TWIL 36 2047 2012 N/A 100%42,625 YTIL 40 RP 2062 2016 Superstructure in progress 100%
816,872 R.P. of YTML 22 & ext., YTML 2047 N/A Planning stage 14.9%28 & ext., YTML 29 & ext., and YTML 12, 32 and 33 together with adjoining lots at Yau Tong Bay
250,930 IL9007 2060 2016 Superstructure in progress 50%

As at 31 December 2015
The Wharf (Holdings) L imited | Annual Report 2015190
SCHEDULE OF PRINCIPAL PROPERTIES
APPROXIMATE GROSS FLOOR AREAS (sq.ft.)
Address Total Office Retail Residential Others
MAINLAND CHINAProperty – InvestmentCompleted Investment PropertiesShanghai Times Square 973,000 331,000 447,000 195,000 –
93-111 Huai Hai Zhong Road, ShanghaiChongqing Times Square 591,800 13,800 578,000 – –
100 Zou Rong Road, Yuzhong District, ChongqingWuhan Times Square 8,000 – 8,000 – –
160 Yan Jiang Da Dao, Jiangan District, WuhanDalian Times Square 188,000 – 188,000 – –
50 Ren Min Road, Zhongshan District, DalianChengdu Times Outlets 680,000 – 680,000 – –
No. 633 Shuangnan Avenue (Middle Section)Shuangliu County, Chengdu
Chengdu International Finance Square 5,349,000 3,136,000 2,213,000 – –Junction of Hongxing Road and Da Ci Si Road, Jinjiang District
Wuxi International Finance Square 1,592,000 1,592,000 – – –Taihu Plaza, Nanchang District, Wuxi
Shanghai Wheelock Square 1,199,000 1,149,000 50,000 – –1717 Nan Jing Xi Road, Jingan District, Shanghai
10,580,800 6,221,800 4,164,000 195,000 –
Investment Properties Under DevelopmentChengdu International Finance Square 774,000 – – 774,000 –
Junction of Hongxing Road and Da Ci Si Road, Jinjiang District, Chengdu
Wuxi International Finance Square 450,000 – – – 450,000Taihu Plaza, Nanchang District, Wuxi
Suzhou International Finance Square 2,989,000 2,558,000 – 181,000 250,000Xing Hu Jie, Suzhou Industrial Park, Suzhou
Changsha International Finance Square 7,805,000 4,799,000 2,425,000 – 581,000Furong District, Changsha
Changsha Times Outlets 770,000 – 770,000 – –168 Ou Zhou Bei Lu, Jinzhou New District Industrial Concentration Zone Changsha, Hunan China
Chongqing International Finance Square 2,202,000 1,463,000 547,000 – 192,000Zones A of Jiangbei City, Jiang Bei District, Chongqing (Attributable – Note g)
14,990,000 8,820,000 3,742,000 955,000 1,473,000
Marco Polo Wuhan 405,000 – – – 405,000160 Yan Jiang Da Dao, Jiangan District, Wuhan
Marco Polo Changzhou 474,000 – – – 474,00088 Hehai East Road, Xinbei Disirict, Changzhou
Niccolo Chengdu 443,000 – – – 443,000Tower 3, IFS, No.1, Section 3, Hongxing RoadJinjiang District, Chengdu, Sichuan
1,322,000 – – – 1,322,000
Total Mainland China Property – Investment 26,892,800 15,041,800 7,906,000 1,150,000 2,795,000
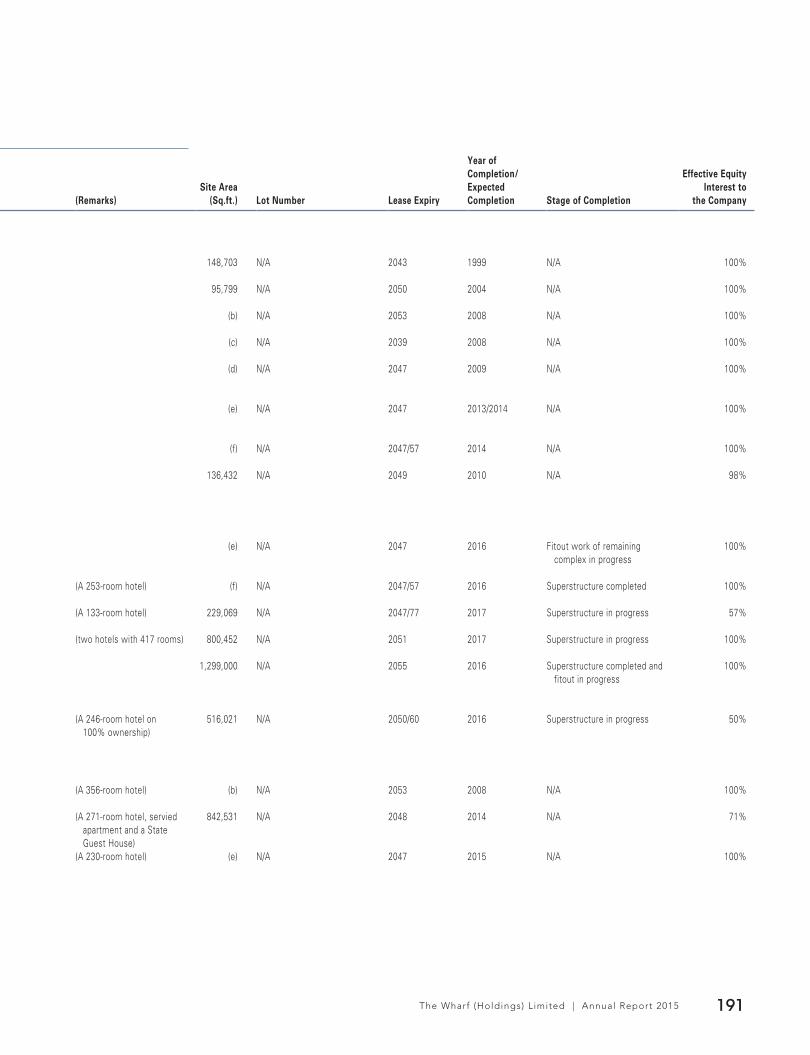
The Wharf (Holdings) L imited | Annual Report 2015 191
Year of Completion/ Effective Equity
Site Area Expected Interest to (Remarks) (Sq.ft.) Lot Number Lease Expiry Completion Stage of Completion the Company
148,703 N/A 2043 1999 N/A 100%
95,799 N/A 2050 2004 N/A 100%
(b) N/A 2053 2008 N/A 100%
(c) N/A 2039 2008 N/A 100%
(d) N/A 2047 2009 N/A 100%
(e) N/A 2047 2013/2014 N/A 100%
(f) N/A 2047/57 2014 N/A 100%
136,432 N/A 2049 2010 N/A 98%
(e) N/A 2047 2016 Fitout work of remaining complex in progress
100%
(A 253-room hotel) (f) N/A 2047/57 2016 Superstructure completed 100%
(A 133-room hotel) 229,069 N/A 2047/77 2017 Superstructure in progress 57%
(two hotels with 417 rooms) 800,452 N/A 2051 2017 Superstructure in progress 100%
1,299,000 N/A 2055 2016 Superstructure completed and fitout in progress
100%
(A 246-room hotel on 516,021 N/A 2050/60 2016 Superstructure in progress 50%100% ownership)
(A 356-room hotel) (b) N/A 2053 2008 N/A 100%
(A 271-room hotel, servied 842,531 N/A 2048 2014 N/A 71%apartment and a State Guest House)
(A 230-room hotel) (e) N/A 2047 2015 N/A 100%

As at 31 December 2015
The Wharf (Holdings) L imited | Annual Report 2015192
SCHEDULE OF PRINCIPAL PROPERTIES
APPROXIMATE GROSS FLOOR AREAS (sq.ft.)
Address Total Office Retail Residential Others
Property – DevelopmentChangzhou Times Palace 1,426,000 – – 1,426,000 –
China Dinosaur Park, Xinbei District,Jiangsu Province, Changzhou
Changzhou Feng Huang Hu 1,970,000 – – 1,970,000 –Xin Bei District and abutting Han Jiang Lu andYu Long Lu. Changzhou
Changzhou Feng Huang Hu 2,638,000 – – 2,638,000 –Xin Bei District and abutting Huang He Lu andFeng Xiang Lu, Changzhou
Hangzhou Palazzo Pitti 825,000 – – 825,000 –Hangzhou Hangyimian Lot C/DGongshu District Gongchen Bridge West, Hangzhou
Hangzhou Royal Seal 883,000 – – 883,000 –Lot#FG05 of Wenhui Road, Hangzhou
Shi Ji Hua Fu 562,000 – 78,000 484,000 –Yingbin North Road/Fenshou Road, Fuchun District, Fuyang, Hangzhou
Junting 1,666,000 – – 1,666,000 –Hangzhou Qianjiang Economic Development Area09 Provincial Road/Kangxin Road, Yuhang District, Hangzhou
Longxi 456,000 – – 456,000 –Site GS05-R21-14, Shenhua Unit, Gongshu District, Hangzhou
Longxi 565,000 – – 565,000 –Site GS05-R21-A01, Shenhua Unit, Gongshu District, Hangzhou
Shanghai Xi Yuan 3,000 – – 3,000 –D1 of Xinjiangwancheng of Yangpu District, Shanghai
Shanghai Songjiang Xianhe Road 233,000 – – 233,000 –Site #2 of Songjiang Xianhe Road, Shanghai
Shanghai Pudong Huangpujiang 1,464,000 – – 1,464,000 –Site #E18 of Pudong Huangpujiang Riverside, Shanghai
Jingan Garden 763,000 – – 763,000 –398 Wanhangdu Road, Jingan District, Shanghai
Shanghai Pudong Zhoupu 1,053,000 – – 1,053,000 –Site #08, lot 06-05 of Zhoupu Town, Pudong District, Shanghai
Suzhou Ambassador Villa 562,000 – – 562,000 –Lot No. 68210 Suzhou Industrial Park, Suzhou
Bellagio 2,802,000 – – 2,802,000 –Wang Wu Lu, Guo Sin Lu, Wu Chong New District, Suzhou
Suzhou Times City 3,740,000 – – 3,740,000 –Xiandai Da Dao, Suzhou Industrial Park, Suzhou
Wuxi Glory of Time 1,625,000 313,000 – 1,312,000 –Nanchang District and abutting on Jinhang Canal, Wuxi
Wuxi Times City 2,717,000 – – 2,717,000 –Taihu Plaza, Nanchang District, Wuxi
Wuxi Xiyuan 442,000 – – 442,000 –Nanchang District and abutting on Jinhang Canal, Wuxi
River Pitti 3,462,000 – – 3,462,000 –Nanchang District and abutting on Jinhang Canal, Wuxi
Park Mansion 1,116,000 – – 1,116,000 –Southeast of Kang Zhuang Road and Beihuan west Road crossings (north of Tianhe community), Jiangbei District, Ningbo
The Orion 387,000 – – 387,000 –Bounded by Dongdajie south, Jinhua Nan Lu east and Datiankan Jie north, Jinjiang District, Chengdu
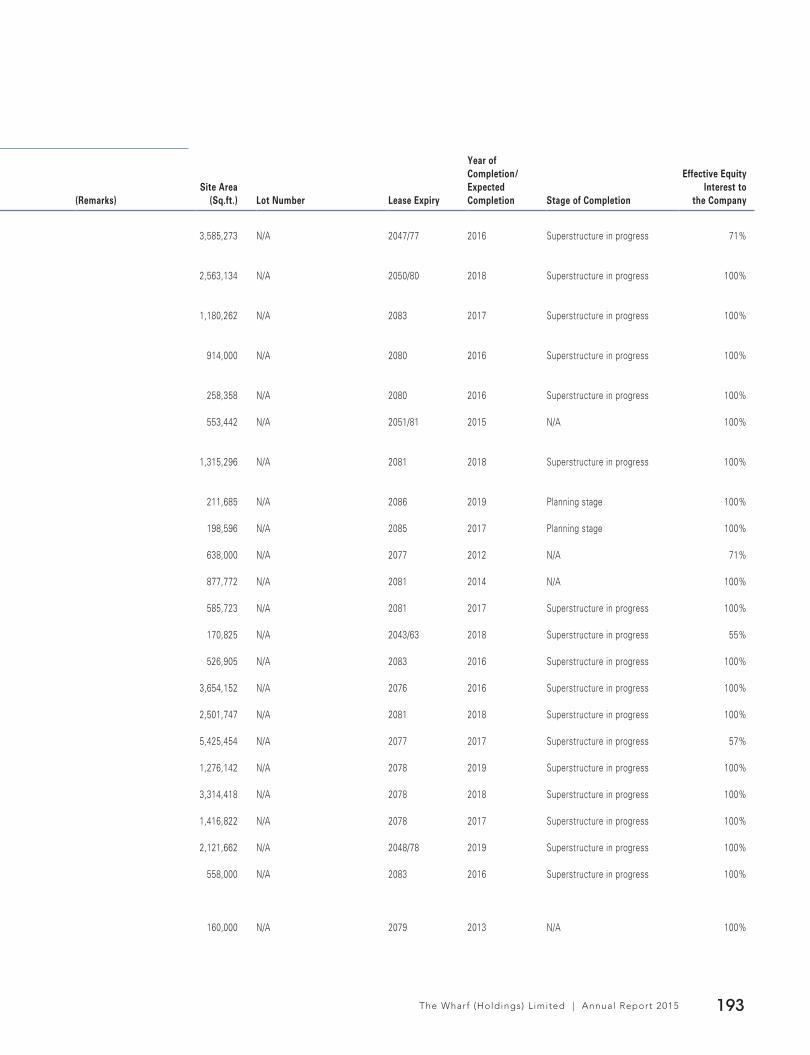
The Wharf (Holdings) L imited | Annual Report 2015 193
Year of Completion/ Effective Equity
Site Area Expected Interest to (Remarks) (Sq.ft.) Lot Number Lease Expiry Completion Stage of Completion the Company
3,585,273 N/A 2047/77 2016 Superstructure in progress 71%
2,563,134 N/A 2050/80 2018 Superstructure in progress 100%
1,180,262 N/A 2083 2017 Superstructure in progress 100%
914,000 N/A 2080 2016 Superstructure in progress 100%
258,358 N/A 2080 2016 Superstructure in progress 100%
553,442 N/A 2051/81 2015 N/A 100%
1,315,296 N/A 2081 2018 Superstructure in progress 100%
211,685 N/A 2086 2019 Planning stage 100%
198,596 N/A 2085 2017 Planning stage 100%
638,000 N/A 2077 2012 N/A 71%
877,772 N/A 2081 2014 N/A 100%
585,723 N/A 2081 2017 Superstructure in progress 100%
170,825 N/A 2043/63 2018 Superstructure in progress 55%
526,905 N/A 2083 2016 Superstructure in progress 100%
3,654,152 N/A 2076 2016 Superstructure in progress 100%
2,501,747 N/A 2081 2018 Superstructure in progress 100%
5,425,454 N/A 2077 2017 Superstructure in progress 57%
1,276,142 N/A 2078 2019 Superstructure in progress 100%
3,314,418 N/A 2078 2018 Superstructure in progress 100%
1,416,822 N/A 2078 2017 Superstructure in progress 100%
2,121,662 N/A 2048/78 2019 Superstructure in progress 100%
558,000 N/A 2083 2016 Superstructure in progress 100%
160,000 N/A 2079 2013 N/A 100%

As at 31 December 2015
The Wharf (Holdings) L imited | Annual Report 2015194
SCHEDULE OF PRINCIPAL PROPERTIES
APPROXIMATE GROSS FLOOR AREAS (sq.ft.)
Address Total Office Retail Residential Others
Tian Fu Times Square 56,000 5,000 38,000 13,000 –Junction of Dong Da Jie & Fu He, Jinjiang District, Chengdu
Crystal Park, No.10 Gaoxin District 2,000 – – 2,000 –Junction of Zhan Hua Road and Fu Cheng Avenue, Chengdu
Times Town, Shuangliu Development Zone 4,277,000 2,348,000 962,000 967,000 –Junction of Shuang Nan Avenue and Guang Hua Avenue, Shuangliu County, Chengdu
Chengdu Times City 2,392,000 – 88,000 2,304,000 –Shuangliu Huayang Street, Qinghe Community Group 8 and Gongxing Street Outang Village Group 5
Le Palais 907,000 – 62,000 845,000 –Lot No. 8 along Section 3 of the 2nd Ring Road East,Chenghua District, Chengdu
Wuhan Lake Moon Site B 710,000 – – 710,000 –Hanyang District, Qintai Road, Wuhan
Dalian Times Square 10,000 – – 10,000 –50 Ren Min Road, Zhongshan District, Dalian
39,714,000 2,666,000 1,228,000 35,820,000 –
Associates/joint ventures(Attributable – Note g)
Suzhou Kingsville 3,000 – – 3,000 –South of Lin Hu Road, East & West sides of Ying Hu Road, Suzhou
Evian Town 40,000 – 13,000 3,000 24,000South of Tian Hong Lu and North of Yu He LuXincheng District, Foshan
Evian Uptown 35,000 – 35,000 – –North side of Kin Jin Lu, Chancheng District, Foshan
Evian Buena Vista 758,000 – 26,000 716,000 16,000Foshan Nanhai District Shishan County Project
Evian Riviera 2,000 – 2,000 – –Foshan Nanhai District Guicheng A18 and A21 Project
Evian Kingbay 902,000 – 41,000 859,000 2,000North of Jihua Bridge, Chancheng District, Foshan
Evian Capital 1,270,000 – 89,000 1,163,000 18,000Beihu Yi Road, Luocun, Shishan, Nanhai District, Foshan
Unique Garden 433,000 – 27,000 403,000 3,000East of Wenhua Lu, Chancheng District, Foshan
Donghui City 181,000 – 8,000 159,000 14,000Guangzhou Develompent Zone KXCD-D1-2 Project
Unique Garden 398,000 – 11,000 387,000 –Laiguangying Central Street, Chaoyang District, Beijing
The Pearl on the Crown 429,000 – – 319,000 110,000South 2nd Ring, Fengtai District, Beijing
Crown Land 481,000 – 43,000 335,000 103,000South 2nd Ring, Fengtai District, Beijing
The Magnificent 34,000 – 2,000 32,000 –Junction of Weiguo Road & Jingjiang Road, Hedong District,Tianjin
Scenery Bay 974,000 – 50,000 878,000 46,000Intersection of Hedong Road and Kunlun Road,Hedong District,Tianjin
Magnolia Mansion 4,000 – – 4,000 –Tangzhen 5 Jiefang 180/1 Qiu, Pudong District, Shanghai
Shanghai South Station (Vanke Center Xuhui) 1,428,000 1,182,000 219,000 – 27,000Caohejing Area Lot 278a-05/278b-02/278b-04South Station Business Zone, Xuhui District, Shanghai

The Wharf (Holdings) L imited | Annual Report 2015 195
Year of Completion/ Effective Equity
Site Area Expected Interest to (Remarks) (Sq.ft.) Lot Number Lease Expiry Completion Stage of Completion the Company
761,520 N/A 2045/75 2013 N/A 100%
884,459 N/A 2046/76 2014 N/A 100%
(d) N/A 2047/77 2019 Superstructure in progress 100%
800,882 N/A 2053/83 2018 Superstructure in progress 100%
1,130,000 N/A 2050/80 2016 Superstructure in progress 100%
454,000 N/A 2080 2016 Superstructure in progress 100%
(c) N/A 2069 2009 N/A 100%
1,976,237 N/A 2077 2014 N/A 50%
2,867,600 N/A 2047/77 2012 N/A 50%
1,155,000 N/A 2048/78 2013 N/A 50%
1,526,900 N/A 2070 2017 Superstructure in progress 50%
603,900 N/A 2080 2014 N/A 50%
639,000 N/A 2083 2017 Superstructure in progress 50%
1,069,000 N/A 2083 2017 Superstructure in progress 50%
305,722 N/A 2055/85 2018 Superstructure in progress 50%
1,181,300 N/A 2081 2016 Superstructure in progress 33%
783,000 N/A 2082 2016 Superstructure in progress 33%
582,000 N/A 2085 2018 Foundation in progress 25%
680,000 N/A 2085 2018 Foundation in progress 25%
511,560 N/A 2079 2012 N/A 50%
902,000 N/A 2083 2017 Superstructure in progress 50%
648,056 N/A 2082 2015 N/A 50%
1,156,979 N/A 2052/62 2020 Superstructure in progress 19%

As at 31 December 2015
The Wharf (Holdings) L imited | Annual Report 2015196
SCHEDULE OF PRINCIPAL PROPERTIES
APPROXIMATE GROSS FLOOR AREAS (sq.ft.)
Address Total Office Retail Residential Others
Greentown Zhijiang No.1 1,225,000 – 83,000 1,142,000 –Zhuantang Town, Zhijiang National TouristHoliday Resort, Xihi District, Hangzhou
Greentown Wharf Qian Tang Bright Moon 1,010,000 – 76,000 934,000 –Hangzhou Xiaoshan Jinhui Road, Hangzhou
Park Mansion 669,000 – 44,000 617,000 8,000Site R21-02-A and Site R21-01, Shenhua Unit,Gongshu District, Hangzhou
Qiantang Bright Moon•Jade Mansion 280,000 – 5,000 275,000 –Hangzhou Xiaoshan Chengbei Village Lot A10
Hangzhou Binjiang District Site R21-6, 7 410,000 – – 410,000 –Petrus Bay 17,000 – – 17,000 –
Site 3#-2 of Baoqingsi, NingboThe Berylville 395,000 – – 395,000 –
Site E-4#, 7#, 8#, 12# & 13#, ShuixianglinliEastern New Town, Ningbo
Garden Valley 1,550,000 – – 1,550,000 –Taoyuan Area, Jiefang Road, Zhongshan District, Dalian
Chengdu ICC 3,659,074 1,236,264 390,903 1,865,277 166,630South of Shuanggui Road, North of Niusha Road East of Erhuan Road, West of Shahe, Jinjiang District, Chengdu
U World 813,000 – 40,000 773,000 –Zone B of Jiangbei City, Jiang Bei District, Chongqing
The Throne 2,796,000 – 169,000 2,627,000 –Zones C of Jiangbei City, Jiang Bei District, Chongqing
International Community 2,877,000 – 901,000 1,976,000 –Zone C of Danzishi, Nanan District, Chongqing
Peaceland Cove 26,000 – 26,000 – –Tiedonglu, Hebei District, Tianjin
23,099,074 2,418,264 2,300,903 17,842,277 537,630
Total Mainland China Property – Development 62,813,074 5,084,264 3,528,903 53,662,277 537,630
MAINLAND CHINA TOTAL 89,705,874 20,126,064 11,434,903 54,812,277 3,332,630
GROUP PROPERTY – INVESTMENT 40,502,500 20,972,200 11,598,100 2,878,200 5,054,000GROUP PROPERTY – DEVELOPMENT 63,828,574 5,084,264 3,582,503 54,622,277 539,530
GROUP TOTAL (Note i) 104,331,074 26,056,464 15,180,603 57,500,477 5,593,530
Notes:
(a) These properties with total site area of 428,719 sq. ft. form part of Harbour City.
(b) This property forms part of Wuhan Times Square which has a total site area of 188,090 sq. ft.
(c) This property forms part of Dalian Times Square which has a total site area of 171,356 sq. ft.
(d) This property forms part of Chengdu Shuangliu Development Zone which has a total site area of 3,900,589 sq. ft.
(e) This property forms part of Chengdu International Finance Square which has a total site area of 590,481 sq. ft.
(f) This property forms part of Wuxi International Finance Square which has a total site area of 313,867 sq. ft.
(g) The floor areas of properties held through joint ventures and associates are shown on an attributable basis.
(h) Total Mainland development properties area included 14,928,000 sq. ft. pre-sold areas which have not yet been recognised in the financial statements.
(i) In addition to the above floor areas, the Group has total attributable carpark areas of approximately 32 million sq. ft. mainly in Mainland China.
(j) In Feb 2016, the Group acquired 1 site for joint development project in Beijing with attributable GFA of 515,000 sq. ft.
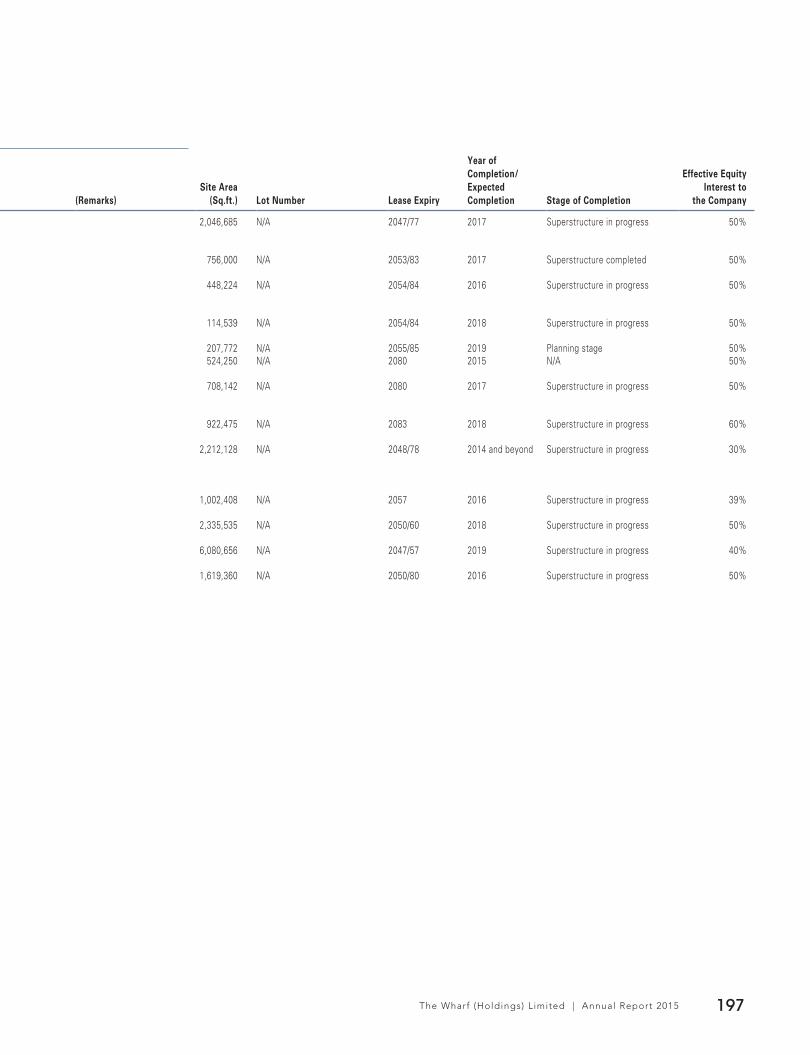
The Wharf (Holdings) L imited | Annual Report 2015 197
Year of Completion/ Effective Equity
Site Area Expected Interest to (Remarks) (Sq.ft.) Lot Number Lease Expiry Completion Stage of Completion the Company
2,046,685 N/A 2047/77 2017 Superstructure in progress 50%
756,000 N/A 2053/83 2017 Superstructure completed 50%
448,224 N/A 2054/84 2016 Superstructure in progress 50%
114,539 N/A 2054/84 2018 Superstructure in progress 50%
207,772 N/A 2055/85 2019 Planning stage 50%524,250 N/A 2080 2015 N/A 50%
708,142 N/A 2080 2017 Superstructure in progress 50%
922,475 N/A 2083 2018 Superstructure in progress 60%
2,212,128 N/A 2048/78 2014 and beyond Superstructure in progress 30%
1,002,408 N/A 2057 2016 Superstructure in progress 39%
2,335,535 N/A 2050/60 2018 Superstructure in progress 50%
6,080,656 N/A 2047/57 2019 Superstructure in progress 40%
1,619,360 N/A 2050/80 2016 Superstructure in progress 50%

The Wharf (Holdings) L imited | Annual Report 2015198
TEN-YEAR FINANCIAL SUMMARY
2015 2014 2013 2012 2011Year ended 31 December HK$ Million HK$ Million HK$ Million HK$ Million HK$ Million
Consolidated Income StatementRevenue 40,875 38,136 31,887 30,856 24,004Operating profit 14,853 14,283 13,280 14,170 11,388Core profit (Note a) 10,969 10,474 11,298 11,040 8,083Profit before property revaluation surplus 9,793 8,247 12,206 13,927 6,727Profit attributable to equity shareholders 16,024 35,930 29,380 47,263 30,568
Dividends attributable to shareholders 5,759 5,486 5,151 4,998 3,211
Consolidated Statement of Financial PositionInvestment properties 310,177 301,890 261,097 231,522 184,057Property, plant and equipment 22,779 25,027 24,161 19,870 18,984Interest in associates 17,785 22,449 19,205 16,673 10,198Interest in joint ventures 17,612 19,030 19,585 19,530 16,934Available-for-sale investments 8,102 3,740 3,744 3,868 2,703Properties for sale 37,768 47,543 53,764 48,915 47,511Bank deposits and cash 23,510 18,725 24,515 18,795 32,528Other assets 6,183 6,254 8,981 9,825 5,058
Total assets 443,916 444,658 415,052 368,998 317,973Bank loans and other borrowings (70,707) (77,984) (82,587) (74,420) (75,993)Other liabilities (56,029) (52,563) (48,210) (37,672) (31,106)
Net assets 317,180 314,111 284,255 256,906 210,874
Share capital: nominal value – – 3,030 3,029 3,029Other statutory capital reserves – – 26,346 26,285 26,285
Share capital and other statutory capital reserves 29,441 29,376 29,376 29,314 29,314Reserves 278,287 276,119 246,181 219,187 173,943
Shareholders’ equity 307,728 305,495 275,557 248,501 203,257Non-controlling interests 9,452 8,616 8,698 8,405 7,617
Total equity 317,180 314,111 284,255 256,906 210,874
Net debt 47,197 59,259 58,072 55,625 43,465
Financial DataPer share dataEarnings per share (HK$)– Core profit 3.62 3.46 3.73 3.64 2.70– Before property revaluation surplus 3.23 2.72 4.03 4.60 2.25– Attributable to equity shareholders 5.29 11.86 9.70 15.60 10.22Net asset value per share (HK$) 101.53 100.82 90.94 82.04 67.10Dividends per share (HK$ Cents) 190.00 181.00 170.00 165.00 106.00
Financial ratiosNet debt to shareholders’ equity (%) 15.3% 19.4% 21.1% 22.4% 21.4%Net debt to total equity (%) 14.9% 18.9% 20.4% 21.7% 20.6%Interest cover (Times) (Note c) 7.6 6.1 5.8 7.4 7.9Return on shareholders’ equity (%) (Note b) 5.2% 12.4% 11.2% 20.9% 16.7%Dividend payout (%)– Core profit 52.5% 52.4% 45.6% 45.3% 39.7%– Attributable to equity shareholders 35.9% 15.3% 17.5% 10.6% 10.5%

The Wharf (Holdings) L imited | Annual Report 2015 199
2010 2009 2008 2007 2006Year ended 31 December HK$ Million HK$ Million HK$ Million HK$ Million HK$ Million
Consolidated Income StatementRevenue 19,380 17,553 15,940 16,208 13,364Operating profit 9,372 8,554 7,406 7,832 6,056Core profit (Note a) 7,088 6,420 4,796 6,043 4,285Profit before property revaluation surplus 7,905 7,817 4,194 5,947 4,285Profit attributable to equity shareholders 35,750 19,256 5,816 13,143 10,757
Dividends attributable to shareholders 2,930 2,754 2,203 2,093 1,958
Consolidated Statement of Financial PositionInvestment properties 148,241 115,492 98,410 95,782 86,684Property, plant and equipment 18,397 18,510 21,183 18,831 15,514Interest in associates 5,510 4,238 4,009 4,182 781Interest in joint ventures 15,350 7,551 7,989 4,555 788Available-for-sale investments 3,362 1,331 706 2,858 2,921Properties for sale 29,732 17,797 17,272 9,235 5,784Bank deposits and cash 16,900 18,412 15,886 7,717 3,769Other assets 5,276 7,130 3,099 3,011 3,036
Total assets 242,768 190,461 168,554 146,171 119,277Bank loans and other borrowings (49,589) (39,844) (38,009) (31,282) (20,670)Other liabilities (22,530) (15,029) (13,030) (22,887) (18,689)
Net assets 170,649 135,588 117,515 92,002 79,918
Share capital: nominal value 2,754 2,754 2,754 2,448 2,448Other statutory capital reserves 16,573 16,573 16,573 7,758 7,758
Share capital and other statutory capital reserves 19,327 19,327 19,327 10,206 10,206Reserves 143,762 109,219 91,748 76,158 64,956
Shareholders’ equity 163,089 128,546 111,075 86,364 75,162Non-controlling interests 7,560 7,042 6,440 5,638 4,756
Total equity 170,649 135,588 117,515 92,002 79,918
Net debt 32,689 21,432 22,123 23,565 16,901
Financial DataPer share dataEarnings per share (HK$)– Core profit 2.51 2.33 1.75 2.38 1.75– Before property revaluation surplus 2.79 2.84 1.53 2.34 1.75– Attributable to equity shareholders 12.64 6.99 2.12 5.17 4.39Net asset value per share (HK$) 59.22 46.68 40.33 35.28 30.70Dividends per share (HK$ Cents) 100.00 100.00 80.00 80.00 80.00
Financial ratiosNet debt to shareholders’ equity (%) 20.0% 16.7% 19.9% 27.3% 22.5%Net debt to total equity (%) 19.2% 15.8% 18.8% 25.6% 21.1%Interest cover (Times) (Note c) 12.9 16.5 8.1 8.7 8.7Return on shareholders’ equity (%) (Note b) 24.5% 16.1% 5.9% 16.3% 15.3%Dividend payout (%)– Core profit 41.3% 42.9% 45.9% 34.6% 45.7%– Attributable to equity shareholders 8.2% 14.3% 37.9% 15.9% 18.2%
Notes:
(a) Core profit excludes investment property revaluation surplus, mark-to-market changes on financial instruments, impairment provision for properties and other non-recurring items including the loss of HK$1,620 million from the deemed disposal of Greentown interest on reclassification as available-for-sale investment and the attributable gain of HK$613 million from disposal of 50% interest in Taicang in 2015, the accounting gain from the acquisition of interests in Greentown of HK$2,233 million in 2012, revaluation of Hactl interest/tax write-back of HK$1,246 million in 2010 and profit on disposal of Beijing Capital Times Square of HK$1,393 million in 2009.
(b) Return on shareholders’ equity is based on profit attributable to shareholders over average shareholders’ equity during the year.(c) Interest cover is based on EBITDA over finance costs (before capitalisation and fair value loss/gain).(d) Certain figures have been reclassified or restated to comply with the prevailing HKFRSs.

A Chinese version of this Annual Report is available from the Company upon request.如有需要,可向本公司索取本年報之中文版本。
ART PIECE CREDIT:
Chow Chun-Fai, Tsim Sha Tsui, p.14
Bae Joon-Sung, Costume of Painter – kotkkoji girls, p.68-69
Des
ign,
Prin
ting
& P
rodu
ctio
n: G
enN
ex F
inan
cial
Med
ia L
imite
d w
ww
.gen
nexf
m.c
om
www.wharfholdings.com