Embed Size (px)
Citation preview
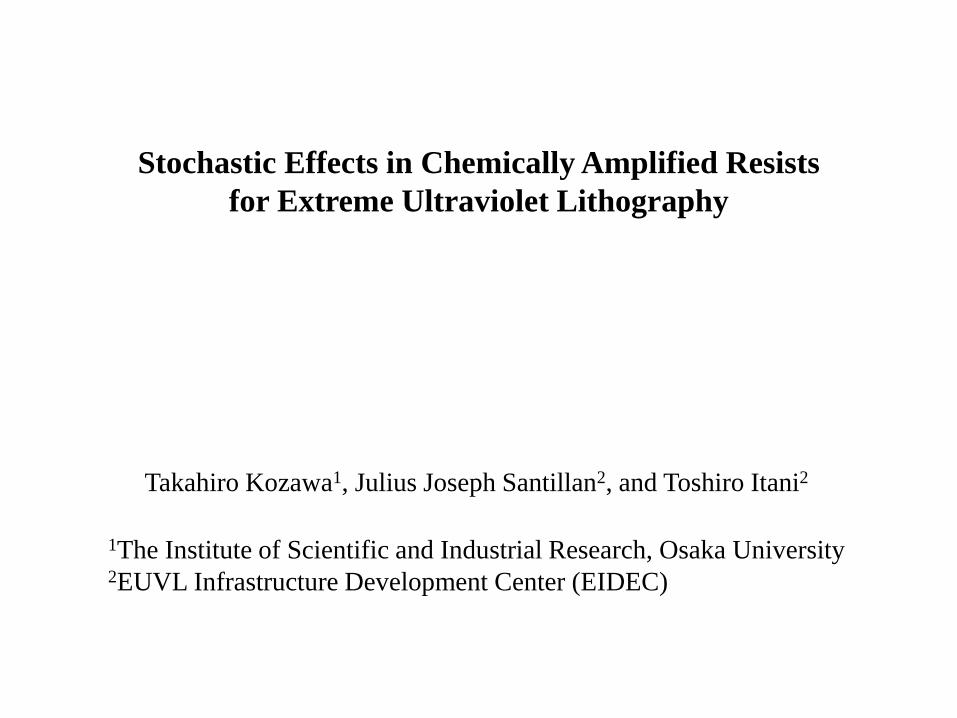
Takahiro Kozawa1, Julius Joseph Santillan2, and Toshiro Itani2
1The Institute of Scientific and Industrial Research, Osaka University 2EUVL Infrastructure Development Center (EIDEC)
Stochastic Effects in Chemically Amplified Resists
for Extreme Ultraviolet Lithography

Evaluation of resist materials
The performance of resist materials is generally
evaluated by comparing the resolution, LER,
and sensitivity.
Sensitivity
Resolution
LWR(LER)
Trade-off
Trade-off relationship
Exposure experiments
Resolution, Sensitivity, LWR(LER)
SEM image
The evaluation of the potential capability of
resist materials is tricky because of the trade-off
relationships between these factors.
It is essential to the evaluation and development of resist materials
to extract information from SEM images as much as possible.
For example, high sensitivity does not
necessarily mean high performance.

Small Field Exposure Tool : SFET
Source (Xe DPP)
Exposure
chamber
Mask loader
Wafer loader
Wafer
track
Items Target
Specifications
NA 0.3
Illumination
mode
Annular(0.3/0.7),
x-slit
Field size 0.2 x 0.6 mm
Magnification 1/5
Wavefront error <0.9 nm rms
Flare <7% (MSFR)
Source power 0.5W @IF
Wafer size 300 mm
Objective
Establishment of scientific foundation and technology for resist evaluation
The stochastic effect in line-and-space patterns fabricated using SFET was analyzed to clarify the relationship of stochastic effect to LER and resist pattern defects.
-30
30
Dev
iati
on
fro
m h
alf-
pit
ch
(no
min
al l
ine
wid
th)
(nm
)
0
0
12
LE
R (
nm
)
6
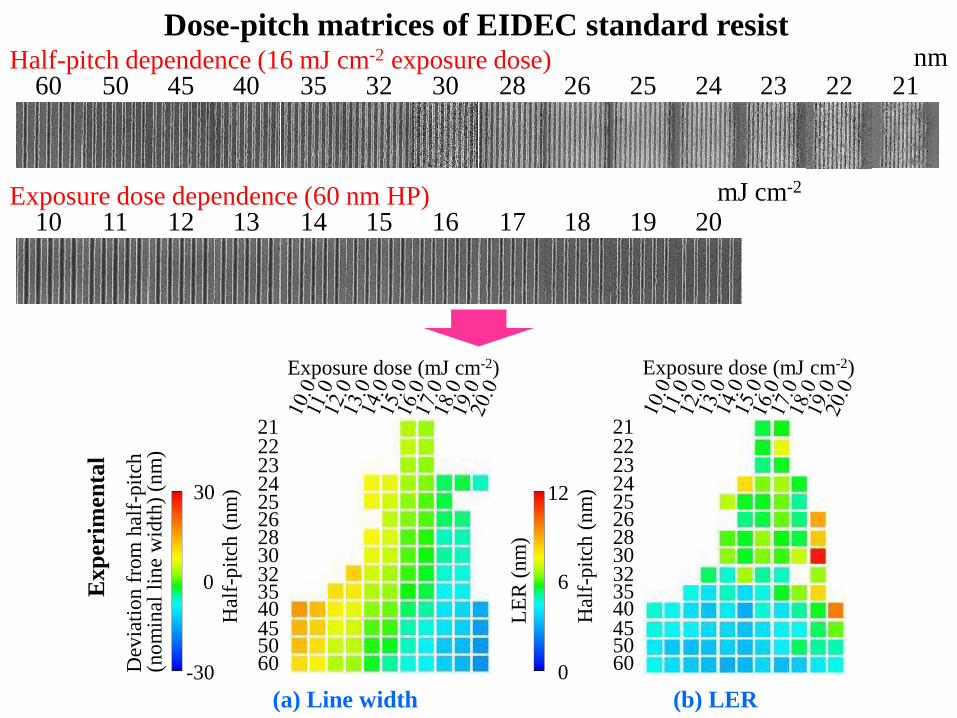
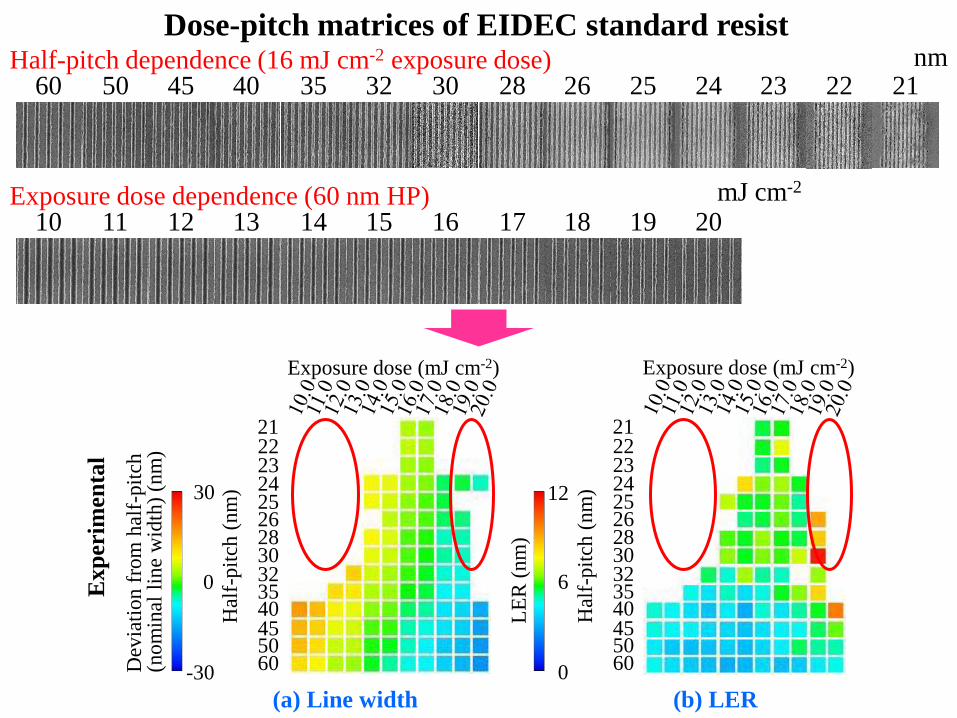
(b) LER (a) Line width
22 23 24 25 26 28 30 32 35 40 45 50 60
Exposure dose (mJ cm-2)
Hal
f-p
itch
(nm
)
Dose-pitch matrices of EIDEC standard resist
Exp
erim
en
tal
21 22 23 24 25 26 28 30 32 35 40 45 50 60
Exposure dose (mJ cm-2)
Hal
f-p
itch
(nm
)
21
Half-pitch dependence (16 mJ cm-2 exposure dose) 60 50 45 40 35 32 30 28 26 25 24 23 22 21
Exposure dose dependence (60 nm HP) 10 11 12 13 14 15 16 17 18 19 20
nm
mJ cm-2
-30
30
Dev
iati
on
fro
m h
alf-
pit
ch
(no
min
al l
ine
wid
th)
(nm
)
0
0
12
LE
R (
nm
)
6
(b) LER (a) Line width
22 23 24 25 26 28 30 32 35 40 45 50 60
Exposure dose (mJ cm-2)
Hal
f-p
itch
(nm
)
Dose-pitch matrices of EIDEC standard resist
Exp
erim
en
tal
21 22 23 24 25 26 28 30 32 35 40 45 50 60
Exposure dose (mJ cm-2)
Hal
f-p
itch
(nm
)
21
Half-pitch dependence (16 mJ cm-2 exposure dose) 60 50 45 40 35 32 30 28 26 25 24 23 22 21
Exposure dose dependence (60 nm HP) 10 11 12 13 14 15 16 17 18 19 20
nm
mJ cm-2

Analysis procedure
Step 1: Overall fitting – Probability density model
Step 2: Refitting with Monte Calro acid generation simulation – Hybrid model
Acid generation Catalytic chain reaction
Step 3: Analysis with Monte Carlo process simulation – Stochastic model
Stochastic effect was investigated using Monte Carlo method.
However, Monte Carlo method is not suitable for accurate calculation.
EUV photon
Ionization
Ionization Next ionization or excitation
Resist
Thermalization
photon
electron
E < Eth
E > Eth
hn
hn-Ie
-Ie
+
-
+
+
- - +Acid generator
Protected unit
(polymer)
Rp
Rq
Quencher
Deprotection
Neutralization
Acid
During PEB During exposure
Diffusion
Point spread function
Monte Carlo method
Reaction diffusion equations
Monte Carlo method Monte Carlo method
Reaction diffusion equations
0.0
0.2
0.4
0.6
0.8
1.0
10 20 30 40 50 60 70
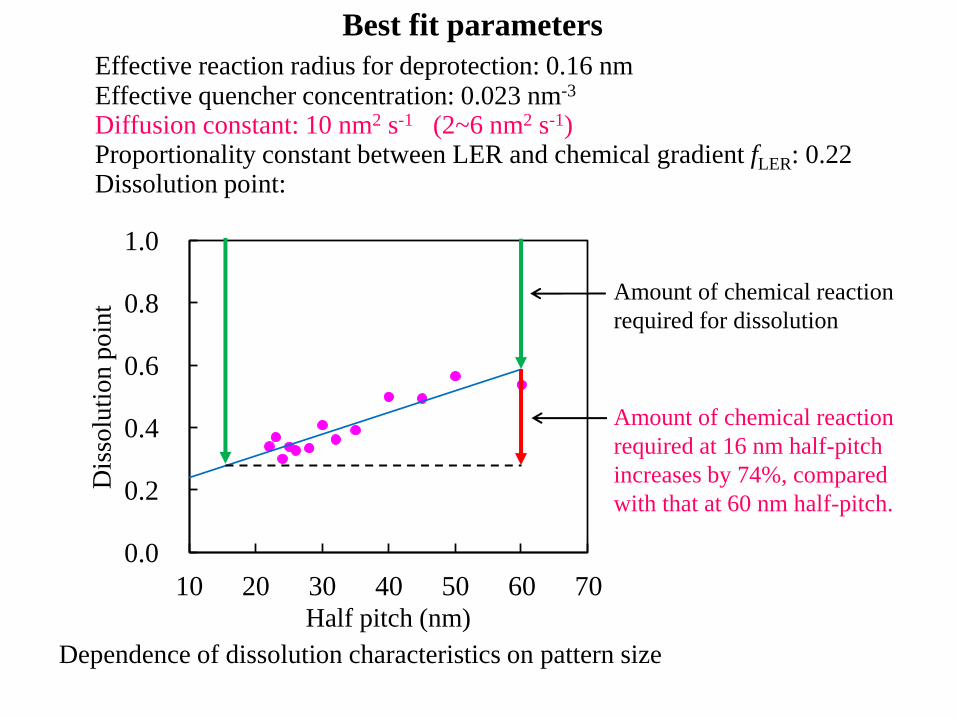
Best fit parameters
Effective quencher concentration: 0.023 nm-3
Effective reaction radius for deprotection: 0.16 nm
Diffusion constant: 10 nm2 s-1 (2~6 nm2 s-1) Proportionality constant between LER and chemical gradient fLER: 0.22
Dissolution point:
Half pitch (nm)
Dis
solu
tio
n p
oin
t
Dependence of dissolution characteristics on pattern size
Amount of chemical reaction
required for dissolution
Amount of chemical reaction
required at 16 nm half-pitch
increases by 74%, compared
with that at 60 nm half-pitch.
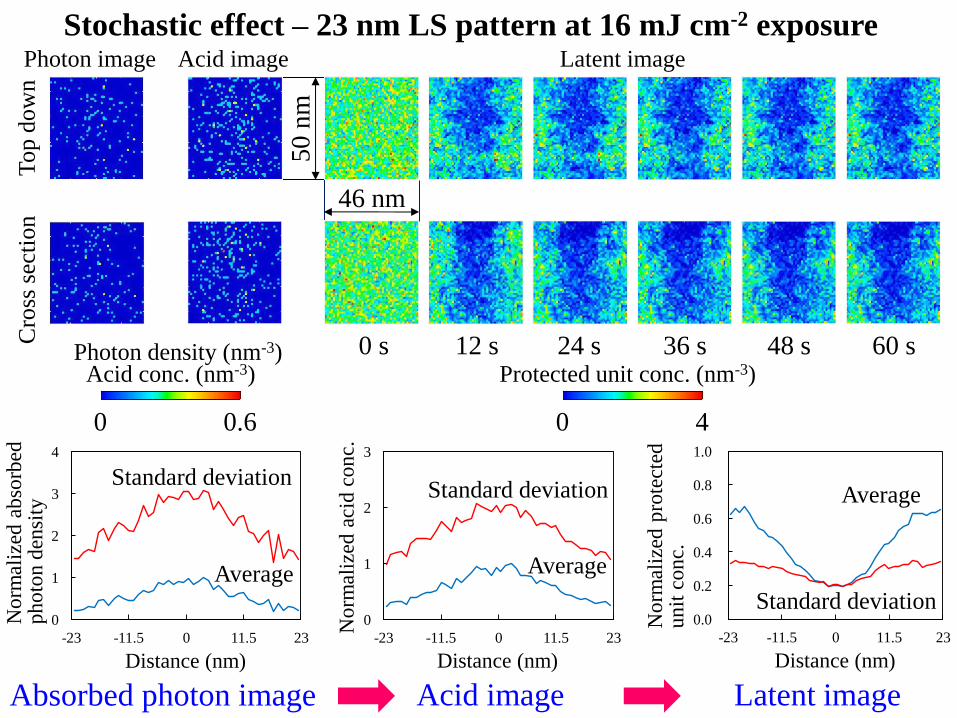
0
1
2
3
4
-23 -11.5 0 11.5 23
0
1
2
3
-23 -11.5 0 11.5 23
0.0
0.2
0.4
0.6
0.8
1.0
-23 -11.5 0 11.5 23
Distance (nm)
Absorbed photon image
No
rmal
ized
ab
sorb
ed
ph
oto
n d
ensi
ty
Standard deviation
Average
Acid image Latent image
12 s 24 s 36 s 48 s 60 s 0 s
Top d
ow
n
Cro
ss s
ecti
on
Acid conc. (nm-3)
0 0.6
Protected unit conc. (nm-3)
0 4
46 nm
50
nm
Stochastic effect – 23 nm LS pattern at 16 mJ cm-2 exposure Photon image
Photon density (nm-3)
Standard deviation
Average
No
rmal
ized
aci
d c
on
c.
Acid image
Distance (nm)
Latent image
Standard deviation
Average
No
rmal
ized
pro
tect
ed
un
it c
on
c.
Distance (nm)
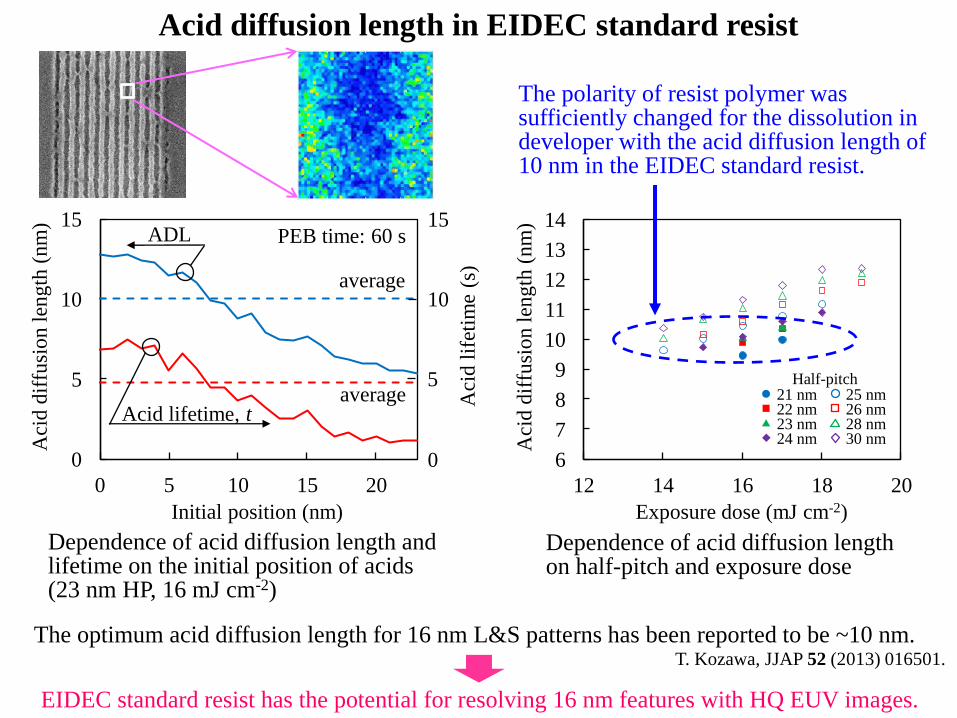
0
5
10
15
0 5 10 15 20
Acid diffusion length in EIDEC standard resist
Initial position (nm)
Aci
d d
iffu
sio
n l
eng
th (
nm
)
10
15
0
PEB time: 60 s
Aci
d l
ifet
ime
(s)
Acid lifetime, t
ADL
5
Dependence of acid diffusion length and lifetime on the initial position of acids (23 nm HP, 16 mJ cm-2)
average
average
6
7
8
9
10
11
12
13
14
12 14 16 18 20
Exposure dose (mJ cm-2) A
cid
dif
fusi
on
len
gth
(n
m)
21 nm 22 nm 23 nm 24 nm
25 nm 26 nm 28 nm 30 nm
Half-pitch
The optimum acid diffusion length for 16 nm L&S patterns has been reported to be ~10 nm.
EIDEC standard resist has the potential for resolving 16 nm features with HQ EUV images.
T. Kozawa, JJAP 52 (2013) 016501.
Dependence of acid diffusion length on half-pitch and exposure dose
The polarity of resist polymer was sufficiently changed for the dissolution in developer with the acid diffusion length of 10 nm in the EIDEC standard resist.

0.0
0.2
0.4
0.6
0.8
1.0
-22 -11 0 11 22
Latent image of 22 nm LS pattern at 16 mJ cm-2 exposure
Distance (nm)
Norm
aliz
ed p
rote
cted
unit
conc.
Pattern boundary (Exp.)
Average
+0.31s
-0.31s
s
Dissolution point
Normalized standard deviation of protected unit connected to a polymer
LER (Exp.)
The fluctuation of protected unit concentration leads to the fluctuation
of the crossing point between latent image and dissolution threshold.

0.0
0.1
0.2
0.3
0.4
0.5
0.6
20 22 24 26 28 30
a
Half-pitch (nm)
Ave. Monodisperse
Ave. Random
Relationship between protected unit fluctuation and LER
0.0
0.2
0.4
0.6
0.8
1.0
-23 -11.5 0 11.5 23
Distance (nm)
m ±as
±0.31-±0.37s fluctuation of protected units contributes to LER formation.
Monodisperse polymer
Randomly protected polymer
14 mJ cm-2
15 mJ cm-2
16 mJ cm-2
17 mJ cm-2
18 mJ cm-2
0.0
0.2
0.4
0.6
0.8
1.0
-30 -15 0 15 30
0.0
0.2
0.4
0.6
0.8
1.0
-30 -15 0 15 30
Distance (nm)
No
rmal
ized
pro
tect
ed u
nit
co
nc.
Average +0.31s
-0.31s
s
Dissolution point
Distance (nm)
No
rmal
ized
pro
tect
ed u
nit
co
nc.
Average +0.31s
-0.31s
s
Dissolution point
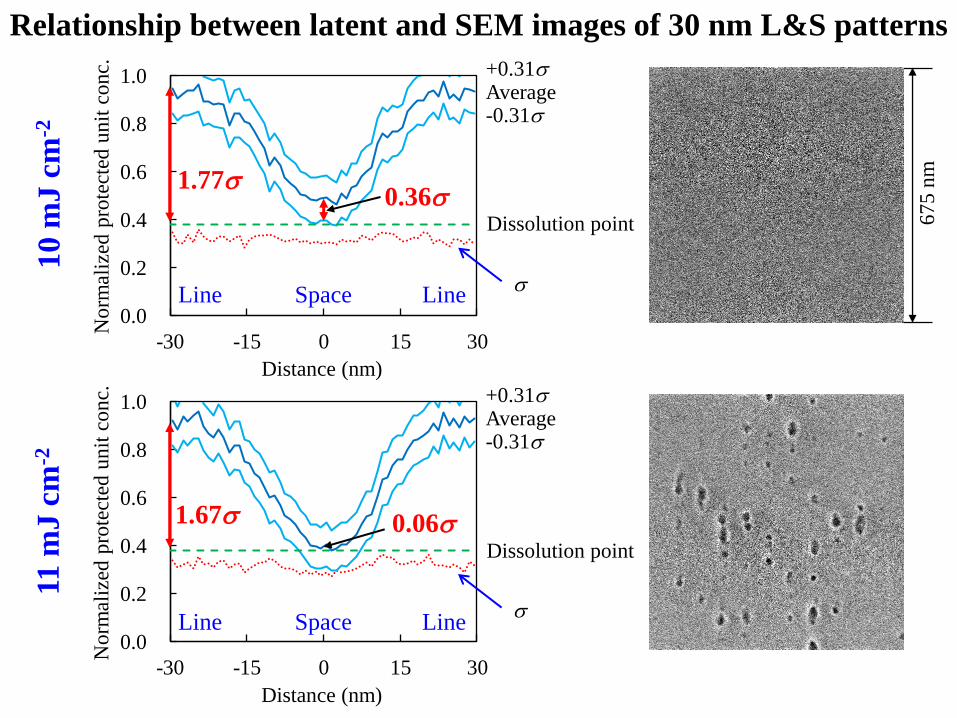
10 m
J c
m-2
Relationship between latent and SEM images of 30 nm L&S patterns
11 m
J c
m-2
67
5 n
m
1.77s
1.67s
0.36s
0.06s
Line Line Space
Line Line Space

0.0
0.2
0.4
0.6
0.8
1.0
-30 -15 0 15 30
0.0
0.2
0.4
0.6
0.8
1.0
-30 -15 0 15 30
Distance (nm)
No
rmal
ized
pro
tect
ed u
nit
co
nc.
Average +0.31s
-0.31s
s
Dissolution point
Distance (nm)
No
rmal
ized
pro
tect
ed u
nit
co
nc.
Average +0.31s
-0.31s
s
Dissolution point
12 m
J c
m-2
Relationship between latent and SEM images of 30 nm L&S patterns
13 m
J c
m-2
67
5 n
m
1.74s
1.64s
0.35s
0.72s
Line Line Space
Line Line Space

0.0
0.2
0.4
0.6
0.8
1.0
-30 -15 0 15 30
0.0
0.2
0.4
0.6
0.8
1.0
-30 -15 0 15 30
Distance (nm)
No
rmal
ized
pro
tect
ed u
nit
co
nc.
Average +0.31s
-0.31s
s
Dissolution point
Distance (nm)
No
rmal
ized
pro
tect
ed u
nit
co
nc.
Average +0.31s
-0.31s
s
Dissolution point
14 m
J c
m-2
Relationship between latent and SEM images of 30 nm L&S patterns
15 m
J c
m-2
67
5 n
m
1.56s
1.25s
0.88s
1.32s
Line Line Space
Line Line
Space
0.0
0.2
0.4
0.6
0.8
1.0
-30 -15 0 15 30
0.0
0.2
0.4
0.6
0.8
1.0
-30 -15 0 15 30
Distance (nm)
No
rmal
ized
pro
tect
ed u
nit
co
nc.
Average +0.31s
-0.31s
s
Dissolution point
Distance (nm)
No
rmal
ized
pro
tect
ed u
nit
co
nc.
Average +0.31s
-0.31s
s
Dissolution point
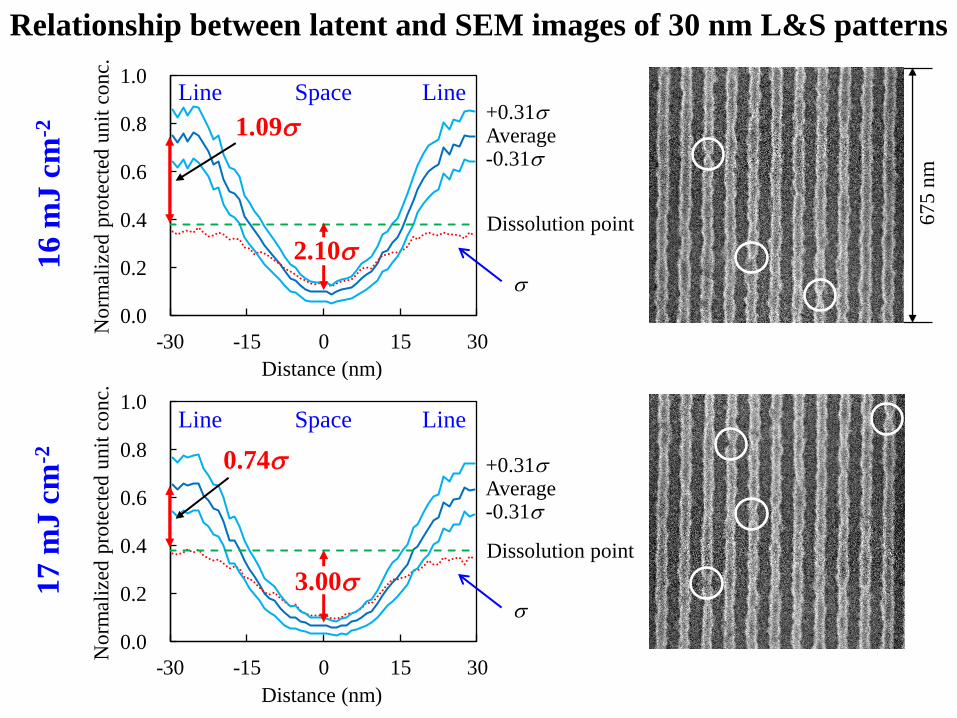
16 m
J c
m-2
Relationship between latent and SEM images of 30 nm L&S patterns
17 m
J c
m-2
67
5 n
m
1.09s
0.74s
2.10s
3.00s
Line Line Space
Line Line Space

0.0
0.2
0.4
0.6
0.8
1.0
-30 -15 0 15 30
0.0
0.2
0.4
0.6
0.8
1.0
-30 -15 0 15 30
Distance (nm)
No
rmal
ized
pro
tect
ed u
nit
co
nc.
Average +0.31s
-0.31s
s
Dissolution point
Distance (nm)
No
rmal
ized
pro
tect
ed u
nit
co
nc.
Average +0.31s
-0.31s
s
Dissolution point
18 m
J c
m-2
Relationship between latent and SEM images of 30 nm L&S patterns
19 m
J c
m-2
67
5 n
m 0.47s
0.30s
5.05s
3.57s
Line Line Space
Line Line Space

0.0
0.2
0.4
0.6
0.8
1.0
-30 -15 0 15 30
Distance (nm)
No
rmal
ized
pro
tect
ed u
nit
co
nc.
Average +0.31s
-0.31s
s
Dissolution point
20 m
J c
m-2
Relationship between latent and SEM images of 30 nm L&S patterns
67
5 n
m
0.05s
6.08s
Line Line Space
The same analysis was applied to the other SEM images.
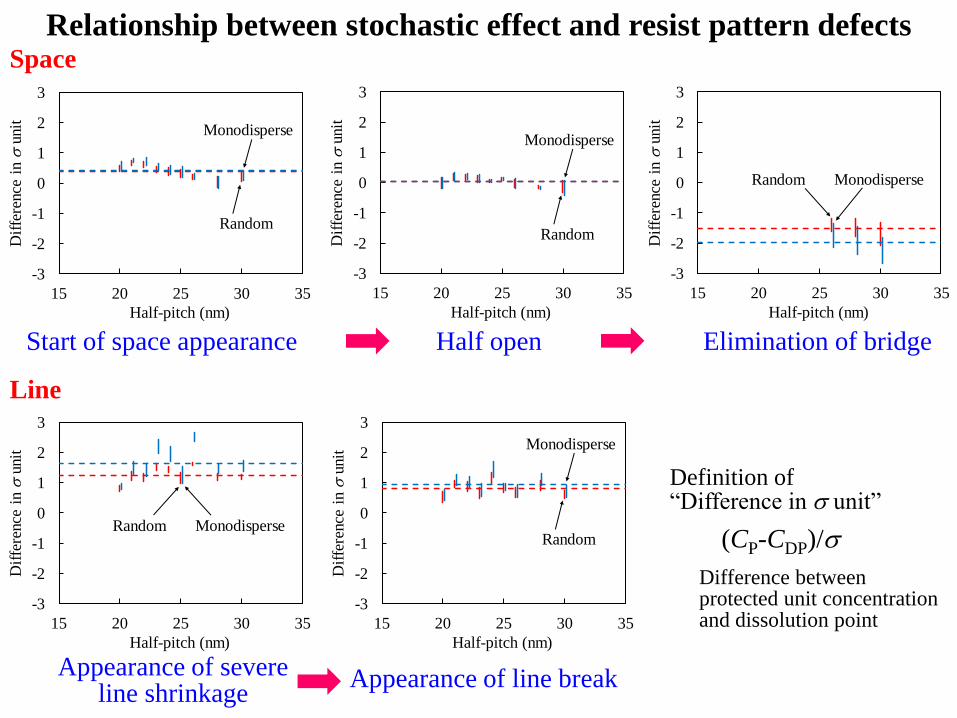
Start of space appearance
-3
-2
-1
0
1
2
3
15 20 25 30 35
Half-pitch (nm)
Dif
fere
nce
in s
unit
Random
Monodisperse
Space
Line
Half-pitch (nm)
-3
-2
-1
0
1
2
3
15 20 25 30 35
Random
Monodisperse
Dif
fere
nce
in s
unit
Half open
Relationship between stochastic effect and resist pattern defects
Half-pitch (nm)
-3
-2
-1
0
1
2
3
15 20 25 30 35
Random Monodisperse
Dif
fere
nce
in s
unit
Elimination of bridge
Half-pitch (nm)
-3
-2
-1
0
1
2
3
15 20 25 30 35
Random Monodisperse
Dif
fere
nce
in s
unit
Appearance of severe line shrinkage
Half-pitch (nm)
-3
-2
-1
0
1
2
3
15 20 25 30 35
Random
Monodisperse
Dif
fere
nce
in s
unit
Appearance of line break
Definition of “Difference in s unit”
(CP-CDP)/s
Difference between protected unit concentration and dissolution point
0.0
0.2
0.4
0.6
0.8
1.0
-30 -15 0 15 30
Distance (nm)
No
rmal
ized
pro
tect
ed u
nit
co
nc.
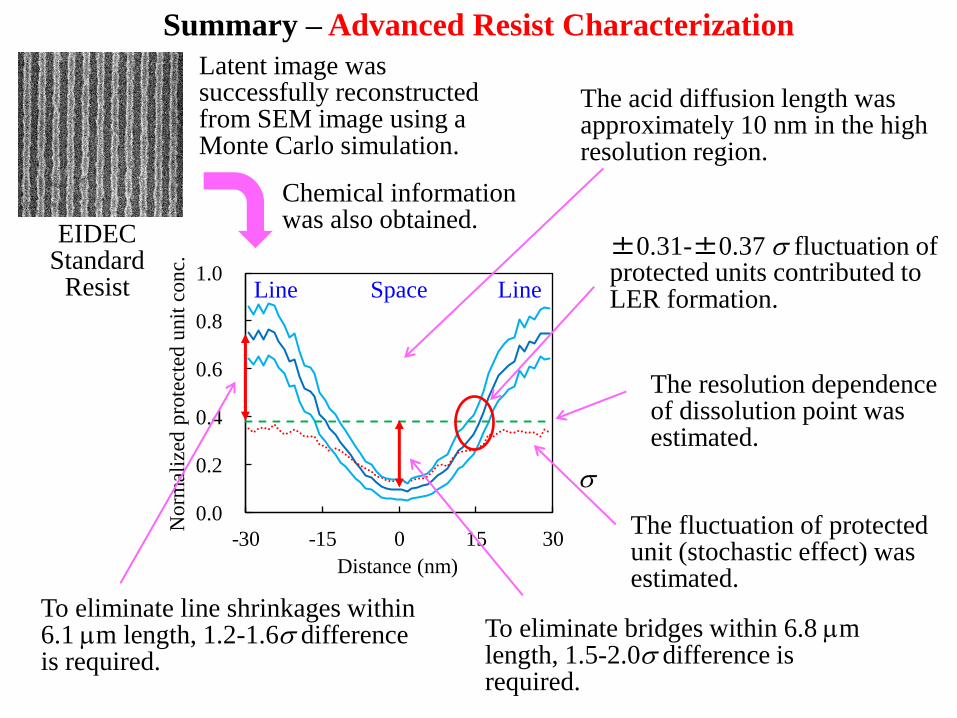
Summary – Advanced Resist Characterization
Line Line Space
Latent image was successfully reconstructed from SEM image using a Monte Carlo simulation.
The acid diffusion length was approximately 10 nm in the high resolution region.
To eliminate line shrinkages within 6.1 mm length, 1.2-1.6s difference is required.
±0.31-±0.37 s fluctuation of protected units contributed to LER formation.
To eliminate bridges within 6.8 mm length, 1.5-2.0s difference is required.
The fluctuation of protected unit (stochastic effect) was estimated.
The resolution dependence of dissolution point was estimated.
Chemical information was also obtained.
s
EIDEC Standard
Resist
This work was partially supported by the New Energy and
Industrial Technology Development Organization (NEDO).
Acknowledgement


![Synthesis of non-chemically amplified 193nm photo-resists ...€¦ · was the major driving force for advances in semiconductor fabrication during 1980s and 1990s [3]. DNQ/Novolac](https://img.dokumen.tips/doc/110x75/60486d2c359f494acc756277/synthesis-of-non-chemically-amplified-193nm-photo-resists-was-the-major-driving.jpg)