Embed Size (px)
Citation preview

S ti iti t El t i P E i iSome activities at Electric Power Engineering, Chalmers, Göteborg, g
AC network for wind turbine grids and SWPTCAC-network for wind turbine grids and SWPTC
Ola Carlson
Chalmers – Electric Power Engineering LTH, December 17, 2013 1 (26)

Clean electricity for clean environmentClean electricity for clean environment
Staff:13 senior researchers, 3 technicians & adminstrators, 25 Ph.D students
Power systems and power electronics
Electrical vehicle and transportation systems
Electrical machines and drives
Renewable energy and grid integration
Study sustainable power systems consisting HVDC transmission and smart-grid based distribution for higher efficiency and flexibility
Strive for electrification of transport systems by providing innovative and cost-effective concepts, convincing demonstration, and verified knowledge
Develop high-efficiency and high-performance drive solutions to maximize energy saving and material utilization
All-in-One drive train (deep
Explore technologies for renewable energy generation and integration, including wind, solar, and ocean for zero-emission and stable power supply
Power systems (analysis, market, dynamics, stability, operation, voltage and frequency control)
Power electronics in power systems (HVDC converter, AC& DC
On-board electric drivelines (motor, converter, and control)
Battery (charging/discharging optimization, lifetime analysis, and integration)
( pintegration of converter, motor, and mechanical parts for compact design)
High efficiency machine (design, modeling analysis prototyping
Wind turbine drive-train (generator, converter, transformer, and whole drive-train design)
Wind power integration (connection, stability, integration)(HVDC converter, AC& DC
transmission, and FACTS) DC network (DC/DC converter, DC
grid, and DC distribution) Smart-grid and distribution
( ffi i t MV t EV i
integration) Electrical system operation and
control on electric vehicles (HEV, EV, and PHEV)
Charging (on-board devices, h i & d i i t ti ff
modeling, analysis, prototyping, and measurement)
Converter and control (SiC, multi-level, and new topologies)
Advanced testing (efficiency, i d i i )
(connection, stability, integration) Renewable energy systems (ocean,
tidal, solar, generators, converters, and grid integration)
Energy storage (batteries, fl h l t i t ti
Chalmers – Electric Power Engineering LTH, December 17, 2013 2 (26)
(efficient MV system, EV in distribution, and demand-side management)
charging & drive integration, off-road wireless charging)
noise, and environment impacts) flywheel, storage integration, short-term storage for power stability)

Maximizing the integration of wind power in g g pdistribution systems (Lic Nov-13)
Shemsedin NurseboChalmers University of TechnologyChalmers University of TechnologyDepartment of energy and environment
Division of electrical power enegineering
Supervisors: Ola Carlson, Peiyuan Chen
Examiner: Ola CarlsonExaminer: Ola Carlson
Licentiate seminar
Financed by Chalmers Energy initiative
(CEI)
Chalmers – Electric Power Engineering LTH, December 17, 2013 3 (26)
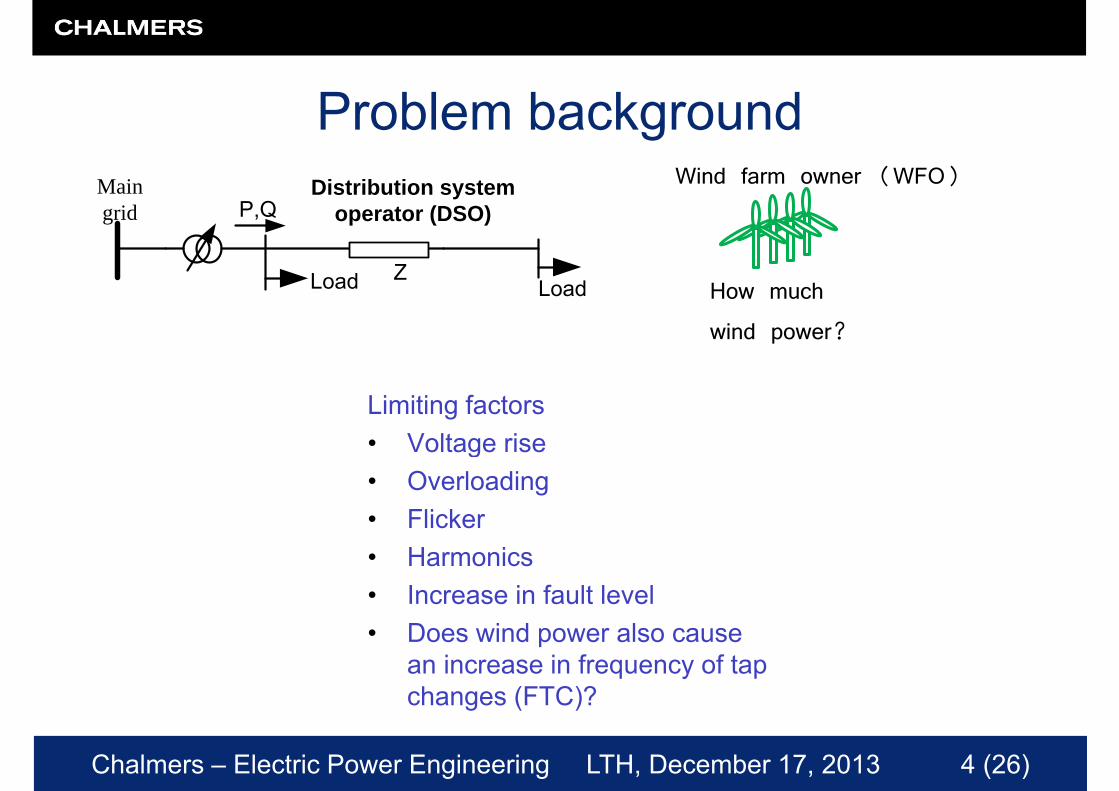
Wind farm owner (WFO)
Problem backgroundMain grid P,Q
Distribution system operator (DSO)
Wind farm owner (WFO)
Load LoadZ
How much
wind power?
Limiting factorsVoltage rise• Voltage rise
• Overloading• FlickerFlicker• Harmonics• Increase in fault level• Does wind power also cause
an increase in frequency of tap changes (FTC)?
Chalmers – Electric Power Engineering LTH, December 17, 2013 4 (26)
changes (FTC)?

The effect of wind power on frequency of tapThe effect of wind power on frequency of tap changes (FTC)
• Tap changer failure relates to the number of tap changes
• The main cause of transformer f il i f lt t hfailure is a faulty tap changer
Chalmers – Electric Power Engineering LTH, December 17, 2013 5 (26)

The effect of wind power on frequency of tapThe effect of wind power on frequency of tap changes (FTC)
Operation:Ope at o• Set point voltage
at substation busbar = 10 7kVat substation busbar = 10.7kV
• Deadband=±1.2%
Chalmers – Electric Power Engineering LTH, December 17, 2013 6 (26)

The effect of wind power on frequency of tapThe effect of wind power on frequency of tapchanges (FTC)
10
12
Wind powerLoad(active power)Load (reactive power)
6
8
MW
,MV
ar)
( p )
Installed capacity of wind power: 12 225MW
2
4P
ower
(M12.225MW
Operating with unity power factor
0 2000 4000 6000 8000-2
0
Time (hours)
p g y p
Chalmers – Electric Power Engineering LTH, December 17, 2013 7 (26)
Time (hours)

The effect of wind power on frequency of tapThe effect of wind power on frequency of tap changes (FTC)
100120140
chan
ges
20406080
mbe
r of
tap
020
Num
timetimeLoad only (585 changes) Load + Wind power (505 changes)
However further analysis shows wind power does not always decrease the FTC
during one year
Chalmers – Electric Power Engineering LTH, December 17, 2013 8 (26)
However further analysis shows wind power does not always decrease the FTC

Mitigation of increase in FTC using reactiveMitigation of increase in FTC using reactive power compensation (RPC)
Load and wind power data Vs tap positionLoad and wind power data Vs tap position
0 50
1,00
1,50
2,00
0,98
0,99
ge (p
.u))
0 5
1
1,5
2
0,98
0,99
e (p
.u))
-1,00
-0,50
0,00
0,50
0,96
0,97
00 00 03 00 06 00 09 00 12 00 15 00 18 00 21 00
Vol
tag
-1
-0,5
0
0,5
0,96
0,97
Vol
tage
00:00 03:00 06:00 09:00 12:00 15:00 18:00 21:00Time (hour)
Voltage Vmax
Vmin Reactive power compensation
00:00 03:00 06:00 09:00 12:00 15:00 18:00 21:00Time (hour)
Voltage Vmax Vmin Tap position
Chalmers – Electric Power Engineering LTH, December 17, 2013 9 (26)
Tap position with RPC

Mitigation of increase in FTC using reactiveMitigation of increase in FTC using reactive power compensation (RPC)
• Case study:External grid
SCC 170 MVASCC=170 MVAX/R=10 9 MW
10 7 kV ±1 2%
3 MW
10.7 kV ±1.2%45±8×1.67%/11.5 kV
CC
MinimumMinimumpower factorpower factor
Change in the FTC Change in the FTC (%(%∆∆FTC)FTC)
Average Average power loss power loss (kW)(kW)
reactive power from the wind reactive power from the wind turbinesturbines
Average (Average (kVarkVar)) ((MVarMVar))CaseCase
g (g ( )) (( ))
11 11 00 1616 00 00
22 0.950.95 --2121 1616 1515 0.70.7
33 0.900.90 --3030 1616 2525 0.90.9
44 0.800.80 --4040 1616 3636 1.01.0
55 0 00 0 --100100 1414 176176 1 01 0
Chalmers – Electric Power Engineering LTH, December 17, 2013 10 (26)
55 0.00.0 100100 1414 176176 1.01.0

Wind power hosting capacity (HC) ofWind power hosting capacity (HC) of distribution systems
H h i d th ? Net(active power) Wind power• How much wind power, then?Main limiting factors • Voltage rise 12 225
15
Net(active power) Wind power
Load(active power) Load (reactive power)
• Voltage rise• Thermal overloadingShould we limit the HC based on 5
1012.225
worst case analysis?0
5
-10
-5
→ 10.5 Max based on worst case analysis• Total installed wind power 12 225 MW
0 2000 4000 6000 800010
Time (hours)
Total installed wind power 12.225 MW• Maximum observed reverese power flow 9.14 MW
Chalmers – Electric Power Engineering LTH, December 17, 2013 11 (26)

H ti it t dHosting capacity: case studyCapacity factor 28%
Discount rate 5%
Additional capacity(MW) 7.0
Curtailed Energy(%) 3.3%
145,0
With AMS
3.3% curtailment
81012
2,5 3,0 3,5 4,0 4,5
W
in m
illio
n €
12.225 + 7.0 = 19.225 MW
Based on worst case consideration = 10
+ 0.5= 10.5 MW 0246
0,0 0,5 1,0 1,5 2,0
,
MW
Am
ount
Percentile increase
= (19.23 -
10.5)/10.5100%
,1% 2% 3% 4% 5% 6% 8% 9% 10
%
11%
12%
13%
14%
15%
Curtailed energy
Additional capacity AMS costs
Chalmers – Electric Power Engineering LTH, December 17, 2013 12 (26)
= 83%p y
Cost of reinforcement WFO net benefit

Chalmers – Electric Power Engineering LTH, December 17, 2013 13 (26)

Hosted by
VÄRLDENS SKILLNAD
Hosted by Chalmers University of TechnologyDepartment of Energy and Environment
Chalmers – Electric Power Engineering LTH, December 17, 2013 14 (26)

Swedish Wind Power Technology Center
To support the Swedish industry with
knowledge about design issues
di i d Th S di hregarding wind power The Swedish
Wind Power Technology Centre d o e ec o ogy Ce e
(SWPTC) has been founded.
Chalmers – Electric Power Engineering LTH, December 17, 2013 15 (26)

Partners
Chalmers – Electric Power Engineering LTH, December 17, 2013 16 (26)

Personnel• At university: 12 senior researcher
8 PhD students2 technicians
• At industry: 25 persons
• Other: 4 persons
• Total: 50 persons works within SWPTC
Chalmers – Electric Power Engineering LTH, December 17, 2013 17 (26)

O i j i hi SWPTCOn-going projects within SWPTCTG1 4 Grid code testing
TG1-1 Control of turbines
TG1-4 Grid code testing
TG5 1 Load and risk based
TG2-2 Fatigue loads in forest regions
TG1-6 LIDAR system for optimisation
TG5-1 Load- and risk-based maintenance
TG5-2 Current induced damages in b i
TG2-1 Models of rotor blades TG1-2 Models of
bearings
TG1 2 Models of electrical drive
TG4 2 Optimisation ofTG1-5 Measurements for verification
TG4-2 Optimisation of blades
TG6 2 Methods for deTG4-1 Models of turbines
TG3-1 Models of TG6-1 Sensors for d t ti f i
TG6-2 Methods for de-icing of blades
TG3-2 Compound
Chalmers – Electric Power Engineering LTH, December 17, 2013 18 (26)
mechanical drive detection of iceTG3 2 Compound bearings

General Electric design and install Göteborg Energi operate:
Grid code testing by VSC-HVDCGeneral Electric design and install, Göteborg Energi operate:
Chalmers cooperation:Chalmers cooperation:• Validation of models for
mechanical and electrical systems• Develop and carry out
Grid code tests of the wind turbine
Chalmers – Electric Power Engineering LTH, December 17, 2013 19 (26)8 MW HVDC-light converter4 MW General Electric

Chalmers – Electric Power Engineering LTH, December 17, 2013 20 (26)

Chalmers – Electric Power Engineering LTH, December 17, 2013 21 (26)

HVDC GöteborgHVDC Göteborg• System
HVDCConnection Grid
VindkraftverkGE 4 1 MWHVDC
HVDC
Grid GE 4.1 MW
HVDC
Chalmers – Electric Power Engineering LTH, December 17, 2013 22 (26)

Grid Code testing byg yVoltage Source ConvertersGöteborg Energi & ChalmersGöteborg Energi & Chalmers
Current measurement
0.30 0.40 0.50 0.60 0.70 0.80 0.90 1.00 1.10
Voltage [pu]
LVRT profileDanish LVRT RCL-filter
Time [s] 0.0 1.0 2.0 3.0 4.0 5.0
0.00 0.10 0.20
0200.00 0.20 0.40 0.60 0.80 1.00 1.20
age [pu]
VSC1 out 2
(a) Controlled PCC voltage
Surge arrester and breaker
Time [s] 0.0 1.0 2.0 3.0 4.0 5.0
-1.00 -0.80 -0.60 -0.40 -0.20
Voltag
(b) Voltage measurement
LVRT TEST. (a) Danish grid code, (b) Controlled PCC voltage.
Simulation results from PSCAD calculations.
Chalmers – Electric Power Engineering LTH, December 17, 2013 23 (26)Department of Energy and EnvironmentNicolás Espinoza and Ola Carlson
Division of Electric Power Engineering

Lab-tests at Electric Power Engineering
Chalmers – Electric Power Engineering LTH, December 17, 2013 24 (26)

Proposed test and demonstration in GöteborgProposed test and demonstration in Göteborg
Chalmers – Electric Power Engineering LTH, December 17, 2013 25 (26)
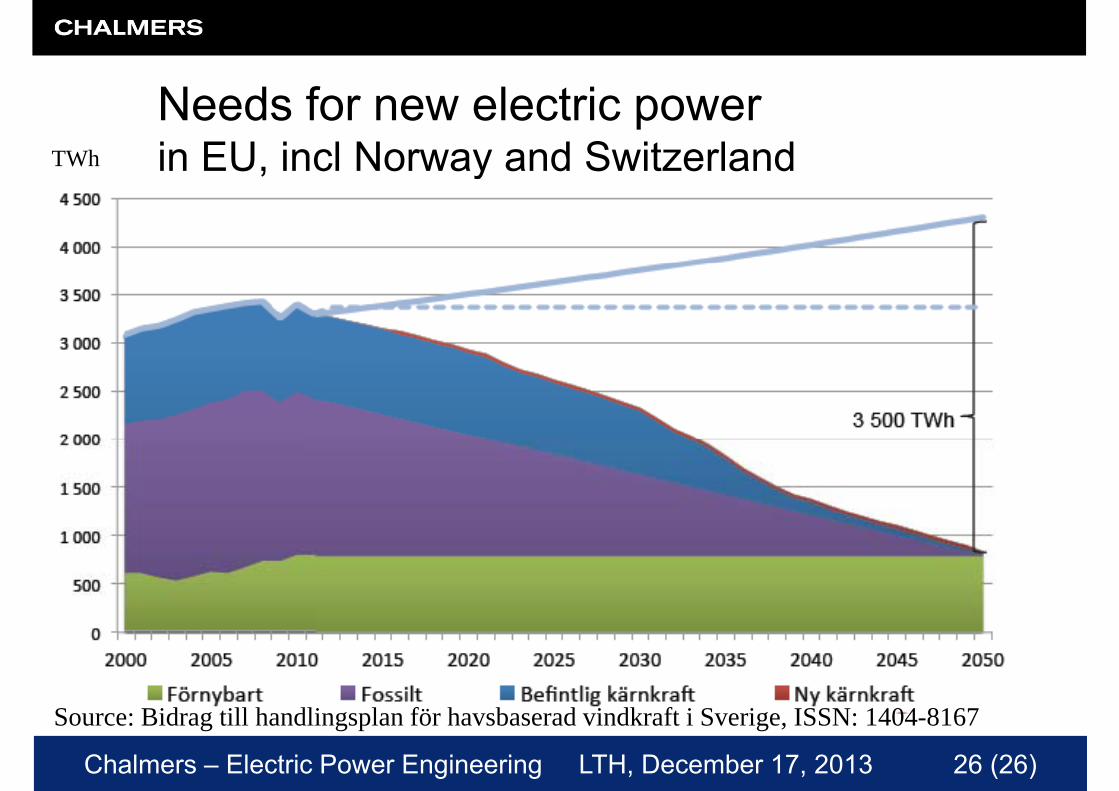
N d f l t iNeeds for new electric powerin EU, incl Norway and SwitzerlandTWh , y
Chalmers – Electric Power Engineering LTH, December 17, 2013 26 (26)
Source: Bidrag till handlingsplan för havsbaserad vindkraft i Sverige, ISSN: 1404-8167