Embed Size (px)
Citation preview

N A S A TECHNICAL NOTE
'11
_I- NASA TN *- D-33117
STIFFNESS PROPERTIES OF FOAM-FILLED FABRIC STRUCTURES
by Jerry W. Deaton and George W. Zender
Ldngley Resedrcb Center Langley station, Hdmpton, VU,
, N A T I O N A L AERONAUTICS AND SPACE A D M I N I S T R A T I O N WASHINGTON, D. i
I
https://ntrs.nasa.gov/search.jsp?R=19660010302 2019-08-29T02:59:14+00:00Z

TECH LIBRARY KAFB. NM
STIFFNESS PROPERTIES OF FOAM- FILLED FABRIC STRUCTURES
By Jerry W. Deaton and George W. Zender
Langley Research Center Langley Station, Hampton, Va.
N A T I O N A L AERONAUTICS AND SPACE ADMINISTRATION
For sale by t h e Clearinghouse for Federal Scientific and Technical Information Springfield, Virginia 22151 - Price $2.00

STIFFNESS PROPERTIES OF FOAM-FILLED FABRIC STRUCTURES
By Je r ry W. Deaton and George W. Zender Langley Research Center
SUMMARY
Results on both foam-filled and air-inflated fabric structures subjected to uniaxial, biaxial, shear , o r bending stresses are presented and discussed. The resul ts indicate that the stiffness properties of the foam-filled models are superior to those of the air- inflated models when compared on a inass-stiffness basis. The results also indicate that the stiffness properties of the foam are not proportional to foam density (stiffness increases faster than density) for the range of foam density of the investigation. highest values of stiffness for both the air-inflated and the foam-filled models are obtained
specimen. than the values usually encountered for isotropic materials. that the strength in shear for the foam-filled cylinders varies linearly with foam density and increases at about the same rate as foam density.
The
I when the greater yarn count of the fabric is oriented in the longitudinal direction of the
The values of Poisson's ratio for the foam-filled beams were, in general, less The results also indicate
INTRODUCTION
Expandable structures fabricated from films or fabric tnaterials and utilizing
A particular fabric construction which has been used at the gases or foams for expansion and rigidization in space a re being considered for many aerospace applications. Langley Research Center in studies (see refs. 1 and 2) of inflatable structures is known as Airmat and w a s developed by the Goodyear Aerospace Corporation. These studies have utilized air for inflation. Contained herein are the results of an investigation to determine the material properties of a particular nylon-neoprene fabric (manufacturer's designation XA27A119) by using a rigid closed-cell polyurethane foam for expansion and rigidization. Results on air-inflated models are presented for coniparison with the foam- filled models.
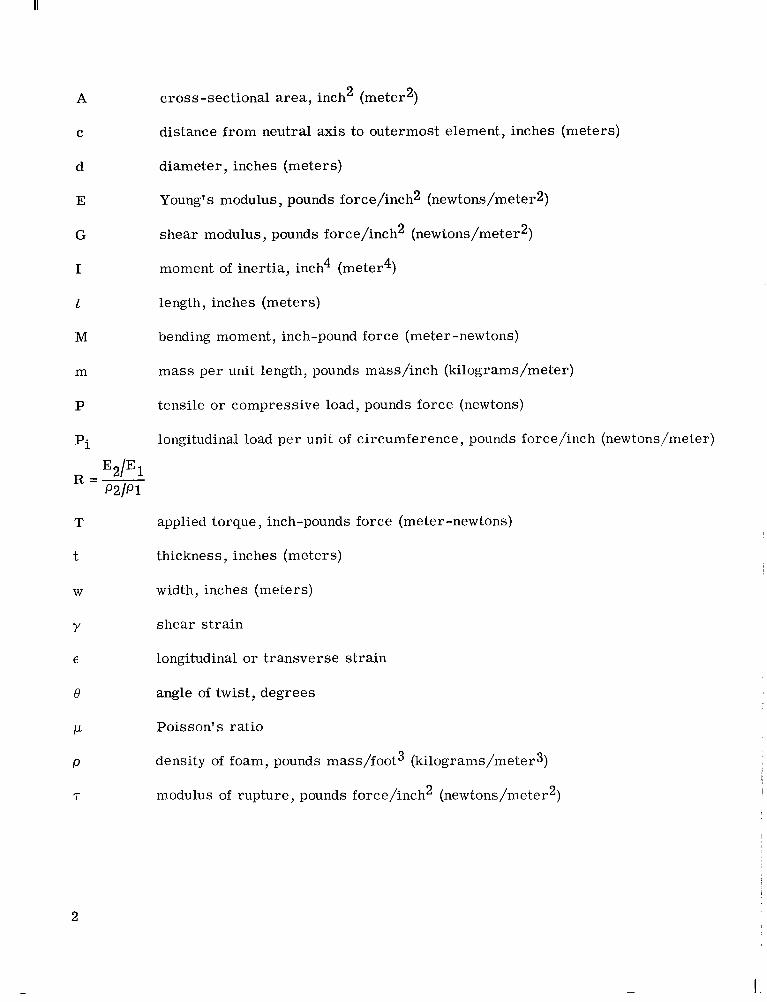
SYMBOLS
The units used for the physical quantities defined in this paper a r e given both in the U.S. Customary Units and in the International System of Units (SI). pertinent to the present investigation are presented in the appendix and in reference 3.
Conversion factors
cross-sectional area, inch 2 (meter 2 ) A
C distance from neutral axis to outermost element, inches (meters)
d diameter, inches (meters)
E
G
I
I? length, inches (meters)
M
Young's modulus , pounds force/inch2 (newtons/meterz)
shear modulus, pounds force/inch 2 (newtons/meter2)
moment of inertia, inch 4 (meter4)
bending moment, inch-pound force (meter -newtons)
m
P
mass per unit length, pounds mass/inch (kilograms/meter)
tensile or compressive load, pounds force (newtons)
Pi longitudinal load per unit of circumference, pounds force/inch (newtons/meter)
T
t thickness, inches (meters)
applied torque , inch-pounds force (meter-newtons)
W width, inches (meters)
Y shear s t ra in
E longitudinal or transverse s t ra in
e angle of twist, degrees
P Poisson's ratio
P
7
density of foam, pounds mass/foot3 (kilograms/meted)
modulus of rupture, pounds force/inch2 (newtons/meter2) i
2

Subscripts :
a Airmat
f foam
122 first or second value
TEST SPECIMENS AND METHOD OF TESTING
The fabric used for the present investigation consists of two surfaces tied together with "drop" yarns that provide a l-inch (2.5-cm) space between surfaces when inflated. (See fig. 1.) Each surface consists of a nylon inner ply of Airmat weave with a coating of neoprene and a light nylon cover ply of plain weave which is also coated with neoprene. Other details of the fabric a r e given in table I and reference 1. Both the inner and cover ply shown in figure 1 contain one set of yarns (warp) with considerable crimp and another se t of yarns (fi l l) which is more nearly straight. The inner and cover plies a r e oriented at 90° to each other so that the crimped yarns of one ply a r e alined with the more nearly straight yarns of the other ply. For purposes of specifying orientation of the fabric, the direction of the yarns of the heavier inner ply a re employed; that is, the direction of the warp yarns of the inner ply is termed the warp direction of the fabric, whereas the direc- tion tranverse to the warp direction is termed the f i l l direction. One set of specimens w a s made with the warp yarns and one set was made with the f i l l yarns oriented in the longitudinal direction of the specimens; hereinafter , the specimens with the warp yarns oriented in the longitudinal direction a r e referred to as warp specimens and the speci- mens with the f i l l yarns oriented in the longitudinal direction are referred to as f i l l specimens.
Three types of specimens were tested: a plain s t r ip of the fabric, a cylinder, and a beam. General details of each type a r e shown in figure 2.
The s t r ip specimens were clamped with aluminum plates at each end as indicated in figure 2(a) and were subjected to tensile loads with deadweights. The inner sides of the fabric were in contact during the tes ts rather than separated with extended drop yarns as indicated in figure 2(a).
Two types of cylinders were tested: One w a s air inflated and the other w a s filled with a rigid closed-cell polyurethane foam. The cylinders were made of one surface of the fabric obtained by severing the drop yarns between the two surfaces so that approx- imately 0.5 inch (1.3 cm) of the drop yarns remained with each surface. The surface w a s then fabricated into cylindrical form by splicing. The foam-filled cylinders employed
3
1

I - , . . .-.... - I l l I
one splice as shown in figure 2(c), whereas the air-inflated cylinders utilized two diamet- rically opposite splices as shown in figure 2(d). Two air-inflated cylinder specimens were tested; one was a warp specimen and one was a fill specimen. Six foam-filled cylinders, two each of three nominal foam densities, were tested. (See table 11.) One specimen of each foam density was a warp specimen and one of each foam density was a fill specimen.
The cylinder specimens were subjected to torsion and to longitudinal tensile loads as shown in figures 3 and 4. The foam-filled cylinders were also tested in compression by using a hydraulic testing machine with a capacity of 120 kips (534 KN). After all s t ra in data were obtained on the foam-filled cylinder specimens, the specimens were tested to failure in torsion by using a torsion testing machine with a capacity of 60 000 inch-pounds (6780 m-N), as shown in figure 5.
Six foam-filled beam specimens (see fig. 2(b)), two each of three nominal foam densities (see table 11), were tested. One specimen of each foam density was a warp specimen and one of each foam density was a f i l l specimen. The beam specimens were subjected to end bending moments as shown in figure 6. Two bending tes ts were made on each of the six beam specimens. One test was made with one side of the beam resting on the supporting fixture shown in figure 6 and the other tes t was made with the opposite side of the beam resting on the supports. For all bending tests the specimens were cen- tered on the supports which were 10 inches (25.4 cm) apart. Bending moments were introduced by applying deadweight loads 7.5 inches (19.1 cm) from each support as shown in figure 6.
Strains on all specimens were measured with Tuckerman optical s t ra in gages of 1- or 2-inch (2.5- o r 5.1-cm) gage length. Longitudinal s t ra ins were obtained at the midlength of each specimen and transverse s t ra ins were also obtained at the midlength of each surface of the foam-filled beam specimens. In addition, shear strains were also measured on the foam-filled cylinder specimens. One of the characteristics of woven materials is that the s t ra in under load is time dependent (see ref. 1) and careful timing is required to obtain useful s t ra in data from specimens. For all specimens, loads were applied without unloading until maximum load was reached and the s t ra in measurements were obtained at each load increment after sufficient time had elapsed (approximately 5 minutes) for the s t ra in to be essentially constant with time.
The twist at the loaded end of the air-inflated and foam-filled cylinder specimens was measured by using an indicating a rm attached to the wooden end piece and a pro- tractor of 15-inch (38.1-cm) radius mounted to the supporting frame shown in figure 3. For the torsion failure testing of the foam-filled cylinder specimens, relative twist meas- urements were obtained from two indicating a r m s attached to the cylinder 10 inches (25.4 cm) apart and f rom two protractors of 14-inch (35.6-cm) radius. (See fig. 5.) Twist
4
. .. ,

measurements were obtained by using the same loading and time procedure as previously described. Internal pressure of the air-inflated cylinders was measured with a Bourdon tube pressure gage with a range of 0 to 15 psig (0 to 103.4 kN/m2). All tests were per- formed at room temperature (approximately 75O F (30OOK)).
After all tests were completed, foam density measurements were made on samples taken from each of the foam-filled specimens. length of each cylinder and values of foam density were obtained. The results a r e shown in figure 7. It is evident from the figure that a definite density variation occurs along the length of the cylinder specimens. along with the shape and orientation of small foam cells observea in the samples, indi- cates that the cylinders were probably foamed with the longitudinal direction of the cylinder in a vertical position. Density measurements were made on three samples taken from each beam specimen along its length. These measurements did not indicate a variation in density with length of specimen as was obtained with the cylinder specimens. Table II gives the average of foam densities obtained from the samples taken from each specimen.
Five foam samples were taken along the
The variation of foam density with cylinder length,
RESULTS
Strips and Air-Inflated Cylinders
Figure 8 shows a typical set of s t ress-s t ra in results for the s t r ip specimens and the air-inflated cylinder specimens. measured on opposite sides of the specimens. the circular symbols a r e for the s t r ip specimens subjected to uniaxial loading. lighter solid curve labeled "due to pressure" shows the longitudinal strain obtained for values of the longitudinal load per unit of circumference Pi for the cylinder as the pressure was slowly increased to 15.0 psig (103.4 kN/m2), and the dashed curve indicates the longitudinal s t ra ins for decreasing pressures. Also shown in figure 8 are the longi- tudinal strains obtained for longitudinal tensile loads that were applied after the cylinder was in an initial state of tension due to internal pressure. obtained as the internal pressure was slowly increased until the desired pressure level w a s obtained. Then the pressure was held constant and longitudinal tensile loads were introduced. Tensile loads w e r e applied at pressure levels of 2.5 to 15.0 psig (17.2 to to 103.4 kN/m2) in increments of 2.5 psig. Only data for pressures of 2.5, 7.5, and 15.0 psig (17.2, 51.7, and 103.4 kN/m2) a r e shown in figure 8. The values of longitudinal stiffness Et shown in figure 8 were obtained from the slopes of the nearly linear curves faired through the data points. For the warp cylinder the stiffness values for the six pressure levels varied from 926 to 976 lbf/in. (162.2 to 170.9 kN/m) and had an average
The symbols show the average of the s t ra ins The data shown by the curve faired through
The
Longitudinal s t ra ins were .
5

value of 957 lbf/in. (167.6 kN/m). f rom 719 to 776 lbf/in. (125.9 to 135.9 kN/m) and had an average value of 754 lbf/in. (132.0 kN/m) for the six pressure levels. warp and fill s t r ip specimens were 739 lbf/in. (129.4 kN/m) and 471 lbf/in. (82.5 kN/m), respectively. The difference in stiffness values for the pressurized cylinders and strip specimens is to be expected since the two specimens a r e under different s t ress condi- tions. (See ref. 1.)
The longitudinal stiffnesses for the f i l l cylinder varied
The longitudinal stiffnesses obtained for the
Figure 9 shows the torque-twist results obtained with the air-inflated cylinders for values of the longitudinal pressure s t ress Pi (various pressure levels). For small values of torque or twist, the shear stiffness Gt (based on elementary torsion theory with the effect of the splices neglected) is about 65 lbf/in. (11.4 kN/m) for both the fill and the warp cylinders at all the pressure stresses. The shear stiffness decreases as the torque or twist increases, and it becomes dependent on the pressure stress. No visible wrinkling or buckling of the cylinders was observed for the range of loads included in figure 9.
Foam-Filled Cylinders Subjected to Tension, Compression, and Torsion
Figure 10 shows a typical set of results for the foam-filled cylinder specimens sub- jected to longitudinal tensile and longitudinal compressive loads. average strains measured on opposite sides of the specimens. The data shown are for cylinders having a foam density of 2.0 lbm/ft3 (32.0 kg/m3). The circular symbols indicate the strains measured as tensile loads were applied to the cylinder (see fig. 4) and the square symbols indicate the measured strains for the specimens under applied compressive loads. Also indicated in figure 10 by the dashed lines are the load-strain curves corresponding to the average value of longitudinal stiffness for the pressurized cylinders under direct tensile load. The curves labeled "foam" in figure 10 represent the load-strain characteristics for the foam alone, based on the assumption that the fabric has the same value of stiffness in tension and compression and the same value as the average given previously. These curves were obtained by selecting a value of strain and then subtracting the corresponding load of the dashed curve from the load (for the same value of strain) of the curve faired through the data points. Data similar to those shown in figure 10 were obtained for each of the foam-filled cylinder specimens. The slope of the curves labeled "Foam" in figure 10 was used to obtain the tensile modulus and com- pressive modulus of the foam for the cylinder specimens. The values of tensile and com- pressive moduli were obtained by dividing the slope value of the curves labeled "foam" in figure 10 by the average cross-sectional a rea of the foam inside the cylinder specimen. The average cross-sectional a rea w a s obtained from the average of 10 diameter meas- urements made along the length of each foam-filled cylinder specimen; the average of the 10 diameter measurements is listed in table II. A value of 0.024 in. (0.061 cm) was used
The symbols show the
6

for a single thickness of the fabric in the computations for determining the cross- sectional area.
Figure 11 shows the tensile modulus and compressive modulus of the foam plotted against foam density for the cylinder specimens. Solid lines have been faired through the data and extended by the dashed lines to the intersection of the ordinate and abscissa axes since zero modulus would be expected for zero density. broken curve shown in figure 11 indicates the modulus increasing at the same rate as the
For comparison, the
foam density, or R = 1, where R is defined by R = - Thus, values of R p 2 p 1
greater than 1 indicate the modulus increasing faster than the density and values of R less than 1 indicate the density increasing faster than the modulus.
Figure 12 shows a typical set of results for the foam-filled cylinder specimens subjected to small torsion loads. (See fig. 3.) The symbols show the average shear strains measured on opposite sides of the specimens. The data shown are for cylinder specimens having a foam density of 3.8 lbm/ft3 (60.9 kg/m3). Also indicated in figure 12 by the dashed lines a r e the torque-shear-strain curves corresponding to a shear s t i f f - ness of 65 lbf/in. (11.4 kN/m) obtained from figure 9 for the pressurized cylinder spec- imens. The curves labeled "foam" in figure 12 represent the torque-shear-strain char- acteristics of the foam and were obtained by using the method previously described for determining the tensile and compressive moduli of the foam. Data similar to those shown in figure 12 were obtained for each of the cylinder specimens and elementary torsion theory was used to determine the shear modulus of the foam from the slope of the curves labeled ttfoamt' in figure 12. against foam density. by the broken line.
Figure 13 shows the shear modulus of the foam plotted The curve for R = 1 is also shown in figure 13 and is indicated
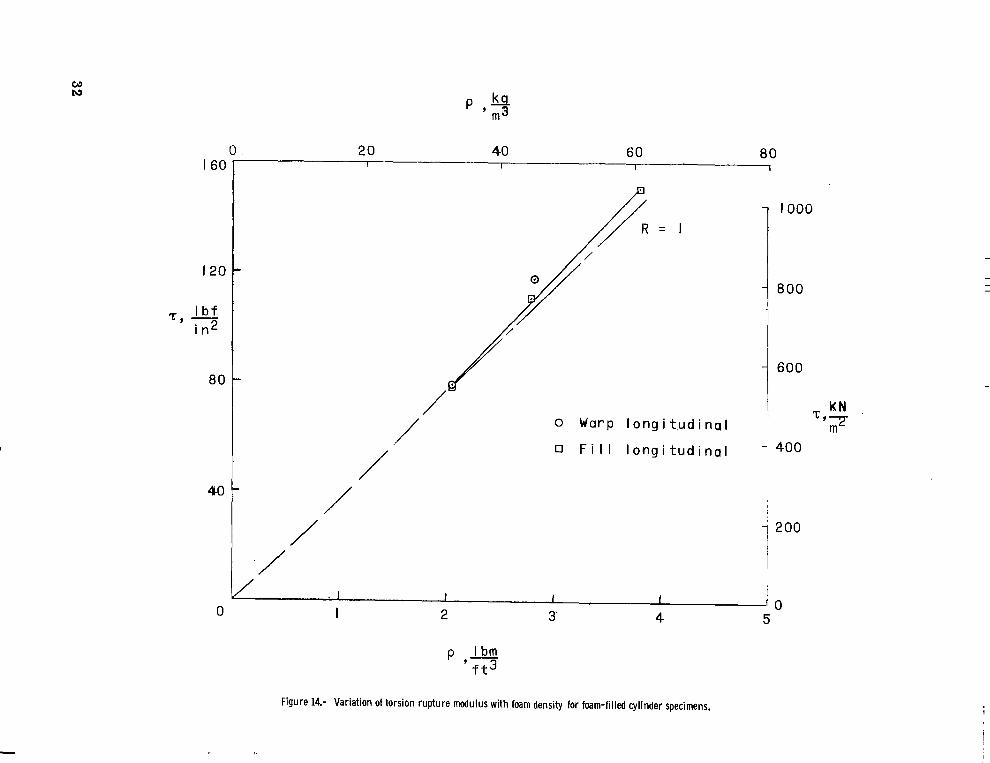
An index of the ultimate strength in torsion of the foam-filled cylinder specimens w a s obtained by twisting the specimens to failure and noting the value of ultimate torque. The values of ultimate torque were used to compute the modulus of rupture T and the results a r e shown in figure 14 plotted against foam density. A value of the rupture modulus for the warp specimen having a foam density of 3.8 lbm/ft3 (60.9 kg/m3) w a s not obtained became failure for this specimen occurred in the bonded joint between the cylinder and the wooden end piece used to apply torque to the cylinder. Also indicated on the figure by the broken curve is R = 1.
A comparison of the specific stiffness EA/m between the foam-filled and air- inflated cylinder specimens is shown in figure 15. The data shown are for the cylinder specimens under longitudinal tensile loads, (See fig. 4.) The values of EA for the air- inflated cylinders were obtained from the curves of figure 8, whereas the values of EA for the foam-filled cylinders were obtained from curves similar to those shown in
7

figure 10. The value of m was taken as the mass per unit length for each specimen and included the mass of the inflation medium.
Beams Subjected to Bending Moment
Table 111 shows the sectional properties of the foam-filled beam specimens used to determine the mechanical properties of the beams. The sectional properties were eval- uated from the assumed cross section which closely approximated the actual cross sec- tion as indicated by the sketch accompanying the table. For the calculations, the effec- tive thickness of the fabric in the splice region was taken as 1.24 times that of the remainder of the beam for the beam with the warp yarns in the longitudinal direction, whereas the similar value for the beam with the f i l l yarns in the longitudinal direction was 1.46. These values were taken from reference 1 for beams of similar construction and represent the increase in stiffness of the spliced region over the stiffness of the remainder of the beam as determined from uniaxial tests.
Figure 16 shows a typical set of results for the foam-filled beam specimens. The data shown a re for the warp beam with a foam density of 4.5 lbm/ft3 (72.1 kg/m3) and for the f i l l beam with a foam density of 4.9 lbm/ft3 (78.5 kg/m3). The solid curves faired through the data points a r e for increasing bending moment and the dashed curves a re for decreasing bending moment. Also shown in figure 16 a r e the values of Poisson's ratio, obtained from the ratio of the transverse strain to the longitudinal strain at the various bending-moment levels, for increasing moment and for decreasing moment. Data similar to those shown in figure 16 were obtained for each of the six beam specimens and stiff- nesses for the specimens were obtained from the slopes of the curves faired through the data for the longitudinal strains of the tension and compression sides of the beams. From these data the modulus of the foam was determined by using elementary bending theory, given by the equation
- - Mc Eta- Ia ta
If
E Ef =
for beams of two materials having centroids lying in the same plane. The values of M/E were taken as the average of the slopes of the curves faired through the data for the longi- tudinal strains measured on the tension and compression sides of the beams. (See fig. 16.) The value of Eta was taken as the average value of the longitudinal stiffnesses for the pressurized cylinders under direct tensile load. (See fig. 8.) Values for the effective moment of inertia divided by the unspliced thickness Ia/ta of the fabric and for the moment of inertia If of the foam were taken for the beam with the assumed cross section and listed in table III.
a
..- .. ...-.. ...,., , 1111. I I 111111111.-1 I I I I

Values of the foam modulus Ef for the beam specimens in bending a r e shown in figure 17. The data shown in figure 17 a re the average values of the foam modulus obtained from the two bending tests made on each beam as previously mentioned. broken curve shown in figure 17 indicates that R = 1.
The
Figure 18 shows the effect of foam density on Poisson's ratio. It is evident from figure 16 that the average of values of Poisson's ratio for loading and unloading varies somewhat with bending moment up to a value of about 15 in-lbf (1.7 m-N); then the aver- age of values remains approximately constant for increasing and decreasing bending moments for the range of bending moment above 15 in-lbf included in the investigation. This behavior in Poisson's ratio was characteristic for all bending tes ts and for this reason the values of Poisson's ratio shown in figure 18 are the average values for increasing and decreasing bending moments above 15 in-lbf of applied moment.
Figure 19 gives a specific-stiffness EI/m comparison between the foam-filled beams of the present investigation and the pressurized beams of reference 1. The values of E1 for the foam-filled beams were taken as the average value from the two bending tests previously described and were obtained from curves similar to those shown in figure 16. For the pressurized beams the values of E1 were obtained by taking the product of the average values of stiffness and the effective moment of inertia of the beams. (See fig. 9 and table E, respectively, of ref. 1.) The value of m w a s again taken as the mass per unit length for each specimen and included the mass of the inflation medium.
DISCUSSION
It is evident from figure 8 that for the air-inflated cylinders the tension stiffness in the warp direction is considerably more than the tension stiffness in the f i l l direction. This difference is mainly due to the yarn count being higher in the warp direction than in the f i l l direction of the fabric. (See table I.) Comparison of the tension and compression data for the foam-filled specimens (see figs. 10 and 16) indicates that the compression stiffness is approximately the same as the tension stiffness. This can be attributed to the overriding effect of the foam. Since the foam is much stiffer than the fabric (see figs. 10 and 16) and the ratio of foam a rea to fabric area is large, then, any compressive loads would be carried mostly by the foam without regard to fabric orientation. Figures 10 and 16 also indicate that for the foam-filled specimens both the tension and compression stiff- nesses in the warp direction are greater than the corresponding stiffnesses in the f i l l direction but the difference is not as great as that for the air-inflated specimens. For example, for the air-inflated cylinders the tension stiffness for the fill specimen is approx- imately 78 percent of that for the warp specimen, whereas for the foam-filled cylinders the tension stiffness for the f i l l specimen is approximately 88 percent of that for the warp
9

specimen. Thus, the difference in yarn count in the warp and f i l l directions of the fabric also influences the stiffness of the foam-filled specimens.
It is evident from figures 11 and 17 that increased foam density has a beneficial effect on the tensile and compressive moduli of the foam. This effect can be seen by a comparison of the curves faired through the data with the broken curves which represent the density increasing at the same rate as the modulus (or R = 1). Favorable values of R were obtained for the foam-filled specimens; in figures 11 and 17 the modulus increases by a factor of approximately 2.3 as the corresponding foam densities increase by a factor of only approximately 1.9.
The average values of Poisson's ratio shown in figure 18 are, in general, l ess than the values usually encountered for isotropic materials. The results show that the values of Poisson's ratio increase with increasing foam density. This increase is possibly caused by physical differences in the cell structure of the foam at the various densities. At the lower value of foam density the cell structure is such that the shape and size of the cells vary considerably, whereas the cell structure of the foam at the higher foam densities is more constant and therefore performs as a more homogeneous material.
The results shown in figure 13 indicate that favorable values of R a re also obtained for the foam-filled cylinder specimens in shear. Comparison of figures 11 and 13 indicates that, for the range of foam density contained herein, the values of R obtained for the cylinder specimens a r e approximately the same, regardless of s t r e s s conditions present. Comparison of figures 11 and 13 also shows that the value of shear modulus is about three-tenths of the tensile modulus of the foam at corresponding foam densities. This factor demonstrates a lower shear modulus of the foam as compared with those of isotropic materials for which the shear modulus is usually about four- tenths of the tensile modulus.
The results shown in figure 14 indicate that the ultimate shear strength of the foam varies almost linearly with the foam density and increases at about the same rate as the density.
Figure 15 indicates that the specific stiffness for the foam-filled cylinder speci- mens varies f rom approximately 33 to 47 t imes the specific stiffness for the air-inflated specimens as the ratio of the mass per unit length of the foam-filled specimens to that of the air-inflated specimens var ies approximately from 2.3 to 3.2. Therefore, from a specific-stiffness viewpoint the foam-filled cylinder specimens offer substantial tension- stiffness advantages over the air-inflated cylinders.
Figure 19 shows that the specific stiffness of the foam-filled beams is approxi- mately 3.2 to 4.9 t imes the specific stiffness of the pressurized beams of reference 1. The ratio of the mass per unit length of the foam-filled beams to that of the pressurized
10

beams varies from 0.61 to 0.87. It should be noted that the larger mass of the pressur- ized beams is due to an extra heavy coating of neoprene (see ref. 1) and for this reason direct comparison with the foam-filled beams is not applicable. Even without the extra coating, the data indicate, however, that bending-stiffness advantages for the foam-filled beams are likely.
CONCLUDING REMARKS
The stiffness properties of a particular nylon-neoprene fabric subjected to uniaxial, biaxial, shear, o r bending s t resses as obtained from foam-filled models have been pre- sented. These results were compared with results obtained from other models utilizing air for inflation. The results demonstrate that the stiffness of the foam-filled models was superior to the stiffness of the pressurized models when compared on a mass- stiffness basis. For example, the specific stiffness of the foam-filled cylinder specimens varied from approximately 33 to 47 t imes the specific stiffness of the air-inflated cylin- ders. The results also show that, for the range of foam density of the investigation, increased density has a beneficial effect on the modulus of the foam. foam-filled specimens increased by a factor of approximately 2.3 as the corresponding foam densities increased by a factor of only approximately 1.9. The values of Poisson's ratio for the foam-filled beams were, in general, less than the values usually encountered for isotropic materials. For the foam-filled cylinders, the strength in shear varied linearly with foam density and increased at about the same rate as foam density. The results also show that the highest values of stiffness a r e obtained, regardless of erection medium, when the direction of the greater yarn count of the fabric is oriented in the longitudinal direction of the specimen.
The modulus for the
Langley Research Center, National Aeronautics and Space Administration,
Langley Station, Hampton, Va., November 8, 1965.
11

APPENDIX
CONVERSION OF U S . CUSTOMARY UNITS TO SI UNITS
The International System of Units (SI) was adopted by the Eleventh General Confer- ence on Weights and Measures, Paris, October 1960, in Resolution No. 12 (ref. 3). Conversion factors for the units used herein are given in the following table:
~. ~ __
i
-~
Physical quantity
Density . . . . . . . . . . - . . -. - - -
Force . . . . . . . . . . Length . . . . . . . . . . Spec if i c stiff ness :
Beams, EI/m . . . . . Cylinders, E A / m . . .
S t r e s s . . . . . . . . . . Tempera ture . . . . . . .
*Multiply value given value in SI Unit.
mega (M)
kilo (k)
centi (c)
12
106
103
10 -2
U.S. Customary Unit
. - - - - __ lbm/ft3
lbf
in ,
3 in
in.
p s i = lbf/in2
OF + 459.67
Conversion factor
(* 1 16.02
4.44 8
0.0254
1.607 X
0.2491
6.895 X lo3 - 5/9 -
SI unit
~- .. - .. -
kilograms/meter3 (kg/m3)
newtons (N)
m e t e r s (m)
joules - me ter2/kilogram (J-ma/kg joule s/kilogr am (J/kg)
newtons/meterz (N/m2)
deg rees Kelvin (OK)
Prefixes to indicate multiples of units a r e as follows: - -
m u l t i p l e
---.-.. ........... I I ...... .I 11111.1 I I m1.11 . I11.11.1 -I.-- 1 1 1 I I I 1.1 II I

b REFERENCES
1. Zender, George W.; and Deaton, Jerry W.: The Stiffness Properties of Stressed Fabrics as Obtained From Model Tests. NASA TN D-775, 1961.
2. Stroud, W. Jefferson: Experimental and Theoretical Deflections and Natural Frequencies of An Inflatable Fabric Plate. NASA TN D-931, 1961.
3. Mechtly, E. A.: The International System of Uni t s - Physical Constants and Conversion Factors. NASA SP-7012, 1964.
13
I

TABLE I.- DETAILS OF FABRIC
Item
Yarn . . . . . . . . . . . . . . . . . . . . . . Weave . . . . . . . . . . . . . . . . . . . . . Warp count, yarns/in. (yarns/cm) . . . . . . Fill count, yarns/in. (yarns/cm) . . . . . . . Drop-yarn count, yarns/in2 (yarns/cma). . .
Yarn in longitudinal
direction
Warp
Warp
Warp
Fill
Fill
Fill
Yarn in longitudinal
direction
Inner ply -~
Nylon
Airmat
82 (32)
45 (18)
116 (18)
P
lbm/ft3
3.3
3.8
4.5
2.9
3.7
4.9 -- -
Warp
Warp
Warp
Fill
Fill
Fill
Cover ply
Nylon
Plain
96 (38)
103 (41)
TABLE II.- DETAILS OF FOAM-FILLED SPECIMENS
(a) Beams
~ --
k / m 3
52.9
60.9
72.1
46.5
59.3
78.5 ..
lbm/ft3
2 .o 2.8
3.8
2.0
2.8
3.8 ~ ~~ ~
Total mass -___
slugs
0.0224
.0242
.0273
.0221
.0245
.0275
-
P
k / m 3
32.0
44.9
60.9
32.0
44.9
60.9
___.
kg
0.3269
.3532
.3984
.3225
.3576
.4013 ~
in.
26
26
26
26
26
26
(b) Cylinders
Total mass
slugs
0.0206
.0243
.0297
.0210
.0248
.0294
kg
0.3006
.3546
.4334
.3065
.3619
.4291
2
cm
66
66
66
66
66
66
I?
_ _
in.
18
18
18
18
18
18
in.
6.34
6.34
6.34
6.34
6.34
6.34
cm
46
46
46
46
46
46
cm
16.10
16.10
16.10
16.10
16.10
16.10 ..
d
in.
4.13
4.14
4.12
4.08
4.13
4.11
in.
1
1
1
1
1
1
cm
10.49
10.52
10.46
10.36
10.49
10.44
t
cm
2.5
2.5
2.5
2.5
2.5
2.5 . . -
14

TABLE IU.- SECTIONAL PROPERTIES O F FOAM-FILLED BEAMS
Effective periphery, in. (cm), for: Unspliced fabric, 2(5.3) in. o r 2(13.46) c m . . . . . . . . . . . Spliced circle , n(l)K in. or n(2.54)K c m . . . . . . . . . . . . Total . . . . . . . . . . . . . . . . . . . . . . . . . . . . . . . .
0.5 in. (1.27 cm)
10.60 (26.92) 10.60 (26.92) 3.89 ( 9.88) 4.58 (11.63)
14.49 (36.80) 15.18 (38.55) __.- -- --___
0.5 in. (.1.27 cm) 7
Unspliced fabric, 2(5.3)(0.5)2 in3 or 2(13.46)(1.27)2 cm3 . . . Spliced circle , n(0.5)3K in3 or n(1 .27)k cm3 . . . . . . . . . Total . . . . . . . . . . . . . . . . . . . . . . . . . . . . . . . .
-
5.3 in. (13.46 cm)
e-- - _c
Enclosed area 6.09 in2 (39.29 cm2)
- Trace of outer periphery of foam-filled beam Assumed section
2.65 (43.42) 2.65 (43.42) .49 ( 8.03) .57 ( 9.34)
3.14 (51.45) 3.22 (52.76) -___ -____
_ _ -
Property I Warp I longitudinal 1 longitudinal
Fabric . .
. . . . . . . . . . . . 1.24 Effective thickness at splice, Unspliced thickness
. - . _ ~ (see ref. 1)
Effective moment of inertia, 5, in3 (cm3), for: Unsplic ed- thickne s s t a I __-
I
15
i

Nylon c o v e r P I
t k y l o n inner p l y
(a) Fabric.
--War o
, i i I I I
L-61-1072.1 (b) Photomicrograph of inner ply.
Figure 1.- Details of fabric construction.
16

t 3 in. (7.6 cm)
\ c l a m p e d end p l a t e s b y aluminum
.I t
(a) Strip. (b) Beam.
(c) Foam-filled cylinder. (d) Air-inflated cylinder.
Figure 2.- Details of specimens.
17

Figure 3.- Setup for torsion test on foam-filled cylinder. L-61-3034.1
18

C’L W
L- 61-3035 Figure 4.- Setup for tension test on foam-filled cylinder.

Figure 5.- Setup for torsion fai lure test on foam-filled cylinder. L-63- 1324.1

Figure 6.- Setup for bending test on foam-filled beam. L-62-1697

1 , m
c 0 . I .2 .3 .4 I I I I
i
3 -
I bm P , - f t 3
2 -
I -
O
0
0 J
R
8 0
6i)
40
- 20 o Warp longitudinal
Fill longitudinal
I I I I I I I I I O 2 4 6 8 I O 12 14 16 18
1 , in.
Figure 7.- Variation of foam density with cylinder length.

e
28
24
20 I b f i n . -
16
12
a
4
0
L o a d --- U n l o a d
E t = 976 I b f / i n ; r n 2.5 p s i g ( 17.2 kN/m2) : 0 7 .5 p s i g ( 5 1 . 7 kN/m2) 170.9 kN/m) ' A 15.0 p s i g ( 1 0 3 . 4 kN/m2)
o S t r i p
4 8 12 16 20 24 28 32
E
5
4
3 kN P. -
I ' m
2
I
0 X
(a) Warp longitudinal.
Figure 8.- Typical stress-strain results for strip specimens and air-inflated cylinder specimens subjected to longitudinal tensile loads.
I 0-3
,

2 8
2 4
2 0 I b f 'i, - i n .
12
8
4
0
L o a d U n l o a d -- -
E t = 758 0 S t r i p 2 . 5 p s i g ( 1 7 . 2 kN/m2)
0 7.5 P S i g ( 5 1 . 7 kN/m2)2 ( 1 3 2 . 7 k N / m ) a 15.0 P S i g (103 .4 kN/m )
4 a 12 16 20 2 4 2 8 32-x
E
(b) Fill longitudinal.
.Figure 8.- Concluded.
f .

N Ln
I40
I 2 0
IO0
80
i n-l b f
60
40
20
0
(a) Warp longitudinal.
Figure 9.- Torque plotted against twist for air-inflated cylinder specimens.
Y m-N
I O 20 3 0 40 50 60 70
9 , d e g

I 4 0
I 2 0
I O 0
P. =15.0 - I b f ( 2 . 6 3 I b f i n . G t = 65 I
T , m--N
in-I b-f
(b) Fill longitudinal,
Figure 9.- Concluded.
t

200 - 200 -
180 - p - 800 180 -
0 T e n s i o n 160 -
0 Compress i o n
160 -
I40
I 2 0
IO0
P , I b f
80
60
40
20
0
- 200
140 -
I 2 0
IO0
P , I b f
80
60
40
20
0
P - 800
- 600
p, N
- 400
- 200
I 2 3 0
10-3
E E
(a) Warp longitudinal.
Figure 10.- Typical load-strain results for foam-filled cylinder specimens subjected to longitudinal tensile and longitudinal compressive loads. p = 2.0 Ibm/ft3 (32.0 kg/m3).

0 T e n s i o n
160-
180 1 0 Compress i o n p: 8oo 160 -
0 I 2 3
600
p ,
400
I40
I 2 0 N
IO0
P , I b f
80
60
200 40
0 X I
20
0-3 0
1 *0°
- 600
- 400
I 2 3"x 10-3
E &
(b) Fi l l longitudinal.
Figure 10.- Concluded.
* .

- 0 12 ooc
10 ooc
8 000
6 0 0 0
I b f E f , 3
4 000
2 000
0
2 0 I
40 I
60 I
8 0 1
0 T e n s i o n Compress i o n
I I
2 3 I .~
4 5
7 2
60
4 8
E f t MN m2
36
2 4
12
0
Figure 11.- Variation of Young’s modulus wi th foam density for foam-filled cylinder specimens in tension or compression.
29

w 0
260 i 240 r
220 -
I 200 -
180 -
160 -
140 -
120 - T , i n - l b f
100 -
-28
-24
-20
-16
T, m-N
-12
- 8
- A
0 I 2 3 4 5 6
260 240 i 220 -
200 -
180 -
160 -
140 -
120 - T , i n - l b f
100 - 80 -
60 -
8 I 4
-2 0
-16
T , m-N
-12
- 8
4
Y Y
(a) Warp longitudinal. (b) Fi l l longitudinal.
Figure 12.- Typical torque-shear-strain results for foam-filled cylinder specimens subjected to small torsion loads. p = 3.8 Ibm/ft3 (60.9 kg/m3).

2 0 40 60 8 0 0 4 0 0 0 , I I I I
1000
3000 -
/ /
-
/ /
2 0 0 0 -
I b f G f , 3
- 24
- 1 8
- 12
- 6
I /
0 I 2 3 4 5
Figure 13.- Variation of shear modulus with foam density for foam-filled cylinder specimens.
I 6 0
I20
I b f 'G, -
i n2
80
40
0
0 20 40 60 80 I I I I
/ /
0 Warp I ong i t.ud i na I /' /
0 F i l l l o n g i t u d i n a l - 400
/ I
IO00
800
600
-1 200
/ - 1 1 1 ! 1 ' 0 2 3' 4 5 I
p Ibm '3
Figure 14.- Variation of torsion rupture modulus with foam density for foam-filled cylinder specimens,

0 3 x I O 6
.2 I
0
0 3 x I 0 6
0
I
. I
. 2 I
I
. I
a . 2
a . 2
m, + .4 .6 I I
. 8 I .o 1
0 Foam-filled c y l i n d e r Air-inflated c y l i n d e r
1 I I
. 3 .4 .5 m, +
(a) Warp longitudinal.
m , 9 .4 . 6 I I
I I
.3 .4
m , !&!!
1
5
I
.ti
.8 I
. 7
I . o 1
I
.6 .7
(b) F i l l longitudinal.
Figure 15.- Specific-stiffness relations for cylinder specimens in tension.
.33

T e n s i o n 50
40
30
20
L o n g i - t u d i n a l
I O 1-
Trans- S t r a i n v e r s e d i r e c t i o n
M, i n - l b f 0 1 \ \
0 0 Tens i o n
~ ! ~ l coyp ress - I I on ‘ 1
Lo ad --- U n l o a d
\ / IV,’ 0 M, m-N
I O - @ L
- 2
- 3 I
- 4 I 1 I I L I I I I I I
I 2 3 4 10-3
30 - - y Compress ion 40 - A ,
I
0 . I . 2 . 3 -5 -4 -3 -2 -I 0
P E
(a) Warp longitudinal. p = 4.5 Ibm/ft3 (72.1 kg/m3).
Figure 16.- Typical bending-moment- strain characteristics and values of Poisson’s ratio for foam-filled beam specimens in bending.

T e n s i o n 50- - L o n g i - T r a n s - S t r a i n
t u d i n a l v e r s e d i r e c t i g n - 5 L 40 - 0 0 0 Tens i o n
0 A Q
- 3 30 -
I
- 2
- L o a d U n l o a d - _ _ I C
20 - I ,i
- I , ,'I
10- I I I ; /;/
/ 0 M , m-N M, i n - l b f 0- / 7,
10- b - / , d f \ - I
\ d0 R
I
1 ,' /
- 2 &
20 - 1 /;/ 30 - F 7
I / /
- 3
' 4 I ,
I 2 3 4 10-3
! l r l I I !
,3 c
I Y 7 Compress i o n 40 I 1 0 1
0 . I . 2 .3 -5 4 -3 -2 -I 0
CL E
(b) Fill longitudinal. p = 4.9 Ibm/ft3 (78.5 kg/m3).
Figure 16.- Concluded.

12 000
I O 000
8 000
6 000
I b f
I n. E f ' 2
4 000
2 000
0
2 0 I
m 40 6 0
I
80 I
0
/ /
/ I
/ / I
i / /
/ I
I I
2 Y
I
4
7 2
6 0
48
MN E f ' 2
36
2 4
12
'0 5
Figure 17.- Variation of Youny's modulus with foam density for foam-filled beams i n bending.
36

k g P ..I ' 3 m
0 3 ,J 40 60 8 0 .3 I
0 Warp I cny i tud i na I fl Fi I I longitudinal
0 1 - U
0 2 3 4 5
Figure 18.- Effect of foam density on average values of Poisson's ratio.
w -3

lllIIlIIlIIIl111111111l I I1 I I
0 .2 30 104- I
I
m, 9 .4 .6 I I
24
18
- :I, i n 3
12
6
0
0 F o a m - f i I l e d beam 0 A i r - i n f l a t e d beam ( r e f . 1 ) t L- 1 I I
_ I .2 .3
0
.2
I
.2
m,
(a) Warp longitudinal.
m, % .4
I
. 3
I
.4
.6 I
I
. 5
.8
. 6
1
.4
1
.5
.8 I
. 6
m.
(b) Fi l l longitudinal.
Figure 19.- Specific-stiffness relations for beam specimens.
38 NASA-Langley, 1966 L-3800

"The aeronazitical and space activities of the United States shall be conducted so as io contribzite . . . to the expansion o f hnman knowl- edge of phenomena in the atmosphere and space. The Administration shall provide for the widest practicable and approptiate dissemination of information concerning its activities aiid the resrrlts thereof .'I
-NATIONAL AERONAUTICS AND SPACE ACT OF 1958
NASA SCIENTIFIC AND TECHNICAL PUBLICATIONS
TECHNICAL REPORTS: important, complete, and a lasting contribution to existing knowledge.
TECHNICAL NOTES: of importance as a contribution to existing knowledge.
TECHNICAL MEMORANDUMS: Information receiving limited distri- bution because of preliminary data, security classification, or other reasons.
CONTRACTOR REPORTS: Technical information generated in con- nection with a NASA contract or grant and released under NASA auspices.
TECHNICAL TRANSLATIONS: Information published in a foreign language considered to merit NASA distribution in English.
TECHNICAL REPRINTS: Information derived from NASA activities and initially published in the form of journal articles.
SPECIAL PUBLICATIONS Information derived from or of value to NASA activities but not necessarily reporting the results .of individual NASA-programmed scientific efforts. Publications include conference proceedings, monographs, data compilations, handbooks, sourcebooks, and special bibliographies.
Scientific and technical information considered
Information less broad in scope but nevertheless
Details on the availability of these publications may be obtained from:
SCIENTIFIC AND TECHNICAL INFORMATION DIVISION
NATIONAL AERONAUTICS AND SPACE ADMINISTRATION
Washington, D.C. PO546
I. I1 1111111