Embed Size (px)
Citation preview

Coalition Update 2011
CurrentUnderage Drink-
ingIssues & Trends
Together We Can

Steve Waldo, InvestigatorVermont Department of Liquor Control
6 Baltimore RoadBaltimore , Vt. 05143
(802) [email protected]
Your presenter:

Good information =
good choices
Bad information =bad choices

Resources http://www.whitehousedrugpolicy.gov http://www.health.org http://www.freevibe.com http://www.dea.gov

Scope of the Problem

So, What’s The Big Deal Any-way?!
Kids will be kids We did it when we were young It’s only a beer It’s just weed, at least it’s not Real Drugs Maybe we can make a safe environment for the
kids to party No one will get hurt

National Highway Deaths
Alcohol fatalities 32 %
68 %Source = NHTSA 2010 (2009 data) = 10,839 deaths

National Highway Deathsfrom alcohol

Vermont Highway DeathsAlcohol Related
1982
1985
1988
1991
1994
1997
2001
2005
2006
2007
2008
2009
0%
10%
20%
30%
40%
50%
60%
70%
80%
90%
100%
65
48 52 5548
4238 41
32 38 16 32
No AlcoAlcohol
Source: NHTSA 2010

9th 10th 11th 12th all0
5
10
15
20
25
30
35
2123 24
26
2323 2321
24 23
Vt '07NationalVt '09
Teens who rode with a drinking driver
Source = 2005 National YRBS, 2007 Vermont State YRBS & 2009 Vermont State YRBS studies.

9th 10th 11th 12th all0
2
4
6
8
10
12
14
16
18
4
7
11
15
8
3
5
9
13
7
Vt '07NationalVt '09
Teens who drove a vehicle in past 30 days and had been
drinking
Source = 2005 National YRBS, 2007 Vermont State YRBS & 2009 Vermont State YRBS studies.

YOUNG PEOPLE & ALCOHOL
What is the one ingredient common in the top 4 causes of death for those aged 10 to 24?
1) Motor vehicle crashes.
2) Unintentional injuries.
3) Homicide.
4) Suicide.
Alcoho
lAlcoho
l

Underage Drinking in the US
Rates of current use were highest in small urban areas and rural areas
Rates of binge drinking among 12-17 year olds were highest in rural areas
In 2003 and 2004, current underage alcohol use was highest in the Northeast region (32%)

U. S. COLLEGE STUDENTS
600,000 injured while driving under the influence of alcohol
700,000 injured by other students who were drinking
100,000 victims of alcohol related sexual assaults 1,700 die from alcohol related injures including car
crashes

Vermont specific
•Once again tops in the nation for teen alcohol use•Also, tops in the nation for marijuana use•We are 4th highest for underage drinking costs per youth, $200 million per year•Alcohol is a factor in 50% of youth car crashes•Alcohol link to 2 out of 3 sexual assaults and rapes•Underage drinkers consumed 13.3% of all alcohol sold in Vermont•Underage sales account for $48 million in sales in Vermont

Where they get it
store9%
gave money30%
3rd per-son41%
stole it
15%
from home4%
Males
store3%
gave money29%
3rd per-son51%
stole it
16%
from home1%
Females
Source: 2009 Youth Risk Behavior Survey

What they drink
Liquor45%
Beer40%
Malt
Bev
9%
Wine4%
Wine Cooler1%
Males
Liquor43%
Beer20%
Malt Bev28%
Wine6%
Wine Cooler4%
Females
Source: 2009 Youth Risk Behavior Survey

Choked On Her Vomit After Passing Out From Being
Drunk

International Perspective on Binge Drinking
0 10 20 30 40 50 60 70
123456789
1011121314151617181920212223242526272829303132333435
Prevalence 5+ Drinks Past 30 Days

International Perspective Binge Drinking
010203040506070DenmarkNetherlandsIrelandGermanyIsle of ManUnited KingdomMaltaBelgiumNorwayGreenlandCzech RepublicEstoniaFaroe IslandsSloveniaLatviaSlovak RepublicSwitzerlandFinlandUkraineBulgariaLithuaniaGreeceRussia (Moscow)SwedenCroatiaItalyCyprusIcelandHungaryFrancePortugalRomaniaPolandUSATurkeyPrevalence of 5+ Drinks Past 30 Days

International DataEuropean School Survey Project on Alcohol and Other Drugs
(schools)
05101520253035IrelandGermanyNetherlands Isle of ManUnited KingdomMaltaSwedenDenmarkNorway BelgiumLatviaSloveniaUkraineBulgari EstoniaFaroe IslandsGreenlandCzech RepublicRussia (Moscow)Portugal CroatiaFinlandSlovak RepublicSwitzerlandItaly LithuaniaGreeceIcelandPolandRomaniaCyprus FranceUSAHungaryTurkeyCountry% Binge Drinking 3+ Times/Month
USA From MTF Study

2009 YRBS
Alcohol – 36% of students drink (64% don’t)
Tobacco – 16% of students smoke(84% don’t)
Marijuana – 22% of the students use(78% don’t)
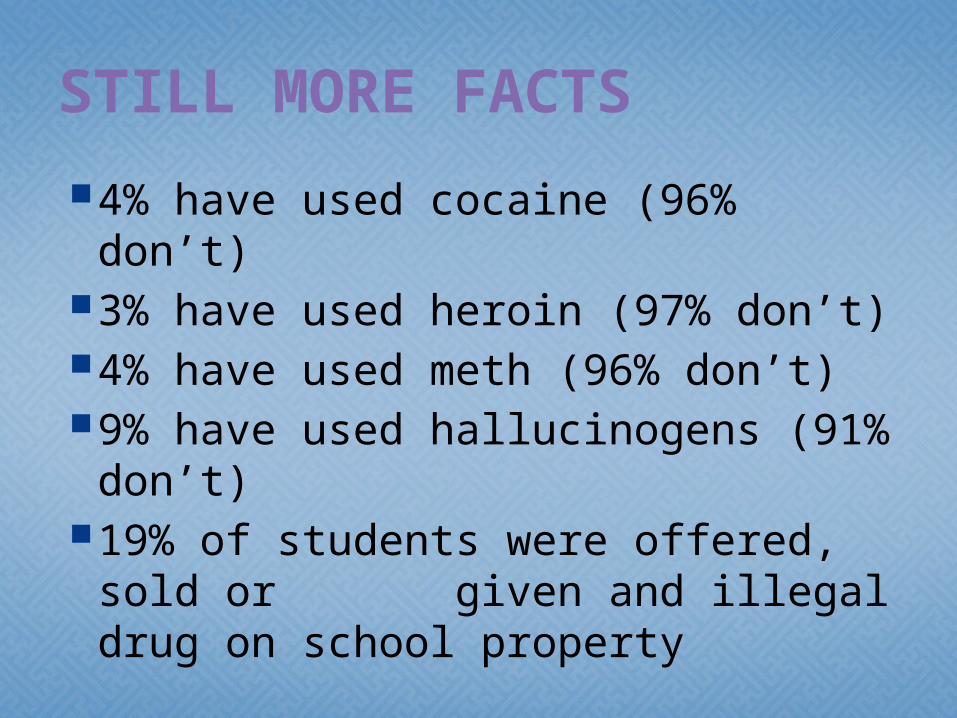
STILL MORE FACTS
4% have used cocaine (96% don’t)3% have used heroin (97% don’t)4% have used meth (96% don’t)9% have used hallucinogens (91% don’t)19% of students were offered, sold or
given and illegal drug on school property

Update
Did you know?

Tobacco

Nicotine levels
1998 1999 2000 2001 2002 2003 20041.6
1.65
1.7
1.75
1.8
1.85
1.9
Boston Globe: 92 of 116 brands tested higher in ‘04 then in ‘98. 52 brands increased more than 10%.
Source = Mass Tobacco Control Program

IndustryConsolida-
tions

1. Nestle2. Coca-Cola3. Coca-Cola Enterprises4. Anheuser-Busch5. Diageo6. SABMiller7. InBev8. Heineken9. Suntory10. PepsiCo11. Pepsi Bottling Group12. Asahi13. Kirin14. Fonterra15. Pernod Ricard16. Dean Foods17. Kraft Foods18. Femsa19. Unilever20. Dairy Farmers of America
Top Beverage Companies
Out of the top 20 beverage companies, 8 are beer companies.

“CONSOLIDATIONS CONTINUE”Beer Suppliers
InBev/Anheuser Busch
SAB Miller/Coors