Embed Size (px)
Citation preview

Aalborg Universitet
Steps Towards Personalised Antibiograms
predicting antimicrobial susceptibility
Sanden, Line Rugholm
DOI (link to publication from Publisher):10.5278/vbn.phd.med.00095
Publication date:2017
Document VersionPublisher's PDF, also known as Version of record
Link to publication from Aalborg University
Citation for published version (APA):Sanden, L. R. (2017). Steps Towards Personalised Antibiograms: predicting antimicrobial susceptibility. AalborgUniversitetsforlag. Ph.d.-serien for Det Sundhedsvidenskabelige Fakultet, Aalborg Universitethttps://doi.org/10.5278/vbn.phd.med.00095
General rightsCopyright and moral rights for the publications made accessible in the public portal are retained by the authors and/or other copyright ownersand it is a condition of accessing publications that users recognise and abide by the legal requirements associated with these rights.
? Users may download and print one copy of any publication from the public portal for the purpose of private study or research. ? You may not further distribute the material or use it for any profit-making activity or commercial gain ? You may freely distribute the URL identifying the publication in the public portal ?
Take down policyIf you believe that this document breaches copyright please contact us at [email protected] providing details, and we will remove access tothe work immediately and investigate your claim.
Downloaded from vbn.aau.dk on: June 09, 2019

LINE R
UG
HO
LM SA
ND
ENSTEPS TO
WA
RD
S PERSO
NA
LISED A
NTIB
IOG
RA
MS
STEPS TOWARDS PERSONALISED ANTIBIOGRAMS
PREDICTING ANTIMICROBIAL SUSCEPTIBILITY
BYLINE RUGHOLM SANDEN
DISSERTATION SUBMITTED 2017


I
STEPS TOWARDS PERSONALISED
ANTIBIOGRAMS
PREDICTING ANTIMICROBIAL SUSCEPTIBILITY
by
Line Rugholm Sanden
Dissertation submitted 2017
.

Dissertation submitted: March 2017
PhD supervisor: Prof. Steen Andreassen, Aalborg University
PhD committee: Professor Svend Birkelund Aalborg University
Emeritus Professor Ewart Robert Carson City University London
Ledende overlæge, professor dr. med. Vejle Sygehus
PhD Series: Faculty of Medicine, Aalborg University
ISSN (online): 2246-1302ISBN (online): 978-87-7112-935-9
Published by:Aalborg University PressSkjernvej 4A, 2nd floorDK – 9220 Aalborg ØPhone: +45 [email protected]
© Copyright: Line Rugholm Sanden
Printed in Denmark by Rosendahls, 2017

III
CV
Personal Information
Line Rugholm Sanden
Born September 17, 1984, Aalborg, Denmark
Academic Profile and Research Experience
Line received her Master of Science (MSc) in Biomedical Engineering and
Informatics from Aalborg University, Denmark in 2009. Line began her PhD studies
at Aalborg University’s Department of Health Science and Technology in 2009.
During the PhD study, she had contributions accepted at two international
conferences, two papers published and submitted a patent application.
Current and Prior Positions
Research Assistant, Centre for Health Informatics, University of New South Wales,
Sydney, Australia, 2008
PhD Student, Center for Model-Based Medical Decision Support, Department of
Health Science and Technology, Aalborg University, Aalborg, Denmark,
November 2009 – March 2017
Quality Assurance Manager, Treat Systems Aps, Aalborg Denmark,
September 2014 - Present


ENGLISH SUMMARY
Antimicrobial treatment of infectious patients is increasingly complicated by
frightening rates of antimicrobial resistance in infection-causing pathogens. The
development of antimicrobial resistance is driven by the use and misuse of
antimicrobials. Therefore, the choice of antimicrobial treatment should be
appropriate to achieve the best outcome for both current and future patients.
Hospitalised patients suspected of infection are often treated empirically with
antimicrobials (i.e. before microbiological results on pathogen identity and
antimicrobial susceptibility are available). Institutional antibiograms (ABG), which
are aggregated local antimicrobial susceptibility test (AST) results, can be used as an
indicator for the expected susceptibility to antimicrobials, when choosing empirical
antimicrobial treatment.
The aim of this project was to generate personalised ABGs, which predict patient-
specific antimicrobial susceptibility in the hospital setting. During the project, we
focused on making the results of the research operational, by developing practical
implementable applications. This thesis summarises the research and methods
developed to generate personalised ABGs as a series of steps taken, starting with the
institutional ABG.
The first step was to generate ABGs representing patients with hospital-acquired
infections and patients with community-acquired infections, respectively. Typically,
AST results are available for a limited set of antimicrobials. When patient-specific
AST results become available, and a treatment must be chosen, cross-resistance and
cross-susceptibility for all available treatments must be considered. The next step was
therefore to develop and validate a method which uses cross-susceptibility/resistance
to adjust an ABG with respect to a patient’s AST results (Paper I). The next patient-
specific factor considered was the association between prior antimicrobial exposure
and increased resistance at the patient level (Paper II). The results indicate to which
degree the susceptibilities should be adjusted, for patients previously exposed to
antimicrobials. A mathematical method was developed to modify the ABG with
respect to a patient’s prior antimicrobial exposure. This method also served as an
operationalisation of Paper II. The method was extended to modify the ABG with
respect to both patient-specific prior exposure to antimicrobials and AST results
(Patent pending). Future work involves the validation of this method. During the
project the developed methods were implemented in an existing software solution for
antimicrobial stewardship, Treat Steward.

VI

VII
DANSK RESUME
Antimikrobiel behandling af infektioner er i stigende grad kompliceret af øget
resistens hos de patogener, som forårsager infektioner. Udvikling af antimikrobiel
resistens er drevet af brugen og misbrugen af antimikrobielle stoffer. Derfor bør
valget af antimikrobiel behandling været særdeles velovervejet for at opnå det
bedste resultat for både nuværende og fremtidige patienter. Indlagte patienter med
tegn på infektion behandles oftest empirisk med antimikrobielle stoffer, før der
forelægger mikrobiologiske resultater om patogen-identitet og antimikrobiel
resistens. Institutionelle antibiogrammer (ABG), som er aggregerede lokale
suceptibilitets-resultater, kan bruges som en indikator for den forventede
susceptibilitet, når der vælges empirisk antimikrobiel behandling.
Formålet med dette projekt var at skabe patientspecifikke ABG’er, der prædikterer
antimikrobiel susceptibilitet hos indlagte patienter. I løbet af projektet, var der
fokus på at gøre forskningsresultaterne operationelle, ved at udvikle praktiske
implementerbare metoder. Denne afhandling opsummerer forskningen og
metoderne udviklet til at generere patientspecifikke ABG’er.
Det første skridt var at generere ABG’er til at repræsentere henholdsvis patienter
med hospitalserhvervede infektioner og patienter med samfundserhvervede
infektioner. AST resultater bliver typisk kun tilgængelige for et begrænset sæt af
antimikrobielle stoffer. Når patientspecifikke AST resultater bliver tilgængelige, og
skal vælges en behandling, bør kryds-susceptibilitet/resistens til alle tilgængelige
behandlinger tages i betragtning. Det næste trin var derfor at udvikle og validere en
metode, som anvender kryds-susceptibilitet/resistens til at justere et ABG i forhold
til en patients AST resultater (Paper I). Den næste patient-specifikke faktor, der
blev taget i betragtning var sammenhængen mellem tidligere antimikrobiel
behandling og øget resistens på patientniveau (Paper II). Resultaterne indikerer i
hvilket omfang susceptibiliteten skal justeres for patienter, som tidligere har
modtaget antimikrobiel behandling. En matematisk metode blev udviklet til at
modificere ABG’et i forhold til en patients tidligere antimikrobielle behandling.
Denne metode fungerede også som en operationalisering af Paper II. Metoden blev
udvidet til at justere ABG’et med hensyn til både en patientens tidligere behandling
med antimikrobielle stoffer og patientens AST resultater (patentanmeldt). Det
fremtidige arbejde involverer valideringen af denne metode. I projektet blev de
udviklede metoder implementeret i TREAT Steward, som er en eksisterende
softwareløsning til ”antimicrobial stewardship”.

VIII
IX
PREFACE
This PhD thesis includes both published and unpublished material. Chapter 2
includes an abstract accepted for presentation at the 27th European Congress of
Clinical Microbiology and Infectious Diseases (Vienna, April 2017). Material in the
form of two published papers forms the basis of Chapter 3 and Chapter 4,
respectively. Additionally, the thesis includes a mathematical method which is
described in a patent application. The chapters based on published material are
written as extended summaries, while those which present unpublished material are
written in the form of chapters in a monograph.
The work was carried out at the Center for Model-based Medical Decision Support,
Department of Health Science and Technology at Aalborg University in Denmark.
The PhD project contributes to the existing project of developing the decision support
system for antimicrobial stewardship; Treat Steward, which had its origin in the same
department.
During the project, my focus has been on making the research operational, by
developing practical applications, with the aim of shortening the way from research
to an implemented solution available for clinicians and patients.


ACKNOWLEDGEMENTS
There are a number of people without whom this thesis might not have been written.
First, I would like to thank my PhD supervisor Prof. Steen Andreassen for his
invaluable comments and original ideas. I would also like to thank Prof. Mical Paul
and Prof. Leonard Leibovici for their insights as co-authors, for provision of data, and
suggestions throughout my project.
I would also like to thank my friends and colleagues at MMDS, Judex, amPHI
Systems, and TREAT Systems. A special thanks goes to Ulrike Pielmeier and Mads
Mogensen their understanding, encouragement and moral support. Also, thanks to
Logan Ward for minimising the “danglish”.
Thank you to my family and friends who have supported me along the way. Thanks
to Marianne Bystrup for showing up in the most stressful periods and being so
supportive and enthusiastic in all matters.
Last but certainly not least, a very special thanks to my husband Esben for not letting
me give up and for the never ending practical and emotional support, especially as
both our children were born during the project period.
XII
TABLE OF CONTENTS
Chapter 1. Introduction .......................................................................................... 17
Chapter 2. Institutional ABGs ............................................................................... 22
2.1. Quality-check of the isolate database ............................................................ 23
2.2. Mapping species into pathogen groups ......................................................... 25
2.3. Hospital and community ABGs .................................................................... 30
2.4. Filling in the gaps in the ABGs ..................................................................... 33
2.5. Including cross-susceptibility/resistance in the ABG .................................... 37
Chapter 3. Interpretative reading of AST results ................................................ 41
3.1. Introduction ................................................................................................... 42
3.2. Calculating posterior susceptibilities............................................................. 42
3.3. Validation of the explored methods .............................................................. 46
3.4. Discussion and conclusion ............................................................................ 50
Chapter 4. The effect of prior antimicrobial exposure ........................................ 51
4.1. Introduction and Method ............................................................................... 51
4.2. Resistance in GN bacteria to single antimicrobials ....................................... 52
4.3. Resistance in GP bacteria to single antimicrobials ........................................ 54
4.4. Resistance in GN bacteria to classes of antimicrobials ................................. 55
4.5. Discussion and conclusion ............................................................................ 56
Chapter 5. Modifying the ABG to account for PE ............................................... 58
5.1. The susceptibility to an antimicrobial after PE to the same antimicrobial class
............................................................................................................................. 58
5.2. The susceptibility to an antimicrobial after PE to other classes of antimicrobials
............................................................................................................................. 61
Chapter 6. Modifying the ABG to account for both PE and AST ...................... 64
Chapter 7. Implementing the personalised ABG ................................................. 68
7.1. TREAT Steward ............................................................................................ 68
7.2. Implemetation in TREAT Steward ............................................................... 70
7.3. Patient example ............................................................................................. 71
Chapter 8. Discussion ............................................................................................. 75

XIII
Literature list ........................................................................................................... 77
Appendices ............................................................................................................... 81
XIV
LIST OF PUBLICATIONS
This thesis includes the following publications. The papers are referenced in the text
by their corresponding roman numerals.
Paper I: Andreassen, S., Zalounina, A., Paul, M., Sanden, L., Leibovici, L., 2015.
Interpretative reading of the antibiogram – a semi-naïve Bayesian approach. Artif.
Intell. Med. 65, 209–217
Paper II: Sanden, L., Paul, M., Leibovici, L., Andreassen, S., 2016. Quantifying the
associations between antibiotic exposure and resistance - a step towards personalised
antibiograms. Eur. J. Clin. Microbiol. Infect. Dis. 35, 1989–1996
Conference abstract: Sanden, L., Hussein, H., Paul, M., Andreassen, S., 2017.
Pathogen- and antimicrobial-specific resistance in late hospital-acquired infections.
In: The 27th European Congress of Clinical Microbiology and Infectious Diseases.
(Accepted)
XV
LIST OF ABBREVATIONS
ABG Antibiogram
AmoCl Amocixillin-Clavulanate
Ampi Ampicillin
AST Antimicrobial Susceptibility Test
CAI Community-Acquired Infection
Cftax Ceftriaxone
EUCAST The European Committee on Antimicrobial Susceptibility Testing
GN Gram Negative
GP Gram Positive
HAI Hospital-Acquired Infection
InstABG Institutional Antibiogram
NOSO Nosocomiality
OD Odds
OR Odds Ratio
PE Prior Exposure
PipTa Piperacillin-Tazobactam


CHAPTER 1. INTRODUCTION
This chapter gives an introduction to the challenges that motivate this project,
followed by an introduction to the scope of the project, describing the clinical area
to which the project contributes. Finally, the research objectives addressed in each
chapter are presented.
Antimicrobial resistance is recognised by the WHO (World Health Organisation) as
a major health threat of the 21st century. Resistance to the currently available
antimicrobials currently claim upwards of 50,000 lives each year across Europe and
the US (WHO, 2014).
“Without urgent, coordinated action, the world is heading towards a
post-antibiotic era, in which common infections and minor injuries, which
have been treatable for decades, can once again kill.”
Dr Keiji Fukuda (WHO Assistant Director-General for Health Security)
The emergence and spread of antimicrobial resistance is driven by the continued use
and misuse of antimicrobials. The majority of human consumption of antimicrobials
occurs in the community (outside hospitals). Nevertheless, antimicrobial
consumption in hospitals is a main driver for the spread of antimicrobial-resistant
bacteria responsible for healthcare-associated infections (ECDC, 2015). This thesis
focuses on the use of antimicrobials in the hospital setting. It is in the hospital setting
that the most extreme drug resistance has been found and the broadest-spectrum
antimicrobials are being used (Doron and Davidson, 2011). The selection of resistant
bacterial strains in individual hospitalised patients that is caused by antimicrobial
exposure also have potential ecological implications in the community, through the
spread of resistant strains (Timothy H. Dellit et al., 2007). Unfortunately, the
extensive use of antimicrobials continues to increase; as an example the latest data
on the overall antimicrobial consumption in the EU hospital sector (2010–2014)
showed a significant increasing trend (ECDC, 2015). Moreover, an estimated 20-
50% of all antimicrobials prescribed in the hospital setting are either unnecessary or
inappropriate (CDC, 2016; Timothy H. Dellit et al., 2007; Doron and Davidson,
2011).
The threat of resistance can be effectively mitigated either by the discovery of new
antimicrobials or by a more appropriate use of antimicrobials. The already small and
dwindling pipeline of drug candidates makes it unlikely that the rescue will come

CHAPTER 1. INTRODUCTION
18
from newly discovered drugs (WHO, 2014, 2011). The course of action, most likely
to succeed, is to find ways of using the existing antimicrobials more prudently.
Actions have been taken worldwide, where hospital based antimicrobial stewardship
Programmes have been incorporated into hospital policies. The term antimicrobial
stewardship covers coordinated interventions, to improve the quality of antimicrobial
use. The primary goal is to optimise clinical outcomes and ensure cost-effectiveness
of therapy, while minimizing unintended consequences of antimicrobial use,
including toxic effects, selection of pathogenic organisms, and the emergence of
antimicrobial resistance (CDC, 2016; Timothy H Dellit et al., 2007).
The use of IT-based interventions, including decision support systems, have been
shown to improve the appropriateness of antimicrobial prescribing in hospitals and
present an exciting new prospect to target inappropriate antimicrobial prescribing
(Baysari et al., 2016; Kullar et al., 2013; MacDougall and Polk, 2005).
When a patient presents at a hospital and is suspected of having an infection,
antimicrobials will be administered to the patient with the purpose of eradicating the
microorganism causing the infection. Choosing an appropriate antimicrobial
treatment is a complicated task where a number of factors must be considered. First,
the clinician must make a reasonable guess on the diagnosis, the severity of the
infection, and on the identity of the microorganism causing the disease (also known
as a pathogen). Secondly, the clinician must make a reasonable guess on the
susceptibility of the likely microorganisms(s) to the antimicrobials available for
therapy, and based on these factors choose an appropriate empirical antimicrobial
treatment (Mandell et al., 2010; Schaechter et al., 2007).
Empirical treatment is a medical term referring to the initiation of antimicrobial
treatment prior to the determination of pathogen identity and antimicrobial
susceptibility. Empirical treatment is often used when managing an infectious disease
and can make the difference between cure and death for infected patients (Leibovici
et al., 1998; Paul et al., 2010). The empirical treatment can be guided by a local
institutional antibiogram (instABG) (Bax et al., 2001; Hindler and Stelling, 2007;
Pakyz, 2007), also known as a “cumulative antibiogram report” (Hindler and Stelling,
2007). An instABG is generated from statistics on the locally tested combinations of
pathogens and antimicrobials and thereby reflects the resistance level in the given
population. From the instABG it can be read that, for example, the probability of E.
coli being susceptible in vitro to cefuroxime is 71%.
Before an empirical treatment is administered, samples will be taken from the patient,
usually both a blood sample and a “local” sample from the suspected site of infection,
for example a urine sample if the patient is suspected of a urinary tract infection.
Within a day or two bacteria are successfully isolated from blood or local samples in
approximately 30% of the patients (Paul et al., 2006). Once isolated, the bacteria are

CHAPTER 1. INTRODUCTION
19
tested for their in vitro susceptibility to a set of antimicrobials. The simplest and most
widely used method for antimicrobial susceptibility testing (AST) is the disc
diffusion test, where bacteria are seeded onto an agar plate and paper discs
impregnated with antimicrobials are placed over the surface. After incubation
susceptibility to antimicrobials appear by clear areas around the disk and resistance
is indicated as bacterial growth up to the discs. The diameter of the zone of inhibition
by diffusion of the antimicrobial on to the agar plate is used to determine the
susceptibility of the bacteria to the set of tested antimicrobials. Quantitative methods
are also used to provide estimate of a minimum inhibitory concentration (MIC), a
value that can be used to determine whether an effective antimicrobial concentration
is attainable in body fluids. The lowest concentration of the antimicrobial agent that
prevents visible growth, usually after an 18- 24-hour incubation period, is the MIC
(Mandell et al., 2010; Schaechter et al., 2007).
The AST results from a bacterial isolate specify its susceptibility to each of the tested
antimicrobials. The AST results can give reason to change the empirical treatment
administered to the patient into a “final” treatment, where susceptibility to the
antimicrobial treatment is confirmed by the AST. Due to the phenomenon of cross-
susceptibility/resistance an AST result showing susceptibility to an antimicrobial
often implies susceptibility to similar antimicrobials. Likewise, an AST result
showing resistance to an antimicrobial often implies resistance to similar
antimicrobials.
Factors specific to the patient suspected of infection must be considered to arrive at
the optimal choice of antimicrobial treatment (Leibovici et al., 1999; Mandell et al.,
2010). In this project, we addressed the following patient specific factors related to
antimicrobial susceptibility:
1. Nosocomiality (NOSO): Patients with a Hospital-Acquired Infection (HAI)
have a higher probability of being infected with resistant pathogens than
patients with Community-Acquired Infections (CAI) (ECDC, 2017; Sanden
et al., 2017).
2. Prior Exposure (PE): Patients recently exposed to antimicrobials have
higher probability of subsequent increased bacterial resistance (Bell et al.,
2014; Sanden et al., 2016).
3. AST results: Typically, AST results becomes available for a limited set of
antimicrobials. When patient-specific AST results become available, and a
treatment must be chosen, cross-resistance and cross-susceptibility for the
untested treatments must be considered (Andreassen et al., 2015; Leclercq
et al., 2013).
The aim of the project was to generate personalised ABGs, which predicts patient
specific antimicrobial susceptibility in the hospital setting. During the project, we
focused on making the research operational, by developing practical implementable

CHAPTER 1. INTRODUCTION
20
applications. The following chapters each present a step taken to generate
personalised ABGs. These steps are shown on Figure 1.1.
Figure 1.1: Flow diagram showing the steps taken to generate personalised ABGs, starting with an institutional ABG, which was modified first by nosocomiality (NOSO). The resulting
ABG|NOSO was then modified by prior antimicrobial exposure (PE) resulting in an ABG|NOSO,PE and by AST results resulting in an ABG|NOSO,AST. The ABG|NOSO,PE and the ABG|NOSO,AST were then combined. Finally, in vivo susceptibility modifications were
made in the already existing system, TREAT Steward.
Chapter 2 provides of description of the work done to generate institutional ABGs
accounting for nosocomiality. The first aim was to generate versions of the
ABG|NOSO that represented community-acquired infections (ABG|CAI) and
hospital-acquired infections (ABG|HAI), respectively. The second aim was to
include evidence on cross-susceptibility/resistance in the ABGs, resulting in a
crossABG|HAI and a crossABG|CAI. The crossABG was also a prerequisite for the
approaches presented in Chapter 3 and Chapter 5.
Chapter 3 is based primarily on Paper I. When AST results become available, it
might give reason to adjust the expected susceptibility to antimicrobials for which
susceptibility was not tested. The research objective was to develop and validate a
method which uses cross-susceptibility/resistance to adjust an instABG with respect
to AST results. The resulting personalised ABG is denoted ABG|AST.

CHAPTER 1. INTRODUCTION
21
Chapter 4 is based primarily on Paper II. Bacteria from patients recently exposed to
antimicrobials have an increased probability of being resistant to antimicrobials
compared to those not recently exposed to antimicrobials. To generate ABGs for
these patients by adjusting an instABG, a quantification of the increased resistance
was needed. The research objective was to quantify the effect of prior antimicrobial
exposure at patient level.
Chapter 5 describes a method developed with the purpose of modifying the instABG
to account for a patient’s prior exposure (PE) to antimicrobials, where the resulting
ABG is denoted ABG|PE. The chapter also serves as an operationalisation of Paper
II. The content of this chapter is included in a patent application.
Chapter 6 describes a method developed with the purpose of modifying the instABG
to account for both PE and for AST results. The resulting ABG is denoted
ABG|PE,AST. Like Chapter 5, the content of this chapter is also included in a patent
application.
Chapter 7 describes the implementation of the developed in vitro susceptibility
modifications. The developed methods were implemented in TREAT Steward, a
software solution for antimicrobial stewardship. The implementation is illustrated by
going through a patient example.
These chapters and the included objectives are steps towards generating personalised
ABGs, serving as a better starting point for antimicrobial treatment than an instABG.
Thereby the project seeks to contribute to patient specific antimicrobial stewardship.
The main findings, scientific contributions are discussed in Chapter 8, which also
gives a conclusion and addresses future work.

CHAPTER 2. INSTITUTIONAL ABGS
22
CHAPTER 2. INSTITUTIONAL ABGS
To be able to generate personalised ABGs, we needed an instABG, which could be
adjusted to patient specific factors. This chapter describes the approach used to
generate an instABG from an isolate database, including the steps taken to ensure
the quality of the isolate database. The chapter also describes how one of the patient
specific factors, nosocomiality (NOSO), is taken into account by compiling two
separate ABG|NOSO, one for community-acquired infections, the ABG|CAI and one
for hospital-acquired infections, the ABG|HAI. Finally, the chapter describes the
compilation of the cross-susceptibility and cross-resistance ABG, the crossABG of a
given pathogen for pairs of antimicrobials. The crossABG is a prerequisite for the
approaches presented in Chapter 3 and Chapter 5. Figure 2.1 shows the relation
between the content of this chapter and the rest of the thesis.
Figure 2.1: This chapter describes the first steps taken to generate personalised ABGs, resulting in ABG|NOSO.
The instABG is generated from statistics on the locally tested combinations of
pathogens and antimicrobials and thereby reflects the resistance level for the patients
in the institution. In the context of generating personalised ABGs, the instABG serves
as our prior knowledge, which can be adjusted by patient specific factors. To illustrate
the process of generating an ABG|HAI and ABG|CAI and the corresponding
crossABG|HAI and crossABG|CAI, we will use a microbiological isolate database
from Rambam Health Care Campus in Israel as an example. The database was
compiled for the period 2012 to 2015 as part of a hospital specific calibration of the
software solution for antimicrobial stewardship, TREAT Steward (Treat Systems
ApS). When the ABGs were generated, as traditionally recommended, solely on the

CHAPTER 2. INSTITUTIONAL ABGS
23
basis of institutional AST results, some complications and limitations arose, which
will be addressed in the following.
We divided the generation of an instABG into five steps, which will be described in
the following sections:
Step 1 – Quality-check of the isolate database: The purpose of the first step was to
ensure the quality of the isolate database, which contained AST results for the
pathogens isolated from patient samples at the hospital’s microbiological laboratory.
Step 2 – Mapping reported species into pathogen groups: The reported species
were mapped into pathogen groups, to decrease the risk of estimating susceptibilities
on the basis of a few, or even zero observed cases.
Step 3 - Hospital and community ABGs: The instABG was separated into an ABG
representing hospital-acquired infections (ABG|HAI) and an ABG representing
community-acquired infections (ABG|CAI).
Step 4 – Filling in the gaps: For many entries, both in the ABG|HAI and the
ABG|CAI, few or no susceptibility results were available. We explored how to
include more evidence in the ABG|HAI and ABG|CAI to fill in the empty entries.
Step 5 – Including cross-resistance in the ABG: The cross-susceptibility and cross-
resistance observed in the isolate database were included in a crossABG|HAI and a
crossABG|CAI. A similar crossABG will be used in Chapter 3 and Chapter 5.
2.1. QUALITY-CHECK OF THE ISOLATE DATABASE
The compiled isolate database from Rambam contained all AST results from in vitro
isolated pathogens from all sample types (e.g. blood, urine, sputum). The database
contained 44,557 patient- and episode-unique isolates. Examples are presented in
Table 2.1. Each isolate was associated with information about:
Isolate ID
Patient ID (anonymised)
Patient age
Admission date of the patient
Sample date (when the sample was taken)
Sample type (blood or other)
Species name
AST results (susceptible=S, resistant=R or intermediate=I)

CHAPTER 2. INSTITUTIONAL ABGS
24
Iso
late
ID
Pa
tien
tID
Ag
e
Ad
mis
sio
n
Da
te
Sa
mp
le
Da
te
Pa
thog
en
Na
me
Am
ikacin
Am
ox
icil
lin
Am
pic
illi
n
Cefa
zoli
n
Cefo
tax
ime
Ceft
azid
ime
Ceft
ria
xo
ne
Cefu
rox
ime
200150001 1572832 77 12/31/2011 1/1/2012 Enterococcus
faecalis
200150004 1395133 24 1/1/2015 1/1/2015 Escherichia coli S R S S S
200150010 1407741 76 12/21/2013 12/21/2013 Klebsiella
pneumoniae ssp R R R R R
200150011 1604350 47 12/31/2014 12/31/2014 Enterobacter cloacae
S S S R
Table 2.1: A segment of the data contained in the isolate database from Rambam.
Isolates were selected for further analysis provided:
1. The first 6 columns containing Isolate ID, Patient ID, Patient age, Admission
date, Sample date and Pathogen name were all filled in,
2. The patient’s age was over 18 years,
3. Admission date was before the Sample date, and
4. The isolate was not a duplicate.
Two isolates were defined as duplicates if the isolates were from the same patient,
had the same species name and the sample dates were separated by less than 30 days.
To decide which one of the duplicates to be considered for deletion, a number of
checks were performed. The duplicate to be deleted was identified by being:
The isolate with the lowest number of AST results, or
If the isolates had the same number of AST results: The least resistant isolate
(fewest number of AST results = R), or
If the two samples have identical AST results: The newest isolate.
A list of isolates with issues was constructed, i.e. a list of all isolates not satisfying
one or more of the above criteria (Table 2.2). The list was used as a review tool where
the reviewer could enter Yes or No in the “Delete isolate?” column and also enter a
comment.

CHAPTER 2. INSTITUTIONAL ABGS
25
Issue
ID
Isolate ID Mistakes description Delete
isolate?
Comment
1 201226091 Duplicate of isolate: 201225342 Yes
2 201208437 Duplicate of isolate: 201208305 Yes
3 201208305 Duplicate of isolate: 201213276 Yes
4 201208437 Duplicate of isolate: 201213276 Yes
Table 2.2: A segment of a list of isolates with identified issues.
In total, we identified 10,129 issues that were added to the list. A review by a clinical
expert from the institution had the purpose of identifying which issues should be
deleted from the isolate database, and whether additional data could be provided in
cases of missing data. After the review, all 10,129 isolates were deleted and the
remaining 34,427 were selected for further analysis.
2.2. MAPPING SPECIES INTO PATHOGEN GROUPS
In the microbiological laboratory, the name of the identified species is reported for
each isolate. Even though an isolate database may contain several thousand isolates
like the Rambam database, some of the species do not occur frequently. As a
consequence, the susceptibility for some pathogen/antimicrobial combinations must
be decided on the basis of a few, or even zero observed cases. Since susceptibilities
change over time, the problem cannot be solved by including susceptibility data for
a longer period of time. It is recommended that clinical microbiology laboratories
generate local ABGs with pathogen-specific susceptibility data annually, to optimise
recommendations for empirical therapy (Mandell et al., 2010). Susceptibility data
older than three years should definitely be used with caution. To get higher isolate
counts, it may be useful to construct an ABG|HAI and an ABG|CAI for groups of
pathogens, where each pathogen group may contain one or more species. If the
groups are carefully defined the loss of species resolution caused by the grouping
may be more than compensated for by the reduction in statistical noise caused by the
higher counts, thus providing an overall improved accuracy of the estimates of
susceptibility (Andreassen et al., 2009).
In the isolate database from Rambam, we found 285 different species names. The
reporting of species names was not standardised, and therefore there the 285 different
names may not truly reflect 285 different types of species. Table 2.3 shows the
mapping of species into pathogen groups for the Rambam database, where the
reported species names were mapped into 27 pathogen groups. The mapping was
approved by a local expert. Even though the grouping of species provided higher
isolate counts, some groups were still represented by sparse susceptibility data with

CHAPTER 2. INSTITUTIONAL ABGS
26
counts smaller than 20 (Campylobacter, HACEK, Listeria, Meningococcus,
Moraxella, and Streptococcus group D).
Pathogen group Species reported from institutional laboratory
Acinetobacter
(N = 1278)
Acinetobacter baumannii Acinetobacter radioresistens
Acinetobacter calcoaceticus Acinetobacter spp
Acinetobacter haemolyticus Acinetobacter ursingii
Acinetobacter johnsonii Nocardia brasiliensis
Acinetobacter junii Nocardia spp
Acinetobacter lwoffii Streptomyces species
Campylobacter
(N = 15)
Campylobacter fetus Campylobacter spp
Campylobacter jejuni
Candida (N = 161)
Aspergillus flavus Candida parapsilosis
Aspergillus fumigatus Candida pelliculosa
Aspergillus Niger Candida species,not albicans
Aspergillus terreus Candida tropicalis
Candida albicans Fusarium spp
Candida dubliniensis Mould fungus
Candida glabrata Saccharomyces cerevisiae
Candida krusei
Citrobacter
(N = 788)
Citrobacter amalonaticus Citrobacter koseri (C. diversus)
Citrobacter braakii Citrobacter sedlakii
Citrobacter farmeri Citrobacter spp
Citrobacter freundii Citrobacter youngae
Citrobacter koseri
Escherichia coli
(N = 8563)
Escherichia coli Escherichia hermannii
Escherichia fergusonii
Enterobacter (N = 1199)
Enterobacter aerogenes Enterobacter cloacae
Enterobacter amnigenus Enterobacter gergoviae
Enterobacter asburiae Enterobacter species
Enterococcus
(N = 4348)
Enterococcus avium Enterococcus gallinarum
Enterococcus casseliflavus Enterococcus hirae
Enterococcus durans Enterococcus raffinosus
Enterococcus faecalis Enterococcus spp
Enterococcus faecium
Gram Negative Anaerobe
(N = 213)
Anaerobic gram negative rods Fusobacterium mortiferum
Anaerobic gram positive rod Fusobacterium nucleatum
Bacteroidas ovatus Fusobacterium spp
Bacteroides caccae Prevotella bivia
Bacteroides distasonis Prevotella intermedia
Bacteroides fragilis Prevotella melaninogenica
Bacteroides spp Prevotella oralis
Bacteroides stercoris Prevotella oris
Bacteroides thetaiotaomicron Prevotella species (non-pigmented group)
Bacteroides uniformis Prevotella species (pigmented group)
Bacteroides vulgatus Veillonella parvula

CHAPTER 2. INSTITUTIONAL ABGS
27
Delftia acidovorans Veillonella spp
Gram Positive
Anaerobe
(N = 95)
Actinomyces meyeri Clostridium spp
Actinomyces naeslundii Clostridium subterminale
Actinomyces spp Eubacterium lentum
Anaerobic gram positive coccus Eubacterium spp
Arcanobacterium haemolyticum Peptococcus sp.
Clospridium spp Peptostreptococcus anaerobius
Clostridium barati
Peptostreptococcus
asaccharolyticus
Clostridium clostridiiforme Peptostreptococcus micros
Clostridium paraputrificum Peptostreptococcus sp.
Clostridium perfringens Propionibacterium acnes
Clostridium septicum Propionibacterium species
Clostridium sordellii Rothia mucilaginosa
Gram Positive Rods
(N = 64)
Bacillus species Corynebacterium species
Bacillus subtilis (globigii) Corynebacterium stariatum
Corynebacterium amycolatum Corynebacterium urealyticum
Corynebacterium jeikeium group Cryptococcus neoformans
Corynebacterium minutissimum Erysipelothrix rhusiopathiae
Corynebacterium pseudodiphteriticum
Gram positive bacilli
HACEK
(N = 3) Eikenella corrodens
Haemophilus
(N = 329)
+Haemophilus influenza beta lact Haemophilus influenzae
-Haemophilus influenza beta lact Haemophilus parainfluenzae
Haemophilus influenza invasive Haemophilus spp
Klebsiella (N = 4469)
Klebsiella oxytoca
Klebsiella pneumoniae ssp
pneumoniae
Klebsiella oxytoca/(Raoultella planticola/terrigena)
Klebsiella pneumoniae ssp pneumoniae/(R.planticola/terrig.)
Klebsiella pneumoniae Klebsiella spp
Klebsiella pneumoniae ssp ozaenae
Listeria
(N = 10)
Listeria monocytogenes Listeria species
Meningococcus
(N = 1) Neisseria meningitidis
Moraxella (N = 10)
Moraxella group Moraxella osloensis
Other Gram Negative
(N = 943)
Achromobacter xylosoxidans ssp
denitrificans Kluyvera cryocrescens
Achromobacter xylosoxidans ssp xylosoxidans Kluyvera species
Aeromonas hydrophila/caviae Neisseria cinerea
Aeromonas salmonicida Neisseria gonorrhoeae
Aeromonas sobria Neisseria spp
Aeromonas spp
Nonfermenting Gram-Negative
Bacillus
Aeromonas veronii biovar veronii Ochrobactrum anthropi
Alcaligenes faecalis ssp faecalis
Pantoea agglomerans (formerly
enterobacter agglomerans)
Bordetella bronchiseptica Pantoea spp

CHAPTER 2. INSTITUTIONAL ABGS
28
Branhamella catarrhalis Pasteurella multocida
Brevundimonas diminuta Pasteurella pneumotropica
Brevundimonas diminuta/vesicularis Pasteurella spp
Brucella melitensis Prevotella disiens
Brucella melitensis complement Rahnella aquatilis
Burkholderia cepacia Raoultella ornithinolytica
Burkholderia cepacia group Raoultella planticola
Burkholderia gladioli Rhizobium radiobacter
Cedecea davisae Serratia ficaria
Chryseobacterium gleum Serratia fonticola
Chryseobacterium indologenes Serratia liquefaciens
Chryseobacterium
meningosepticum Serratia liquefaciens group
Comamonas testosteroni Serratia marcescens
Ewingella americana Serratia odorifera
Finegoldia magna Serratia plymuthica
Gardnerella vaginalis Serratia rubidaea
Globicatella sanguinis Serratia species
Gram negative bacilli Shewanella putrefaciens group
Gram negative coccobacilli Sphingobacterium spiritivorum
Granulicatella adiacens Sphingobacterium thalpophilum
Granulicatella elegans Sphingomonas paucimobilis
Hafnia alvei Stenotrophomonas maltophilia
Pneumococcus
(N = 215) Streptococcus pneumoniae
Proteus (N = 2818)
Morganella morganii Proteus vulgaris group
Morganella morganii ssp morganii
Proteus vulgaris group/Proteus
penneri
Morganella morganii ssp sibonii Providencia alcalifaciens
Proteus mirabilis Providencia rettgeri
Proteus penneri Providencia species
Proteus species Providencia stuartii
Pseudomonas
(N = 215)
Pseudomonas aeruginosa Pseudomonas pseudoalcaligenes
Pseudomonas fluorescens Pseudomonas putida
Pseudomonas luteola Pseudomonas spp
Pseudomonas mendocina Pseudomonas stutzeri
Pseudomonas oryzihabitans
Salmonella non typhi
(N = 44)
Salmonella enteritidis Salmonella spp
Salmonella group
Staphylococcus -
Coagulase negative (N = 1437)
Coagulase negative Staphylococcus
Staphylococcus hominis ssp hominis
Micrococcus luteus / lylae Staphylococcus hyicus
Micrococcus species Staphylococcus intermedius
Staphylococcus auricularis Staphylococcus lentus
Staphylococcus capitis Staphylococcus lugdunensis
Staphylococcus caprae Staphylococcus saccharolyticus
Staphylococcus chromogenes Staphylococcus saprophyticus
Staphylococcus cohnii ssp cohnii Staphylococcus schleiferi
Staphylococcus cohnii ssp urealyticum
Staphylococcus sciuri

CHAPTER 2. INSTITUTIONAL ABGS
29
Staphylococcus epidermidis Staphylococcus simulans
Staphylococcus haemolyticus Staphylococcus warneri
Staphylococcus hominis Staphylococcus xylosus
Staphylococcus -
Coagulase positive
(N = 2973)
Gram positive cocci consistent with Staphylococcus
Staphylococcus aureus
Streptococcus group A
(N=24) Streptococcus pyogenes (group A)
Streptococcus group B
(N = 434)
Streptococcus agalactiae (Group
B)
Streptococcus group B
Streptococcus group D
(N = 16)
Streptococcus alactolyticus Streptococcus gallolyticus ssp
gallolyticus
Streptococcus gallolyticus Streptococcus gordonii
Streptococcus viridans (N = 259)
Alpha haemolytic Streptococcus Streptococcus pluranimalium
Gemella morbillorum
Streptococcus parasanguinis Streptococcus salivarius
Streptococcus infantarius ssp coli Streptococcus sanguis
Streptococcus mitis/oralis/ Streptococcus spp
Streptococcus mitis/Streptococcus
oralis Streptococcus vestibularis
Streptococcus mutans Streptococcus viridans group
Streptococcus pasteurianus
Streptococcus
(N = 137)
Aerococcus viridans Streptococcus dysgalactiae ssp
equisimilis
Str.dys.dysgalactiae/Str.dys.equisimilis
Streptococcus group C
Streptococcus anginosus Streptococcus group F
Streptococcus canis Streptococcus group G
Streptococcus constellatus Streptococcus intermedius
Streptococcus constellatus (viridans strep) Streptococcus thermophilus
Streptococcus constellatus ssp
pharyngis Streptococcus thoraltensis Streptococcus dysgalactiae ssp
dysgalactiae
Table 2.3: The mapping of species into pathogen groups for the Rambam database.
As an example, Table 2.4 shows the last pathogen group from Table 2.3,
streptococcus. It can be seen, that only 2 out of 15 reported species were isolated
more than 20 times. For the majority of the reported species in this group, the small
number of isolates are not useful to compile a species-specific susceptibility profile
in an instABG. When segregating the isolates into those representing HAIs and CAIs,
the number of isolates in each group are further reduced. In section 2.4 we explore
how to include more evidence in the ABG|HAI and ABG|CAI, than what can be
achieved by using statistics on institutional AST results.

CHAPTER 2. INSTITUTIONAL ABGS
30
The streptococcus pathogen group N
Aerococcus viridans 8
Str.dys.dysgalactiae/Str.dys.equisimilis 4
Streptococcus anginosus 56
Streptococcus canis 1
Streptococcus constellatus 9
Streptococcus constellatus (viridans strep) 2
Streptococcus constellatus ssp pharyngis 5
Streptococcus dysgalactiae ssp dysgalactiae 2
Streptococcus dysgalactiae ssp equisimilis 25
Streptococcus group C 1
Streptococcus group F 2
Streptococcus group G 3
Streptococcus intermedius 15
Streptococcus thermophilus 3
Streptococcus thoraltensis 1
Total number of streptococcus isolates 137
Table 2.4: The number of isolates in the streptococcus pathogen group.
2.3. HOSPITAL AND COMMUNITY ABGS
One of the patient specific factors that the ABG can be adjusted for is nosocomiality,
i.e. whether the infection is hospital-acquired or community-acquired. The high rates
of antimicrobial resistance in hospitals has been associated with high rates of
antimicrobial use (Doron and Davidson, 2011). Patients with hospital-acquired
infections therefore have a higher probability of being infected with resistant
pathogens than patients that have acquired an infection elsewhere. This gives reason
to compile an ABG|HAI for hospital-acquired infections (HAI) and an ABG|CAI for
community-acquired infections (CAI). The effect of higher resistance in HAIs has
been shown to be sufficiently expressed in infections acquired after at least 7 days in
hospital, to be used to generate hospital specific ABGs (Dickstein et al., 2016).
Throughout the thesis, we will use three versions of the instABG, which were defined
as follows:
The ABG|CAI included isolates from samples drawn before a patient had spent 7
days in hospital. Thereby the ABG|CAI mainly represents patients, who had
community-acquired infections, but isolates from patients coming from other
healthcare facilities than the hospital (e.g. nursing home) could also be included.
The ABG|HAI included isolates from samples drawn after a patient had spent 7 days
in hospital. The ABG|HAI thereby represents patients, who had hospital-acquired
infections.

CHAPTER 2. INSTITUTIONAL ABGS
31
The instABG included the total patient population represented in the isolate database
from the microbiological laboratory. The instABG thereby included both the
ABG|HAI and the ABG|CAI.
Table 2.5 shows the antimicrobial specific susceptibilities for biggest pathogen
group, E. coli, in the three versions of the ABG. It can be seen, for example, that the
probability of an E. coli isolate being susceptible to cefuroxime is 71.2% in CAIs and
49.6% in HAIs.
Pathogen: E. coli Probability of susceptibility
Antimicrobial instABG ABG|CAI ABG|HAI
Ampicillin 25.2% 26.6% 13.4%
Piperacillin 31.6% 32.4% 25.0%
Amoxicillin-clavulanate 78.3% 80.0% 63.0%
Piperacillin-tazobactam 92.9% 93.6% 86.8%
Cefazolin 50.0% 53.2% 28.6%
Cefuroxime 68.9% 71.2% 49.6%
Ceftazidime 72.7% 74.8% 55.1%
Ceftriaxone 72.8% 74.9% 55.3%
Meropenem 99.7% 99.8% 99.0%
Ertapenem 99.7% 99.8% 99.1%
Imipenem-cilastatin 99.7% 99.8% 99.4%
Aztreonam 41.5% 36.2% 55.6%
Doxycycline 45.4% 47.3% 30.0%
Gentamicin 81.1% 82.5% 69.1%
Amikacin 99.5% 99.7% 98.3%
Ofloxacin 57.2% 58.1% 47.3%
Ciprofloxacin 57.5% 59.3% 41.9%
Nitrofurantoin 95.8% 95.8% 96.4%
Fosfomycin 99.1% 99.1% 98.6%
Sulfa-trimethoprim 54.2% 55.7% 41.5%
Chloramphenicol 90.3% 89.3% 95.7%
Table 2.5: Probability of susceptibility in E. coli isolates.
We compared the susceptibility levels in the ABG|HAI and the ABG|CAI (Sanden et
al., 2017). The differences in resistance levels were calculated as odds ratios (ORs)
with 95% confidence intervals (CI) for resistance. The results presented in the
following are mainly based on a conference abstract (ECCMID 2017)(Sanden et al.,
2017).
Figure 2.2 shows the difference in the susceptibility data from HAI and CAI for the
pathogen group with the highest number of AST results, E. coli (NAST = 113,791). As
expected, E. coli showed significantly higher resistance to most antimicrobials (16
out of the 21 antimicrobials) in HAIs compared to resistance in CAIs. This included
significantly higher resistance in HAIs for all penicillins (ORs: 2.2-2.4),
cephalosporins (ORs: 2.4-2.8), aminoglycosides (ORs: 2.1-5.1), and quinolones
(ORs: 1.5-2.0).
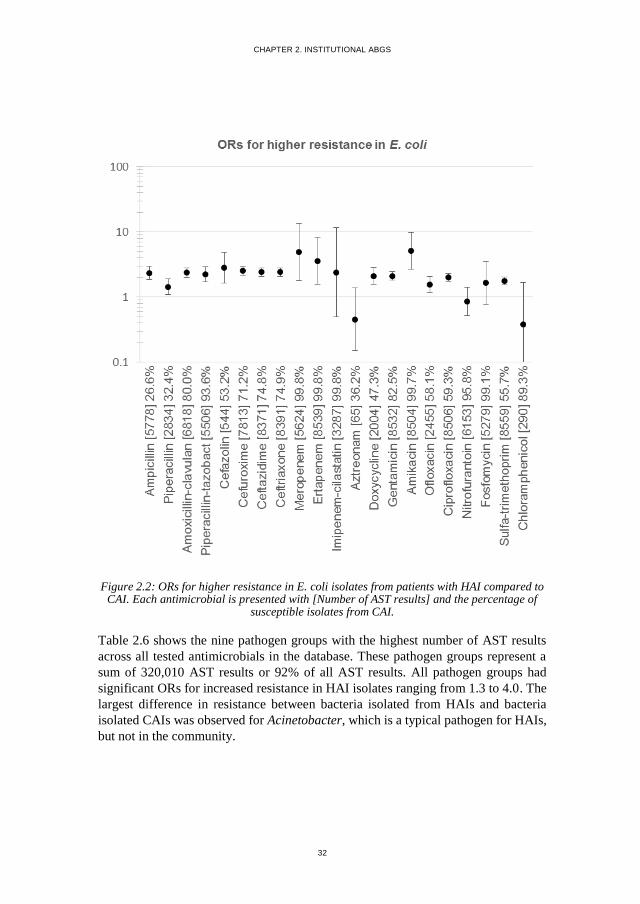
CHAPTER 2. INSTITUTIONAL ABGS
32
Figure 2.2: ORs for higher resistance in E. coli isolates from patients with HAI compared to CAI. Each antimicrobial is presented with [Number of AST results] and the percentage of
susceptible isolates from CAI.
Table 2.6 shows the nine pathogen groups with the highest number of AST results
across all tested antimicrobials in the database. These pathogen groups represent a
sum of 320,010 AST results or 92% of all AST results. All pathogen groups had
significant ORs for increased resistance in HAI isolates ranging from 1.3 to 4.0. The
largest difference in resistance between bacteria isolated from HAIs and bacteria
isolated CAIs was observed for Acinetobacter, which is a typical pathogen for HAIs,
but not in the community.

CHAPTER 2. INSTITUTIONAL ABGS
33
Pathogen group NAST (%HAI) OR (95% CI)
Acinetobacter 11,031 (51%) 4.0 (3.7-4.3)
Staph. coag. pos. 25,620 (24%) 2.6 (2.4-2.8)
Staph. coag. neg. 11,852 (20%) 2.1 (1.9-2.3)
Klebsiella 58,499 (25%) 2.1 (2.0-2.2)
Enterococcus 17,292 (19%) 1.8 (1.7-2.0)
E. coli 113,791 (10%) 1.7 (1.7-1.8)
Pseudomonas 30,500 (39%) 1.6 (1.5-1.7)
Proteus 36,588 (24%) 1.5 (1.4-1.6)
Enterobacter 14,837 (23%) 1.3 (1.2-1.4)
All pathogen groups 343,761 (21%) 1.94 (1.87-1.94)
Gram- pathogen groups 286,098 (21%) 1.87 (1.84-1.91)
Gram+ pathogen groups 56,877 (21%) 2.24 (2.14-2.34)
Table 2.6: ORs for higher resistance in HAI compared to CAI.
As expected we observed a significant difference in resistance level in the
susceptibilities from the ABG|HAI and the ABG|CAI. The results emphasise the
importance of personalising the instABG with respect to HAI and CAI.
2.4. FILLING IN THE GAPS IN THE ABGS
The ABG|HAI and ABG|CAI from Rambam each included 27 pathogen groups and
55 antimicrobials, giving a total number of 27*55 = 1485 entries in each of these
ABGs. Table 2.7 shows a segment of the AST results used in the ABG|HAI. Many
of the entries remained empty or only contained a few results (coloured red). By using
the statistics from pathogen/antimicrobial combinations with >10 AST results it was
possible to fill in 213 (15%) of the 1485 entries in the ABG|HAI and 265 (18%) of
the entries in the ABG|CAI.

CHAPTER 2. INSTITUTIONAL ABGS
34
HAI statistics Pathogen
Antimicrobial AS
T r
esu
lt
Aci
net
oba
cter
E. co
li
Str
epto
cocc
us
Penicillin S 0 0 8
J01CE01 R 0 0 0
Cloxacillin S 0 0 0
J01CF02 R 0 0 0
Oxacillin S 0 0 0
J01CF04 R 0 0 0
Ampicillin-sulbactam S 267 0 0
J01CR01 R 257 0 0
Amoxicillin-clavulanate S 0 427 0
J01CR02 R 0 251 0
Piperacillin-tazobactam S 52 488 0
J01CR05 R 567 74 0
Cefalexin S 0 0 0
J01DB01 R 0 0 0
Cefazolin S 0 20 0
J01DB04 R 0 50 0
Cefuroxime S 0 412 0
J01DC02 R 0 418 0
Table 2.7: A segment of the AST results used in the ABG|HAI.
For the ABG to be used as a guidance for the choice of antimicrobial therapy both
for clinicians and for decision support systems, all entries must be filled in. Although
the susceptibility is usually tested to antimicrobials which are likely to be chosen for
therapy, it may be necessary to use an antimicrobial, for which few or no
susceptibility results are available in the ABG|HAI or ABG|CAI.
INCLUDING PRIOR DISTRIBUTIONS
To fill in the empty entries in the ABG we explored how to include more evidence in
the ABG|HAI and ABG|CAI, than what can be achieved by using statistics on
institutional AST results. This additional evidence may, in the Bayesian tradition, be
considered prior information, i.e. prior to the statistical processing of the institutional
AST results. This evidence can be expressed as (prior) probability distributions, for
example based on:
Susceptibility data from another period of time
Susceptibility data from another institution
Opinions from clinical experts
Observations from the literature
The probabilities derived from these sources are expressed as Dirichlet counts. For
example, the prior opinion derived from one of these sources may be that the

CHAPTER 2. INSTITUTIONAL ABGS
35
probability of susceptibility of E. coli to cefuroxime is 80%. This may be expressed
as 8 imaginary “Dirichlet observations” in the isolate database of susceptibility and
2 observations of resistance. A convenient property of this way of expressing prior
opinions is that the Bayesian posterior probability is very simple to calculate. The
Dirichlet observations are simply added to any real observations in the isolate
database (Spiegelhalter et al., 1993). For example, if the isolate database contains 100
observations of the susceptibility of E. coli to cefuroxime, 71 (71%) showing
susceptibility and 29 (29%) showing resistance then the posterior probability of
susceptibility would be (8 + 71) / (8+ 71 + 2 + 29) = 72% (Table 2.8). This is close
to the 71% observed in the isolate database. Had the number of Dirichlet observations
been 1000, 800 observation of susceptibility and 200 of resistance, then the resulting
posterior would have been 79%. This is close to the prior opinion and this example
illustrates that the number of imaginary Dirichlet observation can be used to indicate
the strength of the prior opinion; A large Dirichlet count (1000) indicating a strong
prior opinion and a small Dirichlet count (10) indicating a weak prior opinion.
Pathogen: E. coli
Antimicrobial AS
T r
esult
RA
M2
015
Pri
or
opin
ion
Cov
erag
e Weak prior opinion
Cefuroxime S 71 8 72%
J01DC02 R 29 2
Strong prior opinion Cefuroxime S 71 800
79% J01DC02 R 29 200
Table 2.8: An example of the use of Dirichlet observations.
To generate an ABG|HAI and ABG|CAI for Rambam, we included the following
prior distributions:
Susceptibility data from another institution: We included an instABG generated
at another Israeli hospital. The instABG was compiled at Beilinson Hospital at Rabin
Medical Center and contained susceptibility data from the period 2011-2014. A
segment of the susceptibility data used from this instABG is shown in the column
“Rab2014” in Table 2.9. Counts from the Rab2014 instABG were downscaled to give
a sum of 10. In this way, the contribution of these counts depends on the number of
AST results in the currently assessed database (Ram2015). The higher the counts
from the new isolate database, the smaller the weight from the prior results on the
aggregated probability of susceptibility (“Coverage”).
Opinions from clinical experts: We included expert opinions on the level of
susceptibility suggested by clinical experts at Beilinson Hospital (Rabin Medical
Center) in 2014. These opinions were expressed as statistical counts and examples
are shown in the column “Prior opinion” in Table 2.9.

CHAPTER 2. INSTITUTIONAL ABGS
36
Observations from the literature: EUCAST (The European Committee on
Antimicrobial Susceptibility Testing) has designed a set of rules on intrinsic
resistance and exceptional phenotypes (EUCAST, 2016). EUCAST expert rules on
intrinsic resistance were expressed as S=0 and R=1000, giving a coverage of 0%.
EUCAST expert rules on resistance of exceptional phenotypes were expressed as S
=1000 and R=0, giving a coverage of 100%. These counts were included in the
column “Prior opinion” in Table 2.9.
Table 2.9 shows a segment of these distributions for E. coli, alongside the statistics
from the current isolate database, all expressed as statistical counts on susceptibility
versus resistance. We will come back to the column “New opinion” in the next
section.
HAI statistics Pathogen: E. coli
Antimicrobial AS
T r
esu
lt
RA
M20
15
RA
B20
14
Pri
or
op
inio
n
New
opin
ion
Co
ver
age
Ampicillin-sulbactam S 0 4.8 39.8 41%
J01CR01 R 0 5.2 60.2
Amoxicillin-clavulanate S 427 6.9 45.1 61%
J01CR02 R 251 3.1 54.9
Piperacillin-tazobactam S 488 9.6 82.5 86%
J01CR05 R 74 0.4 17.5
Cefalexin S 0 6.4 0 1%
J01DB01 R 0 3.7 1000
Cefazolin S 20 0 20 24%
J01DB04 R 50 0 80
Cefuroxime S 412 6.4 51.7 50%
J01DC02 R 418 3.6 48.3
Table 2.9: A segment of the statistical distributions for E. coli in HAIs.
REVIEW AND NEW OPINIONS
Now with the distributions available, the next step towards a final ABG was to get
the susceptibility data, representing our current posterior belief, reviewed by a
clinical expert from the institution. This was done to get input about local
susceptibilities, which were not reflected in the available statistical counts. The
column “New opinion” was used to handle this process where the reviewer could
enter opinions expressed as statistical counts (Table 2.10).

CHAPTER 2. INSTITUTIONAL ABGS
37
HAI statistics Pathogen: E. coli
Antimicrobial AS
T r
esult
RA
M20
15
RA
B20
14
Pri
or
op
inio
n
New
opin
ion
Co
ver
age
Ampicillin-sulbactam S 0 4.8 39.8 428 60%
J01CR01 R 0 5.2 60.2 252
Amoxicillin-clavulanate S 427 6.9 45.1 427 62%
J01CR02 R 251 3.1 54.9 251
Piperacillin-tazobactam S 488 9.6 82.5 488 87%
J01CR05 R 74 0.4 17.5 74
Cefalexin S 0 6.4 0 20 2%
J01DB01 R 0 3.7 0 51
Cefazolin S 20 0 20 20 25%
J01DB04 R 50 0 80 50
Cefuroxime S 412 6.4 51.7 412 50%
J01DC02 R 418 3.6 48.3 418
Table 2.10: A segment of the review tool with statistical distributions for E. coli in HAIs.
As a helping tool to draw the reviewer’s attention to cases with divergent statistics,
we highlighted the cells:
Green shading indicated a significant difference in susceptibility counts
between the RAM2015 and the RAB2014 statistics.
Yellow shading indicated a difference between the prior opinion and the
total counts from the RAM2015 and the RAB2014 statistics.
Red shading indicated if new opinions deviated significantly from the sum
of the other three columns.
The resulting column “Coverage” in Table 2.10 now shows a segment of the final
coverages used in the ABG|HAI for E. coli. The coverage was calculated as the sum
of the three distributions and expressed as the probability of susceptibility. For
example, the probability of an E. coli isolate being susceptible to ampicillin-
sulbactam is (4.8 + 39.8 + 428) / (4.8 + 39.8 + 428 + 5.2 + 60.2 + 252) = 60%.
2.5. INCLUDING CROSS-SUSCEPTIBILITY/RESISTANCE IN THE ABG
Susceptibility to an antimicrobial often implies susceptibility to similar
antimicrobials and resistance to an antimicrobial often implies resistance to similar
antimicrobials. When patient specific AST results become available, we can use
knowledge on cross-susceptibility/resistance as an indicator for whether to expect
susceptibility or resistance to antimicrobials for which no AST results are available.

CHAPTER 2. INSTITUTIONAL ABGS
38
This activity is known as interpretative reading of the ABG (Courvalin, 1996;
Leclercq et al., 2013) In Chapter 3 and Chapter 5, we explore approaches of
interpretative reading. In these approaches, we used a crossAGB, which contained
statistics on cross-susceptibility/resistance between pairs of antimicrobials for each
pathogen group.
Table 2.11 shows an example of the statistical data on cross-susceptibility/resistance
that can be obtained from an isolate database, in this case on E. coli isolates in HAIs
from Rambam 2012-2015. Some of the antimicrobials and antimicrobial
combinations have zero AST results (“0”), and thereby no data which can be used to
calculate the level of cross-susceptibility/resistance.
HAI statistics
Pathogen: E. coli
Cefu
roxim
e
J01
DC
02
Cefo
taxim
e
J01
DD
01
Ceft
azi
dim
e
J01
DD
02
Antimicrobial AST statistics S R S R S R
Ampicillin-sulbactam S 0 0 0 0 0 0 0 J01CR01 R 0 0 0 0 0 0 0
Amoxicillin-clavulanate S 427 317 85 0 0 335 83
J01CR02 R 251 28 201 0 0 52 188
Piperacillin-tazobactam S 488 254 187 0 0 295 177 J01CR05 R 74 13 52 0 0 25 46
Table 2.11: An example of the data on cross-susceptibility/resistance that can be obtained from an isolate database.
From the data given in Table 2.11 we can for example calculate the probability of
susceptibility to amoxicillin-clavulanate, which is denoted P(amoCl) as:
P(amoCl) = 427 / (427+251) = 0.63 = 63%.
The conditional probability of susceptibility to amoCl given susceptibility to
cefuroxime (cefur) is denoted P(amoCl|cefur) and is calculated as:
P(amoCl|cefur) = 317/ (317+28) = 0.92 = 92%
The OR for increased susceptibility to amoCl given susceptibility to cefur is
calculated as:
𝑂𝑅𝑎𝑚𝑜𝐶𝑙|𝑐𝑒𝑓𝑢𝑟 =𝑂𝐷𝑎𝑚𝑜𝐶𝑙|𝑐𝑒𝑓𝑢𝑟
𝑂𝐷𝑎𝑚𝑜𝐶𝑙=
𝑃(𝑎𝑚𝑜𝐶𝑙|𝑐𝑒𝑓𝑢𝑟)
1−𝑃(𝑎𝑚𝑜𝐶𝑙|𝑐𝑒𝑓𝑢𝑟)
1−𝑃(𝑎𝑚𝑜𝐶𝑙)
𝑃(𝑎𝑚𝑜𝐶𝑙)=
0.92
0.08
0.37
0.63= 6.7
(These probabilities can be found in Table 2.12)

CHAPTER 2. INSTITUTIONAL ABGS
39
If we then consider susceptibility to amoCl given resistance to cefur, denoted
P(amoCl|¬cefur), only 85 (30%) out of 286 isolates were susceptible to amoCl, with
the corresponding OR = 0.2. In this example, an AST result on cefuroxime would be
a useful indicator for whether or not amoCl could be expected to cover an E. coli
infection, even if the susceptibility to amoCl had not been tested itself.
Table 2.12 shows a segment of a compiled crossABG|HAI for E. coli where the
conditional probabilities and ORs of susceptibility are included for the antimicrobial
listed on the left. Cases with a conditional probability of 100% gives an OR = ∞. We
get a conditional probability of 100% when we calculate an antimicrobial’s cross-
susceptibility to itself (cefur in Table 2.12).
HAI statistics
Pathogen: E. coli
Cefu
rox
ime
J01
DC
02
Cefo
tax
ime
J01
DD
01
Ceft
azid
ime
J01
DD
02
Antimicrobial AST statistics S R S R S R
Ampicillin-sulbactam S 0 0 0 0 0 0 0 J01CR01 R 0 0 0 0 0 0 0
Coverage ? ? ? ? ? ? ?
Odds ratio ? ? ? ? ? ?
Amoxicillin-clavulanate S 427 317 85 0 0 335 83 J01CR02 R 251 28 201 0 0 52 188
Coverage 63% 92% 30% ? ? 87% 31%
Odds ratio 6.7 0.2 ? ? 3.8 0.3
Piperacillin-tazobactam S 488 254 187 0 0 295 177 J01CR05 R 74 13 52 0 0 25 46
Coverage 87% 95% 78% ? ? 92% 79%
Odds ratio 3.0 0.5 ? ? 1.8 0.6
Cefalexin S 0 0 0 0 0 0 0 J01DB01 R 0 0 0 0 0 0 0
Coverage ? ? ? ? ? ? ?
Odds ratio ? ? ? ? ? ?
Cefazolin S 20 13 0 0 0 13 0 J01DB04 R 50 4 44 0 0 2 41
Coverage 29% 76% 0% ? ? 87% 0%
Odds ratio 8.1 0.0 ? ? 16.3 0.0
Cefuroxime S 412 412 0 0 0 407 0
J01DC02 R 418 0 418 0 0 13 398
Coverage 50% 100% 0% ? ? 97% 0%
Odds ratio ∞ 0.0 ? ? 31.8 0.0
Table 2.12: An example of the data on cross-susceptibility/resistance that can be obtained from an isolate database.
The crossABG|HAI and crossABG|CAI compiled for Rambam each included 27
pathogen groups and 55 * 55 pairs of antimicrobials with an entry for respectively
cross-susceptibility and cross-resistance, respectively. This gave a total number of
27*55*55*2 = 163,650 entries in each crossABG. As it can be seen in the data
example in Table 2.12, some of the antimicrobials and antimicrobial combinations,

CHAPTER 2. INSTITUTIONAL ABGS
40
did not have any AST results (“0”), and thereby the probability of cross-
susceptibility/resistance could not be calculated (“?”).
By using the Rambam AST statistics on antimicrobials tested more than 10 times, we
could fill in 5241 (3.2%) of the entries in the crossABG|HAI and 5534 (3.4%) of the
entries in the crossABG|CAI.
EUCAST has designed a set of interpretative rules to assist clinical microbiologists
in the interpretation of antimicrobial susceptibility testing. Some of the rules are
simple, for example: “IF S. aureus is resistant to oxacillin or cefoxitin, THEN report
as resistant to all β-lactams” and some of the rules are complicated, for example: “IF
Enterobacteriaceae are intermediate to tobramycin, resistant to gentamicin, and
susceptible to amikacin, THEN report as resistant to tobramycin” (Leclercq et al.,
2013). The simple rules could be integrated directly in a crossABGs, where for
example the probability of S. aureus being susceptibility to cefuroxime, given
resistance to oxacillin is 0% (OR=0) and likewise for the rest of the group of β-lactam
antimicrobials. The more complicated rules could not be transferred to the
crossABGs. The EUCAST expert rules represent an improvement in the reporting of
susceptibility results, but covered only 265 (0.16%) of the entries in the Rambam
crossABGs.

CHAPTER 3. INTERPRETATIVE READING OF AST RESULTS
41
CHAPTER 3. INTERPRETATIVE
READING OF AST RESULTS
This chapter describes the work done to develop and validate a mathematical method
for interpretative reading of AST results, where probabilities of susceptibility to
untested antimicrobials can be calculated. The resulting method generates
ABG|ASTs, by adjusting the ABG to patient specific AST results. The content of this
chapter is based primarily on Paper I (Andreassen et al., 2015). Figure 3.1 shows
the relation between the content of this chapter and the rest of the thesis.
Figure 3.1: This chapter describes the method developed to generate ABG|NOSO,AST.

CHAPTER 3. INTERPRETATIVE READING OF AST RESULTS
42
3.1. INTRODUCTION
From a Bayesian perspective, the instABG represents our prior evidence; the prior
probability of susceptibility to antimicrobials. When AST results become available,
they add more evidence to our knowledge about the susceptibility. In Paper I, we
explored methods of interpretative reading of AST results. We used data from an
isolate database containing 3,347 isolates with AST results, compiled between 2002
and 2004 at Rabin Medical Center in Israel. The examples and results in this chapter
are based on this database and the corresponding instABG and crossABG.
From the crossABG (described in section 2.5), we can read the probability of
susceptibility to an antimicrobial, given an AST result for one other antimicrobial.
When we have multiple AST results that may affect the susceptibility to an untested
antimicrobial, it becomes more complicated to calculate the combined effect. For an
isolate with 21 AST results, the straightforward solution would to compile the 20-
dimensional probability matrix for cefuroxime, conditional on the other 20 AST
results. Bayes theorem can then be used directly to calculate the posterior probability
of susceptibility to cefuroxime. This is far from a viable solution, because it would
be impossible to populate the 220 elements in this matrix even with an isolate database
compiled over many years in a large hospital.
The aim was to develop and validate a practical method for interpretative reading of
AST results where the susceptibilities are calculated from an instABG and a
crossABG.
3.2. CALCULATING POSTERIOR SUSCEPTIBILITIES
To handle the combined effect of multiple AST results, we explored several versions
of naïve and semi-naïve Bayesian methods, to calculate the probability of
susceptibility to antimicrobials. The naïve Bayes approach includes all significant
ORs for cross-resistance/susceptibility and assumes mutual independence. In the
semi-naïve Bayesian methods, only a limited number of the most significant ORs
were used.
Table 3.1 shows a segment of the crossABG for E. coli with OR for susceptibility to
cefuroxime (cefur), given an AST result for another antimicrobial “A”. The relevant
ORs are bold, for example for ampicillin (A=ampi) with AST=R, we have ORcefur|¬ampi
= 0.63.

CHAPTER 3. INTERPRETATIVE READING OF AST RESULTS
43
Antimicrobial A
AST
result
Cefuroxime
ORcefur|A p ≤ 0.1
ORcefur|¬A p ≤ 0.1
Penicillin
Penicillin
Ampicillin R 23 0.63
Ampicillin-
Sulbactam 6.9 0.40
Amoxicillin-Clavulanate
R 5.1 0.30
Piperacillin R 4.5 0.59
Piperacillin/
Tazobactam S 1.6 0.11
Methicillin
Cephalosporin
Cephalothin R ∞ 0.60
Cefuroxime S ∞ 0
Ceftazidime S 3.4 0.00
Ceftriaxone S 4.5 0
Cefepime S 2.9 0
Carbapenem
Ertapenem NS NS
Imipenem S NS NS
Meropenem S NS NS
Monobactam Aztreonam S 3.4 0.01
Glycopeptide Vancomycin
Macrolide Erythromycin
Tetracycline Minocycline S 2.2 0.55
Tetracycline S 2.4 0.63
Aminoglycoside
Amikacin S 1.8 0.09
Gentamicin S 2.0 0.14
Tobramycin S 3.7 0.10
Quinolone Ciprofloxacin S 5.0 0.18
Ofloxacin S 5.0 0.16
Other
Chloramphenicol
Clindamycin
Colistin S NS NS
Fusidic acid
Rifampicin
Sulfa-Trim S 2.0 0.52
Table 3.1: ORs for E. coli being susceptible to cefuroxime given susceptibility test results to other antimicrobials. NS: Odds ratio Not Significant. Blank field: Susceptibility to this
antimicrobial not tested. S=susceptible and R=resistant.

CHAPTER 3. INTERPRETATIVE READING OF AST RESULTS
44
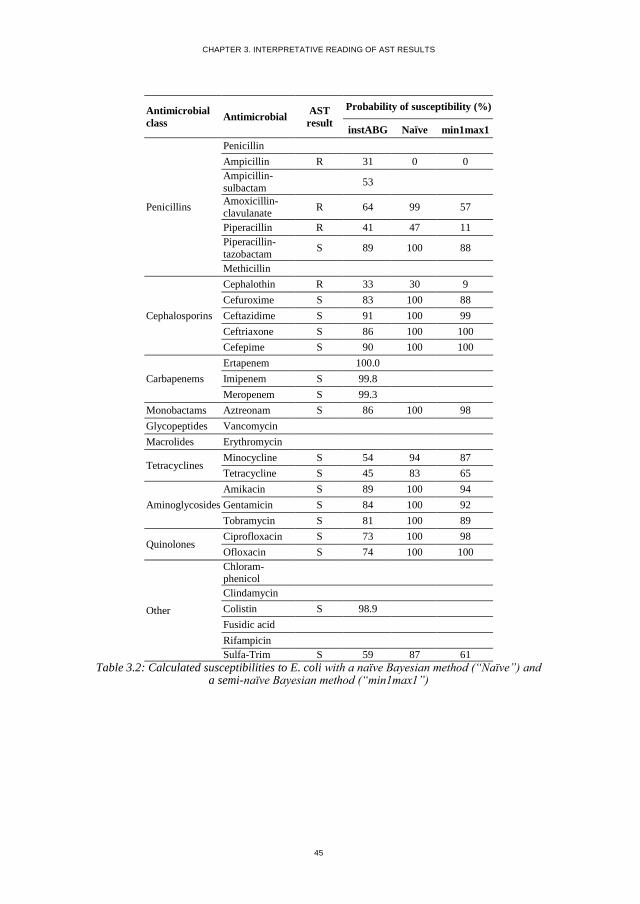
Table 3.2 shows an example of predicted susceptibilities with a naïve Bayesian
method (Naïve) and a semi-naïve Bayesian method (min1max1). We only included
ORs for cross resistance/susceptibility which were significantly different from 1.
The limit of significance was arbitrarily chosen for the example in Table 3.2 as p <
0.1. The semi-naïve Bayesian method, denoted min1max1 method only included
the largest of the ORs for antimicrobials to which the isolate was tested susceptible
and the smallest of the ORs amongst those tested resistant. The same principle was
used for a min2max2 method that included the two largest and the two smallest
ORs.
CHAPTER 3. INTERPRETATIVE READING OF AST RESULTS
45
Antimicrobial
class Antimicrobial
AST
result
Probability of susceptibility (%)
instABG Naïve min1max1
Penicillins
Penicillin
Ampicillin R 31 0 0
Ampicillin-
sulbactam 53
Amoxicillin- clavulanate
R 64 99 57
Piperacillin R 41 47 11
Piperacillin-
tazobactam S 89 100 88
Methicillin
Cephalosporins
Cephalothin R 33 30 9
Cefuroxime S 83 100 88
Ceftazidime S 91 100 99
Ceftriaxone S 86 100 100
Cefepime S 90 100 100
Carbapenems
Ertapenem 100.0
Imipenem S 99.8
Meropenem S 99.3
Monobactams Aztreonam S 86 100 98
Glycopeptides Vancomycin
Macrolides Erythromycin
Tetracyclines Minocycline S 54 94 87
Tetracycline S 45 83 65
Aminoglycosides
Amikacin S 89 100 94
Gentamicin S 84 100 92
Tobramycin S 81 100 89
Quinolones Ciprofloxacin S 73 100 98
Ofloxacin S 74 100 100
Other
Chloram-phenicol
Clindamycin
Colistin S 98.9
Fusidic acid
Rifampicin
Sulfa-Trim S 59 87 61
Table 3.2: Calculated susceptibilities to E. coli with a naïve Bayesian method (“Naïve”) and a semi-naïve Bayesian method (“min1max1”)

CHAPTER 3. INTERPRETATIVE READING OF AST RESULTS
46
3.3. VALIDATION OF THE EXPLORED METHODS
COMPARING NAÏVE AND SEMI-NAÏVE BAYESIAN METHODS
Table 3.3 shows the results of using several versions of naïve and semi-naïve
Bayesian methods. The methods are named after the number of ORs used to calculate
posterior probabilities of susceptibility. For example, the min0max3 method includes
zero ORs on cross-resistance and the three highest significant ORs on cross-
susceptibility (if they exist). The methods were validated by using a 5-fold cross
validation, where each time one of the five sets was designated as the validation set,
with the remaining four forming the learning set. The instABGs and crossABGs
compiled from the learning set were used to calculate posterior probabilities in the
validation set. We removed the AST results one at a time and used the different
methods to calculate the given susceptibility. Then the normalised Brier
distance(Brier, 1950) between the AST result and the calculated susceptibility was
used to measure the quality of the calculated susceptibility. Table 3.3 shows the
square root of the mean Brier distance of the estimated susceptibilities for the five
validations sets, and the range the sets varied across.
Number
of ORs Method
Norm. Brier
Distance (%)
Range for
the 5 validation sets
0 instABG 37.7 37.3 - 38.4
1 min0max1 35.3 34.8 - 35.6
min1max0 36.7 36.1 - 37.5
2
min0max2 37.2 37.1 - 37.4
min1max1 25.6 25.3 - 26.0
min2max0 40.2 39.5 - 40.8
3
min0max3 38.2 38.0 - 38.4
min1max2 26.0 25.7 - 26.1
min2max1 26.7 26.2 - 27.2
min3max0 42.1 41.3 - 42.9
4
min0max4 38.6 38.4 - 38.9
min1max3 27.0 26.6 - 27.3
min2max2 25.3 24.8 - 25.6
min3max1 28.5 28.1 - 28.9
min4max0 43.0 42.3 - 43.9
6 min3max3 26.0 25.7 - 26.4
8 min4max4 26.7 26.4 - 27.1
All naïve 28.2 27.8 - 28.5
Table 3.3: Normalised Brier distances for calculated susceptibilities by using different Bayesian approaches.

CHAPTER 3. INTERPRETATIVE READING OF AST RESULTS
47
The normalised Brier distance between the instABG probabilities and the AST results
for all isolates in the database was 37.7%. By generating patient specific ABG|ASTs
with the naïve Bayes method we reduced the distance to 28.2%. We achieved the
smallest distance of 25.3% with ABG|ASTs calculated by using the semi-naïve
min2max2 method.
The Brier distances from the 5-fold validation were significantly smaller (p<10-99,
paired 2-tailed t-test) for the min2max2 method than for the instABG. The distance
for the min2max2 was also significantly smaller than the distance for the min1max1
method (p<10-9). The naïve Bayes approach is known to produce overconfident
results, i.e. results too close to 0% or 100%, if the underlying assumption of
independence is not well met. The naïve Bayes results in Table 3.3 indicates that this
is the case, and this is most likely the reason that the semi-naïve methods perform
better than the naïve method.
PERFORMANCE ON DIFFERENT PATHOGEN GROUPS
Figure 3.2 shows the performance of the min2max2 method on each pathogen group
compared to the prior susceptibilities from the instABG. The presented normalised
Brier distances for each pathogen group were averaged over the five validation sets.
The normalised Brier distance was reduced with 13.3% for GN bacteria, 12.0% for
Staphylococcus spp. and 3.5% for the rest of the GP bacteria on average. This
indicates a better performance on GN isolates compared to GP isolates. This is could
be related to a higher fraction of the cross-ABG being filled for GN bacteria, i.e. a
higher fraction of significant cross-resistances and cross-susceptibilities.

CHAPTER 3. INTERPRETATIVE READING OF AST RESULTS
48
Figure 3.2: Normalised Brier distances for each pathogen group averaged over 5 validation sets when using prior susceptibilities and the min2max2 method, respectively.
PERFORMANCE WITH DIFFERENT P-VALUES
The results were generated with ORs for-cross resistance/susceptibility with the limit
of significance p < 0.1. We explored how the limit of significance influenced the
results. The results for different p values, ranging from 0.02 to 0.5 are illustrated on
Figure 3.3, for respectively the prior susceptibilities from the instABG, the naïve
Bayes method, and the min2max2 method.
0
0.1
0.2
0.3
0.4
0.5N
orm
alis
ed B
rier
dis
tan
ce
prior min2max2

CHAPTER 3. INTERPRETATIVE READING OF AST RESULTS
49
Figure 3.3: Normalised Brier distances averaged over the five validation sets when using respectively the prior susceptibilities from the instABG, the naïve Bayes method, and the min2max2 method to calculate patient specific probabilities of susceptibility. The results
were generated with different p values, ranging from 0.02 to 0.5.
It can be seen from Figure 3.3 that irrespective of p value, the naïve Bayes method
had lower normalised Brier distance than the prior probabilities and that the
min2max2 method had lower normalised Brier distances than the naïve Bayes
method. The decrease of the normalised Brier distance of the min2max2 method with
the p value could be seen as an argument for using a high p value. This should
however be balanced against the risk of obtaining “strange” estimates due to spurious
ORs derived from very few susceptibility results. Since the reduction in normalised
Brier distance was very small for p values above 0.1, p = 0.1 may be an appropriate
choice.
20%
25%
30%
35%
40%
0 0.1 0.2 0.3 0.4 0.5
Norm
alis
ed B
rier
dis
tan
ce
p value
prior
min2max2
naive

CHAPTER 3. INTERPRETATIVE READING OF AST RESULTS
50
3.4. DISCUSSION AND CONCLUSION
In conclusion, we achieved significantly more accurate predictions of microbial in
vitro susceptibility to antimicrobials, than the prior probabilities stored in the
instABG. The developed method is limited by being an approximate method.
However, an exact Bayesian approach would require multidimensional conditional
probability matrices, which is far beyond reach. The one-dimensional conditional
probabilities in the crossABG represents a practical upper limit. It may therefore be
considered a virtue, that useful posterior probabilities can be calculated from the
limited information compiled from the isolate database.
The method was implemented in TREAT Steward. When possible the system used
the min2max2 method, except when less than two ORs were available for cross-
susceptibility and cross-resistance, respectively, in which case min1max1 was used.
The implementation will be presented in Chapter 7.

CHAPTER 4. THE EFFECT OF PRIOR ANTIMICROBIAL EXPOSURE
51
CHAPTER 4. THE EFFECT OF PRIOR
ANTIMICROBIAL EXPOSURE
This chapter describes the work done to quantify the effect of prior antimicrobial
exposure at patient level. A quantification of increased resistance associated with
prior antimicrobial exposure is a necessary step to be able to generate an ABG|PE
for patients previously exposed to antimicrobials. The content of the chapter is based
primarily on Paper II (Sanden et al., 2016). Figure 4.1 shows the relation between
the content of this chapter and the rest of the thesis.
Figure 4.1: This chapter describes the work done to quantify the effect of PE with the purpose of being able to generate an ABG|NOSO,PE.
4.1. INTRODUCTION AND METHOD
The aim of the research published in Paper II was to quantify the association between
recent antimicrobial exposure at patient level and subsequent antimicrobial
resistance. Data were obtained from a series of prospective cohort studies carried out
at Rabin Medical Center, Beilinson Hospital in Israel in the period from 2002-2011,
where 4,232 patients suspected of infection were included. We analysed resistance to
antimicrobials in bacterial isolates from patients with clinically significant and
CHAPTER 4. THE EFFECT OF PRIOR ANTIMICROBIAL EXPOSURE
52
microbiologically documented infections, starting antimicrobial treatment after
obtaining cultures (n=775). Further details on the inclusion criteria are available in
Paper II (Sanden et al., 2016).
Separate analyses were made for Gram negative (GN) and Gram positive (GP)
bacterial isolates. The increase in bacterial resistance is expressed by ORs and 95%
Confidence Intervals (CI) (Sanden et al., 2016). We calculated increased resistance
to both single antimicrobials and to the following classes of antimicrobials:
Tetracyclines
Penicillins
Penicillins combined with β-lactamase inhibitor (BLI)
Cephalosporins
Aminoglycosides
Carbapenems
Quinolones
The increase in resistance was calculated after the following types of exposure were
analysed:
Exposure to any antimicrobial class
Exposure to the same antimicrobial class
Exposure to other antimicrobial classes
4.2. RESISTANCE IN GN BACTERIA TO SINGLE ANTIMICROBIALS
Figure 4.2 illustrates the ORs for increased resistance in GN bacterial isolates from
patients exposed to any antimicrobial compared to those with no exposure. The effect
of exposure to any class ranged from an insignificant OR of 1.03 for chloramphenicol
to a significant OR of 9.84 for imipenem-cilastatin.

CHAPTER 4. THE EFFECT OF PRIOR ANTIMICROBIAL EXPOSURE
53
Figure 4.2: OR for increased resistance in Gram negative bacteria from patients exposed to any antimicrobial compared to unexposed. Each antimicrobial is presented with number of
AST results [in brackets]. Vertical bars indicate 95% confidence limits.
Looking at resistance to antimicrobials within the same class, the prior exposure had
almost the same effect on all antimicrobials within the same class. The only
significant exception was amongst the carbapenems, where previous exposure to any
class of antimicrobials had a greater effect on resistance to imipenem-cilastatin
(OR=9.8) than to ertapenem (OR=2.6) or meropenem (OR=1.5).
GN bacteria from patients exposed to the same antimicrobial class as the tested
antimicrobial, only showed significant ORs for quinolones, with an OR of 7.15 for
ofloxacin and an OR of 5.11 for ciprofloxacin. The data for this analysis were sparse,
since patients were seldom treated with the same antimicrobial twice within a month.
Looking at exposure to an antimicrobial from another class, the majority of the
antimicrobials with significantly higher resistance when exposed to any class also
had significant ORs after exposure to another class of antimicrobials. This indicates
0.1
1.0
10.0
100.0
Am
pic
illin
[5
25
]
Pip
era
cilli
n [
50
3]
Am
pic
illin
Sulb
acta
m [
19
9]
Am
pic
illin
Cla
vula
nat
e [
44
5]
Pip
era
cilli
nTa
zob
acta
m [
45
6]
Cef
azo
lin [
23
8]
Cef
uro
xim
e [5
24
]
Cef
ota
xim
e [
44
7]
Cef
tria
xon
e [4
78
]
Cef
tazi
dim
e [5
76
]
Cef
ep
ime
[16
2]
Erta
pe
nem
[3
09
]
Imip
en
em
Cila
stat
in [
25
1]
Mer
op
ene
m [
30
3]
Azt
reo
nam
[2
63
]
Min
ocy
clin
e [3
91
]
Tetr
acyc
line
[1
23
]
Am
ikac
in [
56
0]
Tob
ram
ycin
[1
37
]
Ge
nta
mic
in [
58
1]
Ofl
oxa
cin
[5
19
]
Cip
rofl
oxa
cin
[5
41
]
Sulp
haT
rim
[5
17
]
Ch
lora
mp
hen
ico
l [6
7]
Nit
rofu
ran
toin
[1
25
]
Co
listi
n [
42
4]
OR for increased resistance in Gram negative bacteria

CHAPTER 4. THE EFFECT OF PRIOR ANTIMICROBIAL EXPOSURE
54
an effect of cross-resistance between antimicrobial classes. The highest OR for
increased resistance after exposure to an antimicrobial from another class was for
nitrofurantoin with OR 5.92 (2.02-17.38). Table 4.1 shows the analysis for the three
most common prior antimicrobial treatments of patients with current infection with
GN bacteria. Data details for all the 26 included antimicrobials are available in Paper
II (Appendix II) (Sanden et al., 2016). For example, for ceftriaxone (cftax) the
probability of resistance goes from being 27% for no exposure to 44% for patient
previously exposed to any antimicrobial within the last month, resulting in a OR of
2.1(1.2-3.5). After exposure to a cephalosporin (same class), resistance to cftax
increased with an OR of 2.3 (0.8–7.0) and after exposure to another class, resistance
to cftax increased with an OR of 3.1 (1.8–5.3). In general resistance was increased
most by exposure to the same class following by exposure to any class and other
class.
Tested
antimicrobial
Type of prior antimicrobial exposure
None Any class Same class Other class
Res Res OR (95% CI) Res OR (95% CI) Res OR (95% CI)
Ampicillin-
clavulanate 41 % 60 % 2.1 (1.2-3.7) 73 % 3.8 (1.0–4.4) 57 % 1.8 (1.0–3.4)
Ceftriaxone 27 % 44 % 2.1 (1.2–3.5) 46 % 2.3 (0.8–7.0) 42 % 1.9 (1.1–3.4)
Ciprofloxacin 30 % 61 % 3.6 (2.2–5.7) 69 % 5.1 (1.7–15.0) 57 % 3.1 (1.8–5.3)
Table 4.1: Resistance to the three most common prior antimicrobial treatments of patients with infected with GN bacteria. (Res = Probability of resistance)
4.3. RESISTANCE IN GP BACTERIA TO SINGLE ANTIMICROBIALS
The results of the analysis of resistance in GP are illustrated on Figure 4.3. The
number of AST results was considerably lower for GP bacteria than for GN bacteria,
and the results did not show any significant increase in resistance after exposure to
antimicrobials.

CHAPTER 4. THE EFFECT OF PRIOR ANTIMICROBIAL EXPOSURE
55
Figure 4.3: OR for increased resistance in GP bacteria from patients exposed to any antimicrobial compared to unexposed. Each antimicrobial is presented with number of AST
results [in brackets]. Vertical bars indicate 95% confidence limits.
4.4. RESISTANCE IN GN BACTERIA TO CLASSES OF ANTIMICROBIALS
For seven classes of antimicrobials, Figure 4.4 illustrates the ORs for increased
resistance in bacterial isolates from patients exposed to any antimicrobial compared
to those with no exposure. Across the antimicrobial classes, the results indicated a
ranking of antimicrobials with quinolones and carbapenems being most effected by
prior antimicrobial exposure, followed by aminoglycosides, penicillins+BLI, and
cephalosporins.
0.0
0.1
1.0
10.0
100.0
Pen
icill
in [
17
7]
Am
pic
illin
[9
0]
Tetr
acyc
line
[1
03
]
Ge
nta
mic
in [
13
5]
Ofl
oxa
cin
[7
6]
Eryt
hro
myc
in [
16
2]
Sulp
haT
rim
[9
2]
Ch
lora
mp
hen
ico
l[1
48
]
Fusi
dic
Aci
d [
12
4]
Clin
dam
ycin
[1
24
]
Rif
amp
icin
[1
16
]
Odds ratio for increased resistance in Gram positive bacteria

CHAPTER 4. THE EFFECT OF PRIOR ANTIMICROBIAL EXPOSURE
56
Figure 4.4: OR for increased resistance in GN bacteria to antimicrobial classes, when analysing isolates from patients exposed to any antimicrobial. Each antimicrobial class is presented with number of AST results [in brackets]. Vertical bars indicate 95% confidence
limits.
4.5. DISCUSSION AND CONCLUSION
In conclusion, we were able to quantify the association between antimicrobial
exposure and subsequent resistance at the level of the individual treated. Our results
showed that an increase in resistance after exposure to antimicrobials was driven by
both exposure to the same class, as well as by cross-resistance after exposure to other
antimicrobial classes. However, to be fully applicable in clinical use, the analysis
should be expanded to give pathogen- and antimicrobial-specific results. These
expansions would require a substantially larger dataset.
0.1
1.0
10.0
100.0
Tetr
acyc
line
s [5
14
]
Pen
icill
ins
[10
28
]
Cep
hal
osp
ori
ns
[24
25
]
Pen
icill
ins
+ B
LI [
11
00
]
Am
ino
glyc
osi
de
s [1
27
8]
Car
bap
enem
s [
86
3]
Qu
ino
lon
es
[1
06
0]
Odds ratio for increased resistance in Gram negative bacteria

CHAPTER 4. THE EFFECT OF PRIOR ANTIMICROBIAL EXPOSURE
57
Figure 4.5: The selection of data on prior exposure for a specific pathogen (E. coli) and a
specific antimicrobial (cftax).
Our study included 4,232 patients with 775 clinically significant isolates, (Figure
4.5). As illustrated on Figure 4.5, 85 of these isolates were from patients with PE to
a single antimicrobial. When analysing a specific pathogen, for example E. coli, we
were left with 23 isolates and the most common PE, cftax, were only associated with
3 of these isolates. Even through the study included more than 4000 patients, this was
far from being enough data to generate pathogen- and antimicrobial specific results
with convincing statistical power, and it would be logistically difficult to collect
enough data.
Our results on exposure to any, same and other antimicrobials do however indicate a
need to modify the expected coverage of empirical antimicrobial treatments for
patients recently exposed to antimicrobials. This was a motivation for exploring
another approach to modify the ABG|HAI or ABG|CAI for patients previously
exposed to antimicrobials, which will be addressed in Chapter 5.
4232 Patients
775 Isolates = MDI
85 PE = monotherapy
23 Pathogen = E. coli
3 PE=cftax

CHAPTER 5. MODIFYING THE ABG TO ACCOUNT FOR PE
58
CHAPTER 5. MODIFYING THE ABG TO
ACCOUNT FOR PE
This chapter describes a mathematical method (patent pending) developed to modify
either the ABG|CAI or the ABG|HAI with respect to a patient’s prior antimicrobial
exposure. This chapter serves as an operationalisation of Paper II (described in
Chapter 4). The method will be described by giving a patient example, and the
generalised mathematics is described in Appendix A. Figure 5.1 shows the relation
between the content of this chapter and the rest of the thesis.
Figure 5.1: This chapter describes the method used to generate ABG|NOSO,PE.
5.1. THE SUSCEPTIBILITY TO AN ANTIMICROBIAL AFTER PE TO THE SAME ANTIMICROBIAL CLASS
To modify the susceptibility to an antimicrobial, given PE to that antimicrobial, we
need the corresponding OR for increased resistance. In the study (Sanden et al.,
2016), described in Chapter 4, we observed that PE had almost the same effect on all
antimicrobials within the same class. From Paper II (Sanden et al., 2016) we have
ORs for increased resistance to antimicrobial classes in GN bacteria (Table 5.1). The
ORs are associated with PE to any, same, and other class of antimicrobial,
respectively.

CHAPTER 5. MODIFYING THE ABG TO ACCOUNT FOR PE
59
GN bacteria
PE=any class
PE=same class
PE=other class
Tested
antimicrobial class N ORclass (95% CI) N ORclass (95% CI) N ORclass (95% CI)
Tetracyclines 514 1.52 (0.66-3.49) <10 512 1.45 (0.63-3.35)
Penicillins 1028 1.76 (0.96-3.25) <10 1012 1.75 (0.95-3.23)
Cephalosporins 2425 2.16 (1.16-4.01) 2110 1.52 (0.37-6.29) 2339 2.10 (1.05-4.21)
Penicillins + BLI 1100 2.42 (1.23-4.79) 960 2.55 (0.59-11.03) 1064 2.36 (1.04-5.33)
Aminoglycosides 1278 2.84 (1.55-5.22) <10 1262 2.46 (1.30-4.64)
Carbapenems 863 3.13 (0.44-22.25) <10 848 1.77 (0.21-14.88)
Quinolones 1060 3.35 (2.05-5.47) 917 6.02 (1.90-19.12) 1004 2.67 (1.43-4.98)
Table 5.1: ORs for increased resistance in GN bacteria associated with exposure to respectively any, same, and other class of antimicrobial (Sanden et al., 2016).
It was difficult to generate significant ORs for increased resistance, given exposure
to the same class. This was probably due to the limited number of patients with PE
and corresponding AST result on the same class of antimicrobials. However, for a
given antimicrobial “A”, OR¬a|PE=same could be expected to higher or at least equal to
OR¬a|PE=any. Where OR¬a|PE=same describes the change in resistance towards
antimicrobial A, given PE to an antimicrobial of the same class, and OR¬a |PE=same,
describes the change in resistance towards A, given exposure to any type of
antimicrobial. In the following we will use OR¬a|PE=any to modify the susceptibility to
previously given antimicrobials. This means that we, for example, assume
conservatively for cephalosporins that OR¬ceph|PE=same = 2.16.
Consider as an example, a patient suspected of being infected with a community-
acquired E. coli infection. For this patient, the ABG|CAI (described in Chapter 2,
section 2.3) can be used for guidance on empirical treatment. A small segment of the
55 antimicrobials in the Rambam ABG|CAI for E. coli is shown Table 5.2.

CHAPTER 5. MODIFYING THE ABG TO ACCOUNT FOR PE
60
An
tim
icro
bia
l
Am
oxic
illi
n-c
lav
ula
nat
e
Pip
erac
illi
n-t
azob
acta
m
Cef
azoli
n
Cef
uro
xim
e
Cef
tria
xon
e
ABG|CAI 80% 94% 50% 71% 75%
PE X OR¬ceph|PE=ceph
ABG|CAI,PE P*(amoCl) P*(pipTa) P*(cefa) P*(cefur) P*(cftax)
Table 5.2: A segment of the ABG|CAI from Rambam, listing the susceptibility of E. coli. The
patient specific susceptibility after PE to ceftriaxone will be shown in the ABG|CAI,PE.
If the medical history for this patient includes recent antimicrobial treatment, then the
probability of resistance to antimicrobials could be expected to increase (Bell et al.,
2014; Costelloe et al., 2010; Sanden et al., 2016), as demonstrated in Chapter 4. The
susceptibilities in the ABG|CAI, should then be modified with respect to the effect
of the patients PE. The resulting probabilities is the represented in an ABG|CAI,PE.
Consider as an example, a patient with PE=cftax. The prior probability of
susceptibility to cftax, can be read from the ABG|CAI to be P(cftax)=75% (Table
5.2). By modifying P(cftax) with the OR for increased resistance to a cephalosporin
given PE to a cephalosporin, denoted OR¬ceph|PE=ceph, we get P*(cftax).
In the following we will calculate P*(cftax). The probability of resistance to cftax, is
denoted P(¬cftax), where P(cftax)=1-P(¬cftax). First, the prior odds ODcftax for
susceptibility to cftax is calculated from the prior probability of susceptibility,
P(cftax), as:
𝑂𝐷cftax =𝑃(cftax)
𝑃(¬cftax)=
0.75
1−0.75= 3
The prior odds are then modified with OR¬ceph|PE=ceph=2.16. The posterior odds for
susceptibility to cftax after exposure to cftax, is denoted OD*cftax. By using Eq. 4 and
Eq. 10 from Appendix A, OD*cftax can be calculated as:
𝑂𝐷𝑐𝑓𝑡𝑎𝑥∗ = 𝑂𝐷cftax ∙
1
𝑂𝑅¬𝑐𝑒𝑝ℎ|𝑃𝐸=𝑐𝑒𝑝ℎ= 3 ∙
1
2.16= 1.40
The posterior probability of susceptibility, denoted P*(cftax), can then be calculated
by using the mathematical relationship between odds and probability:
CHAPTER 5. MODIFYING THE ABG TO ACCOUNT FOR PE
61
𝑂𝐷∗cftax =
𝑃∗(𝑐𝑓𝑡𝑎𝑥)
𝑃∗(¬𝑐𝑓𝑡𝑎𝑥)
⇔
𝑃∗(cftax) = 𝑂𝐷∗
cftax
1+ 𝑂𝐷∗cftax
=1.4
1+1.4= 0.58 = 58%
This means that for the patient previously has been treated with cftax, then the
probability of cftax being effective against an E. coli goes from being 75% to 58%,
which makes the antimicrobial less attractive to use. We can now fill in the
susceptibility to cftax in an ABG|CAI,PE, as shown in Table 5.3.
An
tim
icro
bia
l
Am
oxic
illi
n-c
lav
ula
nat
e
Pip
erac
illi
n-t
azob
acta
m
Cef
azoli
n
Cef
uro
xim
e
Cef
tria
xon
e
ABG|CAI 80% 94% 50% 71% 75%
PE X OR¬ceph|PE=ceph
ABG|CAI, PE P*(amoCl) P*(pipTa) 34% 53% 58%
Table 5.3: A segment of the ABG|CAI from Rambam, listing the susceptibility of E. coli. The ABG|CAI,PE, now includes the susceptibility of E. coli to ceftriaxone (PE) and the
susceptibility to antimicrobials of the same class (cephalosporins)
The susceptibilities to the other cephalosporins are likewise calculated by modifying
the prior susceptibility from the ABG|CAI with OR¬ceph|PE=ceph.
5.2. THE SUSCEPTIBILITY TO AN ANTIMICROBIAL AFTER PE TO OTHER CLASSES OF ANTIMICROBIALS
The question is now, how to modify the susceptibilities to the antimicrobials from
other classes in the ABG|CAI, PE. Our study, described in Chapter 4 (Sanden et al.,
2016), showed increased resistance after exposure to antimicrobials from another
class, and hence we would in our example also expect PE to cftax to affect the
susceptibility to other antimicrobials. For the given example, we need for the OR for
increased resistance to amoCl and to pipTa, given exposure to cftax. Unfortunately,
no studies have to our knowledge been able to assess the increased resistance of a
given pathogen after exposure to different antimicrobials. This was a motivation for

CHAPTER 5. MODIFYING THE ABG TO ACCOUNT FOR PE
62
inventing a method that takes advantage of our knowledge on cross-resistance
between antimicrobials.
The cross-resistance between cftax and the other antimicrobials from our example (in
Table 5.3) are shown in the crossABG|CAI in Table 5.4. Here we can read that the
probability of susceptibility to amoCl given resistance to cftax,
P(amoCl|¬cftax)=39%. The change in susceptibility from P(amoCl)=80% to
P(amoCl|¬cftax)=39% corresponds to an ORamoCl|¬cftax=0.16.
Table 5.4: The crossABG|CAI with cross-susceptibility/resistance between ceftriaxone/amoxicillin-clavulanate and ceftriaxone/piperacillin-tazobactam.
As a consequence of the cross-resistance between cftax and amoCl, we modify the
susceptibility to amoCl, given PE to cftax.
By using Eq. 8 from Appendix A, the probability of susceptibility to amoCl given PE
to cftax can be calculated as:
𝑃∗(𝑎𝑚𝑜𝐶𝑙) = 𝑃(𝑎𝑚𝑜𝐶𝑙|𝑐𝑓𝑡𝑎𝑥) ∙ 𝑃∗(𝑐𝑓𝑡𝑎𝑥) + 𝑃(𝑎𝑚𝑜𝐶𝑙|¬𝑐𝑓𝑡𝑎𝑥) ∙ 𝑃∗(¬𝑐𝑓𝑡𝑎𝑥)
From the crossABG|CAI (Table 5.4) we can read that:
P(amoCl|cftax) = 0.91
P(amoCl|¬cftax) = 0.39
From Table 5.3 we have
P*(cftax) = 58%, and P*(¬cftax) = 1- P*(cftax) =42%. By inserting these values, we
get:
𝑃∗(𝑎𝑚𝑜𝐶𝑙) = 𝑃(𝑎𝑚𝑜𝐶𝑙|𝑐𝑓𝑡𝑎𝑥) ∙ 𝑃∗(𝑐𝑓𝑡𝑎𝑥) + 𝑃(𝑎𝑚𝑜𝐶𝑙|¬𝑐𝑓𝑡𝑎𝑥) ∙ 𝑃∗(¬𝑐𝑓𝑡𝑎𝑥)
= 0.91 ∙ 0.58 + 0.39 ∙ 0.42 = 0.69 = 69%
crossABG|CAI
Pathogen: E. coli
Ceftriaxone
cftax ¬cftax
Amoxicillin-clavulanate P(amoCl|CFTAX) 91% 39%
J01CR02 ORamoCl|cftax 2.57 0.16
Piperacillin-tazobactam P(pipTa|CFTAX) 96% 86%
J01CR05 ORpipTa|cftax 1.53 0.42
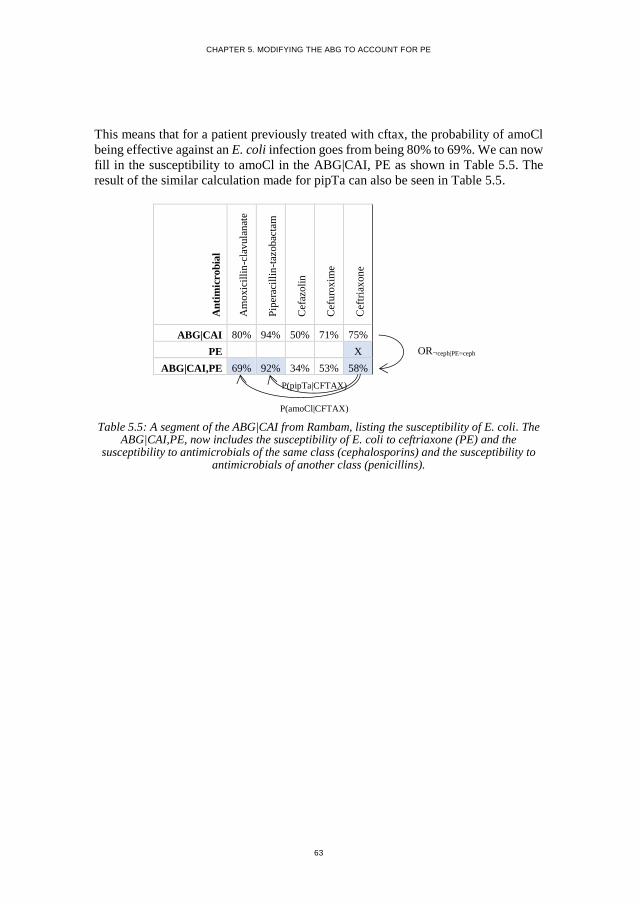
CHAPTER 5. MODIFYING THE ABG TO ACCOUNT FOR PE
63
This means that for a patient previously treated with cftax, the probability of amoCl
being effective against an E. coli infection goes from being 80% to 69%. We can now
fill in the susceptibility to amoCl in the ABG|CAI, PE as shown in Table 5.5. The
result of the similar calculation made for pipTa can also be seen in Table 5.5.
Table 5.5: A segment of the ABG|CAI from Rambam, listing the susceptibility of E. coli. The ABG|CAI,PE, now includes the susceptibility of E. coli to ceftriaxone (PE) and the
susceptibility to antimicrobials of the same class (cephalosporins) and the susceptibility to antimicrobials of another class (penicillins).
An
tim
icro
bia
l
Am
oxic
illi
n-c
lav
ula
nat
e
Pip
erac
illi
n-t
azob
acta
m
Cef
azoli
n
Cef
uro
xim
e
Cef
tria
xon
e
ABG|CAI 80% 94% 50% 71% 75%
PE X OR¬ceph|PE=ceph
ABG|CAI,PE 69% 92% 34% 53% 58%
P(pipTa|CFTAX)
P(amoCl|CFTAX)

CHAPTER 6. MODIFYING THE ABG TO ACCOUNT FOR BOTH PE AND AST
64
CHAPTER 6. MODIFYING THE ABG TO
ACCOUNT FOR BOTH PE AND AST
This chapter describes a mathematical method (patent pending) developed to modify
either the ABG|CAI or the ABG|HAI with respect to both patient specific PE and AST
results. Figure 6.1 shows the relation between the content of this chapter and the rest
of the thesis.
Figure 6.1: This chapter describes the method used to generate ABG|NOSO,PE,AST.
When AST results become available for patients previously exposed to
antimicrobials these results should also be used to modify the susceptibility to
untested antimicrobials (as described in Chapter 3). Now we need an patient specific
ABG that accounts for both PE and AST results, denoted as ABG|CAI,PE,AST.
Consider the situation, where an AST result is available, showing that E. coli is
susceptible to cefuroxime (cefur). An ABG|CAI,PE,AST is added in Table 6.1, where
the confirmed susceptibility to cefur is expressed as 100% probability of
susceptibility.
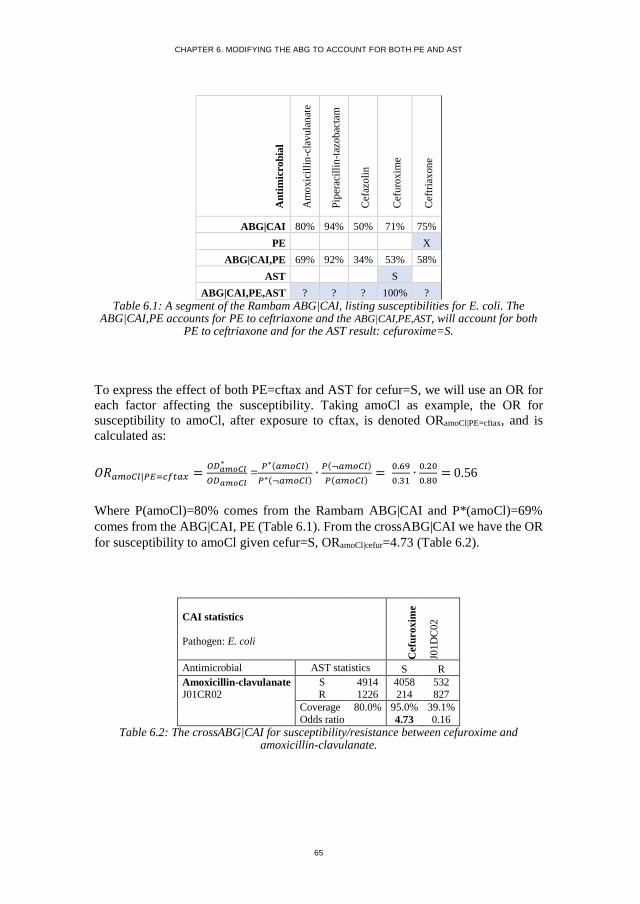
CHAPTER 6. MODIFYING THE ABG TO ACCOUNT FOR BOTH PE AND AST
65
An
tim
icro
bia
l
Am
oxic
illi
n-c
lav
ula
nat
e
Pip
erac
illi
n-t
azob
acta
m
Cef
azoli
n
Cef
uro
xim
e
Cef
tria
xon
e
ABG|CAI 80% 94% 50% 71% 75%
PE X
ABG|CAI,PE 69% 92% 34% 53% 58%
AST S
ABG|CAI,PE,AST ? ? ? 100% ?
Table 6.1: A segment of the Rambam ABG|CAI, listing susceptibilities for E. coli. The ABG|CAI,PE accounts for PE to ceftriaxone and the ABG|CAI,PE,AST, will account for both
PE to ceftriaxone and for the AST result: cefuroxime=S.
To express the effect of both PE=cftax and AST for cefur=S, we will use an OR for
each factor affecting the susceptibility. Taking amoCl as example, the OR for
susceptibility to amoCl, after exposure to cftax, is denoted ORamoCl|PE=cftax, and is
calculated as:
𝑂𝑅𝑎𝑚𝑜𝐶𝑙|𝑃𝐸=𝑐𝑓𝑡𝑎𝑥 =𝑂𝐷𝑎𝑚𝑜𝐶𝑙
∗
𝑂𝐷𝑎𝑚𝑜𝐶𝑙 =
𝑃∗(𝑎𝑚𝑜𝐶𝑙)
𝑃∗(¬𝑎𝑚𝑜𝐶𝑙)∙
𝑃(¬𝑎𝑚𝑜𝐶𝑙)
𝑃(𝑎𝑚𝑜𝐶𝑙)=
0.69
0.31∙
0.20
0.80= 0.56
Where P(amoCl)=80% comes from the Rambam ABG|CAI and P*(amoCl)=69%
comes from the ABG|CAI, PE (Table 6.1). From the crossABG|CAI we have the OR
for susceptibility to amoCl given cefur=S, ORamoCl|cefur=4.73 (Table 6.2).
CAI statistics
Pathogen: E. coli
Cefu
rox
ime
J01
DC
02
Antimicrobial AST statistics S R
Amoxicillin-clavulanate S 4914 4058 532
J01CR02 R 1226 214 827
Coverage 80.0% 95.0% 39.1%
Odds ratio 4.73 0.16
Table 6.2: The crossABG|CAI for susceptibility/resistance between cefuroxime and amoxicillin-clavulanate.

CHAPTER 6. MODIFYING THE ABG TO ACCOUNT FOR BOTH PE AND AST
66
The next step was to combine the effect of PE and AST results. In Chapter 3 we took
advantage of the semi-naïve Bayesian methods min1max1 and min2max2, to
calculate the probability of susceptibility. These methods were also used to modify
the ABG to multiple PE’s and AST results. The methods use the largest available
ORs for increased resistance and the smallest ORs for decreased resistance. In the
given example, we use min1max1 to write:
𝑂𝑅𝑎𝑚𝑜𝐶𝑙∗ = 𝑂𝑅𝑎𝑚𝑜𝐶𝑙|𝑃𝐸=𝑐𝑓𝑡𝑎𝑥 ∙ 𝑂𝑅𝑎𝑚𝑜𝐶𝑙|𝑐𝑒𝑓𝑢𝑟 = 0.56 ∙ 4.73 = 2.63
By using Eq. 4 from Appendix A, we can calculate the odds of susceptibility to
amoCl:
𝑂𝐷𝑎𝑚𝑜𝐶𝑙∗ = 𝑂𝑅𝑎𝑚𝑜𝐶𝑙
∗ ∙ 𝑂𝐷𝑎𝑚𝑜𝐶𝑙 = 2.63 ∙ 0.80
0.20 = 10.52
Finally, the posterior probability of susceptibility to amoCl is calculated as:
𝑃∗(𝑎𝑚𝑜𝐶𝑙) =𝑂𝐷′
𝑎𝑚𝑜𝐶𝑙
1+𝑂𝐷′𝑎𝑚𝑜𝐶𝑙
= 10.52
1+10.52= 0.91 = 91%
Thereby the probability of in vitro susceptibility to amoCl, given PE=cftax and
cefur=S is 91%. The results of the similar calculations made for the other
antimicrobials can be seen in Table 6.3.
An
tim
icro
bia
l
Am
oxic
illi
n-c
lav
ula
nat
e
Pip
erac
illi
n-t
azob
acta
m
Cef
azoli
n
Cef
uro
xim
e
Cef
tria
xon
e
ABG|CAI 80% 94% 50% 71% 75%
PE X
ABG|CAI, PE 69% 92% 34% 53% 58%
AST S
ABG|CAI, PE, AST 91% 97% 73% 100% 100%
Table 6.3: A segment of the Rambam ABG|CAI, listing susceptibilities for E. coli. The ABG|CAI,PE accounts for PE to ceftriaxone and the ABG|CAI,PE,AST, now accounts for
both PE to ceftriaxone and for the AST result: cefuroxime=S.

CHAPTER 6. MODIFYING THE ABG TO ACCOUNT FOR BOTH PE AND AST
67
Table 6.4 shows an ABG|CAI,PE,AST were an E. coli isolate was tested resistant to
cefur. It can be seen that the AST result for cefur affects the susceptibility both to the
other cephalosporins and also to the penicillins. Due to cross-resistance between
cefur and cefazolin the AST result cefur=R, results in 0% susceptibility to cefazolin.
Cross-resistance between cefur and the penicillin amoCl gives a decrease in the
susceptibility to amoCl from 69% to 27%. It can also be seen from Table 6.3 and
Table 6.4 that the AST result for cefur, had a stronger effect on the other
cephaloporins, than on the penicillins.
An
tim
icro
bia
l
Am
oxic
illi
n-c
lav
ula
nat
e
Pip
erac
illi
n-t
azob
acta
m
Cef
azoli
n
Cef
uro
xim
e
Cef
tria
xon
e
ABG|CAI 80% 94% 50% 71% 75%
PE X
ABG|CAI, PE 69% 92% 34% 53% 58%
AST R
ABG|CAI, PE, AST 27% 81% 0% 0% 3%
Table 6.4: A segment of the Rambam ABG|CAI, listing susceptibilities for E. coli. The ABG|CAI,PE accounts for PE to ceftriaxone and the ABG|CAI,PE,AST, now accounts for
both PE to ceftriaxone and for the AST result: cefuroxime=R.
This example included the susceptibility to five antimicrobials, but the principles for
modifying the in vitro susceptibilities would be the same for the rest of the
antimicrobials available at a given location.

CHAPTER 7. IMPLEMENTING THE PERSONALISED ABG
68
CHAPTER 7. IMPLEMENTING THE
PERSONALISED ABG
The developed in vitro susceptibility modifications were implemented in a software
solution for antimicrobial stewardship (TREAT Steward). This chapter illustrates the
implementation by going through a patient example.
During the project, we focused on making the research operational, by developing
practical applications, with the aim of shortening the way from research to an
implemented solution available for clinicians and patients. Handling the patient
specific factors that can affect the institutional ABG, can be a complicated task for
the clinician, who must choose the most appropriate antimicrobial. A software-based
application incorporating the expected effect of the patient specific factors could
serve as decision support for clinicians, in the process of selecting the antimicrobial
treatment.
7.1. TREAT STEWARD
The developed methods were implemented in a software solution for antimicrobial
stewardship, TREAT Steward (TREAT), which has been shown to reduce
inappropriate antimicrobial treatments at hospitals (Paul et al., 2006). TREAT uses
Causal Probabilistic Network (CPN) technology. CPNs, also called Bayesian
networks, can for example, represent the probabilistic relationships between diseases
and symptoms. TREAT provides decision support by calculating the probability of
infection, the most likely diagnosis and the responsible pathogen(s). From this, a cost-
benefit analysis balances the benefits (survival) and costs (side-effects, resistance
development, direct costs) of potential antimicrobial treatment regimens
(TREATsystems.com, 2017).
Figure 7.1 and Figure 7.2 show the graphical user interface for the decision support
feature in TREAT. Figure 7.1 shows a summary of the findings for a fictive patient
example, a 71-year-old male with symptoms indicating pneumonia.

CHAPTER 7. IMPLEMENTING THE PERSONALISED ABG
69
Figure 7.1: The user interface of TREAT showing a summary of the findings for a fictive
patient.
Figure 7.2 shows the user interface of the decision support feature in TREAT, for the
patient example in Figure 7.1. On the left side, the “TREAT diagnosis” suggests
100% probability of pneumonia. In the middle, the suggested pathogen distribution
is shown and on the right side of Figure 7.2, the recommended antimicrobial
treatments are shown; the top 1 treatment recommendation in this case being
ampicillin. For each of the pathogens the probability of coverage by ampicillin is
indicated by the blue portion of the bar, with red indicating not covered.
Figure 7.2: The user interface of TREAT showing the decision support feature.
The in vivo coverage of ampicillin across all pathogens in the suggested pathogen
distribution is 61% (shown in heading above the pathogen distribution).

CHAPTER 7. IMPLEMENTING THE PERSONALISED ABG
70
7.2. IMPLEMETATION IN TREAT STEWARD
The work presented in this thesis contributed to the TREAT system by providing
methods to estimate personalised in vitro susceptibilities. The methods for in vitro
susceptibility modifications were integrated with the in vivo susceptibility
modifications already made by TREAT (Figure 7.3).
Figure 7.3: By implementing the developed methods for in vitro susceptibility modifications in TREAT susceptibilities in vivo susceptibility modifications already made by TREAT.
The in vivo modifications in TREAT are specified by the user for each infection site.
This includes adjustments to the bioavailability and penetrance (e.g. of the blood-
brain barrier) as well as adjustments for the effect of bacteriostatic versus bactericidal
treatments.

CHAPTER 7. IMPLEMENTING THE PERSONALISED ABG
71
7.3. PATIENT EXAMPLE
In the following the implementation of the personalised ABGs into the TREAT
system will be illustrated by going through a patient example. Consider the patient
example from section 7.1, where no PE or AST results are affecting the susceptibility.
The probabilities of susceptibility are in this case solely based on the ABG|CAI.
Table 7.1 shows a segment of the implemented ABG|CAI and Table 7.2 explains the
color-codes used in the implemented ABGs.
Table 7.1: A segment of an implemented ABG|CAI showing probability of in vitro susceptibility for different pathogen/antimicrobial combinations.
0.0-4.9 5.0-14.9 15.0-24.9 25.0-34.9 35.0-44.9 45.0-54.9 55.0-64.9 65.0-74.9 75.0-84.9 85.0-94.9 95.0-100
Table 7.2: The color-scale used to indicate the probability of susceptibility. Red indicates a low coverage, yellow indicates intermediate coverage, and green indicates high coverage.
Figure 7.4 shows the advice given by TREAT, when no PE or AST results are entered
for the patient. TREAT now provides the opportunity to enter PE (“Antibiotics last
month”). In this example ceftriaxone is entered (Figure 7.5). The recalculated advice,
which takes PE into account, can be seen on Figure 7.6.

CHAPTER 7. IMPLEMENTING THE PERSONALISED ABG
72
Figure 7.4: The TREAT advice when no PE and no AST.
Figure 7.5: Ceftriaxone is entered in as PE
Figure 7.6: The TREAT advice when PE=ceftriaxone and no AST.
Figure 7.7: The AST result is entered: strep. pneumoniae is tested resistant (R) to amoCl.
Figure 7.8: The TREAT advice when PE=ceftriaxone and AST for strep. pneumonia:
amoCl=R.

CHAPTER 7. IMPLEMENTING THE PERSONALISED ABG
73
When ceftriaxone is entered as PE (Fig. 7.5), the recalculated susceptibilities results
in a new order of the recommended treatments. The in vivo coverage of ampicillin is
affect by PE to ceftriaxone and consequently decreases from 61% (Fig. 7.4) to 58%
(Fig. 7.6). The susceptibility to azithromycin is not affected, and hence azithromycin
is now the top 1 recommendation instead of ampicillin. The decreased coverage of
ceftriaxone itself results it in going from being the top 5 recommendation to drop
down to be recommendation number 9 (see the red arrow).
When the AST result is entered that amoCl=R (Fig. 7.7), ampi is consequently not
one of the recommended treatments (Fig. 7.8). Cross-resistance between amoCl and
ampi results in a decreased probability of susceptibility to ampi, when resistance is
observed towards amoCl.
As a part of the project, a feature to inspect the ABG was also implemented. Figure
7.9 shows an example of the implemented feature, in this case showing the
susceptibility of strep. pneumonia to ceftriaxone. The susceptibility modification is
illustrated on a bar representing susceptibility from 0 to 100%. The susceptibility
from the ABG|CAI is indicated by a “●”. Modifications made due to PE and/or AST
results are indicated by a “◄”. The green bar indicates the final susceptibility after
in vivo modifications are made. In this example the susceptibility was not decreased
by in vivo modifications.
Figure 7.9: An example of the implemented feature to inspect the probability of susceptibility. The example presents an ABG|CAI,PE,AST for the susceptibility of strep.
pneumonia to ceftriaxone, when PE=ceftriaxone and AST: amoCl=R.

CHAPTER 7. IMPLEMENTING THE PERSONALISED ABG
74
Figure 7.10 shows additional versions of the ABG for the same patient. It can be seen
that when PE=cftax is entered, then the susceptibility to cftax and ampi is decreased
(ABG|CAI vs. ABG|CAI,PE). When an AST result is entered: amoCl=R, then the
susceptibility to ampi and cftax is further decreased in the ABG|CAI,PE,AST.
Figure 7.10: Examples of the implemented personalised ABGs for a patient suspected of
having a pneumonia infection.

CHAPTER 8. DISCUSSION
75
CHAPTER 8. DISCUSSION
The aim of the project was to generate personalised ABGs for hospitalised infectious
patients. We investigated how to modify an institutional ABG to account for three
patient specific factors: Nosocomiality, prior exposure to antimicrobials, and AST
results.
With regard to the nosocomiality of an infection, we found that when compared to
CAIs, HAIs were associated with an increased probability of resistance by an OR of
1.94 (1.87-1.94). It is well known that the nosocomiality should be accounted for
when selecting antimicrobial therapy (Doron and Davidson, 2011). Our results
indicate that the effect of PE was even higher than the effect of nosocomiality for
some antimicrobials. For example, for quinolones the OR for increased resistance
was 3.35 (2.05-5.47) in GN bacteria isolated from patients exposed to any type of
antimicrobials within the last month.
When AST results become available for a limited set of antimicrobials, the effect of
cross-resistance and cross-susceptibility for all treatments available at a given
hospital must be considered. We quantified the effect of cross-
susceptibility/resistance between antimicrobials in a crossABG. We developed a
method which modifies the susceptibility to the untested antimicrobials with respect
to a patient’s AST results, by using the crossABG. Our results indicate that ORs
describing cross-susceptibility/resistance can be used to predict the susceptibility to
untested antimicrobials.
We developed methods to combine the susceptibility modifications accounting for
nosocomiality, PE, and AST, respectively. The methods were developed to be
practical and easily implementable, and during the project we succeeded in
implementing the methods in an existing software system for antimicrobial
stewardship (TREAT).
Future work includes a validation of the method presented in Chapter 5, which was
used to modify the ABG to prior exposure. The method presented in Chapter 6 should
likewise be validated by making an attempt to recalculate the susceptibility, while
including the effect of other AST results and PE.
In Chapter 2 we took steps to improve the quality of the susceptibilities presented in
an institutional ABG. AST results from similar species were mapped into pathogen
groups to decrease the risk of estimating susceptibilities on the basis of a few or zero
results. The quality of the susceptibilities was further optimised by including AST
results from a similar institution and by including opinions from experts. It should

CHAPTER 8. DISCUSSION
76
also be considered whether the crossABG could likewise be improved, in cases of
missing data, by using statistics from similar antimicrobials.
When quantifying the effect of prior antimicrobial exposure, we were not able to
access data on exposure going further back than one month. The time since
antimicrobial exposure is however a factor that affects the level of increased
resistance, which may persist for up to 12 months (Costelloe et al., 2010). Studies
reporting the quantity of antimicrobials prescribed found that longer duration and
multiple courses were associated with higher rates of resistance (Costelloe et al.,
2010). Hence the duration of prior antimicrobial treatment could also be considered
as a patient specific factor.
Another patient specific factor, not addressed in the thesis, is clinically failing
treatment. If a patient is not responding to a given antimicrobial treatment this could
indicate that the pathogens causing the infection are resistant to the given treatment.
In that case, the probability of susceptibility to the treatment should be adjusted and
likewise for antimicrobials showing cross-resistance to the ineffective antimicrobial.
Future studies could analyse data from patients with clinically failing treatment, to
clarify how to generate personalised ABGs accounting for clinically failing
treatment. These ABGs could be clinically important, when a current treatment fails
and a new treatment should be selected.
The personalised ABGs generated in this project could serve as a better prediction of
antimicrobial susceptibility than traditional institutional ABGs. Thereby the project
seeks to contribute to patient specific antimicrobial stewardship by supporting
clinicians in giving targeted personalised therapy and avoid failure of therapy due to
resistant microbes.

CHAPTER 8. DISCUSSION
77
LITERATURE LIST
Andreassen, S., Zalounina, A., Leibovici, L., Paul, M., 2009. Learning susceptibility
of a pathogen to antibiotics using data from similar pathogens. Methods Inf.
Med. 48, 242–247.
Andreassen, S., Zalounina, A., Paul, M., Sanden, L., Leibovici, L., 2015.
Interpretative reading of the antibiogram – a semi-naïve Bayesian approach.
Artif. Intell. Med. 65, 209–217.
Bax, R., Bywater, R., Cornaglia, G., Goossens, H., Hunter, P., Isham, V., Jarlier, V.,
Jones, R., Phillips, I., Sahm, D., Senn, S., Struelens, M., Taylor, D., White, A.,
2001. Surveillance of antimicrobial resistance — what, how and whither? Clin.
Microbiol. Infect. 7, 316–325.
Baysari, M.T., Lehnbom, E.C., Li, L., Hargreaves, A., Day, R.O., Westbrook, J.I.,
2016. The effectiveness of information technology to improve antimicrobial
prescribing in hospitals: A systematic review and meta-analysis. Int. J. Med.
Inform. 92, 15–34.
Bell, B.G., Schellevis, F., Stobberingh, E., Goossens, H., Pringle, M., 2014. A
systematic review and meta-analysis of the effects of antibiotic consumption
on antibiotic resistance. BMC Infect. Dis. 14, 13.
Brier, G.W., 1950. Verification of forecasts expressed in terms of probability. Mon.
Weather Rev. 78, 1–3.
CDC, 2016. Core Elements of Hospital Antibiotic Stewardship Programs [WWW
Document]. Centers Dis. Control Prev. URL
http://www.cdc.gov/getsmart/healthcare/implementation/core-elements.html
(accessed 8.28.16).
Costelloe, C., Metcalfe, C., Lovering, A., Mant, D., Hay, A.D., 2010. Effect of
antibiotic prescribing in primary care on antimicrobial resistance in individual
patients: systematic review and meta-analysis. BMJ 340, c2096.
Courvalin, P., 1996. Interpretive reading of in vitro antibiotic susceptibility tests (the
antibiogramme). Clin. Microbiol. Infect. 2, S26–S34.
Dellit, T.H., Owens, R.C., McGowan, J.E., Gerding, D.N., Weinstein, R.A., Burke,
J.P., Huskins, C.W., Paterson, D.L., Fishman, N.O., Carpenter, C.F., Brennan,
P.J., Billeter, M., Hooton, T.M., 2007. Infectious Diseases Society of America
and the Society for Healthcare Epidemiology of America guidelines for

CHAPTER 8. DISCUSSION
78
developing an institutional program to enhance antimicrobial stewardship.
Clin. Infect. Dis. 44, 159–77.
Dellit, T.H., Owens, R.C., McGowan, J.E.J., Gerding, D.N., Weinstein, R.A., Burke,
J.P., Huskins, W.C., Paterson, D.L., Fishman, N.O., Carpenter, C.F., Brennan,
P.J., Billeter, M., Hooton, T.M., 2007. Infectious Diseases Society of America
and the Society for Healthcare Epidemiology of America guidelines for
developing an institutional program to enhance antimicrobial stewardship.
Clin. Infect. Dis. 44, 159–177.
Dickstein, Y., Geffen, Y., Leibovici, L., Paul, M., 2016. Comparison of Antibiotic
Susceptibility Patterns of Bacterial Isolates Based on Time From
Hospitalization and Culture Source: Implications for Hospital Antibiograms.
Infect. Control Hosp. Epidemiol. 37.
Doron, S., Davidson, L.E., 2011. Antimicrobial stewardship. Mayo Clin. Proc. 86,
1113–23.
ECDC, 2015. Summary of the latest data on antibiotic consumption in the European
Union [WWW Document]. Eur. Cent. Dis. Prev. Control. Stock. 2015. URL
http://ecdc.europa.eu/en/eaad/antibiotics-news/Documents/antimicrobial-
consumption-ESAC-Net-summary-2015.pdf (accessed 12.18.15).
ECDC, 2017. Antimicrobial Resistance and Healthcare-associated Infections
Programme [WWW Document]. URL
http://ecdc.europa.eu/en/healthtopics/antimicrobial-resistance-and-
consumption/antimicrobial-resistance-healthcare-associated-infections-
programme/Pages/ARHAI.aspx (accessed 3.12.17).
EUCAST, 2016. EUCAST Expert Rules Version 3.1 Intrinsic Resistance and
Exceptional Phenotypes Tables.
Hindler, J.F., Stelling, J., 2007. Analysis and presentation of cumulative
antibiograms: a new consensus guideline from the Clinical and Laboratory
Standards Institute. Clin. Infect. Dis. 44, 867–73.
Kullar, R., Goff, D.A., Schulz, L.T., Fox, B.C., Rose, W.E., 2013. The “epic”
challenge of optimizing antimicrobial stewardship: the role of electronic
medical records and technology. Clin. Infect. Dis. 57, 1005–1013.
Leclercq, R., Cantón, R., Brown, D.F.J., Giske, C.G., Heisig, P., MacGowan, A.P.,
Mouton, J.W., Nordmann, P., Rodloff, A.C., Rossolini, G.M., Soussy, C.-J.,
Steinbakk, M., Winstanley, T.G., Kahlmeter, G., 2013. EUCAST expert rules
in antimicrobial susceptibility testing. Clin. Microbiol. Infect. 19, 141–60.

CHAPTER 8. DISCUSSION
79
Leibovici, L., Shraga, I., Andreassen, S., 1999. How do you choose antibiotic
treatment? BMJ Br. Med. J. 318, 1614.
Leibovici, L., Shraga, I., Drucker, M., Konigsberger, H., Samra, Z., Pitlik, S.D.,
1998. The benefit of appropriate empirical antibiotic treatment in patients with
bloodstream infection. J. Intern. Med. 244, 379–386.
MacDougall, C., Polk, R.E., 2005. Antimicrobial stewardship programs in health care
systems. Clin. Microbiol. Rev. 18, 638–656.
Mandell, G.L., Bennett, J.E., Dolin, R., 2010. Mandell, Douglas, and Bennett’s
Principles and Practice of Infectious Diseases, 7th edition, 7th ed.
Pakyz, A.L., 2007. The utility of hospital antibiograms as tools for guiding empiric
therapy and tracking resistance. Insights from the Society of Infectious
Diseases Pharmacists. Pharmacotherapy 27, 1306–12.
Paul, M., Andreassen, S., Tacconelli, E., Nielsen, A.D., Almanasreh, N., Frank, U.,
Cauda, R., Leibovici, L., 2006. Improving empirical antibiotic treatment using
TREAT, a computerized decision support system: cluster randomized trial. J.
Antimicrob. Chemother. 58, 1238–45.
Paul, M., Shani, V., Muchtar, E., Kariv, G., Robenshtok, E., Leibovici, L., 2010.
Systematic review and meta-analysis of the efficacy of appropriate empiric
antibiotic therapy for sepsis. Antimicrob. Agents Chemother. 54, 4851–4863.
Sanden, L., Hussein, H., Paul, M., Andreassen, S., 2017. Pathogen- and
antimicrobial-specific resistance in late hospital-acquired infections. In: The
27th European Congress of Clinical Microbiology and Infectious Diseases.
European Society of Clinical Microbiology and Infectious Diseases.
Sanden, L., Paul, M., Leibovici, L., Andreassen, S., 2016. Quantifying the
associations between antibiotic exposure and resistance - a step towards
personalised antibiograms. Eur. J. Clin. Microbiol. Infect. Dis. 35, 1989–1996.
Schaechter, M., Engleberg, N.C., DiRita, V., Dermody, T.S., 2007. Schaechter’s
Mechanisms of Microbial Disease. Lippincott Williams & Wilkins.
Spiegelhalter, D.J., Dawid, A.P., Lauritzen, S.L., Cowell, R.G., 1993. Bayesian
Analysis in Expert Systems. Stat. Sci. 8, 219–247.
TREATsystems.com, 2017. Antimicrobial Stewardship Program with TREAT
Steward [WWW Document]. URL http://www.treatsystems.com/Default.aspx
(accessed 2.3.17).

CHAPTER 8. DISCUSSION
80
WHO, 2011. Race against time to develop new antibiotics. Bull. World Health Organ.
88, 88–89.
WHO, 2014. Antimicrobial Resistance: Global Report on Surveillance. Bull. World
Health Organ. 61, 383–94.

CHAPTER 8. DISCUSSION
81
APPENDICES

APPENDIX A.
APP 82
Appendix A.
Modifying the resistance to an antimicrobial after PE to the same
antimicrobial class
We assume that a given pathogen has an ABG presenting a set of N antimicrobials:
N = {1, …, n, …, N} and a corresponding set of AST results: 𝑨𝑵 = {𝐴1, …, 𝐴𝑛, …,
𝐴𝑁}, where 𝐴𝑛 is either susceptible (𝑎𝑛) or resistant (¬𝑎𝑛).
The prior probability of susceptibility to an antimicrobial 𝐴𝑛, is denoted as 𝑃(𝑎𝑛).
The corresponding probability of resistance to 𝐴𝑛 is denoted as 𝑃(¬𝑎𝑛). Hence
𝑃(¬𝑎𝑛) = 1 − 𝑃(𝑎𝑛).
The aim is to calculate the posterior probability 𝑃∗(¬𝑎𝑛) of resistance to
antimicrobial 𝐴𝑛, given PE to an antimicrobial of the same class.
The idea was to use an OR for resistance, given PE to the same class of
antimicrobials, denoted as 𝑂𝑅¬𝑎𝑛|𝑃𝐸=𝑠𝑎𝑚𝑒 .
First, we define the prior odds 𝑂𝐷¬𝒂𝒏 for resistance to 𝐴𝑛 as:
𝑂𝐷¬𝑎𝑛= 𝑃(¬𝑎𝑛)/𝑃(𝑎𝑛) (Eq. 1)
The posterior odds for resistance to An, given PE to the same class of antimicrobials
is defined as:
𝑂𝐷¬𝑎𝑛∗ = 𝑃∗(¬𝑎𝑛)/𝑃∗(𝑎𝑛) (Eq. 2)
where 𝑃(𝑎𝑛) is the probability of resistance for patients without PE and 𝑃∗(𝑎𝑛) is
the probability of resistance for patient with PE.
𝑂𝑅¬𝑎𝑛|𝑃𝐸=𝑠𝑎𝑚𝑒 is defined as:
𝑂𝑅¬𝑎𝑛|𝑃𝐸=𝑠𝑎𝑚𝑒 =𝑂𝐷¬𝑎𝑛
∗
𝑂𝐷¬𝑎𝑛
=𝑃∗(¬𝑎𝑛)
𝑃∗(𝑎𝑛) ∙
𝑃(𝑎𝑛)
𝑃(¬𝑎𝑛)
(Eq. 3)

APPENDIX A.
APP 83
By isolating 𝑂𝐷¬𝑎𝑛∗ in Eq. 3, we get:
𝑂𝐷¬𝑎𝑛∗ = 𝑂𝐷¬𝑎𝑛
∙ 𝑂𝑅¬𝑎𝑛|𝑃𝐸=𝑠𝑎𝑚𝑒 (Eq. 4)
We assume that 𝑃(𝑎𝑛) is known from the patient’s ABG and that 𝑂𝑅¬𝑎𝑛|𝑃𝐸=𝑠𝑎𝑚𝑒 is
known from Chapter 4. This allows calculation of 𝑃(¬𝑎𝑛) = 1- 𝑃(𝑎𝑛), 𝑂𝐷¬𝑎𝑛 (Eq.
1), and 𝑂𝐷¬𝑎𝑛∗ (Eq. 4), in that order.
Finally, the posterior probability of resistance, 𝑃∗(¬𝑎𝑛), can then be calculated by
using the mathematical relationship between odds and probability:
𝑃∗(¬𝑎𝑛) = 𝑂𝐷¬𝑎𝑛
∗
1 + 𝑂𝐷¬𝑎𝑛∗
(Eq. 5)
And if desired also 𝑃∗(𝑎𝑛) as:
𝑃∗(𝑎𝑛) = 1 − 𝑃∗(¬𝑎𝑛)

APPENDIX A.
APP 84
Modifying the resistance to an antimicrobial after PE to other classes
of antimicrobials
The question is now how to modify the probability of resistance to antimicrobials
from other classes. Consider an antimicrobial 𝐵, which is a member of the set of 𝑁
antimicrobials and belongs to another class than the antimicrobial 𝐴𝑛, to which the
patient was exposed. The prior probability of susceptibility to antimicrobial B, is
denoted as 𝑃(𝑏). The corresponding probability of resistance to B is denoted as
𝑃(¬𝑏). The aim is to calculate the posterior probability 𝑃∗(¬𝑏) after exposure to 𝐴𝑛
has modified the probability of resistance to antimicrobial 𝐴𝑛 from 𝑃(¬𝑎𝑛) to
𝑃∗(¬𝑎𝑛).
Marginalisation of the joint probability of 𝑃(𝐵, 𝐴𝑛) gives:
𝑃(¬𝑏) = 𝑃(¬𝑏, 𝑎𝑛) + 𝑃(¬𝑏, ¬𝑎𝑛) (Eq. 6)
By the first probability axiom we have:
𝑃(¬𝑏) = 𝑃(¬𝑏| 𝑎𝑛) ∙ 𝑃(𝑎𝑛) + 𝑃(¬𝑏|¬𝑎𝑛) ∙ 𝑃(¬𝑎𝑛) (Eq. 7)
where 𝑃(¬𝑏|𝐴𝑛) is the vector of conditional probabilities of resistance to B given
the outcome of 𝐴𝑛: 𝑃(¬𝑏|𝑎𝑛) and 𝑃(¬𝑏|¬𝑎𝑛).
When we learn 𝑃∗(𝑎𝑛) (Eq. 5), our belief in B is revised, such that using Eq. 7 we
have:
𝑃∗(¬𝑏) = 𝑃(¬𝑏| 𝑎𝑛) ∙ 𝑃∗(𝑎𝑛) + 𝑃(¬𝑏|¬𝑎𝑛) ∙ 𝑃∗(¬𝑎𝑛) (Eq. 8)
where we assume that 𝑃(¬𝑏|𝑎𝑛) and 𝑃(¬𝑏|¬𝑎𝑛) are available from a crossABG.
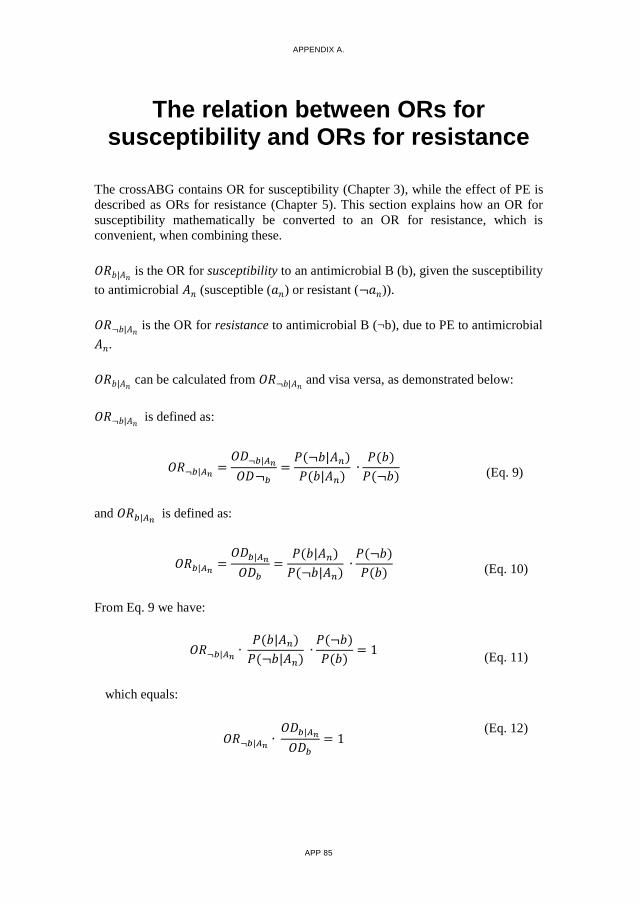
APPENDIX A.
APP 85
The relation between ORs for susceptibility and ORs for resistance
The crossABG contains OR for susceptibility (Chapter 3), while the effect of PE is
described as ORs for resistance (Chapter 5). This section explains how an OR for
susceptibility mathematically be converted to an OR for resistance, which is
convenient, when combining these.
𝑂𝑅𝑏|𝐴𝑛 is the OR for susceptibility to an antimicrobial B (b), given the susceptibility
to antimicrobial 𝐴𝑛 (susceptible (𝑎𝑛) or resistant (¬𝑎𝑛)).
𝑂𝑅¬𝑏|𝐴𝑛 is the OR for resistance to antimicrobial B (¬b), due to PE to antimicrobial
𝐴𝑛.
𝑂𝑅𝑏|𝐴𝑛 can be calculated from 𝑂𝑅¬𝑏|𝐴𝑛
and visa versa, as demonstrated below:
𝑂𝑅¬𝑏|𝐴𝑛 is defined as:
𝑂𝑅¬𝑏|𝐴𝑛=
𝑂𝐷¬𝑏|𝐴𝑛
𝑂𝐷¬𝑏
=𝑃(¬𝑏|𝐴𝑛)
𝑃(𝑏|𝐴𝑛) ∙
𝑃(𝑏)
𝑃(¬𝑏) (Eq. 9)
and 𝑂𝑅𝑏|𝐴𝑛 is defined as:
𝑂𝑅𝑏|𝐴𝑛=
𝑂𝐷𝑏|𝐴𝑛
𝑂𝐷𝑏
=𝑃(𝑏|𝐴𝑛)
𝑃(¬𝑏|𝐴𝑛) ∙
𝑃(¬𝑏)
𝑃(𝑏) (Eq. 10)
From Eq. 9 we have:
𝑂𝑅¬𝑏|𝐴𝑛∙
𝑃(𝑏|𝐴𝑛)
𝑃(¬𝑏|𝐴𝑛) ∙
𝑃(¬𝑏)
𝑃(𝑏)= 1
(Eq. 11)
which equals:
𝑂𝑅¬𝑏|𝐴𝑛∙
𝑂𝐷𝑏|𝐴𝑛
𝑂𝐷𝑏
= 1 (Eq. 12)

APPENDIX A.
APP 86
Using the definition of 𝑂𝑅𝑏|𝐴𝑛 from Eq. 10, we have:
𝑂𝑅¬𝑏|𝐴𝑛∙ 𝑂𝑅𝑏|𝐴𝑛
= 1 (Eq. 13)
and hence:
𝑂𝑅𝑏|𝐴𝑛=
1
𝑂𝑅¬𝑏|𝐴𝑛
(Eq. 14)


LINE R
UG
HO
LM SA
ND
ENSTEPS TO
WA
RD
S PERSO
NA
LISED A
NTIB
IOG
RA
MS
ISSN (online): 2246-1302ISBN (online): 978-87-7112-935-9