Embed Size (px)
Citation preview

Stephens Annual Investment
ConferenceD E C E M B E R 1 , 2 0 2 1

2
D I S C L A I M E R
IMPORTANT: You must read the following information before continuing to the rest of the presentation, which is being provided to you for informational purposes only.
FORWARD-LOOKING STATEMENTS
This presentation contains forward-looking statements. These forward-looking statements include projections, estimates and assumptions about various matters including future financial and operationalperformance of CURO and Heights Finance, such as adjusted earnings before taxes, loan receivables, revenue, pre-tax income, earnings per share, originations and expense run rates; the impact of thetransaction on us, including expected strategic benefits and synergies; future growth plans, including expansion of near-prime credit offering, card products, new merchant partnerships and verticals andsmall ticket retail targeting and technology driven enhancements; addressable markets and our position in them; impact of Desjardins exit on our business. In addition, words such as “guidance,”“estimate,” “anticipate,” “believe,” “forecast,” “step,” “plan,” “predict,” “focused,” “project,” “is likely,” “expect,” “intend,” “should,” “will,” “confident,” variations of such words and similar expressions areintended to identify forward-looking statements. Our ability to achieve these forward-looking statements is based on certain assumptions, judgments and other factors, both within and outside of ourcontrol, that could cause actual results to differ materially from those in the forward-looking statements, including the inability of the parties to successfully or timely consummate the proposed transaction,including the risk that any required licensing approvals are not obtained, are delayed or are subject to unanticipated conditions that could adversely affect the combined company or the expected benefitsof the proposed transaction; failure to realize the anticipated benefits of the proposed transaction; risks relating to the uncertainty of projected financial information; the effects of competition on thecompany’s business; our ability to attract and retain customers; market, financial, political and legal conditions; the future impact of COVID-19 pandemic or any other global event on the company’s businessand the global economy; our dependence on third-party lenders to provide the cash we need to fund our loans and our ability to affordably access third-party financing; errors in our internal forecasts; ourlevel of indebtedness; our ability to integrate acquired businesses; actions of regulators and the negative impact of those actions on our business; our ability to protect our proprietary technology andanalytics and keep up with that of our competitors; disruption of our information technology systems that adversely affect our business operations; ineffective pricing of the credit risk of our prospective orexisting customers; inaccurate information supplied by customers or third parties that could lead to errors in judging customers’ qualifications to receive loans; improper disclosure of customer personaldata; failure of third parties who provide products, services or support to us; any failure of third-party lenders upon whom we rely to conduct business in certain states; disruption to our relationships withbanks and other third-party electronic payment solutions providers as well as other factors discussed in our filings with the Securities and Exchange Commission. These projections, estimates andassumptions may prove to be inaccurate in the future. These forward-looking statements are not guarantees of future performance and involve known and unknown risks and uncertainties that are difficultto predict with regard to timing, extent, likelihood and degree of occurrence. There may be additional risks that we presently do not know or that we currently believe are immaterial that could also causeactual results to differ from those contained in the forward-looking statements. Given these risks and uncertainties, investors should not place undue reliance on forward-looking statements as a predictionof actual future results. We undertake no obligation to update, amend or clarify any forward-looking statement for any reason.
All product names, logos, brands, trademarks and registered trademarks are property of their respective owners.
NON-GAAP FINANCIAL MEASURESIn addition to the financial information prepared in conformity with U.S. GAAP, we provide certain “non-GAAP financial measures,” including: Adjusted Net Income (Net Income from continuing operationsminus certain non-cash and other adjusting items); Adjusted Earnings Per Share (Adjusted net income divided by diluted weighted average shares outstanding); Adjusted EBITDA (EBITDA plus or minuscertain non-cash and other adjusting items); Gross Combined Loans Receivable (includes loans originated by third-party lenders through CSO programs which are not included in our consolidated financialstatements); Adjusted Corporate, district, and other; and Adjusted Non-advertising costs of providing services. Such measures are intended as a supplemental measure of our performance that are notrequired by, or presented in accordance with, GAAP. We present these non-GAAP financial measures because we believe that, when viewed with our GAAP results and the accompanying reconciliation,such measures provide useful information for comparing our performance over various reporting periods as they remove from our operating results the impact of items that we believe do not reflect ourcore operating performance. These non-GAAP financial measures are not substitutes for any GAAP financial measure and there are limitations to using them. Although the Company believes that thesenon-GAAP financial measures can make an evaluation of our operating performance more consistent because they remove items that do not reflect our core operations, other companies in the Company’sindustry may define their own non-GAAP financial measures differently or use different measures. As a result, it may be difficult to use any non-GAAP financial measure to compare the performance ofother companies to our performance. The non-GAAP financial measures presented in these slides should not be considered as measures of the income generated by our business or discretionary cashavailable to us to invest in the growth of our business. Our management compensates for these limitations by reference to GAAP results and using these non-GAAP financial measures as supplementalmeasures. Reconciliation of non-GAAP metrics to the closest comparable GAAP metrics are included on slides 20 to 24.

3
Overview of CURO
CURO is a tech-enabled, omni-channel financial services company, providing
financing products to a full spectrum of non-prime consumers in the U.S. and non-prime and prime consumers in
Canada
HIGHLY RECOGNIZED & EXPANDING PORTFOLIO OF BRANDS
U.S. Direct LendingOnline in 27 states; 160 branches in 13 statesMarket leader in revenue for non-prime market with diverse product set; signed definitive agreement to acquire Heights Finance which expands reach to near-prime and adds 390 branches
B U S I N E S S O V E R V I E W
Canada Direct LendingCash Money and LendDirect focus on non-prime open-end loans and payment protection insurance in 201 branches in 8 provinces and online in 7 provinces
Canada Point-of-Sale LendingFlexiti, an emerging growth Canadian point-of-sale (“POS”) / buy-now-pay-later (“BNPL”) provider
Card ProductsRevolve mobile app-enabled virtual checking account with FDIC-insured deposits; launching non-prime credit card in Q4:2021
1
1 Signed definitive agreement to acquired Heights Finance

$55+ millionAdj. Pre-Tax Income2
$275 millionRevenue2
4
$500+ millionReceivables1
H E I G H T S A T A G L A N C E
Consumer finance company with 390 branches across 11 southern and mid-western U.S. states
Provides secured and unsecured installment loans to near-prime and non-prime consumers as well as customary opt-in insurance and other financial products
1 Loan receivables represent pre-allowance net finance receivables projected as of 12/31/2022.2 Projected financials for fiscal year ended December 31, 2022.3 Heights Finance adjusted earnings before taxes of $55 million in 2022E.
Heights Finance Acquisition Announced on November 17, 2021
S T R A T E G I C R A T I O N A L E
Accelerates CURO’s strategic migration into longer term, higher balance and lower rate credit products
Adds millions of near-prime and non-prime customers and expands CURO’s addressable market
Diversifies products, revenue, customers and geographic breadth in U.S.
Adds a leadership team with deep industry experience and a strong performance track record
Digitization of customer journey across larger footprint
Strong synergy potential through:
• Combined branch optimization
• Combined cost efficiencies
• Cross-selling opportunities
Immediately accretive to earnings
• Expected to add $0.63+ to 2022 EPS
T R A N S A C T I O N D E T A I L S
Purchase price of $360 million • Comprised of $335 million cash and $25 million of
CURO stock• 6.5x Heights Finance’s 2022E Adjusted Earnings
Before Taxes3
Anticipated to close no later than Q1:2022

5
• Non-prime Loans
• $250 - $1,500
• 7 to 12 month terms
• Unsecured
Operates 390 branches across 11 states in the South and Midwest
• Heights operates branches in Alabama (47), Georgia (18), Illinois (26), Indiana (16), Kentucky (18), Missouri (19), Oklahoma (18), South Carolina (58), Tennessee (64), Texas (86), and Wisconsin (20)
Consumer finance company with expected loan receivables of $500 million+ in 2022(1)
Provides secured and unsecured installment loan products to non-prime and near-prime consumers and opt-in installment loan related credit insurance and ancillary products
Credit products include:
• Near Prime Loans
• $1,000 - $10,000
• 24 to 60 month terms
• Secured or Unsecured
Optional credit and non-credit insurance products fill out the product set
Company rebranded to Heights Finance in 2020 after merging with Southern Management Corp
Approximately half of total portfolio loan balance comprised
of APR less than 36%(2)
Overview of Heights Finance
1 Loan receivables represent pre-allowance net finance receivables projected as of 12/31/2022.2 As of 9/30/2021.

6
Heights Growth Plan
Expand Heights Finance’s Near-Prime Credit Offering
• State expansion
• In-market branch expansion
• Progressive credit products for CURO customers
Card Products
• Market Revolve through expanded branch network
• Offer CURO non-prime credit cards to eligible customers
Technology-driven Margin Enhancements
• Extend CURO omni-channel
• Expand digital marketing
• Credit decisioning
• Diversify payment options

Canada Direct LendingProven track record of profitably transitioning to larger, lower-yielding loans
777
0%
20%
40%
60%
80%
100%
120%
140%
160%
180%
$0
$100
$200
$300
$400
$500
$600
Q1 2018 Q2 2018 Q3 2018 Q4 2018 Q1 2019 Q2 2019 Q3 2019 Q4 2019 Q1 2020 Q2 2020 Q3 2020 Q4 2020 Q1 2021 Q2 2021 Q3 2021
Loan Balances Lending Yield NCO Rates Net Revenue Yield Ancillary Yield
(C$ Millions)

Solidifies Position as a Full Spectrum Consumer Lender
8
CURO’s omni-channel distribution and product sets provides access to credit for non-prime and near-prime consumers in the U.S. and prime and non-prime consumers in Canada
CONSUMER CREDIT ACCESS U.S. BRANDS CANADIAN BRANDS
DirectBranchOnline & Mobile
CardCredit Card /Debit Card
POSOmni-channelPoint-of-Sale Financing
1
1 Katapult is a publicly traded company in which CURO has an ownership interest. Katapult is not a CURO brand.2 Heights Finance brands include Covington Credit, Southern Finance and Quick Credit; Height Finance is a separate company until CURO’s announced acquisition closes.
2

9
FINANCING ON THE FLEXITICARD®
Deferred Payments
Payments are deferred until end of promo period
0% interest1, 3-24 months
Monthly Installments
Split purchase into equal monthly payments
0% interest1, 3-72 months
Revolving Credit Purchase
Like a regular credit card
Up to 30 days interest
free
Flexiti is one of Canada's fastest growing
POS fintech lenders, offering customers 0%
interest1 financing at retailers that sell big-
ticket goods (~C$1,5002 average transaction
size) like furniture, appliances, jewelry and
electronics.
M I S S I O N
A B O U T F L E X I T I
To bring flexible payment
solutions to all
1 Subject to the Flexiti cardholder agreement. Interest is charged if the
promotion is cancelled or expires without full payment.2 Based on average transaction value of the last 12 months (Nov 2020 – Oct
2021).
G O - T O - M A R K E T I N C A N A D A P O S L E N D I N G A S :

Flexiti has limited omnichannel competition, with new BNPL entrants largely competing with each other
10
Flexiti expects to become Canada’s largest POS financing provider with LGL group now onboarded1
Flexiti has captured a majority of the $2 Billion Desjardins exit opportunity, with an 83% win-rate2
New BNPL entrants are focused primarily on small-ticket (< C$500) e-commerce transactions that do not require a credit check
Key purchase criteria for merchants are economics, ease of POS integration and customer experience
Flexiti’s leading omnichannel financing solution provides opportunity for continued market share gains
PRIMARILY IN-STORE
OMNI-CHANNEL
PRIMARILYE-COMMERCE
INS
TA
LL
ME
NT
OR
DE
FE
RR
ED
Pa
ym
en
ts o
n R
ev
olv
ing
Lin
eT
RA
NS
AC
TIO
N-B
AS
ED
inst
all
me
nt
Le
nd
ing
/
1 Based on expected originations.2 Flexiti has won 83% of retailers that have communicated a decision to Flexiti as of November 25,
2021.3 Desjardins announced its exit from the POS financing space in October 2019 when
it sold its merchant acquiring business to Global Payments. Most merchantcontracts are expected to expire by early 2022.
3

$0K
$5,000K
$10,000K
$15,000K
$20,000K
$25,000K
$30,000K
$35,000K
$40,000K
$45,000K
$50,000K
1 3 5 7 9 11 13 15 17 19 21 23 25 27 29 31 33 35 37 39 41 43 45 47 49 51
2019
2020
2021
Flexiti’s originations growth is accelerating: +132% growth YTD vs. 20201
111 YTD as of October 31, 2021
C$1.4 Billion in originations since inception -
KEY STATS:
achieved November 29, 2021
~C$125 Million in November originations -forecasted
Published Weekly Originations
FLEXITI'S BLACK FRIDAY 2021 WAS 3.2X VS. 2020
Black FridayGROWTH DRIVEN BY CANADA'S LEADING BIG-TICKET RETAILERS
C$0.5 Billion in receivables -achieved November 2021

Flexiti is One of Canada’s Fastest Growing Companies with Clear Visibility for Future Growth
12
Existing Customers
Growth in acquisitions via Flexiti.com
Growth in cross shop amongst Flexiti partnersAs announced on September 24, 2021, Flexiti ranks 13th on The Globe and Mail’s third-annual ranking of Canada’s Top Growing Companies
Future Growth Driven by:
Lost Utility for Desjardins Cardholders as of December 31, 2021
New Merchant Partnerships
Direct to Consumer Investment
Target Small Ticket(Pay-in-4)
121 Flexiti ranked 29 out of 500 companies in the Americas, and 2nd in Canada.
Resulting in an estimated C$350 million per year across The LFL Group financing program
Flexiti has an established pipeline of prospective partners – with planned expansions into new verticals
With limited D2C investment, Flexiti.com is our fourth largest acquisition channel – launching D2C digital campaigns to further bolster acquisitions
Canadian small ticket retail TAM estimated to capture 78% of total retail spend – developing small ticket will unlock new categories for Flexiti
Flexiti has ranked 10th on Deloitte’s Fast 50TM Canada Award Ranking in 2021 and has consistently ranked in the top 10.
12
Ranked 3rd
Canada’s Top Growing Companies
2 0 2 0
Ranked 10th
Deloitte Fast 50TM
Canada Award Ranking
2 0 2 1
Ranked 2nd
Financial Times Fastest Growing Companies1
2 0 2 0
Ranked 13th
Canada’s Fastest Growing Companies
2 0 2 1
Ranked 54th
Deloitte Fast 500TM
North America Award Ranking
2 0 2 1

13
Financial Recap

14
Consolidated Financial Performance TrendsLoan Growth Across All Business Lines
LOAN BALANCES 1 ($Millions)
CASH BALANCES ($Millions)
$201 $221 $302$269 $287 $302 $276 $257 $292 $330
$344 $361 $391 $408 $444 $440
$344 $235 $245 $268
$218 $224 $233 $677 $731 $743
$620 $492 $537 $598
$763 $806 $926
2Q19 3Q19 4Q19 1Q20 2Q20 3Q20 4Q20 1Q21 2Q21 3Q21
Canada POS Lending Canada Direct Lending U.S.
$92$62 $75
$139
$269
$207 $213
$135
$276
$206
2Q19 3Q19 4Q19 1Q20 2Q20 3Q20 4Q20 1Q21 2Q21 3Q21
REVENUE ($Millions)
ADJUSTED EBITDA2 ($Millions)
ADJUSTED EPS2
$0
$100
$200
$300
2Q19 3Q19 4Q19 1Q20 2Q20 3Q20 4Q20 1Q21 2Q21 3Q21
Revenue Net revenue
$54$67 $68 $66
$51
$36 $34
$64$50
$38
2Q19 3Q19 4Q19 1Q20 2Q20 3Q20 4Q20 1Q21 2Q21 3Q21
$0.52$0.71 $0.80 $0.77
$0.53
$0.27 $0.20
$0.69
$0.40
$0.15
2Q19 3Q19 4Q19 1Q20 2Q20 3Q20 4Q20 1Q21 2Q21 3Q211 Includes Company-Owned Loans and Loans Guaranteed by the Company under CSO programs. Refer
to slide 24 for a reconciliation of Gross Combined Loan Receivables for the periods presented.2 Reconciliation of non-GAAP metrics to the closest comparable GAAP metrics included within slide 20
through 24.
Like all peers, COVID-19 impacts on customer behavior affected 2020 and 2021 financial results

15
Canada Direct Lending
Credit Quality Remains StrongConsistent Robust Loan Growth
PAST DUE AR %1
LOAN BALANCES ($Millions)
TRANSACTION MIX (by week)
$269 $287 $302
$276 $257 $292
$330 $344 $361 $391
2Q19 3Q19 4Q19 1Q20 2Q20 3Q20 4Q20 1Q21 2Q21 3Q21
0%
2%
4%
6%
8%
10%
12%
Apr-19 Oct-19 Apr-20 Oct-20 Apr-21 Oct-21
61+ DPD 31-60 DPD 1-30 DPD
Solid demand and credit line increases fuel robust loan growth
Strong revenue growth and operating leverage drove 68% Q3 YOY AEBITDA growth
Credit performance remains stable and better than our expectations
10%
30%
50%
70%
90%
Ja
n-2
0
Feb-2
0
Mar-
20
Apr-
20
May-2
0
Ju
n-2
0
Ju
l-20
Aug
-20
Sep
-20
Oct-
20
No
v-2
0
De
c-2
0
Ja
n-2
1
Feb-2
1
Mar-
21
Apr-
21
May-2
1
Ju
n-2
1
Ju
l-21
Aug
-21
Sep
-21
Oct-
21
Online Store
$0
$10
$20
$30
$40
$50
$60
$70
2Q19 3Q19 4Q19 1Q20 2Q20 3Q20 4Q20 1Q21 2Q21 3Q21
Revenue Net revenue
$12
$15
$20
$8
$16 $16
$22
$26
$29$27
2Q19 3Q19 4Q19 1Q20 2Q20 3Q20 4Q20 1Q21 2Q21 3Q21
Revenue ($Millions)
Adjusted EBITDA2 ($Millions)
2 Reconciliation of non-GAAP metrics to the closest comparable GAAP metrics included within slide 20.
1 Excludes Single Pay

Strong Growth Outlook for Canadian Business Segments
16
Expect to develop into Canada’s largest BNPL/POS lender1
Top 3 non-bank direct-to-consumer lender
Revenue expected to grow from C$364 Million in 2021 to C$735 Million in 2023
Pre-tax income expected to grow from C$60 Million in 2021 to C$210 Million in 2023
Solid Revenue Growth Outlook…
Annual Revenue (C$Millions)
Note: Please refer to page 2 for cautionary language regarding forward-looking statements.1 Based on expected originations.2 Excludes acquisition-related adjustments.
…with Impressive Profitability Forecasts
Annual Pre-Tax Income (C$Millions)
$50$175
$335$315
$375
$400
Canada Direct Lending Canada POS Lending
2021E 2022E 2023E
$364
$550
$735
2
-$45-$12
$70$105 $120
$140
Canada Direct Lending Canada POS Lending
2021E 2022E 2023E
$108$60
$210
16
17
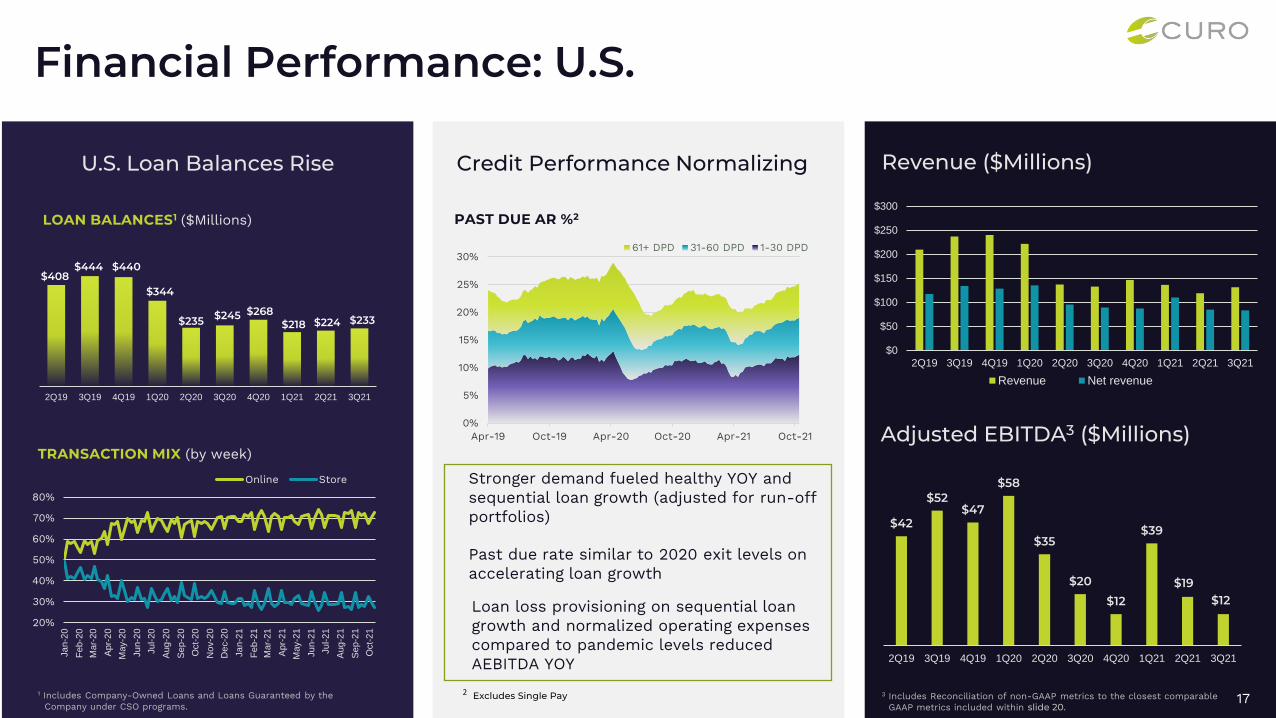
Financial Performance: U.S.
Credit Performance NormalizingU.S. Loan Balances Rise
PAST DUE AR %2LOAN BALANCES1 ($Millions)
TRANSACTION MIX (by week)
$408 $444 $440
$344
$235 $245 $268 $218 $224 $233
2Q19 3Q19 4Q19 1Q20 2Q20 3Q20 4Q20 1Q21 2Q21 3Q21
1 Includes Company-Owned Loans and Loans Guaranteed by the Company under CSO programs.
0%
5%
10%
15%
20%
25%
30%
Apr-19 Oct-19 Apr-20 Oct-20 Apr-21 Oct-21
61+ DPD 31-60 DPD 1-30 DPD
Stronger demand fueled healthy YOY and sequential loan growth (adjusted for run-off portfolios)
Past due rate similar to 2020 exit levels on accelerating loan growth
Loan loss provisioning on sequential loan growth and normalized operating expenses compared to pandemic levels reduced AEBITDA YOY
20%
30%
40%
50%
60%
70%
80%
Ja
n-2
0
Feb-2
0
Mar-
20
Apr-
20
May-2
0
Ju
n-2
0
Ju
l-20
Aug
-20
Sep
-20
Oct-
20
No
v-2
0
De
c-2
0
Ja
n-2
1
Feb-2
1
Mar-
21
Apr-
21
May-2
1
Ju
n-2
1
Ju
l-21
Aug
-21
Sep
-21
Oct-
21
Online Store
$0
$50
$100
$150
$200
$250
$300
2Q19 3Q19 4Q19 1Q20 2Q20 3Q20 4Q20 1Q21 2Q21 3Q21
Revenue Net revenue
$42
$52$47
$58
$35
$20
$12
$39
$19$12
2Q19 3Q19 4Q19 1Q20 2Q20 3Q20 4Q20 1Q21 2Q21 3Q21
Revenue ($Millions)
Adjusted EBITDA3 ($Millions)
3 Includes Reconciliation of non-GAAP metrics to the closest comparable GAAP metrics included within slide 20.
2 Excludes Single Pay

Expense Run-rates Affected by Strategic Acquisitions
18
Flexiti and Heights Finance acquisitions add to operating expense base
Pro forma interest expense will include $250 million of incremental Senior Notes used to fund in part the Heights Finance acquisition as well as volume-related growth in ABL and warehouse facilities
ADJUSTED CORPORATE, DISTRICT, AND OTHER EXPENSES 1
($ in millions)
ADJUSTED NON-ADVERTISING COSTS OF PROVIDING SERVICES 1
($ in millions)
$65 $64 $52$1
$150 $132
$91
$62
$44
2019 2020 2021 YTD
Canada Direct Lending Canada POS Lending U.S. Heights Finance
1 Reconciliation of non-GAAP metrics to the closest comparable GAAP metrics included within slide 22; note that 2021 YTD is through 9/30/21.
2 Based on $1.0 billion of Senior Secured Notes; Heights Finance’s 2021 interest expense using annualized 3Q21 ABL data; Flexiti’s 2021 interest expense using annualized 3Q21 warehouse data; and U.S. and CDL 2021 interest expense using annualized 3Q21 ABL data
Annualized interest expense2
$75, 56%
$22,17%
$16,12%
$20,15%
Senior Secured Notes at 7.5% Heights ABL
Flexiti Warehouse U.S. and CDL ABL
~$133 million($s in millions)
$22 $20 $18$21
$123 $111 $96
$68 $50
2019 2020 2021 YTD
Canada Direct Lending Canada POS Lending U.S. Heights Finance

19
Appendix

20
Historical Consolidated Adjusted EBITDA Reconciliation($Millions) Q2 2019 Q3 2019 Q4 2019 Q1 2020 Q2 2020 Q3 2020 Q4 2020 Q1 2021 Q2 2021 Q3 2021
Net Income (Loss) from continuing operations $17.7 $28.0 $29.6 $36.0 $21.1 $12.9 $4.5 $25.7 $104.5 $(42.0)
Provision (Benefit) for Income Taxes 7.5 11.2 9.8 1.9 1.1 (0.8) 3.7 8.4 34.2 (13.4)
Interest Expense 17.0 17.4 17.7 17.3 18.3 18.4 18.7 19.5 23.5 25.8
Depreciation and Amortization 4.7 4.6 4.5 4.6 4.4 4.4 4.2 5.0 7.4 7.3
EBITDA $46.8 $61.2 $61.5 $59.8 $44.9 $34.8 $31.1 $58.7 $169.5 $(22.3)
U.K. Related Costs1 0.7 0.3 - - - - - - - -
Loss (income) from equity method investment2 3.7 1.4 1.2 1.6 (0.7) (3.5) (1.9) (0.5) (1.7) 1.6
Gain from equity method investment3 - - - - - - - - (135.4) -
Share-based compensation4 2.6 2.8 2.7 3.2 3.3 3.4 3.0 2.7 3.5 4.0
Restructuring costs5 - - - - - - - - 5.8 5.6
Legal and other costs6 - 0.9 1.8 0.9 0.8 1.0 0.2 - - 0.4
Acquisition-related adjustments7 - - - - - - - - 5.5 4.3
Change in fair value of contingent consideration8 - - - - - - - - - 3.8
Loss on extinguishment of debt9 - - - - - - - - - 40.2
Canada GST adjustment10 - - - - 2.2 - - - - -
Transaction costs11 - - 0.3 0.2 0.1 0.4 2.0 3.2 3.2 0.1
Other Adjustments12 (0.2) 0.5 (0.1) - 0.6 0.0 (0.0) (0.2) (0.1) (0.1)
Adjusted EBITDA $53.7 $67.1 $67.5 $65.8 $51.1 $36.1 $34.3 $63.8 $50.3 $37.6
Adjusted EBITDA Margin 20.3% 22.6% 22.3% 23.4% 28.0% 19.8% 17.0% 32.4% 26.8% 18.0%
For a description of each addback, refer to slide 23.

21
Historical Consolidated Adjusted Net Income Reconciliation($Millions) Q2 2019 Q3 2019 Q4 2019 Q1 2020 Q2 2020 Q3 2020 Q4 2020 Q1 2021 Q2 2021 Q3 2021
Net Income (Loss) from continuing operations $17.7 $28.0 $29.6 $36.0 $21.1 $12.9 $4.5 $25.7 $104.5 $(42.0)
U.K. Related Costs1 0.7 0.3 - - - - - - - -
Loss (income) from equity method investment2 3.7 1.4 1.2 1.6 (0.7) (3.5) (1.9) (0.5) (1.7) 1.6
Gain from equity method investment3 - - - - - - - - (135.4) -
Share-based compensation4 2.6 2.8 2.7 3.2 3.3 3.4 3.0 2.7 3.5 4.0
Restructuring costs5 - - - - - - - - 5.8 5.6
Legal and other costs6 - 0.9 1.8 0.9 0.8 1.0 0.2 - - 0.4
Acquisition-related adjustments7 - - - - - - - - 5.5 4.3
Change in fair value of contingent consideration8 - - - - - - - - - 3.8
Loss on extinguishment of debt9 - - - - - - - - - 42.3
Canada GST adjustment10 - - - - 2.2 - - - - -
Transaction costs11 - - 0.3 0.2 0.1 0.4 2.0 3.2 3.2 0.1
Intangible asset amortization13 0.8 0.7 0.6 0.7 0.8 0.8 0.7 0.8 1.9 1.8
Income tax valuations14 - - - - (3.5) - - - - -
Impact of tax law changes15 - - - (9.1) - (2.1) - - - -
Cumulative tax effect of adjustments16 (1.1) (1.2) (1.4) (1.3) (1.9) (1.4) 0.1 (1.7) 30.2 (15.1)
Adjusted net income from continuing operations $24.4 $32.9 $34.8 $32.2 $22.2 $11.3 $8.6 $30.1 $17.4 $6.4
Net income (loss) from continuing operations $17.7 $28.0 $29.6 $36.0 $21.1 $12.9 $4.5 $25.7 $104.5 $(40.2)
Diluted Weighted Average Shares Outstanding 47.1 46.0 43.2 41.9 41.5 41.8 42.6 43.6 43.7 41.2
Adjusted Diluted Weighted Average Shares Outstanding17 47.1 46.0 43.2 41.9 41.5 41.8 42.6 43.6 43.7 43.3
Diluted (Loss) Earnings per Share from Continuing Operations $0.38 $0.61 $0.68 $0.86 $0.51 $0.31 $0.11 $0.59 $2.39 $(1.02)
Per share impact of adjustments to net income (loss) from Continuing Operations
$0.14 $0.10 $0.12 ($0.09) $0.02 ($0.04) $0.09 $0.10 ($1.99) $1.17
Adjusted Diluted Earnings per Share from Continuing Operations $0.52 $0.71 $0.80 $0.77 $0.53 $0.27 $0.20 $0.69 $0.40 $0.15
For a description of each addback, refer to slide 23.

22
Adjusted Operating Expense Reconciliation($Millions) 2019 2020 YTD 2021 1
Corporate, district and other $160.1 $159.9 $170.2
Less:
Depreciation and Amortization 7.6 7.4 13.1
Share-based compensation4 10.3 12.9 10.1
Legal and other6 4.5 2.9 0.4
Transaction costs11 0.3 2.7 6.5
Restructuring costs5 - - 5.7
U.K. related costs1 8.8 - -
Canada GST Adjustment10 - 2.2 -
Add:
Reclass Ad Astra pre-acquisition18 15.5 - -
Adjusted Corporate, district and other $144.1 $131.8 $134.4
Non-advertising costs of providing services $241.2 $205.7 $156.1
Less:
Depreciation 11.1 10.1 6.6
Restructuring costs5 - - 5.7
Reclass Ad Astra pre-acquisition18 15.5 - -
Adjusted Non-advertising costs of providing services $214.6 $195.6 $143.8
Advertising $53.4 $44.5 $24.8
Adjusted Non-advertising costs of providing services 214.6 195.6 143.8
Adjusted Corporate, district and other 144.1 131.8 134.4
Total Core Costs $412.1 $371.9 $303.0
For a description of each addback, refer to slide 23.1 Only includes expenses for Canada POS segment from March 10, 2021 – September 30, 2021

23
# Description
1 U.K. related costs of $8.8 million for the year ended December 31, 2019 relate to placing the U.K. subsidiaries into administration on February 25, 2019, which included $7.6 million to obtain consent from the holders of the 8.25% SeniorSecured Notes to deconsolidate the U.K. Segment and $1.2 million for other costs.
2 The amounts reported includes our share of estimated U.S. GAAP net (income) loss of Katapult.
3 During the nine months ended September 30, 2021, we recorded an additional gain on our investment in Katapult of $135.4 million. The gain represents cash we received, net of the basis of our investment in Katapult, upon thecompletion of the business combination between Katapult and FinServ.
4 The estimated fair value of share-based awards is recognized as non-cash compensation expense on a straight-line basis over the vesting period.
5 Restructuring costs for the three and nine months ended September 30, 2021 resulted from U.S. store closures and consisted of (i) severance costs for store employees, (ii) lease termination costs, and (iii) accelerated depreciation, partiallyoffset by the net write-off of right-of-use ("ROU") assets and lease liabilities.
6 Legal and other costs for the three and nine months ended September 30, 2021 included costs related to certain legal matters. Legal and other costs for the year ended December 31, 2020 included costs for certain litigation and relatedmatters of $2.4 million and severance costs for certain corporate employees of $0.5 million. Legal and other costs for the year ended December 31, 2019 included (i) costs related to certain securities litigation and related matters of $2.5million, (ii) legal and advisory costs of $0.3 million related to the repurchase of shares from Friedman Fleischer & Lowe Capital Partners II, L.P. and its affiliated investment funds ("FFL“), and (iii) $1.8 million due to eliminating 121 positions inNorth America in the first quarter.
7 Acquisition-related adjustments for the nine months ended September 30, 2021 relate to the acquired Flexiti loan portfolio as of March 10, 2021.
8 In connection with our acquisition of Flexiti, we recorded a $3.8 million adjustment related to the fair value of the contingent consideration for the three months ended September 30, 2021.
9 On July 30, 2021, we entered into new 7.50% Senior Secured Notes due 2028, which were used on August 12, 2021 to extinguish the 8.25% Senior Secured Notes due 2025. During the three months ended September 30, 2021, $40.2 millionfrom the loss on the extinguishment of debt in determining Adjusted EBITDA was due to the early redemption of the 8.25% Senior Secured Notes due 2025. An additional $2.1 million of interest was incurred for the three months endedSeptember 30, 2021 in determining Adjusted Net income, which represents interest on the 8.25% Senior Secured Notes due 2025 for the period between July 30, 2021 and August 12, 2021. This is the period during which the 8.25% SeniorSecured Notes and 7.50% Senior Secured Notes were outstanding.
10 The Company received a Notice of Adjustment from Canadian tax authority auditors in the second quarter 2020 related to the treatment of certain expenses in prior years for purposes of calculating the GST due.
11 Transaction costs for the nine months ended September 30, 2021 relate to the Katapult and FinServ business combination and the acquisition of Flexiti. Transaction costs for the year ended December 31, 2020 relate to legal and advisorycosts related to the Katapult transaction and the acquisition of Flexiti. Transaction costs for the year ended December 31, 2019 relate to legal and advisory costs related to the acquisition of Ad Astra, which closed January 3, 2020.
12 Other adjustments include the intercompany foreign exchange impact.
13 The amortization expense on intangible assets through March 31, 2021 was recognized on a straight-line basis over the life of the intangible asset. Intangible asset amortization for periods after March 31, 2021 is in connection with theFlexiti acquisition.
14 In the second quarter of 2020, a Texas court ruling related to the apportionment of income to the state for another company resulted in a change in estimate regarding the realization of a tax benefit previously taken. Accordingly, werecorded a $1.1 million liability for our estimated exposure related to this position. Also in the second quarter of 2020, we released a $4.6 million valuation allowance related to NOLs for certain entities in Canada.
15 On March 27, 2020, the Coronavirus Aid, Relief and Economic Security Act ("CARES Act") was enacted by the U.S. Federal government in response to the COVID-19 pandemic. The CARES Act, among other things, allows NOLs incurred in2018, 2019 and 2020 to be carried back to each of the five preceding taxable years to generate a refund of previously paid income taxes. For the nine months ended September 30, 2020, we recorded an income tax benefit of $11.3 millionrelated to the carryback of NOL from tax years 2018 and 2019.
16 Cumulative tax effect of adjustments included in Reconciliation of Net income from continuing operations to EBITDA and Adjusted EBITDA table is calculated using the estimated incremental tax rate by country.
17 We calculate Adjusted Diluted Earnings per Share utilizing diluted shares outstanding as of September 30, 2021. If we record a loss from continuing operations under U.S. GAAP, shares outstanding utilized to calculate Diluted Earningsper Share from continuing operations are equivalent to basic shares outstanding. Shares outstanding utilized to calculate Adjusted Earnings per Share from continuing operations reflect the number of diluted shares we would havereported if reporting Net income from continuing operations under U.S. GAAP.
18 Prior to our acquisition of Ad Astra in January 2020, costs associated with this third party collection entity were classified within Non-advertising costs of providing services. Subsequent to acquisition, direct costs related to Ad Astra andare classified within Corporate, district and other, consistent with our internal collection costs.
Description of adjustments for Consolidated Adjusted EBITDA, Consolidated Adjusted Net Income and Adjusted Operating Expense Reconciliations

24
Historical Gross Combined Loan Receivables
($Millions) 2Q19 3Q19 4Q19 1Q20 2Q20 3Q20 4Q20 1Q21 2Q21 3Q21
Company-owned gross loans receivable
$609.6 $657.6 $665.8 $564.4 $456.5 $497.4 $553.7 $731.0 $769.3 $882.4
Gross loans receivable guaranteed by the Company
$67.3 $73.1 $76.7 $55.9 $34.1 $39.8 $44.1 $32.4 $37.1 $43.4
Gross combined loans receivable $676.9 $730.7 $742.5 $620.3 $490.6 $537.2 $597.8 $763.4 $806.4 $925.8
Note: Subtotals may not sum due to rounding. The above table summarizes Company-owned gross loans receivable, a GAAP balance sheet measure, and reconciles it to gross combined loans receivable, a non-GAAP measure including loans originated by third-party lenders through CSO programs, which are not included in our Condensed Consolidated Financial Statements but from which we earn revenue and for which we provide a guarantee to the lender.