Embed Size (px)
Citation preview

i
DEVELOPMENT OF ELECTROCHEMICAL SENSORS CONTAINING
BIMETALLIC SILVER AND GOLD NANOPARTICLES
By
Stephen Nzioki Mailu
BEd (Sc) First class Honours
A thesis submitted in fulfillment of the requirements for the degree of Magister
Scientiae in the Department of Chemistry, University of Western Cape.
SUPERVISORS: Prof. Emmanuel I. Iwuoha
Prof. Priscilla G.L Baker
MAY, 2010.

ii
KEYWORDS
Polyaromatic hydrocarbons (PAHs)
Electrochemical sensor
Overoxidized-polypyrrole composite (PPyox)
Silver-gold bimetallic alloy nanoparticles (Ag-AuNPs)
Polypyrrole polymer (PPy)
Anthracene (AN)
Pyrene (Py)
Phenanthrene (PHE)
Cyclic voltammetry (CV)
Square wave voltammetry (SWV)
Electrochemical impedance spectroscopy (EIS)
Bimetallic nanoparticles

iii
ABSTRACT
Polyaromatic hydrocarbons (PAHs) are ubiquitous environmental pollutants that have
been shown to be teratogenic, mutagenic and carcinogenic and pose serious threats to
the health of aquatic and human life. Several methods have been developed for their
determination such as immunoassay, gas chromatography and high performance
liquid chromatography (HPLC) in combination with fluorescence or absorbance
detection. However, these methods are known to manifest underlying disadvantages
such as complicated pretreatment, high costs and time consuming processes. In this
work, a simple, less time consuming electrochemical method in the form of an
electrochemical sensor has been developed for the detection of PAHs. The sensor was
fabricated by the deposition of silver-gold (1:3) alloy nanoparticles (Ag-AuNPs) on
ultrathin overoxidized polypyrrole (PPyox) film which formed a PPyox/Ag-AuNPs
composite on glassy carbon electrode (PPyox/Ag-AuNPs/GCE). The silver-gold alloy
nanoparticles deposited to form the composite were chemically prepared by
simultaneous reduction of silver nitrate (AgNO3) and chloroauric acid (HAuCl4) using
sodium citrate and characterized by UV-visible spectroscopy technique which
confirmed the homogeneous formation of the alloy nanoparticles. Transmission
electron microscopy showed that the synthesized nanoparticles were in the range of
20-50 nm. The properties of the composite formed upon deposition of the
nanoparticles on the PPyox film were investigated by electrochemical methods. The
PPyox/Ag-AuNPs/GCE sensor showed strong catalytic activity towards the oxidation
of anthracene, phenanthrene and pyrene, and was able to simultaneously detect
anthracene and phenanthrene in a binary mixture of the two. The catalytic peak
currents obtained from square wave voltammetry increased linearly with anthracene,
phenanthrene and pyrene concentrations in the range of 3.0 x 10⁻⁶ to 3.56 x 10⁻⁴ M,

iv
3.3 x 10⁻⁵ to 2.83 x 10⁻⁴ M, 3.3 x 10⁻⁵ to 1.66 x 10⁻⁴ M and with detection limits of
0.169 µM, 1.59 µM and 2.70 µM, respectively. The PPyox/Ag-AuNPs/GCE sensor is
simple, has antifouling properties and is less time consuming with a response time of
4 s.

v
DECLARATION
I declare that Development of electrochemical sensors containing bimetallic silver
and gold nanoparticles is my own work, that it has not been submitted for any degree
or examination in any other university, and that all sources I have used or quoted have
been indicated and acknowledged by means of complete references.
Stephen Nzioki Mailu May 2010
Signed……………………….

vi
ACKNOWLEDGEMENTS
The success of this work can be attributed to the assistance, guidance, and prayers of
so many people who are hereby gratefully acknowledged. Firstly, I would like to give
the Almighty God, all the glory, honour and adoration for giving me the strength and
wisdom through the Holy Spirit to complete this work.
Many thanks go to all the members of the church of God where I derived spiritual
nourishment.
To my supervisors, Professor Emmanuel Iwuoha and Professor Priscilla G.L Baker, I
say a big thank you for your excellent supervision, support and encouragement during
this period. Dr. Jaheed Nazeem is also highly appreciated for his continuous support
through out my research period.
To the members of the department of Chemistry, University of the Western Cape,
South Africa, I say thank you for the good and the cordial working relationship I
enjoyed during my studies.
I gratefully acknowledge the National Research Foundation (NRF) of South Africa
for funding my research programme. The support of my colleagues in SensorLab,
University of the Western Cape, including Peter, Muchindu, Fanelwa, Chinwe, Abdul,
Nicolette, Jesmina, Zelo, Natasha, Njomo, Masikini, Lundi, Matinise, Wale and Sipho
is gratefully acknowledged. The leadership, role and cooperation from our post-

vii
doctoral fellows: Dr. Amir-Al-Ahmed, Dr. Everlyne Songa, Dr. Omotayo Arotiba, Dr.
Tesfaye Waryo and Dr. Faiza Jan Iftikhar, is also acknowledged.
The contributions of my beloved friends: Peter Ndangili, Nicholas Musyoka, Anyona,
Everlyne, Njomo, Chinwe, Masikini, Wale and Susan Maingi are highly appreciated.
Much appreciation to all my family members for their love and care during the period
of study. My sisters and brothers: Rebecca Mbula, Mary Kamene, Damaris Ngina,
Irene Katunge, Nicholas Loki, Richard Kituku and Peter Kinyae, each time you
assured me of your moral support while studying, I felt highly encouraged and loved.
Thank you so much.
Lastly, to my parents Mrs. Rhodah Mumbi Mailu and Mr. Bredan Mailu Kituku, this
is for you. Thank you very much for your love, care, education and upbringing. You
are just the best gift from God! Painfully, Daddy passed away at the climax of this
work, may his soul rest in peace.

viii
DEDICATION
This project is dedicated to
The
Almighty God
And
My Parents
Mrs. Rhodah Mumbi Mailu and Mr. Bredan Mailu Kituku.

ix
LIST OF PUBLICATIONS
1. Stephen N. Mailu, Tesfaye T. Waryo, Peter M. Ndangili, Fanelwa R. Ngece,
Abd A. Baleg, Priscilla G. Baker, Emmanuel I. Iwuoha. Determination of
anthracene on Ag-Au bimetallic nanoparticles/overoxidized-polypyrrole
composite modified glassy carbon electrodes. Sensors 2010 (in press).
2. Stephen N. Mailu, Rasaq A. Olowu, Tesfaye T. Waryo, Priscilla G. Baker,
Emmanuel I. Iwuoha. Simultaneous determination of anthracene and
phenanthrene on Ag-Au bimetallic alloy nanoparticles/overoxidized-
polypyrrole composite modified glassy carbon electrode. Advanced material
letters 2010 (in preparation).
3. Stephen N. Mailu, Tesfaye T. Waryo, Faiza J. Iftikhar, Priscilla G. Baker,
Emmanuel I. Iwuoha. Recent advances in synthesis, characterization and
application of bimetallic alloy nanoparticles as novel materials in
electrochemical sensors and enzyme biosensors. Electrochemical Acta
Chimica, Review article 2010 (in preparation).

x
TABLE OF CONTENTS
Title page ............................................................................................................................. i
Keywords............................................................................................................................. ii
Abstract .............................................................................................................................. iii
Declaration ......................................................................................................................... v
Acknowledgement .............................................................................................................. vi
Dedication ........................................................................................................................ viii
List of publications ............................................................................................................. ix
Table of contents ................................................................ Error! Bookmark not defined.
List of figures ................................................................................................................... xvi
List of tables ................................................................................................................... xxiii
List of schemes ............................................................................................................... xxiv
List of abbreviations ....................................................................................................... xxv
CHAPTER 1 ....................................................................................................................... 1
1.0 INTRODUCTION .................................................................................................. 1
1.1 Background. ........................................................................................................ 1
1.2 Problem statement. .............................................................................................. 4
1.3 Rationale and motivation. ................................................................................... 5
1.4 The aims and objectives of the research. ............................................................ 7
1.5 Research framework. .......................................................................................... 9

xi
1.6 Outline of the thesis. ......................................................................................... 10
CHAPTER 2 ..................................................................................................................... 12
2.0 LITERATURE REVIEW. ...................................................................................... 12
2.1 Polyaromatic hydrocarbons (PAHs). ...................................................................... 12
2.1.1 Definition and sources of PAHs. ..................................................................... 12
2.1.2 Formation of PAHs. ......................................................................................... 13
2.1.3 Properties of PAHs. ......................................................................................... 15
2.1.4 Characteristics of some of the monitored PAHs. .......................................... 17
2.1.4.1 Phenanthrene (PHE).............................................................................. 17
2.1.4.2 Anthracene (AN). .................................................................................. 18
2.1.4.3 Pyrene (Py)............................................................................................ 19
2.1.5 Toxicological effects of PAHs. ..................................................................... 20
2.1.5.1 Toxicity of PAHs. ................................................................................. 20
2.1.5.2 Genotoxicity of PAHs. .......................................................................... 21
2.1.5.3 Carcinogenicity of PAHs. ..................................................................... 22
2.1.6 Human exposure to PAHs. ............................................................................ 23
2.1.7 Methods used in the detection of PAHs. ....................................................... 24
2.2 Polymers. .......................................................................................................... 27
2.2.1 Conducting polymers (CPs). ............................................................................ 27
2.2.2 Synthesis of conducting polymers. .................................................................. 28
2.2.2.1 Polypyrrole (PPy). ................................................................................... 29
2.2.2.2 Overoxidation of polypyrrole. .................................................................. 33
2.3 Monometallic and bimetallic nanoparticles. ..................................................... 35
2.3.1. Application of nanoparticles in electrochemical sensors and biosensors. ...... 35

xii
2.3.1.1 Immobilization of biomolecules. .......................................................... 36
2.3.1.2 Catalysis of electrochemical reactions. ................................................. 37
2.3.1.3 Enhancement of electron transfer. ........................................................ 38
2.3.1.4 Labeling biomolecules. ......................................................................... 38
2.3.1.5 Nanoparticles acting as reactant ............................................................ 38
2.3.2 Bimetallic nanoparticles. ............................................................................... 39
2.3.3 Silver-gold bimetallic alloy nanoparticles (Ag-AuNPs). .............................. 40
2.3.3.1 Preparation methods for Ag-AuNPs. .................................................... 40
2.4 Chemical sensors. ............................................................................................. 41
2.4.1 Electrochemical sensors ................................................................................ 42
2.4.1.1 Potentiometric sensors. ......................................................................... 42
2.4.1.2 Conductometric sensors. ....................................................................... 44
2.4.1.3 Amperometric sensors. ......................................................................... 44
2.5 Characterization techniques. ............................................................................. 46
2.5.1 Electroanalytical techniques. ........................................................................... 46
2.5.1.1 Basic components of an electroanalytical system. .................................... 46
2.5.1.2 Cyclic voltammetry (CV) ..................................................................... 49
2.5.1.3 Square wave voltammetry (SWV). ....................................................... 54
2.5.2 Spectroscopic techniques ................................................................................. 57
2.5.2.1 Electrochemical impedance spectroscopy (EIS) ....................................... 57
2.5.2.2 UV-visible spectroscopy ........................................................................... 65
2.5.2.3 Fluorescence spectroscopy........................................................................ 66
2.5.3 Other techniques ........................................................................................... 67
2.5.3.1 Transmission electron microscopy (TEM) ............................................... 67
CHAPTER 3 ..................................................................................................................... 69

xiii
3.0 EXPERIMENTAL SECTION ................................................................................ 69
3.1 Introduction ............................................................................................................. 69
3.2 Reagents and materials ........................................................................................... 69
3.3 Instrumentation. ...................................................................................................... 70
3.4 Preparation of silver, gold and silver-gold alloy nanoparticles .............................. 71
3.5 Preparation of glassy carbon electrode (GCE) with nanoparticles. ........................ 72
3.6 Preparation of overoxidized-polypyrrole polymer on GCE (PPyox/GCE). ........... 72
3.7. Fabrication of overoxidized-polypyrrole/Ag-AuNPs composite on GCE
(PPyox/Ag-AuNPs/GCE). ............................................................................................ 73
3.8 Electrochemical characterization. ........................................................................... 74
3.8.1 Characterization of the nanoparticles. .............................................................. 74
3.8.2 Characterization of polypyrrole (PPy). ............................................................ 75
3.8.3 Characterization of PPyox/GCE and PPyox/Ag-AuNPs/GCE. ....................... 75
3.9 Electrochemical sensor measurements. ............................................................ 76
3.9.1 Choice of suitable solvent and supporting electrolyte. ................................. 76
3.9.2 Preparation and analysis of the PAHs .............................................................. 77
3.9.3 Interferences studies......................................................................................... 78
CHAPTER 4 ..................................................................................................................... 79
4.0 RESULTS AND DISCUSSION 1 .......................................................................... 79
4.1 Characterization of Ag-AuNPs. .............................................................................. 79
4.1.1 UV-visible spectroscopy. ................................................................................. 79
4.1.2 Fluorescence properties of Ag-AuNPs. ........................................................... 84
4.1.3 Transmission electron microscopy (TEM) ...................................................... 85
xiv
4.1.4 Electrochemical characterization of Ag-AuNPs. ............................................. 86
4.1.4.1 Characterization in neutral medium. ......................................................... 86
4.1.4.2. Characterization in the presence of K3Fe(CN)6 redox probe ................... 93
4.1.4.3. Impedimetric characterization of Ag-AuNPs/GCE. ................................ 95
4.2 Synthesis and characterization of PPy/GCE ..................................................... 99
4.2.1 Characterization of PPy/GCE in 0.1 M LiClO4. .............................................. 99
4.3 Overoxidation of polypyrrole. .............................................................................. 104
4.4 Electrochemical characterization of PPyox/Ag-AuNPs/GCE. ............................. 105
CHAPTER 5 ................................................................................................................... 108
5.0 RESULTS AND DISCUSSION 2 ........................................................................ 108
5.1 Response of the electrochemical sensor on some monitored PAHs. .................... 108
5.1.1 Electrocatalytic oxidation of anthracene (AN). ............................................. 108
5.1.1.1 Analytical application for anthracene detection ..................................... 113
5.1.1.2. Interferences to AN detection. ............................................................... 117
5.1.1.3 Stability studies. .................................................................................. 118
5.1.1.4. Reproducibility studies. ......................................................................... 119
5.1.2 Electrocatalytic oxidation of phenanthrene (PHE). .................................... 120
5.1.2.1 Reproducibility studies ........................................................................... 125
5.1.2.2 Interference studies. ................................................................................ 125
5.1.3. Electrocatalytic oxidation of AN and PHE. .................................................. 126
5.1.3.1 Effect of scan rate on the peak current in the binary mixture of AN and
PHE ..................................................................................................................... 129
5.1.3.2. Simultaneous determination of AN and PHE. ....................................... 131
5.1.4 Determination of pyrene (Py). ........................................................................ 135

xv
5.1.4.1 Reproducibility. ......................................................................................... 138
CHAPTER 6. .................................................................................................................. 139
6.0 CONCLUSION AND RECOMMENDATIONS ................................................. 139
6.1 Conclusion ............................................................................................................ 139
6.2 Future work and recommendation: ....................................................................... 140
References. ...................................................................................................................... 141

xvi
LIST OF FIGURES
FIGURE TITLE Page
Figure 1:
Figure 2:
Figure 3:
Figure 4:
Figure 5:
Figure 6:
Figure 7:
Figure 8:
Figure 9:
Figure 10:
Figure 11:
Figure 12:
Figure 13:
Figure 14:
Figure 15:
Figure 16:
The chemical structure of some common 16 US EPA priority
PAHs
Structure of phenanthrene
Structure of anthracene
Structure of pyrene
Schematic representation of an electrochemical cell consisting
of three electrodes
A typical cyclic voltammogram
A typical SWV containing the forward, reverse and difference
currents.
A typical impedance diagram
A typical Nyquist plot
A typical Nyquist plot showing some kinetic parameters
A typical bode plot showing variation of impedance and phase
angle with change in frequency
A bode plot showing some kinetic parameters
Randles equivalent circuit for a simple electrochemical cell
UV-visible absorption spectra of Ag, Au, Ag-Au (1:3) alloy
nanoparticles and a mixture of pure Ag and Au nanoparticles
UV-visible absorption spectra of Ag, Au and Ag-Au (1:3) alloy
nanoparticles after 4 months storage at 25 °C.
UV-visible absorption spectra of Ag-Au alloy nanoparticles
14
17
19
19
47
51
56
60
61
62
63
64
64
80
81

xvii
Figure 17:
Figure 18:
Figure 19:
Figure 20:
Figure 21a:
Figure 21b:
Figure 21c:
Figure 22:
Figure 23a:
Figure 23b:
Figure 23c:
with various molar ratios of Ag and Au.
A plot of the wavelength corresponding to the maximum
absorbance for varying mole fractions of Ag-Au alloy
nanoparticles.
Digital photographs of Au, Ag and Ag-Au alloy (Au mole
fraction: (a) 0, (b) 0.1, (c) 0.5, (d) 0.75, (e) 0.9 and (f) 1)
nanoparticles
Emission spectra of Au and Ag-Au alloy (Au mole fraction: (a)
0.5, (b) 0.75, (c) 0.9 and (d) 1) nanoparticles with varying Au
mole fraction
TEM images of (a) Ag-Au (1:3) bimetallic alloy nanoparticles ,
(b) pure Ag nanoparticles and (c) pure Au nanoparticles.
Cyclic voltammograms of bare GCE and AgNPs/GCE in 0.1 M
PBS pH 7 at a scan rate of 50 mV s-1.
Cyclic voltammograms of bare GCE and AuNPs/GCE in 0.1 M
PBS pH 7 at a scan rate of 50 mV s-1.
Cyclic voltammograms of bare GCE and Ag-AuNPs/GCE in
0.1 M PBS pH 7 at a scan rate of 50 mV s-1.
Cyclic voltammograms of Ag-AuNPs/GCE in 0.1M PBS pH 7
at different scan rates.
Cyclic voltammograms of bare GCE and AgNPs/GCE in 0.1M
LiClO4 at a scan rate of 50 mV s-1
Cyclic voltammograms of bare GCE and AuNPs/GCE in 0.1 M
LiClO4 at a scan rate of 50 mV s-1.
Cyclic voltammograms of bare GCE and Ag-AuNPs/GCE in
82
83
84
85
86
87
88
88
89
90
91

xviii
Figure 24:
Figure 25:
Figure 26:
Figure 27:
Figure 28:
Figure 29:
Figure 30:
Figure 31:
Figure 32:
Figure 33:
Figure 34:
0.1M LiClO4 at a scan rate of 50 mV s-1
Cyclic voltammograms of Ag-AuNPs/GCE in 0.1M LiClO4 at
different scan rates
A plot of scan rate versus anodic peak current
CVs of bare GCE and Ag-AuNPs/GCE in 5 mM K3Fe(CN)6
solution containing 0.1 M KCl at a scan rate of 50 mV s-1.
Nyquist plots of the EIS recorded in the presence of
K4[Fe(CN)6]/K3[Fe(CN)6] (1:1) containing aq. KCl (0.1 M) for
the bare GCE and Ag-AuNPs/GCE
Polymerization of pyrrole in 0.1 M LiClO4
Multiscan voltammograms of PPy characterization in 0.1 M
LiClO4 at different scan rates: (a) 10 mV s-1; (b) 50 mV s-1; (c)
75 mV s-1; (d) 100 mV s-1; (e) 150 mV s-1; (f) 200 mV s-1; (g)
250 mV s-1; (h) 300 mV s-1; (i) 350 mV s-1. (Initial potential:
500 mV).
A plot of current versus scan rate
Cyclic voltammograms of bare GCE and PPy/GCE in 5 mM
K3Fe(CN)6 at a scan rate of 50 mV s-1
Overoxidation of PPy in 0.1 M NaOH for 420 s
CVs recorded with PPyox/GCE (curve a), bare GCE (curve b)
and PPyox/Ag-AuNPs/GCE (curve c) in the presence of
K3Fe(CN)6 (5 mM) in aq. KCl (0.1 M): Scan rate: 50 mV s-1
CV of 3.56 x 10⁻⁴ M anthracene at bare GCE, AgNps/GCE,
AuNPs/GCE, Ag-AuNPs/GCE, PPyox/GCE and PPyox/Ag-
AuNPs/GCE
91
92
93
94
96
99
100
101
103
105
107
110

xix
Figure 35:
Figure 36:
Figure 37:
Figure 38:
Figure 39:
Figure 40:
Figure 41:
Figure 42:
Figure 43:
CVs of PPyox/Ag-AuNPs/GCE upon addition of 3.56 x 10⁻⁴ M
anthracene at different scan rates
A plot of root scan rate versus peak current
CV of PPyox/Ag-AuNPs/GCE in acetonitrile + 0.1 M LiClO4
with different anthracene concentration: (a) 0, (b) 33, (c) 66, (d)
100, (e) 133, (f) 166, (g) 200, (h) 233, (i) 250, (j) 283, (k) 312,
(l) 340, (m) 356 µM) at a scan rate of 100 mV s-1
A calibration plot showing the relationship between oxidation
current and concentration of anthracene
SWV of PPyox/Ag-AuNPs/GCE in acetonitrile + 0.1 M LiClO4
with different anthracene concentration: (a) 0, (b) 3, (c) 6, (d)
10, (e) 13, (f) 16, (g) 20, (h) 23, (i) 26, (j) 28, (k) 33, (l) 66, (m)
100, (n) 133, (o) 166, (p) 200, (q) 233, (r) 250, (s) 283, (t) 312,
(u) 340, (v) 356 µM).
A calibration plot showing the relationship between current and
concentration of anthracene.
Current-time plot for the electrochemical sensor response to
successive addition of 3.0 μM anthracene at a constant potential
of 1181 mV.
SWV of PPyox/Ag-AuNPs/GCE in acetonitrile and 0.1 M
LiClO4 in anthracene alone and a mixture of anthracene and
interferences
SWV of PPyox/Ag-AuNPs/GCE in acetonitrile and 0.1 M
LiClO4 in presence of anthracene (3.56 x 10⁻⁴ M) at the 1st day,
4th day, 8th and 12th day.
112
113
114
114
115
115
117
118
119

xx
Figure 44:
Figure 45:
Figure 46:
Figure 47:
Figure 48:
Figure 49:
Figure 50:
Figure 51:
Figure 52:
Figure 53:
Figure 54:
CV of 2.5 x 10⁻⁴ M PHE at bare GCE, Ag-AuNPs/GCE,
PPyox/GCE and PPyox/Ag-AuNPs/GCE in acetonitrile and 0.1
M LiClO4.
SWV of 2.5 x 10⁻⁴ M PHE at bare GCE, Ag-AuNPs/GCE,
PPyox/GCE and PPyox/Ag-AuNPs/GCE in acetonitrile and 0.1
M LiClO4.
Anodic difference SWV of PPyox/Ag-Au NPs/GCE in
acetonitrile and 0. 1 M LiClO4 with different PHE
concentrations.
A calibration plot showing the relationship between oxidation
current and concentration of PHE
CV of PPyox/Ag-AuNPs/GCE in acetonitrile and 0.1 M LiClO4
at different scan rates upon addition of 2.33 x 10⁻⁴ M PHE
A plot of root scan rate versus peak current of PHE
SWV of PPyox/Ag-AuNPs/GCE in acetonitrile and 0.1 M
LiClO4 in PHE alone and a mixture of PHE and interferences
Voltammetric curves of 3.56 x 10⁻⁴ M solution of AN (curve a),
2.30 x 10⁻⁴ M solution of PHE (curve b) and 0.1 M LiClO4
supporting electrolyte in acetonitrile (curve c) using PPyox/Ag-
AuNPs/GCE.
CVs of PPyox/Ag-AuNPs/GCE in acetonitrile and 0.1 M
LiClO4 (blank) (1) and a mixture of AN and PHE (2) .
SWVs of PPyox/Ag-AuNPs/GCE in acetonitrile and 0.1 M
LiClO4 (blank) (1) and a mixture of AN and PHE (2)
CVs for the binary mixtures of 2.30 x 10⁻⁴ M AN and 2.30 x 10-
121
121
122
123
124
124
126
127
128
128

xxi
Figure 55:
Figure 56:
Figure 57:
Figure 58:
Figure 59:
Figure 60:
Figure 61:
Figure 62:
Figure 63:
4 M PHE in 0.1 M LiClO4 and acetonitrile at PPyox/Ag-
AuNPs/GCE at different scan rates: (a) 20 (b) 40 (c) 80 (d) 100
(e) 150 (f) 200 (g) 250 (h) 300 (i) 350 (j) 400 (k) 450 mV s-1
A plot of root scan rate versus peak current of AN
A plot of root scan rate versus peak current of PHE
SWV for the binary mixtures of AN and PHE at PPyox/Ag-Au
NPs/GCE in 0.1 M LiClO4 and acetonitrile, [PHE] was kept
constant and [AN] was changed (i.e. [AN]: (a) 0, (b) 30, (c) 60,
(d) 100, (e) 130, (f) 166, (g) 200, (h) 230, (i) 250 ,(j) 280, (k)
312 μΜ).
A calibration plot of concentration versus peak current of AN
SWV for the binary mixtures of AN and PHE at PPyox/Ag-Au
NPs/GCE in 0.1 M LiClO4 and acetonitrile, [AN] was kept
constant and [PHE] was changed (i.e. [PHE]: (a) 0 (b) 30 (c) 60
(d) 100 (e) 130 (f) 166 (g) 200 (h) 230 (i) 250 (j) 280 μΜ).
A calibration plot of concentration versus peak current of PHE.
SWV for the binary mixtures of AN and PHE at PPyox/Ag-
AuNPs/GCE in 0.1 M LiClO4 and acetonitrile, at increasing
[AN] and [PHE] (i.e. (a) 250, (b) 280, (c) 312, (d) 340, (e) 356,
(f) 380 μΜ).
SWV of 2.80 x 10⁻⁴ M pyrene at bare GCE, Ag-AuNPs/GCE,
PPyox/GCE and PPyox/Ag-AuNPs/GCE in acetonitrile and 0.1
M LiClO4
SWV of PPyox/Ag-AuNPs/GCE at increasing concentration of
pyrene (a) 0, (b) 10, (c) 33, (d) 66, (e) 100, (f) 130, (g) 166 μΜ).
130
130
131
132
132
133
134
135
136
137

xxii
Figure 64: A calibration plot of current verses concentration of pyrene 138

xxiii
LIST OF TABLES
TABLE TITLE page
Table 1: Diagnostic tests for the electrochemical reversibility of a redox couple,
carried out by cyclic voltammetry .................................................................... 52
Table 2: The EIS parameters obtained from the circuit fitting of Figure 27 data. ........... 97
Table 3: Effect of Ag-AuNPs electrode on the kinetics of [Fe(CN)6]3-/4- ........................ 98
Table 4: CV data for bare GCE and PPy/GCE in 5 mM K3Fe(CN)6. ............................ 104
Table 5: CV data obtained from Figure 33 .................................................................... 107
Table 6: Anodic current response data for the development of the sensor .................... 111

xxiv
LIST OF SCHEMES
SCHEME TITLE Page
Scheme 1: Research framework. ........................................................................................ 9
Scheme 2: Procedure of ion exchange behavior of conducting polymer ......................... 30
Scheme 3: Synthesis of polypyrrole from pyrrole monomer. .......................................... 32
Scheme 4: Overoxidation of polypyrrole. ........................................................................ 33
Scheme 5: A schematic picture of an electrochemical sensor. ........................................ 45
Scheme 6: Schematic illustration of the stepwise sensor fabrication processError! Bookmark not define
Scheme 7: Outline of various products expected from the oxidation of anthracene. .... 109

xxv
LIST OF ABBREVIATIONS
AN Anthracene
CV Cyclic voltammetry
DNA Deoxyribonucleic acid.
EIS Electrochemical impedance spectroscopy
Au Gold
GCE Glassy carbon electrode
HMW High molecular weight
HPLC High performance liquid chromatography
LMW Low molecular weight
NPs Nanoparticles
Ag Silver
Ag-AuNPs Silver-gold nanoparticles
SOD Superoxide dismutase
SWV Square wave voltammetry
PPyox Overoxidized-polypyrrole
PHE Phenanthrene
PAHs Polyaromatic hydrocarbons
PPy Polypyrrole
Py Pyrene
TEM Transmission electron microscopy
US EPA United state environmental protection agency

1
CHAPTER 1
1.0 INTRODUCTION
1.1 Background.
The quality of the environment is one of the key parameters that determine the life
expectancy of human beings as well as the other living organisms. Interfering with the
environment by means of contaminating it affects in one way or the other the life
expectancy of the living organisms. The environment is contaminated through a
process called pollution which is defined as the introduction of contaminants into the
environment that causes instability, disorder, harm or discomfort to the ecosystem.
This can be through air, water or soil pollution. Air pollution, both indoors and
outdoors, is a significant cause of health problems worldwide. Urban and rural
outdoor environment contains infections, allergens, irritants and chemical toxins that
reduce the quality of life and causes diseases. These pollutants shorten the life span of
people. Consequently, water pollution is a great threat to the life of human beings as
well as other organisms. It has been suggested to be the leading world wide cause of
death and diseases and that it accounts for the death of more than 14,000 people daily
[1]. This pollution occurs through the passage of domestic wastes as well as industrial
wastes such as oil, grease, and volatile organic compounds into the water bodies.
Moreover, soil pollution is caused by the presence of man-made chemicals or other
alteration in the natural soil environment. This contamination typically arises from the
rupture of underground storage tanks, application of pesticides, and percolation of
contaminated surface water to subsurface strata, oil and fuel dumping, leaching of
wastes from landfills or direct discharge of industrial wastes to the soil.

2
Since the publication of Rachel Carson’s silent spring [2], there has been concern that
chemicals in the environment might exert profound and deleterious effects on wildlife
population, and that the human health is extricably linked to the environment.
However, the most common chemicals that cause great harm to the environment are
petroleum hydrocarbons, solvents and pesticides. Due to the dangers associated with
the pollution of the environment, it is of paramount importance to identify the specific
causes of the pollution, the pollutants, and their specific composition in the
environment. This calls for the development of fast and sensitive methods for
monitoring the type of pollutants and the proportional amount of the pollutants in the
environment. For this reason, the development of procedures for the extraction,
determination and analysis of environmental pollutants has been one of the most
important objectives of global research efforts today [3]. Some of the major
environmental pollutants that require constant monitoring due to their environmental
toxicity are the polyaromatic hydrocarbons (PAHs). They are chemical compounds
that consist of aromatic rings and do not contain heteroatom or carry substituents [4].
They occur in oil, coal, and tar deposits and are produced as by-products of fuel
burning (whether fossil fuel or biomass). As pollutants, they are of great concern
because some of them have been identified to be carcinogenic, mutagenic and
teratogenic. They are released into the air through burning of fuel or carbon
containing compounds such as wood thus acting as air pollutants. Consequently, once
oil and petroleum fuel spill to the water bodies they act as sources of PAHs which
pollute water and soil.
Contamination of the environment is thus a global problem [3], especially the
presence of PAHs in the environment as a result of their high levels of toxicity,

3
persistency and environmental prevalence [5]. Thorough research has been done on
the causes, methods of determining and the maximum amount of PAHs that is
allowed in the environment. In connection to this, the governments and environmental
scientists around the world have begun screening and controlling them so as to reduce
and restrain their risk to people and the environment. In fact, recent studies have
focused on developing methods for monitoring traces of PAHs [6-9]. However, these
studies have been limited to 16 PAHs, designated as priority pollutants by the United
States Environmental Protection Agency (US EPA) [10]. In view of this, this work
aims at developing a cheap and less time consuming electroanalytical method for the
determination of anthracene, phenanthrene and pyrene which are some of the
carcinogenic PAHs and that have been designated to be among the priority pollutants
by the United States Environmental Protection Agency (US EPA). Since PAHs are
made up of benzene rings and are easily oxidized at high potentials, the method
employed involves the use of an electrochemical method, in form of an
electrochemical sensor based on silver-gold alloy nanoparticles/overoxidized-
polypyrrole composite. The composite is used to modify glassy carbon electrode and
through the application of positive potentials, the specific PAHs are oxidized at
specific potentials hence making them to be identified and determined. The silver-
gold alloy nanoparticles act as electro-catalysts and aid in electron transfer during the
oxidation process while the overoxidized-polypyrrole possess nanopores and create
room for the deposition of the nanoparticles and prevent electrode fouling [11].

4
1.2 Problem statement.
The public concern about the presence of PAHs in the environment and their possible
toxic effects such as being carcinogenic, mutagenic and teratogenic calls for the
development of precise, accurate, cheap and less time consuming methods for
identifying and quantifying them. Majority of the methods reported for the
determination of PAHs involve the use of immunoassay, gas chromatography and
high performance liquid chromatography (HPLC) with UV-vis absorbance or
fluorescence, and capillary electrophoresis (CE) equipped with laser-induced
fluorescence. These conventional methods allow high accuracy and low detection
limits. However, the drawbacks of these methods although the most accurate, are that
they are expensive, time consuming, require large sample volumes as well as large
amount of organic solvent with separation and extraction procedures, and must be
undertaken by an analytical chemist in a dedicated analytical laboratory. Moreover,
electrode fouling offers a great analytical challenge during the determination of these
PAHs.
In view of these analytical challenges, the silver-gold alloy
nanoparticles/overoxidized-polypyrrole composite based electrochemical sensor
developed in this study provides an easy, cheap, less time consuming and electrode
fouling free method for the determination of PAHs.

5
1.3 Rationale and Motivation.
As a result of the above mentioned environmental effects caused by the presence of
PAHs in the environment and the regulations attached to the maximum tolerated level
for PAHs in the environment, there is the need to monitor the types of PAHs and their
levels (compositional proportion) in the environment. Certain guidelines have been
set by certain world organizations concerning the pollutants found in water and soil
such as PAHs. In drinking water, the world health organization (WHO) has
recommended concentration of lower than 15 ng/L for each PAH and 700 ng/L for
benzo(a)pyrene (B[a]P) [12]. However, it has been recommended that drinking water
samples containing around 8 PAHs, the concentration level should be less than 200
ng/L [13]. According to Kabzinski et al., [13] the concentration of PAHs in surface
water range from 0.1 – 830 ng/L and should not exceed that limit. In rain and snow,
the concentration of all 16 PAHs has been found to vary between 500 to 20,000 ng/L.
However, the concentration of PAHs in waste water and lakes can increase more than
100 times in comparison to the recommended maximum amount of PAHs in drinking
water [13]. In soils, PAHs concentration should not exceed 1 µg/g [14]. Several
methods for analysis and determination of PAHs have been reported. These methods
include immunoassay [15], gas chromatography [16] and high performance liquid
chromatography (HPLC) using UV-vis absorbance [17-18] and capillary
electrophoresis (CE) equipped with laser-induced fluorescence [19]. However, these
methods are known to manifest underlying disadvantages such as complicated
pretreatment, high costs, and time consuming processes. Recent studies have shown
that electrochemical methods are inexpensive, simple, and effective, have a high
electrochemical detection and are less time consuming [20-21]. The ability of PAHs
to be electrochemically oxidized forms the basis of electrochemical detection

6
methods. On application of potential, the electrocatalytic oxidation of PAHs is usually
accompanied by generation of current. This current is proportional to the amount of
the specified PAH under investigation. Consequently, by monitoring this current, the
amount of the PAH under study can be inferred.
It has been found that bare electrodes such as glassy carbon electrodes, platinum
electrodes and gold electrodes were able to oxidize the monitored PAHs [22]. Roman
et al. [22] showed that naphthalene and acenaphthalene were able to be oxidized by
bare glassy carbon electrodes and platinum electrodes. However, the immobilization
of nanoparticles on the surface of the electrodes has been found to increase the
effective surface area of the electrodes, thus enhancing the peak current leading to an
increase in their sensitivity. Consequently, the use of bimetallic nanoparticles have
been reported to have higher catalytic properties compared to their corresponding
monometallic nanoparticles due to their increased surface area [23]. However, a great
challenge of electrode fouling is observed during the oxidation of PAHs. This calls for
the use of polypyrrole polymer which prevents electrode fouling. It is worth noting
that over oxidizing the polypyrrole creates some nanopores on the surface of the
polymer thus creating room for the deposition of the nanoparticles [11]. Thus, the
fabrication of an electrochemical sensor based on overoxidized-polypyrrole and
silver-gold bimetallic alloy nanoparticles presents a novel, simple, cheap, less time
consuming, electrode fouling free and environmentally friendly method of detecting
the highly carcinogenic PAHs.

7
1.4 The aims and objectives of the research.
The project will investigate the electrocatalytic behaviour of silver-gold alloy
nanoparticles and the antifouling properties of overoxidized-polypyrrole towards the
oxidation of PAHs.
The objectives of the study are:
1) To chemically synthesize silver-gold alloy nanoparticles.
2) To characterize the synthesized alloy nanoparticles by UV-Visible
spectroscopy, fluorescence spectroscopy, transmission electron
microscopy (TEM), electrochemical impedance spectroscopy (EIS)
and cyclic voltammetry (CV).
3) To electrochemically synthesize polypyrrole and investigate its
electrochemical properties.
4) To electrochemically overoxidize the synthesized polypyrrole.
5) To develop silver-gold alloy nanoparticles/overoxidized-polypyrrole
composite on glassy carbon electrode (GCE) surface.
6) To study the electrochemical properties of the composite.
7) Apply the fabricated electrochemical sensor in the detection of PAHs.
In this study, a simple cheap and less time consuming procedure for preparing silver-
gold alloy nanoparticles/overoxidized-polypyrrole composite based sensor for novel
detection of anthracene, phenanthrene and pyrene is described. Pyrrole monomer
doped with 0.1 M LiClO4 was polymerized on glassy carbon electrode (GCE) to form
polypyrrole modified glassy carbon electrode (PPy/GCE). The polypyrrole was then
overoxidized in 0.1 M NaOH at positive potentials (1.0 V) for 420 s. Overoxidation of

8
the polymer is accomplished by a loss of conjugation, electronic conductivity and
dedoping with a net electronegative character imparted to the polymer film. Hence,
the small doping anions ejected from the overoxidized film, creates a porous structure
on the electrode. This creates room for the deposition of the nanoparticles. The
immobilization of the silver-gold (1:3) alloy nanoparticles on the overoxidized-
polypyrrole leads to the formation of silver-gold alloy nanoparticles/overoxidized-
polypyrrole composite (PPyox/Ag-AuNPs/GCE) which is thus used as the
electrochemical sensor for the detection of anthracene, phenanthrene and pyrene.

9
1.5 Research framework.
In line with the study objectives and the experimental procedure, the research
framework is shown on the scheme below.
Scheme 1. Research framework.
Selection of experimental procedure.
Preparation of chemicals.
Chemical synthesis of silver-gold alloy nanoparticles.
Characterization-TEM
-UV-vis spectrocopy -Fluorescence spectroscopy
-CV -EIS
Electrode preparation
• Electropolymerization of pyrrole on GCE
• Overoxidation of polypyrrole
• Drop-coating of silver-gold alloy nanoparticles on overoxidized
polypyrrole
Characterization. -CV
Sensor evaluation. Results and discussion.

10
1.6 Outline of the thesis.
The thesis will be presented as outlined briefly below:
An introduction giving various issues especially pollutants that affect human life and
which require continuous monitoring are raised in this chapter. Polyaromatic
hydrocarbons (PAHs) as one of the pollutants, their sources and their side effects are
briefly highlighted in this chapter. Various methods used in the determination of
PAHs are briefly discussed and the need for the use of electrochemical methods for
the determination of PAHs is mentioned in this chapter. The objectives of this study
are also stated in this chapter.
A literature review relating to the definition and sources of PAHs, their formation,
properties, toxicity, how they are exposed to humans and the various methods used in
their detection will be presented in chapter 2. This chapter will also cover a brief
introduction to conducting polymers and polypyrrole as one of the polymers as well
as the use of nanoparticles in the development of sensors. Characterization
techniques, mainly cyclic voltammetry (CV), square wave voltammetry (SWV),
electrochemical impedance spectroscopy (EIS), UV-visible spectroscopy,
fluorescence spectroscopy, and transmission electron microscopy (TEM) will be
discussed in this chapter. In chapter 3, information on the chemicals used,
instrumentation and preparation procedures will be discussed. The chapters 4 and 5
will present results and discussion, chapter 4 will mainly present and discuss the
characterization of the synthesized silver-gold (1:3) alloy nanoparticles, overoxidized-
polypyrrole and silver-gold alloy nanoparticles/overoxidized-polypyrrole composite.
Chapter 5 will present and discuss the electrochemical sensor response to some

11
monitored PAHs. It is also in this chapter that a detailed description of the sensor and
its analytical characteristics such as stability, detection limit, linear range and
reproducibility will be discussed. The final chapter, 6 will present the conclusions.

12
CHAPTER 2
2.0 LITERATURE REVIEW.
2.1 Polyaromatic hydrocarbons (PAHs).
2.1.1 Definition and sources of PAHs.
Polycyclic aromatic hydrocarbons (PAHs) also known as polyarenes are a diverse
group of organic compounds composed of hydrogen and carbon atoms arranged in
two or more fused benzene rings. They are widespread ubiquitous environmental
contaminants of anthropogenic or natural origin usually occurring in mixtures. The
natural sources of PAHs include natural fires, volcanic eruptions, thermal geological
reactions etc. [24]. Anthropogenic sources are the major sources of PAHs and this
include fuel oil or gasoline spills, natural seeps as well as the combustion of fossil
fuels such as coal, oil, and natural gas. The main source of PAHs is the incomplete
combustion of coal, oil and petrol as well as in processes involving the petrochemical
industries. They can also be found airborne, in the gas phase or adsorbed to airborne
particles, in aqueous phases, such as groundwater, wastewater or drinking water, and
adsorbed to solids in soil or sediments [25]. Crude oil and coal have also been
identified as sources of PAHs. The adverse effects of PAHs are as a result of their
persistence, hydrophobic character, bioaccumulation and carcinogenic properties.
Hence, due to their ubiquitous distribution, PAHs detection in water and soils has
arose a lot of concern and thus of ongoing interest to analytical chemists. They are
emitted in the atmosphere, adsorbed to particles, and may then be transported over
long distances [25]. According to Voogtp et al., [26] an estimated total input of

13
230,000 metric tons of PAHs is released annually to the aquatic environment. This is
mainly from spillage of fuels such as petroleum, oil and coal products causing a threat
to the aquatic life. Djomo et. al. [27] showed that PAHs have adverse toxic effects on
green alga and scenedesmus subspicatus once released into the aquatic environment.
2.1.2 Formation of PAHs.
PAH is a name commonly used to refer to numerous benzene rings connected to one
unit which can either be fused in a linear, angular, or clustered arrangement. The
simplest example is naphthalene having two benzene rings side by side while others
vary from two, three and more fused aromatic rings. The carcinogenic and mutagenic
potential of some of the PAHs and their ubiquity in the environment led to the
inclusion of 16 PAHs compounds in the list of priority pollutants in waste water
published by the United States (US) Environmental Protection Agency (EPA) 1984
[25, 28] and later adopted by the US government in 1988. Some of the 16 US EPA
priority PAHs are shown in Figure 1.

14
Naphthalene Anthracene Phenanthrene Benzo (a) anthracene
Benzo (a) pyrene Acenaphthylene Chrysene Pyrene
Fluorene Fluoranthene Acenaphthene Benzo[k]fluoranthene
Benzo[b]fluoranthene Benzo[g,h,i]perylene Indeno[1,2,3,-cd]pyrene
Dibenzo[a,h]anthracene Figure 1. The chemical structure of some common 16 US EPA priority PAHs.

15
PAHs are formed during organic combustion processes without sufficient amounts of
oxygen present (pyrolysis) and are found as a mixture of individual compounds [29].
The formation of PAHs can occur when parts of the fuel’s polycyclic hydrocarbon
backbone does not completely decompose or through high temperature processes of
smaller alkanes clustering together to form aromatic compound. Due to the toxicity,
persistency and environmental prevalence of PAHs [5], they have been thoroughly
studied. However, these studies have been limited to the above mentioned 16 PAHs,
designated as priority pollutants by the United States Environmental Protection
Agency (US EPA).
2.1.3 Properties of PAHs.
PAHs are grouped into two categories based on their molecular structure. Those with
up to four rings and below, belong to low molecular weight (LMW) while those with
more than four rings are high molecular weight (HMW). PAHs containing three or
less benzene rings (LMW) have a high vapour pressure and can normally be found in
the gas phase [25]. They are semi-volatile and exist in the atmosphere partly as
vapors, which are highly susceptible to atmospheric degradation processes. The semi-
volatile property of PAHs makes them highly mobile through out the environment via
deposition and re-volatilization between air, soil, and water bodies. They are thus
considered a regional pollutant. HMW PAHs are less volatile and condense on soot
particles formed during combustion, are primarily associated with particles in the
atmosphere and water and are less available for degradation [25]. PAHs are less
oxidized in the atmosphere due to their ability to condense on particles and this
enhances their transportation over long distances in the atmosphere and hence causes
them to be ubiquitous in the environment. They accumulate in the environment

16
because they are thermodynamically stable compounds as a result of their large
negative resonance energies; have low aqueous solubility, and adsorb to soil particles.
Because of these reasons, PAHs do not readily undergo natural environmental
processes including biodegradation. Therefore, PAHs persist for long periods under
many natural conditions in the contaminated environment [30].They are insoluble in
water but readily solubilize in organic acids and solvents implying that in aqueous
environment, they are found adsorbed on particulates. This is supported by Quantin et
al., [31] who argues that PAHs have high boiling points, are very lipophilic and are
hard to dissolve in water. As a result of their hydrophobicity and recalcitrance, they
accumulate in sediments in high concentrations. The low molecular weight PAHs are
more water soluble and volatile than the higher molecular weight compounds since
solubility of PAHs in water is inversely proportional to the number of rings they
contain. For example, three- ring PAHs tend to be more water soluble than the five-
ring compounds [32]. Due to their high partition coefficients and low water solubility,
these compounds can strongly adsorb on to the surface of porous media, such as
sediments and ground water [33-34]. In addition, the aqueous concentrations of PAHs
in the contaminated environments can accumulate at higher concentrations in the
presence of other organic compounds [35]. Mackay and Gschwend [35] showed that
concentrations of PAHs in groundwater at a coal tar site were elevated by factors of 3-
50 over purely dissolved concentration in water. These elevated concentrations of
PAHs could enter into human body via food webs, and cause hazards to human
health. Therefore, the investigation of concentration and distribution of PAHs in the
environment provides a valuable record for clinical diagnosis, risk assessment, and
the development of pre-warning system.
17
2.1.4 Characteristics of some of the monitored PAHs.
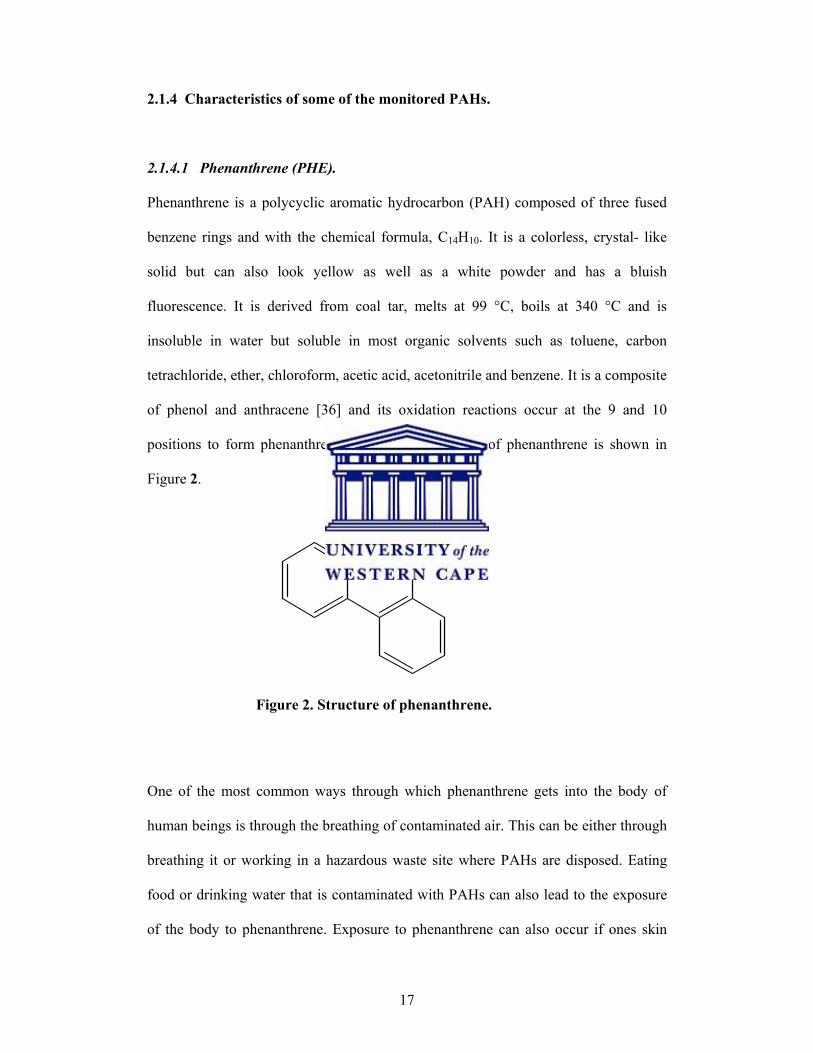
2.1.4.1 Phenanthrene (PHE).
Phenanthrene is a polycyclic aromatic hydrocarbon (PAH) composed of three fused
benzene rings and with the chemical formula, C14H10. It is a colorless, crystal- like
solid but can also look yellow as well as a white powder and has a bluish
fluorescence. It is derived from coal tar, melts at 99 °C, boils at 340 °C and is
insoluble in water but soluble in most organic solvents such as toluene, carbon
tetrachloride, ether, chloroform, acetic acid, acetonitrile and benzene. It is a composite
of phenol and anthracene [36] and its oxidation reactions occur at the 9 and 10
positions to form phenanthrenequinone. The structure of phenanthrene is shown in
Figure 2.
Figure 2. Structure of phenanthrene.
One of the most common ways through which phenanthrene gets into the body of
human beings is through the breathing of contaminated air. This can be either through
breathing it or working in a hazardous waste site where PAHs are disposed. Eating
food or drinking water that is contaminated with PAHs can also lead to the exposure
of the body to phenanthrene. Exposure to phenanthrene can also occur if ones skin

18
comes into contact with contaminated soil or products like soils, coal, coal tar, roofing
tar or creosote where PAHs are found [37]. It has also been found that breathing
cigarette and tobacco smoke, eating foods grown in contaminated soils or eating
grilled meat can expose one to phenanthrene [37]. Once it gets into the body, it
spreads and targets the fat tissues. The major target organs in the body include the
kidneys and the liver. However, in a matter of days, it leaves the body through urine
and feaces [37]. It has been identified as one of the priority pollutant by the United
States Environmental Protection Agency (USEPA) [38].
Other sources of PHE include incomplete combustion of fossil fuels, vehicular
emissions, municipal incinerators and coke plants. Oil and petrol spillage into water
bodies also results in the release of PHE to the environment [39-41]. It is widely
distributed throughout the environment and is one of the most frequent and abundant
PAHs found at contaminated sites [42].
2.1.4.2 Anthracene (AN).
It is a colorless solid polycyclic aromatic hydrocarbon consisting of three fused
benzene rings derived from coal-tar or other residues of thermal pyrolysis. It has the
chemical formula C14H10 and has been identified in surface and drinking water,
ambient air, smoke of cigarettes and cigars, foods, honey and edible aquatic
organisms. This compound comes originally from both natural and anthropogenic
sources involving incomplete combustion, aluminum smelting or the spillage of fossil
fuel. Most people are exposed to anthracene through some of the foods they eat.
Evidence indicates that anthracene is absorbed following oral and dermal exposure
[43]. Oil and petrol spillage into water bodies also results in the release of anthracene

19
in to the environment [43]. Its determination is vital due to its acute toxicity. Its
structure is shown in Figure 3.
Figure 3. Structure of anthracene
2.1.4.3 Pyrene (Py).
Pyrene is a colorless solid and a highly toxic polyaromatic hydrocarbon consisting of
four fused benzene rings, resulting in a flat aromatic system. It has the chemical
formula C20H12 and is formed during incomplete combustion of organic compounds.
It gets into the bodies of organisms through breathing contaminated air. Eating food
and drinking water that is contaminated with PAHs may also lead to its exposure [43].
Its structure is shown in Figure 4.
Figure 4. Structure of pyrene

20
2.1.5 Toxicological effects of PAHs.
2.1.5.1 Toxicity of PAHs.
PAHs have been reported to cause a decrease in body weight, enlarge liver with cell
edema and congestion of the liver parenchyma, reproductive toxicities, and
destruction of oocyte and inflammation of kidney cells. Developmental toxicities such
as embryo lethality, reduced fetal weight and malformations have been reported in
response to benzo(a)anthracene, benzo(a)pyrene, dibenzo(a,h)anthracene and
naphthalene [44]. Death in rodents has been reported to occur after short-time
exposure to high doses of PAHs. It is noteworthy that, no deaths have been reported
from short term occupational exposure in humans [45]. Since the environmental levels
are generally much lower than the occupational exposure, it is unlikely that short-term
exposures to PAHs would lead to death. Eye irritation, photophobia and skin toxicity
such as dermatitis and keratosis have been demonstrated in workers occupationally
exposed to PAHs. Respiratory effects, including acute and subacute inflammation and
fibrosis, have also been demonstrated experimentally. A number of PAHs have been
reported to cause tumors in laboratory animals that were exposed to PAHs through
their food, from breathing contaminated air and when it was applied to their skin. For
example, when pregnant mice ate high doses of benzo(a)pyrene, they experienced
reproductive problems [46]. Other effects include damage to skin, body fluids and the
immune system which help the body fight diseases and affects immunocompetence of
organisms as well as the skin of animals. Moreover, PAHs have been identified to
disrupt the sex hormones and posses developmental toxicity. They have effects on
sperm quality in males while in females they cause reproductive disfuctioning by the
destruction of oocyte. The testis and ovaries contain rapidly proliferating cells hence

21
are probably particularly susceptible to damage by PAHs [46]. Benzo(a)pyrene
(B[a]p) affects egg production in fish since they reduce primary oocyte numbers and
plasma testosterone as well as estrogen level. They are also considered to be
developmental toxicants. In animals, they are said to have the potential to induce
adverse developmental effects such as pregnancy terminations, malformations,
sterility in offsrings, testicular changes and immune-suppression and tumours [46].
2.1.5.2 Genotoxicity of PAHs.
Genotoxicity or mutagenicity is the ability of a foreign compound to effect a
structural rearrangement in the molecular structure of a deoxyribonucleic acid (DNA)
with its attendant implications. The primary focus of toxicological research on PAHs
has been on genotoxicity and carcinogenicity. According to Pickering et al., [46]
several PAHs have shown to damage DNA and to cause mutations thus causing
structural changes in the DNA. This occurs as a result of multiple metabolic
transformations that take place in the PAHs. These transformations mostly lead to the
formation of electrophilic derivatives capable of covalent interaction with
nucleophilic centers of macromolecules, which results in mutagenicity. Moreover, a
variety of chromosomal alterations such as frame shift mutations, deletion, s-phase
arrest stand breakage etc may also be induced as a result of bulky adduct of PAHs to
DNA bases [47]. In mammalian system, they are metabolized principally in the liver
to yield both detoxification products which are more polar and excretal, and
bioactivation products, which are more reactive and genotoxic. The original PAH
compound does not react with DNA but they require metabolic activation and
conversion to display their genotoxic properties. PAHs do not accumulate in the body
but are converted to more water-soluble forms, which facilitates their subsequent

22
excretion from the organism [46]. However, this may lead to the formation of reactive
intermediates that may react with DNA to form adduct, preventing the gene involved
from functioning normally. The DNA damage may be repaired, but if the repair fails,
i.e. if there is irreparable genetic damage, a mutation occurs.
2.1.5.3 Carcinogenicity of PAHs.
The interest on PAHs has been mainly due to their carcinogenic properties. PAHs
comprises the largest class of chemical compounds known to be cancer- causing
agents and are included in the European Union and United States Environmental
Protection Agency (EAP) Priority pollutant list due to their mutagenic and
carcinogenic properties [48]. Several works have been done on the carcinogenicity of
these compounds [49-50]. Many of these have been found to be positive (cause
cancer); some not cancer causing, may act as synergists [51]. Humans are exposed to
complex mixtures of PAHs which have been implicated in inducing lung, skin,
stomach and breast cancer. The carcinogenesis of PAHs is basically on their ability to
bind the DNA thereby causing a series of disruptive effects that end up in tumor
initiation. The aromatic hydrocarbon receptor plays a very important role in this.
PAHs biological effects are actually attributed to the oxidation process that occurs
during biotransformation of the mother compounds. PAH metabolites, including bay-
region diol epoxides and free radical cation intermediates formed by mono-
oxygenation and one-electron oxidation, respectively, are molecules that may bind to
cellular DNA forming covalent DNA adducts responsible for carcinogenic process.
The PAHs induced carcinogenesis is very complex and varies with individual
compound [49].

23
2.1.6 Human exposure to PAHs.
Human exposure to PAHs occurs through the smoking of tobacco, inhalation of
polluted air and ingestion of food and water contaminated by combustion effluents.
Emissions from the combustion of coal, diesel, petrol, kerosene, wood, biomass and
synthetic chemicals such as plastics also contribute to their publicity. The spillage/
leakage of oil, diesel and petrol into the water bodies during the process of
transportation may get their way into water bodies and affect aquatic life which may
consequently affect humans. Most of the PAHs released in the environment end up
being deposited in the oceans and/or subject to long range transport making them a
wide spread environmental problem which affects humans directly or indirectly. The
semi-volatile property of PAHs makes them highly mobile through out the
environment via deposition and re-volatilization between air, soil and water bodies. It
is therefore desirable in order, to put in place adequate clean up programmes for the
prevention and remediation of PAHs pollution in the environment to avoid public
health hazards. There are limits for work place exposure for chemicals that contain
PAHs such as coal tar and mineral oil. The Occupational Safety and Health
Administration (OSHA) has set a limit of 0.2 milligrams of PAHs per cubic meter of
air (0.2 mg m-3). The OSHA permissible exposure limit (PEL) for mineral oil mist
that contains PAHs is 5 mg m-3 averaged over an 8-hour exposure period. Likewise,
the National Institute for Occupational Safety and Health (NIOSH) recommends that
the average workplace air levels for coal tar products should not exceed 0.1 mg m-3
for a 10-hour workday, within a 40-hour workweek. There are other limits for
workplace exposure for compounds that contain PAHs, such as coal, coal tar, and
mineral oil [52].

24
2.1.7 Methods used in the detection of PAHs.
Several methods have been applied in the determination of PAHs. Some of the
commonly used methods include immunoassay [15], gas chromatography [16] and
high performance liquid chromatography (HPLC) with UV-vis absorbance or
fluorescence [53-54] and capillary electrophoresis (CE) equipped with laser-induced
fluorescence [19]. The drawback of these methods although the most accurate, are
that they are expensive, time consuming, require large sample volumes as well as
large amount of organic solvent with separation and extraction procedures, and must
be undertaken by an analytical chemist in a dedicated analytical laboratory [55].
Moreover, the low solubility of the highly hydrophobic hydrocarbons in water and
their occurrence in complex mixtures often require complex extraction,
preconcentration and separation procedures for the sensitive detection of PAHs.
Typical extraction methods applied are solid phase extraction (SPE), liquid-liquid
extraction and supercritical fluid extractions. In addition, large amount of organic
solvents used by the above techniques is environmentally unfriendly and raises
concerns regarding health hazards to analysts. Most immunoassays for PAHs
described in literature are enzyme linked immunosorbent assays (ELISA) [56-58],
although other techniques such as radioimmunoassay (RIA) [59-60], piezoelectric
immunosensor [61], capacitive immunosensor [62] and fluorescence based fiber
optical immunosensors [63] have also been investigated. However, the fact that many
PAHs are very similar in molecular structure, electron density and the lack of side
groups makes it impossible to produce antibodies specific for only one compound
[10]. This poses challenge in the application of immunoassays for determination of
PAHs. These limitations can be reduced or avoided by using biosensor systems.
Several biosensors including immunosensors, DNA biosensors and whole-cell

25
biosensors have been developed for the determination of PAHs [10, 64-67]. For
example, a disposable amperometric immunosensor using screen-printed electrode
was fabricated to detect low concentration of phenanthrene [10]. A soil biosensor
using a recombinant biolumiscent bacterium, Escherichia coli GC2, and rhamnolipids,
a biosurfactant, to increase the bioavailability of PAHs from the contaminated soil has
been developed [65, 67]. In addition, a flow injection analysis system coupled with an
evanescent wave biosensor for the detection of aromatic compounds that can
intercalate with dsDNA has been reported [66]. However, these biosensors are
designed for the determination of a single analyte in a sample at a time and lack the
opportunity for analysis of multiple samples in the presence of multianalytes [68].
Moreover, enzymes cannot oxidize PAHs with IP values above 8 eV, an indicator that
PAHs like fluorine whose IP value is above 8 eV cannot be determined [69].
Therefore, there is an ever-increasing demand for the determination of trace amounts
of these substances at plant sites, water bodies and air. This calls for the development
of a suitable and cost-effective analytical method that is able to carry out a rapid,
simple and sensitive analysis of PAHs in environmental samples as well as able to
detect more than one PAH in a sample. Electroanalytical methods are considered to be
better methods for the determination of PAHs and an efficient solution to
environmental problems compared to the other methods because a completely clean
reagent, i.e. the electron, is utilized [10, 70-71]. However, during the determination of
the PAHs using the electroanalytical methods, the problem of electrode fouling is
observed which affects the stability of the methods [72].
The use of polymer-nanoparticles composite for detection of PAHs has not been
reported. In this work, an electrochemical method for the determination of PAHs has

26
been developed by the use of overoxidized-polypyrrole and silver-gold alloy
nanoparticles immobilized on the surface of the glassy carbon electrode (indicator
electrode) and the modified electrode used as an electrochemical sensor to detect
some PAHs. This will involve the use of a three electrode cell (glassy carbon
electrode as the indicator electrode, Ag/AgCl as the reference electrode and Pt wire as
the counter electrode) as will be explained in the experimental section. The
polypyrrole is a conducting polymer and prevents electrode fouling thus enhancing
the stability and repeatability of the method while the nanoparticles acts as electro-
catalysts in the oxidation of the PAHs. The developed method is able to detect more
than one PAH in a mixture of PAHs. A brief summary of the use of conducting
polymers specifically polypyrrole and nanoparticles as electrode modifiers will be
outlined below (2.2 and 2.3):

27
2.2 Polymers.
Researchers from different fields are in a process of combining expertise to study
organic solids that poses remarkable conducting properties. Organic compounds with
the ability of effectively transferring charge can be divided into three main groups
namely; ion radical salts charge transfer complexes, organic species and conjugated
conducting polymers. In the past two decades, a new class of polymers known as
intrinsically conducting polymers or electro-active conjugated polymers has emerged.
These polymers have gained popularity due to their interesting electrical and optical
properties, which have previously been observed only in inorganic systems.
2.2.1 Conducting polymers (CPs).
The chemical bonding in conducting polymers produces one unpaired electron where
there is a π electron per carbon atom in the backbone of the polymer. The carbon
atoms are π bonded in a sp2pz configuration where the orbital of successive carbon
atoms overlap providing delocalization of the electrons along the backbone of the
polymer. Charge mobility is exerted along the backbone of the polymer as a result of
this electron delocalization introducing properties such as electrical conductivity, low
energy optical transitions, low ionization potential and high electron affinity. The π
bonds in conducting polymers are highly susceptible to chemical or electrochemical
oxidation or reduction processes. The formation of non-linear defects such as solitons,
polarons and bipolarons produced during doping and polymerization of a polymer,
have made a contribution to the electrical conduction in these polymer materials. An
increase in electrode modification as a result of these polymers has provided new and
interesting properties, which have contributed for the wide application of conducting
polymers. They can either be metallic conductors or semiconductors and have been

28
applied in charge storage devices (batteries, capacitors), electromagnetic screens,
sensors, membranes and corrosion protective coatings [73-75].
2.2.2 Synthesis of conducting polymers.
There are various available methods for the synthesis of conducting polymers, with
oxidative coupling of the monomer being the most widely used technique. This
technique involves the formation of a cation radical followed by another coupling to
produce a di-cation and the repetition then leads to the polymer [74]. Electro-
polymerization is normally carried out in a single cell compartment where a three-
electrode configuration is employed subjected to an electrochemical solution
consisting of a monomer and a supporting electrolyte (in some cases) all dissolved in
an appropriate solvent which in some cases is acidic. The polymerization can be
carried out either potentiostatically where the potential is kept constant with a
variation of the current with time, or galvanostatically by keeping the current constant
thereby monitoring the electrode potential. A three-electrode system employed during
the polymerization comprises of a working electrode, a counter electrode and a
reference electrode. Materials such as gold, platinum, carbon, nickel, titanium and
palladium are used as working electrodes and function as support systems for the
polymer films. Counter electrodes on the other hand supply the current required by
the working electrode. A few commonly used counter electrodes include metallic foils
of nickel, platinum and gold. Reference electrodes such as saturated calomel electrode
(SCE), silver/silver chloride and mercurous sulfate are used in aqueous media [73].
Conductivity of the polymer is influenced by a number of factors including polaron
length, the conjugation length, and the overall chain length and by the charge transfer
to adjacent molecules. Research has proved that electrochemical synthesis is rapidly

29
becoming the preferred method for polymer preparation due to the simplicity and
reproducibility associated with this technique. One advantage associated with the
electrochemical polymerization of conducting polymers is that their reactions can be
carried out at room temperature either by varying the potential or the current and with
time the thickness of the film can be monitored and controlled. Besides copolymers
and graft copolymers, electrochemical synthesis can be used for the generation of free
standing, homogeneous and self doped films. Conducting polymers (CPs) such as
polypyrrole, polythiophene, polycarbazole, polyindole and polyazulene can be
synthesized using this technique [76]. However, in this work, major focus has been
given to polypyrrole.
2.2.2.1 Polypyrrole (PPy).
Of all known CPs over the last 20 years, polypyrrole has appeared as the most
extensively studied conducting polymer and the most frequently used because its
monomer pyrrole is easily oxidized, water soluble, commercially available and the
PPy posses good environmental stability, good redox properties, high electrical
conductivity, simplicity of synthetic procedures and the possibility of forming
homopolymers or composites with optical chemical and physical properties [77].
However, its insolubility in organic solvents hinders its processability. The electrical
conductivity of conducting polymers is achieved in the film of the conducting
polymers by oxidation (p-doping) or reduction (n-doping), followed respectively by
the insertion of anionic or cationic species [78] according to the following procedure:

30
N
H
N
H
N
H n
+
AN
H
N
H
N
H n
+Reduce
OxidizeA
0
Scheme 2. Procedure of ion exchange behavior of conducting polymer
Due to the double bond alternation in the conjugated polymer backbone, the charged
species formed upon doping are able to move along the carbon chain (delocalization)
allowing electron transport and thus giving an electronically conductive material [79].
Thus, the hoping of electrons along and across the polymer chains with conjugating
bonds gives PPy its electrical conductivity [77]. As a result, more positive PPy, more
electron holes available, longer polymer chains and more coplanarity between
interchains, are favoured for a higher conductivity performance [75].
PPy is a black powder and can be prepared by chemical or electrochemical
polymerization. In the chemical polymerization process, monomers are oxidized by
oxidizing agents or catalysts to produce conducting polymers while under
electrochemical polymerization, PPy films are prepared by anodic
electropolymerization of pyrrole in either non-aqueous or aqueous media on
substrates such as glassy carbon or indium tin oxide (ITO). This can be done either
through potentiostatic (constant potential), cyclovoltammetric and galvanostatic
(constant current) methods. However, the principal advantage of the electrochemical
method is related to the better conducting properties and long-term stability of
conductivities [75]. Moreover, electrochemical polymerization provides a better

31
control of film thickness and morphology and cleaner polymers compared to chemical
oxidation [77].
The number of electrons involved in the polypyrrole polymerization process for each
monomer is approximately 2.25, one for each of the two α positions to form the
polymer and another one for every four monomer units to form the doped polymer.
Similarly; one anion per four monomer units is incorporated during doping to
maintain charge neutrality [80]. In the undoped state (pristine), neutral PPy is
generally non-conducting having the aromatic and quinoid structures of which the
latter posses a higher energy configuration. Generally, the redox mechanism of
polypyrrole is described by one-electron transfer step; [81].
PPy PPy+ + e- (1)
where PPy is the neutral species and PPy+ is the radical cationic species or polaron
(one positive charge localized over three to four monomer units). The polaron can
further be oxidized;
PPy+ PPy++ + e- (2)
PPy++ is the dicationic species or bipolaron (two positive charges localized over three
to four monomer units). In the presence of dopant, where the dopant maintains
electrical neutrality of the polymer during polymerization, the doped form (oxidized)
is formed which manifest as either a polaron and/or bipolaron depending on the
doping level as follows:
PPy + X- (s) → PPy+X- + e- polaron (3)
PPy ++ 2X-(s) → PPy2+(X-)2 + e- bipolaron (4)

32
where X- are anions, (the subscript (s) indicates that they are in solution phase) and
PPy represents a segment of the polypyrrole chain. The synthesis of polypyrrole from
solutions containing its monomer, pyrrole, may be represented by the simplified
process [77]:
N
H
N+
H
N
H
N
H
N
H
N
H
N
H
N
H
N
H
n
Oxidize Polymerize
Monomer polymer
Scheme 3. Synthesis of polypyrrole from pyrrole monomer.
During electrochemical synthesis of PPy, the properties of the deposited film on the
electrodes depend on the polymerization conditions. The solvent and the supporting
electrolyte affect the film morphology, conductivity and mechanical behaviour.
According to Said et al., [77] the electropolymerization potential also affects the
formation and the properties of polypyrrole films. At high positive potentials, the PPy
can be overoxidized expelling the doping ions from the backbone of the polymer and
thus loosing its electrochemical conductivity. However, overoxidized-polypyrrole
(PPyox) is an excellent material used as a matrix for deposition of metal
nanoparticles, as it consists of nano-pores within the polymer film [11].

33
2.2.2.2 Overoxidation of polypyrrole.
Polypyrrole undergoes overoxidation at positive potentials, and/or at more alkaline
media, and has been regarded as an undesirable degradation process, since it leads to
the loss of conductivity and dedoping [11]. This means that dopant anions are
expelled into the solution phase, leaving the polymer in its neutral, non-conductive
state being susceptible to nucleophilic attack. Furthermore, some literature reviews
have pointed out that, in aqueous solution, the PPy overoxidation potential depends on
the solution pH whereby the higher the pH, the lower the overoxidation potential is.
Indeed, PPy overoxidation process is more effective in basic solution (NaOH) than in
NaCl solution [82]. In sodium hydroxide solution, the overoxidation of polypyrrole
film proceeds faster than in pH buffer solutions because hydroxide ions in sodium
hydroxide solution act as nucleophilic reactants which are stronger than anionic
species present in buffer solutions [83]. During the overoxidation of pyrrole, higher
density carbonyl groups such as >C=O and –COO- are generated on the backbone of
the overoxidized-polypyrrole film (PPyox-film). This is favorable for cation species
(+) to be accumulated onto the film and then catalytically oxidized at the electrode.
This allows favorable conditions for chemical interactions between the PPyox surface
and the approaching species. The overoxidation of polypyrrole from basic solutions
where the dopant (A−) is ClO4
− may be represented by the simplified process:
N
H
N
H
N
H
N
H
N
H
N
H
N
HA-
A
Overoxidation
A-
A = ClO4
PPy
N
H
N
H
N
H
N
N
H
N
H
N
H
PPyox
O
2 H++ A
Scheme 4. Overoxidation of polypyrrole.

34
It is noteworthy that this transformation of PPy as a result of overoxidation is
accomplished by a loss of conjugation, electronic conductivity and dedoping with a
net electronegative character imparted to the polymer film. Hence, the small doping
anions ejected from the PPyox film, creates a porous structure on the electrode [11].
The PPy film improves selectivity, cation permselective behavior and the efficiency
of PPyox in suppressing interfering electroactive species and avoiding electrode
fouling [11]. The high permselectivity of overoxidized polypyrrole films allows
analytes to reach the surface of electrodes easily.
For conducting polymers, the thickness of the film determines the conductivity and
the permeability of the polymer film. The thinner the thickness of the overoxidized
PPy film, the shorter the response time and a higher sensitivity can be achieved. This
can be achieved by controlling the electropolymerization parameters such as the
number of cycles used during polymerization. Thus, the thickness of the PPyox
polymer can be controlled. The formation of the porous structure on the working
electrode surface by the overoxidized-polypyrrole enables easy deposition of
nanoparticles leading to the formation of a polymer-nanoparticles composite with
antifouling properties. The deposited nanoparticles increase the rate of electron
transfer and acts as electro-catalysts. Nanoparticles have found great application in the
fabrication of electrodes as outlined in 2.3 below.

35
2.3 Monometallic and bimetallic nanoparticles.
Noble metallic nanomaterials are of particular interest today because of their
application in many areas. They are widely used in the development of
electrochemical sensors and biosensors as described below:
2.3.1 Application of nanoparticles in electrochemical sensors and biosensors.
The unique chemical and physical properties of nanoparticles make them extremely
suitable for designing new and improved sensing devices, especially electrochemical
sensors and biosensors. Many kinds of nanoparticles, such as metal, bimetallic, oxide
and semi-conductor nanoparticles have been used for constructing electrochemical
sensors, for example, an electrochemical sensor for the determination of trace Cr(VI)
was developed by the use of gold nanoparticles modified on glassy carbon electrode
[84]. It has been shown that metal nanoparticles provide three important functions for
electroanalysis; improved mass transport, high effective surface area and catalytic
properties [85]. Due to their unique catalytic properties, they have been used as
catalysts and electrocatalyst. For example, an electrochemical nitrate sensor was
developed by the modification of glassy carbon electrode with Au-Fe(III)
nanoparticles [86]. Silver-gold bimetallic nanoparticles immobilized on the surface of
glassy carbon electrode have been used in the electrocatalytic oxidation of glucose
(electrochemical glucose sensor) [87]. Biosensors have also been fabricated based on
nanoparticles whereby certain enzymes have been attached on nanoparticles-modified
electrodes. For example, an electrochemical biosensor has been developed by the
immobilization of superoxide dismutase (SOD) on gold nanoparticles modified
indium /tin oxide film coated glass [88]. Moreover, Xinhuang kang developed a novel
glucose biosensor based on immobilization of glucose oxidase in chitosan on GCE

36
modified with gold-platinum alloy nanoparticles [89]. Hence, these nanoparticles
which can either be monometallic or bimetallic play different roles in different
sensing systems. They have excellent conductivity and catalytic properties which
make them act as “electronic wires” to enhance the electron transfer between redox
centers in proteins and electrode surfaces, and as catalysts to increase electrochemical
reactions. Oxide nanoparticles are often used as labels or tracers for electrochemical
analysis. According to Xiliang Luo et al., [85] monometallic and bimetallic
nanoparticles have several functions in electrochemical sensors and biosensors as
outlined below:
2.3.1.1 Immobilization of biomolecules.
Nanoparticles have large specific surface area and high surface free energy. This
enables them to adsorb biomolecules strongly and play an important role in the
immobilization of bimolecules in biosensor construction. The nanoparticles enable the
biomolecules which are adsorbed on the surface of the electrodes to retain their
biocompatibility. This is because they are highly compatible with the biomolecules
since most of them carry charges and can electrostatically adsorb biomolecules with
different charges. Besides their common electrostatic aspects, some nanoparticles can
also immobilize biomolecules by other interactions. For example, gold nanoparticles
have been reported to immobilize proteins through the covalent bonds formed
between the gold atoms and amide groups and cysteine residues of proteins [90-91].
Other nanoparticles such as Pt, Ag, TiO2, ZrO2 and bimetallic nanoparticles such as
Ag-Au and Au-Pt alloy nanoparticles have also been applied in the immobilization of
enzymes. Electrochemical immunosensors based on the immobilization of antigen or
antibody with nanoparticles has also been extensively applied. For example, Zhuo et

37
al. [92] developed a reagentless amperometric immunosensor based on the
immobilization of ά-1-fetoprotein antibody onto gold nanoparticles and the
immunosensor exhibited good long-term stability. Generally, immobilization of
biomolecules with certain nanoparticles can effectively increase the stability and
maintain the activity of biomolecules and can be a good option for bimolecular
immobilization [85].
2.3.1.2 Catalysis of electrochemical reactions.
Many nanoparticles, especially metal nanoparticles have excellent catalytic properties.
The introduction of nanoparticles with catalytic effects into electrochemical sensors
and biosensors can decrease overpotentials of many analytically important
electrochemical reactions and even realize the reversibility of some redox reactions,
which are irreversible at common unmodified electrode. For example, Ohsaka and
Coworkers [93] developed an electrochemical sensor for selective detection of
dopamine in the presence of ascorbic acid which was based on the catalytic effect of
gold nanoparticles on the ascorbic acid oxidation. This resulted in the decrease of the
oxidation overpotential of ascorbic acid and the effective separation of the oxidation
potentials of ascorbic and dopamine, thus allowing the selective electrochemical
detection. Several nanoparticles and bimetallic nanoparticles have been used as
catalysts and electrocatalysts. For example, Tianyan et al. [94] prepared a highly
sensitive H2O2 sensor based on the modification of carbon film electrode with Pt
nanoparticles. Bimetallic Ag-Au alloy nanoparticles have also been used as
electrocatalyst in the electrocatalytic oxidation of glucose [87].

38
2.3.1.3 Enhancement of electron transfer.
Enzymes usually lack direct electrochemical communication with electrodes since the
active centers are surrounded by considerably thick insulating protein shells, hence
blocking the electron transfer between electrodes and the active centers. Conductivity
properties of nanoparticles, mostly metal nanoparticles at nanoscale dimensions
makes them suitable for enhancing the electron transfer between the active centers of
enzymes and the electrodes. They act as electron transfer “mediators” or “electrical
wires” e.g. Ag and Au nanoparticles have good conductivity and have been used to
enhance electron transfer between proteins and electrodes [95].
2.3.1.4 Labeling biomolecules.
The labeling of biomolecules, such as antigen, antibody and DNA with nanoparticles
plays an increasingly important role in developing sensitive electrochemical
biosensors. Biomolecules labeled with nanoparticles can retain their bioactivity and
interact with their counterparts and based on the electrochemical detection of those
nanoparticles, the amount or concentration of analytes can be determined. Metal
nanoparticles labels can be used in both immunosensors and DNA sensors. Gold
nanoparticles are the most frequently used among all the metal nanoparticles labels
available. For example Limoges’s group [96] has reported a sensitive electrochemical
immunosensor for goat immunoglobulin G (igG) based on a gold nanoparticles label.
2.3.1.5 Nanoparticles acting as reactant
Nanoparticles are chemically more active than the related bulk materials due to their
high surface energy. For example, MnO2 is known to catalyze the decomposition of
H2O2, while MnO2 nanoparticles can react with H2O2 directly [97]. However, the

39
application of the special reactivity of electrochemical sensors and biosensors has not
been extensively studied.
2.3.2 Bimetallic nanoparticles.
Metal nanoparticles can either be monometallic or bimetallic. Bimetallic nanoparticles
are nanoparticles made up of two metal nanoparticles and have been reported to have
higher catalytic properties compared to their corresponding monometallic
nanoparticles due to their increased surface area [98]. There are two types of
bimetallic nanoparticles namely; alloy nanoparticles and core-shell nanoparticles. The
difference between the two arises from their method of preparation where bimetallic
alloy nanoparticles are as a result of simultaneous reduction of the metal salts to
nanoparticles while core-shell nanoparticles result from successive reduction of the
more noble metal salt followed by the reduction of the less noble metal salt. The alloy
nanoparticles are homogeneously distributed over the whole volume on an atomic
scale; however, the core-shell metal nanoparticles constitute the core of the structure
and the other one the external shell.
Bimetallic nanoparticles are of considerable interest since they posses interesting size-
depended electrical, chemical and optical properties [99]. They are of special
importance in the field of catalyst, since they often exhibit better catalytic properties
than their monometallic counterparts [23].

40
2.3.3 Silver-gold bimetallic alloy nanoparticles (Ag-AuNPs).
2.3.3.1 Preparation methods for Ag-AuNPs.
Many methods have been reported for the synthesis of Ag-Au alloy nanoparticles.
This is because Ag and Au have very similar lattice constants and are completely
miscible over the entire composition [100] hence are able to form alloy nanoparticles
upon reduction of their metal salts. They have been synthesized by the use of
chemical and electrochemical methods. Electrochemical methods involve the
reduction of their metal salts by the application of electric potential while in chemical
synthesis, reducing agents are used. The use of strong reducing agents such as sodium
borohydride (NaBH4) has been reported to yield smaller particles compared to the use
of weak reducing agents such as sodium citrate which results in the production of
larger particles [101]. For example, a simple co-reduction of HAuCl4 and AgNO3 with
sodium citrate in aqueous solution has been reported to yield 17 to 22 nm sized alloy
nanoparticles [102] while using NaBH4 as the reducing agent yielded stable Ag-Au
alloy nanoparticles of 2-3 nm which were stabilized using optically transparent
inorganic imogolite fibers [103]. However, the use of sodium citrate is preferred since
the reductant can easily be decomposed to carbon dioxide and it is not as toxic as
NaBH4. Moreover, the sodium citrate acts as a reducing agent as well as a stabilizing
agent compared to the use of NaBH4 which requires a stabilizing agent. A stabilizing
agent is of great importance in the synthesis of nanoparticles to prevent agglomeration
of the nanoparticles, which lowers their catalytic properties. According to Masato et
al., [87] electrochemical properties and the electrocatalytic property of Ag-Au alloy
nanoparticles with different Ag and Au composition depends on the composition of
Ag in the bimetallic alloy nanoparticles. Increasing the amount of Ag content in the

41
bimetallic alloy nanoparticles, would show no improved electrocatalytic reactions.
Thus, a high Ag content above 70% in the bimetallic alloy nanoparticles showed low
electrocatalytic properties [87]. However, Ag-Au bimetallic alloy nanoparticles with
low Ag content have been observed to show improved electrocatalytic properties.
Masato et al. showed that Ag-Au bimetallic alloy with Ag:Au atomic ratio 27:73 had
higher electrocatalytic properties compared to the other Ag:Au alloy nanoparticles
[87]. Aiqin Wang et al. [104] and Xhiang et al. [105] showed that Ag-Au bimetallic
alloy nanoparticles portrayed better electrocatalytic properties when Ag:Au was in the
ratio of 1:3 (25:75). On this basis, more focus has been on the synthesis,
characterization and the application of Ag-Au with an Ag: Au atomic ratio of 25:75
(1:3).
2.4 Chemical sensors.
A chemical sensor can be defined as “ a small device that as a result of a chemical
interaction or process between the analyte and the sensor device transforms chemical
or biochemical information of a quantitative type into an analytically useful signal ”
[106]. Chemical sensors consist of a transducer, which transforms the response into a
detectable signal on modern instrumentation, and a chemically selective layer, which
isolates the response of the analyte from its immediate environment. They are
classified according to the property that is being determined such as; electrical,
optical, mass or thermal properties and are designed to detect and respond to an
analyte in the gaseous, liquid or solid state. Compared to optical, mass and thermal
sensors, electrochemical sensors are highly attractive because of their remarkable
detection capability, experimental simplicity and low cost. They have a leading
position among the presently available sensors that have reached the commercial

42
stage and which have found a vast range of importance in the fields of clinical,
industrial, environmental and agricultural analyses [107].
2.4.1 Electrochemical sensors
Electrochemical sensors operate by reacting with the analyte of interest and producing
an electrical signal proportional to the analyte concentration. There are three types of
electrochemical sensors: namely; potentiometric, conductometric and amperometric
sensors.
2.4.1.1 Potentiometric sensors.
Potentiometric sensors have found the most widespread practical applicability since
early 1930’s due to their simplicity, familiarity and cost. They involve the
establishment of a local equilibrium at the sensor surface, where either of the
electrode or membrane potential is measured, and information about the composition
of the sample is obtained from the potential difference between reference electrode
and the indicator electrodes [107]. Basically, in potentiometric sensors, the potential
difference between the reference electrode and the indicator electrode is measured
without polarizing the electrochemical cell, that is, very small current is allowed. The
reference electrode is required to provide a constant half-cell potential. The indicator
electrode develops a variable potential depending on the activity or concentration of a
specific analyte in solution. The change in potential is related to the concentration of
the analyte in a logarithmic manner [108]. Potentiometric devices can be categorized
into three basic types:
i) Ion-selective electrodes (ISE)
ii) Coated wire electrodes (CWE)

43
iii) Field effect transistors (FET).
The ion-selective electrode is an indicator electrode capable of selectively measuring
the activity of a particular ionic species. In classic configuration, ISE are mainly
membrane-based devices, consisting of permselective ion-conducting materials,
which separate the sample from the inside of the electrode. One of the electrodes is
the working electrode whose potential is determined by its environment while the
second electrode is a reference electrode whose potential is fixed by a solution
containing the ion of interest at a constant activity. Since the potential of the reference
electrode is constant, the value of the potential difference (cell potential) can be
related to the concentration of the dissolved ions.
Under classical CWE design, a conductor is directly coated with an appropriate ion-
selective polymer (usually poly(vinyl chloride), poly (vinylbenzyl chloride) or
poly(acrylic acid)) to form an electrode system that is sensitive to electrolyte
concentration. The design eliminates the need for a reference electrode.
The field effect transistor (FET) is a solid-state device that exhibits high input
impedance and low- output impedance hence capable of monitoring charge build up
on the ion sensing membrane. Polymer matrix (electrode modifiers) of the
potentiometric sensors can be altered by the immobilization of biological/biomedical
materials leading to the development of potentiometric biosensors [107].

44
2.4.1.2 Conductometric sensors.
These are sensors that depend on changes of electric conductivity of a film or a bulk
material whose conductivity is affected by the analyte present. Conductometric
sensors are cheap, simple and no reference electrodes are needed. Analytes are
determined based on the measurement of conductivity.
2.4.1.3 Amperometric sensors.
Amperometry is a method of electrochemical analysis in which the signal of interest
is a current that is linearly dependent upon the concentration of the analyte. As certain
chemical species are oxidized or reduced (redox reactions) at inert metal electrodes,
electrons are transferred from the analyte to the working electrodes or to the analyte
from the electrode. The direction of electron flow of electrons depends upon the
properties of the analyte and can be controlled by the electric potential applied to the
working electrode [108]. The basic instrumentation of these sensors requires
controlled-potential equipment and the electrochemical cell consists of three –
electrode cell; namely, working electrode, reference electrode and counter electrode.
The working electrode is the electrode at which the reaction of interest occurs, the
reference electrode provides a stable potential compared to the working electrode
while an inert conducting material (e.g. platinum, graphite) is used as the counter
electrode (auxiliary electrode). A supporting electrolyte is required in controlled-
potential experiments to eliminate electro migration effects, decrease the resistance of
the solution and maintain the ionic strength constant. The working principle of an
electrochemical sensor is described below (scheme 5):

45
Electrode
Immobilized layer Scheme 5: A schematic picture of an electrochemical sensor.
The analyte molecules interact with the immobilized layer interface (e.g polymers,
nanoparticles, enzymes etc) in a lock and key mechanism to generate an electrical
signal through the chosen transducer. The generated signal is amplified and monitored
with an artificial intelligence such as computer hardware/software to produce
measurable analytical signal. The signal can be in the form of current, potential or
impedance. Furthermore, it is possible to change the properties of the sensor by
changing parameters (e.g. sensing material or temperature) during manufacturing or
operation of the sensor in order to improve selectivity and sensitivity. If the signal is
in the form of current, the current can be measured at a fixed potential or potential
difference across an electrochemical cell is scanned from one preset value to another
and the cell current is recorded as a function of the applied potential. The rate of flow
of electrons is proportional to the analyte concentration. The working electrode can be
modified with different materials such as polymers, nanoparticles or composites of
Current
Potential
Impedance

46
polymers and nanoparticles etc to increase its sensitivity and reduce electrode fouling
of reduced or oxidized species.
2.5 Characterization techniques.
2.5.1 Electroanalytical techniques.
Electrochemistry affords some of the most sensitive and informative analytical
techniques in the chemists arsenal. Electroanalytical methods such as cyclic
voltammetry, stripping voltammetry, differential pulse polarography, square wave and
chronoamperometry complements other analytical techniques such as
chromatography and spectroscopy and are not only capable of assaying trace
concentrations of an electroactive analyte, but also supply useful information
concerning its physical and chemical properties. Electrochemical methods of analysis
include all methods of analysis that measure current, potential and resistance and
relate them to analyte concentration. Quantities such as oxidation potentials, diffusion
coefficients, electron transfer rates, and electron transfer numbers are readily obtained
using electroanalytical methods, and are difficult to obtain using other techniques.
Arguably, the most popular electroanalytical techniques are cyclic voltammetry and
square wave. This section describes the basic components of the modern
electroanalytical system, the principles of cyclic voltammetry and square wave
voltammetry.
2.5.1.1 Basic components of an electroanalytical system.
The basic components of a modern electroanalytical system for voltammetric
measurements are a potentiostat, a computer, and the electrochemical cell. The role of

47
the potentiostat is to apply accurate and controlled potential and monitor the current
produced. The electrochemical cell, where the electrochemical measurements are
carried out, consists of a working (indicator) electrode, reference electrode, and
counter (auxiliary) electrode. The working electrode is where the reaction or transfers
of interest take place hence usually referred to as the indicator electrode. In this three-
electrode system, voltage is carefully regulated between the working and reference
electrodes, while the current passes between the working and the counter electrode. It
is noteworthy that at no time does current pass through the reference electrode; this is
ensured by the use of a potentiostat. The arrangement of the three electrodes in an
electrochemical cell is presented in Figure 5 and described below:
Figure 5. Schematic representation of an electrochemical cell consisting of three
electrodes.
Electrochemical cell and Reagents- The arrangement of the electrodes within the
cell is important. The reference electrode is placed close to the working electrode and
located between the working and the auxiliary electrode. The cell material depends on
the application, usually a glass beaker or a glass cell is used which has a close fitting

48
lid containing ports for electrodes and a purging line. If the reaction being
investigated involves a potential sweep in the negative direction then the reduction of
oxygen may interfere. To avoid this, the solution is deoxygenated, usually achieved
by purging the solution with an inert gas such as nitrogen, argon or helium prior to
analysis, and blanketing the solution with the gas during analysis. Electrolyte
solutions are combinations of solvent and supporting electrolyte. The choice of the
electrolyte solution depends on the application. In general, the solution must be
conducting, chemically and electrochemically inert. It should not contribute to any
chemical reactions and must not undergo any electrochemical reaction. The most
common electrolyte solution is water with an added salt or buffer. In some studies
usually organic electrode processes, the system may be non-aqueous. Acetonitrile or
dimethyl sulphoxide (DMSO) are common organic solvents. Supporting electrolytes
added to aid in conductivity include tetrabutylammonium hexafluorophosphate,
tetrabutylammonium tetrafluorophosphate (TBAPF4), lithium perchlorate etc.
Electrodes- As with electrolyte solution, the cell geometry, and potential waveform
applied and the choice of electrode depends on the application. The choice of the
working or indicator electrode is of great importance. The shape of the electrode is
important, in terms of its size or any modification to the surface. The common
electrodes used are:
i) Working electrode (indicator electrode) - this is the electrode at which the redox
of the analyte or the electrochemical phenomena investigated takes place. The
commonly used materials for working electrodes include platinum, gold and glassy
carbon. The ideal characteristics of an indicator electrode are a wide potential range,
low resistance and a reproducible surface.

49
ii) Reference electrode- this is the electrode with a constant and a known potential.
Its potential is taken as the reference, against which the potentials of the other
electrodes are measured. The commonly used reference electrodes for aqueous
solutions are the saturated calomel electrode (SCE) and silver/silver chloride
(Ag/AgCl).
iii) Counter electrode (auxiliary electrode) - It acts as a sink for electrons so that
current can be passed from the external circuit through the cell. Reactions occurring at
the counter electrode surface are unimportant as long as it conducts current well. In
most cases the counter electrode consists of a metallic foil or thin platinum wire,
although gold and sometimes graphite may be used.
2.5.1.2 Cyclic voltammetry (CV).
Cyclic voltammetry is a widely used electroanalytical technique that uses
microelectrodes and unstirred solution so that measured current is limited by the
analyte diffusion at the electrode surface. It has wide applications in the study of
redox processes, electrochemical properties of analytes in solution and for
understanding reaction intermediates as well as for obtaining the stability of reaction
products [109]. The technique works by varying some applied potential at a working
electrode at some scan rate (v) in both forward and reverse direction while monitoring
the current. The resultant trace of current against potential is termed as a
voltammogram. During cyclic voltammetry measurement, the potential is ramped
from an initial potential, Ei to a more negative or positive potential but, at the end of
the linear sweep, the direction of the potential scan is reversed, usually stopping at the
initial potential , Ei (or it may commence an additional cycle) [110]. The potential is
usually measured between the reference electrode and the working electrode and the

50
current is measured between the working electrode and the counter electrode
(auxiliary electrode). This data is then plotted as current versus potential as shown in
Figure 6. The forward scan produces a current peak for any analyte that can be
reduced or oxidized depending on the initial scan direction over the range of potential
scanned. The current increases as the current reaches the reduction potential of the
analyte, but then decreases as the concentration of the analyte is depleted close to the
electrode surface. If the redox couple is reversible, then reversing the applied potential
makes it reach a potential that re-oxidizes the product formed in the first reduction
reaction, thus producing a current of reverse polarity from the forward scan. The
oxidation peak usually has the same shape as that of the reduction peak. As a result,
the information about the redox potential and the electrochemical reaction rates of
compounds can be obtained. For instance, if the electron transfer is fast at the
electrode surface and the current is limited by the diffusion of species to the electrode
surface, then the peak current is proportional to the square root of the scan rate (v½).

51
Figure 6. A typical cyclic voltammogram
Important parameters are usually obtained from cyclic voltammograms for analysis of
redox properties of an electroactive sample. These parameters include peak potentials
(Epc, Epa) and peak currents (Ipc, Ipa) of the cathodic and anodic peaks, respectively.
Consequently, important information about the sample under investigation can be
obtained from the above peak parameters. This includes whether the electrochemical
process displayed by the sample is reversible, irreversible or quasi –reversible. It also
gives an insight into how fast the electron process is, relative to other processes such
as diffusion. For instance, if the electron transfer is fast relative to the diffusion of
electroactive species from the bulk solution at the surface of the electrode, the
reaction is said to be electrochemically reversible and the peak separation (ΔEp) is
given by equation 5 below;

52
ΔEp = | Epa - Epc | = 2.303 RT / nF (5)
Where ΔEp is the peak separation (V), Epa is the anodic peak potential (V), Epc is the
cathodic peak potential (V), n is the number of electrons, F is the Faraday constant
(96 486 C mol-1), R is the gas constant (8.314 J mol-1 K-1) and T is the absolute
temperature of the system (298 K). The number of electrons (n) involved in the
electrochemical process can be estimated from the above equation. Thus, for a
reversible redox reaction at 25 °C (298 K) with n electrons, ΔEp should be 0.0592/n V
or about 60 mV for one electron. In practice, this value is difficult to attain because of
cell resistance. Irreversibility due to a slow electron transfer rate results in ΔEp >
0.0592/n V, possibly, greater than 70 mV for a one-electron reaction [111]. The
diagnostic tests for electro-reversibility are listed in Table 1.
Table 1: Diagnostic tests for the electrochemical reversibility of a redox couple,
carried out by cyclic voltammetry.
1. Ipc = Ipa
2. The peak potentials , Epc and Epa , are independent of the scan rate (v)
3. The formal potential (Eº′) is positioned mid-way between Epc and Epa, so
Eº′ = (Epa + Epc) / 2.
4. Ip is proportional to v½
5. The separation between Epc and Epa is 59 mV/n for an n-electron
couple (i.e. ΔEp = | Epa - Epc | = 0.0592/n V).

53
For reversible reaction, the concentration is related to peak current by the Randles-
Sevčik equation (at 25 °C) [109-110].
02
12
12
35p 1069.2 CvADnI (6)
Where Ip is the peak current in amperes, v is the rate at which the potential is swept in
V s-1, A is the electrode area (cm2), n is the number of electrons transferred, D is the
diffusion coefficient (cm2 s-1), pa is peak anodic, pc is the peak cathodic and 0C is the
concentration in mol cm-3. Several voltammograms performed at different scan rates
can lead to preparation of several linear plots whose slopes could give further
information about the redox properties of the sample in question. For, instance, when
the peak current is plotted against the square root of the scan rate, the slope of the
linear plot can be used to estimate the diffusion coefficient according to the Randles-
Sevčik, equation (6) shown above. When plotted, the log of peak current versus the
log of scan rate gives a linear plot whose slope distinguishes between diffusion
controlled peaks, adsorption peaks or even a mixture of the two. A plot of the Log Ip
versus log v is linear, with a slope of 0.5 for diffusion peak and a slope of 1 for an
adsorption peak. Intermediate values of the slope are sometimes observed, suggesting
a “mixed” diffusion-adsorption peak [111].
In some cases, the sample to be characterized may be deposited on the surface of the
electrode (chemically modified electrodes). In such cases, one can estimate the
surface concentration of the adsorbed material by the use of the Brown-Anson
equation model;
RT
AvΓFnI
4
*22
p (7)

54
Where Ip, n, F, A, R, v and T are explained in equations 5 and 6 and * is the surface
concentration of the adsorbed species of the electrode modifier.
Although cyclic voltammetry is very widely used for the initial redox characterization
of a molecule (i.e., the redox potentials, and the stability of the different oxidations
state) and for qualitative investigation of chemical reactions that accompany electron
transfer, there are a number of disadvantages inherent in this technique which
includes:
i) The effects of slow heterogeneous electron transfer and chemical reactions
cannot be separated if both of these effects are present, then the rate constants
for these processes can only be calculated using simulations methods.
ii) There is a background charging current throughout the experiment of
magnitude vCdl (where Cdl is the capacitance of the interface at the working
electrode). This restricts the detection limit to about 10-5 M. In addition, the
ratio of the peak faradaic current to the charging current decreases with
increasing v (Ip is proportional to v½ ) [112].
In spite of these limitations, cyclic voltammetry is very suited for a wide range of
applications and is one of the standard techniques used in characterization.
2.5.1.3 Square wave voltammetry (SWV).
This technique involves the application of square wave modulation to a constant or
nearly constant dc potential, and the current generated is sampled at the end of
successive half cycles of the square wave. Three currents are generated i.e. forward
current from the forward pulse (If), the reverse current from the reverse pulse (Ir) and
that for the net current (Id) which are then plotted against the potential on the

55
corresponding staircase tread. The net current (Id) is obtained by the difference
between the forward and the reverse current (If - Ir) and is centered on the redox
potential. The net current serves better analytical usage than the forward and reverse
currents because it increases the discrimination against the charging current, since any
residual charging current is subtracted out. Figure 7 shows the SWV containing the
forward, reverse and net currents. The net current is larger than that of the forward
and reverse current since it is the difference between them [113]. The peak height is
directly proportional to the concentration of the electroactive species and detection
limit as low as 10-8 is possible.
SWV has many advantages over cyclic voltammetry such as much faster scan times
(high scanning speed), excellent sensitivity, the rejection of background current, high
signal to noise ratio and applicability to a wider range of electrode materials and
systems [114-115]. Square wave voltammetry can play very important role in the
characterization of electroactive species with poor, overlapping or ill-formed redox
signals in cyclic voltammetry by producing individual sharp peaks [113]. It can also
be applied in study of the electrode kinetics with regard to preceding, following or
catalytic homogeneous chemical reactions and determination of some species at trace
levels.

56
Figure 7: A typical SWV containing the forward, reverse and difference
currents.
Consequently, the difference (Id) is larger than each individual component in the
region of the peak that is centered on the half-wave potential because If, and Ir have
opposite signs. This difference effectively cancels the capacitive currents and thus
higher scan rates are possible without background current interferences. This makes
SWV a useful tool in kinetic study.

57
2.5.2 Spectroscopic techniques
2.5.2.1 Electrochemical impedance spectroscopy (EIS).
In cyclic voltammetry and other dynamic electroanalysis, an applied potential is either
constant (potentiostatic) or changing (potentiodynamic) when ramped at a constant
rate of v =dE/dt [110]. However, in impedance, a small perturbing potential is applied
across a cell or sample and changes in a cyclic sinusoidal manner and generates a
current resulting from the overpotential (η) caused by the small displacement of the
potential from the equilibrium value. Over a time scale, the averaged over potential is
zero. Because the potential is only perturbing, it has the advantage of minimizing the
concentration change after the experiment. The induced current alternates because the
voltage changes in a cyclic manner, and hence the term alternating current (AC). The
term impedance is therefore a measure of the ability of a circuit to resist the flow of
an alternating current (AC) [115]. It is synonymous to resistance (R) used in direct
current (DC), which is defined by Ohm’s law (equation 8) as the ratio between
voltage (E) and current (I) [109-110].
I
ER (8)
EIS is an excellent, non-destructive, accurate and rapid insitu technique for examining
processes occurring at the electrode surface. During a controlled-potential EIS
experiment, the electrochemical cell is held at equilibrium at a fixed DC potential, and
a small amplitude (5–10 mV) AC wave form is superimposed on the DC potential to
generate a response from the equilibrium position. The response to the applied
perturbation, which is generally sinusoidal, can differ in phase and amplitude from the
58
applied signal. This response is measured in terms of the AC impedance or the
complex impedance, Z* (overall or complete impedance), of the system, which
permits analysis of electrode process in relation to diffusion, kinetics, double layer,
coupled homogeneous reactions, etc [116]. The complex impedance (Z*) is made up
of a resistive or real part Z′, attributable to resistors (in phase with the applied
voltage), and a reactive or imaginary part Z′′, attributable to the contributions of
capacitors. This is related to the resistance (R), reactance (X) and capacitance (C) by
the equation:
jXRZ (9)
where X = 1/ωC and ω = 2 π f. R is the resistance measured in Ohms (Ω), X is the
reactance, C the capacitance measured in Farads (F), ω the applied angular frequency
measured in rad s-1 and f is the frequency measured in Hertz (Hz) [109]. Notational
representation of this in terms of Z′ and Z" is given by:
Z* = Z′ - jZ′′ where j = √-1 (10)
Because Z* is defined by the complex term, j, which determines the contribution of Z′′
to Z*, the term complex impedance is often used. For a pure resistor that is not having
any capacitance, its resistance when determined with a continuous current (DC) is R
because its impedance is frequency independent, Z* = Z′ = R.
The experimental data collected from an impedance experiment is often presented as
Nyquist plot of Z′ (usually positive x-axis corresponds to the real impedance), versus
59
Z′′ (usually, the positive y-axis correspond to -Z"), over a wide frequency range
(normally 100 kHz to 0.1 Hz). The Nyquist plot of impedance spectra includes a
semicircle portion and a linear portion, with the former at higher frequencies
corresponding to the electron transfer process and the latter at lower frequencies
corresponding to the diffusion process. The electron transfer resistance (Rct) at the
electrode surface is equal to the semicircle diameter, which can be used to describe
the interface properties of the electrode [117].
Another way of presenting impedance data is a bode plot in which the logarithm of
the absolute value of Z′ and the phase (φ) are plotted against the logarithm of the
frequency (f) [118]. This can be plotted together or separately. Nyquist plots are more
commonly displayed for historical reasons, the data is however often poorly resolved
(particularly at high frequencies), and the explicit frequency dependence is not
displayed in the plot. In contrast, the bode plot directly displays the frequency
dependence; in addition, the data is well resolved at all frequencies, since a
logarithmic frequency scale is used. When the frequency of the AC waveform is
varied over a wide range of frequency (ca about 10-4 and > 106 Hz), the impedance
obtained for the system is a function of the operating frequency. Spectra of the
resulting impedance at different frequencies do reveal the different electrochemical
kinetics involved in the system. While dipolar properties are manifest at the high
frequency regions, bulk and surface properties will be evident at intermediate and low
frequencies respectively [118]. The total impedance of a system is determined by the
impedances of the various components of the electrochemical cell; for example,
electron transfer kinetics, diffusion and passivating layers. The relative contribution of
the various components typically varies with frequency; for example, electron transfer

60
kinetics may dominate at high frequencies, whereas diffusion may dominate at lower
frequencies [118] .
Measuring impedance over a wide frequency range allows processes with different
time scales such as electron transfer, mass transport and chemical reaction to be
detected within the same experiment. Impedance data is commonly analyzed by
fitting it to an equivalent circuit model. The frequently used circuit, called the Randles
equivalent circuit is composed of different elements such as resistors, capacitors, and
inductors joined in series or in parallel. Figure 8 shows the impedance diagram for the
real impedance (x-axis) and imaginary impedance (y-axis) with low frequency data
being on the right side of the plot and higher frequencies are on the left [118].
Figure 8. A typical impedance diagram
A typical Nyquist plot for the impedance data is shown in Figure 9. The semicircular
shape is characteristic of a single "time constant".
max

61
Figure 9. A typical Nyquist plot.
EIS is a useful tool in studying the kinetics of electrochemical reactions. Redox
reactions usually involve charge transfer kinetics and mass transfer. The slower of this
two determines the rate of the reaction. The mass transfer in EIS is limited to
diffusion (concentration gradient) by the steady state condition. Figure 10 shows the
Nyquist plot indicating the kinetically controlled (higher frequency) and the mass
controlled (low frequency) parts of the plot.

62
Figure 10. A typical Nyquist plot showing some kinetic parameters.
From ωmax (frequency at maximum imaginary impedance of the semicircle) useful
kinetic parameters such as double layer capacitance (Cdl), (obtained using equation
11), time constant (cycle life) τ, (calculated using equation 12), exchange current 0I ,
(Calculated using equation 13) and heterogeneous rate constant Ket (calculated using
equation 14) can be evaluated:
dlct
max
1
CR (11)
dlctCR (12)
ct
0 nFR
RTI (13)
0
0et nFAC
IK (14)

63
where ωmax = 2 π ƒ, Rs is the solution resistance, Rct is the charge transfer resistance,
Cdl is the double layer capacitance, R is the gas constant (8.314 J K-1 mol-1), F is the
Faradays constant (96 486 C mol-1), n is the number of electrons, τ is the time
constant or cycle life (relates to the time required for the proton to completely move
across the electrolyte layer from one side to the other), 0I is the exchange current
(relates to rate constant to electron transfer at zero overpotential), 0C is the
concentration (mol cm-3) and etk is the heterogeneous rate constant.
A representative plot of frequency as x-axis versus logarithm of real impedance as y1-
axis, and phase angle as y2-axis called bode plot is presented in Figure 11 and 12.
Bode plot is a plot of log magnitude of impedance and phase angle versus log of
frequency [115].
Figure 11. A typical bode plot showing variation of impedance and phase angle
with changes in frequency.
100m 1 3 10 30 100 1K 3K 10K 100K
50
100
200
500
1K
2K
|Z| /
0
15
30
45
60
75
90|phase| / o
frequency / Hz

64
Figure 12. A bode plot showing some kinetic parameters.
The bode plot gives direct information on the frequency and phase angle. The
frequency at maximum phase is a useful parameter in determining the double layer
capacitance using equation 15:
dlct
solctmax
)/1(
CR
RR (15)
The commonly used Randles equivalent circuit for fitting of the impedance data is
shown in Figure 13.
Rs C
Rct Zw
Figure 13. Randles equivalent circuit for a simple electrochemical cell.
C is capacitance which is the ability of an electrochemical system to store or retain
charge and Zw is the Warburg impedance associated with the resistance as a result of
the diffusion of ions across the electrode/electrolyte interface. Thus, EIS can give

65
useful information of the impedance changes on the electrode surface before and after
modification.
2.5.2.2 UV-visible spectroscopy
It is a spectroscopic technique that involves the spectroscopy of photons in the UV-
visible region. It uses light in the visible and adjacent (ultraviolet (UV) and near
infrared (NIR) ranges). In UV-visible spectroscopy, one can monitor the colour of a
material and current at the same time. The colour monitored is the wavelength at
which the maximum of the absorption band (s) occurs, λmax, together with the
absorbance at each of these wavelengths. The optical absorbance, Abs, is defined
according to the equation:
)samplewith
samplenowith(log 10 T
TAbs (16)
where T is the transmittance of light following its passage through the cell. Any
changes in the absorbance relates to the amount of electroactive material as converted
by the flow of current. The absorption spectrum tells us the nature of the material
generated. It is a major technique that is used in the quantitative determination of
solutions of transition metal ions and highly conjugated compounds. For example, if a
material absorbs UV-visible light, then we can monitor its concentration using Beer-
Lambert relationship;
lCAbs 0 (17)

66
where the absorbance is determined at fixed wavelength λ, ε is the extinction
coefficient (cited at the same value of λ), and l is the optical pathlength. If the
magnitude of the extinction coefficient at λ is known, then the amount of analyte ( 0C )
can be quantified simply by determining the optical absorbance and inserting the
values into equation (17).
Most of the analytical techniques are not particularly useful for telling us what
‘something’ is, but are excellent at telling us how much of that ‘something’ is present,
or has been formed or has been changed. However, UV-visible spectroscopy is one of
the best ways of identifying an analyte. This is because each specific analyte absorbs
energy in the form of photons at different wavelengths [110]. Hence, one is able to
identify a certain analyte by the application of UV-vis spectroscopy. It is a
complementary technique to fluorescence spectroscopy in that it deals with transitions
from the ground state to the excited state while fluorescence spectroscopy measures
transitions from excited state to the ground state [119].
2.5.2.3 Fluorescence spectroscopy.
Fluorescence is the emission of visible light by a substance that has absorbed light of
a different wavelength while spectroscopy is the study of the any measurement of a
quantity as function of either wavelength or frequency. Thus, fluorescence
spectroscopy can be defined as a type of electromagnetic spectroscopy which
analyzes fluorescence from a sample. It involves using a beam of light, usually
ultraviolet light that excites the electrons in molecules of certain compounds and
causes them to emit light of a lower energy, typically, but not necessarily, visible
light. Since molecules have various states called energy levels, fluorescence

67
spectroscopy is primarily concerned with electronic and vibrational states. The
species being examined are first excited, by absorbing a photon, from its ground
electronic state to one of the various vibrational states in the excited electronic state.
Collisions with other molecules cause the excited molecule to lose vibrational energy
until it reaches the lowest vibrational state of the excited electronic state. The
molecules then drops down to one of the various vibrational levels of the ground
electronic state again, emitting a photon in the process. As molecules drop down into
any of the several vibrational levels in the ground state, the emitted photons will have
different energies, and thus frequencies. Therefore, by analyzing the different
frequencies of light emitted in fluorescence spectroscopy, along with their relative
intensities, the structure of the different vibrational levels can be determined. It can be
noted that, in a typical experiment, the different frequencies of fluorescent light
emitted by a sample are measured, holding the excitation light at a constant
wavelength. This is called an emission spectrum. The emission spectrum provides
information for both qualitative and quantitative analysis. Fluorescence spectroscopy
is an important investigational tool in many areas of analytical science, due to its
extremely high sensitivity and selectivity [120].
2.5.3 Other techniques
2.5 3.1 Transmission electron microscopy (TEM).
Transmission electron microscopy (TEM) is a microscopic technique whereby a beam
of electrons is transmitted through an ultra thin specimen, interacting with the
specimen as it passes through. An image is formed from the interaction of the
electrons transmitted through the specimen; the image is magnified and focused onto

68
an imaging device, such as a fluorescent screen on a layer of photographic film, or to
be detected by a sensor such as a CCD camera. Transmission electron microscopes
are capable of imaging at a significantly higher resolution than light microscopes,
owing to the small de Broglie wavelength of electrons. This enables the instrument's
user to examine fine detail-even as small as a single column of atoms, which is tens of
thousands times smaller than the smallest resolvable object in a light microscope.
TEM forms a major analysis method in a range of scientific fields, in both physical
and biological sciences. TEMs find application in cancer research, virology, materials
science as well as pollution and semiconductor research. Through the use of TEM,
one can view the finest structures.

69
CHAPTER 3
3.0 EXPERIMENTAL SECTION
3.1 Introduction
This chapter describes the general experimental procedures for the chemical synthesis
of Ag-Au alloy nanoparticles, characterization of the synthesized alloy nanoparticles;
electrochemical synthesis and overoxidation of nanostructured polypyrrole. The
fabrication of an electrochemical sensor based on Ag-Au alloy
nanoparticles/overoxidized–polypyrrole composite and its application in the
determination of selected polyaromatic hydrocarbons (PAHs) will also be discussed.
3.2 Reagents and materials
The reagents and materials used in this study included: Pyrrole (Py) (99%), Hydrogen
tetrachloroaurate(III) trihydrate (HAuCl4.3H2O), trisodium citrate (Na3C6H5O7)
(99%), silver nitrate (AgNO3) (99%), anthracene (99%), phenanthrene (99%), pyrene
(99%), Lithium perchlorate (LiClO4) (99.99%) and acetonitrile (HPLC grade). They
were obtained from Sigma-Aldrich and were of analytical grade. Phosphate buffer
solution (PBS), 0.1 M, pH 7.0 was prepared from anhydrous disodium hydrogen
phosphate (Na2HPO4) and sodium dihydrogen phosphate (NaH2PO4). Deionized
water (18.2 MΩ) purified by a milli-QTM system (Millipore) was used for aqueous
solution preparations. Analytical grade argon (Afrox, South Africa) was used to degas
the system. Pyrrole was purified twice by distillation under the protection of high
purity nitrogen and then kept in a refrigerator when not in use.

70
3.3 Instrumentation.
All electrochemical experiments were carried out using a BAS 50B electrochemical
analyzer from Bioanalytical systems inc. (West Lafayette, IN) with conventional
three- electrode system consisting of glassy carbon electrode (GCE) as the working
electrode (A = 0.071 cm2), platinum wire as the auxiliary electrode and Ag/AgCl (3 M
NaCl) as the reference electrode. All experimental solutions were purged with high
purity argon gas and blanketed with argon atmosphere during measurements. The
experiments were carried out at controlled room temperature (25 °C). UV-Vis spectra
measurements were recorded over a range of 350-700 nm using 3 cm3 quartz cuvettes
with Nicolette Evolution 100 Spectrometer (Thermo Electron Corporation, UK).
Transmission electron microscopy (TEM) images were acquired using a Tecnai G2
F2O X-Twin MAT. TEM characterizations were performed by placing a drop of the
solution on a carbon coated copper grid and dried under electric bulb for 30 min.
Fluorescence spectra measurements were obtained by the use of the NanoLogTM
HORIBA JOBINYVON machine. Electrochemical impedance spectra (EIS)
measurements were performed using VoltaLab PGL 402 from Radiometer Analytical
(Lyon , France) in a solution containing 0.1 M KCl and Fe(CN)63-/4- and plotted in the
form of complex plane diagrams (Nyquist plots) with a frequency range of 100 KHz
to 0.1 Hz. The amplitude of the applied sine wave potential was 10 mV, whereas the
ambient applied dc potential was set at the formal potential (184 mV) which was
obtained from the CV experiment of the [Fe(CN)6]3-/4- redox probe. Alumina micro
powder and polishing pads were obtained from Buehler, IL, USA and were used for
polishing the GCE.
71
3.4 Preparation of silver, gold and silver-gold alloy nanoparticles.
Silver nanoparticles (AgNPs) were synthesized by the reduction of AgNO3 with
trisodium citrate according to procedures described by Fang et al. [121] and Asta et
al. [122]. Briefly, 50 mL of 1.0 mM AgNO3 solution was heated to boiling in an
Erlenmeyer flask. To this solution, 5 mL of 1% C6H5O7Na3 was added dropwise (0.5
g of C6H5O7Na3 was dissolved in 50 mL of distilled water in order to prepare 1%
C6H5O7Na3 solution). During the process, the solution was mixed vigorously by the
use of a magnetic stirrer. The solution was heated until a pale yellow colour was
observed. It was then removed from the heating surface and stirred until it cooled to
room temperature. The mechanism of the reaction can be expressed as follows; [122].
4Ag+ + C6H5O7Na3 + 2H2O 4Ago + C6H5O7H3 + 3Na+ + H+ + O2 (13)
Gold nanoparticles (AuNPs) were prepared through the reduction of 1.0 mM HAuCl4
using sodium citrate as the reducing agent. 20 mL of 1.0 mM HAuCl4 solution was
added to a 50 mL Erlenmeyer flask on a stirring hot plate. A magnetic stirrer was
added into the solution and the solution heated to boil. To the boiling solution, 2 mL
of 1% solution of sodium citrate, (C6H5O7Na3) was added. Gold sol gradually formed
as the citrate reduced Au3+ to Au0. The solution was heated until a deep red colour
was observed [123].
Silver-gold alloy nanoparticles (Ag-AuNPs) were synthesized via a previously
reported procedure [102]. 49 mL of water was added into a 100 mL round bottomed
flask. 0.5 mL 2% (w/v) sodium citrate was added into the flask of water and the

72
reaction mixture heated to 92 °C. 0.5 mL of a mixture of 10 mM HAuCl4 and 10 mM
AgNO3 solution was added into the reaction mixture and the temperature regulated
between 90 °C and 92 °C and refluxed for 1 hour. The volume of the mixture was
adjusted so as to prepare Ag-Au nanoparticles with Ag/Au ratio of 1:3 by mixing
0.125 mL of 10 mM AgNO3 and 0.375 mL of 10 mM HAuCl4 . After refluxing the
mixture at temperature between 90 °C and 92 °C for 1 hour, a colour change was
observed in the solution (dark red) indicating the formation of nanoparticles according
to the hallmarks reported in the literature [124].
3.5 Preparation of glassy carbon electrode (GCE) with nanoparticles.
For the preparation of electrodes for electrochemical measurements, GCE was
polished repeatedly with 1.0, 0.3, and 0.05 µm alumina slurries respectively and then
rinsed thoroughly with distilled water followed by sonication in ethanol and water
respectively. 4 µL solutions of already synthesized Ag-Au (1:3) alloy nanoparticles
were drop-coated onto the surface of a thoroughly polished GCE and left to dry at
room temperature and it is henceforth denoted as Ag-AuNPs/GCE. Ag-modified and
Au-modified electrodes were as well prepared by drop-evaporation over the bare
GCE, and each henceforth denoted as AgNPs/GCE and AuNPs/GCE, respectively.
3.6 Preparation of overoxidized-polypyrrole polymer on GCE (PPyox/GCE).
Prior to modification, the bare GCE was polished to a mirror finish as described in
3.5. Electrochemical polymerization of pyrrole was carried out in 0.1 M LiClO4
solution containing 0.1 M pyrrole by cycling the potential from -400 to 700 mV at a
scan rate of 50 mV s-1 for 10 cycles. Before applying potential to the above
polymerization solution, the solution was degassed by bubbling argon gas through for

73
15 min and then maintained oxygen free by keeping a blanket of argon above the
solution. It is during this electropolymerization process that polypyrrole polymer was
electrodeposited on the surface of the electrode. The electrode was then removed from
the solution and rinsed with water to remove any traces of monomers. This modified
electrode was denoted as PPy/GCE. The polypyrrole modified electrode (PPy/GCE)
was then transferred into 0.1 M NaOH solution for potentiometric electrochemical
overoxidation of the conductive polypyrrole film at +1.0 V for 420 s. The obtained
modified electrode was thoroughly rinsed with de-ionized water and was denoted as
PPyox/GCE which was kept in readiness for either characterization or immobilization
of the nanoparticles.
3.7. Fabrication of overoxidized-polypyrrole/Ag-AuNPs composite (PPyox/Ag-
AuNPs).
In order to incorporate the intermetallic nanoparticles, 4 µL solution of already
synthesized Ag-Au alloy nanoparticles were drop-coated on the PPyox/GCE and
allowed to dry at room temperature. The modified electrode was taken out and rinsed
with water, and henceforth denoted as PPyox/Ag-AuNPs/GCE. The PPyox/Ag-
AuNPs/GCE was ready for use as an electrochemical sensor for the detection of
anthracene, phenanthrene and pyrene. In this work, the PPyox/Ag-AuNPs/GCE will
thus be referred to as an electrochemical sensor. A schematic illustration of the
stepwise electrochemical sensor fabrication process is shown below in scheme 6.

74
(a) Electropolymerization of pyrrole
(b) Overoxidation of polypyrrole
(c) Immobilization of the Ag-Au alloy nanoparticles
Scheme 6. Schematic illustration of the stepwise sensor fabrication process.
3.8 Electrochemical characterization.
3.8.1 Characterization of the nanoparticles.
A three electrode system was used for electrochemical characterization of the
synthesized nanoparticles. GCE modified with nanoparticles was used as the working
electrode, platinum wire as the auxiliary electrode and Ag/AgCl (3 M NaCl) as the
reference electrode. The characterization solutions used contained 3 mL of 0.1 M
LiClO4 and 3 mL of 0.1 M phosphate buffer pH 7 which were added into an
electrochemical cell and degassed for about 5 min using argon gas. Cyclic
voltammogram (CV) of Ag-AuNPs/GCE in the above solutions was achieved by
scanning between -0.6 V and +1.0 V at a scan rate of 50 mV s-1 as well as at different
a b c

75
scan rates: 20, 40, 60, 80 and 100 mV s-1. For control experiments, AgNPs/GCE and
AuNPs/GCE were also characterized using the same procedure.
3.8.2 Characterization of polypyrrole (PPy).
Inoder to investigate the electrochemistry of the prepared polypyrrole, a three
electrode system was used for electrochemical characterization as described in 3.8.1
with PPy/GCE as the working electrode. The characterization of the polypyrrole was
done in 0.1 M LiClO4 by cathodic scanning from 500 mV to -1000 mV at different
scan rates. Consequently, it was also necessary to confirm whether the synthesized
polypyrrole was overoxidized before overoxidizing it in 0.1 M NaOH. This was done
by testing the electrical conductivity of the polypyrrole. This was investigated by
characterizing the polymer in 5 mM K3Fe(CN)6 redox probe by potential scanning
from +600 mV to -200 mV at a scan rate of 50 mV s-1.
3.8.3 Characterization of PPyox/GCE and PPyox/Ag-AuNPs/GCE.
The catalytic properties of the Ag-Au alloy nanoparticles deposited on the
PPyox/GCE were studied by performing an electrochemical characterization using
cyclic voltammetry. A three electrode system was used for the electrochemical
characterization of PPyox/GCE and PPyox/Ag-AuNPs/GCE as described in 3.8.1
using PPyox/GCE and PPyox/Ag-AuNPs/GCE as the working electrodes,
respectively. This was investigated in 5 mM K3Fe(CN)6 redox probe as described in
3.8.2.

76
3.9 Electrochemical sensor measurements.
3.9.1 Choice of suitable solvent and supporting electrolyte.
Most PAHs are insoluble in water hence a suitable organic solvent is necessary to
completely dissolve them. The choice of solvents is determined by several factors,
including conductance, solubility of electrolyte and electroactive substance and the
reactivity with electrolytic products. In Fry and Britton’s handy review of solvents
and electrolytes [125], acetonitrile, ethanol, methanol, and methylene chloride are
recommended as good oxidative (anodic) electrochemical solvents, while
dimethylformamide (DMF) and dimethyl sulfoxide (DMSO) are suggested for
reductive (cathodic) electrochemistry. Acetonitrile (CH3CN) was chosen as a suitable
solvent since it was found to dissolve most of the PAHs and has been reported to have
a relatively high dielectric constant, has the ability to dissolve electrolytes, its
relatively non-toxic and portrays good electrochemical properties. Since, acetonitrile
is a non-aqueous electrolyte, a suitable supporting electrolyte was necessary to
enhance conductivity, minimize double-layer and migration currents. Lithium
perchlorate (LiClO4) was chosen as the supporting electrolyte based on its solubility
in acetonitrile and its inertness towards the electroactive species (PAHs). However,
most PAHs are found in waste water hence the need to introduce water in the
acetonitrile. In this work, water was introduced in to the acetonitrile by preparing a
solution of acetonitrile and water in the ratio 80:20 (acetonitrile: water). This mixture
of acetonitrile and water was used as the solvent in all sensor applications and will
thus be referred to as acetonitrile.

77
3.9.2 Preparation and analysis of the PAHs.
5 mM of standard solutions of anthracene, phenanthrene and pyrene were prepared as
follows: 0.022 g , 0.022 g and 0.025 g of anthracene, phenanthrene and pyrene were
dissolved each in about 15 cm3 of acetonitrile (to achieve solubility), respectively, and
later made up to 25cm3 solutions in distilled water with continuous stirring for about
30 min. The solutions were kept in brown bottles. From these stock solutions, aliquots
(in µL) were drawn and added to the cell and used for sensor development. The cell
for electrocatalytic oxidation of the PAHs consisted of the PPyox/Ag-Au
nanoparticles modified glassy carbon electrode (working electrode), platinum counter
electrode and Ag/AgCl (3 M NaCl) reference electrode. A 3 mL test solution
consisting of acetonitrile (acetonitrile: water = 80:20) and 0.1 M LiClO4 was degassed
with argon for about 10 min before the experiment. A blanket of argon was kept
during the experiment to maintain an oxygen free solution. Both cyclic voltammetry
and square wave voltammetry were used for the characterization of the modified
electrode and the determination of the electrode response to the monitored PAHs. The
potential at which anthracene was oxidized was also determined for further steady
state amperometric measurements. For the steady state measurements of anthracene, a
constant potential of +1181 mV was used which was obtained from CV
measurements. The amperometric measurements were achieved as follows: The
degassed acetonitrile and 0.1 M LiClO4 solution was excited at a constant potential of
+1181 mV and the current was initially allowed to attain a steady state. The first 3.0
µM of anthracene was then injected into the cell. The increase in the catalytic current
was then monitored and allowed to attain steady state, then followed by another
addition of 3.0 µM anthracene. This was repeated until no further increase in catalytic
current was observed after addition of anthracene. The solution was kept oxygen free

78
by use of argon gas and was constantly stirred at 300 rotations per min (300 rpm)
using a magnetic stirrer. After each sensor experiment, the electrode was washed in
de-ionized water and kept in 0.1 M LiClO4 for successive measurements in order to
establish the lifetime of the sensor.
3.9.3 Interferences studies.
Several substances suspected to interfere with the detection of PAHs were
investigated by the developed electrochemical sensor. These substances include
inorganic substances such as Na+, Cu2+, Fe2+, Mn2+, Cl-, SO42-, NO3
- and NO2- [126].
Solutions containing 0.1 M of each of these substances were prepared. A mixture of
these solutions was prepared and mixed with a similar concentration of the PAH at a
ratio of 1:1. SWV measurements were carried out on the resulting mixtures. The
catalytic current emanating from the mixture solution of interferences and the PAHs
was compared to that of a similar concentration of standard PAHs alone. Expressed as
a ratio of I (PAH +suspected interference)/ I (PAH) and converted into percentage, the
value obtained was used to assess the level of possible interference by the investigated
substances.

79
CHAPTER 4
4.0 RESULTS AND DISCUSSION 1
4.1 Characterization of Ag-AuNPs.
4.1.1 UV-visible spectroscopy.
The formation of silver-gold alloy nanoparticles (Ag:Au = 1:3) by simultaneous
reduction of gold and silver ions was confirmed by the use of UV-visible
spectroscopy. Figure 14 shows the visible absorption spectra of silver, gold, silver-
gold bimetallic alloy nanoparticles and a mixture of silver and gold nanoparticles.
Absorption maximum for silver nanoparticles (curve a) and gold nanoparticles (curve
c) were observed at 415 nm and 525 nm, respectively. The Ag-Au bimetallic alloy
nanoparticles showed an absorption peak at 504 nm (curve b). The appearance of
single absorption peaks at 504 nm which was between 525 nm and 400 nm shows that
Ag-Au alloy nanoparticles were formed [102, 127].

80
Figure 14. UV-visible absorption spectra of Ag (curve a), Au (curve c), Ag-Au
(1:3) alloy nanoparticles (curve b) and a mixture of pure Ag and Au
nanoparticles (curve d).
When pure gold and silver nanoparticles were mixed physically, two absorption peaks
were observed (curve d) corresponding to the individual metal nanoparticles.
However, only one absorption peak was observed (curve b) for the solution of the
bimetallic alloy nanoparticles. This is a confirmation that the synthesized
nanoparticles were alloys and not mixture of elemental nano-particles as described by
Pal et al. [128]. The formation of core-shell bimetallic nanoparticles was ruled out
since core-shell nanoparticles exhibit two absorption peaks whose relative intensities
depend on the thickness of the shell [124]. The alloy formation can be attributed to
similar lattice constants of 0.408 and 0.409 nm, respectively, for gold and silver. This
small difference in lattice constants being smaller than the amplitude of thermal
vibrations of atoms has already been hypothesized to favor alloy formation even at the
nanometer scale [129].

81
A second set of spectroscopic experiment was carried out to establish that the
nanoparticles were well stable on storing at room temperature for a long time. Figure
15 shows the visible spectra of solution containing Ag (curve a), Au (curve c) and
Ag-Au (1:3) alloy nanoparticles (curve b) after storage for 4 months at 25 °C. The
above nanoparticles stored in an air –sealed bottle at a temperature of 25 °C were
found to be very stable, since no apparent change was observed by UV-visible
absorption spectra even after about 4 months.
Figure 15. UV-visible absorption spectra of Ag (curve a), Au (curve c) and Ag-
Au (1:3) alloy nanoparticles (curve b) after 4 months storage at 25 °C.
A plot of wavelength against mole fraction of one of the monometallic nanoparticles
in the alloy at increasing concentration is ideally known to obey a linear fashion.
However, core-shell nanoparticles do not show such a relationship [127]. To confirm
this, Ag-Au alloy nanoparticles with different molar ratios were thus synthesized.
Figure 16 shows UV-visible spectra of the Ag-Au alloy nanoparticles with different

82
molar ratio of Ag and Au (Ag/Au ratio, 1:0, 3:1, 1:1, 1:3, 1:9, 0:1). The monometallic
Ag and Au nanoparticles showed one characteristic peak at 415 nm (Figure 16 curve
a) and 525 (Figure 16 curve f), respectively, both consistent with previous results
[102]. A change in wavelength was observed with increasing amount of gold content
in the alloy. All the single absorption peaks for the alloy nanoparticles were located at
intermediate wavelengths between the absorption peaks of Ag nanoparticles and Au
nanoparticles showing that Ag-Au alloy nanoparticles were formed.
Figure 16. UV-visible absorption spectra of Ag-Au alloy nanoparticles with
various molar ratios of Ag and Au.

83
Figure 17. A plot of the wavelength corresponding to the maximum absorbance
for varying mole fractions of Ag-Au alloy nanoparticles.
In Figure 17, it is observed that there is a linear relationship between the absorption
peak position (λ max) values and the Au-mole ratio. According to Raveendran et al.,
and the Murray’s report [130], this linear relationship is attributed to the formation of
homogeneous alloy nanoparticles rather than core-shell. It has also been supported by
Jian Zhu using the Drude model and quasi-static theory [127].
The optical properties of these alloy nanoparticles vary with their composition, which
is seen from the digital photographs in Figure 18. The colour of the colloidal solution
changes from yellow to deep red with increasing gold content which could be visually
detected as a progressive change in the colour.

84
(a) (b) (c) (d) (e) (f)
Figure 18. Digital photographs of Au, Ag and Ag-Au alloy (Au mole fraction: (a)
0, (b) 0.1, (c) 0.5, (d) 0.75, (e) 0.9 and (f) 1) nanoparticles.
4.1.2 Fluorescence properties of Ag-AuNPs.
The characteristic fluorescence property of silver-gold bimetallic alloy nanoparticles
was observed by measuring fluorescence emission spectra as shown in Figure 19. The
emission spectrum (fluorescence band) for pure Au nanoparticles was observed at 606
nm when excitation was carried out at 525 nm (curve d) while Ag-Au (1:3) bimetallic
alloy nanoparticles showed a fluorescence band at 562 nm when excitation was
carried out at 504 nm (curve b). The concentration of the gold content and silver
content in the alloy composition was varied and the spectra were recorded for each
case (see Figure 19) which correlates well with previous reports [102]. It is worth
noting that with silver content above 50% in the alloy, we were not able to observe
any emission spectra even after exciting the alloy at their respective λmax values.
The fluorescence properties of silver and gold nanoparticles have been attributed to
electronic transitions between the highest valence d-band and conductance sp-band.
[131]. The d-band electrons of the noble metal nanoparticles absorb the incident

85
photon energy and promote to higher electronic states in the sp-band. The electron-
hole pair recombines non-radioactively through electron-photon scattering process but
then may combine radioactively giving rise to the observed fluorescence [128]. So, as
the Au content in the alloy increases, the energy gap between valence and conduction
band decreases and as a result, the emission peaks of the alloy nanoparticles showed
an increase in wavelength [102]. Thus, the Ag-Au bimetallic alloys were confirmed to
have been formed.
Figure 19. Emission spectra of Au and Ag-Au alloy (Au mole fraction: (a) 0.5, (b)
0.75, (c) 0.9 and (d) 1) nanoparticles with varying Au mole fraction.
4.1.3 Transmission electron microscopy (TEM).
In the present work, spherical Ag-Au alloy nanoparticles were synthesized by
reduction of HAuCl4 and AgNO3 by the use of sodium citrate as the reducing agent as
well as the capping agent. Sodium citrate molecules which are negatively charged
were adsorbed on the surface of the nanoparticles causing repulsion of the
nanoparticles against each and hence stabilizing the alloy nanoparticles by preventing

86
them from aggregating. Samples of the prepared alloy nanoparticles (molar ratio Ag:
Au =1:3) were characterized by TEM. Figure 20 shows the TEM images of Ag-Au
bimetallic alloy nanoparticles, Ag nanoparticles and Au nanoparticles. From the
particle size distribution it is observed that, particle sizes in the range of ca 20-30 nm,
30-40 nm and 20-30 nm were observed for Ag-Au alloy, Ag and Au nanoparticles,
respectively.
Figure 20. TEM images of (a) Ag-Au (1:3) bimetallic alloy nanoparticles, (b)
pure Ag nanoparticles and (c) pure Au nanoparticles.
4.1.4 Electrochemical characterization of Ag-AuNPs.
4.1.4.1 Characterization in neutral medium.
The synthesized Ag-Au (1:3) bimetallic alloy nanoparticles were also characterized
by the use of cyclic voltammetric technique. Cyclic voltammetry (CV) of Ag-
AuNPs/GCE was carried out in degassed phosphate buffer solution (0.1 M PBS, pH
7) solution at a scan rate of 50 mV s-1. Similarly, AgNPs/GCE and AuNPs/GCE were

87
characterized respectively, using the same procedure as shown in Figure 21 a, b and
c.
Figure 21a. Cyclic voltammogram of bare GCE (curve a) and AgNPs/GCE
(curve b) in 0.1 M PBS pH 7: Scan rate 50 mV s-1.

88
Figure 21b. Cyclic voltammogram of bare GCE (curve a) and AuNPs/GCE
(curve b) in 0.1 M PBS pH 7: Scan rate 50 mV s-1.
Figure 21c. Cyclic voltammogram of bare GCE (curve a) and Ag-AuNPs/GCE
(curve b) in 0.1 M PBS pH 7: Scan rate 50 mV s-1.

89
Figure 22. Cyclic voltammograms of Ag-AuNPs/GCE in 0.1M PBS pH 7 at
different scan rates.
Large oxidation and reduction peaks of Ag nanoparticles were observed at -414 mV
and 209 mV (corresponding to the Ag/Ag+ redox couple), respectively (see Figure 21
a). The Au nanoparticles-modified electrodes also showed a broad anodic peak and
reduction peak corresponding to the oxidation and reduction of Au at a potential range
of 0 to 700 mV (Figure 21 b). For the Ag-AuNPs/GCE, a reduction peak was
observed around 86 mV while an anodic peak was observed at 245 mV (Figure 21 c).
It is interesting to note that, for the Ag-Au alloy nanoparticles, only one reduction and
one oxidation peak was observed. This showed that the Ag-Au alloy nanoparticles
were composed of atomically mixed Ag and Au atoms and not composed of Ag and
Au metal domains. Increasing the scan rate showed an increase in the peak current as

90
shown in Figure 22. Further characterizations of the modified AgNPs/GCE,
AuNPs/GCE and Ag-AuNPs/GCE electrodes were done using 0.1 M LiClO4 as
shown in Figure 23 a, b and c. Similar results were obtained even when 0.1 M LiClO4
was used instead of 0.1 M PBS pH 7. This strongly supports that the synthesized Ag-
Au nanoparticles were relatively homogeneous forming alloy nanoparticles.
Figure 23a. Cyclic voltammogram of bare GCE (curve a) and AgNPs/GCE
(curve b) in 0.1M LiClO4: Scan rate 50 mV s-1.

91
Figure 23b. Cyclic voltammogram of bare GCE (curve a) and AuNPs/GCE
(curve b) in 0.1M LiClO4: Scan rate 50 mV s-1.
Figure 23c. Cyclic voltammogram of bare GCE (curve a) Ag-AuNPs/GCE (curve
b) in 0.1M LiClO4: Scan rate 50 mV s-1.

92
Figure 24. Cyclic voltammograms of Ag-AuNPs/GCE in 0.1M LiClO4 at
different scan rates.
The effect of potential scan rate was investigated as shown in Figure 24. The
oxidation peak current (Ipa) against the scan rate (v) was linear over the range of 10-80
mV s-1 as shown in Figure 25. The linear regression equation was obtained as Ipa/A = -
3.2695 x 10⁻⁷ - 8.45488 x 10⁻⁸ v/ (mV s-1) with a correlation coefficient (r2) of 0.9980.
This indicated that the electrode process was redox reaction of surface adsorbed
species.

93
Figure 25. A plot of scan rate versus anodic peak current.
4.1.4.2. Characterization in the presence of K3Fe(CN)6 redox probe.
Cyclic voltammetry of the ferricyanide system is a convenient and valuable tool to
monitor the electrochemical characteristics of the surface of modified electrodes. CV
of the modified electrode was recorded (Figure 26) in the presence of K3Fe(CN)6 (5
mM) in aq. KCl (0.1 M) at a scan rate of 50 mV s-1 .

94
Figure 26. CVs of bare GCE (curve a) and Ag-AuNPs/GCE (curve b) in 5 mM
K3Fe(CN)6 solution containing 0.1 M KCl. Scan rate : 50 mV s-1.
The CVs of K3Fe(CN)6 as an electrochemical probe at the bare GCE and the modified
electrode are shown in Figure 26. At the bare GCE, the cathodic peak and anodic
peaks of this redox probe were observed at 196 mV and 307 mV, respectively (see
Curve a). However at the Ag-AuNPs/GCE these peaks occurred at 210 mV and 292
mV, respectively (see Curve b). The respective formal potentials were therefore
251.5 mV and 251.0 mV. Hence, in comparison with the CV at bare GCE, a moderate
enhancement of about 12% of the redox peak current was observed at the Ag-Au
bimetallic alloy nanoparticles modified electrode. The reason was that Ag-Au alloy
nanoparticles with large surface area and good conductivity could act as tiny
conduction centers which facilitate the transfer of electrons. Consequently, the
modified electrode showed a marked decrease in peak-to-peak separation (i.e., ΔEp =

95
82 mV), compared to that measured in case of the bare GCE (ΔEp = 111 mV). This
can be attributed to the presence of the nanoparticles which enhanced faster electron
transfer.
4.1.4.3. Impedimetric characterization of Ag-AuNPs/GCE.
The preparation process of electrodes was also monitored by electrochemical
impedance spectroscopy (EIS), which is an effective method for probing the features
of the surface of modified electrodes. The Nyquist plot of impedance spectra includes
a semicircle portion and a linear portion, with the former at higher frequencies
corresponding to the electron transfer process and the latter at lower frequencies
corresponding to the diffusion process. The charge transfer resistance (Rct) at the
electrode surface is equal to the semicircle diameter, which can be used to describe
the interface properties of the electrode [132-133].

96
Figure 27. Nyquist plots of the EIS recorded in the presence of
K4[Fe(CN)6]/K3[Fe(CN)6] (1:1) containing aq. KCl (0.1 M) for the bare GCE
(curve a) and Ag-AuNPs/GCE (curve b).
From Figure 27, the charge transfer resistance (Rct) of Ag-AuNPs/GCE was lower
( Rct = 4674 Ω) with a decrease of 49% (curve b) compared to the bare GCE (curve
a) which had an Rct of 9125 Ω indicating that the Ag-Au alloy nanoparticles have
good conductivity and played an important role in accelerating the transfer of
electrons. This agrees well with the results presented in Figure 26.
The impedance parameters (table 2) were obtained by fitting using the inset
equivalent circuit and the fitting errors were less than 2%. Rs is the solution
resistance, Rct is the charge transfer resistance, and CPE (constant phase element) is a
distributive element that models the double layer capacitance owing to surface

97
inhomogeneity and Zw (w) measures mass transport. The Fe(CN)63-/4- redox probe
exhibited kinetic control and diffusion controlled electrochemistry at high and low
frequency respectively at the Ag-AuNPs and GCE interface.
Table 2. The EIS parameters obtained from the circuit fitting of Figure 27 data.
Circuit element Rs (Ω) Rct (Ω) CPE (nF) Zw (k Ω s1/2) Bare GCE 146.5 9125 932.23 377.35 Ag-AuNPs/GCE 127.2 4674 911.44 355.69
From ωmax (frequency at maximum imaginary impedance of the semicircle), useful
kinetic parameters of Fe2+ ↔ Fe3+ + e- electron transfer such as time constant (cycle
life) τ, exchange current 0I , and heterogeneous rate constant ket [134-135] were
calculated from equations (11,12,13, and 14) and shown in table 3.
dlct
max
1
CR (11)
dlctCR (12)
ct
0 nFR
RTI (13)
0
0et nFAC
IK (14)
Where ωmax = 2 π ƒ, Cdl is the double layer capacitance, R = 8.314 J K-1 mol-1, F = 96
486 C mol-1, n =1, 0C is the concentration of [Fe(CN)6]3-/4- = 5 x 10⁻⁶ mol cm-3. The
maximum frequency values (f) where taken from Figure 27 (15.82 Hz and 8.85 Hz for
Ag-AuNPs/GCE and bare GCE, respectively).
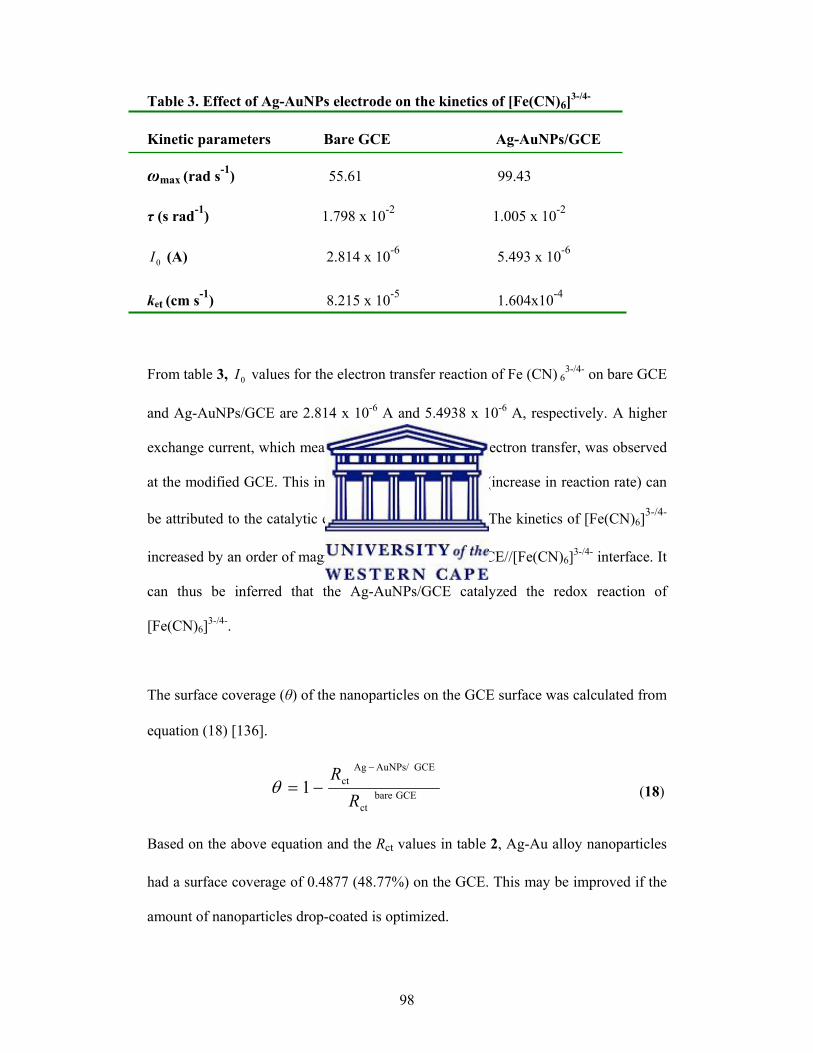
98
Table 3. Effect of Ag-AuNPs electrode on the kinetics of [Fe(CN)6]3-/4-
Kinetic parameters Bare GCE Ag-AuNPs/GCE
ωmax (rad s-1) 55.61 99.43
τ (s rad-1) 1.798 x 10⁻² 1.005 x 10⁻²
0I (A) 2.814 x 10⁻⁶ 5.493 x 10⁻⁶
ket (cm s-1) 8.215 x 10⁻⁵ 1.604x10⁻⁴
From table 3, 0I values for the electron transfer reaction of Fe (CN) 63-/4- on bare GCE
and Ag-AuNPs/GCE are 2.814 x 10⁻⁶ A and 5.4938 x 10⁻⁶ A, respectively. A higher
exchange current, which means increase in the rate of electron transfer, was observed
at the modified GCE. This increase in electron transfer (increase in reaction rate) can
be attributed to the catalytic effect of the nanoparticles. The kinetics of [Fe(CN)6]3-/4-
increased by an order of magnitude at the Ag-AuNPs/GCE//[Fe(CN)6]3-/4- interface. It
can thus be inferred that the Ag-AuNPs/GCE catalyzed the redox reaction of
[Fe(CN)6]3-/4-.
The surface coverage (θ) of the nanoparticles on the GCE surface was calculated from
equation (18) [136].
GCEbarect
GCEAuNPs/Agct1R
R
(18)
Based on the above equation and the Rct values in table 2, Ag-Au alloy nanoparticles
had a surface coverage of 0.4877 (48.77%) on the GCE. This may be improved if the
amount of nanoparticles drop-coated is optimized.

99
4.2 Synthesis and Characterization of PPy/GCE
Figure 28 shows the cyclic voltammogram of 0.1M pyrrole in 0.1 M LiClO4 on GCE
at a scan rate of 50 mV s-1 for 10 cycles. The deposition of a polymer was observed to
occur at the GCE due to the increase in current with each successive sweep.
Figure 28. Polymerization of pyrrole in 0.1 M LiClO4 at a scan rate of 50 mV s-1.
4.2.1 Characterization of PPy/GCE in 0.1 M LiClO4.
CV is very often used to characterize conducting polymer films. This is the method of
choice for studying the reversibility of electron transfer because the oxidation and
reduction can be monitored in the form of a current –potential diagram. Cyclic
voltammetry results of PPy indicated the existence of two redox couples a1/a2 and
b1/b2. The multiscan voltammogram of the PPy-modified GC electrode in 0.1 M
LiClO4 is shown in Figure 29. Both peak potentials and corresponding peak currents
varied, which showed that the polymer was electroactive and diffusion of electrons
was taking place along the polymer chain [137]

100
Figure 29 Multiscan voltammograms of PPy characterization in 0.1 M LiClO4 at
different scan rates: (a) 10 mV s-1; (b) 50 mV s-1; (c) 75 mV s-1; (d) 100 mV s-1; (e)
150 mV s-1; (f) 200 mV s-1; (g) 250 mV s-1; (h) 300 mV s-1; (i) 350 mV s-1.(initial
potential: 500 mV).
The linear dependence of peak currents of cathodic peak I (Figure 29 peak a1) on the
scan rate (Figure 30) indicated that we have a thin film of surface-bound conducting
electroactive polymer, undergoing rapid reversible electron transfer reaction [137].

101
Figure 30. A plot of current versus scan rate.
The oxidation or reduction of polypyrrole requires two simultaneous processes: (i) the
transfer of electrons either from or to polypyrrole and (ii) the diffusion of the
counterion, or in some cases the diffusion of the cation into or out of the polypyrrole
film to maintain charge neutrality. The redox mechanism of polypyrrole is described
by one-electron transfer step;
PPy PPy+ + e- (1)
where PPy is the neutral species and PPy+ is the radical cationic species or polaron
(one positive charge localized over three to four monomer units). The polaron can
further be oxidized;
PPy+ PPy++ + e- (2)
where PPy++ is the dicationic species or bipolaron (two positive charges localized over
three to four monomer units). This explains the existence of two reduction peaks in
the PPy; one strong (Figure 29 curve a1) and the other weak (Figure 29 curve b1)
when characterized in 0.1 M LiClO4. On the cathodic scan, the dicationic species

102
(PPy++) was reduced to the radical cationic species (PPy+) which is responsible for
peak a1 (Figure 29 a1) while the radical cationic species was further reduced to the
neutral PPy species (Figure 29 peak b1). During reverse scanning (anodic scan), the
neutral species PPy was oxidized to the dicationic species or bipolaron (PPy++)
denoted by peak a2 (Figure 29 peak a2). This is in line with previously reported works
[81]. However, at high scan rates a second oxidation peak occurred (Figure 29 peak
b2) as a result of the oxidation of the polaron (cationic species, PPy+) to bipolaron
(dicationic species, PPy++). It is worth noting that, both cationic species (polaron) and
dicationic species (bipolarons) were present in the film containing lithium perchlorate.
Lithium perchlorate was used as a dopant to enhance electrical neutrality during
polymerization. The surface concentration of the PPy film on the surface of the GC
electrode, *ppyΓ was estimated from a plot of Ip against v in accordance with the
Brown –Anson model [109] using the equation:
RT
AvΓFnI
4
*ppy
22
p (19)
where n represents the number of electrons transferred (2), F is the faraday constant
(96,584 C mol-1), *ppyΓ is the surface concentration of the PPy film (mol cm-2), A is
the surface area of the electrode (0.071 cm2), v is the scan rate (V s-1), R is the gas
constant (8.314 J (mol K)-1 and T is the absolute temperature of the system (298 K).
The surface concentration of PPy film, *ppyΓ was estimated to be 2.166 x 10⁻⁹ mol cm-
2. This was in agreement with the values found in literature [115]. On increasing the
scan rate, the magnitude of the peak current increased. However, the peak potentials

103
shifted to more positive potentials and became broad. This shows that the peak
currents are diffusion-controlled [137].
To test for the electrical conductivity of the conducting polymer and to confirm
whether the polymer was overoxidized during polymerization, PPy-modified
electrode was characterized in 5 mM K3Fe(CN)6 redox probe. The PPy/GCE showed
a higher peak current enhancement compared to the bare GCE. This is because PPy is
a good conducting polymer and hence allowed electrons to flow faster from the
solution to the electrode resulting to a high peak height (Figure 31). The data obtained
from Figure 31 was recorded in table 4.
Figure 31. Cyclic Voltammograms of bare GCE and PPy/GCE in 5 mM
K3Fe(CN)6 at a scan rate of 50 mV s-1.

104
Table 4. CV data for bare GCE and PPy/GCE in 5 mM K3Fe(CN)6. Electrode Epa (mV) Epc (mV) Ipa (A) Ipc (A) Eº′ (mV) ΔEp (mV)
Bare GCE 317 170 -5.53 x 10⁻⁵ 5.70 x10⁻⁵ 243.5 147
PPy/GCE 282 218 -7.23 x 10⁻⁵ 6.99 x 10⁻⁵ 250.0 64
The peak to peak separations (ΔEp) were 147 mV and 64 mV at the bare GCE and
PPy/GCE respectively as shown in table 4. The results indicate that the presence of
the conducting PPy polymer increased the electroactive surface area of the electrodes
and enhanced faster electron transfer between the solution and the electrode compared
to the bare GCE as depicted by the increase in current and the decrease in peak
separation. Thus PPy has been shown to be a good conducting polymer. Based on the
conductivity of the electrodeposited PPy polymer, the possibility of the polymer being
over-oxidized was ruled out since overoxidized PPy is a non-conducting polymer
[11]. It was therefore of great importance to overoxidize the PPy.
4.3 Overoxidation of polypyrrole.
PPy was overoxidized in 0.1 M NaOH at a potential of 1.0 V for 420 s as shown in
Figure 32. The overoxidation is indicated by the slow decay of the current after
reaching a maximum as reported by Kaplin et al. [81].

105
Figure 32. Overoxidation of PPy in 0.1 M NaOH for 420 s.
The overoxidized polypyrrole has porous structures thus allows the accumulation of
nanoparticles. Ag-Au alloy nanoparticles were immobilized on the overoxidized PPy
modified electrode and denoted as PPyox/Ag-AuNPs/GCE and was characterized in
K3Fe (CN)6 as a probe to test its electrical conductivity and to confirm whether the
PPy polymer was overoxidized and investigate the catalytic effect of the deposited
nanoparticles as shown in section 4.4.
4.4 Electrochemical characterization of PPyox/Ag-AuNPs/GCE.
PPyox is prepared by oxidizing PPy to a higher oxidation state after which it becomes
susceptible to nucleophilic attack [83]. This process usually results in the addition of
carbonyl functionality to the pyrrolic rings with a consequent loss of conjugation and
hence the loss inherent electronic conductivity [83, 138]. A PPyox film behaves like a
non-conducting polymer on an electrode (GCE in this case) and blocks electron

106
transfer. Hence, our observation (Figure 33, curve a) of lower peak currents and a
larger peak to peak separation (ΔEp = 173 mV) indicated that there was slower
electron transfer compared to that recorded with the bare GCE (Figure 33 curve b,
ΔEp = 111 mV). Moreover, the film is negatively charged with a large loss of
electroactivity [139-140]. The negative charge of the layer should be unfavorable for
the approaching of ferricyanide anions. However, the purpose of the overoxidizing the
PPy was to exploit the fact that this process results in a polymer with pores on its
surface, which creates a better condition for the attachment of nanoparticles [11].
According to the cyclic voltammograms of the K3Fe(CN)63-/4- redox probe shown in
Figure 33, after deposition of the Ag-Au alloy nanoparticles in the presence of
electrodeposited PPyox-film on the GCE’s surface (curve c), the peak current was
enhanced by 25% and the peak-to-peak separation (ΔEp = 82 mV) was reduced by 91
mV when compared to the CV recorded with PPyox film-modified electrode without
the Ag-Au NPs. Relative to the bare GCE, the increased surface roughness and the
newly induced surface functional groups and micro/nano catchment sites of the
PPyox/GCE might have enhanced the loading of the nanoparticles and, thus, created
significant change in the surface area and the kinetics involved. The data obtained
from Figure 33 were recorded in table 5.
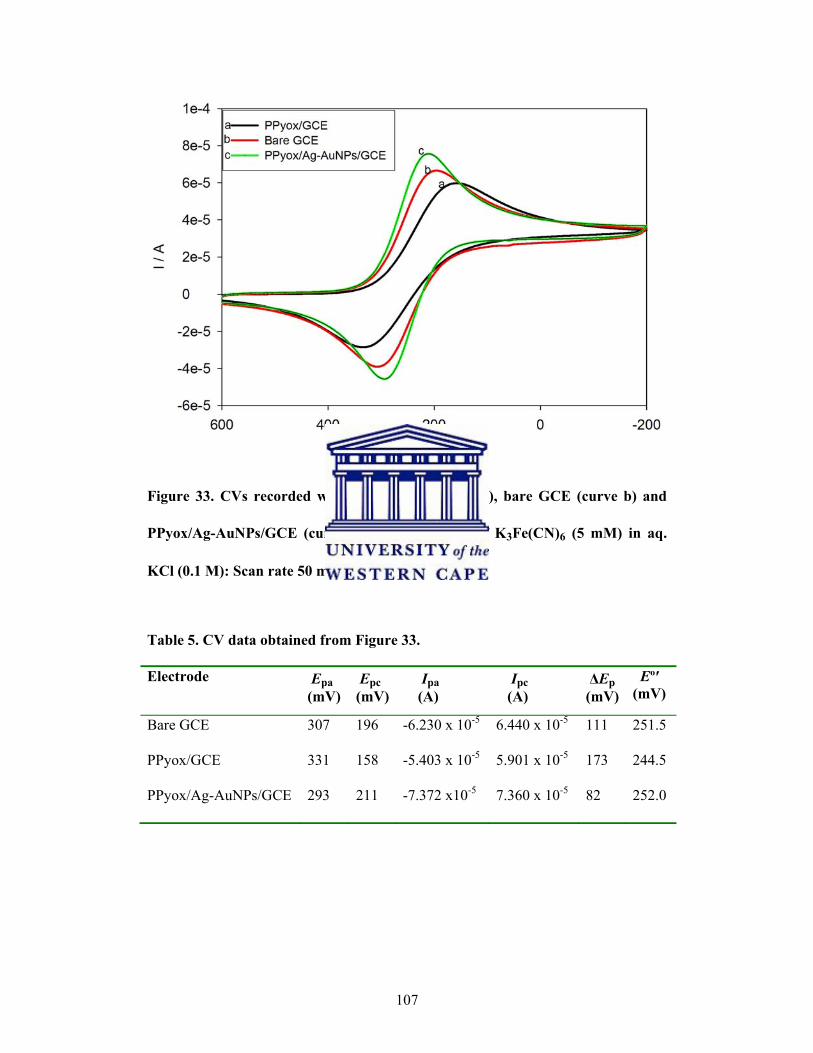
107
Figure 33. CVs recorded with PPyox/GCE (curve a), bare GCE (curve b) and
PPyox/Ag-AuNPs/GCE (curve c) in the presence of K3Fe(CN)6 (5 mM) in aq.
KCl (0.1 M): Scan rate 50 mV s-1.
Table 5. CV data obtained from Figure 33.
Electrode Epa (mV)
Epc (mV)
Ipa (A)
Ipc (A)
ΔEp (mV)
Eº′ (mV)
Bare GCE 307 196 -6.230 x 10⁻⁵ 6.440 x 10⁻⁵ 111 251.5
PPyox/GCE 331 158 -5.403 x 10⁻⁵ 5.901 x 10⁻⁵ 173 244.5
PPyox/Ag-AuNPs/GCE 293 211 -7.372 x10⁻⁵ 7.360 x 10⁻⁵ 82 252.0

108
CHAPTER 5
5.0 RESULTS AND DISCUSSION 2
5.1 Response of the electrochemical sensor on some monitored PAHs.
5.1.1 Electrocatalytic oxidation of anthracene (AN).
Experiments on the electrocatalytic oxidation of anthracene were investigated using
different modified electrodes in acetonitrile with LiClO4 as the supporting electrolyte.
The electrochemical processes observed at all electrodes were only for the oxidation
of anthracene. The following discussion is based on their cyclic voltammetric
responses (see Figure 34) to anthracene (3.56 x10⁻⁴ M) dissolved in the above
solution. The anodic peak around 1200 mV for anthracene was not associated with the
cathodic peak. This irreversible behaviour suggested that anthracene was oxidized and
then reacted to form a new product (anthraquinone) [72]. Scheme 7 shows some of
the expected products from oxidation of anthracene. Hydrolysis of the radical even in
the most anhydrous solutions is likely. If hydrolysis occurs before dimerisation and is
followed by further oxidation and loss of protons, 9-anthranol (A) would be produced.
Rapid keto-enol equilibrium is established and greatly favours the keto isomer, 9-
anthrone (D), which is easily oxidized thus forming bianthrone (E). If a second
hydrolysis occurs before keto-enol tautomerisation, then the product, 9,10-
dihydroxyanthracene (B) would be produced, which can be readily oxidized to
anthraquinone (C) [141]. According to Christopher et al., [141] anthraquinone is the
most likely product formed when little addition of water is added to acetonitrile.

109
HH 2Oe-
+
OH
e-
-2 H +
-2 e-
-2 H +
H 2 O
O H
OH
-2 e-
-2 H+
O
O
+
(A)(B)(C)
H 2O
2
1
O
HH
-H+ -e-
O
(D)
(E)
o
Scheme 7. Outline of various products expected from the oxidation of
anthracene.
From Figure 34, PPyox/Ag-Au alloy nanoparticles modified electrode showed an
anodic peak current which was observed to be 84% higher than that for the bare
electrode (Figure 34, curve f). However, the AgNps/GCE, AuNPs/GCE, Ag-
AuNPs/GCE and PPyox/GCE exhibited peak enhancement of 4.69%, 15.27%,
28.88% and 70% respectively compared to the bare GCE (Figure 34).

110
Figure 34. CV of 3.56 x 10⁻⁴ M anthracene at bare GCE (curve a), AgNPs/GCE
(curve b), AuNPs/GCE (curve c), Ag-AuNPs/GCE (curve d), PPyox/GCE (curve
e) and PPyox/Ag-AuNPs/GCE (curve f) in acetonitrile and 0.1 M LiClO4; Scan
rate 100 mV s-1.
The better electrocatalytic performance of the AgNPs/GCE, AuNPs/GCE and Ag-
AuNPs/GCE to the oxidation of anthracene as shown by their higher amperometric
responses compared to the bare GCE might be attributed to the presence of
nanoparticles on GCE. According to Figure 34, the electrode which was modified
with the bimetallic alloy nanoparticles (curve d) exhibited higher catalytic properties
compared to the monometallic nanoparticles modified electrodes (curve b and c). A
similar observation was reported in the literature [142]. However, the contribution of
modifying the GCE with PPyox (curve e) was most dominant as the PPyox/GCE

111
alone exhibited about 70% increase in the anodic peak compared to the bare electrode.
On deposition of the bimetallic Ag-Au nanoparticles over the PPyox/GCE, the anodic
peak was observed to slightly increase to about 84% as shown by the response of the
PPyox/Ag-AuNPs/GCE (curve f). The catalytic effect of combining PPyox with Ag-
Au NPs as evidenced by the remarkable enhancement in the peak height for
anthracene oxidation might be attributed to the adsorptive ability of PPyox film and
its high nanoparticle-loading nano-porous structure allowing the deposition of the Ag-
Au NPs which have high catalytic properties. A summary of the thermodynamic data
obtained from Figure 34 is shown in table 6.
Table 6. Anodic current response data for the development of the sensor
(see Figure 34).
Electrode Epa ( mV) Ipa (A)
Bare GCE 1148 2.778 x 10⁻⁵
AgNps/GCE 1150 2.900 x 10⁻⁵
AuNPs/GCE 1160 3.193 x 10⁻⁵
Ag-AuNPs/GCE 1162 3. 537 x 10-5
PPyox/GCE 1162 4.657 x 10⁻⁵
PPyox/ Ag-AuNPs/GCE 1181 5.225 x 10⁻⁵
The effect of potential scan rate was investigated. Increasing the scan rates caused an
increase in the peak current. Figure 35 shows the CV of PPyox/Ag-AuNPs/GCE upon
addition of 3.56 x 10⁻⁴ M anthracene at different scan rates. The peak current for
anthracene increased linearly with the square root of the sweep rate (v½) over the
range 20-250 mV s-1 with a linear regression of Ipa(A) = -4.911 x 10⁻⁶ - 3.993 x 10⁻⁶
v½(mV s-1)½ (r2= 0.999) (Figure.36) denoting that the electrochemical process was

112
limited by the rate of diffusion of anthracene from the solution to the electrode
surface. Moreover, on increasing the scan rate, the magnitude of the peak current
increased. However, the peak potentials shifted to more positive potentials. This also
confirmed that the peak currents were diffusion-controlled [137]
Figure 35. CVs of PPyox/Ag-AuNPs/GCE upon addition of 3.56 x 10⁻⁴ M
anthracene at different scan rates.

113
Figure 36. A plot of root scan rate versus peak current.
5.1.1.1 Analytical application for anthracene detection.
The cyclic voltammogram of PPyox/Ag-Au-modified electrode in acetonitrile and
LiClO4 (0.1 M) containing different concentrations of anthracene are shown in Figure
37. A calibration curve (Figure 38) based on the anodic peak heights from Figure 37,
plotted against concentration, was found to be satisfactorily linear (r2 = 0.995) for
analytical application of this sensor. The anodic peak potential of anthracene at the
PPyox/Ag-Au film modified electrode was at about 1181 mV [72]. This was
confirmed by the use of SWV in Figure 39 which showed similar results. Lower
concentrations of anthracene were also determined using SWV (Figure 39 inset) and a
calibration plot drawn as shown in Figure 40.
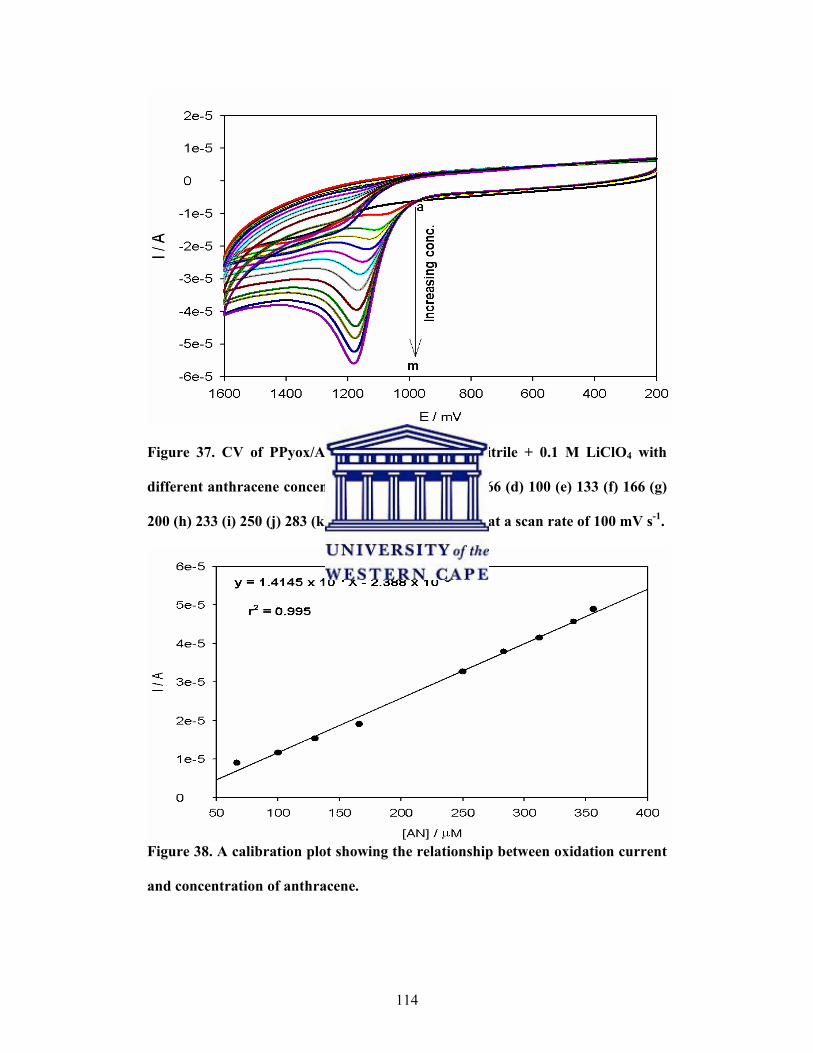
114
Figure 37. CV of PPyox/Ag-AuNPs/GCE in acetonitrile + 0.1 M LiClO4 with
different anthracene concentration: (a) 0, (b) 33, (c) 66 (d) 100 (e) 133 (f) 166 (g)
200 (h) 233 (i) 250 (j) 283 (k) 312 (l) 340 (m) 356 µM) at a scan rate of 100 mV s-1.
Figure 38. A calibration plot showing the relationship between oxidation current
and concentration of anthracene.

115
Figure 39. Anodic difference SWV of PPyox/Ag-AuNPs/GCE in acetonitrile + 0.1
M LiClO4 with different anthracene concentration: (a) 0, (b) 3, (c) 6, (d) 10, (e)
13, (f) 16, (g) 20, (h) 23, (i) 26, (j) 28, (k) 33, (l) 66, (m) 100, (n) 133, (o) 166, (p)
200, (q) 233, (r) 250, (s) 283, (t) 312, (u) 340, (v) 356 µM. Inset shows the curves
at low concentrations.
Figure 40. A calibration plot showing the relationship between current and
concentration of anthracene. Inset shows a calibration plot at low concentration.

116
Based on the SWV measurements, a linear relationship between the anodic current
and anthracene concentration was attained over the range of 3.0 x 10⁻⁶ to 3.56 x 10⁻⁴
with a correlation coefficient of 0.991. The limit of detection for anthracene from
standard solutions, calculated as the concentration corresponding to the signal three
times the standard deviation of blank measurements was 1.69 x 10⁻⁷ M.
While the above calibration was based on kinetic principle, it was also interesting to
see how the electrode would perform under steady state condition. Figure 41 shows
the steady state amperometry response of the sensor for successive additions of
anthracene (3.0 µM each time) into the acetonitrile and 0.1 M LiClO4 solution
sequentially. From the steadystate amperogram (Figure 41), successive additions of
AN resulted in favorable responses on the PPyox/Ag-AuNPs/GCE achieving
steadystate within 4 s. The linear dependence of current response on the AN
concentration as shown in the calibration curve (Figure 41 inset) was linear in the
range 3.0 x 10⁻⁶ to 5.9 x 10⁻⁴ M (r2 = 0.992).

117
Figure 41. Current-time plot for the electrochemical sensor response to
successive addition of 3.0 μM anthracene at a constant potential of 1181 mV. The
measurements were carried out in a continuously stirred acetonitrile solution of
LiClO4 (0.1 M). The inset shows a calibration plot of current against concentration.
5.1.1.2. Interferences to AN detection.
During the over oxidation of pyrrole, higher density carbonyl groups such as >C=O
and –COO- can be generated on the backbone of the PPyox-film [11]. This is
favorable for cation species (+) to be accumulated onto the film and then be
catalytically oxidized at the electrode. Several metal cations are found in waste water
thus the need to investigate how they affect the detection of the PAHs using the
developed sensor. In the catalytic oxidation of anthracene, several interference
substances have been reported. These substances include inorganic species such as
Na+, Cu2+, Fe2+, Mn2+, Cl-, SO42-, and NO3
- [126]. Interference studies were therefore
carried out with the above inorganic species. Figure 42 shows the SWV of the sensor
in presence of anthracene and the interferences. The sensor in anthracene alone

118
generated a current of -2.706 x 10⁻⁵A while a mixture of anthracene and interferences
showed a current of -2.627 x 10⁻⁵A upon addition of 1:1 quantity of the interferences
and anthracene, with the anthracene concentration being 3.12 x 10⁻⁴ M. It was found
that the addition of the interferences caused little decrease of the peak current and
hence a negligible interference of 3.0% was observed. The inorganic species therefore
were expected to cause no meaningful interference in the detection of anthracene.
Figure 42. SWV of PPyox/Ag-AuNPs/GCE in acetonitrile and 0.1 M LiClO4 in
presence of anthracene alone and a mixture of anthracene and interferences.
5.1.1.3 Stability studies.
The stability of PPyox/Ag-AuNPs/GCE sensor was investigated by measuring the
electrode response with 3.56 x 10⁻⁴ M anthracene every 4 days by SWV (Figure 43).
It was found that there was almost 19.26% decrease of the peak current response on

119
the modified electrode for 3.56 x 10⁻⁴ M after 2 weeks thus the modified electrode
retained 80.74% of its initial response after it was kept in refrigerator at 4 °C for 12
days. This can be attributed to the excellent stability of the film.
Figure 43. SWV of PPyox/Ag-AuNPs/GCE in acetonitrile and 0.1 M LiClO4 in
presence of anthracene (3.56 x 10⁻⁴ M) at the 1st day, 4th day, 8th and 12th day.
5.1.1.4. Reproducibility studies.
The stability and reproducibility are key elements of electrode performance. The
reproducibility of the PPyox/Ag-Au nanoparticles modified electrode was
investigated in the presence of 3.56 x 10⁻⁴ M anthracene in acetonitrile and 0.1 M
LiClO4. Square wave voltammetric experiments were repeatedly performed 6 times
with the same PPyox/Ag-Au nanoparticles modified electrode in the solution of 3.56
x 10-4 M anthracene. The relative standard deviation was 1.2% (n = 6) confirming that
the results were reproducible.

120
5.1.2 Electrocatalytic oxidation of phenanthrene (PHE).
Comparative experiments on electrocatalytic oxidation of PHE were investigated
using different electrodes. Compared with the response of PHE at bare GCE in
acetonitrile containing 2.5 x 10⁻⁴ M PHE, PPyox/Ag-AuNPs/GCE exhibited much
higher current response sensitivity towards the oxidation of phenanthrene. For control
experiments, Ag-AuNPs/GCE and PPyox/GCE were used as working electrodes. The
results indicated that the response sensitivity of PPyox/Ag-AuNPs/GCE towards
phenanthrene electro oxidation was higher than those of bare GCE (Figure 44 curve
a), Ag-AuNPs/GCE (Figure 44 curve b) and PPyox/GCE (Figure 44 curve c). It can
be explained by the synergetic effect of Ag-Au alloy nanoparticles which were
incorporated in the PPyox film and thus acted as nanoreactors facilitating electron
transfer while the PPyox behaved like nanopores which enhanced adsorption of
phenanthrene. Similar results were observed using SWV as shown in Figure 45.

121
Figure 44. CV of 2.5 x 10⁻⁴ M PHE at bare GCE (curve a), Ag-AuNPs/GCE
(curve b), PPyox/GCE (curve c) and PPyox/Ag-AuNPs/GCE (curve d) in
acetonitrile and 0.1 M LiClO4.
Figure 45. SWV of 2.5 x 10⁻⁴ M PHE at bare GCE (curve a), Ag-AuNPs/GCE
(curve b), PPyox/GCE (curve c) and PPyox/Ag-AuNPs/GCE (curve d) in
acetonitrile and 0.1 M LiClO4.

122
The SWV of the sensor at different concentrations of PHE is shown in Figures 46.
The oxidation current displays a good linear response to the concentration of PHE (r2
= 0.9994) (Figure 47). A linear relationship between anodic current and PHE
concentration was attained over the range of 3.3 x 10⁻⁵ to 2.83 x 10 -4 M with
detection limit of 1.5983 µM).
Figure 46. Anodic difference SWV of PPyox/Ag-Au NPs/GCE in acetonitrile +
0.1 M LiClO4 with different PHE concentrations: 0, 33, 66, 100, 133, 166, 200,
233, 250, 283 µM).

123
Figure 47. A calibration plot showing the relationship between oxidation current
and concentration of PHE.
The effect of potential scan rate was investigated as shown in Figure 48. The
oxidation peak current increased with the increase in scan rate and exhibited a linear
relation to the square root of the scan rate, v½, (Figure 49) in the range from 20-80 mV
s-1, with linear regression equation Ipa/A = -1.5735 x 10⁻⁵ - 4.675 x 10⁻⁶ v½/(mV s-1)½ (
correlation coefficient, r2 = 0.996), suggesting that the oxidation of PHE at the
PPyox/Ag-AuNPs modified electrode was a diffusion controlled process.

124
Figure 48. CV of PPyox/Ag-AuNPs/GCE in acetonitrile and 0.1 M LiClO4 at
different scan rates upon addition of 2.33 x 10⁻⁴ M PHE.
Figure 49. A plot of root scan rate versus peak current of PHE.

125
5.1.2.1 Reproducibility studies.
The reproducibility of the PPyox/Ag-Au nanoparticles modified electrode was
investigated in the presence of 2.5 x 10⁻⁴ M PHE in acetonitrile and 0.1 M LiClO4.
SWV experiments were performed 6 times with the same PPyox/Ag-Au nanoparticles
modified electrode in a solution of 2.5 x 10⁻⁴ M PHE. The sensitivity remained almost
the same with a relative standard deviation of 5.06% at all the six times confirming
that the results were reproducible.
5.1.2.2 Interference studies.
In the catalytic oxidation of phenanthrene, several interference substances have been
reported. These substances include inorganic species such as Na+, Cu2+, Fe3+, Mn2+,
Cl-, SO42-, and NO3
- [126]. Interference studies were carried out with the above
inorganic species. Using SWV measurements, PHE alone generated a current of -
4.824 x 10⁻⁶A while a mixture of PHE and interferences generated -4.723 x 10⁻⁶ A
upon addition of 1:1 of the interferences when the PHE concentration was 2.5 x 10⁻⁴
M. It was found that the addition of the interferences caused little decrease of the
anodic peak current and hence a negligible interference of 2.1% was observed as
shown in Figure 50.

126
Figure 50. SWV of PPyox/Ag-AuNPs/GCE in acetonitrile and 0.1 M LiClO4 in
presence of PHE alone and a mixture of PHE and interferences.
5.1.3. Electrocatalytic oxidation of AN and PHE.
PHE and AN have similar structures and properties. Their simultaneous determination
was done using the developed sensor (PPyox/Ag-AuNPs/GCE). Figure 51 shows
cyclic voltammograms of AN (curve a), PHE (curve b) and blank (acetonitrile and
0.1M LiClO4) (curve c) at a scan rate of 50 mV s-1 in acetonitrile and 0.1 M LiClO4.
From Figure 51, one oxidation peak was observed for AN (curve a) and PHE (curve
b), respectively. The modified electrode showed no response when no addition of AN
and PHE was done (curve c). It is noteworthy that the oxidation peaks for the PHE
and AN were at distinct potentials.

127
Figure 51. Voltammetric curves of 3.56 x 10⁻⁴ M solution of AN (curve a), 2.30 x
10-4 M solution of PHE (curve b) and 0.1 M LiClO4 in acetonitrile (curve c) using
PPyox/Ag-AuNPs/GCE.
For simultaneous oxidation of AN and PHE, a mixture of PHE and AN (2.30 x 10⁻⁴ M
each) were spiked into the electrolyte and acetonitrile and mixed thoroughly by the
use of a magnetic stirrer. Two peaks were obtained corresponding to the oxidation of
AN and PHE respectively as shown in Figure 52 (peaks a and b). Similar results were
obtained using SWV as shown in Figure 53. It was evident that the voltammogram
peaks i.e. both CV and SWV of the mixture solution of AN and PHE correlated well
with that of their individual solutions (Figure 51). It is noteworthy that, elimination of
the fouling of the electrode surface by the oxidation products could be achieved and
the precise oxidation of AN in the presence of PHE is possible at the PPyox/Ag-
AuNPs/GCE. The voltammetric signals of AN and PHE remained unchanged in the
subsequent sweeps, indicating that the PPyox/Ag-AuNPs modified electrode does not
undergo surface fouling.

128
Figure 52. CVs of PPyox/Ag-AuNPs/GCE in acetonitrile and 0.1 M LiClO4
(blank) (1) and a mixture of AN and PHE (2) at a scan rate of 50 mV s-1.
Figure 53. SWVs of PPyox/Ag-AuNPs/GCE in acetonitrile and 0.1 M LiClO4
(blank) (1) and a mixture of AN and PHE (2).

129
5.1.3.1 Effect of scan rate on the peak current in the binary mixture of AN and
PHE.
Figure 54 shows the cyclic voltammograms for the binary mixtures of 2.30 x 10⁻⁴ M
AN and 2.30 x 10⁻⁴ M PHE in 0.1 M LiClO4 and acetonitrile at the PPyox/Ag-AuNPs
modified electrode at different scan rates. The oxidation peak potentials of the two
compounds were observed to shift positively with the increase in scan rate. In
addition, the oxidation peak current for the oxidation of AN exhibited a linear relation
to the square root of the scan rate, v½, in the range from 20 to 450 mV s-1, with the
linear regression equation Ipa/A = -1.446 x 10⁻⁶ - 8.604 x 10⁻⁷ v½/ (mV s-1)½
(correlation coefficient, r2 = 0.9981), suggesting that the oxidation of AN at the
modified electrode was diffusion-controlled process (Figure 55). Simultaneously, the
oxidation peak current for the oxidation of PHE also exhibited a linear relation to the
square root of the scan rate, v½, in the range from 20 to 450 mV s-1, with the linear
regression equation Ipa/A = -4.115 x 10⁻⁶ - 2.826 x 10⁻⁶ v½/ (mV s-1) ½ (correlation
coefficient, r2 = 0.9995), suggesting that the oxidation of PHE at the modified
electrode was also a diffusion-controlled process (Figure 56).

130
Figure 54. CVs for the binary mixtures of 2.30 x 10⁻⁴ M AN and 2.30 x 10⁻⁴ M
PHE in 0.1 M 0.1 M LiClO4 and acetonitrile at the PPyox/Ag-AuNPs/GCE at
different scan rates: (a) 20 mV s-1 (b) 40 mV s-1 (c) 80 mV s-1 (d) 100 mV s-1 (e)
150 mV s-1 (f) 200 mV s-1 (g) 250 mV s-1 (h) 300 mV s-1 (i) 350 mV s-1 (j) 400 mV s-
1 (k) 450 mV s-1.
Figure 55. A plot of root scan rate versus peak current of AN.

131
Figure 56. A plot of root scan rate versus peak current of PHE.
5.1.3.2. Simultaneous determination of AN and PHE.
A series of mixture standard solutions of PHE and AN, in which the concentration of
one component was varied and the other was fixed were prepared and determined.
Figure 57 shows the SWV obtained when the concentration of PHE was kept constant
and the concentration of AN was increased successively. The oxidative peak current
for AN increased linearly with the increase in AN concentration in the range of 3.0 x
10-5 Μ to 3.12 x 10⁻⁴ Μ.The linear regression equation was Ipa/A = -9.268 x 10⁻⁷ +
2.736 x 10⁻⁸ C / μΜ (correlation coefficient, r2 = 0.9987) (see Figure 58) and the
detection limit was 23.0 μΜ in the presence of 2.30 x 10⁻⁴ M PHE. It can be observed
that, with increasing concentration of AN, the amperometric current increased (Figure
57, peak 1) while that of PHE (peak 2) kept almost constant. Thus it can be confirmed
that the responses of AN and PHE at the modified electrode are independent.

132
Figure 57. SWV for the binary mixtures of AN and PHE at PPyox/Ag-Au
NPs/GCE in 0.1 M LiClO4 and acetonitrile, [PHE] was kept constant and [AN]
was changed (i.e. [AN]: (a) 0 (b) 30 (c) 60 (d) 100 (e) 130 (f) 166 (g) 200 (h) 230 (i)
250 (j) 280 (k) 312 μΜ).
Figure 58. A calibration plot of concentration versus peak current of AN.

133
When the concentration of AN was kept constant and PHE concentration increased,
there was a peak current increase with increase in concentration of PHE (Figure 59
peak 2) while that of AN kept almost constant (Figure 59 peak 1). The oxidative peak
current increased linearly in the range of 3.0 x 10⁻⁵ Μ to 2.80 x 10⁻⁴ Μ. The linear
regression equation was Ipa/A = -2.383 x 10⁻⁶ + 3.195 x 10⁻⁸ C / μΜ (correlation
coefficient, r2 = 0.9989) (Figure 60) and the detection limit was 24.0 μΜ in the
presence of 2.30 x 10⁻⁴ M AN.
Figure 59. SWV for the binary mixtures of AN and PHE at PPyox/Ag-Au
NPs/GCE in 0.1 M LiClO4 and acetonitrile, [AN] was kept constant and [PHE]
was changed (i.e. [PHE]: (a) 0 (b) 30 (c) 60 (d) 100 (e) 130 (f) 166 (g) 200 (h) 230
(i) 250 (j) 280 μΜ).

134
Figure 60. A calibration plot of concentration versus peak current of PHE.
Figure 61 represents the SWV measurements at increasing concentrations of AN and
PHE. As can be seen, there was peak enhancement upon addition of both AN (Figure
61 peak 1) and PHE solutions (Figure 61 peak 2).

135
Figure 61. SWV for the binary mixtures of AN and PHE at PPyox/Ag-Au
NPs/GCE in 0.1 M LiClO4 and acetonitrile, at increasing [AN] and [PHE] (i.e. (a)
250 (b) 280 (c) 312 (d) 340 (e) 356 (f) 380 μΜ).
It can be observed that the sensor was able to simultaneously detect AN and PHE in a
mixture and that increasing the concentration of one does not affect the detection of
the other. Thus, the responses of AN and PHE at the developed sensor are
independent and that it showed excellent sensitivity, selectivity and antifouling
properties.
5.1.4 Determination of pyrene (Py).
The PPyox/Ag-AuNPs/GCE sensor was used to detect pyrene which is one of the
known teratogenic, carcinogenic and mutagenic polyaromatic hydrocarbons. Figure
62 shows the bare and the modified electrodes in the presence of 2.80 x 10⁻⁴ M
pyrene. A remarkable increase in oxidation current can be seen at the PPyox/Ag-

136
AuNPs/GCE (curve d) compared to the other modified electrodes. This demonstrated
the cooperative effect of PPyox and Ag-Au nanoparticles in the electrocatalytic
oxidation of pyrene.
Figure 62. SWV of 2.80 x 10⁻⁴ M pyrene at bare/GCE (curve a), Ag-AuNPs/GCE
(curve b), PPyox/GCE (curve c) and PPyox/Ag-AuNPs/GCE (curve d) in
acetonitrile and 0.1 M LiClO4.
SWV measurements at increasing concentration of pyrene are shown in Figure 63.
After pyrene was added in the acetonitrile and 0.1 M LiClO4, the peak current
increased obviously. A calibration curve of oxidation peak current and concentration
of pyrene was plotted (Figure 64) with a linear regression equation of Ipa/A = 9.8834 x
10-6 + 5.302 x 10⁻⁸ C / μΜ (correlation coefficient, r2 = 0.997). A linear relationship
between anodic current and pyrene concentration was attained over the range of 3.3 x
10-5 to 1.66 x 10⁻⁴ M with a detection limit of 2.7 μΜ.

137
Figure 63. SWV of PPyox/Ag-AuNPs/GCE at increasing concentration of pyrene
(a) 0 (b) 10 (c) 33 (d) 66 (e) 100 (f) 130 (g) 166 μΜ).

138
Figure 64. A calibration plot of current verses concentration of pyrene
5.1.4.1 Reproducibility.
The reproducibility of the PPyox/Ag-Au nanoparticles modified electrode was
investigated in the presence of 2.80 x 10⁻⁴ M pyrene in acetonitrile and 0.1 M LiClO4.
SWV experiments were performed for 6 times with the same PPyox/Ag-Au
nanoparticles modified electrode. The sensitivity remained almost the same with a
relative standard deviation (R.S.D) of 8.16% at all the six times confirming that the
results were reproducible. The results demonstrated that the PPyox/Ag-AuNPs/GCE
would improve both the sensitivity and reproducibility for the determination of pyrene
using SWV.

139
CHAPTER 6.
6.0 CONCLUSION AND RECOMMENDATIONS
6.1 Conclusion
Highly catalytic, stable and well dispersed Ag-Au alloy nanoparticles were
successfully prepared by the reduction of HAuCl4 and AgNO3 with sodium citrate.
The alloy formation was confirmed by optical absorption spectroscopy and TEM.
Consequently, overoxidized-polypyrrole was electrochemically synthesized and
characterized by electrochemical methods. A novel electrochemical sensor was
successfully fabricated based on the construction of nano-porous overoxidized-
polypyrrole (PPyox) template- deposited Ag-Au alloy nanoparticles which formed a
composite nano-electrode sensor, PPyox/Ag-AuNPs/GCE. The sensor exhibited a
strong electrocatalytic activity towards the oxidation of anthracene, phenanthrene and
pyrene. Moreover, the modified electrode with antifouling properties was able to
simultaneously detect anthracene and phenanthrene. This makes the method better
compared to the immunoassay techniques reported in literature.
In SWV determination, lower detection limits of anthracene, phenanthrene and pyrene
were estimated to be about 1.69 x 10⁻⁷ M, 1.59 x 10⁻⁶ M and 2.70 x 10⁻⁶ M,
respectively. Although these detection limits are slightly higher than those obtained
using High performance Liquid Chromatography (HPLC) and Gas Chromatography
(GC) techniques, they are within the concentration range of polyaromatic
hydrocarbons (PAHs) in contaminated waste water [13]. The work presented opens an
entirely new approach in the detection of PAHs by the use of polymers coupled with

140
alloy nanoparticles leading to the development of a simple, cheap, less time
consuming and environmentally friendly electrochemical method with antifouling
properties and lower detection limits.
6.2 Future work and Recommendation:
My thesis opens up an entirely new approach in the application of
electroanalytical techniques for the detection of PAHs by the use of
polymers coupled with alloy nanoparticles. Though, I used Ag-Au alloy
nanoparticles for my work, future work to further establish how other alloy
nanoparticles would behave is worthwhile.
Further optimization of this method and its application in the detection of
anthracene, phenanthrene and pyrene in waste water.
Chemical methods were used in the synthesis of the alloy nanoparticles.
Further investigation of the use of electrochemical method of synthesis is
worthwhile.
Further investigation on the use of the developed sensor in the detection of
more than two PAHs in waste water.

141
References.
1. West, L., World Water Day: A Billion People Worldwide Lack Safe Drinking
Water. 2006 [cited 17 April, 2010]; Available from:
http://environment.about.com/od/environmentalevents/a/waterdayqa.htm.
2. Carson, R., From silent spring to silent night : endocrine disruption ,
amphibian declines, and environmental justice. memorial lecture, pesticides
news; 70, December, 2005.
3. Jose Luis V., Lilia, A., and Alberto N., Application of Isotope Dilution to the
determination of anthracene in environmental samples by headspace solid-
phase microextraction and Gas Chromatography-Mass spectroscopy.
Microchimica Acta, 2006. 155: p. 435-439.
4. Fetzer, J.C., The chemistry and Analysis of the large polyaromatic
hydrocarbons. polyaromatic hydrocarbons, 2007. 27(2).
5. Blumer, M., Polycyclic aromatic compounds in nature. Scientific American
Journal, 2003. 234: p. 34-35.
6. Laura, C., Liliana, A., Marina, B., Licia, S., Omar, L., Carla V., Piero, E.C.,
Irene, M., Vito, F.C, Fustinoni, Biological monitoring of exposure to
polycyclic aromatic hydrocarbons by the determination of unmetabolized
compounds in urine. Toxicol, Lett., 2006. 162: p. 132-138.
7. Saravanabhavan, G., Helferty, A., Hodson, P.V., Brown, R.S., A multi-
dimensional high performance liquid chromatographic method for figure
printing polycyclic hydrocarbons and their alkyl-homologs in the heavy gas
oil fraction of Alaskan North Slope crude. J. Chromatogr. A, 2007. 1156: p.
124-133.

142
8. Sram, R.j., Beskid, O., Rossnerova, A, Rossner, P., Lnenickova, Z., Milkova,
A., Solansky, I., Binkova, B., Environmental exposure to carcinogenic
polyaromatic hydrocarbons-the interpretation of cytogenetic analysis by fish.
Toxicol. Lett., 2007. 172: p. 12-20.
9. Mielke, H.W., Wang, G.D., Gonzales, C.R., Powell, E.T., Le, B., Quach,V.N.,
PAHs and metals in the soils of inner –city and suburban New Orleans ,
Lousiana, USA. Environ. Toxicol. Pharmacol, 2004. 18: p. 243-247.
10. Fähnrich, K.A., Pravda M., and Guilbault G.G., Disposable amperometric
immunosensor for the detection of polycyclic aromatic hydrocarbons (PAHs)
using screen-printed electrodes. Biosensors and Bioelectronics, 2003. 18 (1):
p. 73-82.
11. Li, J., and X.-Q. Lin, Electrodeposition of gold nanoclusters on overoxidized
polypyrrole film modified glassy carbon electrode and its application for the
simultaneous determination of epinephrine and uric acid under coexistence of
ascorbic acid. Analytica Chimica Acta, 2007. 596(2): p. 222-230.
12. WHO, Guidelines of drinking-water Quality Geneva, 1998. vol. 1(2nd edition).
13. Kabzinski, A.K.M., J.C., Juszczak, R., Determination of polycyclic aromatic
hydrocarbons in water (including drinking water) of Lodz,. Journal of
environmental studies, 2002. 11(6): p. 695-706.
14. Sun, F., Littlejohn, D., and David Gibson M., Ultrasonication extraction and
solid phase extraction clean-up for determination of US EPA 16 priority
pollutant polycyclic aromatic hydrocarbons in soils by reversed-phase liquid
chromatography with ultraviolet absorption detection. Analytica Chimica
Acta, 1998. 364(1-3): p. 1-11.

143
15. Woodward K.L.A., G.M., Determination of polyaroamatic hydrocarbon using
immunoassays. Science Total Environment, 1984. 32: p. 103.
16. Colmsjo A., A.H.N., The handbook of environmental chemistry part 1, PAHs
and related coumpounds. springer-verlag, 1998. 3: p. 55.
17. Ferrer, R., Guiteras J., and Beltrán J.L., Development of fast-scanning
fluorescence spectra as a detection system for high-performance liquid
chromatography Determination of polycyclic aromatic hydrocarbons in water
samples. Journal of Chromatography A, 1997. 779 (1-2): p. 123-130.
18. Andrade Eiroa, A., E.V.B., López Mahía, P., Muniategui Lorenzo, S., Prada
Rodríguez, D. and Fernández Fernández. E., Determination of polycyclic
aromatic hydrocarbons (PAHs) in a complex mixture by second-derivative
constant-energy synchronous spectrofluorimetry. Talanta, 2000. 51: p. 677-
684.
19. Szolar, O.H.J., Separation of PAHs by capillary electrophoresis (CE)
equipped with laser-induced fluorescence journal of molecular Rec., 1996. 9:
p. 515.
20. Geffard, O., Geffard, A., His, E., Budzinski, H., Assessment of the
bioavailability and toxicity of sediment-associated polycyclic aromatic
hydrocarbons and heavy metals applied to Crassostrea gigas embryos and
larvae. Marine Pollution Bulletin, 2003. 46(4): p. 481-490.
21. Cai, Z.-Q., Zhu Y.-X., and Zhang Y., Simultaneous determination of dissolved
anthracene and pyrene in aqueous solution by synchronous fluorimetry.
Spectrochimica Acta Part A: Molecular and Biomolecular Spectroscopy, 2008.
69(1): p. 130-133.

144
22. Roman Edmund Sioda, B.F., Voltammetric oxidation of naphthalene
derivatives. Journal of Electroanalytical chemistry, 2008. 612 p. 147-150.
23. Zhou, M., Shiyo, Z., Houyi Ma, O., One-step synthesis of Au-Ag alloy
nanoparticles by a convenient electrochemical method. Physica E: Low-
dimensional Systems and Nanostructures, 2006. 33 (1): p. 28-34.
24. Grova, N.E.A., Detection of polycyclic aromatic hydrocarbon level in milk
collected near potential contamination sources. Journal of Agricultural and
Food chemistry, 2002. 50: p. 4640.
25. Lundstedt, S., Haglud, P., and Orberg, L., Degradation and formation of
polycyclic aromatic compounds during bioslurry treatment of an aged
gasworks soil. Journal of Environmental Toxicological Chemistry, 2003. 22:
p. 1413. .
26. De Voogt, P., V.H.P., Leonards, P., Klamer, J.C., Govers, H.,
Bioconcentration of polycyclic aromatic hydrocarbons in the guppy ( poecilia
reticulate). A quat Toxicol, 1991. 20: p. 169-194
27. Djomo, J.E., Ferrier, V., Narbonne,J.F., Monkiedje, A., Njine, T., Garrigues,
P., Toxic effects of some major polyaromatic hydrocarbons found in crude oil
and aquatic sediments on Scenedesmus subspicatus. Water Research, 2004 38
p. 1817–1821.
28. Wilson, S.C & Jones, K.C., Bioremediation of soil contaminated with
polynuclear aromatic hydrocarbons (PAHs); a review. . Environ. Pollut.,
1993. 81: p. 229-249.
29. Kielhorn, J.B., Guidelines for drinking water quality, Health criteria and
other supporting information, world health organisation, Geneva. 1998. 2: p.
123-152.

145
30. Potin, O., E. & Rafin, C., Biodegradation of polycyclic aromatic
hydrocarbons (PAHs) by Clasporium sphaerospermum isolated from an aged
PAH contaminated soil. FEMS Microbiology Ecology 2004. 51: p. 71-78.
31. Quantin, C., Joner, E.J., and Portal, J.M, PAH dissipation in contaminated
river sediment under oxic and anoxic conditions. Journal of Environmental
pollution, 2005. 134 (2): p. 315-322.
32. Associates, R.T.A., Persistent, bioaccumulative and toxic chemicals in central
and eastern European countries –state of the art report. Brno. 2004. 17.08, .
33. Ghosh U., S.G., Luthy R.G., Zare R.N., Microscale location, characterization
and association of polycyclic aromatic hydrocarbons on habor sediment
particles. Environ. sci. Techno., 2000. 34: p. 1729-1736.
34. Doong, R.A, C.K.P., Sun Y.C, Liao P.L., Composition and distribution of
organochlorine pesticide residues in surface sediments from Wu-shi river
estuary, Taiwan. mar. pollut. Bull., 2002. 45: p. 246-253.
35. Mackay, A.A., P.M.G., Enhanced concentrations of PAHs in groundwater at a
coal tar site. Environ. sci. Technol., 2001. 35: p. 1320-1328.
36. (ATSDR)., A.D.R., Public Health Statement, Polycyclic Aromatic
Hydrocarbons. Atlanta, GA: U.S. Department of Health and Human Services,
1990.
37. Faust, R.A., Oak Ridge National Laboratory, Chemical Hazard Evaluation
Group. Toxicity summary for Phenanthrene. Oak Ridge, 1993.
38. White, K.L., An overview of immunotoxicology and carcinogenic polycyclic
aromatic hydrocarbons. Environ. Carnog.Rev.C4 1986: p. 163-202.
39. Sims, R.C., M.R.O., Fate of polynuclear aromatic compounds (PNAs) in soil-
plant systems. Residue Rev., 1983. 88: p. 1-68.

146
40. Cerniglia, C.E., Microbial metabolism of polycyclic aromatic hydrocarbons.
Adva. Appl. Microbiol., 1984. 30: p. 31-71.
41. Lim, L.H., R.M.H., Harrad, S., The contribution of traffic to atmospheric
concentrations of polycyclic aromatic hydrocarbons. Environ. Sci. Technol.,
1999. 33: p. 3538-3542.
42. Cai, Q.Y., C.H.M., Wu, Q.T., Zeng Q.Y., Katsoyiannis A., Ferard J.F.,
Bioremediation of polycyclic aromatic hydrocarbons (PAHs)-contaminated
sewage sludge by different composting process. J. Hazard . Mater., 2007. 142
p. 535-542.
43. ATSDR., Public Health Statement, Polycyclic Aromatic Hydrocarbons.
Atlanta, GA: U.S. Department of Health and Human Services, 1990.
44. De Jong, W.H.E.A., Detection of immunotoxicity of benzo(a)pyrene in a
subaculate toxicity study after oral exposure in rats, . Toxicological Sciences,
1999. 50: p. 214.
45. Mueller, J.G., Chapman, P. &. Pritchard, P., Creosote-contaminated Sites.
Journal of environmental science and technology. , 1997. 23: p. 1197-1201.
46. Pickering, R.W., A toxicological review of polycyclic aromatic hydrocarbons.
Journal of Toxicology, 1999. 18: p. 101-135.
47. EUHCP, Polycyclic aromatic hydrocarbons-occurrence in food dietary
exposures and health effects, European Union Health and consumer products
Directorate General, 2002.
48. Nieva –Cano, M.J.R.-B., and Santos –Delgado, M.J, Determination of PAH in
food samples by HPLC with fluoremetric detection following sonication
extraction without clean-up. Analyst, 2001. 126: p. 1326.

147
49. Charis, P., Marston, C.P., Jennifer, F., Kay F., Olaf, H., Wan-Mohaiza, D.,
William, M.B., Effects of complex environmental mixture from coal tar
containing polycyclic aromatic hydrocarbons (PAHs) on tumor initiation ,
PAH-DNA binding and metabolic activation of carcinogenic PAH in mouse
epidermis, carcinogenesis, 2001. 22: p. 1077.
50. Melikkian, M., Identification of benzo(a)pyrene metabolites in cervical mucus
and DNA adducts in cervical tissues in humans by gas chromatography –mass
spectrometry. cancer letter, 1999. 146: p. 127.
51. Simko, P., Determination of polycyclic aromatic hydrocarbons in smoked
meat product and smoke flavoring food additives. Journal of chromatography
B, 2002. 770: p. 3.
52. Agency for Toxic Substances and Disease Registry (ATSDR), Toxicological
profile for polycyclic aromatic hydrocarbons,. Atlanta, GA: U.S. Department
of Health and Human Services, Public Health Service, 1995.
53. Ferrer, R., Guiteras, J., and Beltrán, J. L., Development of fast-scanning
fluorescence spectra as a detection system for high-performance liquid
chromatography determination of polycyclic aromatic hydrocarbons in water
samples. Journal of Chromatography A, 1997. 779: p. 123-130.
54. Andrade Eiroa, A., E.V.B., López Mahía, P., Muniategui Lorenzo, S., Prada
Rodríguez, D., and Fernández Fernández, E., Determination of polycyclic
aromatic hydrocarbons (PAHs) in a complex mixture by second-derivative
constant-energy synchronous spectrofluorimetry. Talanta, 2000. 51: p. 677-
684.
55. Cai, Z.-Q., Zhu, Y.X., and Zhang, Y., Simultaneous determination of dissolved
anthracene and pyrene in aqueous solution by synchronous fluorimetry.

148
Spectrochimica Acta Part A: Molecular and Biomolecular Spectroscopy, 2008.
69: p. 130-133.
56. Szekacs, A., L.H.M., Knopp D., Niessner R., A modified enzyme-linked
immunosorbent assay (ELISA) for polyaromatic hydrocarbons. Analytica
chimica acta, 1999. 399: p. 127-134.
57. Li, K., Chen, R., Zhao B., Liu, M., Karu A.E, Roberts V.A., Li, q.,
Monoclonal Antibody-Based ELISAs for Part-per-Billion Determination of
Polycyclic Aromatic Hydrocarbons: Effects of Haptens and Formats on
Sensitivity and Specificity. Analytical Chemistry, 1998. 71(2): p. 302-309.
58. Meisenecker, K., Knopp, D., Niessner, R., Development of an enzyme-linked
immunosorbent assay (ELISA) for pyrene. analytical methods instru., 1993.
2(1): p. 114-118.
59. Herikstad B. V., S.Ø., Haugen A. and Hagen, Determination of polycyclic
aromatic hydrocarbons in urine from coke-oven workers with a
radioimmunoassay. carcinogenesis, 1993. 14(2): p. 307-309.
60. Kado, N.Y., Wei, E.T., Radioimmunoassay for benzo (a) pyrene. J Natl
Cancer Inst., 1978. 61(1): p. 221-225.
61. Liu, M., Li; Q.X, Rechnitz, G.A., Flow injection immunosensing of polycyclic
aromatic hydrocarbons; effect of haptens and formats on sensitivity and
specificity. Anal. chem., 1999. 71: p. 302-309.
62. Liu, M., Rechnitz, G.A., Li, K., Capacitive immunosensing of polycyclic
aromatic hydrocarbons and protein conjuctes. Anal. lett., 1998. 31(12): p.
2025-2038.
149
63. Vo-Dinh, T., B.J.T., Griffin G. D., Ambrose K. R., Sepaniak M. J., and
Gardenhire E. M., Antibody-Based Fiberoptics Biosensor for the Carcinogen
Benzo(a)pyrene. Appl. Spectrosc., 1987. 41: p. 735-738.
64. Lee, H.J., J.V., Cullen, D.C., Kim, B.C., Gu, M.B, Monitoring and
classification of PAH toxicity using an immobilized bioluminescent bacteria.
biosens. bioelectron., 2003. 18: p. 571-577.
65. Chang, S.T., Enhancement in the sensitivity of an immobilized cell-based soil
biosensor for monitoring PAH toxicity. sensors and actuators B, 2004. 97: p.
272-276.
66. Pandey, P.C., Weetall, H.H., Detection of aromatic compounds based on DNA
intercalation using an evanescent wave biosensor. Anal. chem., 1995. 67: p.
787-792.
67. Gu, M.B., S.T.C., Soil biosensor for the detection of PAH toxicity using an
imobilized recombinant bacterium and a biosurfactant. biosensens.
bioelectron., 2001. 16: p. 667-674.
68. Ruey-an Doong, H.-M., Shih-hui Lee, Sol-gel-derived array DNA biosensor
for detection of polycyclic aromatic hydrocarbons in water and biological
samples. sensora and actuators B, 2005: p. 323-330.
69. Vazquez-Duhalt, R., Fedorak P.M., Lignin peroxidase oxidation of aromatic
coumpounds in systems containing organic solvents. Appl. Environ. Micro-
bio., 1994. 60: p. 459.
70. Rajeshwar, K., Environmental Electrochemistry Fundamentals and
Applications in Pollution Abatement. Academic Press,New York, 1997.

150
71. Doong, R.-A., Shih H.-M., and Lee S., Sol-gel-derived array DNA biosensor
for the detection of polycyclic aromatic hydrocarbons in water and biological
samples. Sensors and Actuators B: Chemical, 2005. 111-112: p. 323-330.
72. Bouvrette, P., Hrapovic, S., Male, K.B., Luong, J.T., Analysis of the 16
Environmental Protection Agency priority polycyclic aromatic hydrocarbons
by high performance liquid chromatography-oxidized diamond film
electrodes. Journal of Chromatography A, 2006. 1103(2): p. 248-256.
73. Ahuja, T., M.I.A., Kumar, D., Bimolecular immobilization on conducting
polymers for biosensing application. Biomaterials, 2007. 28: p. 791-794
74. Malhotra, B.D, C.A., Prospects of conducting polymers in biosensors.
Analytical Chimica Acta, 2006. 578: p. 60-61.
75. Kuang-Hsuan Yang, Y.-C.L., Chung-Chin Yu., Temperature effect of
electrochemically roughened gold substrates on polymerization
electrocatalysts of polypyrrole. Analytica Chimica Acta. 2009. 631: p. 40-46.
76. Ngece, R.F., Electrochemical dynamics of cytochrome P450 (2D6) biosensors
for selective serotonin re-uptake inhibitors (SSRis). unpublished MSc. Thesis
in chemistry, 2007. University of the Western Cape, South Africa.
77. Said Sadki, P.S., Nancy Brodie and Guillaume Sabouraud, The mechanism of
pyrrole polymerization. Royal society of Chemistry, 2000. 29: p. 283-293.
78. Dodlhofer, K., and Rajeshwar K., Handbook of conducting polymers, 2nd ed,
New York ,USA, 1998. 531.
79. Lyons, M.E.G., Advances in Chemical Physics, Polymeric systems, 2nd ed.
John Wiley Sons, New York, USA, 1997: p. 297.

151
80. Vernitskaya, T.V.E., Polypyrrole: a conducting polymer; its synthesis,
properties and applications. Russian Chemical Reviews, 1997. 66(5): p. 443-
457.
81. Kaplin, D.A., and Qutubuddin, S., Electrochemically synthesized polypyrrole
films: effects of polymerization potential and electrolyte type. Polymer, 1995.
36(6): p. 1275-1286.
82. Gao, Z., Minxian Z., and Beshen C., The influence of overoxidation treatment
on the permeability of polypyrrole films. Journal of Electroanalytical
Chemistry, 1994. 373(1-2): p. 141-148.
83. Beck F., P.B., Oberst, M., Bunsenges Ber., Organic electrochemistry in the
solid state-overoxidation of polypyrole. journal of physical chemistry, 1987.
91(9): p. 967-974.
84. Benzhi, Liu, L.L., Min Wang and Yanqin, Z., A study of nanostructured gold
modified glassy carbon electrode for the determination of trace Cr(VI). J.
chem. Sci., 2008. 5: p. 493-498.
85. Xiliang Luo, A.M., Anthony J. Killard, Malcolm R. Smyth, Application of
Nanoparticles in Electrochemical Sensors and Biosensors. electroanalysis,
2005. 18(4): p. 319 - 326.
86. Liu, T., Kang, T., Lu, L., Zhang, Y., Cheng, S., Au-Fe(III) nanoparticle
modified glassy carbon electrode for electrochemical nitrite sensor. Journal of
Electroanalytical Chemistry, 2009. 632(1-2): p. 197-200.
87. Masato Tominaga, T.S., Makoto N., Isao T., Composition-activity
relationships of carbon electrodes-supported bimetallic gold-silver
nanoparticles in electrocatalytic oxidation of glucose. journal of electroana.
Chem., 2008. 615 p. 51-61.

152
88. Liping Wang, W.M., Dandan Ni, Junwei Di, Ying Wu, Yifeng Tu, Direct
electrodeposition of gold nanoparticles of to indium/ tin oxide glass.
electrochemistry comm., 2008. 10: p. 673-676.
89. Xiahuang Kang, Z.M., Xiaoyong Zou, Peiang cia, Jinyuan Mo, A novel
glucose biosensor based on immobilization of glucose oxidase in Chitosan on
a glassy carbon electrode modified with gold-platinum alloy nanoparticles /
multiwall carbon nanotubes. Analytical Biochemistry, 2007. 369 p. 71-79.
90. Gole, A., C.D., Ramakrishman, V., Sainkar, S.R., Mandale, A.B., Rao, M.,
Sastry, M., Pepsin-gold colloid conjugates: Preparation, characterization,
and enzymatic activity. Langmuir, 2001. 17(5): p. 1674-1679.
91. Gole, A., Vyas, S., Phadtare, S., Lachke, A., Sastry, M., Studies on the
formation of bioconjugates of Endoglucanase with colloidal gold. Colloids
and Surfaces B: Biointerfaces, 2002. 25(2): p. 129-138.
92. Zhuo, Y., Yuan, R., Chai, Y., Tang, D., Zhang, Y., Wang, N., Li, X., Zhu, Q.,
A reagentless amperometric immunosensor based on gold
nanoparticles/thionine/Nafion-membrane-modified gold electrode for
determination of [alpha]-1-fetoprotein. Electrochemistry Communications,
2005. 7(4): p. 355-360.
93. Retna, Raj, C., Takeo Ohsaka T.O., Gold nanoparticle arrays for the
voltammetric sensing of dopamine. Journal of Electroanalytical Chemistry,
2003. 543 p. 127-133.
94. Tianyan You, O.N., Masato T., and Shigeru H., Characterization of Platinum
Nanoparticle-Embedded Carbon Film Electrode and Its Detection of
Hydrogen Peroxide. Anal. Chem., 2003. 75(9 ): p. 2080–2085.

153
95. Liu, T., Gan X., Fan C., Li G., and Matsuda N., Wiring electrons of
cytochrome c with silver nanoparticles in layered films. ChemPhysChem,
2003. 4: p. 1364-1366.
96. Murielle Dequaire, C.D., and Benoît L., An Electrochemical
Metalloimmunoassay Based on a Colloidal Gold Label. Anal. Chem., 2000.
72 (22): p. 5521–5528.
97. Jing-Juan Xu, W.Z., Xi-Liang Luo and Hong-Yuan Chen, A sensitive
biosensor for lactate based on layer-by-layer assembling MnO2 nanoparticles
and lactate oxidase on ion-sensitive field-effect transistors. The Royal Society
of Chemistry, 2005: p. 792–794.
98. Min Zhou, S.C., Shiyonb Z., Houyi M., One-step synthesis of Ag-Au alloy
nanoparticles by convinient electrochemical method physica E, 2006. 33: p.
28-34.
99. Supriya Devarajan, B.V., Sampath S., Phase transfer of Au–Ag alloy
nanoparticles from aqueous medium to an organic solvent: effect of aging of
surfactant on the formation of Ag-rich alloy compositions. Journal of Colloid
and Interface Science, 2004. 278: p. 126–132.
100. Okomoto H., T.B.M., in, Phase diagrams of binary Gold alloys. international,
metals park, 1987.
101. Link, S., "Alloy formation of gold-silver nanoparticles and the dependance of
the plasmon absorption on their composition". Journal of physical chemistry
B., 1999. 103:p. 3529-3533.
102. Pal, A., Shah, S., Kulkami, V., Murthy, R.S., Devi, S., Template free synthesis
of silver-gold alloy nanoparticles and cellular uptake of gold nanoparticles in

154
Chinese Hamster Ovary cell. Materials Chemistry and Physics, 2009. 113(1):
p. 276-282.
103. Devarajan, S., Vimalan B., and Sampath S., Phase transfer of Au-Ag alloy
nanoparticles from aqueous medium to an organic solvent: effect of aging of
surfactant on the formation of Ag-rich alloy compositions. Journal of Colloid
and Interface Science, 2004. 278(1): p. 126-132.
104. Aiqin Wang, Y.-P.H., Yong-Fan Chen, Chung-Yuan Mou, Au-Ag alloy
nanoparticles as catalyst for CO oxidation : effect of Si/Al ratio of mesoporous
suppor. Journal of catalysts, 2006. 237 p. 197-206.
105. Xiangling Ren, X.M., Fangqiong Tang, Preparation of Ag-Au nanoparticles
and its application to glucose biosensor. sensors and actuators, B 2005. 110 p.
358-363.
106. Stetter, J.N., Sheng Y., Sensors chemical sensors, electrochemical sensors and
ECS. J. Electrochem Soc., 2003. 150: p. S11-16.
107. Nelson, R., Stradiotto, H.Y., Electrochemical sensors: A powerful tool in
analytical chemistry. J. Braz. Chem.. soc., 2003. 14(2): p. 159-173.
108. You Wang, Hui Xu, J.Z., Electrochemical sensors for clinic analysis sensors,
2008. 8: p. 2043-2081.
109. Bard, A.J., and Faulkner , L.R, Electrochemical Methods : Fundamentals and
applications (2nd edition). Newyork, USA: John Willey & Sons, 2000.
110. Monk, P.M.S, Fundamentals of electroanalytical chemistry. Newyork, USA:
John Willey & Sons, 2001: p. 158-159.
111. David, K., Gosser, J., Cyclic voltammetry, simulation and Analysis of Reaction
Mechanisms. VCH publishers, 1994: p. 42-43.

155
112. Haines, F.W., Environmental analytical chemistry. blackie academic and
professional, an imprint of chapman & hall, 2nd edition, 1995: p. 197-223.
113. Williams-Dottin, A.R., Monosubstituted Squarate Ligands and their transition
metal and Lanthanide Complexes: Structural and Electrochemical Studies,
PhD Thesis in Chemistry,. University of the West Indies, St. Augustine, 2001.
114. Kounaves, S.P., Voltammetric Techniques: Handbook of Instrumental
Techniques for Analytical Chemistry. 2007, Chapter 37: p. 709-725.
115. Akinyenye, R.O., Nanostructured polypyrrole impedimetric sensors for
anthropogenic organic pollutants, unpublished PhD Thesis in Chemistry,
University of the Western Cape, South Africa, 2008.
116. Brett, C.M.A.B., A.M.O., Electrochemistry Principles, Methods and
Applications. Oxford University Press, United States, New York, 2005.
117. Kang, X.M., Zhibin Zou, Xiaoyong Cai, Peixiang Mo, Jinyuan, A novel
glucose biosensor based on immobilization of glucose oxidase in chitosan on a
glassy carbon electrode modified with gold-platinum alloy
nanoparticles/multiwall carbon nanotubes. Analytical Biochemistry, 2007.
369(1): p. 71-79.
118. Fernàndez-Sańchez, C., McNeil, C.J. & Rawson, K., Electrochemical
impedance spectroscopy studies of polymer degradation: application to
biosensor development. Trends in Analytical Chemistry 2005. 24 (1): p. 37-48.
119. Skoog, E.A., Principles of Instrumental analysis.6th ed. Thomson Brooks/
Cole, 2007: p. 169-173.
120. Jihad Rene Albani, Principles and application of fluorescence spectrocopy.
Wiley-Blackwell, 2007. 978-1-4051-3891-8.

156
121. Fang, J., Zhong C., and Mu R., The study of deposited silver particulate films
by simple method for efficient SERS. Chemical Physics Letters, 2005. 401(1-
3): p. 271-275.
122. Asta Sileikaite, I.P., Judita Puiso, Algimantas Juraitis, Asta Guobiene,
Analysis of Silver nanoparticles produced by chemical reduction of Silver salt
solution. Material science, 2006. 12: p. 4.
123. McFarland, A.D., Mirkin, C.A , Van Duyne, R.P. and Godwin, H.A, Synthesis
of gold nanoparticles. Journal of chemical education, 2004. 81: p. 544A.
124. Yongsoon shin, I.-T.B., Bruce Arey, W., and Gregory Exarhos, J., Facile
stabilization of Gold-Silver alloy nanoparticles on cellulose nanocrystal.
Journal of physical chem. C, 2008. 112: p. 4844-4848.
125. Fry, A., Britton, W.E, , Laboratory Techniques in electroanalytical Chemistry,
1st edition, New York, USA, 1984. chapter 3.
126. Matschulat Diana, A.D., Niessner Reinhard, Knopp Dietmar, Development of
a highly sensitive monoclonal antibody based ELISA. Royal society of
Chemistry, cambridge, 1877, 2005. 130: p. 1078-1086.
127. Zhu, J., Theoretical study of the optical absorption properties of Au-Ag
bimetallic nanospheres. Physica E: Low-dimensional Systems and
Nanostructures, 2005. 27(1-2): p. 296-301.
128. Angshuman Pal, A., Sunil Shah, A., Surekha, D., Preparation of Silver–Gold
Alloy Nanoparticles at Higher Concentration Using Sodium Dodecyl Sulfate.
Journal of Chemistry, 2008. 61: p. 66.
129. Link S., L.W., El-Sayed M.A., Alloy Formation of Gold−Silver Nanoparticles
and the Dependence of the Plasmon Absorption on Their Composition. Journal
of physical chemistry B, 1999. 103 (18): p. 3529–3533.

157
130. Poovathinthodiyil Raveendran, J.F., A simple and green method for the
synthesis of Au, Ag, and Au–Ag alloy nanoparticles. The Royal Society of
Chemistry, 2006. 8: p. 34-38.
131. Alqudami, S.A., Shivaprasad G.S.M., Ag–Au alloy nanoparticles prepared by
electro-exploding wire technique. Journal of Nanoparticle Research, 2007. 10:
p. 1027-1036
132. Ehret, R., Baumann, W., Brischwein, M., Schwinde, A., Stegbauer, K., Wolf,
B., Monitoring of cellular behaviour by impedance measurements on
interdigitated electrode structures. Biosensors and Bioelectronics, 1997.
12(1): p. 29-41.
133. Kang, X., Mai, Z., Zou, X., Cai, P., Mo, J., A novel glucose biosensor based
on immobilization of glucose oxidase in chitosan on a glassy carbon electrode
modified with gold-platinum alloy nanoparticles/multiwall carbon nanotubes.
Analytical Biochemistry, 2007. 369(1): p. 71-79.
134. Speiser, B., Stratman, M., unwin P.R. (Eds.), Encyclopedia of
Electrochemistry. WILEY-VCH Verlag GmgH and CO. kGaA,Weinheim,
2003. (chapter 2).
135. Monk, P.M.S., Fundamentals of Electroanalytical Chemistry. Newyork, USA:
John Wiley & Sons., 2001: p. 264-266.
136. Arotiba, O.A., Owino, J.H., Baker, P.G., Iwuoha, E.I., Electrochemical
impedimetry of electrodeposited poly(propylene imine) dendrimer monolayer.
Journal of Electroanalytical Chemistry, 2010. 638(2): p. 287-292.
137. Mathebe, N.G.R., Morrin A., and Iwuoha E.I., Electrochemistry and scanning
electron microscopy of polyaniline/peroxidase-based biosensor. Talanta,
2004. 64(1): p. 115-120.

158
138. Christensen, P.A., and Hamnett A., In situ spectroscopic investigations of the
growth, electrochemical cycling and overoxidation of polypyrrole in aqueous
solution. Electrochimica Acta, 1991. 36(8): p. 1263-1286.
139. Martin, C.R., Van Dyke L.S., and Cai Z., Template-synthesis--a method for
enhancing the ionic and electronic conductivity in electronically conductive
polymers. Electrochimica Acta, 1992. 37(9): p. 1611-1613.
140. Van Dyke, L.S. and Martin C.R., Fibrillar electronically conductive polymers
show enhanced rates of charge transport. Synthetic Metals, 1990. 36(2): p.
275-281.
141. Paddon, C.A., Banks, C.E.D., Compton, I.G., Richard, G., Oxidation of
anthracene on platinum macro- and micro-electrodes: Sonoelectrochemical,
cryoelectrochemical and sonocryoelectrochemical studies. Ultrasonics
Sonochemistry, 2006. 13(2): p. 126-132.
142. Tominaga, M., Shimazoe, T., Nagashima, M.,Taniguchi, I., Composition-
activity relationships of carbon electrode-supported bimetallic gold-silver
nanoparticles in electrocatalytic oxidation of glucose. Journal of
Electroanalytical Chemistry, 2008. 615(1): p. 51-61.