Embed Size (px)
Citation preview

July 29th, 2014
H1 2014 resultsStéphane Richard, Chairman and CEO
Gervais Pellissier, Deputy CEO and CFO
2
disclaimer
This presentation contains forward-looking statements about us. Although we believe these statements are based onreasonable assumptions, they are subject to numerous risks and uncertainties, including matters not yet known to usor not currently considered material by us and there can be no assurance that anticipated events will occur or that theobjectives set out will actually be achieved. Important factors that could cause actual results to differ materially fromthe results anticipated in the forward-looking statements include, among others: intense competition in thetelecommunications industry, our ability to find growth opportunities in new markets and activities, deterioration of thegeneral economic and business conditions in the markets served by us, or the failure of such conditions to improve,overall trends in the economy in general and in our markets, the effectiveness of the Conquests 2015 industrial project,including, but not limited to, the success of the action plans regarding human resources and information technologies,network development, customer satisfaction and international expansion, as well as the effectiveness of otherstrategic, operating and financial initiatives, our ability to adapt to the ongoing transformation of thetelecommunications industry, in particular to technological developments and new customer expectations, legal andregulatory developments and constraints, and the outcome of legal proceedings related to regulation and competition,the success of our domestic and international investments, joint ventures and strategic relationships, risks related toinformation and communication technology systems generally, exchange rate fluctuations and interest ratefluctuations, our ability to access the capital markets and the conditions of capital markets in general. More detailedinformation on the potential risks that could affect our financial results can be found in the Registration Document filedwith the French Autorité des Marchés Financiers (AMF) on April 29, 2014 and in the annual report on Form 20-F filedwith the U.S. Securities and Exchange Commission on April 30, 2014. Except to the extent required by law (inparticular pursuant to sections 223-1 and seq. of the General Regulations of the AMF), Orange does not undertakeany obligation to update forward-looking statements.
H1 2014 results – July 29th, 2014

H1 2014 highlights
Stéphane Richard
Chairman and CEO
4
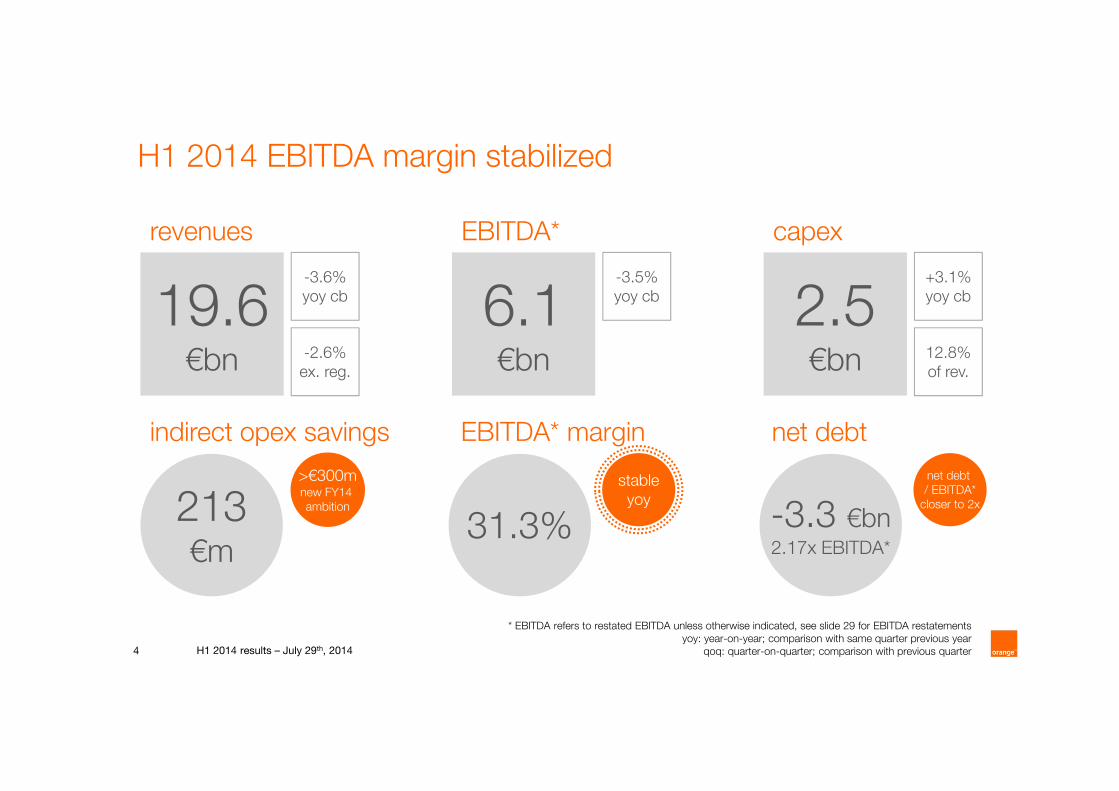
H1 2014 EBITDA margin stabilized
6.1€bn
EBITDA*
-3.5%yoy cb
31.3%
EBITDA* margin
stableyoy
19.6€bn
revenues
-3.6%yoy cb
-2.6%ex. reg.
2.5€bn
capex
+3.1%yoy cb
12.8%of rev.
213€m
indirect opex savings
>€300mnew FY14 ambition -3.3 €bn
2.17x EBITDA*
net debt
net debt / EBITDA*
closer to 2x
H1 2014 results – July 29th, 2014
* EBITDA refers to restated EBITDA unless otherwise indicated, see slide 29 for EBITDA restatementsyoy: year-on-year; comparison with same quarter previous year
qoq: quarter-on-quarter; comparison with previous quarter

5
solid Q2 14 mobile commercial performance across the Group179m mobile customers with network quality as key driver
H1 2014 results – July 29th, 2014
coveragein % of pop.
France 69%
73%
>50%
UK
Spain
4G
* source: ARCEP for France, Commsquare for Belgium, RootMetrics for UK, independant company for Africa & Middle East
coverage in Africa & Middle East3G
# 3G countries
# of new 3G sites over H1
total network capex (yoy)
mobile network in France* in 4G speed in Belgium and UK*#1 in customer satisfaction in 15 out of 18 countries
in Africa & Middle East*#1QoS
investments
commercialperformance
4G customers
2.0m in France
4.2m in UK
1.4m in Spain
launched in Poland, Belgium and Romania in H1 14 and Slovakia early July
+0.6m in Q2 14
+1.3m in Q2 14
+0.4m in Q2 14
91.8m mobiles customers
18/21
+9%
+20%
Orange Money
14countries out of 21
10.8m orange money customers
+0.9m in Q2 14
Africa & Middle East
6
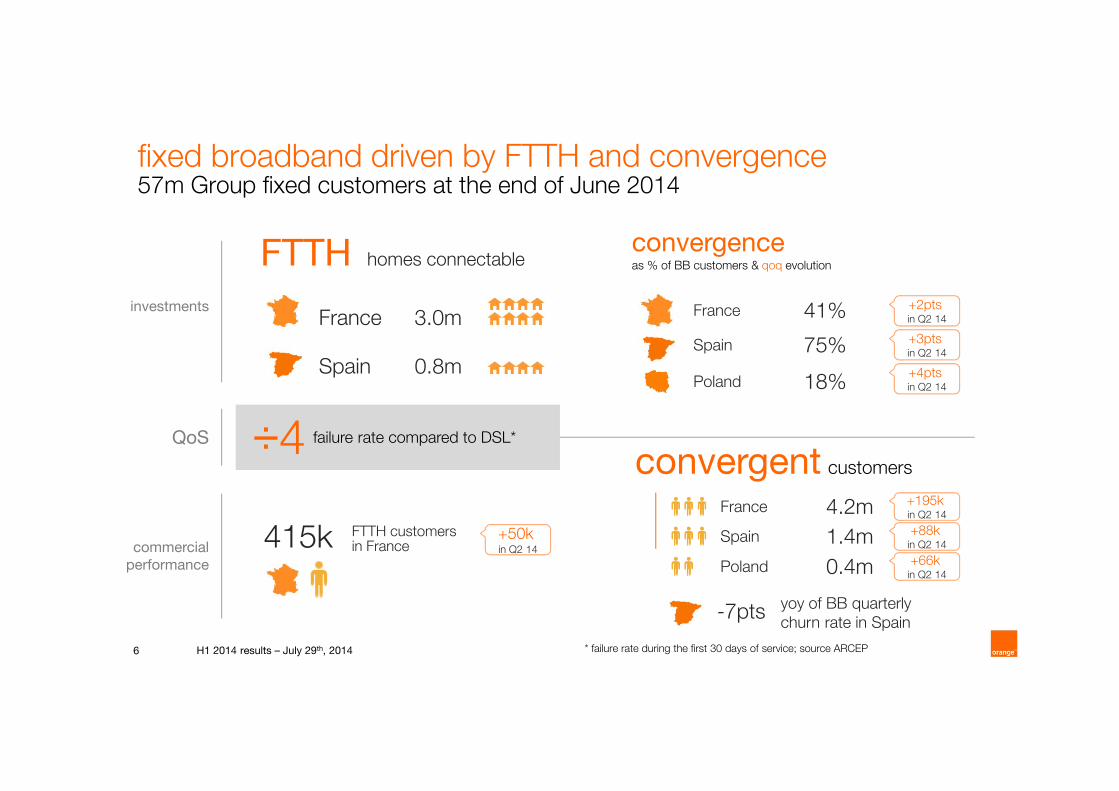
fixed broadband driven by FTTH and convergence57m Group fixed customers at the end of June 2014
H1 2014 results – July 29th, 2014
France 3.0m
0.8mSpain
FTTH homes connectable
failure rate compared to DSL*÷4QoS
investments
commercialperformance
+50k in Q2 14
415k FTTH customersin France
convergence as % of BB customers & qoq evolution
France 41%
75%
18%
Spain
Poland
+2pts in Q2 14
+3pts in Q2 14
+4pts in Q2 14
convergent customers
+195k in Q2 14
+66k in Q2 14
France 4.2m
Poland 0.4m
-7pts yoy of BB quarterly churn rate in Spain
* failure rate during the first 30 days of service; source ARCEP
+88k in Q2 14
Spain 1.4m

H1 2014 results overview
Gervais Pellissier
Deputy CEO and CFO

8
+7.4% +7.6%
€2.1bn
H1 2014 revenuesbetter revenue trend in France, Poland & strong growth in Africa and the Middle-East
H1 2014 results – July 29th, 2014
€9.6bn
-5.0% -0.8%
€1.9bn-6.7% -3.6%
€1.5bn-10.1% -7.0%
€1.4bn
-2.7%
€3.1bn-0.5%
€0.9bn
by activity
-4.6% -4.4%
IC&SSEnterprise
Africa & Middle-East
other european countries
PolandSpain
France
mobile services
mobile equipment sales
fixed services
enterprise & IC&SS
other
€8.6bn
€0.6bn
€6.4bn
€3.5bn
€0.4bn
-2.3%ex. reg.
-2.6%ex. reg.
H1 2014Q2 2014
by segment
Group
€19.6bn
-3.4%yoy cb
-3.6%yoy cb
yoyH1’14
yoyex.reg
yoyH1’14
yoyH1’13
-7.3% -6.4%
+21.9% +10.2%
-1.0% -3.4%
-2.1% -3.6%
9
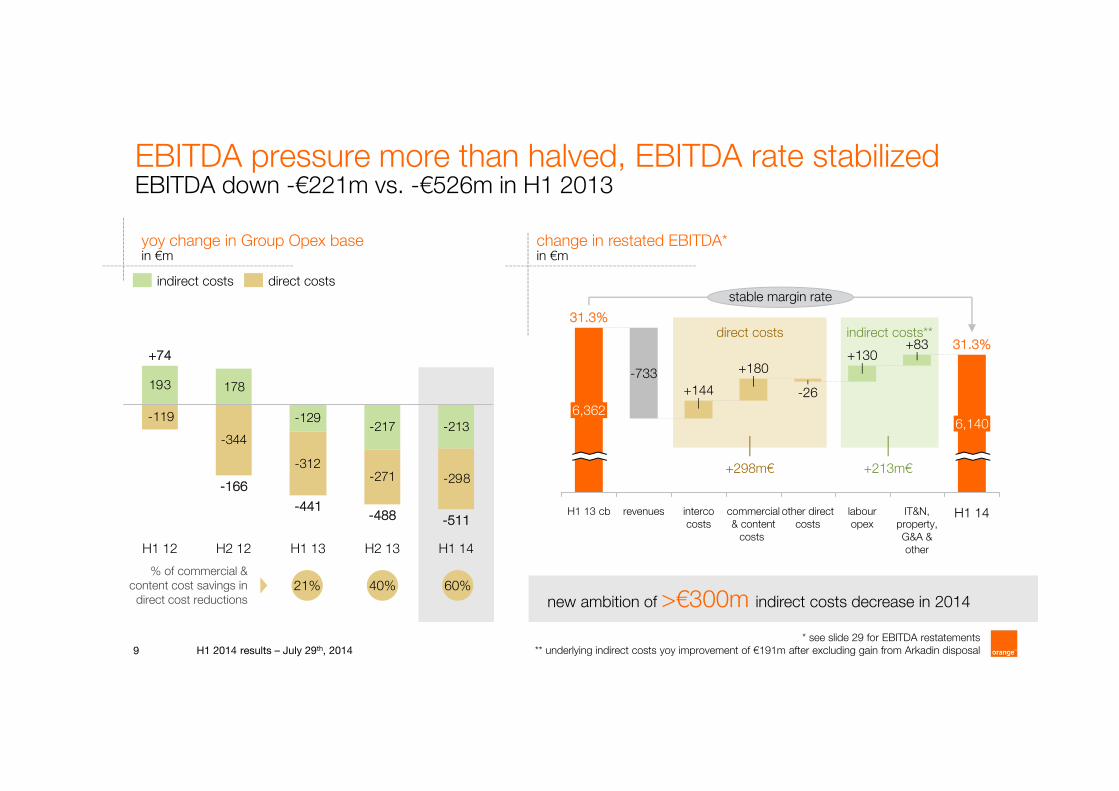
indirect costs**direct costs
EBITDA pressure more than halved, EBITDA rate stabilizedEBITDA down -€221m vs. -€526m in H1 2013
change in restated EBITDA*in €m
H1 2014 results – July 29th, 2014* see slide 29 for EBITDA restatements
** underlying indirect costs yoy improvement of €191m after excluding gain from Arkadin disposal
+213m€+298m€
direct costsindirect costs
yoy change in Group Opex base in €m
21% 40%% of commercial &
content cost savings in direct cost reductions new ambition of >€300m indirect costs decrease in 2014
stable margin rate
H1 14
31.3%
6,140
IT&N, property, G&A & other
+83
labour opex
+130
other direct costs
-26
commercial & content
costs
+180
interco costs
+144
revenues
-733
H1 13 cb
31.3%
6,362
-344
-129-217 -213
193 178
-312-271 -298
-119
-511
H1 14H2 13
-488
H1 13
-441
H2 12
-166
H1 12
+74
60%
10
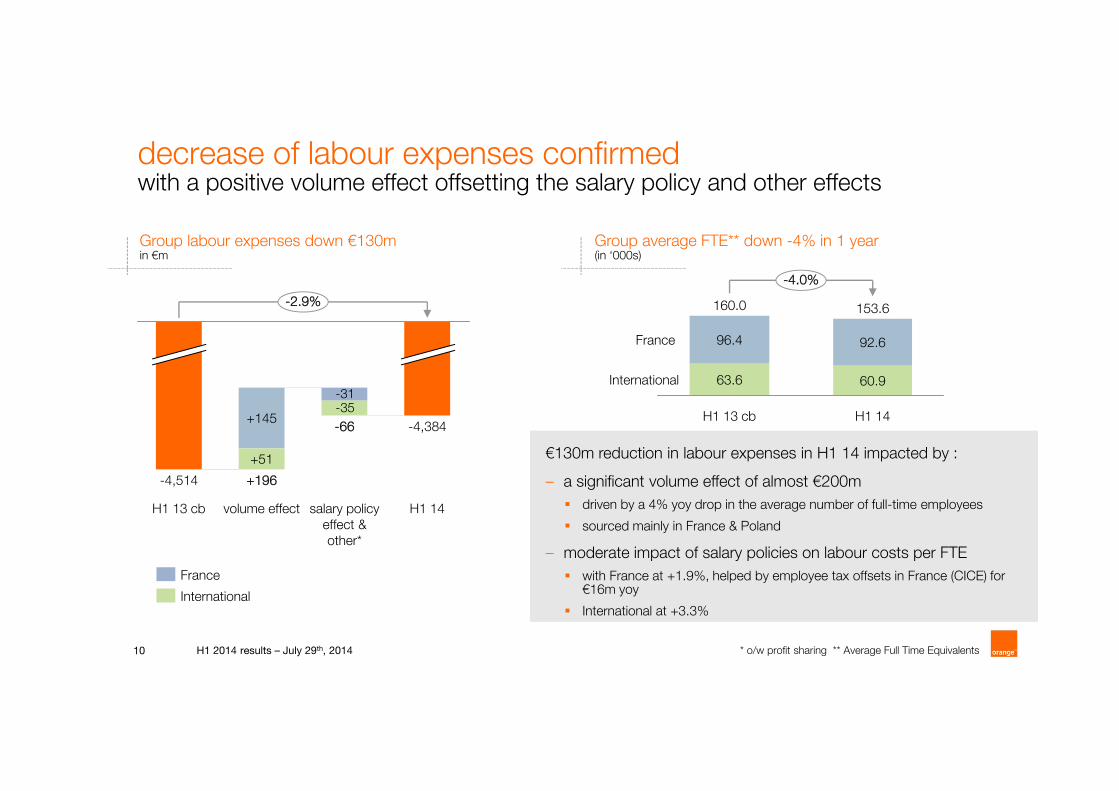
€130m reduction in labour expenses in H1 14 impacted by :
– a significant volume effect of almost €200m
driven by a 4% yoy drop in the average number of full-time employees
sourced mainly in France & Poland
– moderate impact of salary policies on labour costs per FTE
with France at +1.9%, helped by employee tax offsets in France (CICE) for €16m yoy
International at +3.3%
decrease of labour expenses confirmedwith a positive volume effect offsetting the salary policy and other effects
H1 2014 results – July 29th, 2014
-31-35
H1 14
-4,384
salary policy effect & other*
-66
volume effect
+196
+51
+145
H1 13 cb
-4,514
-2.9%
* o/w profit sharing ** Average Full Time Equivalents
Group average FTE** down -4% in 1 year(in ‘000s)
Group labour expenses down €130m in €m
International
France
160.0
63.6
96.4
-4.0%
H1 14
International
France
153.6
60.9
92.6
H1 13 cb

11
6,505 4G sites, covering 69% of population, up 19pp from 50% end of 4Q13, with Orange providing best throughput, above 20Mbps.
Orange recognized again by ARCEP as having best quality of service for mobile networks
+455k FTTH homes connectable (+18% vs. end of 4Q13)
>50% of population covered by 4G, from 30% end of 2013
9,600 3G sites shared with T-Mobile 3,500 4G sites covering 52% of population
€479m invested in H1 14 in Rest of the World, +€105m vs. H1 2013 strong acceleration in 4G across Europe: sharp increase in Mobistar
population coverage (65%); Romania and Slovakia 4G commercial launch, resp. in April and July 2014
increased CAPEX on 4G and FTTH to support future growth
H1 2014 results – July 29th, 2014
+3.1%
H1 14
2,501
-78+62
+92
H1 13 cb
2,425
investment in very high speed networks(4G, FTTH and VDSL) up +64% yoy
4G
FTTHVDSL
mutualisation, rationalization & phasing out
12.8%11.9%
%
CAPEX evolution in €m
CAPEX as % of revenues
as of H1 2014
Q2 14
3.0
Q1 14
2.7
Q4 13
2.6
Q3 13
2.3
Q2 13
2.1FTTH connectable homes (vertical), in millions
+43% yoy
12
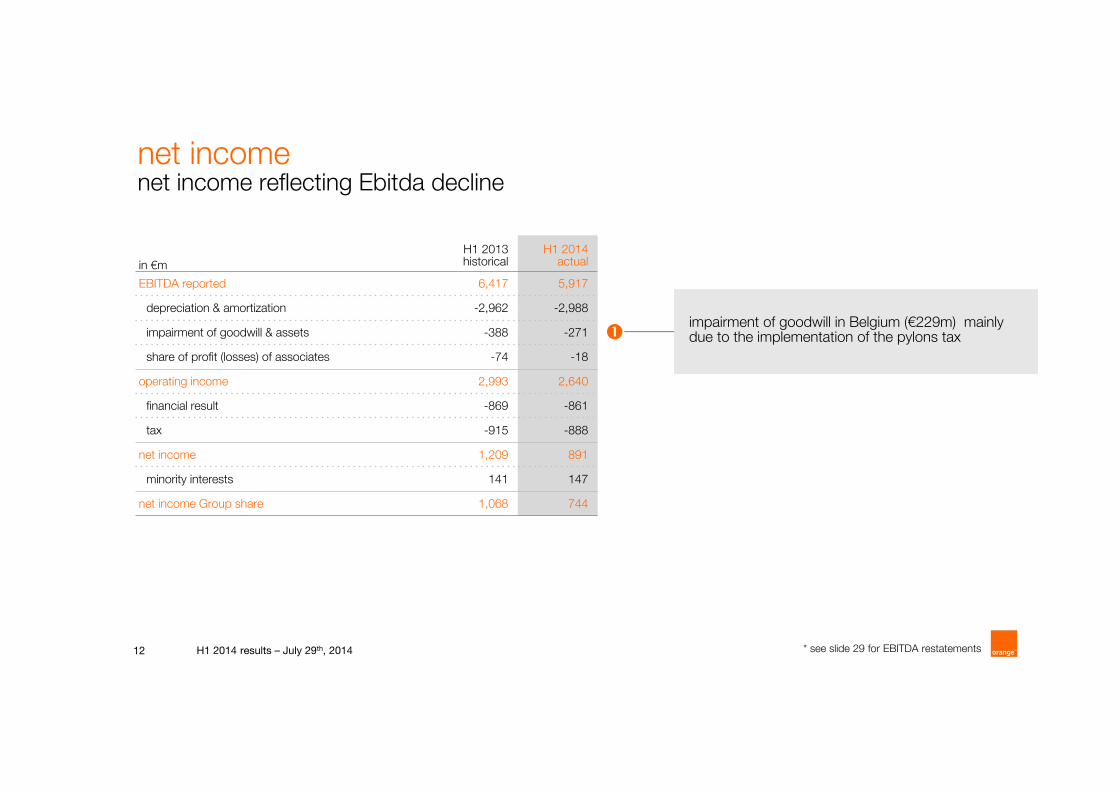
impairment of goodwill in Belgium (€229m) mainly due to the implementation of the pylons tax
net incomenet income reflecting Ebitda decline
in €m
H1 2013historical
H1 2014actual
EBITDA reported 6,417 5,917
depreciation & amortization -2,962 -2,988
impairment of goodwill & assets -388 -271
share of profit (losses) of associates -74 -18
operating income 2,993 2,640
financial result -869 -861
tax -915 -888
net income 1,209 891
minority interests 141 147
net income Group share 1,068 744
* see slide 29 for EBITDA restatementsH1 2014 results – July 29th, 2014

13
* calculated by dividing (A) net financial debt, including 50% of the net financial debt of the EE JV in the U.K., by (B) restated EBITDA including 50% of the EBITDA of EE JV
** excluding TDIRA
2.37x 2.17x
net debt/ EBITDA * ratio
net debt evolutionin €bn
€-0.6bn
net debt end of
June 2014
net debt end of June 2014 excl. hybrid bonds issue
30.2-0.2
-0.9
1.3
1.1
0.8
hybrid bonds issue
0.4 0.20.1
restated EBITDA-CAPEX
0.4
-2.7
27.4
-3.6
net debt end 2013
30.7
other financial items
dividends to ORA shareholders
acquisitions and disposals
working capital & other operational items
net financial expenses
taxes (excl. litigation)
restructuring and litigation
dividends to minorities
spectrum & licences
as of 30th of June, 2014
strong liquidity position
av. weighted cost ofdebt in bonds
average maturity**
continued net debt reduction in H1, accelerated by the issuance of hybrids
H1 2014 results – July 29th, 2014
-€3.3bn
€12.7bn
4.77%
10 years

business review
Gervais Pellissier
Deputy CEO and CFO
15
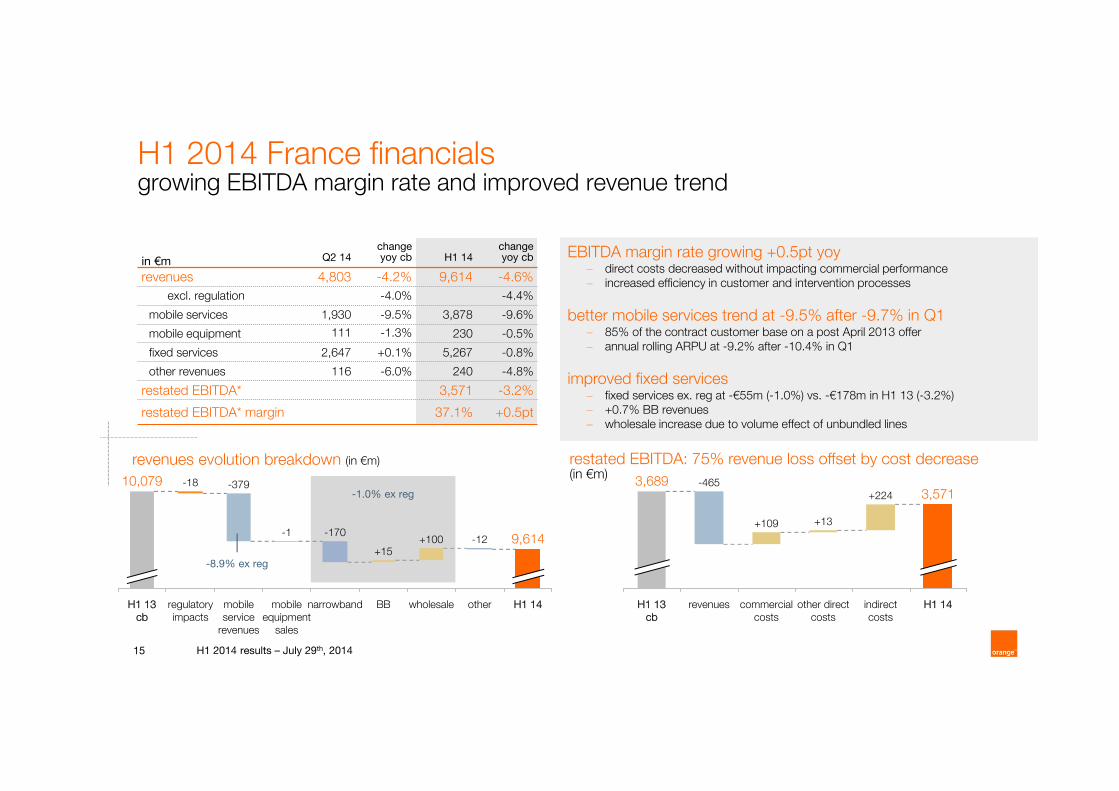
-465
H1 13 cb
3,689
H1 14
3,571
indirect costs
+224
other direct costs
+13
commercial costs
+109
revenues
in €m Q2 14 change yoy cb H1 14
change yoy cb
revenues 4,803 -4.2% 9,614 -4.6%
excl. regulation -4.0% -4.4%
mobile services 1,930 -9.5% 3,878 -9.6%
mobile equipment 111 -1.3% 230 -0.5%
fixed services 2,647 +0.1% 5,267 -0.8%
other revenues 116 -6.0% 240 -4.8%
restated EBITDA* 3,571 -3.2%
restated EBITDA* margin 37.1% +0.5pt
mobile service
revenues
-379
H1 14other
-12
wholesale
+100
BB
+15
narrowband
-170
mobile equipment
sales
regulatory impacts
-18
H1 13 cb
10,079
-19,614
H1 2014 France financialsgrowing EBITDA margin rate and improved revenue trend
H1 2014 results – July 29th, 2014
revenues evolution breakdown (in €m)
EBITDA margin rate growing +0.5pt yoy− direct costs decreased without impacting commercial performance− increased efficiency in customer and intervention processes
better mobile services trend at -9.5% after -9.7% in Q1− 85% of the contract customer base on a post April 2013 offer− annual rolling ARPU at -9.2% after -10.4% in Q1
improved fixed services− fixed services ex. reg at -€55m (-1.0%) vs. -€178m in H1 13 (-3.2%)− +0.7% BB revenues− wholesale increase due to volume effect of unbundled lines
-8.9% ex reg
restated EBITDA: 75% revenue loss offset by cost decrease (in €m)
-1.0% ex reg
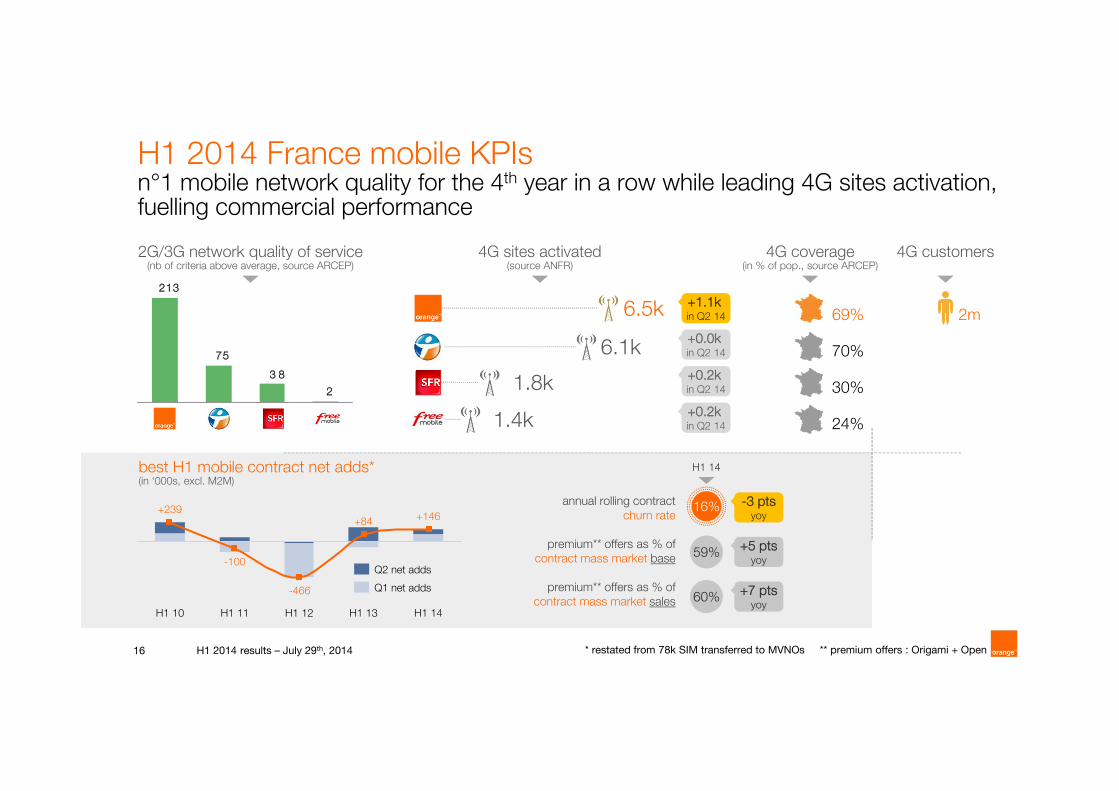
16
H1 2014 France mobile KPIsn°1 mobile network quality for the 4th year in a row while leading 4G sites activation, fuelling commercial performance
H1 2014 results – July 29th, 2014 * restated from 78k SIM transferred to MVNOs ** premium offers : Origami + Open
2G/3G network quality of service(nb of criteria above average, source ARCEP)
4G sites activated (source ANFR)
6.5k 69%
70%
30%
24%
2m+1.1k in Q2 14
+0.0k in Q2 146.1k
1.8k
1.4k
+0.2k in Q2 14
+0.2k in Q2 14
4G coverage(in % of pop., source ARCEP)
4G customers
2
3 8
75
213
16%
best H1 mobile contract net adds* (in ‘000s, excl. M2M)
annual rolling contract churn rate
premium** offers as % of contract mass market base
premium** offers as % of contract mass market sales
16%
59%
60%
-3 ptsyoy
+5 ptsyoy
+7 ptsyoy
H1 14
H1 10 H1 12
+239+84
-466
H1 11 H1 14
+146
H1 13
-100
Q1 net adds
Q2 net adds
17
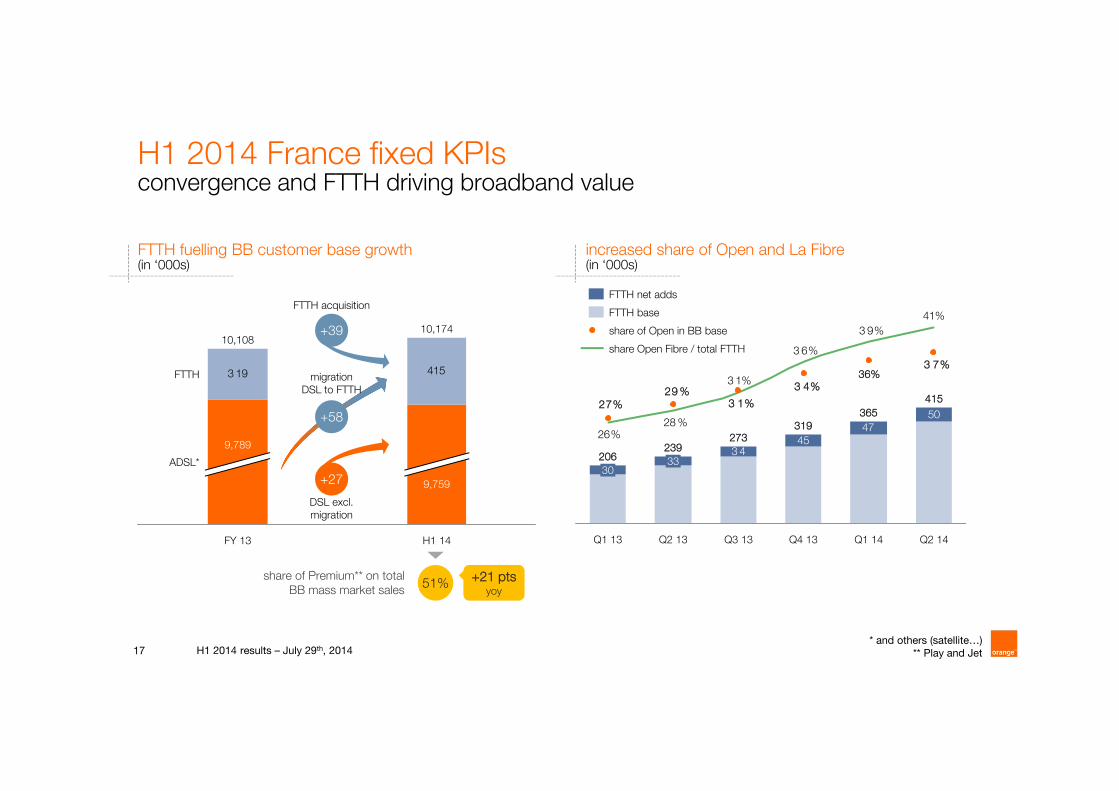
H1 2014 France fixed KPIsconvergence and FTTH driving broadband value
H1 2014 results – July 29th, 2014
increased share of Open and La Fibre(in ‘000s)
3 445
4750
3 7%
3 4%
3 1%29 %
27%
41%
3 9%
3 6%
3 1%
28 %26%
Q3 13
273
Q2 13
239
33
Q1 13
206
30
Q1 14
365
36%
Q4 13
319
Q2 14
415
FTTH fuelling BB customer base growth(in ‘000s)
share Open Fibre / total FTTH
share of Open in BB base
FTTH base
FTTH net adds
3 19 415
10,174
9,759
FY 13
10,108
9,789
H1 14
ADSL*
FTTH
+39
+58
+27
DSL excl. migration
FTTH acquisition
migration DSL to FTTH
share of Premium** on total BB mass market sales
51% +21 ptsyoy
* and others (satellite…)** Play and Jet
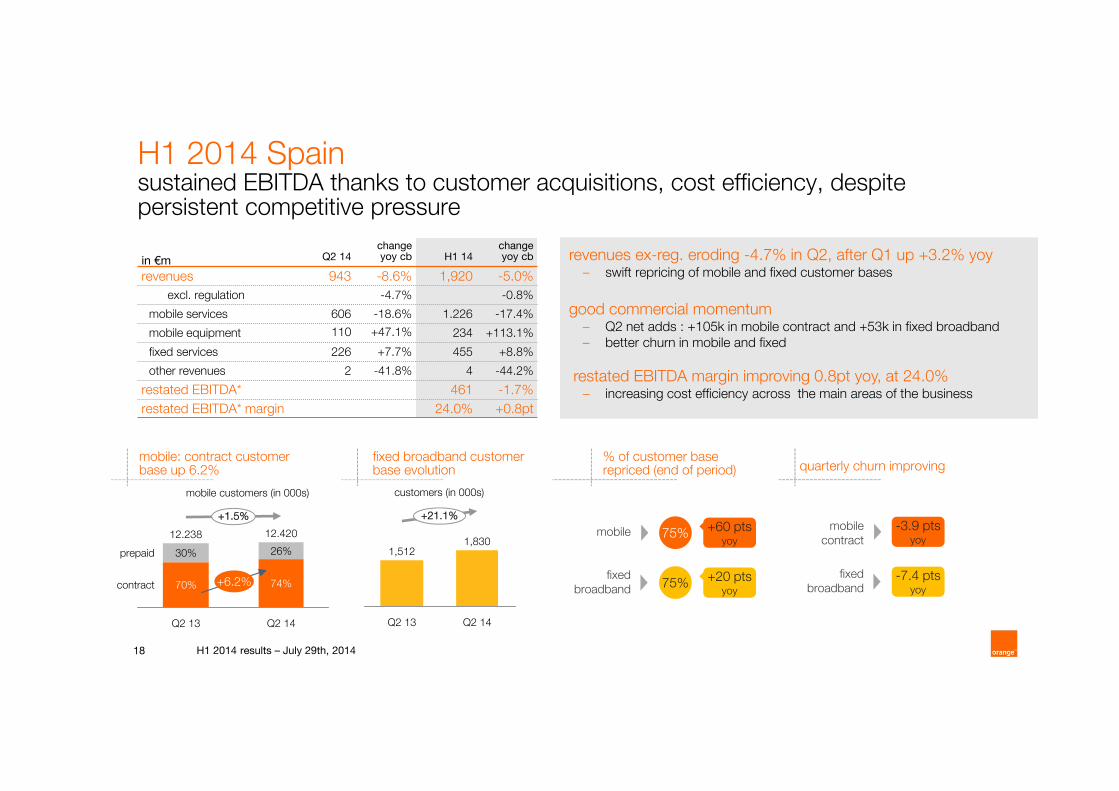
18
H1 2014 Spainsustained EBITDA thanks to customer acquisitions, cost efficiency, despite persistent competitive pressure
H1 2014 results – July 29th, 2014
fixed broadband customer base evolution
mobile: contract customer base up 6.2%
+1.5%
contract
prepaid
Q2 14
12.420
74%
26%
Q2 13
12.238
70%
30%
mobile customers (in 000s)
+6.2%
customers (in 000s)
revenues ex-reg. eroding -4.7% in Q2, after Q1 up +3.2% yoy– swift repricing of mobile and fixed customer bases
good commercial momentum – Q2 net adds : +105k in mobile contract and +53k in fixed broadband– better churn in mobile and fixed
restated EBITDA margin improving 0.8pt yoy, at 24.0%– increasing cost efficiency across the main areas of the business
+21.1%
Q2 14
1,830
Q2 13
1,512
in €m Q2 14 change yoy cb H1 14
change yoy cb
revenues 943 -8.6% 1,920 -5.0%
excl. regulation -4.7% -0.8%
mobile services 606 -18.6% 1.226 -17.4%
mobile equipment 110 +47.1% 234 +113.1%
fixed services 226 +7.7% 455 +8.8%
other revenues 2 -41.8% 4 -44.2%
restated EBITDA* 461 -1.7%
restated EBITDA* margin 24.0% +0.8pt
% of customer base repriced (end of period) quarterly churn improving
75% +60 ptsyoy
mobile
fixed broadband 75% +20 pts
yoy
-3.9 ptsyoy
mobilecontract
fixed broadband
-7.4 ptsyoy

19
H1 2014 Polandsolid commercial activity, sequentially better revenue trend, improving profitability
H1 2014 results – July 29th, 2014
mobile: solid customer net additionsin ‘000s
convergence: continuous momentum in open customersin ‘000s and in % of mobile postpaid base
211286
352 418
125
Q2 14
5.6%
Q1 14
4.8%
Q4 13
4.0%
Q3 13
3.0%
Q2 13
1.8%6670
199179
6199
139169
8264
Q2 14Q1 14Q4 13Q3 13Q2 13
postpaid net addstotal net adds
solid trading activity– effective convergence offers, with +66k Open net adds in Q2 14, for a total of
418k Open customers– continuing momentum in entry level SIMO offer, with +81k nju.mobile customers
net adds in Q2 14, for a total of 560k customers– fixed broadband customers almost stable vs. Q1 14, at 2,281k– fixed voice line losses continuously down: -45% vs. Q2 13 and -7% vs. Q1 14
sequentially improving underlying (ex-regulation) revenue trend– -2.2% in Q2 14 vs. -5.1% in Q1 14, with new instalment model introduced in April
improving restated EBITDA margin– commercial cost down and other cost reduction initiatives
in €m Q2 14 change yoy cb H1 14
change yoy cb
revenues 740 -5.4% 1,456 -6.7%
excl. regulation -2.2% -3.6%
mobile services 349 -8.4% 693 -7.3%
mobile equipment 26 +171.4% 37 +108.5%
fixed services 333 -8.6% 672 -8.6%
other revenues 32 +14.4% 54 -8.5%
restated EBITDA* 466 -4.5%
restated EBITDA* margin 32.0% +0.7pt
fixed lines: steady reduction in fixed voice line lossesin ‘000s
Q2 14
-52
Q1 14
-56
Q4 13
-62
Q3 13
-78
Q2 13
-95

20
H1 2014 Rest of the Worldstrong growth in Africa & the Middle-East offsetting MTR decrease in Romania and ongoing repricing in some European countries
H1 2014 results – July 29th, 2014
Africa and Middle-East– strong growth in Q2 driven by Mali (+36%), Guinea (+57%), Ivory Coast (+11%)
and Egypt (+2.7%, driven by data growth at +82%)
European countries– Q2 revenues significantly impacted by MTR decrease in Romania (MTR divided
by ~3) sparking subsequent retail pricing pressure– better trend in Belgium (-14.3% in Q2 vs -19.6% in Q1) with more than 90% of
mass market customers now repriced. Mobistar was nationally recognized for its best quality 4G network, now covering 65% of the population
Ebitda– strong efforts on costs across both geographies limited the impact on the
segment’s Ebitda, resulting in a quasi-stable Ebitda margin
Africa & Middle East mobile customer base
+9% yoy
n°1 or n°2 in volume market share in
16out of 21Africa & Middle-East
countries
operators positioned n°1 or n°2 in value share provide
over 95%of European revenues
Orange Money customers
10.8m+46% yoy
in €m Q2 14 change yoy cb H1 14
change yoy cb
revenues 1,797 +0.2% 3.661 -0.5%
excl. regulation +2.5% +1.1%
Africa & Middle East 1,059 +9.0% 2,073 +7.4%
European countries 716 -10.2% 1,440 -10.1%
other countries 28 -4.9% 159 +1.9%
restated EBITDA* 1,160 -1.0%
restated EBITDA* margin 31.7% -0.2pt
21
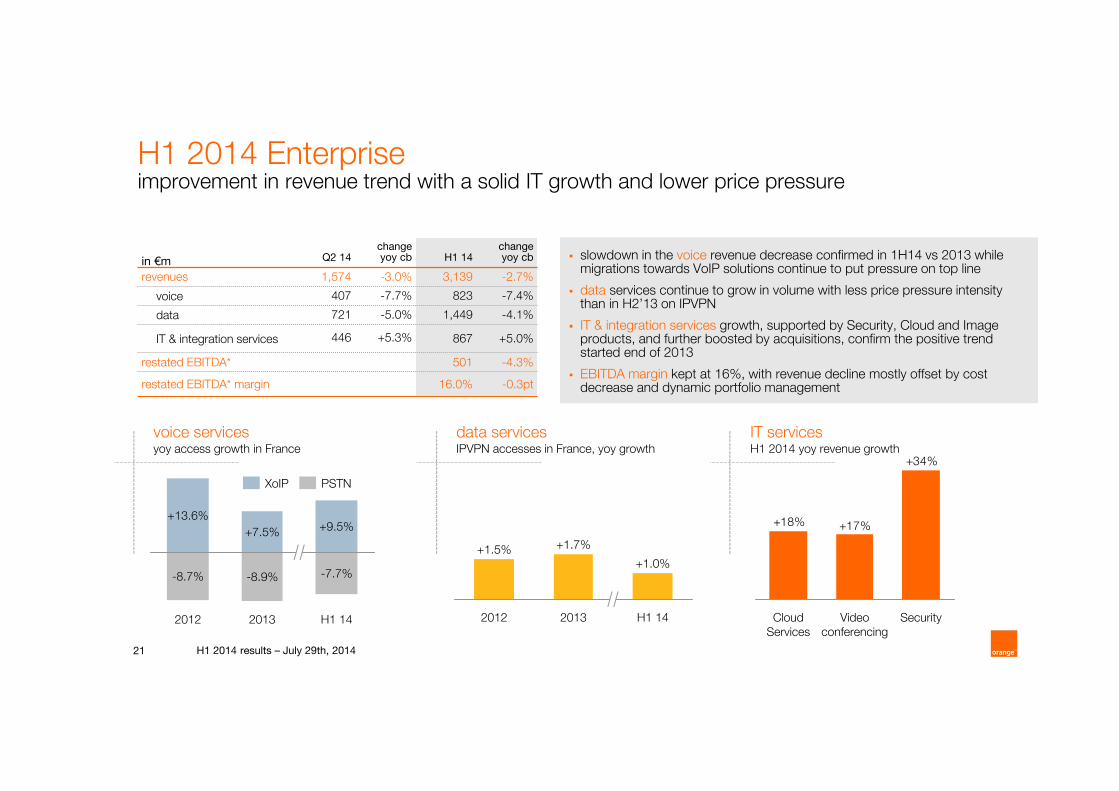
data servicesIPVPN accesses in France, yoy growth
+34%
+17%+18%
SecurityVideo conferencing
Cloud Services
IT servicesH1 2014 yoy revenue growth
voice servicesyoy access growth in France
H1 14
-7.7%
+9.5%
2013
-8.9%
+7.5%
2012
-8.7%
+13.6%
H1 14
+1.0%
2013
+1.7%
2012
+1.5%
PSTNXoIP
H1 2014 Enterpriseimprovement in revenue trend with a solid IT growth and lower price pressure
H1 2014 results – July 29th, 2014
slowdown in the voice revenue decrease confirmed in 1H14 vs 2013 while migrations towards VoIP solutions continue to put pressure on top line
data services continue to grow in volume with less price pressure intensity than in H2’13 on IPVPN
IT & integration services growth, supported by Security, Cloud and Image products, and further boosted by acquisitions, confirm the positive trend started end of 2013
EBITDA margin kept at 16%, with revenue decline mostly offset by cost decrease and dynamic portfolio management
in €m Q2 14 change yoy cb H1 14
change yoy cb
revenues 1,574 -3.0% 3,139 -2.7%
voice 407 -7.7% 823 -7.4%
data 721 -5.0% 1,449 -4.1%
IT & integration services 446 +5.3% 867 +5.0%
restated EBITDA* 501 -4.3%
restated EBITDA* margin 16.0% -0.3pt
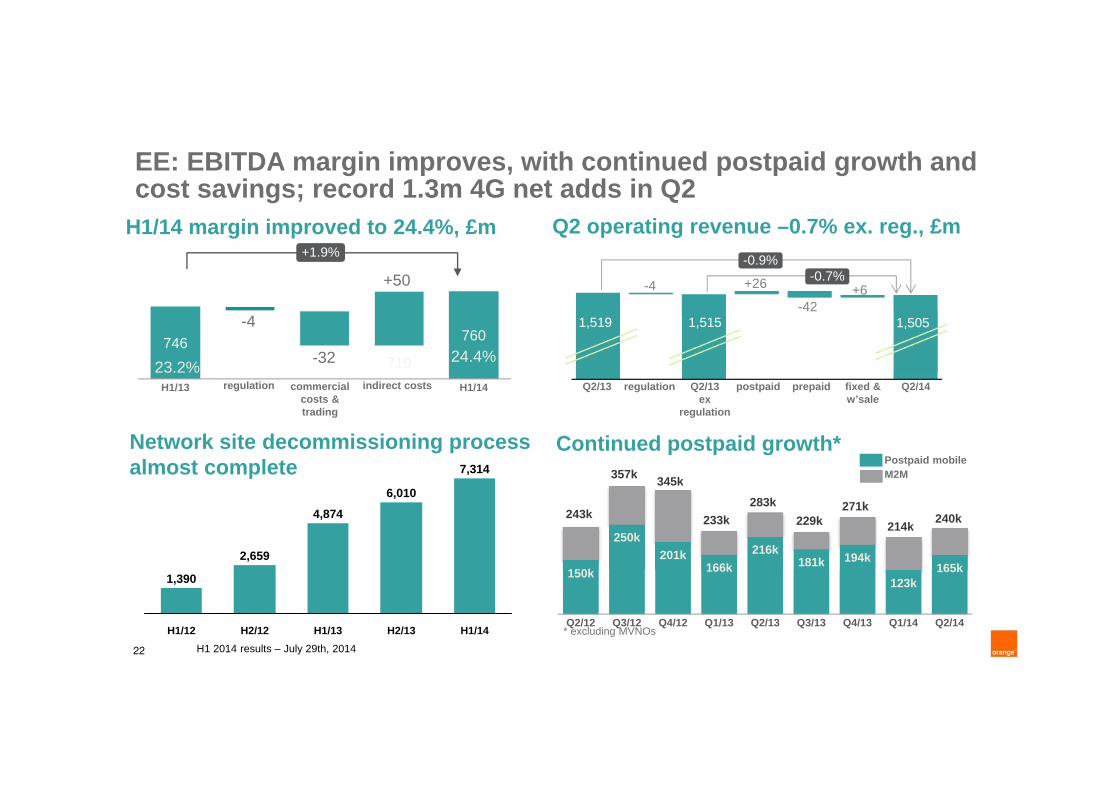
22
EE: EBITDA margin improves, with continued postpaid growth and cost savings; record 1.3m 4G net adds in Q2
H1 2014 results – July 29th, 2014
regulationQ2/13 Q2/14prepaidpostpaidQ2/13 ex
regulation
-0.9%-0.7%
1,519 1,515 1,505
-4-42
+26 +6
fixed & w’sale
Q2 operating revenue –0.7% ex. reg., £mH1/14 margin improved to 24.4%, £m
746 710
760
H1/13 H1/1423.2%
24.4%
regulation indirect costs
-4
-32
+1.9%
+50
commercial costs & trading
Continued postpaid growth*
* excluding MVNOs
150k
250k201k
166k216k
181k 194k
123k165k
Q2/12 Q3/12 Q4/12 Q1/13 Q2/13 Q3/13 Q4/13 Q1/14 Q2/14
214k271k
229k283k
233k
345k357k
243k 240k
Postpaid mobileM2M
Network site decommissioning process almost complete
H1/14
7,314
H2/13
6,010
H1/13
4,874
H2/12
2,659
H1/12
1,390

2014 guidance confirmed
Stéphane Richard
Chairman and CEO
24
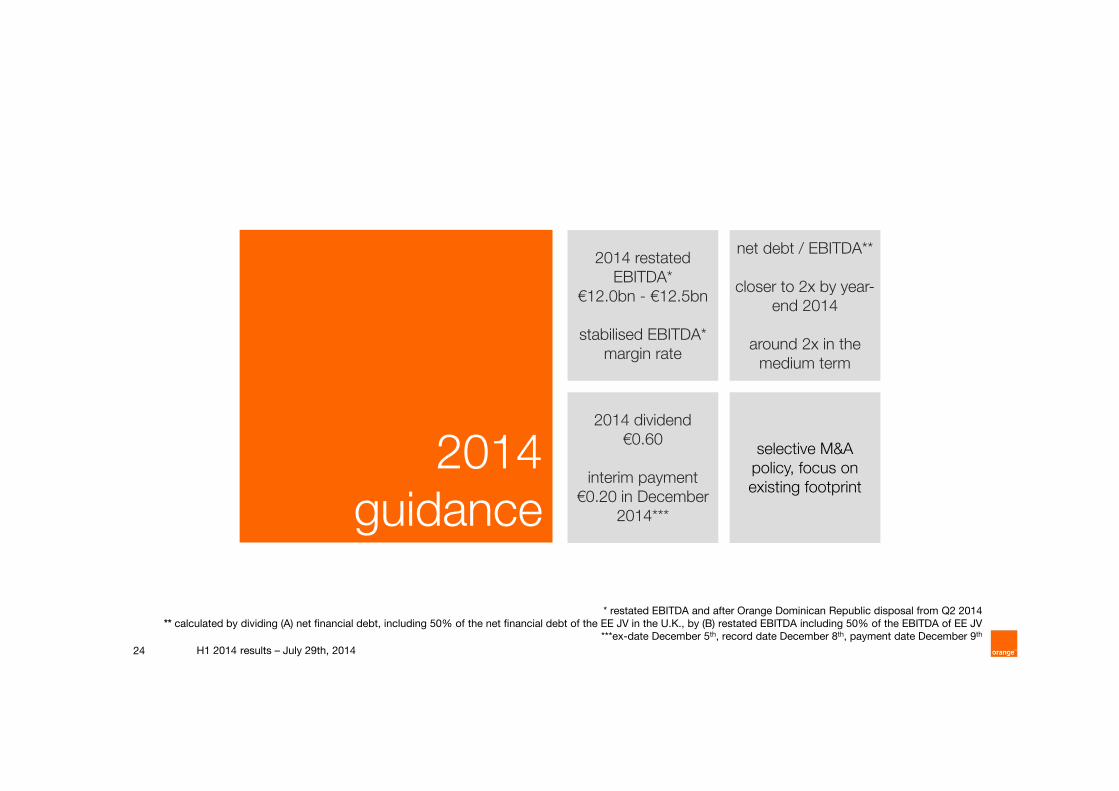
2014 restated EBITDA*
€12.0bn - €12.5bn
stabilised EBITDA* margin rate
2014 dividend€0.60
interim payment €0.20 in December
2014***
net debt / EBITDA**
closer to 2x by year-end 2014
around 2x in the medium term
selective M&A policy, focus on existing footprint
2014 guidance
* restated EBITDA and after Orange Dominican Republic disposal from Q2 2014** calculated by dividing (A) net financial debt, including 50% of the net financial debt of the EE JV in the U.K., by (B) restated EBITDA including 50% of the EBITDA of EE JV
***ex-date December 5th, record date December 8th, payment date December 9th
H1 2014 results – July 29th, 2014

thank you

appendices
27
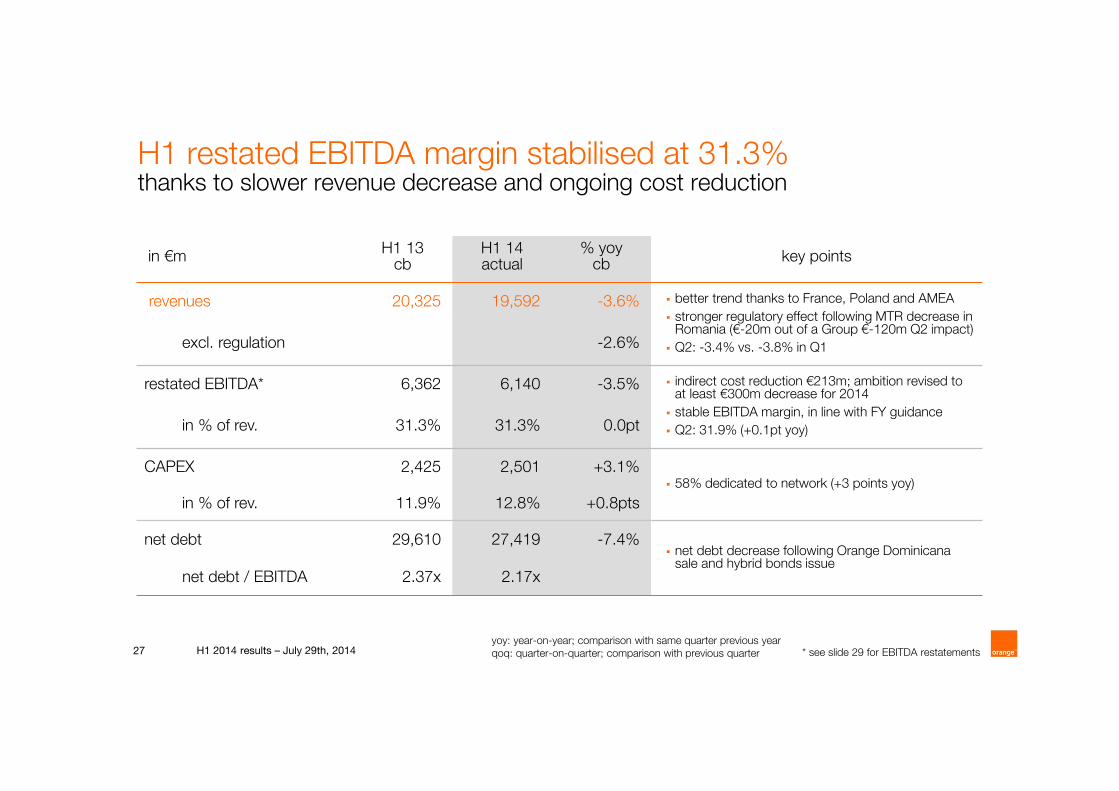
H1 restated EBITDA margin stabilised at 31.3%thanks to slower revenue decrease and ongoing cost reduction
H1 2014 results – July 29th, 2014
in €mH1 13
cbH1 14actual
% yoycb key points
revenues 20,325 19,592 -3.6% better trend thanks to France, Poland and AMEA
stronger regulatory effect following MTR decrease in Romania (€-20m out of a Group €-120m Q2 impact)
Q2: -3.4% vs. -3.8% in Q1excl. regulation -2.6%
restated EBITDA* 6,362 6,140 -3.5% indirect cost reduction €213m; ambition revised to at least €300m decrease for 2014
stable EBITDA margin, in line with FY guidance
Q2: 31.9% (+0.1pt yoy)in % of rev. 31.3% 31.3% 0.0pt
CAPEX 2,425 2,501 +3.1% 58% dedicated to network (+3 points yoy)
in % of rev. 11.9% 12.8% +0.8pts
net debt 29,610 27,419 -7.4% net debt decrease following Orange Dominicana
sale and hybrid bonds issuenet debt / EBITDA 2.37x 2.17x
* see slide 29 for EBITDA restatementsyoy: year-on-year; comparison with same quarter previous yearqoq: quarter-on-quarter; comparison with previous quarter
28
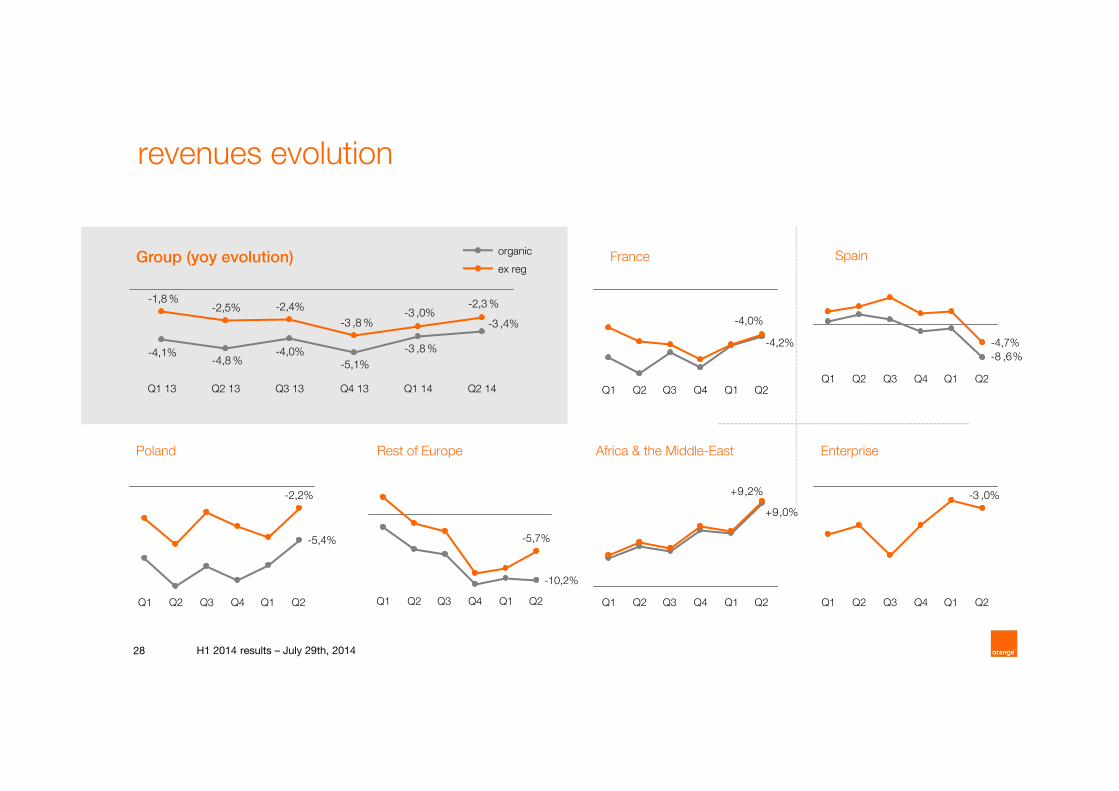
revenues evolution
H1 2014 results – July 29th, 2014
FranceGroup (yoy evolution) Spain
Poland Rest of Europe Africa & the Middle-East Enterprise
-3 ,4%
-3 ,8 %
-5,1%-4,0%
-4,8 %-4,1%
-2,3 %-3 ,0%
-3 ,8 %
-2,4%-2,5%-1,8 %
Q2 14Q1 14Q4 13Q3 13Q2 13Q1 13
-4,2%
-4,0%
Q2Q1Q4Q3Q2Q1
-8 ,6%
-4,7%
Q2Q1Q4Q3Q2Q1
-5,4%
-2,2%
Q2Q1Q4Q3Q2Q1
-5,7%
Q2
-10,2%
Q1Q4Q3Q2Q1
+9,0%
+9,2%
Q2Q1Q4Q3Q2Q1
-3 ,0%
Q2Q3Q1 Q1Q4Q2
ex reg
organic
29
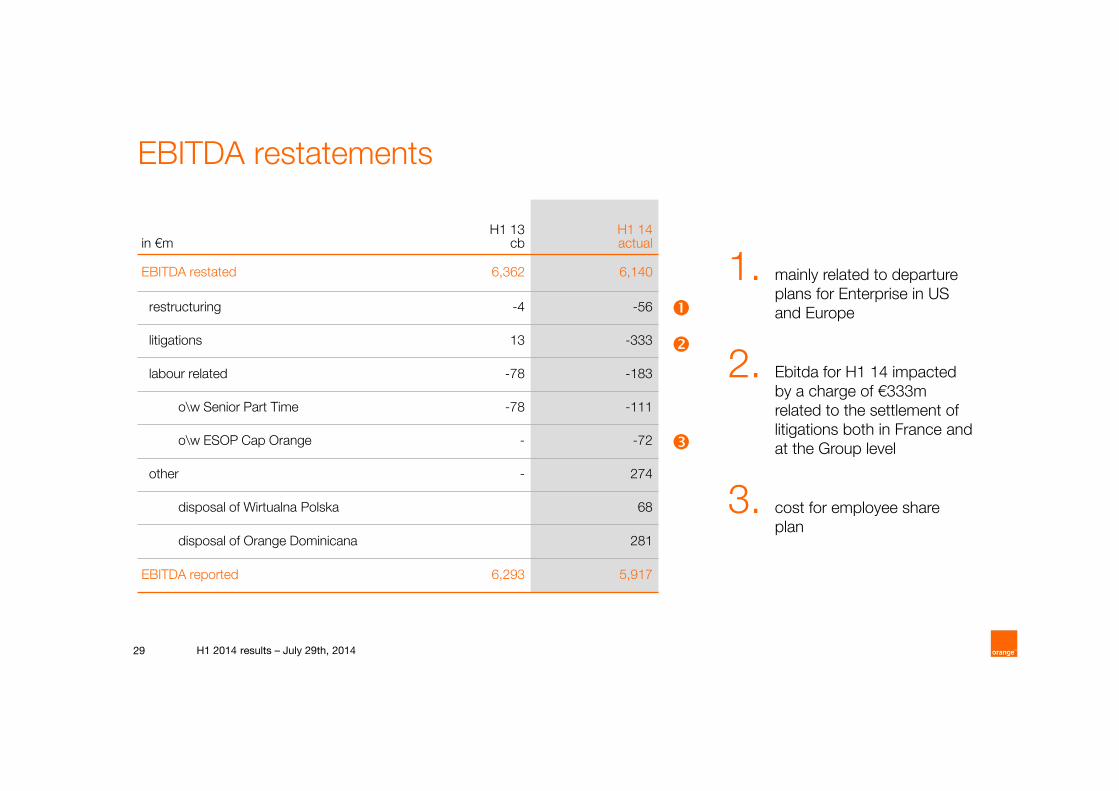
EBITDA restatements
H1 2014 results – July 29th, 2014
in €mH1 13
cbH1 14actual
EBITDA restated 6,362 6,140
restructuring -4 -56
litigations 13 -333
labour related -78 -183
o\w Senior Part Time -78 -111
o\w ESOP Cap Orange - -72
other - 274
disposal of Wirtualna Polska 68
disposal of Orange Dominicana 281
EBITDA reported 6,293 5,917
1. mainly related to departure plans for Enterprise in US and Europe
2. Ebitda for H1 14 impacted by a charge of €333m related to the settlement of litigations both in France and at the Group level
3. cost for employee share plan
30
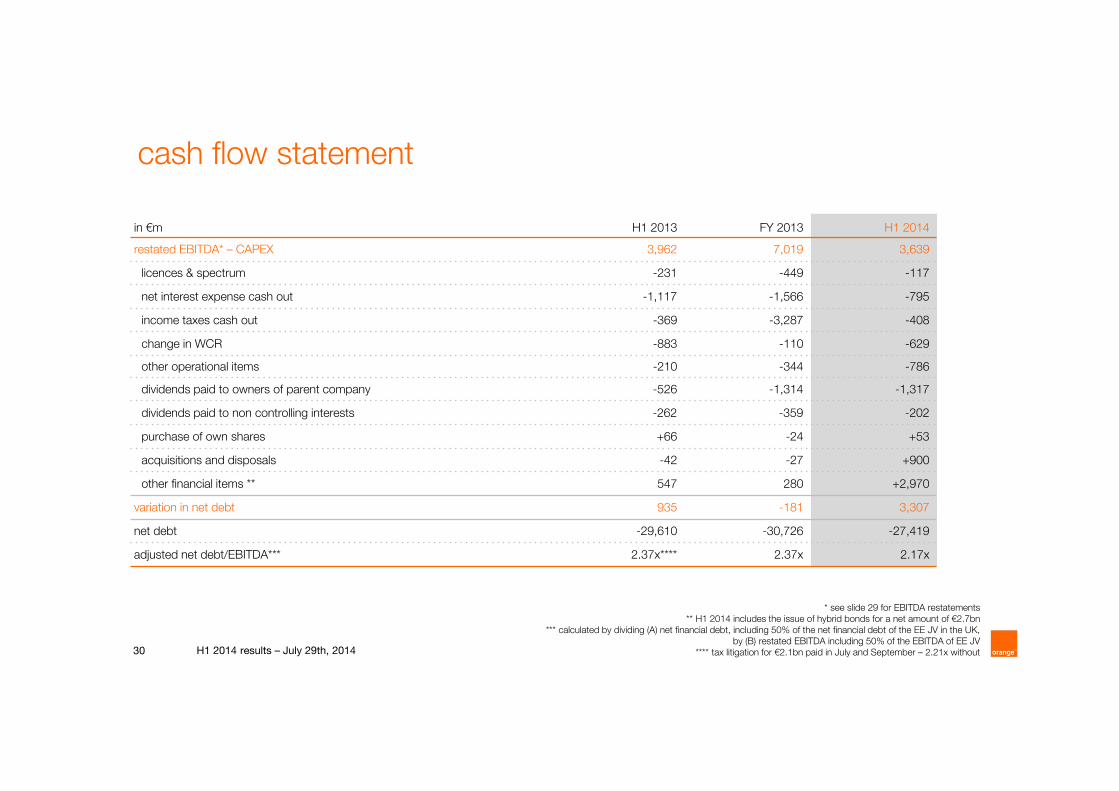
cash flow statement
H1 2014 results – July 29th, 2014
* see slide 29 for EBITDA restatements** H1 2014 includes the issue of hybrid bonds for a net amount of €2.7bn
*** calculated by dividing (A) net financial debt, including 50% of the net financial debt of the EE JV in the UK, by (B) restated EBITDA including 50% of the EBITDA of EE JV
**** tax litigation for €2.1bn paid in July and September – 2.21x without
in €m H1 2013 FY 2013 H1 2014
restated EBITDA* – CAPEX 3,962 7,019 3,639
licences & spectrum -231 -449 -117
net interest expense cash out -1,117 -1,566 -795
income taxes cash out -369 -3,287 -408
change in WCR -883 -110 -629
other operational items -210 -344 -786
dividends paid to owners of parent company -526 -1,314 -1,317
dividends paid to non controlling interests -262 -359 -202
purchase of own shares +66 -24 +53
acquisitions and disposals -42 -27 +900
other financial items ** 547 280 +2,970
variation in net debt 935 -181 3,307
net debt -29,610 -30,726 -27,419
adjusted net debt/EBITDA*** 2.37x**** 2.37x 2.17x

31
high liquidity position of €12.7bn as of June 30, 2014 including €6.2bn in cash
issuances early 2014 at attractive conditions (hybrid bonds of €2.8bn and USD1.6bn notes issued in January, 2014) provide further balance sheet robustness while lowering cost of debt
best-in-class average maturity
average maturity* and net debt evolutiondebt structure
bonds*/bank loans/leases repayments end of june 2014in €bn
Moody’s / S&P / Fitch ratings Baa1 stab / BBB+ neg / BBB+ neg
% of gross debt with fixed rate 90%
% of bond debt in €* (after derivatives) 95%
% of gross debt in bonds 87%
Av. weighted cost of debt in bonds** - H1 2014- end 2013- end 2012
4.77%4.83%5.25%
*excluding TDIRA **source Bloomberg
2017
3.0
2.6
2016
2.9
2.4
2015
2.9
2.5
H2 2014
0.70.3
>2019
18.3
17.3
2018
3.2
2.9
bank loans &othersbonds
10
9999
787
76
27.4
H1 2014
1306
38.0
07
32.535.9
08
42.0
05
47.8
30.5
09 1211
30.7
10
30.931.8
average maturity of net debt in years net debt end of year, in €bn
debtcontinued deleveraging and high liquidity combined with a smooth repayment profile
H1 2014 results – July 29th, 2014