Embed Size (px)
Citation preview

STEP 3: SITING AND SIZING STEP 3: SITING AND SIZING STORM WATER CONTROLSSTORM WATER CONTROLS
Section 6

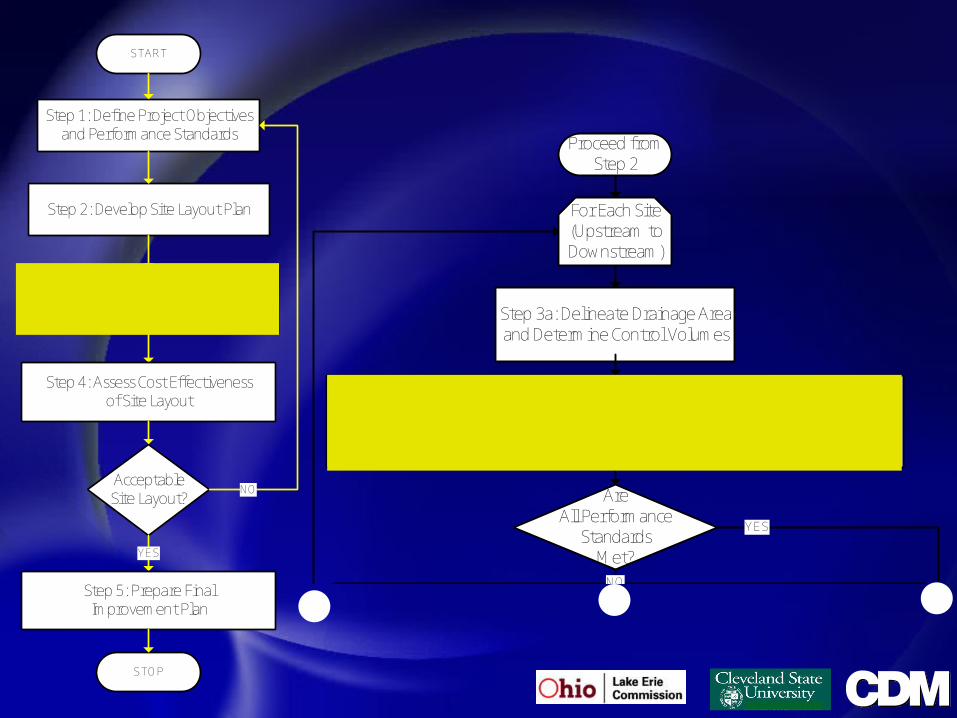
Step 2: Develop Site Layout Plan
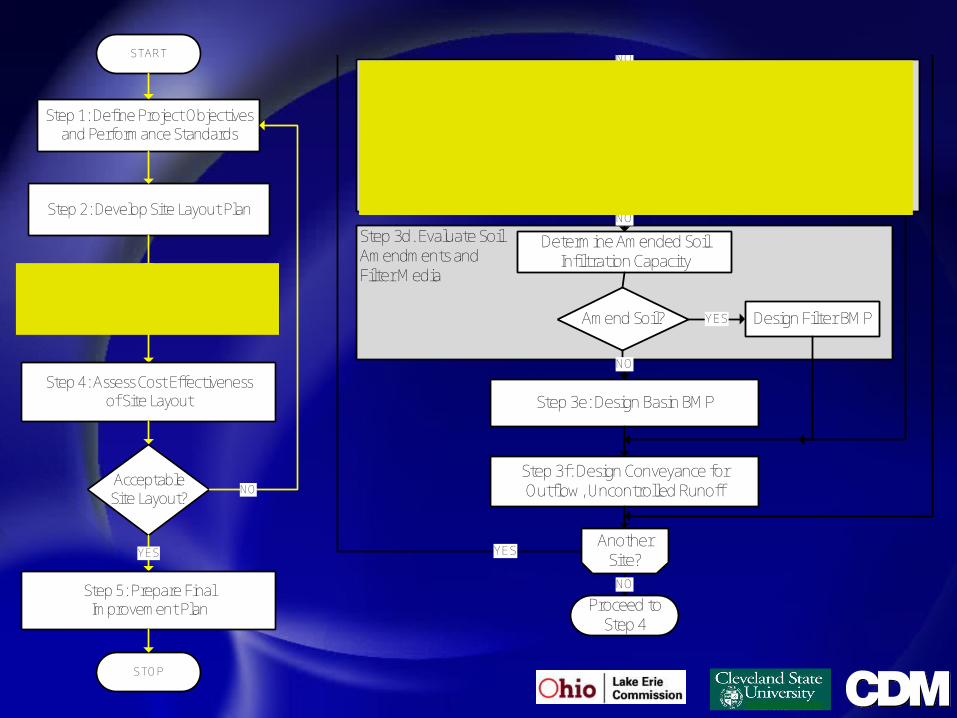
Step 3: Site and Select Storm Water Controls
Step 1: Define Project Objectives and Performance Standards
START
STOP
Step 4: Assess Cost Effectiveness of Site Layout
Acceptable Site Layout?
NO
YES
Step 5: Prepare Final Improvement Plan
Step 3d. Evaluate Soil Amendments and Filter Media
Step 3c. Maximize Infiltration to Native Soil at Site
Step 3b: Define Conveyance Pathways Within Drainage Area
Design Infiltration BMP
Step 3e: Design Basin BMP
Proceed from Step 2
Proceed to Step 4
Are All Performance
Standards Met?
Determine Native Soil Infiltration Capacity
Step 3a: Delineate Drainage Area and Determine Control Volumes
Source Control – No Drainage System Needed Filter Strips and Swales Curb/Gutter/Pipe
Drainage System
All Volume Infiltrated
?
Amend Soil? Design Filter BMP
Step 3f: Design Conveyance for Outflow, Uncontrolled Runoff
NO
NO
YES
YES
NO
YES
NO
YES
For Each Site (Upstream to Downstream)
Another Site?
Determine Amended Soil Infiltration Capacity
Step 2: Develop Site Layout Plan
Step 3: Site and Select Storm Water Controls
Step 1: Define Project Objectives and Performance Standards
START
STOP
Step 4: Assess Cost Effectiveness of Site Layout
Acceptable Site Layout?
NO
YES
Step 5: Prepare Final Improvement Plan
Step 3d. Evaluate Soil Amendments and Filter Media
Step 3c. Maximize Infiltration to Native Soil at Site
Step 3b: Define Conveyance Pathways Within Drainage Area
Design Infiltration BMP
Step 3e: Design Basin BMP
Proceed from Step 2
Proceed to Step 4
Are All Performance
Standards Met?
Determine Native Soil Infiltration Capacity
Step 3a: Delineate Drainage Area and Determine Control Volumes
Source Control – No Drainage System Needed Filter Strips and Swales Curb/Gutter/Pipe
Drainage System
All Volume Infiltrated
?
Amend Soil? Design Filter BMP
Step 3f: Design Conveyance for Outflow, Uncontrolled Runoff
NO
NO
YES
YES
NO
YES
NO
YES
For Each Site (Upstream to Downstream)
Another Site?
Determine Amended Soil Infiltration Capacity

RunoffConveyance /Diversion
StorageDetentionRetention
TreatmentPhysicalChemicalBiological
PeakAttenuation Discharge
Infiltration
Evapotranspiration
Pollutants(to Disposal)
Control Systems
What are Best Practices?What are Best Practices?
Runoff Source Control
Pollutant Source Control
Impervious
Infiltration
Evapotranspiration
Pervious
Source Controls
PreservationRestoration
Resource Protection

Best Local Land Use Practices to Best Local Land Use Practices to Illustrate through Case StudiesIllustrate through Case Studies
Imperviousness control (e.g., reduce, disconnect, permeable materials)
Vegetated filter strips and swales Infiltration practices (e.g., rain gardens,
trenches, dry wells) Filters / underdrains (bioretention, soil
amendments, sand, other) Basins (wet, dry, wetland, vaults) Stream, floodplain, and wetland
enhancements / setbacks Integrated Combinations of Practices
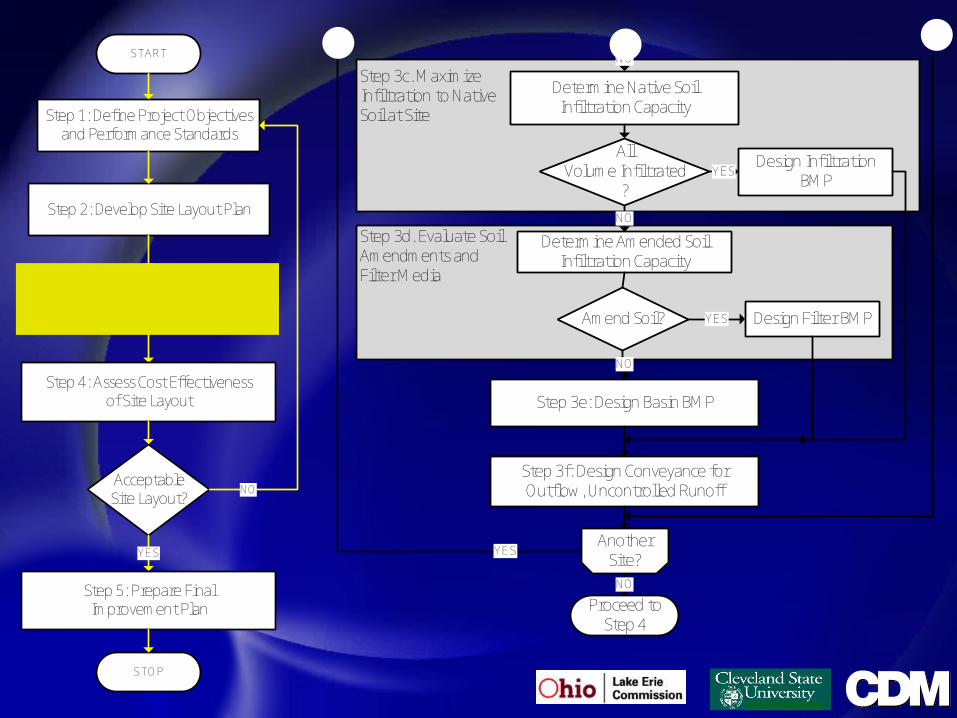
Rain Barrel/Cistern Green Roof
Rain Garden Pocket Park
Bioretention
Decentralized Decentralized ApproachApproach

Opportunities and Barriers : Opportunities and Barriers : Less ImperviousnessLess Imperviousness
Sou
rce
Con
trol
s

Opportunities and Barriers : Opportunities and Barriers : Permeable PavementsPermeable Pavements
Sou
rce
Con
trol
s

Opportunities and Barriers : Opportunities and Barriers : Disconnected DownspoutsDisconnected Downspouts
Sou
rce
Con
trol
s

Opportunities and Barriers : Opportunities and Barriers : Rain Barrels and CisternsRain Barrels and Cisterns
Sou
rce
Con
trol
s

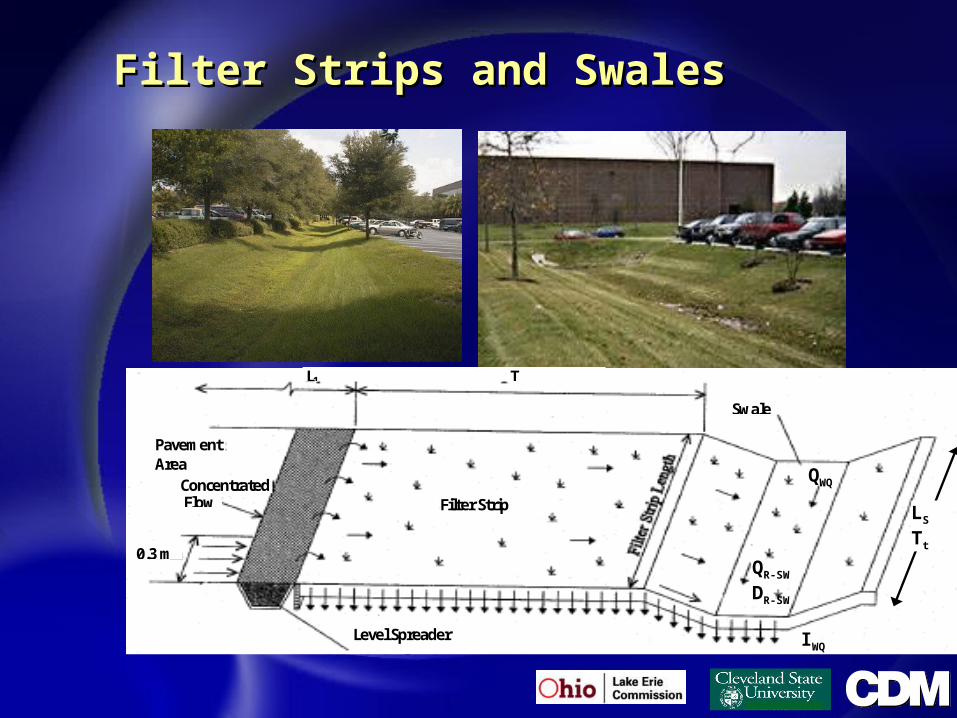
Opportunities and Barriers : Opportunities and Barriers : Filter Strips and SwalesFilter Strips and Swales
Level Spreader
(designs include gravel trenches, sills, embedded curbs, modular porous pavement, and stabilized turf stream)
Swale
Filter Strip Concentrated
Pavement Area
Flow
L1 T
0.3 m
Con
veya
nce
/ Tre
atm
ent S
yste
ms
for
Yar
ds /
Roa
ds /
Par
king
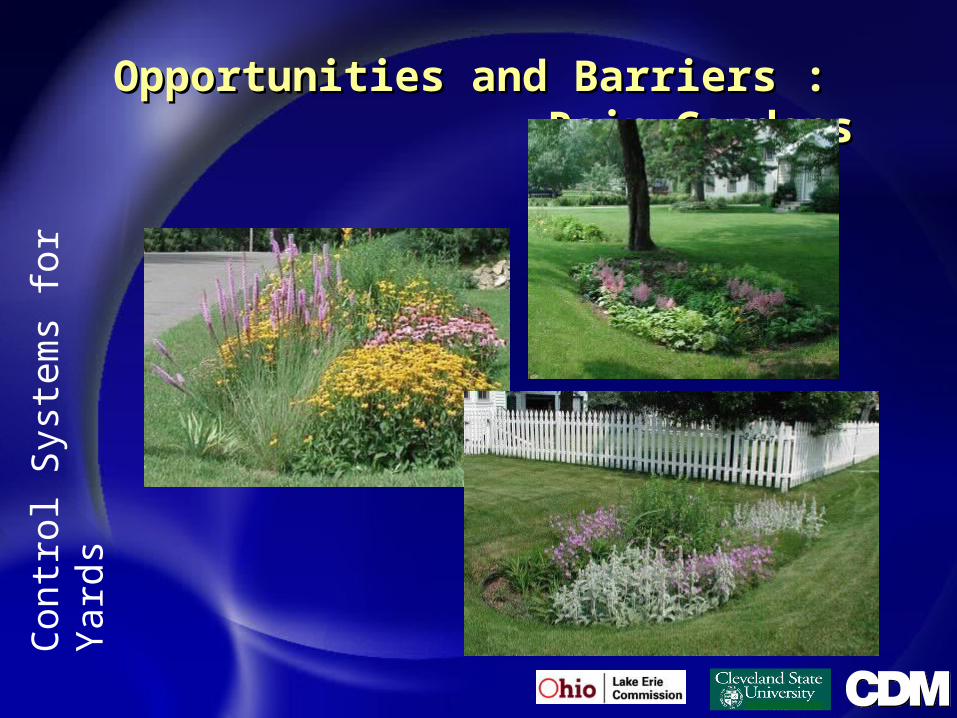
Opportunities and Barriers : Opportunities and Barriers : Rain GardensRain Gardens
Con
trol
Sys
tem
s fo
r Y
ards

Opportunities and Barriers : Opportunities and Barriers : Pocket WetlandsPocket Wetlands
Con
trol
Sys
tem
s fo
r Y
ards

Opportunities and Barriers : Opportunities and Barriers : BioretentionBioretention
drain
Not so good
Good – Run-off from the parking lot can be absorbed by the plants and soil
Center for Watershed Protection
Con
trol
Sys
tem
s fo
r R
oads
/ P
arki
ng
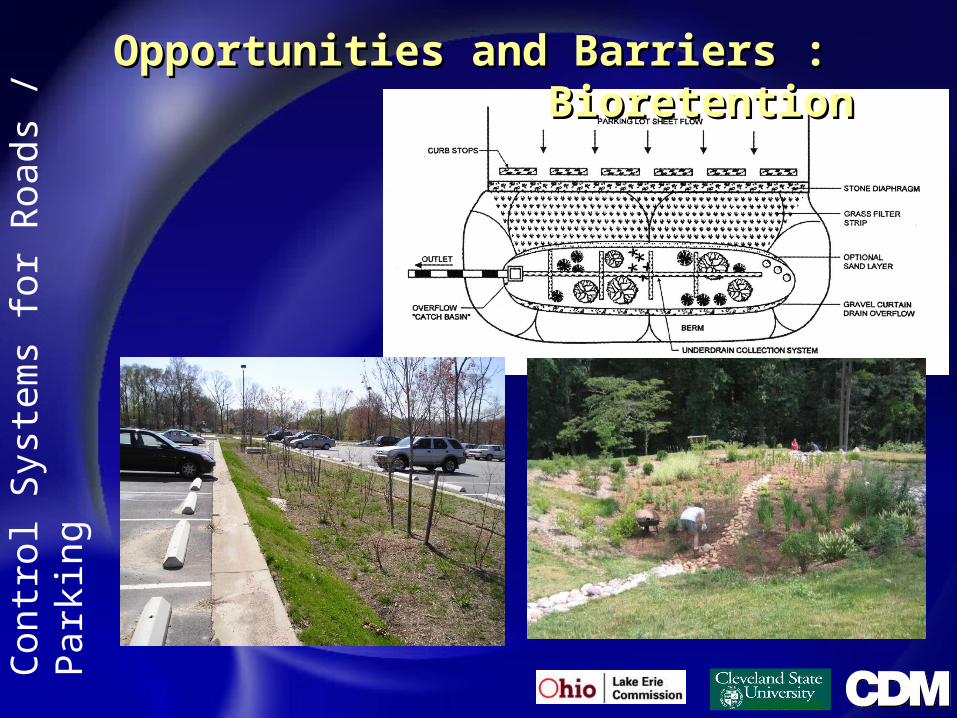
Opportunities and Barriers : Opportunities and Barriers : BioretentionBioretention
Con
trol
Sys
tem
s fo
r R
oads
/ P
arki
ng
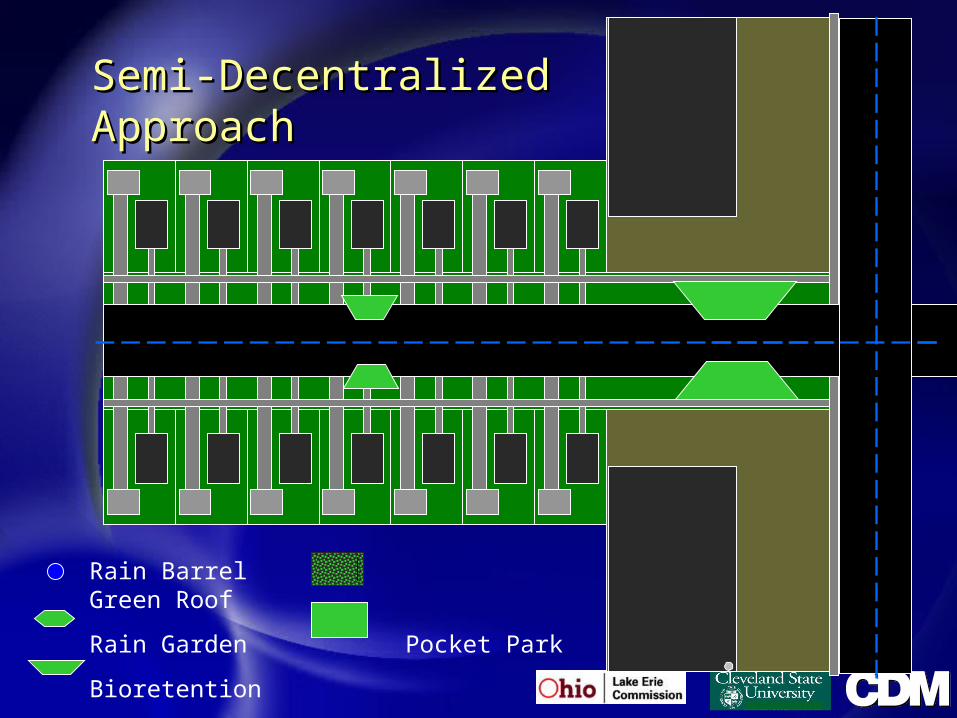
Semi-Decentralized Semi-Decentralized ApproachApproach
Rain Barrel Green Roof
Rain Garden Pocket Park
Bioretention

Opportunities and Barriers : Opportunities and Barriers : BioretentionBioretention
Before
After
After
Con
trol
Sys
tem
s fo
r R
oads
/ P
arki
ng

CentralizedCentralizedApproachApproach
Rain Barrel Green Roof
Rain Garden Pocket Park
Bioretention

Opportunities and Barriers : Opportunities and Barriers : Pocket Park with Best PracticesPocket Park with Best Practices
Con
trol
Sys
tem
s fo
r S
ites/
Reg
ions

Dry Extended Detention Basin Wet Pond - Solids Settling
Wet Pond - EutrophicationWetland
Photo Copyright 1999, Center for Watershed Protection
Opportunities and Barriers : Opportunities and Barriers : Basins for Water Quality / Quantity Control Basins for Water Quality / Quantity Control
Con
trol
Sys
tem
s fo
r S
ites/
Reg
ions

Multi-use Multi-use Storm Storm Water Water BasinBasin
Runoff
Park & Recreation
Treatment and Stream
Erosion Control
Park Facilities& Parking
Pretreatment& Additional Flood Control
(Ballfields, HikingJogging, Biking)
Recharge where Possible
Flood Control

Bruns Ave. Elementary School Wetland and Bruns Ave. Elementary School Wetland and BMP Demonstration Project; BMP Demonstration Project; Charlotte, NCCharlotte, NC
Opportunities and Barriers : Opportunities and Barriers : Integrated Water Quality / Quantity Control Integrated Water Quality / Quantity Control
Con
trol
Sys
tem
s fo
r S
ites/
Reg
ions

Step 2: Develop Site Layout Plan
Step 3: Site and Select Storm Water Controls
Step 1: Define Project Objectives and Performance Standards
START
STOP
Step 4: Assess Cost Effectiveness of Site Layout
Acceptable Site Layout?
NO
YES
Step 5: Prepare Final Improvement Plan
Step 3d. Evaluate Soil Amendments and Filter Media
Step 3c. Maximize Infiltration to Native Soil at Site
Step 3b: Define Conveyance Pathways Within Drainage Area
Design Infiltration BMP
Step 3e: Design Basin BMP
Proceed from Step 2
Proceed to Step 4
Are All Performance
Standards Met?
Determine Native Soil Infiltration Capacity
Step 3a: Delineate Drainage Area and Determine Control Volumes
Source Control – No Drainage System Needed Filter Strips and Swales Curb/Gutter/Pipe
Drainage System
All Volume Infiltrated
?
Amend Soil? Design Filter BMP
Step 3f: Design Conveyance for Outflow, Uncontrolled Runoff
NO
NO
YES
YES
NO
YES
NO
YES
For Each Site (Upstream to Downstream)
Another Site?
Determine Amended Soil Infiltration Capacity

Drainage areas and flow paths are Drainage areas and flow paths are measured from site planmeasured from site plan

ABMP
Vegetated RoofParking LotABMP
Filter BMP
AR = 3 ac
AR = 0.6 ac= 0.6 ac
= 0.3 ac

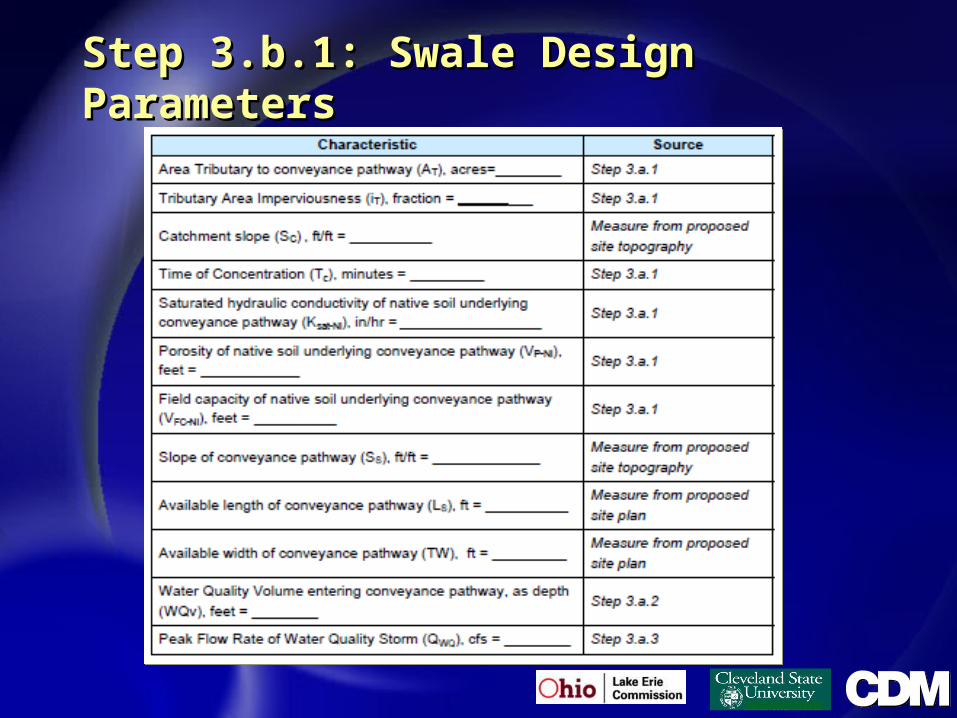
Step 3.a.1: Area InformationStep 3.a.1: Area Information
2.3 ac
0.5 ac1.8 ac
10 min

Step 3.a.1 (cont.): Characteristics of Step 3.a.1 (cont.): Characteristics of Soils at BMP SiteSoils at BMP Site
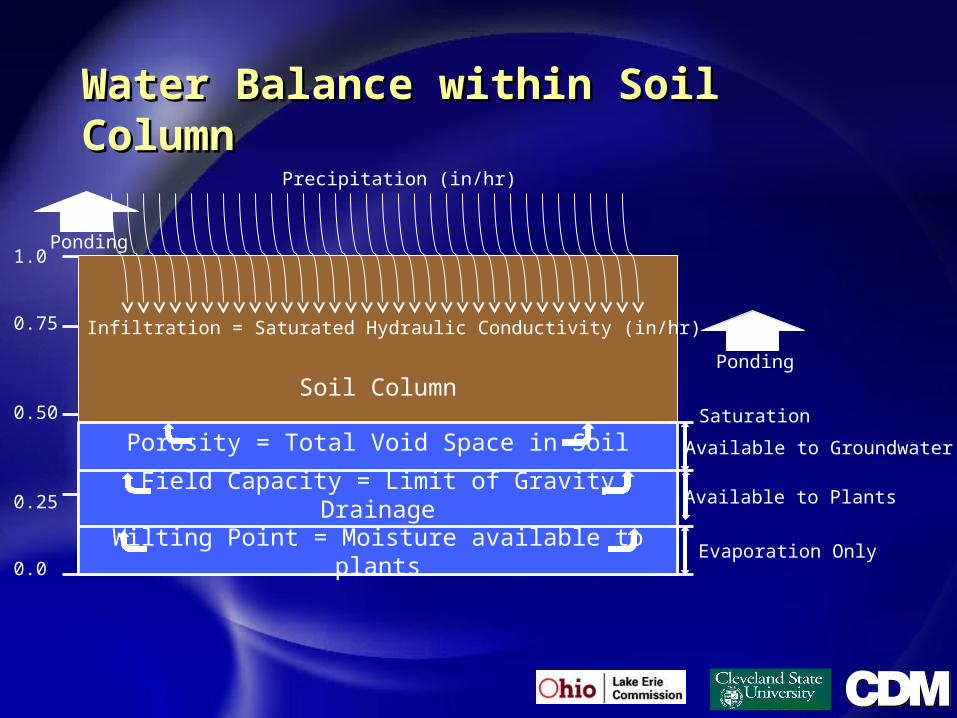
1.0
0.75
0.50
0.25
0.0
Soil Column
Porosity = Total Void Space in Soil
Water Balance within Soil ColumnWater Balance within Soil Column
Field Capacity = Limit of Gravity Drainage
Saturation
Wilting Point = Moisture available to plants
Ponding
Available to Groundwater
Available to Plants
Evaporation Only
Infiltration = Saturated Hydraulic Conductivity (in/hr)
Precipitation (in/hr)
Ponding
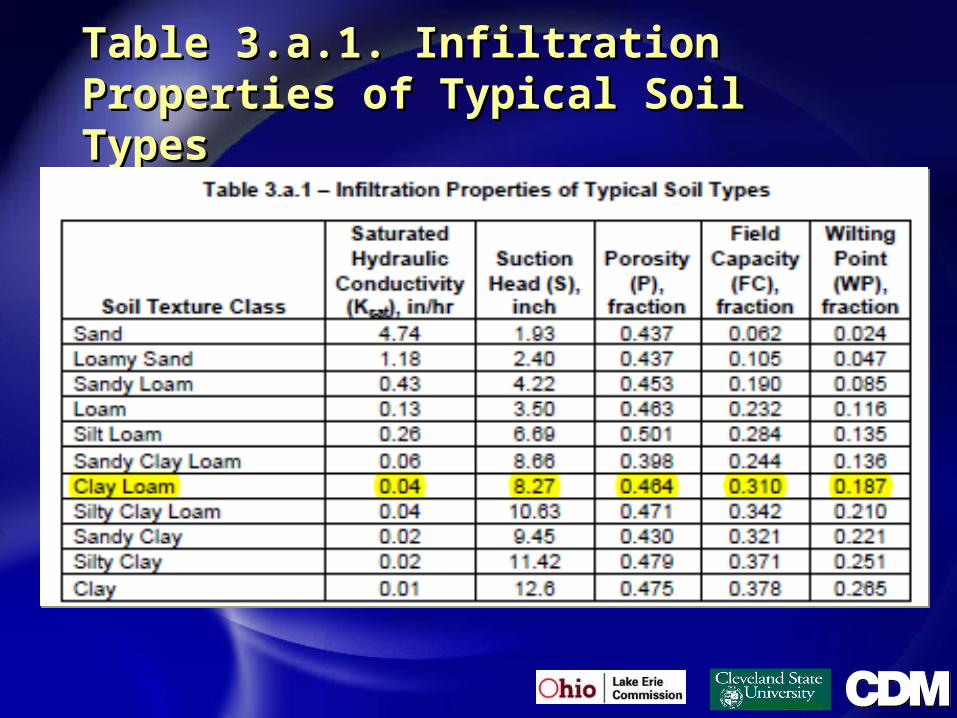
Table 3.a.1. Infiltration Properties of Table 3.a.1. Infiltration Properties of Typical Soil TypesTypical Soil Types

Clay Loam
0.04
0.464 0.310 0.187
5
2.32 1.55
0.935
Step 3.a.1 (cont.): Characteristics of Step 3.a.1 (cont.): Characteristics of Soils at BMP SiteSoils at BMP Site

Unified Stormwater Sizing Criteria Unified Stormwater Sizing Criteria (Minnesota, 2005)(Minnesota, 2005)

Time
Flo
w
Water Quality: First Flush Capture Volume
e.g., 10-yr 1-hr =2.03 in/hr
WQv =0.75 in in 1hr
Downstream Pipe/Channel Capacity = 1.4 in/hr
Water Quantity: Peak ShavingVolume
Extended Detention =0.016 in/hr
Note: 1 in/hr ~ 1 cfs/ac

WQv = C * P * A / 12
where:
WQv = water quality volume in acre-feet
C = runoff coefficient appropriate for storms less
than 1 inch
= 0.858i3 - 0.78i2 + 0.774i + 0.04 or 0.9i + 0.05
I = percent imperviousness
P = rainfall in inches = 0.75 inches
A = area draining into the facility in acres

Figure 8. Mean storm precipitation depth in the U.S (inches) – Source: “Urban Runoff Quality Control”, ASCE / WEF, 1997.

Orlando, Florida
Cincinnati, Ohio
Figure 9. Cumulative probability distribution of daily precipitation for two cities in the U.S. (Roesner, et. al., 1991)

40
50
60
70
80
90
100
0 0.25 0.5 0.75 1 1.25 1.5 1.75 2
Unit Storage Volume (inches)
An
nu
al R
un
off
Cap
ture
(%
)
20% 40%
60% 80%
100%
Percent Impervious
Runoff Volume Captured and Controlled by BMP (acre-inch/acre) 10-yr, 1-hrevent

Step 3.a.2: Calculating Water Quality Step 3.a.2: Calculating Water Quality VolumeVolume
0.4
0.28
= (0.5 ac * 1 + 1.8 ac * 0.28) / 2.3 ac = 0.44
0.0625
0.44 * 0.0625 ft = 0.028 ft
0.028 ft * 2.3 ac = 0.064 ac-ft
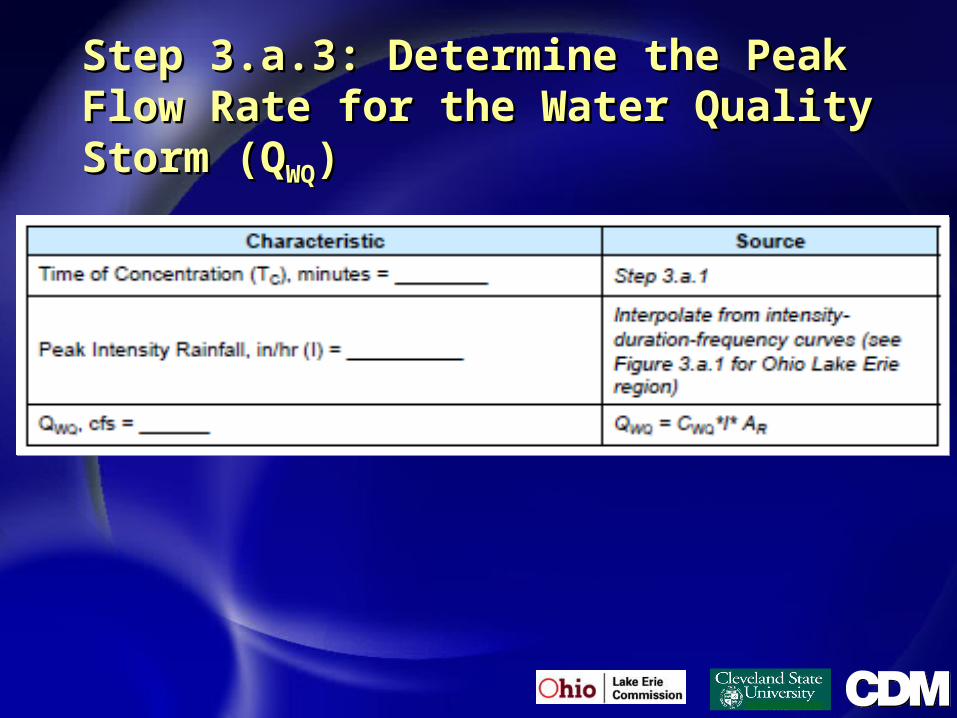
Step 3.a.3: Determine the Peak Flow Step 3.a.3: Determine the Peak Flow Rate for the Water Quality Storm (QRate for the Water Quality Storm (QWQWQ))

Figure 3.a.1 – Intensity-Duration-Frequency Curves for the Ohio Lake Erie Region (Section 02)
Adapted from Huff and Angel, 1992
1.2 in/hr
TC = 10 min
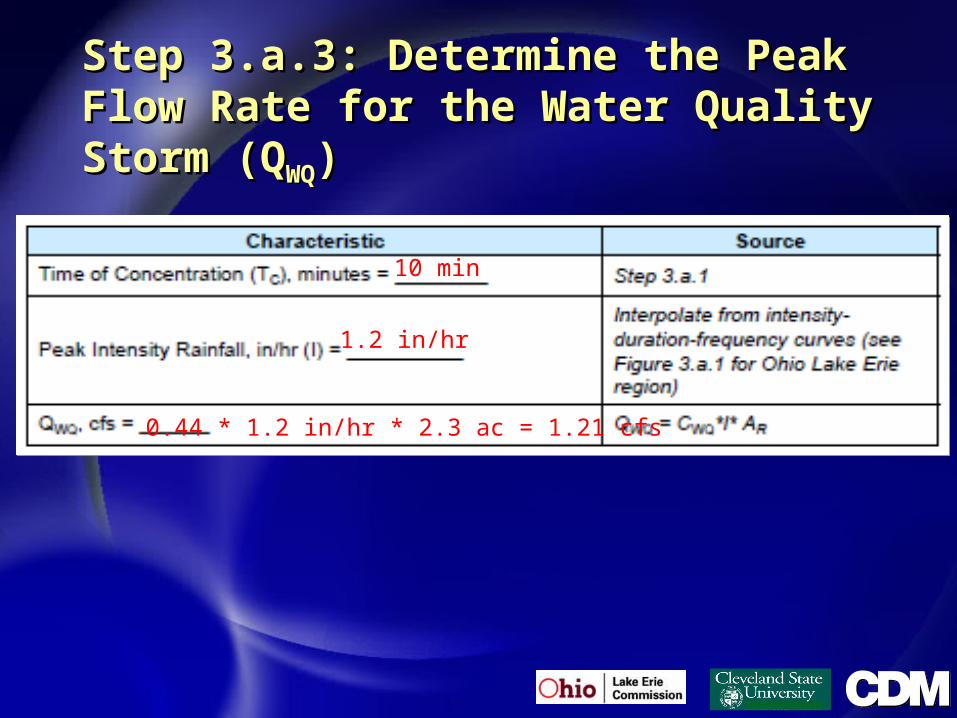
Step 3.a.3: Determine the Peak Flow Step 3.a.3: Determine the Peak Flow Rate for the Water Quality Storm (QRate for the Water Quality Storm (QWQWQ))
10 min
1.2 in/hr
0.44 * 1.2 in/hr * 2.3 ac = 1.21 cfs

STEP 3.a.4. Determine Initial Soil STEP 3.a.4. Determine Initial Soil Moisture ConditionsMoisture Conditions
1.55 ft
2 days
Step 2: Develop Site Layout Plan
Step 3: Site and Select Storm Water Controls
Step 1: Define Project Objectives and Performance Standards
START
STOP
Step 4: Assess Cost Effectiveness of Site Layout
Acceptable Site Layout?
NO
YES
Step 5: Prepare Final Improvement Plan
Step 3d. Evaluate Soil Amendments and Filter Media
Step 3c. Maximize Infiltration to Native Soil at Site
Step 3b: Define Conveyance Pathways Within Drainage Area
Design Infiltration BMP
Step 3e: Design Basin BMP
Proceed from Step 2
Proceed to Step 4
Are All Performance
Standards Met?
Determine Native Soil Infiltration Capacity
Step 3a: Delineate Drainage Area and Determine Control Volumes
Source Control – No Drainage System Needed Filter Strips and Swales Curb/Gutter/Pipe
Drainage System
All Volume Infiltrated
?
Amend Soil? Design Filter BMP
Step 3f: Design Conveyance for Outflow, Uncontrolled Runoff
NO
NO
YES
YES
NO
YES
NO
YES
For Each Site (Upstream to Downstream)
Another Site?
Determine Amended Soil Infiltration Capacity
Filter Strips and SwalesFilter Strips and Swales
Level Spreader
(designs include gravel trenches, sills, embedded curbs, modular porous pavement, and stabilized turf stream)
Swale
Filter Strip Concentrated
Pavement Area
Flow
L1 T
0.3 m
QWQ
QR-SW
DR-SW
IWQ
LS Tt
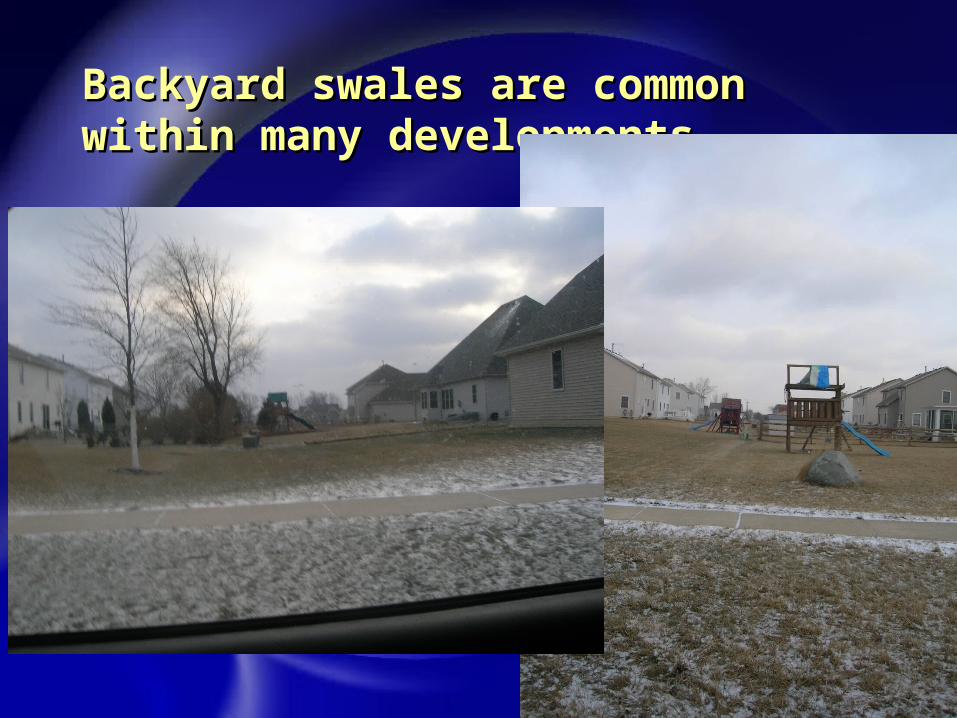
Backyard swales are common within Backyard swales are common within many developmentsmany developments

STEP 3.b.2: Evaluate Site Conditions STEP 3.b.2: Evaluate Site Conditions to Determine if a Grass Filter Strip is a to Determine if a Grass Filter Strip is a Feasible BMP Option.Feasible BMP Option.

Step 3.b.3: Sizing for Water Quality Step 3.b.3: Sizing for Water Quality (Q(QWQWQ = [1.486* A*R = [1.486* A*R2/32/3*S*SSS
1/21/2] / n)] / n)
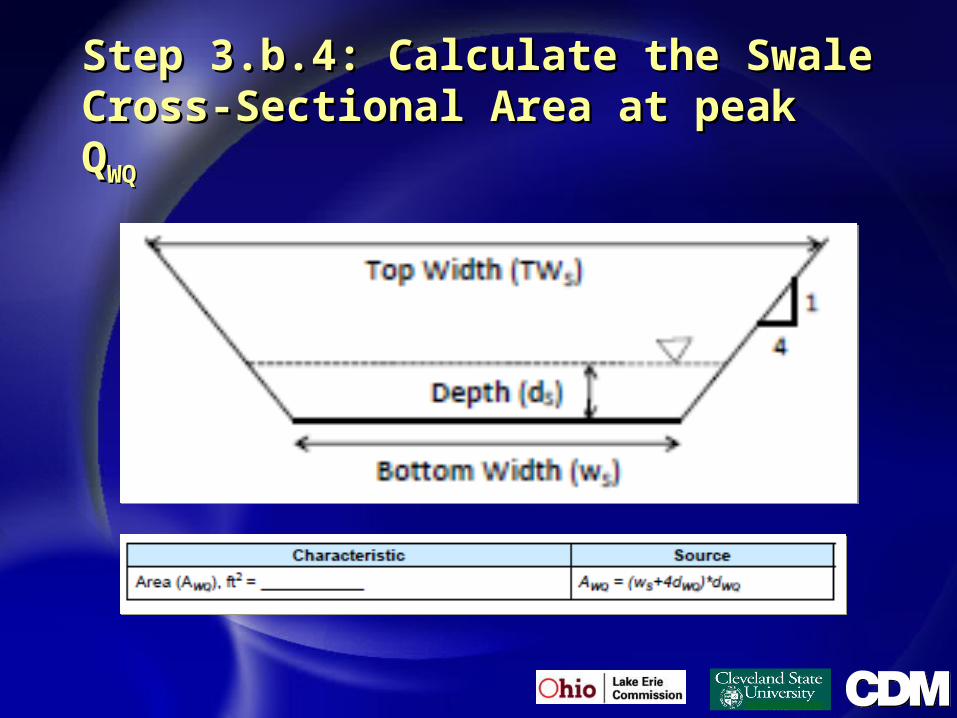
Step 3.b.4: Calculate the Swale Cross-Step 3.b.4: Calculate the Swale Cross-Sectional Area at peak QSectional Area at peak QWQWQ

Look-up table for ARLook-up table for AR2/32/3
6.0 6.2 6.4 6.6 6.8 7.0 7.2 7.4 7.6 7.8 8.0
0.25 0.632 0.652 0.671 0.691 0.711 0.730 0.750 0.770 0.790 0.809 0.829
0.26 0.669 0.690 0.711 0.731 0.752 0.773 0.794 0.815 0.835 0.856 0.877
0.27 0.707 0.729 0.751 0.773 0.795 0.816 0.838 0.860 0.882 0.904 0.926
0.28 0.746 0.769 0.792 0.815 0.838 0.861 0.884 0.907 0.930 0.953 0.976
0.28 0.786 0.810 0.834 0.858 0.883 0.907 0.931 0.955 0.979 1.004 1.028
0.29 0.827 0.852 0.877 0.903 0.928 0.953 0.979 1.004 1.030 1.055 1.081
0.30 0.868 0.895 0.921 0.948 0.975 1.001 1.028 1.054 1.081 1.108 1.134
0.31 0.911 0.939 0.967 0.994 1.022 1.050 1.078 1.106 1.134 1.162 1.189
0.32 0.955 0.984 1.013 1.042 1.071 1.100 1.129 1.158 1.187 1.216 1.246
0.33 0.999 1.030 1.060 1.090 1.120 1.151 1.181 1.212 1.242 1.272 1.303
0.33 1.045 1.076 1.108 1.140 1.171 1.203 1.234 1.266 1.298 1.330 1.361
0.34 1.091 1.124 1.157 1.190 1.223 1.256 1.289 1.322 1.355 1.388 1.421
0.35 1.139 1.173 1.207 1.241 1.276 1.310 1.344 1.379 1.413 1.447 1.482
depth (d) in feet 0.36 1.187 1.222 1.258 1.294 1.329 1.365 1.401 1.436 1.472 1.508 1.544
0.37 1.236 1.273 1.310 1.347 1.384 1.421 1.458 1.495 1.532 1.569 1.607
0.38 1.286 1.325 1.363 1.401 1.440 1.478 1.517 1.555 1.594 1.632 1.671
0.38 1.338 1.377 1.417 1.457 1.497 1.537 1.576 1.616 1.656 1.696 1.736
0.39 1.390 1.431 1.472 1.513 1.554 1.596 1.637 1.678 1.720 1.761 1.803
0.40 1.443 1.485 1.528 1.571 1.613 1.656 1.699 1.742 1.784 1.827 1.870
0.41 1.497 1.541 1.585 1.629 1.673 1.717 1.762 1.806 1.850 1.895 1.939
0.42 1.552 1.597 1.643 1.688 1.734 1.780 1.826 1.871 1.917 1.963 2.009
0.43 1.608 1.655 1.702 1.749 1.796 1.843 1.891 1.938 1.985 2.032 2.080
0.43 1.664 1.713 1.762 1.810 1.859 1.908 1.957 2.005 2.054 2.103 2.152
0.44 1.722 1.772 1.823 1.873 1.923 1.973 2.024 2.074 2.124 2.175 2.225
0.45 1.781 1.833 1.884 1.936 1.988 2.040 2.092 2.144 2.196 2.248 2.300
0.46 1.841 1.894 1.947 2.001 2.054 2.108 2.161 2.215 2.268 2.322 2.375
Dep
th (
ft)
Width (ft)
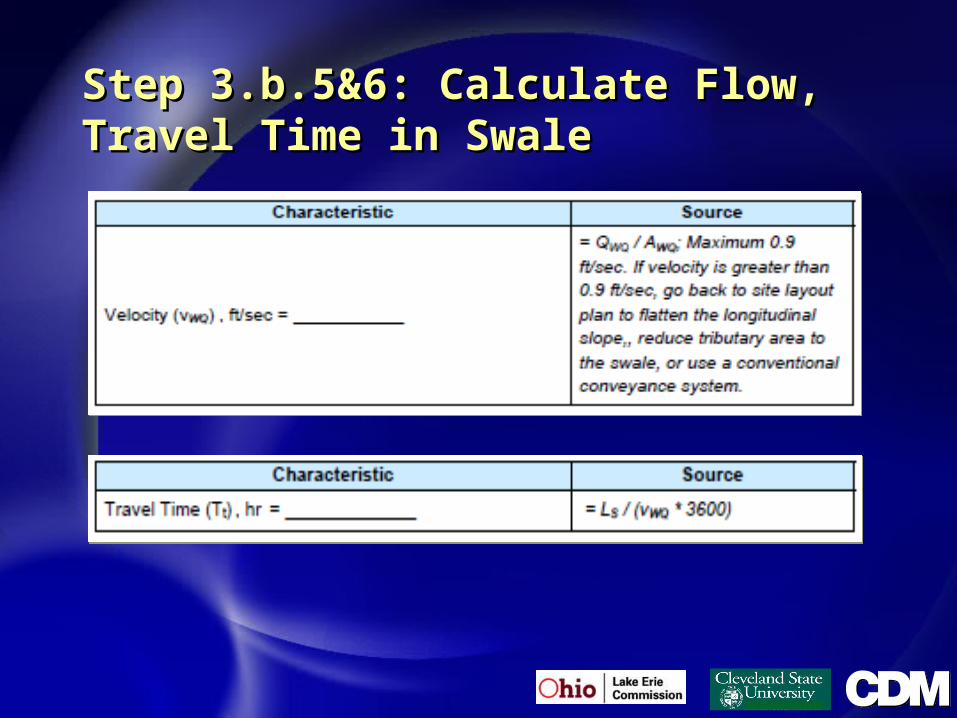
Step 3.b.5&6: Calculate Flow, Travel Step 3.b.5&6: Calculate Flow, Travel Time in SwaleTime in Swale

Step 3.b.7: Check major storm capacityStep 3.b.7: Check major storm capacity

Step 3.b.8: Adjust WQStep 3.b.8: Adjust WQVV for Infiltration for Infiltration
within Swalewithin Swale

Group Discussion Topic #4a: Drainage Group Discussion Topic #4a: Drainage Areas and Internal Drainage (Steps 3a & 3b)Areas and Internal Drainage (Steps 3a & 3b)
Step 2: Develop Site Layout Plan
Step 3: Site and Select Storm Water Controls
Step 1: Define Project Objectives and Performance Standards
START
STOP
Step 4: Assess Cost Effectiveness of Site Layout
Acceptable Site Layout?
NO
YES
Step 5: Prepare Final Improvement Plan
Step 3d. Evaluate Soil Amendments and Filter Media
Step 3c. Maximize Infiltration to Native Soil at Site
Step 3b: Define Conveyance Pathways Within Drainage Area
Design Infiltration BMP
Step 3e: Design Basin BMP
Proceed from Step 2
Proceed to Step 4
Are All Performance
Standards Met?
Determine Native Soil Infiltration Capacity
Step 3a: Delineate Drainage Area and Determine Control Volumes
Source Control – No Drainage System Needed Filter Strips and Swales Curb/Gutter/Pipe
Drainage System
All Volume Infiltrated
?
Amend Soil? Design Filter BMP
Step 3f: Design Conveyance for Outflow, Uncontrolled Runoff
NO
NO
YES
YES
NO
YES
NO
YES
For Each Site (Upstream to Downstream)
Another Site?
Determine Amended Soil Infiltration Capacity

Flo
w R
ate
(Dis
char
ge)
Time
Before Before UrbanizationUrbanization
After Urbanization After Urbanization with No Detention with No Detention
After Urbanization After Urbanization with an Extended with an Extended DetentionDetention
After Urbanization After Urbanization with Volume Control with Volume Control (Detention)(Detention)
RainstormRainstorm<1-year design storm<1-year design storm
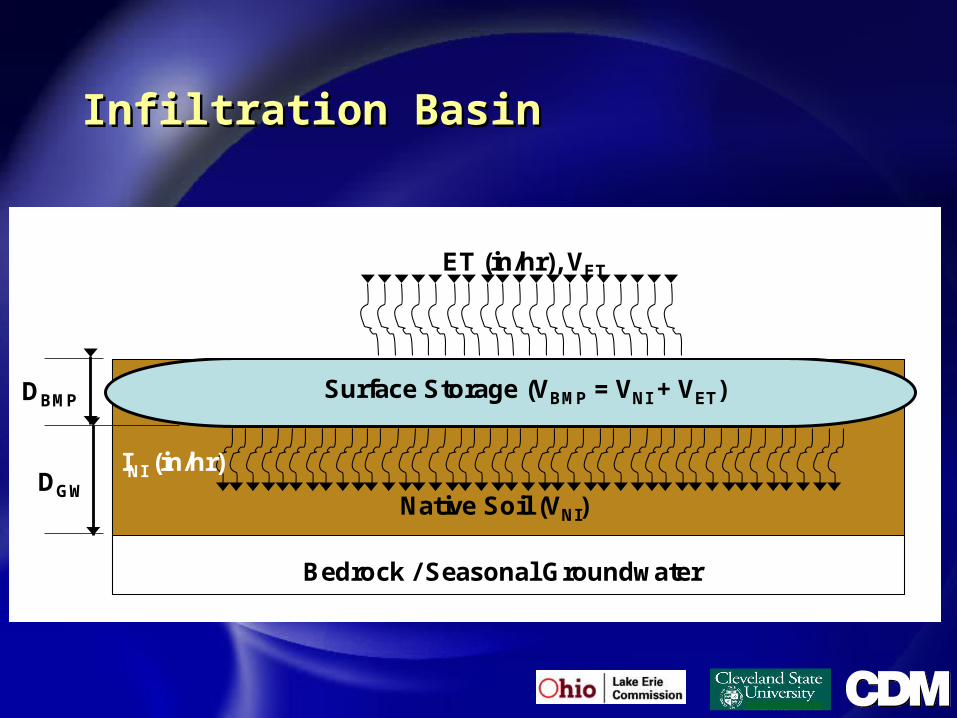
Infiltration BasinInfiltration Basin
DBMP Surface Storage (VBMP = VNI + VET)
Native Soil (VNI)
Bedrock / Seasonal Groundwater
INI (in/hr)DGW
ET (in/hr), VET

Step 3.c.1: BMP Site 1 CharacteristicsStep 3.c.1: BMP Site 1 Characteristics

Step 3.c.2: Determine Total Water Step 3.c.2: Determine Total Water Quality Volume Entering BMP siteQuality Volume Entering BMP site
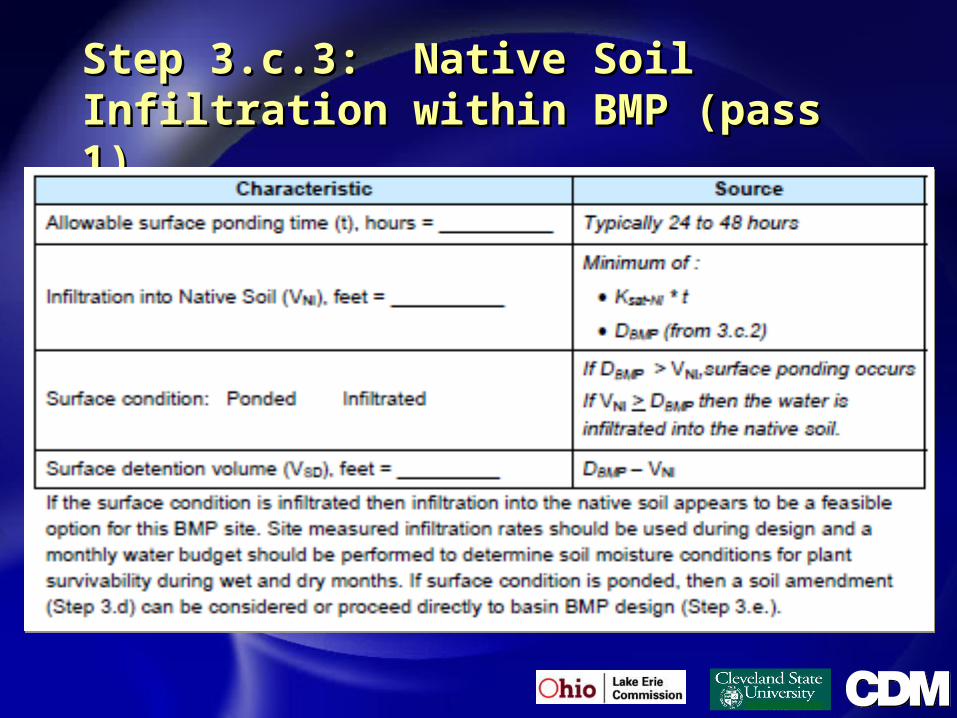
Step 3.c.3: Native Soil Infiltration Step 3.c.3: Native Soil Infiltration within BMP (pass 1)within BMP (pass 1)

Group Discussion Group Discussion Topic #4b: Native Topic #4b: Native Soil Infiltration Soil Infiltration Capacity (Step 3c)Capacity (Step 3c)
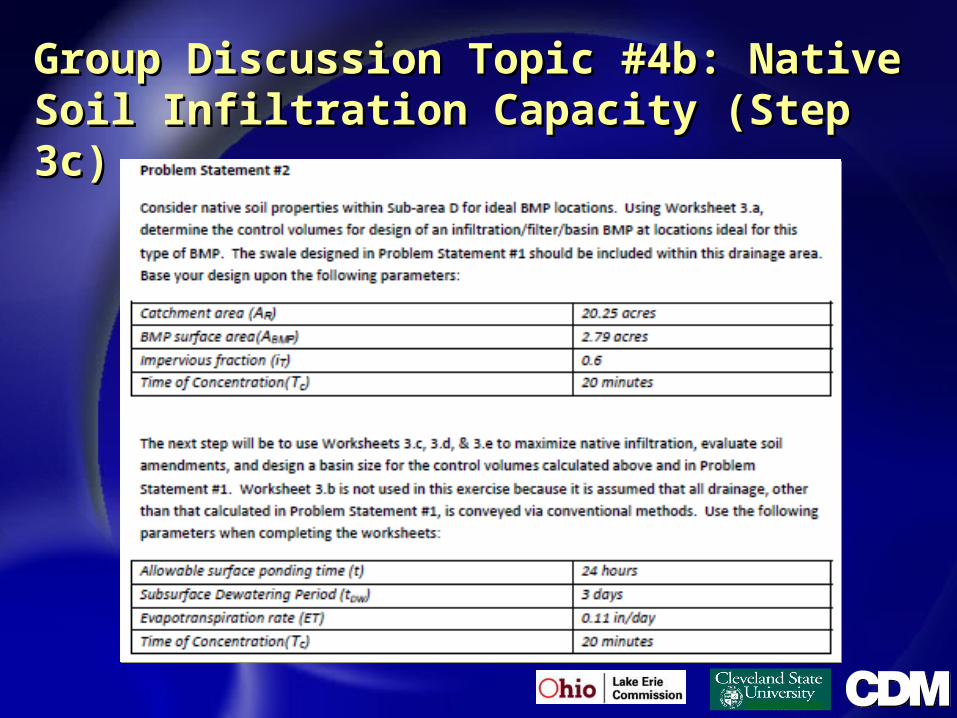
Group Discussion Topic #4b: Native Soil Group Discussion Topic #4b: Native Soil Infiltration Capacity (Step 3c)Infiltration Capacity (Step 3c)

Step 2: Develop Site Layout Plan
Step 3: Site and Select Storm Water Controls
Step 1: Define Project Objectives and Performance Standards
START
STOP
Step 4: Assess Cost Effectiveness of Site Layout
Acceptable Site Layout?
NO
YES
Step 5: Prepare Final Improvement Plan
Step 3d. Evaluate Soil Amendments and Filter Media
Step 3c. Maximize Infiltration to Native Soil at Site
Step 3b: Define Conveyance Pathways Within Drainage Area
Design Infiltration BMP
Step 3e: Design Basin BMP
Proceed from Step 2
Proceed to Step 4
Are All Performance
Standards Met?
Determine Native Soil Infiltration Capacity
Step 3a: Delineate Drainage Area and Determine Control Volumes
Source Control – No Drainage System Needed Filter Strips and Swales Curb/Gutter/Pipe
Drainage System
All Volume Infiltrated
?
Amend Soil? Design Filter BMP
Step 3f: Design Conveyance for Outflow, Uncontrolled Runoff
NO
NO
YES
YES
NO
YES
NO
YES
For Each Site (Upstream to Downstream)
Another Site?
Determine Amended Soil Infiltration Capacity

Combination Filter / InfiltratorCombination Filter / Infiltrator
DBMP Surface Storage (VBMP = VET + VEI)
Filter / Planting Media – Soil, Sand, etc. (VEI)
Bedrock / Seasonal Groundwater
IEI (in/hr)
Native Soil (VNI)
INI (in/hr)
DM
DGW
ET (in/hr), VET

Step 3.a.1: Characteristics of Soils at Step 3.a.1: Characteristics of Soils at BMP SiteBMP Site
Clay Loam
0.04
0.464 0.310 0.187
5
2.32 1.55
0.935
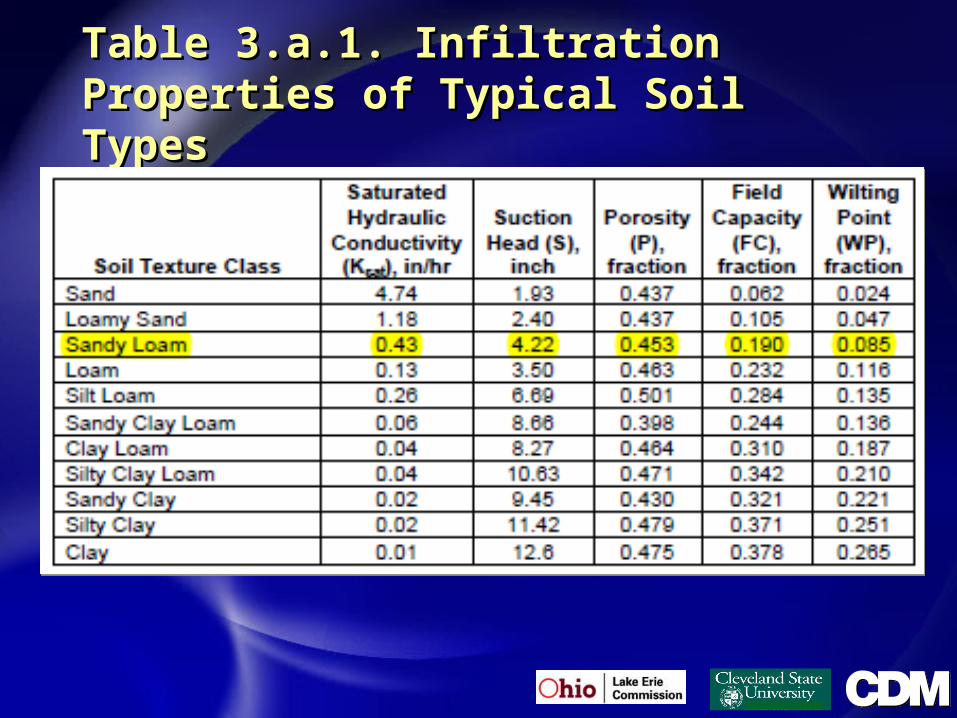
Table 3.a.1. Infiltration Properties of Table 3.a.1. Infiltration Properties of Typical Soil TypesTypical Soil Types

Clay Loam
0.04
0.464 0.310 0.187
5
2.32 1.55
0.935
Step 3.a.1: Characteristics of Soils at Step 3.a.1: Characteristics of Soils at BMP Site - Enhanced Soil InfiltrationBMP Site - Enhanced Soil Infiltration
Sandy Loam
0.43
0.453 0.190
0.085
2.0
0.906 0.380
0.170

Step 3.d.1: Amended Soil in BMP Step 3.d.1: Amended Soil in BMP (pass 2)(pass 2)

Step 3.d.2: Step 3.d.2: Determine Determine Infiltration, Infiltration, Evaporation Evaporation and Soil and Soil Moisture Moisture within BMPwithin BMP

STEP 3.e: Design Basin BMP (if soil STEP 3.e: Design Basin BMP (if soil moisture condition is Saturated or moisture condition is Saturated or Ponded after Step 3.d.)Ponded after Step 3.d.)

Extended Dry Detention BasinExtended Dry Detention Basin
VE
DTo
Sew
er /.
Str
eam
:-R
estr
icte
d /
Det
ain
ed
DBMP Surface Storage (VBMP = VET + VNI + VED)
Native Soil (VNI)
Bedrock / Seasonal Groundwater
INI (in/hr)DNIDGW
ET (in/hr), VET

Infiltration & Filter & Detention in a Infiltration & Filter & Detention in a Single FacilitySingle Facility
DBMP Water Quality Storage (VBMP = VNI + VEI + VED + VET)
Filter / Planting Media – Soil, Sand, etc. (VEI)
Bedrock / Seasonal Groundwater
IEI (in/hr)
Native Soil (VNI)
INI (in/hr)
DM
VE
D&
VF
CTo
Sew
er /.
Str
eam
:-R
estr
icte
d /
Det
ain
edLive (VED)
Infiltrate (VNI)
Rock Reservoir
Flood Control Storage (VFC)DFC
DRock-ED
DRock-NI
DNIDGW
ET (in/hr), VET

Group Discussion Topic #4c: Amended Soil Group Discussion Topic #4c: Amended Soil Infiltration / Detention Facility (Steps 3c, d, e)Infiltration / Detention Facility (Steps 3c, d, e)
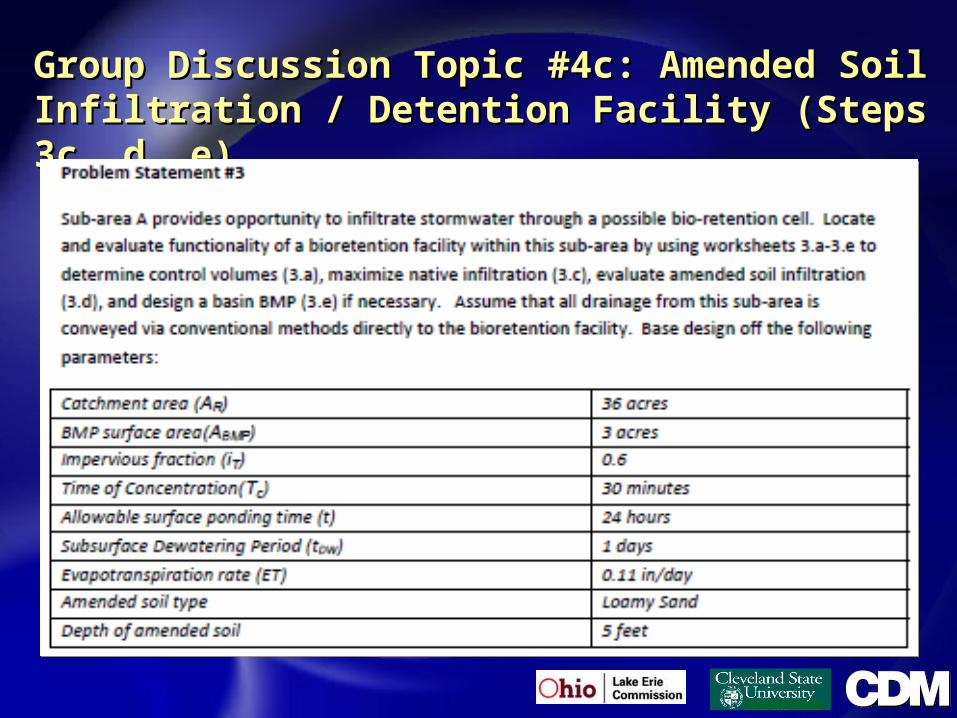
Group Discussion Topic #4c: Amended Soil Group Discussion Topic #4c: Amended Soil Infiltration / Detention Facility (Steps 3c, d, e)Infiltration / Detention Facility (Steps 3c, d, e)
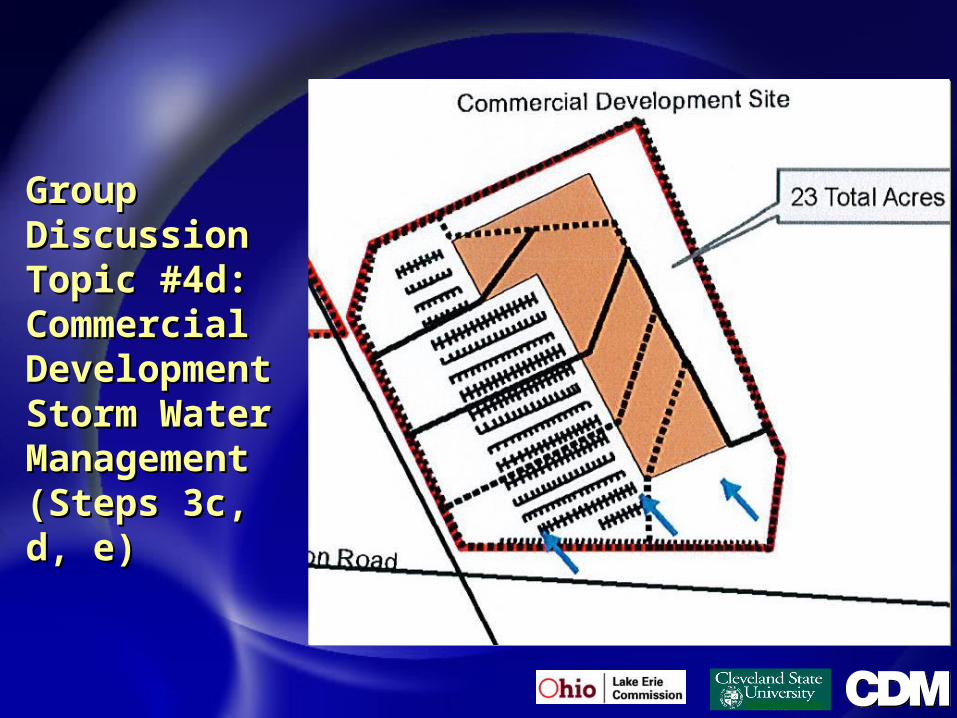
Group Group Discussion Discussion Topic #4d: Topic #4d: Commercial Commercial Development Development Storm Water Storm Water Management Management (Steps 3c, d, e)(Steps 3c, d, e)
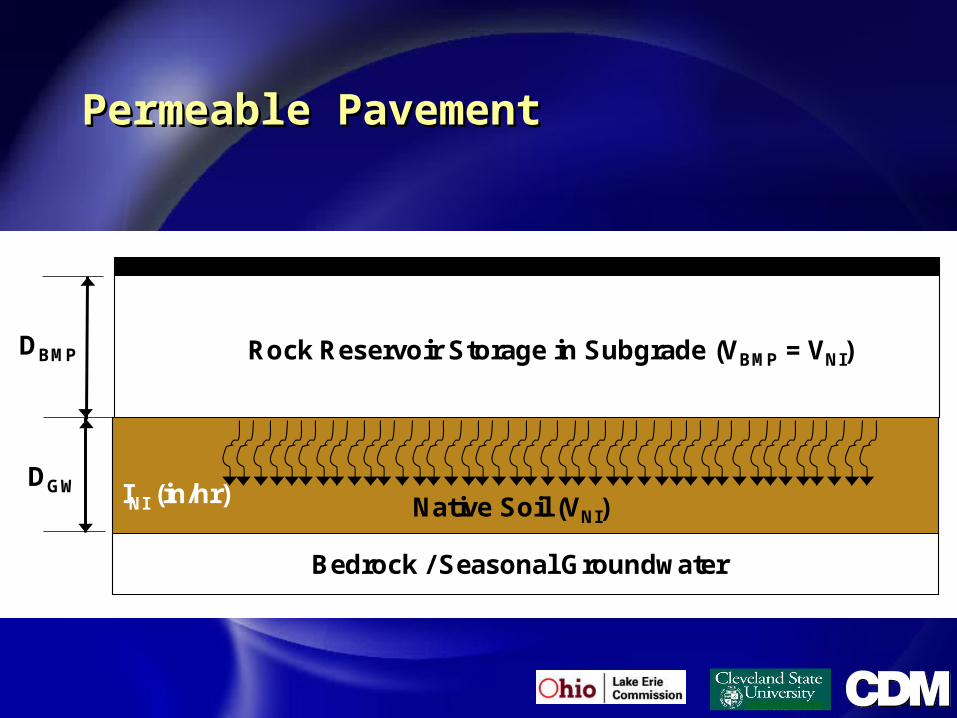
Permeable PavementPermeable PavementFigure 3. Native Soil Infiltrators
(b) Permeable Pavement
DBMP Rock Reservoir Storage in Subgrade (VBMP = VNI)
Native Soil (VNI)
Bedrock / Seasonal Groundwater
INI (in/hr)DGW

Permeable Pavement with Infiltration Permeable Pavement with Infiltration and Detentionand Detention
DRock-ED
DRock-NI
Rock Reservoir
Storage in Subgrade
(VBMP)
Native Soil (VNI)
Bedrock / Seasonal Groundwater
INI (in/hr)
Live (VED)
Infiltrate (VNI)
VE
DTo
Sew
er /.
Str
eam
:-R
estr
icte
d /
Det
ain
ed
DNIDGW
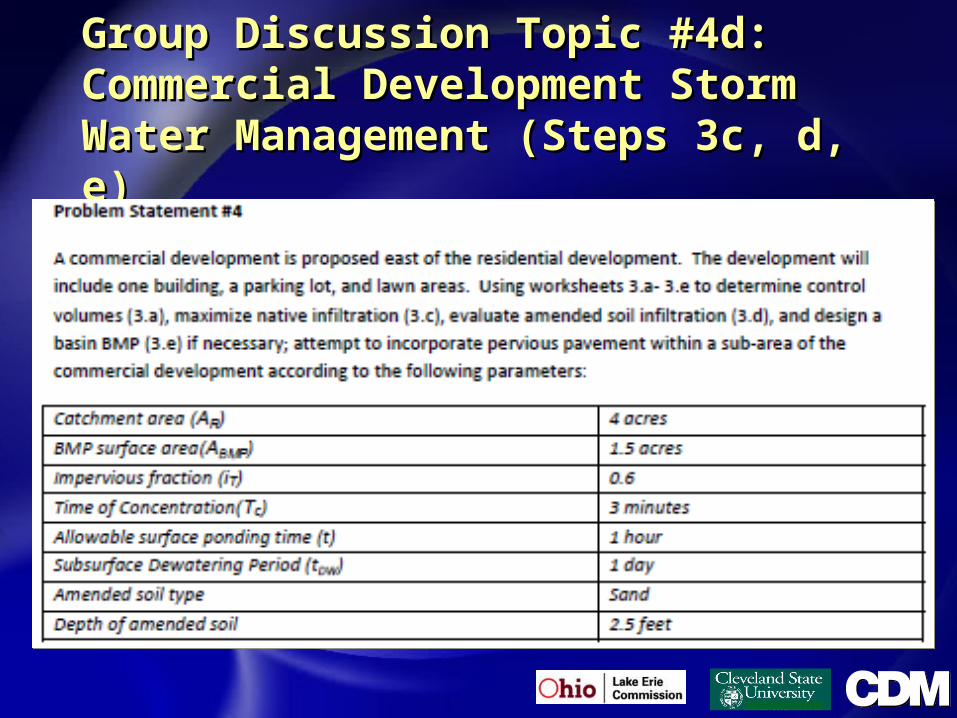
Group Discussion Topic #4d: Group Discussion Topic #4d: Commercial Development Storm Water Commercial Development Storm Water Management (Steps 3c, d, e)Management (Steps 3c, d, e)