Embed Size (px)
Citation preview

Revised 12/30/2020
STELLER SEA LION (Eumetopias jubatus): Western U.S. Stock
STOCK DEFINITION AND GEOGRAPHIC RANGE Steller sea lions range along
the North Pacific Rim from northern
Japan to California (Loughlin et al.
1984) (Fig. 1). Outside of the breeding
season (late May to July), large
numbers of individuals, especially
juveniles and males, disperse widely,
probably to access seasonally important
prey resources (Jemison et al. 2018).
This results in marked seasonal patterns
of abundance in some parts of the range
and potential for intermixing of animals
that were born in different regions
(Sease and York 2003; Baker et al.
2005; Jemison et al. 2013, 2018;
Hastings et al. 2019). During the
breeding season, sea lions, especially
adult females, typically return to their
natal rookery or a nearby breeding
rookery to breed and pup (Raum-
Suryan et al. 2002, Hastings et al.
2017).
Loughlin (1997) considered
the following information when
classifying stock structure based on the
phylogeographic approach of Dizon et al. (1992): 1) Distributional data: geographic distribution continuous, yet a
high degree of natal site fidelity and low (<10%) exchange rate of breeding animals among rookeries; 2) Population
response data: substantial differences in population dynamics (York et al. 1996); 3) Phenotypic data: differences in
pup mass (Merrick et al. 1995, Loughlin 1997); and 4) Genotypic data: substantial differences in mitochondrial
DNA (Bickham et al. 1996). Based on this information, two distinct population segments (DPSs) of Steller sea lions
were recognized in the U.S.: the Eastern DPS, which includes animals born east of Cape Suckling, Alaska (144W),
and the Western DPS, which includes animals born at and west of Cape Suckling (Loughlin 1997; Fig. 1).
However, there is regular movement of Steller sea lions, especially juveniles and males outside the breeding season,
between the Western DPS (males and females equally) and the Eastern DPS (almost exclusively males) across the
DPS boundary (Jemison et al. 2013, 2018; Hastings et al. 2019). In this report, the Western DPS is equivalent to the
Western stock and the Eastern DPS is equivalent to the Eastern stock.
Mixing of mostly breeding females occurred between Prince William Sound and northern Southeast
Alaska, beginning in the 1990s (Gelatt et al. 2007; Jemison et al. 2013, 2018; O’Corry-Crowe et al. 2014; Rehberg
et al. 2018). In 1998 a single Steller sea lion pup was observed on Graves Rock just north of Cross Sound in
Southeast Alaska, and within 15 years (2013) pup counts increased to 551 (DeMaster 2014). Movements of animals
marked as pups in both stocks corroborate the extensive genetic research findings for a strong separation between
the two currently recognized stocks (Jemison et al. 2013, 2018). Mitochondrial and microsatellite analysis of pup
tissue samples collected at Graves Rock in 2002 revealed that approximately 70% of the pups had mtDNA
haplotypes that were consistent with those found in the Western stock (Gelatt et al. 2007). Similarly, a rookery to
the south on the White Sisters Islands, where pups were first noted in 1990, was also sampled in 2002 and
approximately 45% of those pups had Western stock haplotypes (O’Corry-Crowe et al. 2014). Hastings et al. (2019)
estimated that a minimum of 38% and 13% of animals in the North Outer Coast-Glacier Bay and Lynn Canal-
Frederick Sound regions in northern Southeast Alaska, respectively, carry genetic information unique to the Western
stock. Collectively, this information demonstrates that these two most recently established rookeries in northern
Southeast Alaska were partially to predominately established by Western stock females (Jemison et al. 2013, 2018;
O’Corry-Crowe et al. 2014; Rehberg et al. 2018; Hastings et al. 2019).
Figure 1. Generalized distribution (crosshatched area) of Steller sea
lions in the North Pacific and major U.S. haulouts and rookeries (50
CFR 226.202, 27 August 1993), as well as active Asian and Canadian
(British Columbia) haulouts and rookeries (points: Burkanov and
Loughlin 2005, Olesiuk 2008). A black dashed line (144°W) indicates
the stock boundary (Loughlin 1997) and a black line delineates the U.S.
Exclusive Economic Zone.
1
NOAA-TM-AFSC-421 M.M. Muto et al. 2021
Alaska Marine Mammal Stock Assessments 2020

O’Corry-Crowe et al. (2014) concluded that the results of their study of the genetic characteristics of pups
born on these new rookeries “demonstrates that resource limitation may trigger an exodus of breeding animals from
declining populations, with substantial impacts on distribution and patterns of genetic variation.” Jemison et al.
(2018) also found that movement of Prince William Sound females east to these rookeries was negatively correlated
with density: the population’s declines prior to the early 2000s likely spurred these animals to move east in search of
better foraging opportunities. This movement also revealed that this event is rare because colonists dispersed across
an evolutionary boundary, suggesting that the causative factors behind recent declines are unusual or of larger
magnitude than normally occur (O’Corry-Crowe et al. 2014). Thus, although recent colonization events in the
northern part of the Eastern stock indicate movement of Western sea lions (especially adult females) into this area,
the mixed part of the range remains geographically distinct (Jemison et al. 2013, 2018), and the discreteness
between the Eastern and Western stocks remains. Movement of Western stock sea lions south of these rookeries and
Eastern stock sea lions moving to the west is less common (Jemison et al. 2013, O’Corry-Crowe et al 2014).
Hybridization among subspecies and species along a contact zone such as a stock boundary is not
unexpected as the ability to interbreed is an ancestral condition, whereas reproductive isolation would be considered
a recently derived condition. As stated by NMFS and the U.S. Fish and Wildlife Service (USFWS) in a 1996
response to a previous comment regarding stock discreteness policy (61 FR 47222), “The Services do not consider it
appropriate to require absolute reproductive isolation as a prerequisite to recognizing a distinct population segment”
or stock. The fundamental concept overlying this distinctiveness is the collection of morphological, ecological,
behavioral, and genetic evidence for stock differences initially described by Bickham et al. (1996) and Loughlin
(1997) and supported by Baker et al. (2005), Harlin-Cognato et al. (2006), Hoffman et al. (2006, 2009), O’Corry-
Crowe et al. (2006), and Phillips et al. (2009, 2011).
Steller sea lions that breed in Asia are considered part of the Western stock in the 2008 Steller sea lion
Recovery Plan (NMFS 2008). Steller sea lions seasonally inhabit coastal waters of Japan in the winter and breeding
rookeries of Western stock animals outside of the U.S. are currently only located in Russia (Burkanov and Loughlin
2005). Analyses of genetic data differ in their interpretation of separation between Asian and Alaska sea lions.
Based on analysis of mitochondrial DNA, Baker et al. (2005) found evidence of a genetic split between the
Commander Islands (Russia) and Kamchatka that would include Commander Island sea lions within the Western
U.S. stock and animals west of there in an Asian stock. However, Hoffman et al. (2006) did not support an
Asian/Western stock split based on their analysis of nuclear microsatellite markers indicating high rates of male
gene flow. Berta and Churchill (2012) concluded that a putative Asian stock is “not substantiated by microsatellite
data since the Asian stock groups with the Western stock.” All genetic analyses (Baker et al. 2005; Harlin-Cognato
et al. 2006; Hoffman et al. 2006, 2009; O’Corry-Crowe et al. 2006) confirm a strong separation between Western
and Eastern stocks, and O’Corry-Crowe et al. (2006) identified structure at the level of different oceanic regions
within the Aleutian Islands. There may be sufficient morphological differentiation to support elevating the two
recognized stocks to subspecies (Phillips et al. 2009), although a review by Berta and Churchill (2012) characterized
the status of these subspecies assignments as “tentative” and requiring further attention before their status can be
determined. Work by Phillips et al. (2011) addressed the effect of climate change, in the form of glacial events, on
the evolution of Steller sea lions and reported that the effective population size at the time of the event determines
the impact of change on the population. The results suggested that during historic glacial periods, dispersal events
were correlated with historically low effective population sizes, whereas range fragmentation type events were
correlated with larger effective population sizes. This work again reinforced the stock delineation concept by noting
that ancient population subdivision likely led to the sequestering of most mtDNA haplotypes as stock or subspecies-
specific (Phillips et al. 2011).
POPULATION SIZE The Western stock of Steller sea lions decreased from 220,000 to 265,000 animals in the late 1970s to less
than 50,000 in 2000 (Loughlin et al. 1984, Loughlin and York 2000, Burkanov and Loughlin 2005). Since 2003, the
abundance of the Western stock has increased, but there has been considerable regional variation in trend (Sease and
Gudmundson 2002; Burkanov and Loughlin 2005; Fritz et al. 2013, 2016). Abundance surveys to count Steller sea
lions are conducted in late June through mid-July starting approximately 10 days after the mean pup birth dates in
the survey area (4-14 June) after approximately 95% of all pups are born (Pitcher et al. 2001, Kuhn et al. 2017).
Modeled counts and trends are reported for the total Western stock in Alaska and the six regions (eastern, central,
and western Gulf of Alaska and eastern, central, and western Aleutian Islands) that compose this geographic range.
The boundaries for the six regions were identified based on metapopulation analysis of survey count data collected
from 1976 to 1994 (York et al. 1996).
2
NOAA-TM-AFSC-421 M.M. Muto et al. 2021
Alaska Marine Mammal Stock Assessments 2020

NMFS uses raw counts collected during the period from 1978 through 2019 to model counts and annual
rates of change of non-pups and pups for regional aggregations using agTrend (Johnson and Fritz 2014). Using this
model produces two types of count estimates: predicted and realized counts. Predicted counts are used to estimate
trends and account for both observation and process errors. Realized counts use the standardized variance of raw
counts at each site throughout the time series to estimate survey counts we could expect to collect if we had
completely surveyed all sites. Therefore, the more complete the survey, the more similar raw counts are to realized
counts, which is evident by smaller confidence intervals. Modeled counts, like raw counts, do not account for
animals at sea; however, pup counts are considered a census of live pups as they are generally not in the water
during the survey period.
Demographic multipliers (e.g., pup production multiplied by 4.5) and corrections for proportions of each
age-sex class that are hauled out during the day in the breeding season (when aerial surveys are conducted) have
been proposed as methods to estimate total population size from pup and/or non-pup counts (Calkins and Pitcher
1982, Higgins et al. 1988, Milette and Trites 2003, Maniscalco et al. 2006). There are several factors which make
using demographic multipliers problematic when applied to counts of Western Steller sea lions in Alaska, including
the lack of vital (survival and reproductive) rate information for the western and central Aleutian Islands, the large
variability in abundance trends across the range (see Current Population Trend section below and Pitcher et al.
2007), and the large uncertainties related to reproductive status and foraging conditions that affect proportions
hauled out (see review in Holmes et al. 2007).
The most recent comprehensive aerial photographic and land-based surveys of Western Steller sea lions in
Alaska were conducted during the 2018 (Aleutian Islands west of Shumagin Islands) and 2019 (Southeast Alaska
and Gulf of Alaska east of Shumagin Islands) breeding seasons (Sweeney et al. 2018, 2019). The Western Steller
sea lion pup and non-pup model-predicted counts in Alaska in 2019 were 12,581 (95% credible interval of 11,308-
14,051) and 40,351 (35,886-44,884), respectively.
Methods used to survey Steller sea lions in Russia differ from those used in Alaska, with less use of aerial
photography and more use of skiff surveys and cliff counts for non-pups and ground counts for pups (Burkanov
2018a). Since 2015, the use of drones has allowed more survey effort to collect aerial imagery, similar to survey
methods used for the Alaska range (Burkanov 2018a). The most recent total count of live pups on rookeries in
Russia is available from counts conducted in 2016 and 2017, which totaled 5,629 pups, about 11% more than the
5,073 pups counted in 2013 and 2015 (Burkanov 2018b). Rookery pup counts represent more than 95% of pup
counts at all sites (including haulouts) but are underestimates of total pup production. Modeled counts and trends
are reported for non-pups only (there are not robust data available to model pup counts) for the six regions
(Commander Islands, east Kamchatka, Kuril Islands, northern part of Sea of Okhotsk, Sakhalin Island, and western
Bering Sea) that compose the geographic range in Russia (Fig. 2). In 2017, the non-pup count was modeled to be
13,691 (95% credible interval of 12,225-15,133) in Russia (Burkanov 2017, Johnson 2018).
Figure 2. Steller sea lion survey regions along the Asian coast
(Burkanov and Loughlin 2005).
3
NOAA-TM-AFSC-421 M.M. Muto et al. 2021
Alaska Marine Mammal Stock Assessments 2020

Minimum Population Estimate
The minimum population estimate (NMIN) can be defined by the 20th percentile of a log-normal distribution
based on a population abundance estimate for the stock (Wade 1994). Because current population size (N) and a
pup multiplier to estimate N are not known we cannot produce an abundance estimate. With agTrend we can
produce a sum of non-pup and pup modeled counts, which don’t account for non-pups at sea, or animals that are
born or die after the survey. Therefore, the summed count estimate is lower than an abundance estimate and we
should not use the 20th percentile of this number. We use the best estimate of the total count of Western Steller sea
lions in Alaska as the minimum population estimate (NMIN). The agTrend model (Johnson and Fritz 2014) was used
to estimate Western Steller sea lion pup and non-pup counts of 12,581 and 40,351, respectively, in Alaska in 2019
(Sweeney et al. 2019). These sum to 52,932, which will be used as the NMIN for the U.S. portion of the Western
stock of Steller sea lions (NMFS 2016).
Current Population Trend
The first reported trend counts (sums of counts at consistently surveyed, large sites used to examine
population trends) of Steller sea lions in Alaska were made in 1956-1960. Those counts indicated that there were at
least 140,000 (no correction factor applied) sea lions in the Gulf of Alaska and Aleutian Islands (Merrick et al.
1987). Subsequent surveys indicated a major population decrease, first detected in the eastern Aleutian Islands in
the mid-1970s (Braham et al. 1980). Counts from 1976 to 1979 totaled about 110,000 sea lions (no correction factor
applied). The decline appears to have spread eastward to Kodiak Island during the late 1970s and early 1980s, and
then westward to the central and western Aleutian Islands during the early and mid-1980s (Merrick et al. 1987, Byrd
1989). During the late 1980s, counts in Alaska overall declined at approximately 15% per year (NMFS 2008) which
prompted the listing (in 1990) of the species as threatened range-wide under the Endangered Species Act (ESA).
Continued declines in counts of Western Steller sea lions in Alaska in the 1990s (Sease et al. 2001) led NMFS to
change the ESA listing status to endangered in 1997 (NMFS 2008). Surveys in Alaska in 2002, however, were the
first to note an increase in counts, which suggested that the overall decline of Western Steller sea lions stopped in
the early 2000s (Sease and Gudmundson 2002).
Johnson and Fritz’s (2014) agTrend model estimated regional and overall trends in counts of pups and non-
pups in Alaska using data collected at all sites with at least two non-zero counts, rather than relying solely on counts
at “trend” sites (also see Fritz et al. 2013, 2016). Using agTrend, modeled count data from 1978 to 2019 were used
to produce trends for the total Western DPS in Alaska, east of Samalga Pass, and the central, western, and eastern
Gulf of Alaska regions.
Model results indicated that pup and non-pup counts of Western stock Steller sea lions in Alaska were at
their lowest levels in 2002 and have increased at 1.63% y-1 and 1.82% y-1, respectively, between 2002 and 2019
(Table 1; Fig. 3; Sweeney et al. 2019). However, there are strong regional differences across the range in Alaska,
with positive trends in the Gulf of Alaska and the eastern Aleutian Islands region, including eastern Bering Sea (east
of Samalga Pass, ~170°W), and generally negative trends to the west of Samalga Pass, in the central and western
Aleutian Islands (Table 1; Figs. 4 and 5).
4
NOAA-TM-AFSC-421 M.M. Muto et al. 2021
Alaska Marine Mammal Stock Assessments 2020

Table 1. Trends (annual rates of change expressed as % y-1 with 95% credible interval) in counts of Western Steller
sea lion pups and non-pups (adults and juveniles) in Alaska, by regional areas. The rates reported for the Western
DPS in Alaska; east of Samalga Pass; and eastern, central, and western Gulf of Alaska were calculated for the period
from 2002 to 2019 (Sweeney et al. 2019). The rates reported for west of Samalga Pass and eastern, central, and
western Aleutian Islands were calculated for the period from 2002 (when the Western DPS as a whole began to
rebound) to 2018 (Sweeney et al. 2018).
Region Latitude
Range
Pups
Non-pups
Trend -95% +95% Trend -95% +95%
Western DPS in Alaska 144°W-172°E 1.63 1.12 2.16 1.82 1.29 2.38
East of Samalga Pass 144°-170°W 2.90 2.37 3.53 2.71 2.05 3.35
Eastern Gulf of Alaska 144°-150°W 2.68 1.08 4.36 3.32 1.42 5.24
Central Gulf of Alaska 150°-158°W 3.08 1.76 4.35 3.40 2.53 4.32
Western Gulf of Alaska 158°-163°W 3.37 2.25 4.52 2.77 1.47 4.01
Eastern Aleutian Islands 163°-170°W 2.54 1.67 3.46 1.76 0.50 3.07
West of Samalga Pass 170°W-172°E -2.08 -3.13 -0.79 -1.22 -2.20 -0.25
Central Aleutian Islands 170°W-177°E -1.60 -2.75 -0.21 -0.53 -1.64 0.50
Western Aleutian Islands 172°-177°E -6.47 -7.42 -5.57 -6.47 -7.81 -5.21
Figure 3. Realized and predicted counts of Western Steller sea lion pups (left) and non-pups
(right) in Alaska, from 1978 to 2019. Realized counts are represented by points and vertical
lines (95% credible intervals). Predicted counts are represented by the black line surrounded
by the gray 95% credible interval.
5
NOAA-TM-AFSC-421 M.M. Muto et al. 2021
Alaska Marine Mammal Stock Assessments 2020

In 2019, Western DPS survey effort was focused in the Gulf of Alaska (Sweeney et al. 2019). Between
2015 and 2017, pup counts declined in the eastern (-33%) and central (-18%) Gulf of Alaska, counter to the
continuous increases observed in both regions since 2002 (Sweeney et al. 2017). These declines may have been due
to changes in availability of prey associated with warm ocean temperatures that occurred in the northern Gulf of
Alaska from 2014 to 2016 (Bond et al. 2015, Peterson et al. 2016, von Biela et al. 2019, Yang et al. 2019). There
was also a movement of approximately 1,000 non-pups from the eastern to the central Gulf of Alaska regions,
although the combined non-pup count in these two regions remained relatively stable between 2015 and 2017
(western Gulf of Alaska did not appear to change; Sweeney et al. 2017). In 2019, pup counts rebounded to 2015
levels; however, there was a decline in non-pup counts in the eastern, central, and western Gulf of Alaska regions
(Sweeney et al. 2019).
No new data were collected for the Aleutian Islands in the 2019 survey, but the 2020 survey effort will be
focused in this area. In 2018, survey effort was focused in the Aleutian Islands with some opportunistic surveys in
the Gulf of Alaska (Sweeney et al. 2018). The area west of Samalga Pass was significantly declining, especially in
the western Aleutian Islands region. The eastern Aleutian Islands region pups and non-pups have showed signs of
recovery and have been increasing since the early 2000s.
Since part of the Western stock began to recover in the early 2000s, net movement between the Eastern and
Western stocks appears to be small during the breeding season (Jemison et al. 2018). For example, there was an
estimated net 75 sea lions that moved from east to west in 2016 (Jemison et al. 2013, Fritz et al. 2016). Very few
females moved from Southeast Alaska to the Western stock, while approximately 500 were estimated to move from
west to east (net increase in the east). Males moved in both directions, but with a net increase in the west. As a
result, trends in counts estimated from breeding season surveys should be relatively insensitive, at a stock level, to
inter-stock movements.
Burkanov and Loughlin (2005) estimated the Russian Steller sea lion population (pups and non-pups)
declined approximately 52% from the 1970s to the 1990s. Johnson (2018) estimated the non-pup count in Russia
Figure 4. Regions of Alaska used for Western Steller sea lion population trend estimation.
E GULF, C GULF, and W GULF are eastern, central, and western Gulf of Alaska regions,
respectively. E ALEU, C ALEU, and W ALEU are eastern, central, and western Aleutian
Islands regions, respectively (AFSC-MML-Alaska Ecosystems Program 2016).
6
NOAA-TM-AFSC-421 M.M. Muto et al. 2021
Alaska Marine Mammal Stock Assessments 2020

declined 1.3% y-1 between 2002 and 2017; however, just as in the U.S. portion of the Western stock, there were
significant regional differences in population trend in Russia (Table 2; Fig. 6; Burkanov 2018a, Johnson 2018). The
significant decline in non-pup counts appears to be primarily driven by the decline in the Kurils which, traditionally,
represents the largest area in terms of non-pup counts (Burkanov 2018a, Johnson 2018). Moreover, it seems the
statistically significant decline in the Kurils is the result of the 2015 survey, where there appeared to be a large
reduction in comparison to previous years (Fig. 6; Johnson 2018). Pup production appeared to decline in most areas
where breeding occurs in Russia (Kuril Islands, eastern Kamchatka, the Commander Islands, and parts of the Sea of
Okhotsk-Iony rookery); only Tuleny Island (Sakhalin region) and part of the Sea of Okhotsk (Yamsky Islands
rookery) had increasing pup counts between 2006 and 2017 (Burkanov 2018a, 2018b).
Table 2. Trends (annual rates of change expressed as % y-1 with 95% credible interval) in non-pup counts for the
Asian stock (Russia) of Steller sea lions and by region, from 2002 to 2017 (Johnson 2018). See Figure 2 for regions.
Region Trend -95% +95%
Asian stock (Russia) -1.3 -2.6 -0.1
Commander Islands -0.6 -2.6 1.2
Kamchatka -0.8 -3.0 1.5
Kuril -4.1 -5.4 -2.8
Northern Sea of Okhotsk 0.9 -2.0 4.0
Sakhalin 0.9 -2.3 5.4
Western Bering Sea -1.1 -16.1 10.2
7
NOAA-TM-AFSC-421 M.M. Muto et al. 2021
Alaska Marine Mammal Stock Assessments 2020
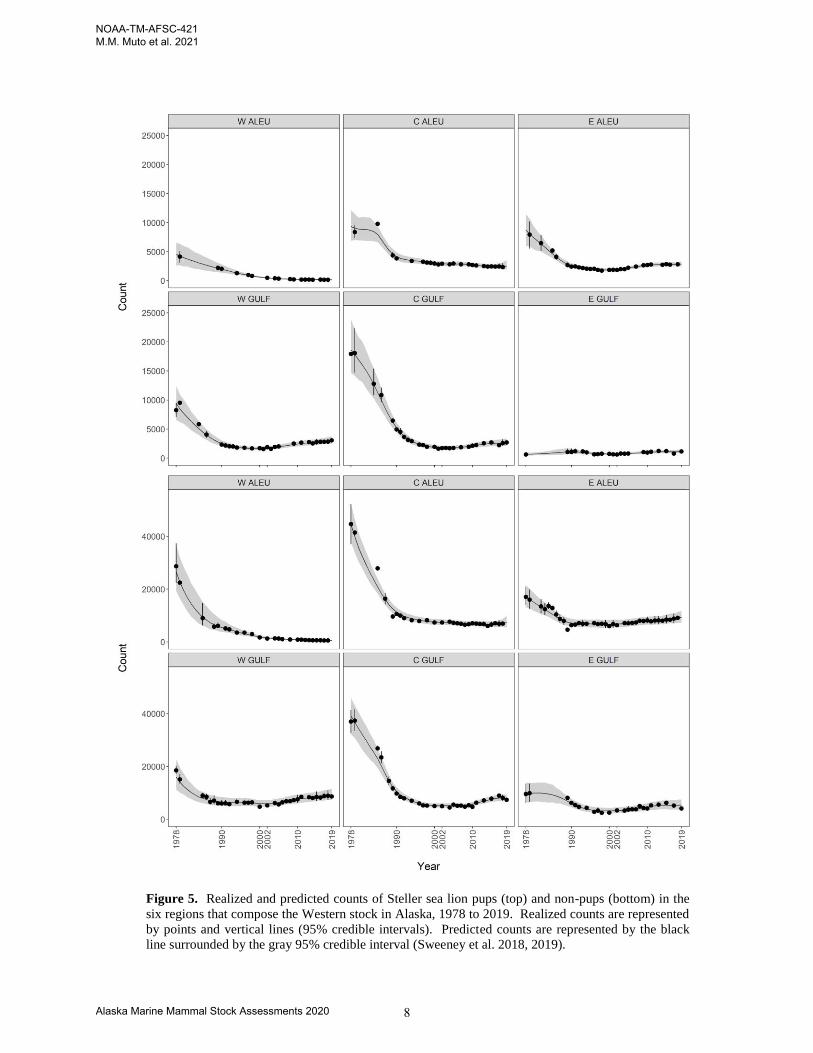
Figure 5. Realized and predicted counts of Steller sea lion pups (top) and non-pups (bottom) in the
six regions that compose the Western stock in Alaska, 1978 to 2019. Realized counts are represented
by points and vertical lines (95% credible intervals). Predicted counts are represented by the black
line surrounded by the gray 95% credible interval (Sweeney et al. 2018, 2019).
8
NOAA-TM-AFSC-421 M.M. Muto et al. 2021
Alaska Marine Mammal Stock Assessments 2020

CURRENT AND MAXIMUM NET PRODUCTIVITY RATES There are no estimates of the maximum net productivity rate (RMAX) for Steller sea lions. Until additional
data become available, the default pinniped maximum theoretical net productivity rate of 12% will be used for this
stock (NMFS 2016).
POTENTIAL BIOLOGICAL REMOVAL Potential biological removal (PBR) is defined as the product of the minimum population estimate, one-half
the maximum theoretical net productivity rate, and a recovery factor: PBR = NMIN × 0.5RMAX × FR. The recovery
factor (FR) for this stock is 0.1, the default value for stocks listed as endangered under the ESA (NMFS 2016).
Thus, for the U.S. portion of the Western stock of Steller sea lions, PBR is 318 sea lions (52,932 × 0.06 × 0.1).
ANNUAL HUMAN-CAUSED MORTALITY AND SERIOUS INJURY Information for each human-caused mortality, serious injury, and non-serious injury reported for NMFS-
managed Alaska marine mammals between 2014 and 2018 is listed, by marine mammal stock, in Young et al.
(2020); however, only the mortality and serious injury data are included in the Stock Assessment Reports. The
minimum estimated mean annual level of human-caused mortality and serious injury for Western U.S. Steller sea
lions between 2014 and 2018 is 254 sea lions: 37 in U.S. commercial fisheries, 0.8 in unknown (commercial,
recreational, or subsistence) fisheries, 3.6 in marine debris, 3.6 due to other causes (illegal shooting, mortality
incidental to Marine Mammal Protection Act (MMPA)-authorized research), and 209 in the Alaska Native
subsistence harvest. No observers have been assigned to several fisheries that are known to interact with this stock
and estimates of entanglement in fishing gear and marine debris based solely on stranding reports in areas west of
144°W longitude may underestimate the entanglement of Western stock animals that travel to parts of Southeast
Alaska. Due to a lack of available resources, NMFS is not operating the Alaska Marine Mammal Observer Program
(AMMOP) focused on marine mammal interactions that occur in fisheries managed by the State of Alaska. The
most recent data on Steller sea lion interactions with state-managed fisheries in Alaska are from the Southeast
Alaska salmon drift gillnet fishery in 2012 and 2013 (Manly 2015), a fishery in which the majority of the Steller sea
lions taken are likely to be from the Eastern stock, although sea lions carrying Western genetic material could be as
high as 38% (Hastings et al. 2019). Counts of annual illegal gunshot mortality in the Copper River Delta should be
considered minimums as they are based solely on aerial carcass surveys from 2015 to 2018, no data are available for
2014, a cause of death for all carcasses found was not determined, and it is not likely that all carcasses are detected.
Disturbance of Steller sea lion haulouts and rookeries can potentially cause disruption of reproduction, stampeding,
or increased exposure to predation by marine predators (NMFS 2008; see also NMFS 1990, 1997). Effects of
Figure 6. Realized and predicted counts of Russian Steller sea lion non-pups in Russia (left) and by
region (right; Fig. 2), 2002 to 2017. Realized counts are represented by points and vertical lines (95%
credible intervals). Predicted counts are represented by the black line surrounded by the gray 95%
credible interval. The blue line represents the trend based on constant average growth for the entire
Asian stock as a whole.
9
NOAA-TM-AFSC-421 M.M. Muto et al. 2021
Alaska Marine Mammal Stock Assessments 2020

disturbance are highly variable and difficult to predict. Data are not available to estimate potential impacts from
non-monitored activities, including disturbance near rookeries without 3-nmi no-entry buffer zones. Potential
threats most likely to result in direct human-caused mortality or serious injury of this stock include subsistence
harvest, incidental take, illegal shooting, disturbance at rookeries that could cause stampedes, and entanglement in
fishing gear and marine debris.
Fisheries Information Information for federally-managed and state-managed U.S. commercial fisheries in Alaska waters is
available in Appendix 3 of the Alaska Stock Assessment Reports (observer coverage) and in the NMFS List of
Fisheries (LOF) and the fact sheets linked to fishery names in the LOF (observer coverage and reported incidental
takes of marine mammals: https://www.fisheries.noaa.gov/national/marine-mammal-protection/marine-mammal-
protection-act-list-fisheries, accessed December 2020).
Based on historical reports and their geographic range, Steller sea lion mortality and serious injury could
occur in several fishing gear types, including trawl, gillnet, longline, and troll fisheries. However, observer data are
limited. Of these fisheries, only trawl fisheries are regularly observed and gillnet fisheries have had limited
observations in select areas over short time frames and with modest observer coverage. Consequently, there are
little to no data on Steller sea lion mortality and serious injury in non-trawl fisheries. Therefore, the potential for
fisheries-caused mortality and serious injury may be greater than is reflected in existing observer data.
Between 2014 and 2018, mortality and serious injury of Western Steller sea lions was observed in 10 of the
federally-managed commercial fisheries in Alaska that are monitored for incidental mortality and serious injury by
fisheries observers: Bering Sea/Aleutian Islands Atka mackerel trawl, Bering Sea/Aleutian Islands flatfish trawl,
Bering Sea/Aleutian Islands Pacific cod trawl, Bering Sea/Aleutian Islands pollock trawl, Bering Sea/Aleutian
Islands Pacific cod longline, Gulf of Alaska Pacific cod trawl, Gulf of Alaska Pacific cod longline, Gulf of Alaska
flatfish trawl, Gulf of Alaska rockfish trawl, and Gulf of Alaska pollock trawl fisheries, resulting in a mean annual
mortality and serious injury rate of 22 sea lions (Table 3; Breiwick 2013; MML, unpubl. data).
AMMOP observers monitored the Alaska State-managed Prince William Sound salmon drift gillnet fishery
in 1990 and 1991, recording two incidental mortalities in 1991, extrapolated to 29 (95% CI: 1-108) for the entire
fishery (Wynne et al. 1992; Table 3). No incidental mortality or serious injury was observed during 1990 for this
fishery (Wynne et al. 1991), resulting in a mean annual mortality rate of 15 sea lions for 1990 and 1991. It is not
known whether this incidental mortality and serious injury rate is representative of the current rate in this fishery.
Between 2014 and 2018, Steller sea lion mortality resulting from entanglements in commercial longline
gear (1 in 2015) and commercial salmon seine net (1 in 2018) was reported to the NMFS Alaska Region marine
mammal stranding network (Young et al. 2020), resulting in a mean annual mortality and serious injury rate of 0.4
sea lions in commercial gear (Table 4). This mortality and serious injury estimate results from an actual count of
verified human-caused deaths and serious injuries and is a minimum because not all entangled animals strand nor
are all stranded animals found, reported, or have the cause of death determined.
The minimum estimated mean annual mortality and serious injury rate in U.S. commercial fisheries
between 2014 and 2018 is 37 Steller sea lions from this stock (37 from observer data + 0.4 from stranding data)
(Tables 3 and 4). No observers have been assigned to several fisheries that are known to interact with this stock,
thus, the estimated mortality and serious injury is likely an underestimate of the actual level.
10
NOAA-TM-AFSC-421 M.M. Muto et al. 2021
Alaska Marine Mammal Stock Assessments 2020

Table 3. Summary of incidental mortality and serious injury of Western U.S. Steller sea lions due to U.S.
commercial fisheries between 2014 and 2018 (or the most recent data available) and calculation of the mean annual
mortality and serious injury rate (Wynne et al. 1991, 1992; Breiwick 2013; MML, unpubl. data). N/A indicates that
data are not available. Methods for calculating percent observer coverage are described in Appendix 3 of the Alaska
Stock Assessment Reports.
Fishery name Years Data
type
Percent
observer
coverage
Observed
mortality
Estimated
mortality
(CV)
Mean estimated
annual mortality
Bering Sea/Aleutian Is.
Atka mackerel trawl
2014
2015
2016
2017
2018
obs
data
100
100
98
100
100
0
0
0
1
5
0
0
0
1 (0.06)
5.1 (0.08)
1.2
(CV = 0.07)
Bering Sea/Aleutian Is.
flatfish trawl
2014
2015
2016
2017
2018
obs
data
100
100
99
100
100
5
6
9
13
8
5.0 (0.02)
6.0 (0.02)
9.0 (0.02)
13 (0.01)
8.0 (0.02)
8.2
(CV = 0.01)
Bering Sea/Aleutian Is.
Pacific cod trawl
2014
2015
2016
2017
2018
obs
data
80
72
68
68
73
0
0
0
1
1
0
0
0
1 (0)
1 (0)
0.4
(CV = 0)
Bering Sea/Aleutian Is.
pollock trawl
2014
2015
2016
2017
2018
obs
data
98
99
99
99
99
2
1
13
6
6
2.0 (0.1)
1 (0.07)
13 (0.03)
6.1 (0.05)
6.1 (0.04)
5.7
(CV = 0.02)
Bering Sea/Aleutian Is.
pollock trawl 2017
obs
data 99 1a N/A
0.2
(CV = N/A)
Bering Sea/Aleutian Is.
Pacific cod longline
2014
2015
2016
2017
2018
obs
data
64
62
57
58
55
1
3
0
1
0
1.7 (0.63)
4.9 (0.36)
0
1.6 (0.6)
0
1.6
(CV = 0.28)
Gulf of Alaska Pacific cod
longline
2014
2015
2016
2017
2018
obs
data
31
36
30
40
29
0
1
0
0
0
0
1.3 (0.5)
0
0
0
0.3
(CV = 0.5)
Gulf of Alaska Pacific cod
trawl
2014
2015
2016
2017
2018
obs
data
12
13
13
11
25
0
0
1
0
0
0
0
10 (0.9)
0
0
2.0
(CV = 0.9)
Gulf of Alaska flatfish
trawl
2014
2015
2016
2017
2018
obs
data
47
54
39
56
34
0
0 (+1)b
0
0
0
0
0 (+1)c
0
0
0
0 (+0.2)d
(CV = N/A)
11
NOAA-TM-AFSC-421 M.M. Muto et al. 2021
Alaska Marine Mammal Stock Assessments 2020

Fishery name Years Data
type
Percent
observer
coverage
Observed
mortality
Estimated
mortality
(CV)
Mean estimated
annual mortality
Gulf of Alaska rockfish
trawl
2014
2015
2016
2017
2018
obs
data
96
93
98
98
95
0
0 (+1)b
0
0
0
0
0 (+1)c
0
0
0
0 (+0.2)d
(CV = N/A)
Gulf of Alaska pollock
trawl
2014
2015
2016
2017
2018
obs
data
14
23
27
19
21
0
0 (+5)e
1
0
0
0
0 (+5)f
4.8 (0.89)
0
0
1.0 (+1)g
(CV = 0.89)
Prince William Sound
salmon drift gillnet
1990
1991
obs
data
4
5
0
2
0
29
15
(CV = 1.0)
Minimum total estimated annual mortality 37
(CV = 0.43) aThis animal was discovered during a vessel offload. Because it could not be associated with a haul number, it was not included in the bycatch
estimate for the fishery. bTotal mortality and serious injury observed in 2015: 0 sea lions in sampled hauls + 1 sea lion in an unsampled haul. cTotal estimate of mortality and serious injury in 2015: 0 sea lions (extrapolated estimate from 0 sea lions observed in sampled hauls) + 1 sea lion
(1 sea lion observed in an unsampled haul). dMean annual mortality and serious injury for fishery: 0 sea lions (mean of extrapolated estimates from sampled hauls) + 0.2 sea lions (mean of number observed in unsampled hauls). eTotal mortality and serious injury observed in 2015: 0 sea lions in sampled hauls + 5 sea lions in unsampled hauls. fTotal estimate of mortality and serious injury in 2015: 0 sea lions (extrapolated estimate from 0 sea lions observed in sampled hauls) + 5 sea
lions (5 sea lions observed in unsampled hauls). gMean annual mortality and serious injury for fishery: 1.0 sea lion (mean of extrapolated estimates from sampled hauls) + 1 sea lion (mean of number observed in unsampled hauls).
Reports to the NMFS Alaska Region marine mammal stranding network of Steller sea lions entangled in
fishing gear or with injuries caused by interactions with gear are another source of mortality and serious injury data
(Table 4; Young et al. 2020). From 2014 to 2018, there were three reports of Steller sea lion interactions with
salmon hook and line gear, in which an animal in poor body condition had a flasher lure hanging from its mouth and
was believed to have ingested the hook, and one report of an animal that was entangled in unidentified hook and line
gear, resulting in a mean annual mortality and serious injury rate of 0.8 sea lions in these unknown (commercial,
recreational, or subsistence) fisheries (Table 4). This mortality and serious injury estimate results from an actual
count of verified human-caused deaths and serious injuries and is a minimum because not all entangled animals
strand nor are all stranded animals found, reported, or have the cause of death determined. Additionally, since
Steller sea lions from parts of the Western stock are known to regularly occur in parts of Southeast Alaska (Jemison
et al. 2013, 2018; NMFS 2013), and higher rates of entanglement of Steller sea lions have been observed in this area
(e.g., Raum-Suryan et al. 2009), estimates based solely on stranding reports in areas west of 144°W longitude may
underestimate the total entanglement of Western stock sea lions in fishery-related gear and marine debris.
12
NOAA-TM-AFSC-421 M.M. Muto et al. 2021
Alaska Marine Mammal Stock Assessments 2020

Table 4. Summary of Western U.S. Steller sea lion mortality and serious injury, by year and type, reported to the
NMFS Alaska Region marine mammal stranding network and Alaska Department of Fish and Game between 2014
and 2018 (Young et al. 2020). N/A indicates that data are not available.
Cause of injury 2014 2015 2016 2017 2018
Mean
annual
mortality
Entangled in commercial Kodiak salmon
seine net 0 0 0 0 1 0.2
Entangled in commercial longline gear 0 1 0 0 0 0.2
Hooked by salmon hook and line gear* 1 0 0 1 1 0.6
Entangled in unknown hook and line gear* 1 0 0 0 0 0.2
Entangled in marine debris 3 6 1 3 5 3.6
Illegally shot N/A 8 1 0 0 3a
Incidental to MMPA-authorized research 0 1 2 0 0 0.6
Total in commercial fisheries
*Total in unknown (commercial, recreational, or subsistence) fisheries
Total in marine debris
Total due to other causes (illegally shot, incidental to MMPA-authorized research)
0.4
0.8
3.6
3.6 aDedicated effort to survey the Copper River Delta for stranded marine mammals began in 2015 in response to a high number of reported strandings, some of which were later determined to be human-caused (illegally shot). Dedicated surveys were also conducted in 2016, 2017, and
2018. Because similar data are not available for 2014 and survey effort was limited in 2018, the data were averaged over 3 years of survey effort (2015-2017) for a more informed estimate of mean annual mortality.
The minimum mean annual mortality and serious injury rate for all fisheries between 2014 and 2018, based
on observer data and stranding data for U.S. commercial fisheries (37 sea lions) and on stranding data for unknown
(commercial, recreational, or subsistence) fisheries (0.8 sea lions), is 38 Western Steller sea lions.
Alaska Native Subsistence/Harvest Information
NMFS signed agreements with the Tribal Government of St. Paul Island (2000) and the Traditional Council
of St. George Island (2001) to co-manage Steller sea lions and northern fur seals. NMFS also signed an agreement
with the Aleut Marine Mammal Commission (2006) for the conservation and management of all marine mammal
subsistence species, with particular focus on Steller sea lions and harbor seals. These co-management agreements
promote full and equal participation by Alaska Natives in decisions affecting the subsistence management of Steller
sea lions (to the maximum extent allowed by law) as a tool for conserving Steller sea lion populations in Alaska
(https://www.fisheries.noaa.gov/alaska/marine-mammal-protection/co-management-marine-mammals-alaska,
accessed December 2020).
Information on the subsistence harvest of Steller sea lions comes via three sources: the Alaska Department
of Fish and Game (ADF&G), the Ecosystem Conservation Office of the Aleut Community of St. Paul Island, and
the Kayumixtax Eco-Office of the Aleut Community of St. George Island. The ADF&G conducted systematic
interviews with hunters and users of marine mammals in approximately 2,100 households in about 60 coastal
communities within the geographic range of the Steller sea lion in Alaska (Wolfe et al. 2005, 2006, 2008, 2009a,
2009b). The interviews were conducted once per year in the winter (January to March) and covered hunter activities
for the previous calendar year. As of 2009, annual statewide data on community subsistence harvests are no longer
being consistently collected. Data are being collected periodically in subareas. Data were collected on the Alaska
Native harvest of Western U.S. Steller sea lions for 7 communities on Kodiak Island in 2011 and for 15
communities in Southcentral Alaska in 2014. The Alaska Native Harbor Seal Commission (ANHSC) and ADF&G
estimated a total of 20 adult sea lions were harvested on Kodiak Island in 2011, with a 95% confidence range
between 15 and 28 animals (Wolfe et al. 2012), and 7.9 sea lions (CI = 6-15.3) were harvested in Southcentral
Alaska in 2014, with adults comprising 84% of the harvest (ANHSC 2015). These estimates do not represent a
comprehensive statewide estimate; therefore, the best available statewide subsistence harvest estimates for a 5-year
period are those from 2004 to 2008. Thus, the most recent 5 years of data available from the ADF&G (2004-2008)
will be used for calculating an annual mortality and serious injury estimate for all areas except St. Paul, St. George,
and Atka Islands (Wolfe et al. 2005, 2006, 2008, 2009a, 2009b; NMFS, unpubl. data) (Table 5). Harvest data are
13
NOAA-TM-AFSC-421 M.M. Muto et al. 2021
Alaska Marine Mammal Stock Assessments 2020

collected in near real-time on St. Paul Island (e.g., Melovidov 2013) and St. George Island (e.g., Kashevarof 2015)
and recorded within 36 hours of the harvest. The most recent 5 years of data from St. Paul (Melovidov 2013, 2014,
2015, 2016; NMFS, unpubl. data) and St. George (Kashevarof 2015; NMFS, unpubl. data) are for 2014 to 2018
(Table 5).
The mean annual subsistence harvest from this stock for all areas except St. Paul, St. George, and Atka
Island between 2004 and 2008 (172) combined with the mean annual harvest for St. Paul (30), St. George (1.4), and
Atka (6) Islands between 2014 and 2018 is 209 Western Steller sea lions (Table 5).
Table 5. Summary of the subsistence harvest data for Western U.S. Steller sea lions. As of 2009, data on
community subsistence harvests are no longer being consistently collected. Therefore, the most recent 5 years of
data (2004 to 2008) will be used for calculating an annual mortality and serious injury estimate for all areas except
St. Paul, St. George, and Atka Islands. Data from St. Paul, St. George, and Atka Islands are still being collected and
the most recent 5 years of data available (2014 to 2018) will be used. N/A indicates that data are not available.
All areas except St. Paul Island St. Paul Island St. George
Island
Atka
Island
Year Number
harvested
Number
struck
and lost
Total
Number
harvested
+ Number
struck and lost
Number
harvested +
Number struck
and lost
Number
harvested +
Number
struck and
lost
2004 136.8 49.1 185.9a
2005 153.2 27.6 180.8b
2006 114.3 33.1 147.4c
2007 165.7 45.2 210.9d
2008 114.7 21.6 136.3e
2014 N/A N/A N/A 35h 1g N/A
2015 N/A N/A N/A 24i 3g N/A
2016 N/A N/A N/A 31j 2j N/A
2017 N/A N/A N/A 30j 0j N/A
2018 N/A N/A N/A 28j 1j 6
Mean
annual
harvest
137 35 172 30 1.4 6
aWolfe et al. (2005); bWolfe et al. (2006); cWolfe et al. (2008); dWolfe et al. (2009a); eWolfe et al. (2009b); hMelovidov (2015); iMelovidov
(2016); jNMFS, unpubl. data.
Other Mortality Reports to the NMFS Alaska Region marine mammal stranding network of Steller sea lions entangled in
marine debris or with injuries caused by other types of human interaction are another source of mortality and serious
injury data. These mortality and serious injury estimates result from an actual count of verified human-caused
deaths and serious injuries and are minimums because not all entangled animals strand nor are all stranded animals
found, reported, or have the cause of death determined. Between 2014 and 2018, reports to the stranding network
resulted in mean annual mortality and serious injury rates of three Steller sea lions illegally shot in the Copper River
Delta (3-year average) and 3.6 observed entangled in marine debris (Table 4; Young et al. 2020). Additional reports
of Steller sea lion mortality due to gunshot wounds are not included in the estimate of the mean annual mortality and
serious injury rate for 2014 to 2018 because it could not be confirmed that the animals were illegally shot rather than
struck and lost in the Alaska Native subsistence harvest.
Mortality and serious injury may occasionally occur incidental to marine mammal research activities
authorized under MMPA permits issued to a variety of government, academic, and other research organizations.
Between 2014 and 2018, there were three reports (one in 2015 and two in 2016) of mortality incidental to research
on the Western U.S. stock of Steller sea lions (Table 4; Young et al. 2020), resulting in a mean annual mortality and
serious injury rate of 0.6 sea lions from this stock.
14
NOAA-TM-AFSC-421 M.M. Muto et al. 2021
Alaska Marine Mammal Stock Assessments 2020

STATUS OF STOCK The minimum estimated mean annual U.S. commercial fishery-related mortality and serious injury rate (37
sea lions) is more than 10% of the PBR (10% of PBR = 32) and, therefore, cannot be considered insignificant and
approaching a zero mortality and serious injury rate. Based on available data, the minimum estimated mean annual
level of human-caused mortality and serious injury (254 sea lions) is below the PBR level (318) for this stock. The
Western U.S. stock of Steller sea lions is currently listed as endangered under the ESA and, therefore, designated as
depleted under the MMPA. As a result, the stock is classified as a strategic stock. The population previously
declined for unknown reasons that are not explained by the documented level of direct human-caused mortality and
serious injury.
There are key uncertainties in the assessment of the Western U.S. stock of Steller sea lions. Some genetic
studies support the separation of Steller sea lions in western Alaska from those in Russia; population numbers in this
assessment are only from the U.S. to be consistent with the geographic range of information on mortality and serious
injury. We provide data for the Russian population for context for the entire Western DPS. There is some overlap
in range between animals in the Western and Eastern stocks in northern Southeast Alaska. The population
abundance is based on counts of visible animals; the calculated NMIN and PBR levels are conservative because there
are no data available to correct for animals not visible during the visual surveys. There are multiple nearshore
commercial fisheries that are not observed; thus, there is likely to be unreported fishery-related mortality and serious
injury of Steller sea lions. Estimates of human-caused mortality and serious injury from stranding data are
underestimates because not all animals strand nor are all stranded animals found, reported, or have the cause of
death determined. Several factors may have been important drivers of the decline of the stock. However, there is
uncertainty about threats currently impeding their recovery, particularly in the Aleutian Islands.
HABITAT CONCERNS Many factors have been suggested as causes of the steep decline in abundance of Western Steller sea lions
observed in the 1980s, including competitive effects of fishing, environmental change, disease, contaminants, killer
whale predation, incidental take, and illegal and legal shooting (Atkinson et al. 2008, NMFS 2008). A number of
management actions have been implemented since 1990 to promote the recovery of the Western U.S. stock of Steller
sea lions, including 3-nmi no-entry zones around rookeries, prohibition of shooting at or near sea lions, and
regulation of fisheries for sea lion prey species (e.g., walleye pollock, Pacific cod, and Atka mackerel; see reviews
by Fritz et al. 1995, McBeath 2004, Atkinson et al. 2008, NMFS 2008). Additionally, potentially deleterious events,
such as harmful algal blooms (Lefebvre et al. 2016) and disease transmission across the Arctic (VanWormer et al.
2019) that have been associated with warming waters, could lead to potentially negative population-level impacts on
Steller sea lions. Metal and contaminant exposure remains a focus of ongoing investigation. Total mercury
concentrations measured in hair samples collected from pups in the western-central Aleutian Islands are the highest
measured for this species and at levels that in other species cause neurological and reproductive effects (Rea et al.
2013), and organochlorine burdens were detected in tissue samples from across the range but were highest in pups
sampled from the Aleutian Islands (Beckmen et al. 2016, Keogh et al. 2020).
The area of greatest (continued) decline in the U.S. remains in the western Aleutian Islands (west of
Samalga Pass). Pacific cod and Atka mackerel are two of the primary prey species of Steller sea lions in the central
and western Aleutian Islands (Sinclair et al. 2013, Tollit et al. 2017). In the increasing eastern Aleutian Islands
region, Rand et al. (2019) reported dense and consistent aggregations of Atka mackerel. However, in the western
Aleutian Islands region, this important prey species was more spread out over a larger area during the non-breeding
(i.e., “winter”) season (Fritz et al. 2019, Rand et al. 2019). Prey availability over winter is thought to be a key factor
in energy budgets of sea lions, especially for pregnant females and especially those supporting a pup and/or juvenile
(NMFS 2010, Boyd 2000, Malavaer 2002, Winship et al. 2002, Williams 2005). This could result in increases in
energy expenditures by Steller sea lions associated with finding and capturing prey, as evident by increased
frequency and duration of foraging trips observed in juvenile Steller sea lions in this region (Lander et al. 2010).
Prey species (e.g., Atka mackerel, Pacific cod, and walleye pollock) are likely to have lower overall abundance, less
predictable spatial distributions, and altered demographics in fished versus unfished habitats (Hsieh et al. 2006,
Barbeaux et al. 2013, Fritz et al. 2019). In 2011, the Pacific cod and Atka mackerel fisheries were closed and then
re-opened in 2014. In the western Aleutian Islands region, modeled realized counts exhibited stability from 2014 to
2016 (and potentially an increase in pup counts), followed by continued declines since 2016 (Sweeney et al. 2016,
2017, 2018). Fritz et al. (2019) suggested that if nutrition is a driver of the decline, then it appears that other factors
(than diet diversity, species mix, and energy density) may be acting. The literature does not prove (or disprove) a
correlation between fisheries, sea lion population trends, and prey availability in the Aleutian Islands, and this
hypothesis is an important area of investigation for Steller sea lions, especially in the Aleutian Islands.
15
NOAA-TM-AFSC-421 M.M. Muto et al. 2021
Alaska Marine Mammal Stock Assessments 2020

The Pacific marine heatwave that occurred from 2014 to 2016, and subsequent warm waters in the north
Pacific, especially the Gulf of Alaska, has been linked to large declines in productivity and impacts on groundfish
populations (von Biela et al. 2019, Yang et al. 2019). In fact, the concomitant decline in pup productivity in the
eastern and central Gulf of Alaska regions observed from 2015 and 2017 may be related to the reduction of available
prey in the area (Sweeney et al. 2017). In 2019, pup production in these regions rebounded to 2015 levels; however,
there was a decline in non-pups that spanned all the Gulf of Alaska regions (Sweeney et al. 2019). These declines
are concerning given that prior to 2017, these regions were showing relatively consistent and steady increases in
counts (Sweeney et al. 2019). As Alaska waters, especially the Gulf of Alaska, continue to warm, it seems evident
from NOAA Fisheries sea lion surveys that this could continue to impact the Western stock in the U.S. It is also
possible that changes in foraging ability could affect sea lion movements between and within the stocks (Jemison et
al. 2018).
CITATIONS AFSC/MML/Alaska Ecosystems Program. 2016. Steller sea lion haulout and rookery locations in the United States
for 2016-05-14 (NCEI Accession 0129877). NOAA National Centers for Environmental Information
Dataset. DOI: dx.doi.org/10.7289/V58C9T7V .
Alaska Native Harbor Seal Commission (ANHSC). 2015. 2014 estimate of the subsistence harvest of harbor seals
and sea lions by Alaska Natives in southcentral Alaska: summary of study findings. Alaska Native Harbor
Seal Commission and Alaska Department of Fish & Game, Division of Subsistence. 15 p.
Atkinson, S., D. P. DeMaster, and D. G. Calkins. 2008. Anthropogenic causes of the western Steller sea lion
Eumetopias jubatus population decline and their threat to recovery. Mammal Rev. 38(1):1-18.
Baker, A. R., T. R. Loughlin, V. Burkanov, C. W. Matson, T. G. Trujillo, D. G. Calkins, J. K. Wickliffe, and J. W.
Bickham. 2005. Variation of mitochondrial control region sequences of Steller sea lions: the three-stock
hypothesis. J. Mammal. 86:1075-1084.
Barbeaux, S. J., J. K. Horne, and M. W. Dorn. 2013. Characterizing walleye pollock (Theragra chalcogramma)
winter distribution from opportunistic data. ICES J. Mar. Sci. 70(6):1162-1173. DOI:
dx.doi.org/10.1093/icesjms/fst052 .
Beckmen, K. B., M. J. Keogh, K. A. Burek-Huntington, G. M. Ylitalo, B. S. Fadely, and K. W Pitcher. 2016.
Organochlorine contaminant concentrations in multiple tissues of free-ranging Steller sea lions
(Eumetopias jubatus) in Alaska. Science of the Total Environment 542:441-452. DOI:
dx.doi.org/10.1016/j.scitotenv.2015.10.119 .
Berta, A., and M. Churchill. 2012. Pinniped taxonomy: review of currently recognized species and subspecies, and
evidence used for their description. Mammal Rev. 42(2):207-234.
Bickham, J. W., J. C. Patton, and T. R. Loughlin. 1996. High variability for control-region sequences in a marine
mammal: implications for conservation and biogeography of Steller sea lions (Eumetopias jubatus). J.
Mammal. 77:95-108.
Bond, N. A., M. F. Cronin, H. Freeland, and N. Mantua. 2015. Causes and impacts of the 2014 warm anomaly in
the NE Pacific. Geophys. Res. Lett. 42(9):3414-3420. DOI: dx.doi.org/10.1002/2015GL063306 .
Boyd, I. L. 2000. State‐dependent fertility in pinnipeds: contrasting capital and income breeders. Functional
Ecology 14(5):623-630.
Braham, H. W., R. D. Everitt, and D. J. Rugh. 1980. Northern sea lion decline in the eastern Aleutian Islands. J.
Wildl. Manage. 44:25-33.
Breiwick, J. M. 2013. North Pacific marine mammal bycatch estimation methodology and results, 2007-2011. U.S.
Dep. Commer., NOAA Tech. Memo. NMFS-AFSC-260, 40 p.
Burkanov, V. 2017. Results of breeding season Steller sea lion pup surveys in Russia, 2011-2016. Memorandum
to T. Gelatt and J. Bengtson, April 6, 2017. Available from Marine Mammal Laboratory, AFSC, NMFS,
7600 Sand Point Way NE, Seattle, WA 98115.
Burkanov, V. 2018a. Brief results on the most recent and complete Steller sea lion counts in Russia. Memorandum
to T. Gelatt and J. Bengtson. Available from Marine Mammal Laboratory, AFSC, NMFS, 7600 Sand Point
Way NE, Seattle, WA 98115. 35 p.
Burkanov, V. 2018b. Current Steller sea lion pup production along Asian coast, 2016-2017. Memorandum to T.
Gelatt and J. Bengtson. Available from Marine Mammal Laboratory, AFSC, NMFS, 7600 Sand Point Way
NE, Seattle, WA 98115. 3 p.
Burkanov, V., and T. R. Loughlin. 2005. Distribution and abundance of Steller sea lions on the Asian coast,
1720’s–2005. Mar. Fish. Rev. 67(2):1-62.
16
NOAA-TM-AFSC-421 M.M. Muto et al. 2021
Alaska Marine Mammal Stock Assessments 2020

Byrd, G. V. 1989. Observations of northern sea lions at Ugamak, Buldir, and Agattu Islands, Alaska in 1989.
Unpubl. report, U.S. Fish and Wildlife Service, Alaska Maritime National Wildlife Refuge, P.O. Box 5251,
NSA Adak, FPO Seattle, WA 98791.
Calkins, D. G., and K. W. Pitcher. 1982. Population assessment, ecology and trophic relationships of Steller sea
lions in the Gulf of Alaska. Environmental Assessment of the Alaskan Continental Shelf. Final Reports
19:455-546.
DeMaster, D. P. 2014. Results of Steller sea lion surveys in Alaska, June-July 2013. Memorandum to J. Balsiger,
J. Kurland, B. Gerke, and L. Rotterman, NMFS Alaska Regional Office, Juneau, AK, January 30, 2014.
Available from Marine Mammal Laboratory, AFSC, NMFS, 7600 Sand Point Way NE, Seattle, WA
98115.
Dizon, A. E., C. Lockyer, W. F. Perrin, D. P. DeMaster, and J. Sisson. 1992. Rethinking the stock concept: a
phylogeographic approach. Conserv. Biol. 6:24-36.
Fritz, L. W., R. C. Ferrero, and R. J. Berg. 1995. The threatened status of Steller sea lions, Eumetopias jubatus,
under the Endangered Species Act: effects on Alaska groundfish fisheries management. Mar. Fish. Rev.
57(2):14-27.
Fritz, L., K. Sweeney, D. Johnson, M. Lynn, and J. Gilpatrick. 2013. Aerial and ship-based surveys of Steller sea
lions (Eumetopias jubatus) conducted in Alaska in June-July 2008 through 2012, and an update on the
status and trend of the western stock in Alaska. U.S. Dep. Commer., NOAA Tech. Memo. NMFS-AFSC-
251, 91 p.
Fritz, L., K. Sweeney, R. Towell, and T. Gelatt. 2016. Aerial and ship-based surveys of Steller sea lions
(Eumetopias jubatus) conducted in Alaska in June-July 2013 through 2015, and an update on the status and
trend of the western distinct population segment in Alaska. U.S. Dep. Commer., NOAA Tech. Memo.
NMFS-AFSC-321, 72 p.
Fritz, L., B. Brost, E. Laman, K. Luxa, K. Sweeney, J. Thomason, D. Tollit, W. Walker, and T. Zeppelin. 2019. A
re-examination of the relationship between Steller sea lion (Eumetopias jubatus) diet and population trend
using data from the Aleutian Islands. Can. J. Zool. 97:1137-1155. DOI: dx.doi.org/10.1139/cjz-2018-
0329 .
Gelatt, T. S., A. W. Trites, K. Hastings, L. Jemison, K. Pitcher, and G. O’Corry-Crowe. 2007. Population trends,
diet, genetics, and observations of Steller sea lions in Glacier Bay National Park, p. 145-149. In J. F. Piatt,
and S. M. Gende (eds.), Proceedings of the Fourth Glacier Bay Science Symposium, October 26–28, 2004:
U.S. Geological Survey Scientific Investigations Report 2007-5047.
Harlin-Cognato, A., J. W. Bickham, T. R. Loughlin, and R. L. Honeycutt. 2006. Glacial refugia and the
phylogeography of Steller’s sea lion (Eumetopias jubatus) in the North Pacific. J. Evol. Biol. 19:955-969.
DOI: dx.doi.org/10.1111/j.1420-9101.2005.01052.x .
Hastings, K. K., L. A. Jemison, G. W. Pendleton, K. L. Raum-Suryan, and K. W. Pitcher. 2017. Natal and breeding
philopatry of female Steller sea lions in southeastern Alaska. PLoS ONE 13(4):e0196412. DOI:
dx.doi.org/10.1371/journal.pone.0176840 .
Hastings, K. K., M. J Rehberg, G. M. O’Corry-Crowe, G. W. Pendleton, L. A. Jemison, and T. S. Gelatt. 2019.
Demographic consequences and characteristics of recent population mixing and colonization in Steller sea
lions, Eumetopias jubatus. J. Mammal. DOI: dx.doi.org/10.1093/jmammal/gyz192 .
Higgins, L. V., D. P. Costa, A. C. Huntley, and B. J. Le Boeuf. 1988. Behavioral and physiological measurements
of maternal investment in the Steller sea lion, Eumetopias jubatus. Mar. Mammal Sci. 4:44-58.
Hoffman, J. I., C. W. Matson, W. Amos, T. R. Loughlin, and J. W. Bickham. 2006. Deep genetic subdivision
within a continuously distributed and highly vagile marine mammal, the Steller’s sea lion (Eumetopias
jubatus). Mol. Ecol. 15:2821-2832.
Hoffman, J. I., K. K. Dasmahapatra, W. Amos, C. D. Phillips, T. S. Gelatt, and J. W Bickham. 2009. Contrasting
patterns of genetic diversity at three different genetic markers in a marine mammal metapopulation. Mol.
Ecol. 18(14):2961-2978.
Holmes, E. E., L. W. Fritz, A. E. York, and K. Sweeney. 2007. Age-structured modeling provides evidence for a
28-year decline in the birth rate of western Steller sea lions. Ecol. Appl. 17(8):2214-2232.
Hsieh, C. H., C. S. Reiss, J. R. Hunter, J. R. Beddington, R. M. May, and G. Sugihara. 2006. Fishing elevates
variability in the abundance of exploited species. Nature 443:859-862. DOI:
dx.doi.org/10.1038/nature05232 .
Jemison, L. A., G. W. Pendleton, L. W. Fritz, K. K. Hastings, J. M. Maniscalco, A. W. Trites, and T. S. Gelatt.
2013. Inter-population movements of Steller sea lions in Alaska, with implications for population
separation. PLoS ONE 8(8):e70167.
17
NOAA-TM-AFSC-421 M.M. Muto et al. 2021
Alaska Marine Mammal Stock Assessments 2020

Jemison, L. A., G. W. Pendleton, K. K. Hastings, J. M. Maniscalco, and L. W. Fritz. 2018. Spatial distribution,
movements, and geographic range of Steller sea lions (Eumetopias jubatus) in Alaska. PLoS ONE
13(12):e0208093. DOI: dx.doi.org/10.1371/journal.pone.0208093 .
Johnson, D. 2018. Trends of nonpup survey counts of Russian Steller sea lions. Memorandum for T. Gelatt and J.
Bengtson, June 6, 2018. Available from NMFS Alaska Region, Office of Protected Resources, 709 West
9th Street, Juneau, AK 99802-1668.
Johnson, D. S., and L. W. Fritz. 2014. agTrend: a Bayesian approach for estimating trends of aggregated
abundance. Methods Ecol. Evol. 5:1110-1115. DOI: dx.doi.org/10.1111/2041-210X.12231 .
Kashevarof, H. 2015. St. George co-management comprehensive report. St. George Island Traditional Council
Kayumixtax Eco-Office, St. George Island, AK 99591.
Keogh, M. J., B. Taras, K. B. Beckmen, K. A. Burek-Huntington, G. M. Ylitalo, B. S. Fadely, L. D. Rea, and K. W.
Pitcher. 2020. Organochlorine contaminant concentrations in blubber of young Steller sea lion
(Eumetopias jubatus) are influenced by region, age, sex and lipid stores. Science of the Total Environment
698:134183. DOI: dx.doi.org/10.1016/j.scitotenv.2019.134183 .
Kuhn, C. E., K. Chumbley, D. Johnson, and L. Fritz. 2017. A re-examination of the timing of pupping for Steller
sea lions Eumetopias jubatus breeding on two islands in Alaska. Endang. Species Res. 32:213-222. DOI:
dx.doi.org/10.3354/esr00796 .
Lander, M. E., T. R. Loughlin, M. G. Logsdon, G. R. VanBlaricom, and B. S. Fadely. 2010. Foraging effort of
juvenile Steller sea lions Eumetopias jubatus with respect to heterogeneity of sea surface temperature.
Endang. Species Res. 10:145-158. DOI: dx.doi.org/ 10.3354/esr00260 .
Lefebvre, K. A., L. Quakenbush, E. Frame, K. Burek Huntington, G. Sheffield, R. Stimmelmayr, A. Bryan, P.
Kendrick, H. Ziel, T. Goldstein, J. A. Snyder, T. Gelatt, F. Gulland, B. Dickerson, and V. Gil. 2016.
Prevalence of algal toxins in Alaskan marine mammals foraging in a changing arctic and subarctic
environment. Harmful Algae 55:13-24. DOI: dx.doi.org/10.1016/j.hal.2016.01.007 .
Loughlin, T. R. 1997. Using the phylogeographic method to identify Steller sea lion stocks, p. 329-341. In A.
Dizon, S. J. Chivers, and W. Perrin (eds.), Molecular genetics of marine mammals, incorporating the
proceedings of a workshop on the analysis of genetic data to address problems of stock identity as related
to management of marine mammals. Soc. Mar. Mammal., Spec. Rep. No. 3.
Loughlin, T. R., and A. E. York. 2000. An accounting of the sources of Steller sea lion mortality. Mar. Fish. Rev.
62(4):40-45.
Loughlin, T. R., D. J. Rugh, and C. H. Fiscus. 1984. Northern sea lion distribution and abundance: 1956-1980. J.
Wildl. Manage. 48:729-740.
Malavaer, M. Y. G. 2002. Modeling the energetics of Steller sea lions (Eumetopias jubatus) along the Oregon
Coast. M.S. Thesis, Oregon State University, Corvallis, Oregon.
Maniscalco, J. M., P. Parker, and S. Atkinson. 2006. Interseasonal and interannual measures of maternal care
among individual Steller sea lions (Eumetopias jubatus). J. Mammal. 87:304-311.
Manly, B. F. J. 2015. Incidental takes and interactions of marine mammals and birds in districts 6, 7, and 8 of the
Southeast Alaska salmon drift gillnet fishery, 2012 and 2013. Final Report to NMFS Alaska Region. 52 p.
McBeath, J. 2004. Greenpeace v. National Marine Fisheries Service: Steller sea lions and commercial fisheries in
the North Pacific. Alaska Law Rev. 21:1-42.
Melovidov, P. I. 2013. 2012 subsistence hunting of Steller sea lions on St. Paul Island. Memorandum for the
Record, February 25, 2013, Aleut Community of St. Paul, Tribal Government, Ecosystem Conservation
Office, St. Paul Island, Pribilof Islands, AK.
Melovidov, P. I. 2014. 2013 subsistence hunting of Steller sea lions on St. Paul Island. Memorandum for the
Record, February 28, 2014, Aleut Community of St. Paul, Tribal Government, Ecosystem Conservation
Office, St. Paul Island, Pribilof Islands, AK.
Melovidov, P. I. 2015. 2014 subsistence hunting of Steller sea lions on St. Paul Island. Memorandum for the
Record, February 20, 2015, Aleut Community of St. Paul, Tribal Government, Ecosystem Conservation
Office, St. Paul Island, Pribilof Islands, AK.
Melovidov, P. I. 2016. 2015 subsistence hunting of Steller sea lions on St. Paul Island. Memorandum for the
Record, February 23, 2016, Aleut Community of St. Paul, Tribal Government, Ecosystem Conservation
Office, St. Paul Island, Pribilof Islands, AK.
Merrick, R. L., T. R. Loughlin, and D. G. Calkins. 1987. Decline in abundance of the northern sea lion, Eumetopias
jubatus, in 1956-86. Fish. Bull., U.S. 85:351-365.
18
NOAA-TM-AFSC-421 M.M. Muto et al. 2021
Alaska Marine Mammal Stock Assessments 2020

Merrick, R. L., R. Brown, D. G. Calkins, and T. R. Loughlin. 1995. A comparison of Steller sea lion, Eumetopias
jubatus, pup masses between rookeries with increasing and decreasing populations. Fish. Bull., U.S.
93:753-758.
Milette, L. L., and A. W. Trites. 2003. Maternal attendance patterns of Steller sea lions (Eumetopias jubatus) from
stable and declining populations in Alaska. Can. J. Zool. 81:340-348.
National Marine Fisheries Service (NMFS). 1990. Final rule. Listing of Steller Sea Lions as Threatened Under the
Endangered Species Act. 55 FR 24345, 26 November 1990.
National Marine Fisheries Service (NMFS). 1997. Final rule. Change in Listing Status of Steller Sea Lions Under
the Endangered Species Act. 62 FR 24345, 5 May 1997.
National Marine Fisheries Service (NMFS). 2008. Recovery Plan for the Steller sea lion (Eumetopias jubatus).
Revision. National Marine Fisheries Service, Silver Spring, MD. 325 p.
National Marine Fisheries Service (NMFS). 2010. Endangered Species Act - Section 7 Consultation Biological
Opinion: Authorization of groundfish fisheries under the Fishery Management Plan for Groundfish of the
Bering Sea and Aleutian Islands Management Area; Authorization of groundfish fisheries under the Fishery
Management Plan for Groundfish of the Gulf of Alaska, State of Alaska parallel groundfish fisheries.
Available online: https://www.fisheries.noaa.gov/resource/document/biological-opinion-authorization-
alaska-groundfish-fisheries . Accessed December 2020.
National Marine Fisheries Service (NMFS). 2013. Occurrence of Western Distinct Population Segment Steller sea
lions east of 144° W longitude. December 18, 2013. NMFS Alaska Region, Protected Resources Division,
Juneau, AK. 3 p.
National Marine Fisheries Service (NMFS). 2016. Guidelines for preparing stock assessment reports pursuant to
the 1994 amendments to the Marine Mammal Protection Act. 23 p. Available online:
https://www.fisheries.noaa.gov/national/marine-mammal-protection/guidelines-assessing-marine-mammal-
stocks . Accessed December 2020.
O’Corry-Crowe, G., B. L. Taylor, and T. Gelatt. 2006. Demographic independence along ecosystem boundaries in
Steller sea lions revealed by mtDNA analysis: implications for management of an endangered species.
Can. J. Zool. 84(12):1796-1809.
O’Corry-Crowe, G., T. Gelatt, L. Rea, C. Bonin, and M. Rehberg. 2014. Crossing to safety: dispersal, colonization
and mate choice in evolutionarily distinct populations of Steller sea lions, Eumetopias jubatus. Mol. Ecol.
23(22):5415-5434.
Olesiuk, P. F. 2008. Abundance of Steller sea lions (Eumetopias jubatus) in British Columbia. Department of
Fisheries and Oceans Canada, Canadian Science Advisory Secretariat Research Document 2008/063. 29 p.
Available online: https://waves-vagues.dfo-mpo.gc.ca/Library/336057.pdf . Accessed December 2020.
Peterson, W., N. Bond, and M. Robert. 2016. The blob (part three): going, going, gone? PICES Press 24(1):46-48.
Available online: https://search.proquest.com/docview/1785278412?accountid=28257 . Accessed
December 2020.
Phillips, C. D., J. W. Bickham, J. C. Patton, and T. S. Gelatt. 2009. Systematics of Steller sea lions (Eumetopias
jubatus): subspecies recognition based on concordance of genetics and morphometrics. Museum of Texas
Tech University Occasional Papers 283:1-15.
Phillips, C. D., T. S. Gelatt, J. C. Patton, and J. W. Bickham. 2011. Phylogeography of Steller sea lions:
relationships among climate change, effective population size, and genetic diversity. J. Mammal.
92(5):1091-1104.
Pitcher, K. W., V. N. Burkanov, D. G. Calkins, B. J. Le Boeuf, E. G. Mamaev, R. L. Merrick, and G. W. Pendleton.
2001. Spatial and temporal variation in the timing of births of Steller sea lions. J. Mammal. 82(4):1047-
1053.
Pitcher, K. W., P. F. Olesiuk, R. F. Brown, M. S. Lowry, S. J. Jeffries, J. L. Sease, W. L. Perryman, C. E.
Stinchcomb, and L. F. Lowry. 2007. Abundance and distribution of the eastern North Pacific Steller sea
lion (Eumetopias jubatus) population. Fish. Bull., U.S. 105(1):102-115.
Rand, K., S. McDermott, E. Logerwell, M. E. Matta, M. Levine, D. R. Bryan, I. B. Spies, and T. Loomis. 2019.
Higher aggregation of key prey species associated with diet and abundance of the Steller sea lion
Eumetopias jubatus across the Aleutian Islands. Marine and Coastal Fisheries 11(6):472-486. DOI:
dx.doi.org/10.1002/mcf2.10096 .
Raum-Suryan, K. L, K. W. Pitcher, D. G. Calkins, J. L. Sease, and T. R. Loughlin. 2002. Dispersal, rookery
fidelity, and metapopulation structure of Steller sea lions (Eumetopias jubatus) in an increasing and a
decreasing population in Alaska. Mar. Mammal Sci. 18(3):746-764. DOI: dx.doi.org/10.1111/j.1748-
7692.2002.tb01071.x .
19
NOAA-TM-AFSC-421 M.M. Muto et al. 2021
Alaska Marine Mammal Stock Assessments 2020

Raum-Suryan, K. L., L. A. Jemison, and K. W. Pitcher. 2009. Entanglement of Steller sea lions (Eumetopias
jubatus) in marine debris: identifying causes and finding solutions. Mar. Pollut. Bull. 58:1487-1495.
Rea, L. D., J. M. Castellini, L. Correa, B. S. Fadely, and T. M. O’Hara. 2013. Maternal Steller sea lion diets elevate
fetal mercury concentrations in an area of population decline. Science of the Total Environment 454-
455:277-282. DOI: dx.doi.org/10.1016/j.scitotenv.2013.02.095 .
Rehberg, M., L. Jemison, J. N. Womble, and G. O’Corry-Crowe. 2018. Winter movements and long-term dispersal
of Steller sea lions in the Glacier Bay region of Southeast Alaska. Endang. Species Res. 37:11-24. DOI:
dx.doi.org/10.3354/esr00909 .
Sease, J. L., and C. J. Gudmundson. 2002. Aerial and land-based surveys of Steller sea lions (Eumetopias jubatus)
from the western stock in Alaska, June and July 2001 and 2002. U.S. Dep. Commer., NOAA Tech. Memo.
NMFS-AFSC-131, 54 p.
Sease, J. L., and A. E. York. 2003. Seasonal distribution of Steller’s sea lions at rookeries and haul-out sites in
Alaska. Mar. Mammal Sci. 19(4):745-763.
Sease, J. L., W. P. Taylor, T. R. Loughlin, and K. W. Pitcher. 2001. Aerial and land-based surveys of Steller sea
lions (Eumetopias jubatus) in Alaska, June and July 1999 and 2000. U.S. Dep. Commer., NOAA Tech.
Memo. NMFS-AFSC-122, 52 p.
Sinclair, E. H., D. S. Johnson, T. K. Zeppelin, and T. S. Gelatt. 2013. Decadal variation in the diet of Western stock
Steller sea lions (Eumetopias jubatus). U.S. Dep. Commer., NOAA Tech. Memo. NMFS-AFSC-248, 67 p.
Sweeney, K., L. Fritz, R. Towell, and T. Gelatt. 2016. Results of Steller sea lion surveys in Alaska, June-July 2016.
Memorandum to D. DeMaster, J. Bengtson, J. Balsiger, J. Kurland, and L. Rotterman, December 5, 2016.
Available from Marine Mammal Laboratory, AFSC, NMFS, 7600 Sand Point Way NE, Seattle, WA
98115.
Sweeney, K., L. Fritz, R. Towell, and T. Gelatt. 2017. Results of Steller sea lion surveys in Alaska, June-July 2017.
Memorandum to the Record, December 5, 2017. Available from Marine Mammal Laboratory, AFSC,
NMFS, 7600 Sand Point Way NE, Seattle, WA 98115.
Sweeney, K., R. Towell, and T. Gelatt. 2018. Results of Steller sea lion surveys in Alaska, June-July 2018.
Memorandum to the Record, December 5, 2018. Available from Marine Mammal Laboratory, AFSC,
NMFS, 7600 Sand Point Way NE, Seattle, WA 98115.
Sweeney, K., K. Luxa, B. Birkemeier, and T. Gelatt. 2019. Results of Steller sea lion surveys in Alaska, June-July
2019. Memorandum to the Record, December 6, 2019. Available from Marine Mammal Laboratory,
AFSC, NMFS, 7600 Sand Point Way NE, Seattle, WA 98115.
Tollit, D., L. Fritz, R. Joy, K. Miller, A. Schulze, J. Thomason, W. Walker, T. Zeppelin, and T. Gelatt. 2017. Diet
of endangered Steller sea lions (Eumetopias jubatus) in the Aleutian Islands: new insights from DNA
detections and bioenergetics reconstructions. Can. J. Zool. 95:853-868. DOI: dx.doi.org/10.1139/cjz-
2016-0253 .
VanWormer, E., J. A. K. Mazet, A. Hall, V. A. Gill, P. L. Boveng, J. M. London, T. Gelatt, B. S. Fadely, M. E.
Lander, J. Sterling, V. N. Burkanov, R. R. Ream, P. M. Brock, L. D. Rea, B. R. Smith, A. Jeffers, M.
Henstock, M. J. Rehberg, K. A. Burek-Huntington, S. L. Cosby, J. A. Hammond, and T. Goldstein. 2019.
Viral emergence in marine mammals in the North Pacific may be linked to Arctic sea ice reduction.
Scientific Reports 9, 15569. DOI: dx.doi.org/10.1038/s41598-019-51699-4 .
von Biela, V. R., M. L. Arimitsu, J. F. Piatt, B. Heflin, S. K. Schoen, J. L. Trowbridge, and C. M. Clawson. 2019.
Extreme reduction in nutritional value of a key forage fish during the Pacific marine heatwave of 2014-
2016. Mar. Ecol. Prog. Series 613:171-182. DOI: dx.doi.org/10.3354/meps12891 .
Wade, P. R. 1994. Managing populations under the Marine Mammal Protection Act of 1994: a strategy for
selecting values for NMIN, the minimum abundance estimate, and FR, the recovery factor. Southwest
Fisheries Science Center Administrative Report LJ-94-19, 26 p. Available from SWFSC, NMFS, 8901 La
Jolla Shores Drive, La Jolla, CA 92037.
Williams, T. 2005. Reproductive energetics of sea lions: implications for the size of protected areas around Steller
sea lion rookeries, p. 83-89. In T. R. Loughlin, D. G. Calkins, and S. Atkinson (eds.), Synopsis of research
on Steller sea lions, 2001–2005. Alaska SeaLife Center, Seward, Alaska.
Winship, A. J., A. W. Trites, and D. A. S. Rosen. 2002. A bioenergetic model for estimating the food requirements
of Steller sea lions Eumetopias jubatus in Alaska, USA. Mar. Ecol. Prog. Ser. 229:291-312.
Wolfe, R. J., J. A. Fall, and R. T. Stanek. 2005. The subsistence harvest of harbor seals and sea lions by Alaska
Natives in 2004. Alaska Department of Fish and Game, Division of Subsistence, Technical Paper No. 303,
Juneau, AK.
20
NOAA-TM-AFSC-421 M.M. Muto et al. 2021
Alaska Marine Mammal Stock Assessments 2020

Wolfe, R. J., J. A. Fall, and R. T. Stanek. 2006. The subsistence harvest of harbor seals and sea lions by Alaska
Natives in 2005. Alaska Department of Fish and Game, Division of Subsistence, Technical Paper No. 319,
Juneau, AK.
Wolfe, R. J., J. A. Fall, and M. Riedel. 2008. The subsistence harvest of harbor seals and sea lions by Alaska
Natives in 2006. Alaska Department of Fish and Game, Division of Subsistence, Technical Paper No. 339,
Juneau, AK.
Wolfe, R. J., J. A. Fall, and M. Riedel. 2009a. The subsistence harvest of harbor seals and sea lions by Alaska
Natives in 2007. Alaska Department of Fish and Game, Division of Subsistence, Technical Paper No. 345,
Juneau, AK.
Wolfe, R. J., J. A. Fall, and M. Riedel. 2009b. The subsistence harvest of harbor seals and sea lions by Alaska
Natives in 2008. Alaska Department of Fish and Game, Division of Subsistence, Technical Paper No. 347,
Juneau, AK.
Wolfe, R. J., L. Hutchinson-Scarbrough, and M. Riedel. 2012. The subsistence harvest of harbor seals and sea lions
on Kodiak Island in 2011. Alaska Department of Fish and Game, Division of Subsistence, Technical Paper
No. 374, Anchorage, AK.
Wynne, K. M., D. Hicks, and N. Munro. 1991. 1990 salmon gillnet fisheries observer programs in Prince William
Sound and South Unimak Alaska. Annual Report NMFS/NOAA Contract 50ABNF000036. 65 p.
Available from NMFS Alaska Region, Office of Marine Mammals, P.O. Box 21668, Juneau, AK 99802.
Wynne, K. M., D. Hicks, and N. Munro. 1992. 1991 marine mammal observer program for the salmon driftnet
fishery of Prince William Sound Alaska. Annual Report NMFS/NOAA Contract 50ABNF000036. 53 p.
Available from NMFS Alaska Region, Office of Marine Mammals, P.O. Box 21668, Juneau, AK 99802.
Yang, Q., E. D. Cokelet, P. J. Stabeno, L. Li, A. B. Hollowed, W. A. Palsson, N. A. Bond, and S. Barbeaux. 2019.
How “The Blob” affected groundfish distributions in the Gulf of Alaska. Fish. Oceanography 28(4):434-
453. DOI: dx.doi.org/10.1111/fog.12422 .
York, A. E., R. L. Merrick, and T. R. Loughlin. 1996. An analysis of the Steller sea lion metapopulation in Alaska,
Chapter 12, p. 259-292. In D. R. McCullough (ed.), Metapopulations and Wildlife Conservation. Island
Press, Covelo, CA.
Young, N. C., B. J. Delean, V. T. Helker, J. C. Freed, M. M. Muto, K. Savage, S. Teerlink, L. A. Jemison, K.
Wilkinson, and J. Jannot. 2020. Human-caused mortality and injury of NMFS-managed Alaska marine
mammal stocks, 2014-2018. U.S. Dep. Commer., NOAA Tech. Memo. NMFS-AFSC-413, 142 p.
21
NOAA-TM-AFSC-421 M.M. Muto et al. 2021
Alaska Marine Mammal Stock Assessments 2020