Embed Size (px)
DESCRIPTION
Steen Bocian, Chief Economist of Danske Bank spoke about Nordic economies after the financial crisis.
Citation preview

Global and local economic and financial outlook

All regions pulling in global recovery- GDP estimates for 2011 (parenthesis show consensus)
2
US: 3.1% (3.1%)
China: 9.4% (9.5%)
Euro: 2.0% (1.6%)
Brazil: 5.7% (4.5%)
Russia: 4.7% (4.2%)
Africa – decent growth pulled by commodities and better governance

Debt problems – but the Nordics look strong
3
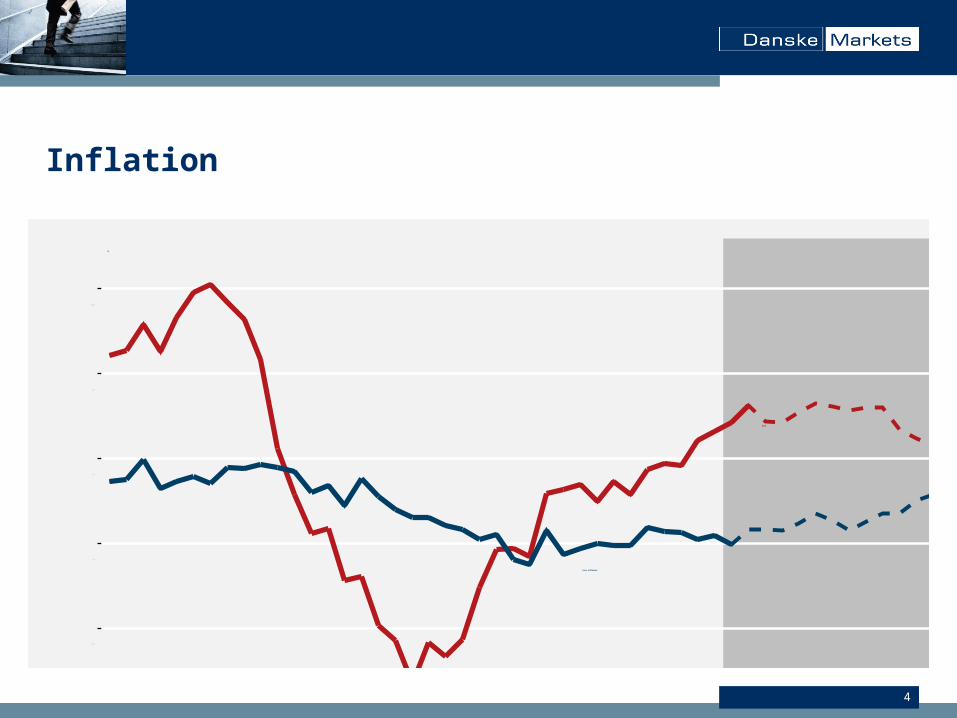
Inflation
4
08 09 10 11 12
-1,0
0,0
1,0
2,0
3,0
4,0
-1,0
0,0
1,0
2,0
3,0
4,0
%
%
HICP
Core inflation
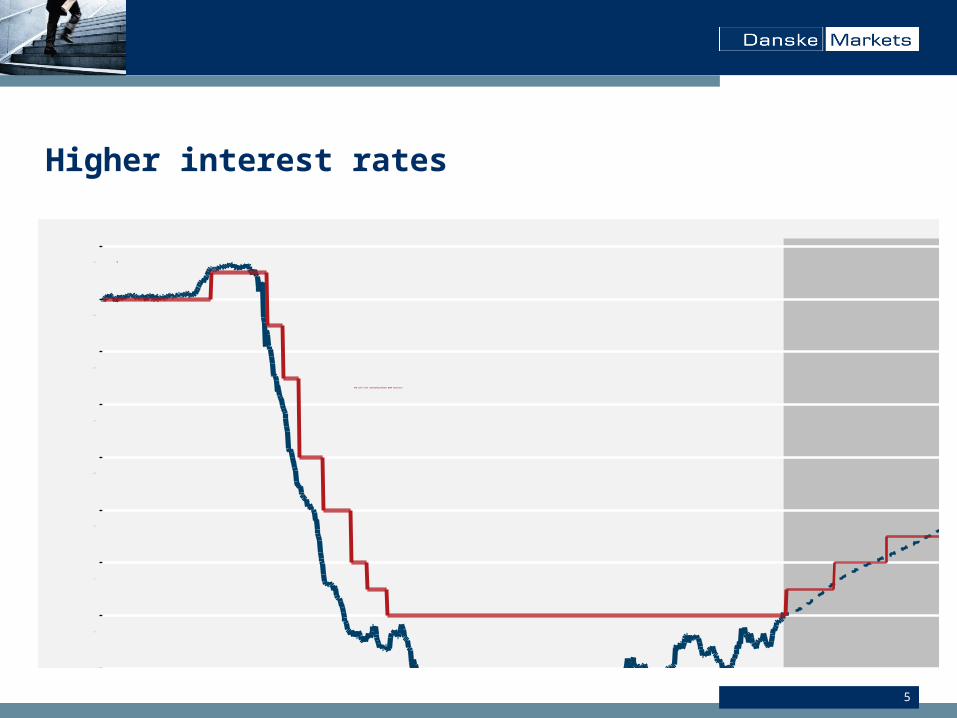
Higher interest rates
5
jan
08
maj sep jan
09
maj sep jan
10
maj sep jan
11
maj sep jan
12
maj sep0,0
0,5
1,0
1,5
2,0
2,5
3,0
3,5
4,0
4,5
0,0
0,5
1,0
1,5
2,0
2,5
3,0
3,5
4,0
4,5 %
%
ECB refi rate (including Danske Bank forecast)
1M Eonia (including forward)

The Nordics

The Nordic economies under pressure – Denmark is struggling the most
7
07 08 09 10
90
95
100
105
90
95
100
105
GDP - 2007q4 = 100
Latvia
Lithaunia
Norway
Denmark
Sweden
Norway
Finland
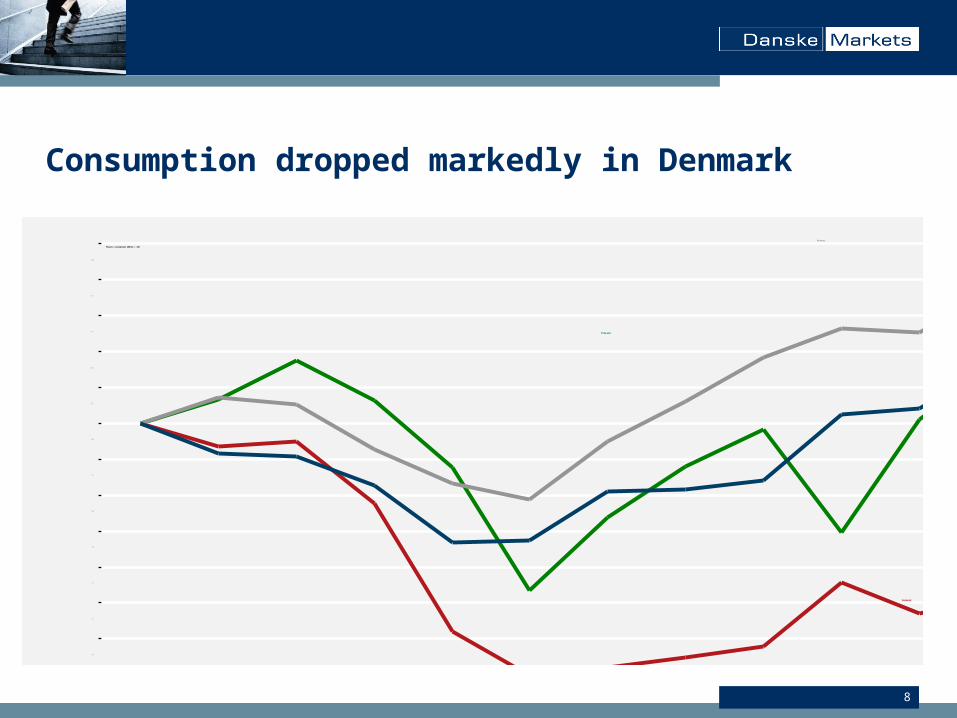
Consumption dropped markedly in Denmark
8
07 08 09 10
92
93
94
95
96
97
98
99
100
101
102
103
104
105
92
93
94
95
96
97
98
99
100
101
102
103
104
105
Private consumption 2007q4 = 100
Latvia
Lithaunia
Norway
Denmark
Sweden
Norway
Finland

High household leverage in the Nordics
9
% of GDP

Housing markets are behaving very differently
1005 06 07 08 09 10
95
100
105
110
115
120
125
130
135
140
145
95
100
105
110
115
120
125
130
135
140
145 Index 2005 =100, House prices
Finland
Denmark
Sweden
Norway

Unemployment has turned around except for Danish
11
00 01 02 03 04 05 06 07 08 09 10
23456789
10
23456789
10
Denmark
Norway
% %
Sweden
Finland

Consumer confidence has improved
12
04 05 06 07 08 09 10 11
-30
-20
-10
0
10
20
30
40
-30
-20
-10
0
10
20
30
40 Index
Index
Finland
Denmark
Norway
Sweden

Swedish exports is picking up strongly
13
07 08 09 10
75
80
85
90
95
100
105
110
115
75
80
85
90
95
100
105
110
115
Eksport - 2008q1 = 100
Latvia
Lithaunia
Denmark
Sweden
Norway
Finland

Denmark and Norway are challenged by the costs
14
00 02 04 06 08 10 12
100
110
120
130
140
150
160
170
100
110
120
130
140
150
160
170 Unit labour cost, 2000=100
Denmark
Sweden
Norway
% y/y
Finland
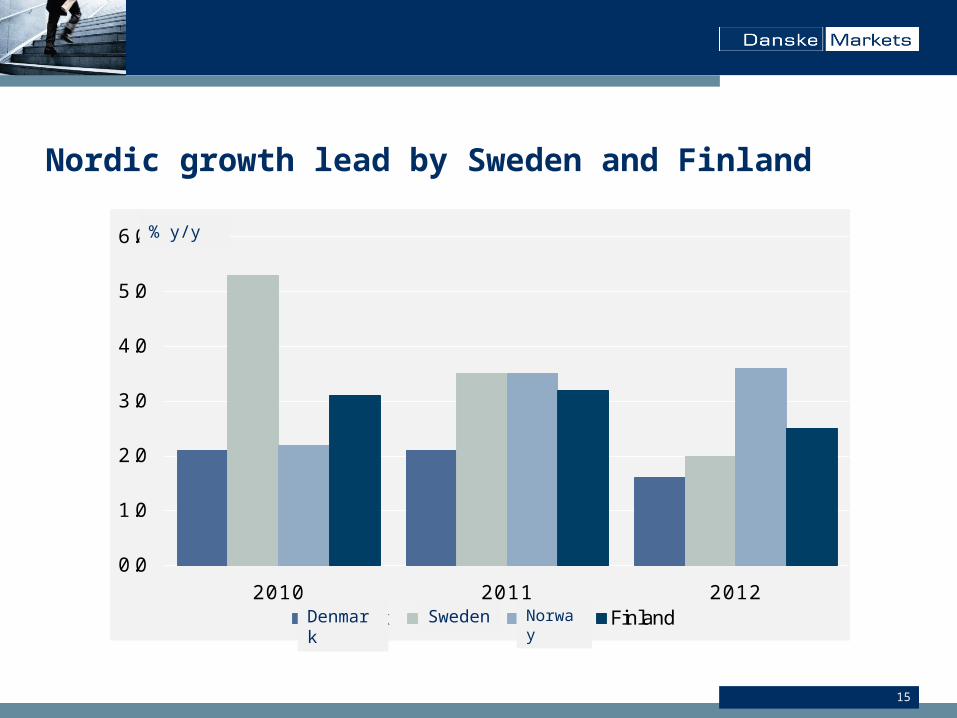
Nordic growth lead by Sweden and Finland
15
0.0
1.0
2.0
3.0
4.0
5.0
6.0
2010 2011 2012
% å/å
Danmark Sverige Norge FinlandDenmark
Sweden
Norway
% y/y

Interest rates on the rise
1607 08 09 10 11 12
percent
0
1
2
3
4
5
6
percent
0
1
2
3
4
5
6
%%
Sweden
Norway
Denmark
Finland