Embed Size (px)
Citation preview

Steam Reforming for Hydrogen. The Process and the Mechanism
Jens R.. Rostrup-Nielsen and Jens Sehested
Haldor Topsøe A/S Lyngby, Denmark
Introduction
Steam reforming has been a well-established process in industry for more than 70 years and it will play an important role in future applications related to a new hydrogen economy1,2. There is also a fast growing need for more hydrogen production capacity in refineries, as the hydrogen balance is negative which means that more hydrogen has to be produced at the refinery or being imported. In spite of efforts to produce hydrogen by schemes involving solar energy, wind energy and biofuels, fossil fuels remain the most feasible feedstock for hydrogen generation in the near term2.
The choice of hydrogen technology is dictated by the cost and availability of feedstock, and by the scale of operation.
Other parameters than efficiency play a role for small units such as simplicity, compactness and (for automotive units) short start-up time. Air blown catalytic partial oxidation (CPO) fulfils these requirements in particular for fuel cell applications where it is normally acceptable that the hydrogen stream contains nitrogen3. However, for commercial scale production of pure hydrogen, steam reforming remains the most economic and efficient technology for a wide range of hydrocarbon feedstocks.
Figure 1. Hydrogen plant. Simplified scheme.
A typical lay-out of a hydrogen plant is shown in Figure 1.
The reforming process is followed by water gas shift at 410-625 F to ensure high conversion of carbon monoxide and clean-up of the hydrogen product in a PSA-unit.
In many situations when natural gas is not available, higher hydrocarbons become the preferred feedstock for the reforming process. Many refineries can benefit from flexibility in feedstock, taking advantage of the surplus of various hydrocarbon streams in the refinery. Steam reforming of liquid hydrocarbons is also considered for hydrogen generation for fuel cells4 with diesel and jet fuel considered as “logistic fuels”.
The steam reforming process may appear straightforward from an overall consideration as the product composition is determined by simple thermodynamics, but in reality it is a complex coupling of catalysis, heat transfer and mechanical design. In recent years, there has been progress in steam reforming technology
resulting in less costly and more efficient plants, in part because of better materials for reformer tubes, better control and understanding of carbon limits, and better catalysts and process concepts with high feedstock flexibility. This progress has been accompanied by a better understanding of the reaction mechanism. Results
Efficiency and costs. With no steam export, theoretical energy consumption of 300 BTU/scf H2 (11,8 MJ/Nm3) on LHV (lower heating value) basis (using liquid water as feed). The industrial value2 for natural gas based plants is about 320 BTU/scf H2 (12.6 MJ/Nm3H2) corresponding to 94% of the theoretical efficiency. At locations with high natural gas prizes, the energy efficiency becomes critical. For a natural gas price of 4 USD MM BTU, the feedstock and utility costs makes about 65% of total operating costs.
High temperature and high steam to carbon ratio favor high conversion of the endothermic steam reforming reactions. However, modern hydrogen plants are normally designed for low steam-to-carbon ratios (1.8-2.5 mole/C-atom). A low steam-to-carbon ratio reduces the mass flow through the plant and thus the size and costs of equipment2. Furthermore, low steam-to-carbon ratios result in a more energy-efficient plant and thus a lower operating cost. In principle, a low steam-to-carbon ratio increases the amount of unconverted methane from the reformer, but is compensated for by increasing the reformer outlet temperature, typically to ca. 1700oF.
- High heat flux - Low steam to carbon ratio and high
exit temperature - Prereformer and high inlet temperature
Figure 2. Parameters resulting in lower reformer costs The thermal efficiency of the tubular reformer and waste heat recovery section approaches 95%. The heat transferred to the process is about 50% of the heat input to the reformer and the remainder is recovered from the flue gas. This heat is used for steam production and for preheating of the reformer feed, combustion air, etc. The same is true for the heat contained in the hot product gas exiting the reformer. Very often, there is little need for export steam and today’s design aims at minimum steam production.
It is possible to increase the amount of heat transferred to the process gas in the reformer from about 50% to about 80% of the supplied heat when using a convective heat exchange reformer5, in which the flue gas as well as the hot product gas are cooled by heat exchange with the process gas flowing through the catalyst bed. This results in a more compact piece of equipment. In all types of heat-exchange reformers, however, the heat exchange is by convection, which generally leads to lower heat fluxes than in reformers with radiant heat transfer. However, the compact heat exhange reformer is well suited for small skid-mounted) hydrogen plants. For large scale reforming, tubular reforming remains the most economic solution.
There have been strong efforts to minimize the costs of the tubular reformer. A smaller size is achieved by improving the heat transfer and hence reducing the number of tubes6. Tubular reformers today are designed for operation at average heat fluxes exceeding 37000 BTU/sqft/h) (100,000 kcal/m2/h) almost two times higher than what was industrial practice 20 years ago. Such reformers are built today for capacities up to 270 MM SCFD H2 (300,000 Nm3/h).This can be achieved by using a side wall fired furnace with better control of the tube wall temperatures.
Prereformer. Steam reforming generally involves the risk of carbon formation1. Whisker carbon may be formed on the catalyst and at high temperatures, ethylene from the pyrolysis of higher
Fuel Chemistry Division Preprints 2003, 48(1), 218

Fuel Chemistry Division Preprints 2003, 48(1), 219
hydrocarbons may lead to pyrolytic coke, which may encapsulate the catalyst pellets.
These constraints are eliminated when a prereformer7 is installed before the tubular reformer. All higher hydrocarbons are converted in the prereformer in the temperature range of 750-1000 F. After a prereformer, it is possible to preheat to temperatures around 1200 F. The prereformer offers great feedstock flexibility ranging from natural gas and refinery off-gas to liquid fuels and it also serves as an effective sulfur guard for down-stream catalysts. Catalyst. The typical steam reforming catalyst contains nickel1. The catalyst properties are dictated by the severe operating conditions in the reformer with high temperatures an steam partial pressures. Sintering is an important cause of deactivation of nickel-containing steam reforming catalysts8. The most important parameters are the temperature and the atmosphere in contact with the catalyst. The catalyst support can affect the sintering in various ways by loss of surface area. The sintering ceases when the nickel particle size exceeds a given size. This maximum size increases with temperature8.
Figure 3. Potential energy curves for steam reforming of methane reaction on Ni(111) and Ni(211) surfaces9
The catalyst activity is rarely a limiting factor. The catalyst volume (space velocity) is fixed from the tubular reformer design. The equilibrium conversion at high reforming temperatures is achieved at very high space velocities (above 106 vol CH4/vol cat/h) when extrapolating the intrinsic rates1. In practice, however, the utilization of the activity (as expressed through the effectiveness factor) is smaller than 10% because of transport restrictions. It can be shown by computer simulations that the catalyst is not the limiting factor for the design of a tubular reformer. An increase of the heat flux and the load at a given exit temperature by a factor of two results in an increase in methane leakage by only 10%7.
Conclusions Fundamental studies of the steam reforming reactions have
led to a more consistent understanding of the mechanism of the main reactions and the competing reactions leading to carbon formation. This forms a more solid basis for development of better catalysts and for their optimum use in advanced reforming technologies. It remains a challenge to take advantage of the huge surplus of catalyst activity in present reformer designs and there is still room for developing catalysts being better in withstanding the risk for carbon formation and sulfur poisoning.
References Discussion
The mechanism of steam reforming. Recent studies of the fundamentals of the steam reforming reactions have lead to a more consistent understanding of the mechanism of the main reactions and the competing reactions for carbon formation1,9. The dissociation of methane on nickel surfaces has been investigated extensively, and several details of the reaction pathway are known from fundamental studies, in-situ high resolution electron microscopy and theoretical calculations.
1. Rostrup-Nielsen, J.R.; Nørskov, J.K; Sehested, J., Adv.Catal. 2002, 47 (2002), 65 (in print).
2. Rostrup-Nielsen, J.R.; Rostrup-Nielsen, T. Cattech, 2002, 6 (4) 150 (2002).
3. Rostrup-Nielsen, J.R.; Aasberg-Petersen, K. in: “Fuel Cell Handbook” (John Wiley & Co.) (in press).
4. Rostrup-Nielsen, J.R. Phys. Chem. Chem. Phys,. 2001, 3, 283. 5. Dybkjær, I.; Winter Madsen, S.E.L. Int. J. Hydrocarb. Eng. 3 (1)
56 (1997/1998). In-situ high resolution electron microscopy has provided new
information on sintering mechanisms and for the importance of steps in nucleation of whisker carbon. DFT-calculations have quantified the energetics of methane activation and shown that activation barriers are smaller on surface steps where also carbon is the most stable surface species.
6. Rostrup-Nielsen, T. Hydrocarb.Eng,, .2002, 7 (8) 51. 7. Aasberg-Petersen, K.; Bak Hansen, J.-H.; Christensen, T.S.;
Dybkjær, I.; Seier Christensen, P.S.; Stub Nielsen, C., Winter Madsen, S.E.L.; Rostrup-Nielsen, J.R. Appl.Catal. A. 2001, 221, 379.
8. Sehested, J.; Carlson, A.: Janssens, T.V.W.; Hansen, P.L.; Datye, A.K. J. Catal,. 2001, 197, 200.
Fig. 3 shows the full potential energy diagram of the steam reforming reaction. The figure shows the energies of the intermediates on the surface and activation barriers separating the intermediates along the reaction path. Two different nickel surfaces were considered. The Ni(111) surface represents the stable dense packed surface, whereas the Ni(211) surface contains steps.
9. Bengaard, H.S., Nørskov, J.K.; Sehested, J.; Clausen, B.S.; Nielsen, L.P.; Molenbroek, A.M.; Rostrup-Nielsen, J.R., J. Catal. 2002, 209, 365.
The steps are much more reactive than the close packed surface. All intermediates are also more strongly bound at the steps than on the terraces. For example, adsorbed atomic carbon is much more stable at the steps than at the terraces1. Consequently, the steps should be better nucleation sites for graphite than the terraces. The availability of step sites is therefore important both for a high reaction rate and for graphite formation. This raises the question of where promoters (such as potassium) are located on the surface during the catalytic reaction. Again, these were found to be considerably more stable at a step than on a terrace1,9.
0.2
0.4
0.0
0.2
0.4
0.6
0.0
0.20.4
D e
v /
cm
2 S -1
macro pore
porosity
meso poreporosity
2 4 6 80
1
2
3
4
5
Spec
ific
Ni s
urfa
ce a
rea
estim
ated
by
XRD
dat
a/ m
2 cm
-3
Specific BET surface area / m2cm-3
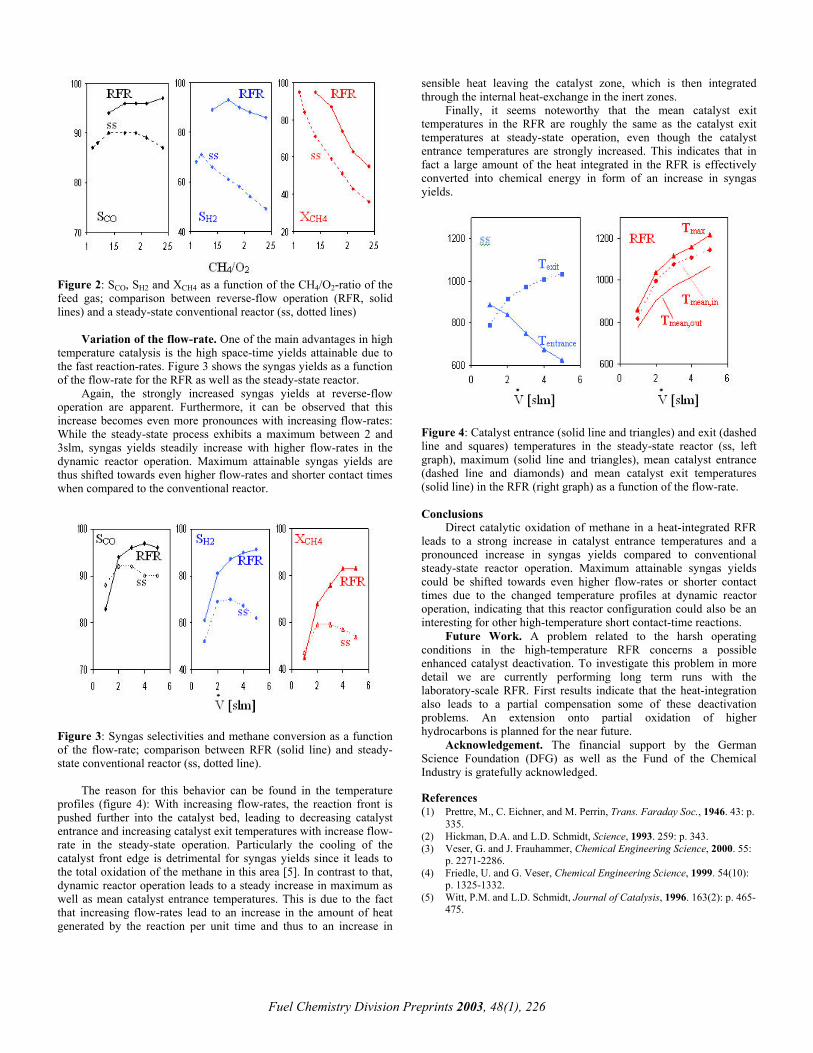
Figure 4. Confirmation of temperature decrease of tube wall using highly active catalyst in electrically heated pilot plant with similar tube diameter to that in commercial use. Operating conditions; P=2.1MPa, S/C=3.0, W/F=750(g/g s).
Conventional catalyst; tube, gas, H2 concentration ISOP catalyst; tube, gas, H2 concentration
0.0 0.5 1.0 1.5 2.0 2.5 3.0 3.5500
600
700
800
900
1000
Tem
pera
ture
/ C
Tube length / m
0.0 0.5 1.0 1.5 2.0 2.5 3.0 3.50
20
40
60
80
100
H 2
conc
enra
tion
/ dry
%
Tube length / m
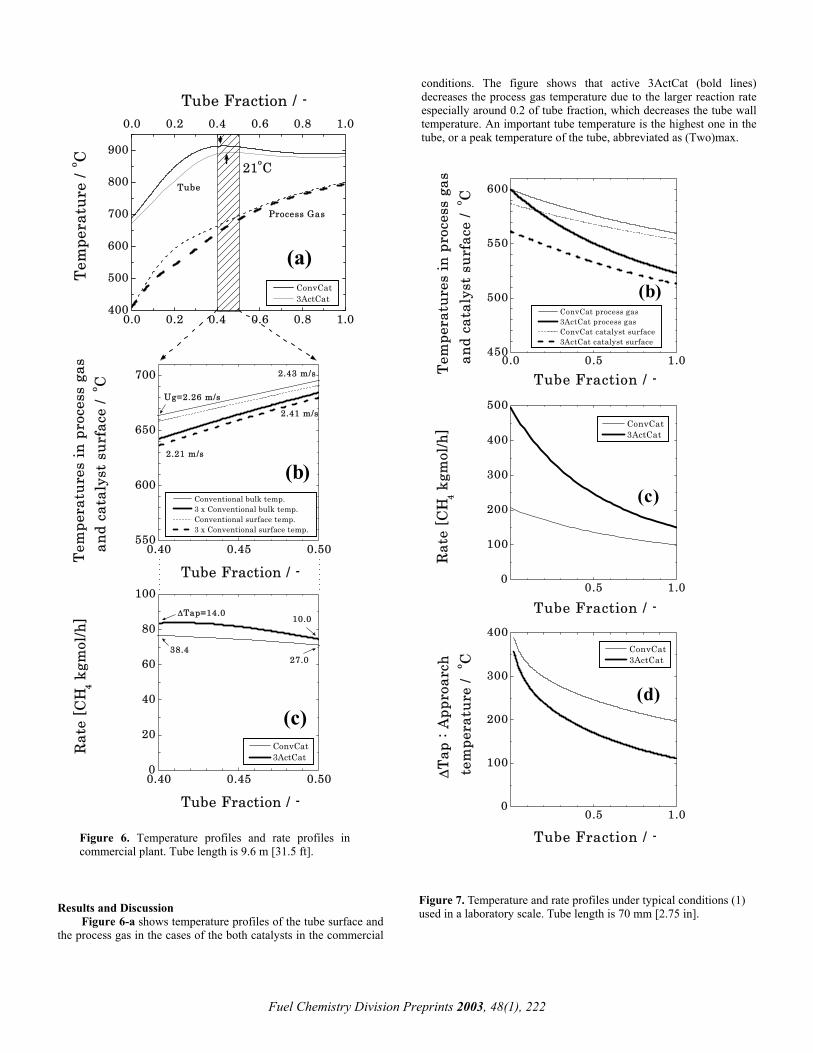
Figure 3. Relation between specific BET surface area and Ni surface area. Ni content (8.2 wt%) is controlled as the same each other.
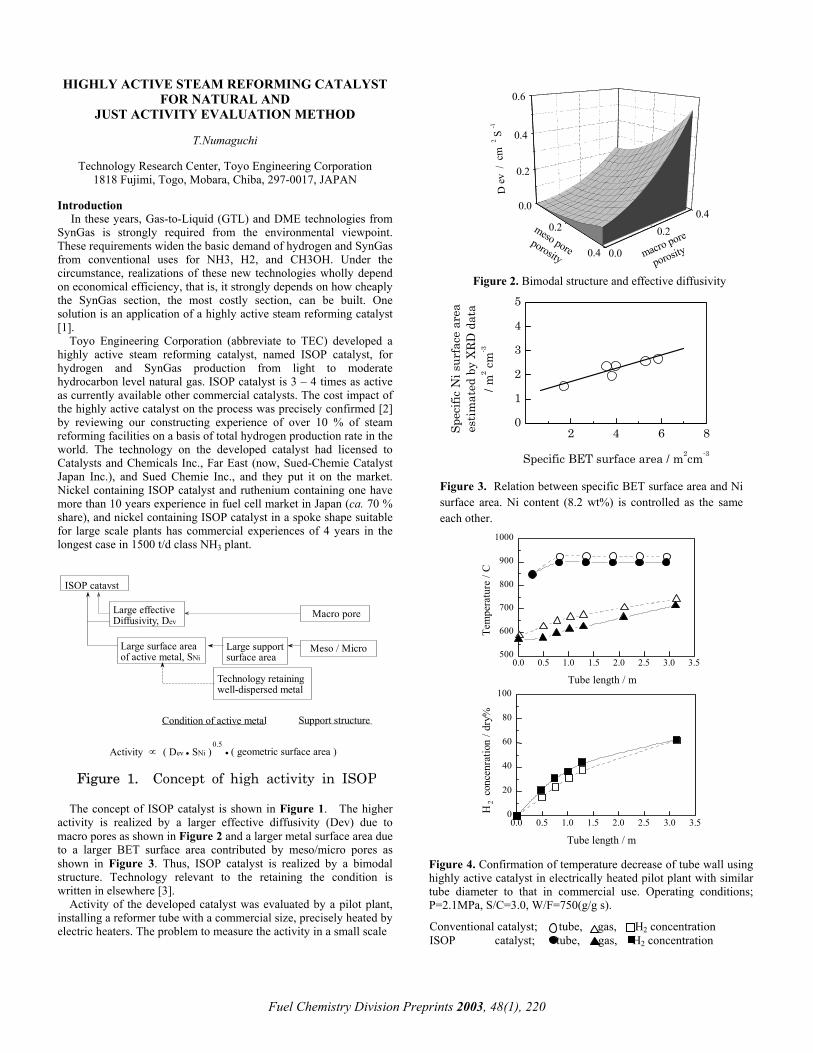
Figure 2. Bimodal structure and effective diffusivity
HIGHLY ACTIVE STEAM REFORMING CATALYST FOR NATURAL AND
JUST ACTIVITY EVALUATION METHOD
T.Numaguchi
Technology Research Center, Toyo Engineering Corporation 1818 Fujimi, Togo, Mobara, Chiba, 297-0017, JAPAN
Introduction In these years, Gas-to-Liquid (GTL) and DME technologies from SynGas is strongly required from the environmental viewpoint. These requirements widen the basic demand of hydrogen and SynGas from conventional uses for NH3, H2, and CH3OH. Under the circumstance, realizations of these new technologies wholly depend on economical efficiency, that is, it strongly depends on how cheaply the SynGas section, the most costly section, can be built. One solution is an application of a highly active steam reforming catalyst [1].
Toyo Engineering Corporation (abbreviate to TEC) developed a highly active steam reforming catalyst, named ISOP catalyst, for hydrogen and SynGas production from light to moderate hydrocarbon level natural gas. ISOP catalyst is 3 – 4 times as active as currently available other commercial catalysts. The cost impact of the highly active catalyst on the process was precisely confirmed [2] by reviewing our constructing experience of over 10 % of steam reforming facilities on a basis of total hydrogen production rate in the world. The technology on the developed catalyst had licensed to Catalysts and Chemicals Inc., Far East (now, Sued-Chemie Catalyst Japan Inc.), and Sued Chemie Inc., and they put it on the market. Nickel containing ISOP catalyst and ruthenium containing one have more than 10 years experience in fuel cell market in Japan (ca. 70 % share), and nickel containing ISOP catalyst in a spoke shape suitable for large scale plants has commercial experiences of 4 years in the longest case in 1500 t/d class NH3 plant.
The concept of ISOP catalyst is shown in Figure 1. The higher activity is realized by a larger effective diffusivity (Dev) due to macro pores as shown in Figure 2 and a larger metal surface area due to a larger BET surface area contributed by meso/micro pores as shown in Figure 3. Thus, ISOP catalyst is realized by a bimodal structure. Technology relevant to the retaining the condition is written in elsewhere [3].
Meso / Micro
Macro pore
ISOP catayst
Condition of active metal Support structure
Large support surface area
Technology retaining well-dispersed metal
Large surface area of active metal, SNi
Large effective Diffusivity, Dev
Activity ∝ ( Dev • SNi ) 0.5
• ( geometric surface area )
Figure 1. Concept of high activity in ISOP
Activity of the developed catalyst was evaluated by a pilot plant, installing a reformer tube with a commercial size, precisely heated by electric heaters. The problem to measure the activity in a small scale
Fuel Chemistry Division Preprints 2003, 48(1), 220

0 200 4005,000
10,00015,000
20,00025,000
0
1,000
2,000
3,000
4,000R
eact
ion
Rat
e
Tim e / h
SpokeISO Pcatalyst
Spokeconventionalcatalyst
changingscale
Pilo t operation
Evaluation ofcom m ercial plan t
L ab. evaluationof discharged catalysts
Figure 5. Activity of ISOP catalyst. Solid lines are estimated activities from the pilot operations. Dotted lines mean a 95% confidence limit range. is discussed later, but on the other hand, it is also true that the precise temperature measurement of tubes, which is indispensable, in a commercial plant requires substantial know-how and experience because of fluctuation of the tube temperature due to not always perfectly adjusted hundreds of burners, unstable flue gas flow under a delicate pressure balance in a box furnace, etc. In consequence, the most reliable evaluating method of is measuring temperature decrease due to endothermic reaction using a tube similar to a commercial size and a precise heating by electrical heaters. By the pilot plant, as a matter of course, the precise temperature measurement is required by checking out Shunt Error problem, etc. Figure 4 shows that the tube having lower surface temperature by 25 C using ISOP catalyst, decreasing lower process temperature by 60 C, produced the same hydrogen to that by the conventional catalyst at the outlet. The highly active catalyst, thus, proved to decrease the tube temperature as estimated by the simulation result.
After confirming the activity precisely using the pilot plant, ISOP catalyst was charged in a reformer of a 1500 ton/day-class commercial NH3 plant and operated for four years successfully as shown in Figure 5, only indicated for two years performance. The mechanical strength was higher than conventional one after two years operation [1] and carbon content was less than the conventional one as indicated in Table 1. Not only in this experience, but also ISOP catalyst charged in other commercial plants has been successfully operated. Through the development of the catalyst, it became clear that the activity evaluation of the steam reforming catalysts is much more
difficult than our own estimate, especially by laboratory scale experiments and just evaluation is hardly executed in many cases. Further, this is not well recognized even by researchers concerned in the steam reforming. For example, discussions on benefit estimation require precise reaction rate from a viewpoint of chemical engineering. We evaluated the activities in the laboratory, the pilot and the commercial scales. As seen in Figure 5, every evaluated activity in
these scales agrees one another because experimental data were analyzed according to chemical engineering methods [4]. Without analysis from the chemical engineering viewpoint, the observed apparent reaction rate in the laboratory experiment has 100% of error to that in the pilot operation very close to the commercial scale. It was concluded [1] that there are only two ways to evaluate the steam reforming catalyst correctly enough to estimate commercial performance: one is to analyze and evaluate data obtained in the laboratory scale experiments by making the most of the chemical engineering methods. The other is just to measure data in the pilot scale experiments close to commercial conditions. In the latter case, the observed result is directly applicable to the benefit estimation. This is true but the both methods are not handy. In this paper, reason why conventional evaluation in laboratory scale is not suitable for predicting performance in a commercial scale is discussed. A next-best method, that is, appropriate conditions in laboratory scale are also discussed for a just evaluation through simulation works.
Methods
The following kinetics and simulating conditions are applied to obtain temperatures of the reforming tube, process gas, catalyst surface and reaction rate in commercial plants and laboratory scale experiments for the discussion of the appropriate conditions in laboratory scale.
Kinetics. Rate equations of the steam reforming reaction and shift reaction of a conventional catalyst (abbreviated as “ConvCat”) in a shape of multi-holes with a size of 5/8 x 1/4 in. applied to Figure 5 are set on the basis for the simulation of commercial reformer. That of the steam reforming for a catalyst having three times higher activity (abbreviated as “3ActCat”) is obtained by triplication of that of ConvCat. For the laboratory scale evaluation assuming use of a fresh catalyst divided into several pieces, the activities are assumed to have a three times higher activity than that after a deactivation in the plant. Simulation. According to a designing procedure [2] of the reformer tube to balance the activity and the heat transfer performance, which is basically common in any reformer design, temperature profiles and reaction rate profiles of the both catalysts are simulated under typical commercial conditions of a top firing reformer for a 1500 ton/day class NH3: Tube ID = 80.5 mm (3.17 inch), Feedstock = light natural gas (CH4 = 94.6 %), Process gas Temperature at inlet = 410C (770F), P = 35.0 atom (514.4 psiA), S/C = 3.0, GHSV0 (“0” means at 0C, 1atom) = 7900 (1/h). For the evaluations in the laboratory scale, the following conditions are applied. These are examined under adiabatic conditions for an easy judgment, which means a comparison of the activities can be basically obtained from a comparison of temperature decreases between inlet and outlet of a catalyst bed. T able 1. Carbon contents in spent catalysts in 2 years
Conventional Catalyst
ISOP Catalyst
Carbon contents
0.12 wt %
0.038 wt %
(1) Typical conditions conventionally used in a small laboratory: Tube (3/4 inch) ID = 21.4mm (2.75 inch), Feedstock = CH4 (99.9 %), Process gas Temperature at inlet = 600 C (1112F), P = 10.0 atom (147.0 psiA), S/C = 3.0, GHSV0 = 15000 (1/h) [accordingly Inlet gas velocity: Ug = 0.1 m/s].
(2) Conditions increasing GHSV0 by 30 times from the conditions (1): GHSV0 = 300000 (1/h), the others are the same as conditions (1) [Inlet Ug = 2m/s].
(3) Conditions increasing GHSV0 by 30 times and decreasing the process gas temperature from the conditions (1): GHSV0 = 300000 (1/h), process gas Temperature at inlet = 500 C (932F), the others are the same as conditions (1).
Fuel Chemistry Division Preprints 2003, 48(1), 221
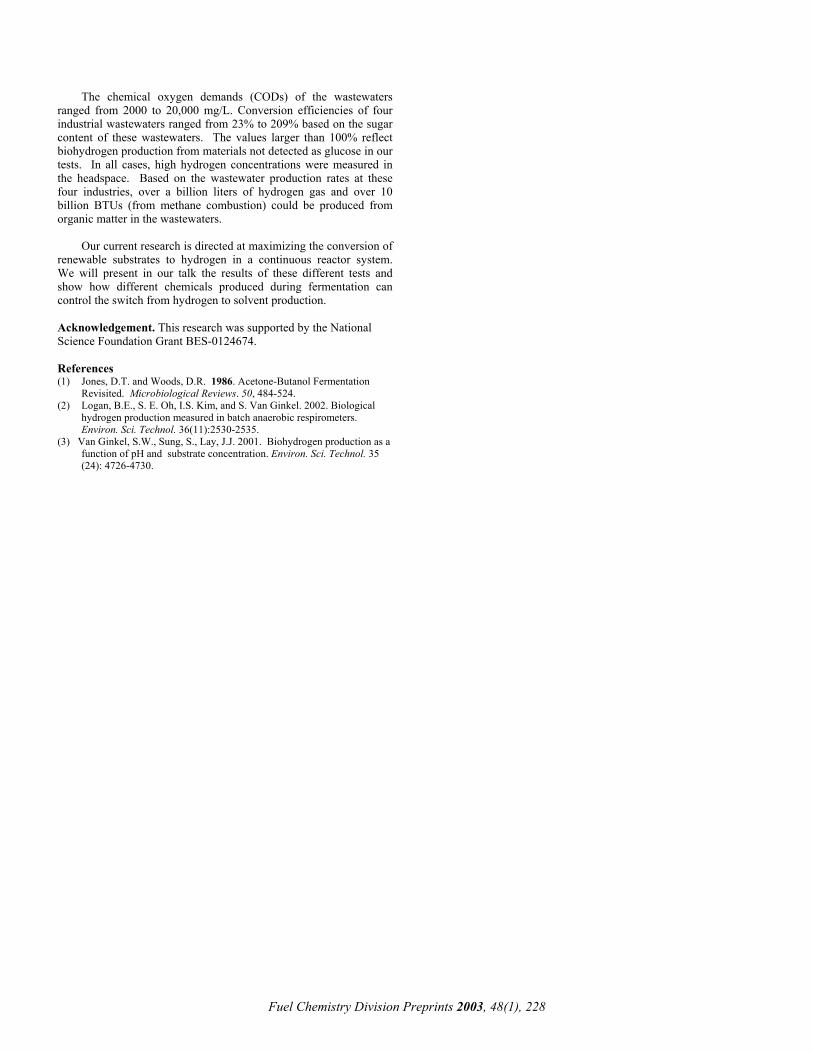
Results and Discussion Figure 6-a shows temperature profiles of the tube surface and the process gas in the cases of the both catalysts in the commercial
conditions. The figure shows that active 3ActCat (bold lines) decreases the process gas temperature due to the larger reaction rate especially around 0.2 of tube fraction, which decreases the tube wall temperature. An important tube temperature is the highest one in the tube, or a peak temperature of the tube, abbreviated as (Two)max.
0.40 0.45 0.500
20
40
60
80
100
27.0
10.0
38.4
∆Tap=14.0
(c)
Rat
e [C
H4 k
gmol
/h]
Tube Fraction / -
ConvCat 3ActCat
0.40 0.45 0.50550
600
650
700
(b)
2.41 m/s
2.43 m/s
2.21 m/s
Ug=2.26 m/s
Tem
pera
ture
s in
pro
cess
gas
and
cata
lyst
sur
face
/ o C
Tube Fraction / -
Conventional bulk temp. 3 x Conventional bulk temp. Conventional surface temp. 3 x Conventional surface temp.
0.0 0.2 0.4 0.6 0.8 1.0400
500
600
700
800
900
0.0 0.2 0.4 0.6 0.8 1.0
Process Gas
Tube
Tube Fraction / -
(a)
21oC
Tem
pera
ture
/ o C
ConvCat 3ActCat
100
200
300
400
Tap
: App
roar
chte
mpe
ratu
re /
o C
(d)
ConvCat 3ActCat
0.5 1.00
100
200
300
400
500
(c)
Rat
e [C
H4 k
gmol
/h]
Tube Fraction / -
ConvCat 3ActCat
0.0 0.5 1.0450
500
550
600
(b)
Tem
pera
ture
s in
pro
cess
gas
and
cata
lyst
sur
face
/ o C
Tube Fraction / -
ConvCat process gas 3ActCat process gas ConvCat catalyst surface 3ActCat catalyst surface
0.5 1.00
∆
Tube Fraction / -Figure 6. Temperature profiles and rate profiles in commercial plant. Tube length is 9.6 m [31.5 ft].
Figure 7. Temperature and rate profiles under typical conditions (1) used in a laboratory scale. Tube length is 70 mm [2.75 in].
Fuel Chemistry Division Preprints 2003, 48(1), 222

(Two)max appears around 0.45 of the tube fraction in the both cases and 3ActCat decreases (Two)max by 21 C, which leads the good deal of profits. The shaded area in the figure from a tube fraction 0.4 to 0.5 is in this paper called “peak zone”. The peak zone is enlarged and expressed in detail in Figure 6-b and-c. The interfacial gradient of temperature in the solid-fluid film, well known to be large [5], is described by the heat balance equation [4]. By solving the equation catalyst surface temperatures are calculated. Figure 6-b shows the process gas temperatures and the catalyst surface temperatures. In Figure 6-b a temperature difference between the process gas temperatures and the catalyst surface temperature in each catalyst is close, 4.5 - 6.0C. Reaction rates corresponding to them are close each other and values are in a range of 70 - 85 [CH4-Kgmol/h] shown in Figure 6-c. This is understood that conditions of them are relatively close to equilibriums at the inlet of the “peak zone” as judged from each “approach temperature”, abbreviated as delta-Tap in the figure. The approach temperature, represented by the difference between the gas temperature and the equilibrium temperature corresponding to the gas composition, indicates degree of approach to equilibrium by temperature. The larger is the approach temperature, the more far from equilibrium is the state. Zero means the state of equilibrium. While the process gas temperatures are high such as 640 – 700C, the approach temperatures of them are small enough to explain the small rates due to small Drive term in the rate equations: cf. Rate = (Arrhenius term) x (Drive term) / (Adsorption term). In the commercial plant, thus, a value of the Drive term around the peak temperature is small, by which the reaction rate is not so large, while the process gas temperatures are high in the both, and this leads the interfacial temperature gradient small along with higher gas linear velocity (Ug) of above 2 m/s in the both cases. This is a reason why the highly active catalyst demonstrates its true abilities in the commercial plant. A similar conclusion is obtained in a side-firing reformer as well. Results under (1) typical conditions used conventionally in laboratory scale are shown in Figure 7. 3ActCat almost reaches to the equilibrium showing approach temperature less than 1C in a half part of the catalyst bed, which is so different from the state in the commercial plant shown in Figure 6-c that no just evaluation is carried out. To avoid the state under the conditions (1) commonly applied in the laboratory evaluation, GHSV0 is by 30 times increased in the conditions (2). Under the conditions, the approach temperatures become much larger than those in conditions (1) and the rates at the inlet are about 3 – 6 times as large as those of ConvCat and 3ActCat in conditions (1) as shown in Figure 8. This leads the catalyst surface temperature of 3ActCat by 40 C lower than that of the process gas at the inlet despite of a close Ug value to that in the commercial conditions, while that of ConvCat is 12 C: cf. 4.5 – 6.0 C for the both catalysts in the commercial plant. This means that 3ActCat is evaluated with a handicap of 28 C compared with ConvCat under conditions (2). Too large rates due to the larger Drive term are a reason of this situation. If the evaluation would be carried out using a mixed gas having a similar composition to that at the inlet of the peak zone in the commercial plant, the rates would be appropriate and a just evaluation would be possible. Since preparation of the mixed gas is not handy so that a decreasing temperature by 100 C is selected as condition (3) in order to decrease Arrhenius term. Results are shown in Figure 9. Rate for ConvCat at the inlet is 34.8 [CH4-Kgmol/h] and that for 3ActCat 114.2, that is, each ratio of the rate in conditions (3) to that in commercial conditions is 34.8/76.8 = 0.45, 114.2/83.9 = 1.4 respectively. While the conditions (3) are still tough to the highly active catalyst, 3ActCat, and tender to ConvCat, the conditions are
acceptable. A ratio of average rate of each is 91.6/31.6 = 2.9, which corresponds to a ratio of an adiabatic temperature decrease of each, 22.7/8.0 = 2.8.
0.5 1.00
100
200
300
400
51015
20
40(d)
∆Ta
p : A
ppro
arch
tem
pera
ture
/ o C
Tube Fraction / -
ConvCat 3ActCat
0.5 1.00
100
200
300
400
500
(c)
Rat
e [C
H4 k
gmol
/h]
Tube Fraction / -
ConvCat 3ActCat
0.0 0.5 1.0450
500
550
600
(b)
Tem
pera
ture
s in
pro
cess
gas
and
cata
lyst
sur
face
/ o C
Tube Fraction / -
ConvCat process gas 3ActCat process gas ConvCat catalyst surface 3ActCat catalyst surface
Figure 8. Temperature and rate profiles under conditions increasing GHSV0 by 30 times from conditions (1).
Fuel Chemistry Division Preprints 2003, 48(1), 223

0.5 1.00
100
200
300
400
∆Ta
p : A
ppro
arch
tem
pera
ture
/ o C
(d)
Tube Fraction / -
ConvCat 3ActCat
0.5 1.00
100
200
300
400
500
(c)
Rat
e [C
H4 k
gmol
/h]
Tube Fraction / -
ConvCat 3ActCat
0.0 0.5 1.0350
400
450
500
(b)
Te
mpe
ratu
re in
pro
cess
gas
and
cata
lyst
sur
face
/ o C
Tube Fraction / -
ConvCat process gas 3ActCat process gas ConvCat catalyst surface 3ActCat catalyst surface
Figure 9. Temperature and rate profiles under conditions increasing GHSV0 by 30 times and decreasing process gas temperature to 500C from conditions (1).
Thus, under typical conditions conventional in a laboratory evaluation such as GHSV0 = 15000 (1/h), 600C using steam and CH4, the reaction rate of steam reforming is too large to evaluate the activity observed in the peak zone of the commercial plant, especially for the highly active catalyst. To avoid the situation, selecting conditions realizing a similar reaction rate to that in the commercial plant is required. Increasing GHSV0 in order to avoid too close state to equilibrium, and decreasing the process gas temperature in order to make the interfacial temperature gradient similar to that in the commercial case, are effective conditions, for example. Conclusions The activity evaluation of the steam reforming catalysts is much more difficult than our own estimate, especially by laboratory scale experiments and just evaluation is hardly executed in many cases. This is caused by the following situation. The reaction rate in a commercial tube where temperature shows the maximum value in the tube is not so large in the commercial plant because the reaction proceeds to some extent before reaching the position, which makes Drive term in a rate equation small. This leads the interfacial temperature gradient small along with a higher gas linear velocity even for a highly active catalyst, which is a reason why the highly active catalyst demonstrates its true abilities in the commercial plant. On the other hand, typical evaluating conditions in laboratory scale are not infrequently those that make the reaction rate too fast, which makes the state too close to equilibrium to evaluate, or make the interfacial temperature gradient too large derived from much more proceeding of the endothermic reaction than that in commercial operations and give much handicap to a highly active catalyst. Besides the best evaluating method using the pilot plant electrically heated, the next-best method in a laboratory scale, it’s handy, is selecting conditions realizing a similar reaction rate to that in the commercial plant by increasing GHSV0 and/or decreasing the process gas temperature in order to make the interfacial temperature gradient similar to that in the commercial case. References (1) Numaguchi, T. Catalysis Survey from Japan 2001, 5 (1), 59. (2) Shoji, K.; Hirota, Y.; and Numaguchi, T. Stud. Surf. Sci. Catal. 1999,
121, 449. (3) Numaguchi, T. Catalysts & Catalysis 2001, 43 (4), 287. (4) Numaguchi, T.; and Kikuchi, K. Chem. Eng. Sci. 1988, 43, 2295. (5) Rostrup Nielsen, J. R. NATO Advanced Study Workshop, Nov. 1-6,
1992, Vauclause, France.
Fuel Chemistry Division Preprints 2003, 48(1), 224

Syngas Production by Direct Oxidation of Methane in a Reverse-Flow Reactor
Dirk Neumann and Götz Veser
Chemical Engineering Dept.
1249 Benedum Hall, University of Pittsburgh Pittsburgh, PA 15261
Introduction
The catalytic conversion of methane to synthesis gas is a key technology in the petrochemical industry, with its importance further increasing in coming decades due to the increasing significance of natural gas as a feedstock for petrochemical processes. Currently, syngas is typically produced via steam reforming of methane, a strongly endothermic reaction in which methane reacts with water over Ni-based catalysts to CO and H2 at a molar ratio of 1:3:
CH4 + H2O Ξ CO + 3 H2 (∆HR = + 206 kJ/mol) This primary reforming stage is then typically followed by one or several secondary water-gas-shift stages to adjust the H2/CO ratio to the stoichiometric value of 2.0, which is needed for most downstream processes like methanol synthesis and Fischer-Tropsch processes.
An interesting alternative for the production of syngas is the direct partial oxidation of methane [1]. Here, methane reacts directly with oxygen or air to form CO and H2 in a one-step reaction, directly yielding an H2/CO ratio of 2:
CH4 + 0.5 O2 Ξ CO + 2 H2 (∆HR = -37 kJ/mol) The reaction is catalysed by noble metals (Pt, Rh) and is characterized by extreme reaction temperatures exceeding 1000°C, which results in very high reaction rates and thus extremely short residence times in the millisecond range [2].
The extreme temperatures observed at autothermal conditions arise due to a complex interaction of total and partial oxidation pathways: A preferential adsorption of oxygen on the catalyst surface results in a local over-oxidation at the catalyst front edge, which leads to the strongly exothermic total oxidation of parts of the methane feed. While this is by definition detrimental for syngas yields, it also leads to the high reaction temperatures which are thermodynamically necessary to shift the reaction route towards the mildly exothermic partial oxidation of methane. The need for sufficiently high temperatures therefore effectively limits the syngas yields attainable at autothermal reactor operation [3].
This thermodynamic limitation can be overcome through heat-integration in a multifunctional reactor configuration. We have previously been able to show that a counter-current heat-exchange reactor leads to improved methane conversions and syngas selectivities [4]. We have now extended these studies onto the study of direct oxidation of methane in a dynamically operated reverse-flow reactor (RFR). In this reactor configuration, a very efficient heat-integration is achieved by periodically switching the flow-direction of the gases through the reactor, while heat-reservoirs (so-called inert zones) before and after the catalyst as well as the catalyst bed itself act as regenerative heat-exchangers. The experimental investigation and the feasibility of syngas production via direct oxidation of methane in a small-scale RFR is the focus of this paper. Experimental
The experimental setup used for the investigations is shown in figure 1. The reactor consists of a quartz-glass tube with catalyst and inert-zones, which is then inserted into a metal housing. The catalyst used was a Pt-coated alumina foam monolith (45 ppi, 1.7cm diameter, 1cm long), which had been prepared by standard impregnation procedures. The inert zones consisted of cordierite
extruded monoliths (1.7 cm diameter, 11cm long). The flow-reversal was accomplished with 4 valves, positioned as indicated in figure 1. Reactor operation and data acquisition were computer controlled.
The reactants (CH4 and air) were fed with standard mass-flow controllers and product gases were analyzed with mass spectrometry for time-resolved qualitative measurements and gas chromatography for quantitative measurements. For direct comparison of the results at reverse-flow operation with results from a conventional reactor, the same reactor setup was used for steady-state experiments. In this way, it was assured that all differences between the steady-state results ad the results at unsteady conditions were exclusively due to the differences in reactor operation rather than differences in the experimental setup.
Figure 1: Schematic of the experimental Reverse-Flow Reactor system used for investigating the partial oxidation of methane
Using this reactor setup, syngas selectivities as well as methane
conversions were investigated as a function of the CH4/O2-ratio of major reactor operating parameters, such as the feed gas composition, cycling periodicity and total gas flow-rate. Results and Discussion
Variation of the CH4/O2 feed gas ratio. Figure 2 shows selectivities towards the partial oxidation products as well as methane conversion as a function of the CH4/O2 ratio of the feed gas (flow-rate 4slm, cycling period τ/2 = 15s; the stoichiometric point for partial oxidation is at CH4/O2 = 2.0, for total oxidation at 0.5). The results for the RFR are shown in comparison to results obtained at conventional steady-state operation.
The non-stationary process shows a strong increase in syngas selectivities as well as methane conversion over the whole range of CH4/O2 ratios investigated when compared to a steady-state reactor without heat-integration. CO selectivities are raised by about 5%, H2 selectivities by up to 30%, and CH4 conversions by about 20%. This strong increase in syngas yields can be traced back to the elevated temperatures attained though the excellent heat-integration resulting from the dynamic reactor operation.
Fuel Chemistry Division Preprints 2003, 48(1), 225
Fuel Chemistry Division Preprints 2003, 48(1), 226
Figure 2: SCO, SH2 and XCH4 as a function of the CH4/O2-ratio of the feed gas; comparison between reverse-flow operation (RFR, solid lines) and a steady-state conventional reactor (ss, dotted lines)
Variation of the flow-rate. One of the main advantages in high
temperature catalysis is the high space-time yields attainable due to the fast reaction-rates. Figure 3 shows the syngas yields as a function of the flow-rate for the RFR as well as the steady-state reactor.
Again, the strongly increased syngas yields at reverse-flow operation are apparent. Furthermore, it can be observed that this increase becomes even more pronounces with increasing flow-rates: While the steady-state process exhibits a maximum between 2 and 3slm, syngas yields steadily increase with higher flow-rates in the dynamic reactor operation. Maximum attainable syngas yields are thus shifted towards even higher flow-rates and shorter contact times when compared to the conventional reactor.
Figure 3: Syngas selectivities and methane conversion as a function of the flow-rate; comparison between RFR (solid line) and steady-state conventional reactor (ss, dotted line).
The reason for this behavior can be found in the temperature profiles (figure 4): With increasing flow-rates, the reaction front is pushed further into the catalyst bed, leading to decreasing catalyst entrance and increasing catalyst exit temperatures with increase flow-rate in the steady-state operation. Particularly the cooling of the catalyst front edge is detrimental for syngas yields since it leads to the total oxidation of the methane in this area [5]. In contrast to that, dynamic reactor operation leads to a steady increase in maximum as well as mean catalyst entrance temperatures. This is due to the fact that increasing flow-rates lead to an increase in the amount of heat generated by the reaction per unit time and thus to an increase in
sensible heat leaving the catalyst zone, which is then integrated through the internal heat-exchange in the inert zones.
Finally, it seems noteworthy that the mean catalyst exit temperatures in the RFR are roughly the same as the catalyst exit temperatures at steady-state operation, even though the catalyst entrance temperatures are strongly increased. This indicates that in fact a large amount of the heat integrated in the RFR is effectively converted into chemical energy in form of an increase in syngas yields.
Figure 4: Catalyst entrance (solid line and triangles) and exit (dashed line and squares) temperatures in the steady-state reactor (ss, left graph), maximum (solid line and triangles), mean catalyst entrance (dashed line and diamonds) and mean catalyst exit temperatures (solid line) in the RFR (right graph) as a function of the flow-rate. Conclusions
Direct catalytic oxidation of methane in a heat-integrated RFR leads to a strong increase in catalyst entrance temperatures and a pronounced increase in syngas yields compared to conventional steady-state reactor operation. Maximum attainable syngas yields could be shifted towards even higher flow-rates or shorter contact times due to the changed temperature profiles at dynamic reactor operation, indicating that this reactor configuration could also be an interesting for other high-temperature short contact-time reactions.
Future Work. A problem related to the harsh operating conditions in the high-temperature RFR concerns a possible enhanced catalyst deactivation. To investigate this problem in more detail we are currently performing long term runs with the laboratory-scale RFR. First results indicate that the heat-integration also leads to a partial compensation some of these deactivation problems. An extension onto partial oxidation of higher hydrocarbons is planned for the near future.
Acknowledgement. The financial support by the German Science Foundation (DFG) as well as the Fund of the Chemical Industry is gratefully acknowledged. References (1) Prettre, M., C. Eichner, and M. Perrin, Trans. Faraday Soc., 1946. 43: p.
335. (2) Hickman, D.A. and L.D. Schmidt, Science, 1993. 259: p. 343. (3) Veser, G. and J. Frauhammer, Chemical Engineering Science, 2000. 55:
p. 2271-2286. (4) Friedle, U. and G. Veser, Chemical Engineering Science, 1999. 54(10):
p. 1325-1332. (5) Witt, P.M. and L.D. Schmidt, Journal of Catalysis, 1996. 163(2): p. 465-
475.

A GREEN AND SUSTAINABLE ENERGY SYSTEM BUILT UPON BIOLOGICAL HYDROGEN
PRODUCTION
Bruce E. Logan, Steven W. Van Ginkel, Sangeun Oh
COE Environmental Institute, 212 Sackett Bldg, Pennsylvania State University, University Park, PA, 16802
Introduction
The production of petroleum products from oil reserves is
expected to peak during the next 10 to 20 years. While vast reserves of other forms of carbon-based materials are well known, these will be costly to obtain. In addition, there is a global drive to reduce carbon dioxide emissions in order to slow or reverse global warming. Only energy sources that do not produce a net gain in CO2 release will be useful in addressing global warming. New energy sources that can be used will include wind, solar, geothermal, hydraulic, tidal, and other non-carbon based processes to produce electricity. There will still remain a need for more mobile sources of energy, and hydrogen gas can be an important contributor to this energy area. However, in order for hydrogen to become a truly “green” source of energy, more environmentally sustainable techniques must be developed for its production.
Hydrogen is currently manufactured primarily using non-
sustainable technologies such as hydrocarbon reforming and electrolysis. However, hydrogen can be formed and recovered in large quantities during anaerobic fermentation of organic substrates. Up to one-third of the energy in a sugar-based material can be recovered as hydrogen in a fermentation process. This hydrogen can then be used to generate electricity in high efficiency fuel cells. The remaining energy value of the material can be biologically converted to methane and recovered either through methane combustion or through methane-reforming fuel cells. Fermentation of sugars to produce hydrogen release CO2 and volatile fatty acids (specifically acetic and butyric acid), but there is no net change in CO2 if crop based products are used in the process. During the later stages of the fermentation, the culture may switch its metabolism and produce other final products such as ethanol, acetone, and butanol. These latter products have been commercially produced for profit using anaerobic reactors. For example, acetone and butanol were produced from maize and used as solvents and fuel extenders during World War II (1). Commercial production of ethanol is currently not economical, but part of the reason is that products such as ethanol have less energy than hydrogen.
The infrastructure for biological hydrogen production does not
yet exist, so research is needed on methods to maximize hydrogen production from fermentation processes. This must be done in an economical method so that the cost of producing the hydrogen is competitive with other energy production methods. The main costs in biological hydrogen production are for the substrate and the fermentation infrastructure.
We have been examining biological hydrogen production from
wastewaters produced by food processing industries for two reasons. First, many of these industries already spend money on wastewater treatment to reduce the oxygen demand of their wastewaters. Thus, the treatment of these wastewaters represents an expense to the company, and any value derived from the wastewater represents a benefit to the company and a potential profit. Second, many
Time (h)0 20 40 60 80 100 120 140
Bio
gas (
mL)
0
100
200
300
400
500
Perc
enta
ge o
f H2
(%)
0
20
40
60
80
Biogas (mL)Percentage of H2 (%)
companies already have the necessary pipes and plumbing needed for biological treatment. Thus, the cost of producing hydrogen represents only additional materials that must be added onto the system, not the cost of a complete system.
Figure 1. Biogas production and hydrogen percentage curves using apple processing wastewater as the substrate.
In order to investigate the potential for hydrogen production
from food processing wastewaters, we conducted a series of batch and chemostat experiments with simulated and real wastewaters. We did not use pure cultures, but instead found it was sufficient to use ordinary soil as an inoculum for hydrogen producing processes. Methods
Tests were conducted using various substrates and a heat-
shocked soil inoculum (2). The soil was baked for two hours at 100°C to kill non-spore-forming, hydrogen-consuming methanogens (3). The spore-soil suspension was then sieved through a #20 mesh (850 µm) mesh and 10 grams of this spore suspension was used to inoculate 250 mL serum bottles. In tests with defined substrates we added substrates to the bottles at a concentration of 4 g-COD/L (1 g-COD per bottle). For the experiments using real wastewaters, we used concentrations around these values. For example, with an apple wastewater we used a concentration of 7.2 g-COD/L. Solutions were buffered with 0.05 M 2-(N-morpholino)ethanesulfonic acid monohydrate (MES) (J.T. Baker) and adjusted to a pH=6.0 using 1M NaOH.
Results and Discussion
An example of our results using apple processing wastewater is
shown in Figure 1. Hydrogen in the headspace reached a maximum of 62% (by volume), with a total of 240 mL of pure hydrogen gas produced during the batch test. With defined substrates, the highest volumes of hydrogen were produced with glucose and sucrose, 158 mL and 142 mL, respectively. The fermentation of molasses produced 151 mL of hydrogen, which is comparable to the amounts produced using glucose and sucrose. Molasses has been extensively used in the production of ethanol, acetone, and butanol as discussed previously. Less hydrogen was produced using the other substrates.
Fuel Chemistry Division Preprints 2003, 48(1), 227
Fuel Chemistry Division Preprints 2003, 48(1), 228
The chemical oxygen demands (CODs) of the wastewaters
ranged from 2000 to 20,000 mg/L. Conversion efficiencies of four industrial wastewaters ranged from 23% to 209% based on the sugar content of these wastewaters. The values larger than 100% reflect biohydrogen production from materials not detected as glucose in our tests. In all cases, high hydrogen concentrations were measured in the headspace. Based on the wastewater production rates at these four industries, over a billion liters of hydrogen gas and over 10 billion BTUs (from methane combustion) could be produced from organic matter in the wastewaters.
Our current research is directed at maximizing the conversion of
renewable substrates to hydrogen in a continuous reactor system. We will present in our talk the results of these different tests and show how different chemicals produced during fermentation can control the switch from hydrogen to solvent production. Acknowledgement. This research was supported by the National Science Foundation Grant BES-0124674. References (1) Jones, D.T. and Woods, D.R. 1986. Acetone-Butanol Fermentation
Revisited. Microbiological Reviews. 50, 484-524. (2) Logan, B.E., S. E. Oh, I.S. Kim, and S. Van Ginkel. 2002. Biological
hydrogen production measured in batch anaerobic respirometers. Environ. Sci. Technol. 36(11):2530-2535.
(3) Van Ginkel, S.W., Sung, S., Lay, J.J. 2001. Biohydrogen production as a function of pH and substrate concentration. Environ. Sci. Technol. 35 (24): 4726-4730.

HYDROGEN PRODUCTION BY WATER DISSOCIATION USING MIXED-CONDUCTING
MEMBRANES
We made composites of metal and oxygen ion conductor to develop mixed oxygen ion-electron conducting membranes. In our study of hydrogen production from water splitting with these membranes, we used hydrogen as a model feed gas to obtain a high pO2 gradient across the membrane. Alternatively, another reducing feed gas such as methane could be used to maintain a high pO2 gradient across the membrane, in which case hydrogen and syngas could be produced in the sweep and feed gas, respectively. This paper presents the results of hydrogen production from water splitting with cermet membranes.
U. (Balu) Balachandran, T. H. Lee, S. Wang, and S. E. Dorris
Energy Technology Division Argonne National Laboratory
Argonne, IL 60439, USA Introduction
Experimental Currently, hydrogen is mainly used as a chemical feedstock in the petrochemical and food industries. Concern about using hydrogen as a fuel for the electric power and transportation industries is growing rapidly because of the climate impact of CO2 and other gases such as NOx and SOx generated from fossil resources. Most of the hydrogen demands are met by fossil-based technologies such as steam reforming of natural gas and coal gasification, which produce CO2 and other gases. Therefore, hydrogen production from renewable clean hydrogen resources, in particular, water, is of significant interest. Water dissociates into oxygen and hydrogen at high temperatures, and the dissociation increases with increasing temperature:
Acceptor doped ceria (CMO) powder was obtained from Praxair Surface Technologies Specialty Ceramics. Membranes designated as ANL-1b (7) were prepared from a mixture of CMO powder and a metal (40 vol.%) with a low hydrogen permeability. Powder mixtures for the membranes were prepared in isopropyl alcohol using a mortar and pestle. After the powder mixtures were dried, they were pressed into disks at 200 MPa and sintered for 10 h at 1400°C in a reducing atmosphere. For measurement of the hydrogen production rate, sintered disks were polished to desired thickness with 600-grit SiC polishing paper. A polished disk was then affixed to an Al2O3 tube by using an assembly described elsewhere (7). A gas-tight seal formed when the assembly was heated to 900°C, and spring-loaded rods squeezed a gold ring between the membrane and the Al2O3 tube. Gas concentrations in the sweep gas were analyzed with an Agilent 6890 GC using a thermal conductivity detector. The flow rates of both the sweep and feed gases were controlled with MKS mass flow controllers. Water partial pressure in the sweep gas was controlled by bubbling the sweep gas through water at various temperatures.
H2 O(g )⇔ H2 +12
O2 .
Because of the small equilibrium constant of this reaction, the concentrations of generated hydrogen and oxygen are very low, even at relatively high temperatures, e.g., 0.1 and 0.042% for hydrogen and oxygen, respectively, at 1600°C (1). However, significant amounts of hydrogen or oxygen could be generated at moderate temperatures if the reaction were shifted toward dissociation by removing either oxygen or hydrogen with a mixed-conducting membrane. While hydrogen can also be produced by high-temperature steam electrolysis, mixed-conducting membrane offers the advantage of requiring no electric power or electrical circuitry. Hydrogen production with a mixed oxygen ion-electron conducting membrane is shown schematically in Figure 1. The rate at which oxygen is removed from the sweep gas depends on the oxygen permeability of the membrane, which is a function of the ambipolar conductivity and surface oxygen exchange kinetics of the membrane, and on the oxygen partial pressure (pO2) gradient across the membrane (2-4). Therefore, membranes should have high ambipolar conductivity, as well as good surface exchange properties and be exposed to a high oxygen partial pressure gradient in order to obtain a high hydrogen production rate on the sweep side. Previous studies of hydrogen production from water splitting with mixed-conducting membranes showed only a modest hydrogen production rate above 1500°C (5, 6), e.g., 0.6 cm3/min-cm2 (STP) at 1683°C (5), mainly because of the low electronic conductivity of those membranes.
Results and Discussion
The temperature dependence of hydrogen production was determined with 80% H2/balance He feed and 49% H2O/balance N2 sweep gases. The hydrogen production rate was measured between 700 and 900°C at constant sweep and feed gas flow rates, and the results are shown in Figure 2. The production rate increased with temperature and showed Arrhenius-type behavior, with an apparent activation energy (Ea) of 0.85 eV.
0.1
1.0
10-7
10-6
0.8 0.9 1.0 1.1
(cm
3
/min
-cm
2)
1000/T (K-1)
2)
Ea = 0.85 eV
O2-
e-
H2O
O2
H2
dense mixed oxygen-electron conductor
high pO2 (sweep side) low pO2 (feed side)
e
Figure 2. Dependence of H2 production rate on temperature. Membrane thickness = 0.97 mm.
The hydrogen production rate for the ANL-1b membrane was measured as a function of water partial pressure (pH2O) in the sweep gas. Measurements were at 900°C in the pH2O range from 0.03 to 0.49 atm with dry 80% H2/balance He feed gas and 100 ppm H2/balance N2 sweep gas. Results of these measurements are shown in Figure 3. The hydrogen production rate increased from 1.1 to 2.0 cm3 (STP)/min-cm2 as the sweep pH2O increased from 0.03 to 0.49
Figure 1. Hydrogen production from water dissociation with a mixed oxygen ion-electron conducting membrane.
Fuel Chemistry Division Preprints 2003, 48(1), 229

atm; the hydrogen production rate showed a logarithmic dependence on pH2O in the sweep gas. As the pH2O in the sweep gas increases, the pO2 increases, and this effect increases the driving force for oxygen permeation from the sweep to the feed side. As a result, the hydrogen production rate increases as the pH2O in the sweep gas increases.
0.0
0.5
1.0
1.5
2.0
2.5
0.0 100
4.0 10-7
8.0 10-7
1.2 10-6
1.6 10-6
0.01 0.10 1.00
(cm
3
/min
-cm
2)
pH2O (atm, sweep)
2)
Fuel Chemistry Division Preprints 2003, 48(1), 230
e
Figure 3. Dependence of H2 production rate on the pH2O in the sweep gas. Membrane thickness = 0.97 mm.
The influence of feed-side pH2 on the hydrogen production rate
is shown in Figure 4. The hydrogen production rate increased with increasing pH2 in the feed gas, showing a logarithmic dependence. As the hydrogen concentration in the feed gas increases, the pO2 on the feed side decreases, thus increasing the driving force for oxygen permeation from the sweep to the feed side. As a result, the hydrogen production rate on the sweep side increases as the pH2 in the feed gas increases.
0.0
0.5
1.0
1.5
2.0
2.5
0.0 100
4.0 10-7
8.0 10-7
1.2 10-6
1.6 10-6
0.01 0.10 1.00
e (c
m
3
/min
-cm
2)
pH2 (atm, feed)
2)
Figure 4. Dependence of H2 production rate on the pH2 in the feed gas. Membrane thickness = 0.97 mm. Sweep pH2O = 0.49 atm.
Previous study (8) showed that the hydrogen production rate increases with decreasing membrane thickness, but surface kinetics becomes important as the membrane thickness decreases below ≈0.5 mm and dominates oxygen permeation through thin (≈0.1 mm) membranes. To increase the hydrogen production rate further, surface kinetics should be enhanced either by increasing the surface area of the membrane (9, 10) or by applying an active catalyst to the surfaces of the membrane. In an effort to enhance surface kinetics and thereby increase the hydrogen production rate, we increased the surface area by applying porous ANL-1b layers on both sides of a dense membrane. By applying the porous layers, the triple phase boundary area increases and extends beyond the surface of the membrane, which may facilitate the oxygen exchange at surfaces. Figure 5 compares the hydrogen production rate for a surface-modified membrane with that for a nonmodified membrane. Measurements were made at 900°C using 80% H2/balance He as the feed gas and 49% H2O/balance N2 as the sweep gas. As shown in Figure 5, the porous layers significantly increased the hydrogen
production rate. The maximum hydrogen production rate for a 0.13-mm-thick membrane modified with porous ANL-1b layers was 6.0 cm3 (STP)/min-cm2. Compared with nonmodified membranes, the relative rate increase of membranes with porous layers becomes larger as the membrane thickness decreases. This is because the hydrogen production rate, which is directly related to the oxygen permeation through the membrane, is mainly determined by the surface oxygen exchange rate as the membrane thickness decreases. The non-linear increase in hydrogen production rate with the inverse of membrane thickness indicates that the hydrogen production is still largely determined by surface reactions for surface-modified membranes as the membrane thickness decreases.
0
1
2
3
4
5
6
7
0 2 4 6 8 10 12
with porous layersno porous layers
0 100
1 10-6
2 10-6
3 10-6
4 10-6
ate
(cm
3
/min
-cm
2)
1/Thickness (mm-1 )
2)
Figure 5. Hydrogen production rates vs. inverse of membrane thickness. The hydrogen production rate of a membrane with porous layers is compared with that of a nonmodified membrane. Conclusions
Novel mixed oxygen ion-electron conducting cermet membranes were developed to produce hydrogen through water dissociation. We obtained a maximum hydrogen production rate of 6.0 cm3 (STP)/min-cm2 with a surface-modified, 0.13-mm-thick membrane. Because of the increased driving force for oxygen permeation from the sweep to the feed side, the hydrogen production rate increased with the pH2O in the sweep gas and with the pH2 in the feed gas. The hydrogen production rate also increased with decreasing membrane thickness, but surface kinetics began to dominate the process at a membrane thickness < 0.5 mm.
Acknowledgment. This work is supported by the U.S. Department of Energy, National Energy Technology Laboratory, under Contract W-31-109-Eng-38. Refrences (1) Ihara, S. Bull. Electrotech. Lab., 1977, 41, 259. (2) Lee, T. H.; Yang, Y. L.; Jacobson, A. J.; Abeles, B.; and Zhou, M. Solid
State Ionics, 1997, 100, 77. (3) Qiu, L; Lee, T. H.; Liu, L. M.; Yang, Y. L.; and Jacobson, A. J. Solid
State Ionics, 1995, 76, 321. (4) Bouwmeester, H. J. M. and Burggraaf, A. J. In The CRC Handbook of
Solid State Electrochemistry, Gellings, P. J. and Bouwmeester, H. J. M., Ed, CRC Press, Inc. 1997; pp. 481.
(5) Naito, H. and Arashi, H. Solid State Ionics, 1995, 79, 366. (6) Etievant, C. Solar Energy Materials, 1991, 24, 413. (7) Balachandran, U.; Lee, T. H.; Zhang, G.; Dorris, S. E.; Rothenberger,
K.S.; Howard, B. H.; Morreale, B.; Cugini, A. V.; Siriwardane, R. V.; Poston Jr., J. A.; and Fisher, E. P. In Proc. 26th Intl. Technical Conf. on Coal Utilization and Fuel Systems, Clearwater, FL, March 5-8, 2001. Coal Technical Association, Gaithersburg, MD, pp.751-761.
(8) Lee, T. H.; Wang, S.; Dorris, S. E.; and Balachandran, U. In Proc. 201st Meetings of the Electrochemical Society, Philadelphia, PA, May 12-17, 2002.
(9) Lee, T. H.; Yang, Y. L.; Jacobson, A. J.; Abeles, B.; and Milner, S. Solid State Ionics, 1997, 100, 87.
(10) Deng, H.; Zhou, M.; and Abeles, B. Solid State Ionics, 1994, 74, 75.
Hydrogen Generation from Methane and Water by Nonthermal Plasma
0
0.5
1
1.5
2
0 1000 2000 3000 4000
Flow Rate mL/min
Vol.% Hydrogen
1%CH4(N2)
10%CH4(N2)
100%CH4
Kanji Irie
Research And Development Laboratory,Daido Steel Co.,Ltd., 2-30, Daido-cho, Minami-ku,Nagoya,Japan457-8545
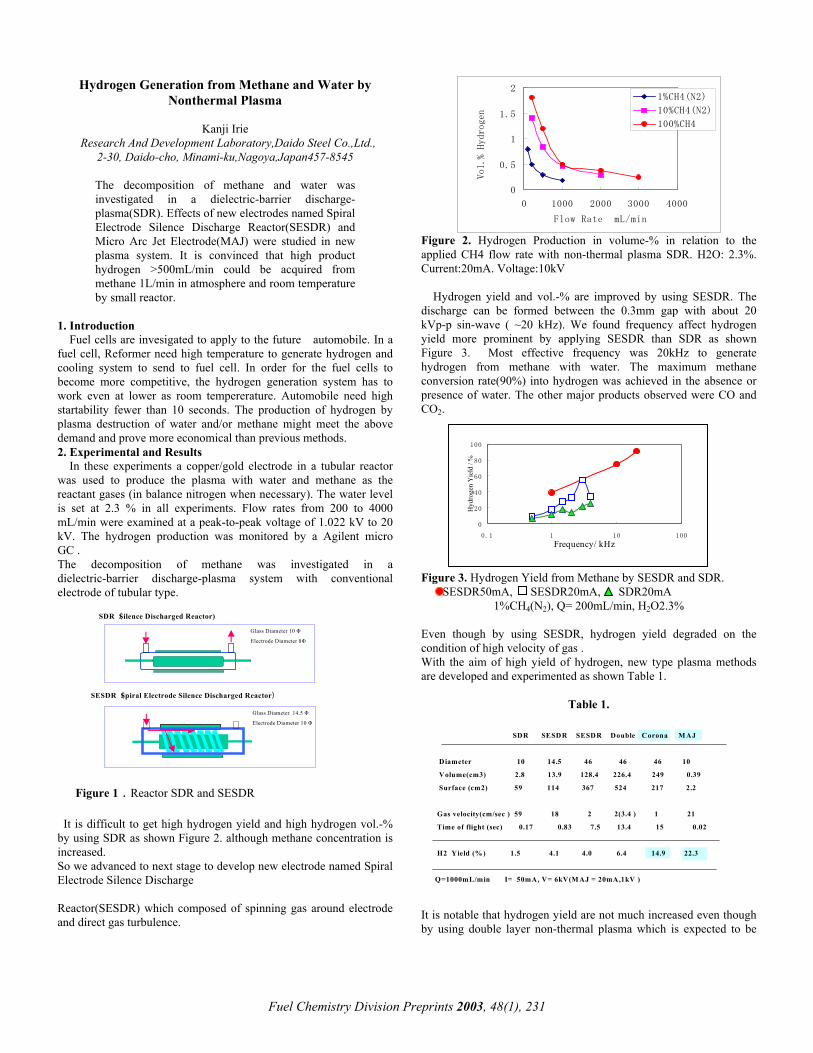
The decomposition of methane and water was investigated in a dielectric-barrier discharge- plasma(SDR). Effects of new electrodes named Spiral Electrode Silence Discharge Reactor(SESDR) and Micro Arc Jet Electrode(MAJ) were studied in new plasma system. It is convinced that high product hydrogen >500mL/min could be acquired from methane 1L/min in atmosphere and room temperature by small reactor.
Figure 2. Hydrogen Production in volume-% in relation to the applied CH4 flow rate with non-thermal plasma SDR. H2O: 2.3%. Current:20mA. Voltage:10kV
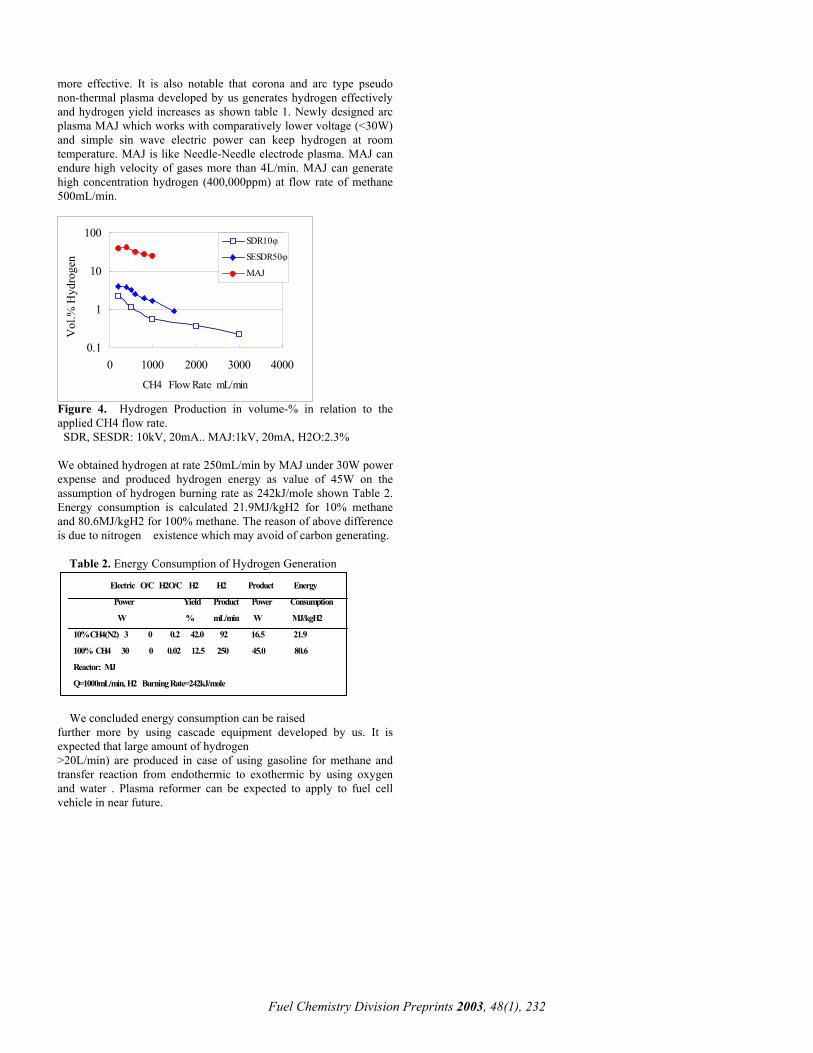
Hydrogen yield and vol.-% are improved by using SESDR. The discharge can be formed between the 0.3mm gap with about 20 kVp-p sin-wave ( ~20 kHz). We found frequency affect hydrogen yield more prominent by applying SESDR than SDR as shown Figure 3. Most effective frequency was 20kHz to generate hydrogen from methane with water. The maximum methane conversion rate(90%) into hydrogen was achieved in the absence or presence of water. The other major products observed were CO and CO2.
1. Introduction
Fuel cells are invesigated to apply to the future automobile. In a fuel cell, Reformer need high temperature to generate hydrogen and cooling system to send to fuel cell. In order for the fuel cells to become more competitive, the hydrogen generation system has to work even at lower as room tempererature. Automobile need high startability fewer than 10 seconds. The production of hydrogen by plasma destruction of water and/or methane might meet the above demand and prove more economical than previous methods.
0
20
40
60
80
100
0.1 1 10 100
Frequency/ kHz
Hyd
roge
n Y
ield
/ %
2. Experimental and Results In these experiments a copper/gold electrode in a tubular reactor
was used to produce the plasma with water and methane as the reactant gases (in balance nitrogen when necessary). The water level is set at 2.3 % in all experiments. Flow rates from 200 to 4000 mL/min were examined at a peak-to-peak voltage of 1.022 kV to 20 kV. The hydrogen production was monitored by a Agilent micro GC .
The decomposition of methane was investigated in a
dielectric-barrier discharge-plasma system with conventional electrode of tubular type.
Figure 3. Hydrogen Yield from Methane by SESDR and SDR. SESDR50mA, SESDR20mA, SDR20mA
1%CH4(N2), Q= 200mL/min, H2O2.3%
Glass Diameter 10 Φ
Electrode Diameter 8Φ
Glass Diameter 14.5 Φ
Electrode Diameter 10 Φ
SDR(Silence Discharged Reactor)
SESDR(Spiral Electrode Silence Discharged Reactor)
Even though by using SESDR, hydrogen yield degraded on the condition of high velocity of gas .
With the aim of high yield of hydrogen, new type plasma methods are developed and experimented as shown Table 1.
Table 1.
SDR SESDR SESDR Double Corona MAJ
Diameter 10 14.5 46 46 46 10
Volume(cm3) 2.8 13.9 128.4 226.4 249 0.39
Surface (cm2) 59 114 367 524 217 2.2
Gas velocity(cm/sec ) 59 18 2 2(3.4 ) 1 21
Time of flight (sec) 0.17 0.83 7.5 13.4 15 0.02
H2 Yield (%) 1.5 4.1 4.0 6.4 14.9 22.3
Q=1000mL/min I= 50mA, V= 6kV(M AJ = 20mA,1kV )
Figure 1.Reactor SDR and SESDR It is difficult to get high hydrogen yield and high hydrogen vol.-%
by using SDR as shown Figure 2. although methane concentration is increased.
So we advanced to next stage to develop new electrode named Spiral
Electrode Silence Discharge Reactor(SESDR) which composed of spinning gas around electrode
and direct gas turbulence. It is notable that hydrogen yield are not much increased even though by using double layer non-thermal plasma which is expected to be
Fuel Chemistry Division Preprints 2003, 48(1), 231
more effective. It is also notable that corona and arc type pseudo non-thermal plasma developed by us generates hydrogen effectively and hydrogen yield increases as shown table 1. Newly designed arc plasma MAJ which works with comparatively lower voltage (<30W) and simple sin wave electric power can keep hydrogen at room temperature. MAJ is like Needle-Needle electrode plasma. MAJ can endure high velocity of gases more than 4L/min. MAJ can generate high concentration hydrogen (400,000ppm) at flow rate of methane 500mL/min.
0.1
1
10
100
0 1000 2000 3000 4000
CH4 Flow Rate mL/min
Vol
.% H
ydro
gen
SDR10φ
SESDR50φ
MAJ
Figure 4. Hydrogen Production in volume-% in relation to the applied CH4 flow rate. SDR, SESDR: 10kV, 20mA.. MAJ:1kV, 20mA, H2O:2.3% We obtained hydrogen at rate 250mL/min by MAJ under 30W power expense and produced hydrogen energy as value of 45W on the assumption of hydrogen burning rate as 242kJ/mole shown Table 2. Energy consumption is calculated 21.9MJ/kgH2 for 10% methane and 80.6MJ/kgH2 for 100% methane. The reason of above difference is due to nitrogen existence which may avoid of carbon generating.
Table 2. Energy Consumption of Hydrogen Generation
Electric O/C H2O/C H2 H2 Product Energy
Power Yield Product Power Consumption
W % mL/min W MJ/kgH2
10% CH4(N2) 3 0 0.2 42.0 92 16.5 21.9
100% CH4 30 0 0.02 12.5 250 45.0 80.6
Reactor: MJ
Q=1000mL/min, H2 Burning Rate=242kJ/mole
We concluded energy consumption can be raised further more by using cascade equipment developed by us. It is expected that large amount of hydrogen >20L/min) are produced in case of using gasoline for methane and transfer reaction from endothermic to exothermic by using oxygen and water . Plasma reformer can be expected to apply to fuel cell vehicle in near future.
Fuel Chemistry Division Preprints 2003, 48(1), 232
DEACTIVATION OF SUPPORTED GOLD WATER GAS SHIFT CATALYSTS
Chang Hwan Kim and Levi Thompson
Department of Chemical Engineering
University of Michigan 2300 Hayward St.
Ann Arbor, MI, 48109-2136 Introduction
An emerging application for the water gas shift (WGS) is in the production of hydrogen-rich gas for proton exchange membrane (PEM) fuel cells. The WGS is used to remove most of the CO, a poison to most fuel cell electrocatalysts, from the steam reforming and/or partial oxidation exhaust. The WGS reactor dominates the fuel processor mass, volume, and cost.
Catalysts composed of nanocrystalline gold particles supported on reducible oxides have been demonstrated to be highly active for a number of reactions including WGS1. With regard to the activity, the gold particle size is very important1, and its size must be small enough to lose metallic character and increase its electronegative character2. The particle size dependency requires delicate preparation methods. The preferred method is deposition-precipitation3. The support usually does not contribute to the catalytic activity, but synergetic effects have been observed in reducible oxide supported gold catalysts1.
In some cases supported gold catalysts have been report to be substantially more active for WGS than commercial Cu based catalysts3. It has, however, also been observed that supported gold catalysts are very susceptible to deactivation and therefore may not be suitable for commercial application. It is claimed this deactivation is due to over-reduction of the support by the reformate4. Results from our work are not consistent with this deactivation mechanism. These results along with a tentative mechanism for deactivation will be presented in this paper. Experimental
Sample preparation. A 10 wt% Au/CeO2 catalyst was prepared using the deposition-precipitation method. A gold precursor (HAuCl4·3H2O) was deposited and precipitated onto the CeO2 support. The support was suspended in 100 ml of water with stirring. A NaCO3 solution was used to keep the pH at 10 during precipitation. The catalyst was aged, carefully washed at 60 °C then dried at 80°C under vacuum for 6 h. The resulting material had a surface area of 120m2/g. The commercial Cu-Zn-Al catalyst was obtained from Süd Chemie Ltd.
Activity measurement. Approximately 15-30 mg of catalyst was loaded in a quartz microreactor. Silica was used as an inert diluent. The catalyst was reduced prior to the activity measurement with a mixture containing 4% H2 in N2. The catalytic properties were measured at atmospheric pressure and temperatures ranging from 200 to 240 °C using a reactant gas whose composition simulates reformate from gasoline partial oxidation (CO, H2O, CO2, H2 and N2 concentrations of 10, 22, 6, 43 and 19 mol%, respectively). An HPLC pump was used to feed H2O (0.04ml/min liq.) to the reactant. The space velocity was high enough to minimize transport limitations, and the particle size was adjusted to minimize the pressure drop as well as transport limitations. The effluents were analyzed using a SRI gas chromatograph with single Carboxen 1000 column.
Characterization. The catalyst was characterized using x-ray diffraction (XRD), Fourier Transform Infrared Spectroscopy (FT-IR) and sorption analysis. The XRD analysis was carried out using a
Rigaku Rotaflex DMAX-B rotating anode x-ray diffractometer with a CuKα radiation source operated at 40 kV and 100 mA. In-situ FT-IR analysis was performed using a Mattson Galaxy 5000 spectrometer equipped with a Harrick high temperature reaction cell. The sample pellet included inert silica. A Micromeritics AutoChem 2910 was used for all sorption techniques. Results and Discussion
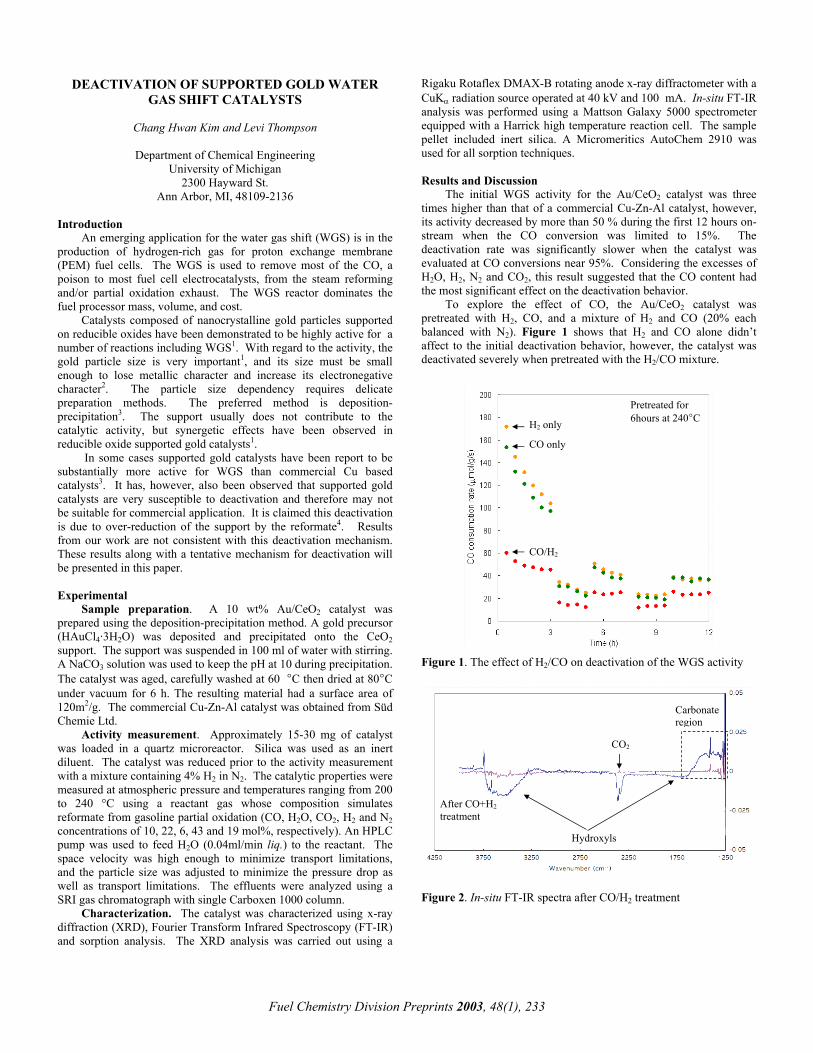
The initial WGS activity for the Au/CeO2 catalyst was three times higher than that of a commercial Cu-Zn-Al catalyst, however, its activity decreased by more than 50 % during the first 12 hours on-stream when the CO conversion was limited to 15%. The deactivation rate was significantly slower when the catalyst was evaluated at CO conversions near 95%. Considering the excesses of H2O, H2, N2 and CO2, this result suggested that the CO content had the most significant effect on the deactivation behavior.
To explore the effect of CO, the Au/CeO2 catalyst was pretreated with H2, CO, and a mixture of H2 and CO (20% each balanced with N2). Figure 1 shows that H2 and CO alone didn’t affect to the initial deactivation behavior, however, the catalyst was deactivated severely when pretreated with the H2/CO mixture.
Pretreated for 6hours at 240°C H2 only
CO only
CO/H2
Figure 1. The effect of H2/CO on deactivation of the WGS activity
Carbonate region
CO2
After CO+H2 treatment
Hydroxyls
Figure 2. In-situ FT-IR spectra after CO/H2 treatment
Fuel Chemistry Division Preprints 2003, 48(1), 233
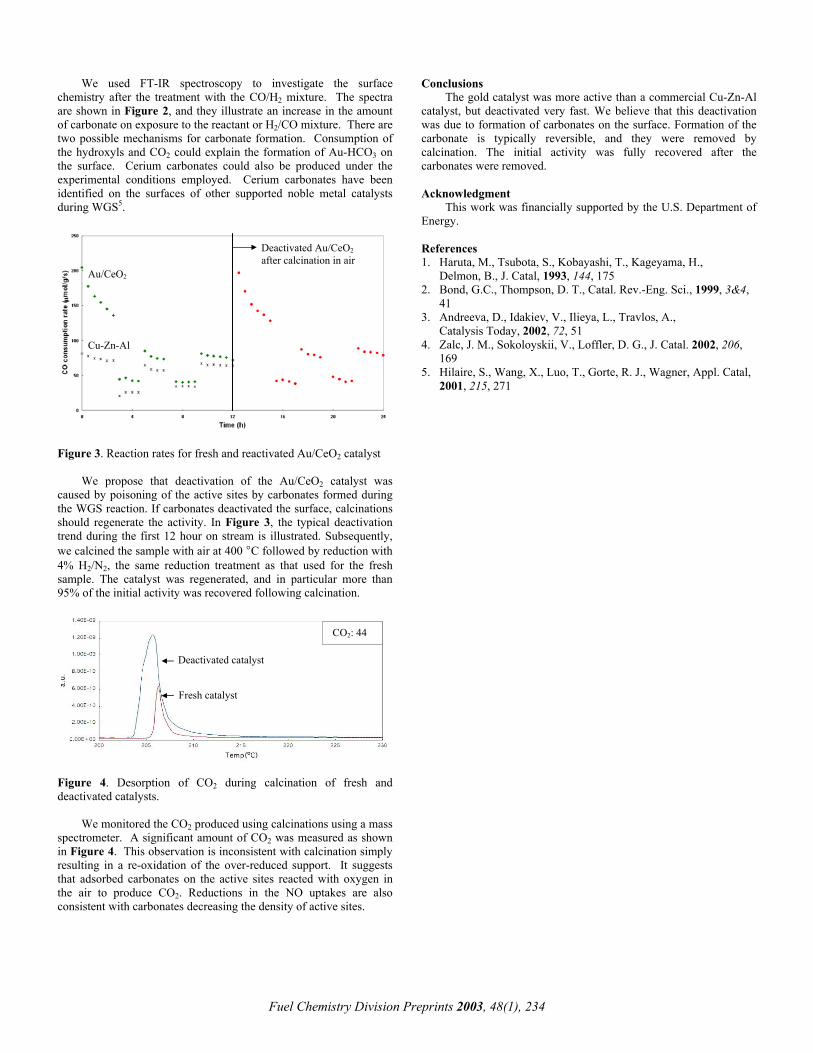
We used FT-IR spectroscopy to investigate the surface chemistry after the treatment with the CO/H2 mixture. The spectra are shown in Figure 2, and they illustrate an increase in the amount of carbonate on exposure to the reactant or H2/CO mixture. There are two possible mechanisms for carbonate formation. Consumption of the hydroxyls and CO2 could explain the formation of Au-HCO3 on the surface. Cerium carbonates could also be produced under the experimental conditions employed. Cerium carbonates have been identified on the surfaces of other supported noble metal catalysts during WGS5.
Conclusions The gold catalyst was more active than a commercial Cu-Zn-Al
catalyst, but deactivated very fast. We believe that this deactivation was due to formation of carbonates on the surface. Formation of the carbonate is typically reversible, and they were removed by calcination. The initial activity was fully recovered after the carbonates were removed. Acknowledgment
This work was financially supported by the U.S. Department of Energy.
References Deactivated Au/CeO2 after calcination in air 1. Haruta, M., Tsubota, S., Kobayashi, T., Kageyama, H.,
Au/CeO2 Delmon, B., J. Catal, 1993, 144, 175 2. Bond, G.C., Thompson, D. T., Catal. Rev.-Eng. Sci., 1999, 3&4,
41 3. Andreeva, D., Idakiev, V., Ilieya, L., Travlos, A.,
Catalysis Today, 2002, 72, 51 4. Zalc, J. M., Sokoloyskii, V., Loffler, D. G., J. Catal. 2002, 206,
169 Cu-Zn-Al
5. Hilaire, S., Wang, X., Luo, T., Gorte, R. J., Wagner, Appl. Catal, 2001, 215, 271
Figure 3. Reaction rates for fresh and reactivated Au/CeO2 catalyst
We propose that deactivation of the Au/CeO2 catalyst was caused by poisoning of the active sites by carbonates formed during the WGS reaction. If carbonates deactivated the surface, calcinations should regenerate the activity. In Figure 3, the typical deactivation trend during the first 12 hour on stream is illustrated. Subsequently, we calcined the sample with air at 400 °C followed by reduction with 4% H2/N2, the same reduction treatment as that used for the fresh sample. The catalyst was regenerated, and in particular more than 95% of the initial activity was recovered following calcination.
CO2: 44
Deactivated catalyst
Fresh catalyst
Figure 4. Desorption of CO2 during calcination of fresh and deactivated catalysts.
We monitored the CO2 produced using calcinations using a mass spectrometer. A significant amount of CO2 was measured as shown in Figure 4. This observation is inconsistent with calcination simply resulting in a re-oxidation of the over-reduced support. It suggests that adsorbed carbonates on the active sites reacted with oxygen in the air to produce CO2. Reductions in the NO uptakes are also consistent with carbonates decreasing the density of active sites.
Fuel Chemistry Division Preprints 2003, 48(1), 234

RECENT DEVELOPMENTS ON HYDROGEN STORAGE SYSTEMS
Liquid hydrogen Liquid hydrogen has an over 800 times higher density than in its
gaseous state. Therefore, liquefaction of hydrogen is particularly attractive from the point of view of improving the mass per volume ratio. However, the condensation temperature of hydrogen at 0.1 MPa is -253 °C and the unavoidable heat transfer even through a super-insulated container leads directly to loss of hydrogen due to boil-off. Larger containers have a better surface to volume ratio than smaller ones, reducing the loss of hydrogen due to evaporation. Therefore, huge hydrogen containers are used for commercial transportation of liquid hydrogen inside ships and delivery by trailers or for stationary storage systems. For small tanks inside sedans, the manufactures are currently working on reducing the boil-off rate6. For example, Linde AG, Germany, is using a newly patented re-cooling system, so the loss due to evaporation can be minimized. The stand-by time of a parked car can so be extended from before 3 days to more than 12 days, before evaporation losses occur6. Additionally, major advances in motor development like direct fuel injection and new valve generations for hydrogen have been made, improving the maximum available torque and power of the car engine, by simultaneously reducing the fuel-consumption7.
Hironobu Fujii, Jürgen I. Gottwald, Takayuki Ichikawa
Faculty of Integrated Arts and Sciences
Hiroshima University 1-7-1, Kagamiyama Higashi-Hiroshima 739-8521 JAPAN
Introduction
Protection of earth is one of the main issues to be solved for human race. However, the fast growing world population, an increasing globalization and the emerging nations on the threshold to a highly mobile society will yield more and more atmospheric pollution. Thus, hydrogen energy systems have been proposed as a means to reduce greenhouse gas and other harmful emissions from stationary and mobile sources, also aiming at a higher energy independence from the short-running fossil fuels and their uncertain sources. Moreover, the car manufactures would like to increase their rate of “zero-emission vehicles” in their car fleet.
Metal-hydrides
For realizing hydrogen energy systems in near future, we have to establish suitable energy storage and transportation technologies. One of the key technologies on that way is the development of high performance hydrogen storage (H-storage) systems.
It is well known that metal-hydride (MH) systems can store more hydrogen than in liquid hydrogen in a safe and efficient way. However, those materials with good storage capabilities and reversibility only desorb hydrogen at relatively high temperatures, too high for fuel cell application. On the other hand, materials fitting these requirements are too heavy or too expensive for a commercial application.
For stationary applications, weight is not a key problem. But especially for mobile applications, e.g. in fuel-cell electric vehicles (FCEV), or cars with hydrogen-fueled internal combustion engine, fuel tanks have to be a compact, lightweight, safe and affordable containment as an on-board H-storage system. As technical realizations, high-pressure hydrogen, liquid hydrogen, absorbed hydrogen in metal hydrides, chemical hydrides and nano-structured carbons will be discussed, omitting on-board reforming of hydrogen from methanol or other liquid fuels.
Therefore, all over the world hydrogen research teams have been initiated: In 1996, the IEA (International Energy Agency) program8 has established an international hydrogen storage task force to search for innovative materials with high H-storage capacity. Since 1995, the DOE (Department of Energy) is progressing the research program on hydrogen storage materials9. In Japan, since 1994 the R&D-program of developing hydrogen storage and transportation systems using metal hydrides has been set up in the WE-NET (World Energy-Network) project10. In addition, the research program on new advanced H-storage materials has been launched in the Priority Areas Project “New Protium Functions in Materials” by the Ministry of Education, Science, Sports and Culture of Japan. The above projects are aiming at the development of high performance H-storage materials applicable to FCEV. To overcome the disadvantages in conventional heavyweight metal hydrides, new materials using lighter elements have been investigated in the recent years.
High-pressure hydrogen
Classical high-pressure gas cylinder tanks made of inexpensive steel are regularly filled up to 15 or 25 MPa in most countries. To run a compact car for 400 km, approximately 4 kg of hydrogen for a FCEV or 8 kg for an internal combustion engine are required1. If 4 kg of hydrogen is stored in its gaseous form and compacted at a pressure of 20 MPa, an internal volume of 220 liters would be necessary, a space clearly not available in standard compact cars.
Therefore, novel high-pressure tanks involving fiber-reinforced composite materials are being developed; normally these new tanks consist of an inner liner, onto which the fibers are wound. They are tested up to a maximum pressure of 60 MPa and for regular use filled up to 35 MPa (5,000 psi)2. However, even for that pressure, the fuel tank would have a too large volume for a compact FCEV. To overcome this disadvantage, very-high-pressure tanks up to 70 MPa (10,000 psi) for mobile and 82.5 MPa (12,500 psi) for stationary application3 have been considered and exist as prototypes. These tanks are envisaged to have a weight of 110 kg, equivalent to a technical efficiency of 0.70 m3/kg4. But even at these high pressures, at the current technical status, the gas cylinders will be a factor of three more inefficient than liquid hydrogen tanks4. However, besides the fact that there remains always a considerable risk in using very-high-pressure vessels, the most dangerous and complicated part is the compression itself. In addition, compressing the hydrogen up to 70 MPa (10,000 psi) would require almost the same energy as its liquefaction and some problems concerning the high-pressure container itself remain to be solved5.
One attractive light-element metal hydride is MgH2, since it is directly formed from the reaction of bulk Mg with gaseous hydrogen, reaching hydrogen concentrations up to 7.6 wt.% of hydrogen. However, like in many other metal hydrides, the reaction is too slow and needs 300 °C for progressing the hydrogen desorption reaction.
A reduction of the metal grain sizes to nanocrystalline dimensions can significantly improve the thermodynamic and diffusional properties in MgH2 and enhances the H-storage features11. Therefore, different processes to obtain micro- or nano-structured Mg have been investigated to overcome the above-mentioned drawbacks.
Recently, Pd-coated nano-structured Mg films prepared by a RF sputtering method have been reported to absorb ~5 wt.% at 100 °C under hydrogen atmosphere of 0.1 MPa and to completely desorb below 100 °C in vacuum12. These catalyzed nano-structured Mg composites are now developed as one of the H-storage materials aiming at large-scale production. Moreover, in another work, the kinetics of MgMH with a maximum H-storage capacity of 7.5 wt.%
Fuel Chemistry Division Preprints 2003, 48(1), 273

Fuel Chemistry Division Preprints 2003, 48(1), 274
could be drastically improved by ball-milling Mg together with nanometer size catalysts of Ni and Fe under an H2-atmosphere of 1 MPa. The grinding time could be shortened from 10 hr to 15 min by simultaneously optimizing the Ni nanoparticle amount to 0.5 at%13.
Recently, it has been found that Cr-Ti-V bcc alloys absorb and desorb effective hydrogen up to 2.6 wt% at 313 K under ambient pressure, which is the highest hydrogen capacity in the metal hydrides applicable for fuel cell cars at present14. Carbon-related storage materials
In the first work on H-storage in single-walled nanotubes (SWNT) in 1997, a H-storage capacity between 5 to 10 wt.% was reported15. This, and the stunning result of up to 67 wt.% at room temperature in carbon nanofibers by another group16, have triggered many laboratories around the world to focus their research on that class of materials. (For a review on the vast area about H-storage in carbon nanostructures, see 17, 18 and 19). Unfortunately, these first experimental results could not be repeated or confirmed independently in other laboratories up to now. Some of the reported storage capacities could be even solely caused by Ti-alloy impurities introduced by the special sonication process, which is applied to open the caps of the nanotubes20. Currently, the opinions about the ability of H-storage in carbon nanotubes and –fibers are still controversially discussed21 and are as widespread as the experimental results.
Instead, nano-structured graphite, mechanically milled under a hydrogen atmosphere of 1 MPa, has been reported and confirmed to absorb hydrogen up to 7.4 wt.%22, 23. However, still some progress should be done in improving the yet too high desorption temperature for H storage.
Chemical hydrides
Complex metal hydrides, also called chemical hydrides, have a high theoretical H-storage capacity (e.g. the “alanate” NaAlH4: 5.6 wt.%) and their feedstock is relatively cheap. But for complex aluminum hydrides, for example, the comprised hydrogen was presumed to be stored irreversibly. The material was only used, after being added to water, as a “one-shot” hydrogen releasing material24. Additionally, hydrogen was released only at temperatures above their melting point. Therefore, the chemical hydrides were assumed an unsuitable material for reversible H-storage. In 1995, Bogdanović et al. have shown in their pioneering work, that Ti-doping of NaAlH4 renders the reaction reversible and kinetically enhances the hydrogen release already at near-ambient temperatures25. At present, research groups are now investigating improved catalysts for optimizing the dehydriding characteristics not only of the alanates. However, a H-storage system applicable to FCEV has not been established yet because the reaction rate and temperatures are still too inadequate for application in an on-board storage system. Moreover, it is currently still unknown what the effective catalyst mechanism is and how it contributes to the process26. In addition, the hydrogen release is not yet optimized, because either the full storage capacity is lost after the first cycle or the initial H capacities are low26. However, if the reaction is improved and becomes significantly fast, the chemical hydrides will play a dominant role as H-storage media in mobile applications.
Conclusion
Currently, in the hydrogen research laboratories all over the world new non-traditional and nano-technological techniques are applied to design high performance H-storage materials. We believe that, due to this research effort, one day better hydrogen-storage materials, which absorb and desorb at least 5 wt.% hydrogen at temperatures below 100 °C, will be discovered and developed.
Acknowledgement
One author (J.G.) would like to thank for his financial support by the Japanese Society for the Promotion of Science fellowship program. References
1 Schlapbach, L., MRS Bulletin, 2002, 27 (09), 675 2 Quantum technologies, Inc, “Quantum Technologies, Trishield™
Composite Cylinder”, http://www.qtww.com/pdf/TriShield.pdf 3 Dynetek, http://www.dynetek.com/ 4 Irani, R. S., MRS Bulletin, 2002, 27 (09), 680 5 Verdugo-Peralta, C., Proc. 14th World Hydrogen Energy Conf.,
Montréal, 2002 6 Wolf, J., MRS Bulletin, 2002 27 (09), 684 7 Wetzel, F.-J., Proc. 14th World Hydrogen Energy Conf., Montréal, 2002 8 IEA (International Energy Agency) Hydrogen Program,
http://www.eren.doe.gov/hydrogen/iea/ 9 U. S. DOE (Department of Energy), Hydrogen, Fuel Cells, and
Infrastructure Technologies Program, http://www.eren.doe.gov/hydrogen/
10 WE-NET (World Energy Network), http://www.enaa.or.jp/WE-NET/ 11 Zaluska, A.; Zaluski, L.; Ström-Olsen, J. O., J. Alloys Compd., 1999,
288, 217 12 Fujii, H.; Higuchi, K.; Yamamoto, K.; Kajioka, H.; Orimo, S.; Toiyama,
K., Mater. Trans., 2002, 43 (11), 2651 13 Kanoya, I.; Hosoe, M.; Suzuki, T., Honda R&D Technical Review, 2002,
14 (2), 91 14 Okada, M.; Kuriiwa, K.; Tamura, T.; Takamura, H.; Kamegawa, A.,
J. Alloys Compd., 2002, 330-332, 511 15 Dillon, A. C.; Jones, K. M.; Bekkedahl, T. A.; Klang, C. H.; Bethune, D.
S.; Heben, M. J., Nature, 1997, 386, 377 16 Chambers, A.; Park, C.; Terry R.; Baker, K.; Rodriguez, N. M., J. Phys.
Chem. B, 1998, 102, 4253 17 Züttel, A; Sudan, P.; Mauron, Ph.; Kiyobayashi, T.; Emmenegger, Ch.;
Schlapbach, L., Int. J. Hydrogen Energy, 2002, 27, 203 18 Dillon, A. C.; Heben, M. J., Appl. Phys. A, 2001, 72, 133 19 Züttel, A.; Orimo, S., MRS Bulletin, 2002, 27 (09), 705 20 Hirscher, M; Becher, M; Haluska, M.; Dettlaff-Weglikowska, U.;
Quintel, A.; Duesberg, G. S.; Choi, Y.-M.; Downes, P.; Hulman, M.; Roth, S.; Stepanik, I.; Bernier, P., Appl. Phys. A, 2001, 72, 129
21 Atkinson, K.; Roth, S.; Hirscher, M.; Grünwald, W., Fuel Cells Bulletin, 2002, 38, 9
22 Orimo, S.; Majer, G.; Fukunaga, T.; Züttel, A.; Schlapbach L.; Fujii, H., Appl. Phys. Lett., 1999, 75 (20), 3093
23 Orimo, S., Matsushima, T.; Fujii, H.; Fukunaga, T.; Majer, G., J. Appl. Phys., 2001, 90 (03), 1545
24 Jensen, C. M.; Zidan, R.; Takara, S.; Guthrie, S. E.; Thomas, G. J., IEA Task 12, Final Task Report, Project 10, 2001, 53
25 Bodanović, B.; Schwickardi, M. J., J. Alloys Compd., 1997, 253, 1 26 Bogdanović, B.; Sandrock, G., MRS Bulletin, 2002, 27 (09), 712

PERFORMANCE OF A METAL HYDRIDE HYDROGEN STORAGE SYSTEM
Sarang A. Gadre, Armin D. Ebner and James A. Ritter*
Department of Chemical Engineering
University of South Carolina Columbia, SC 29208 USA
Introduction
Hydrogen is considered to be the ultimate fuel for the future, not only because of its renewable and nonpolluting nature, but also because water is the only byproduct during combustion. However, there are many roadblocks to the implementation of the hydrogen economy, such as the lack of refueling and storage infrastructures. Hence, a considerable effort is being put fourth worldwide to alleviate some of these roadblocks.1 For example, the Savannah River Technology Center (SRTC) has developed a novel metal hydride hydrogen storage container for niche transportation applications.2 In fact, despite their low gravimetric density, metal hydrides as a means to store hydrogen have been under consideration for many years2-7 because they have the ability to store hydrogen reversibly in the solid state at relatively low pressures and ambient temperature.
However, a metal hydride hydrogen storage container can be complicated and may contain heat transfer tubes as well as a heat transfer medium to overcome the enthalpic effects during charge and discharge. The SRTC container is an excellent example.8 It contains aluminum foam and a u-tube heat exchanger for heat transfer, it is only three-fourths filled with metal hydride powder to compensate for expansion during hydrogenation, and the sintered metal feed tube runs axially along the top of the container to ensure a uniform flux of hydrogen into the vessel. These complications present quite a challenge to the development of a mathematical model that can be used for design and optimization.8 To this end, experimental data are needed over a wide range of hydrogen charge and discharge conditions to calibrate and/or validate such a mathematical model.
Therefore, the objective of this paper is to present some of the results from a simple two level fractional factorial design study that reveals the effect of seven factors on the discharge performance of the SRTC hydrogen storage container from only sixteen different experimental runs. These results are used to further test the models developed previously under diverse operating conditions. Select experimental and modeling results are presented to show how a relatively simple model is able to capture the dynamic discharge behavior of a complex hydrogen storage container.
Experimental
Seven process factors were identified as the critical factors for this study. They are the container insulation (In), u-tube water flow rate (Qw), u-tube water temperature (Tw), initial bed temperature (Ti), initial bed pressure (Pi), hydrogen gas flow rate (Qg), and hysteresis (Hy). These factors and their high and low levels are given in Table 1. The conventional “study one factor at a time” approach
was inefficient here as it is incapable of quickly assessing the relative importance of each factor and how it interacts with the other factors. At the same time, a full factorial design for these seven factors was also impractical, as it would take considerable time to carry out 128 experiments. Hence, a two-level resolution IV fractional factorial design (1/8th fraction) comprising 16 runs was devised for these factors.9 The experiments were carried out as described elsewhere.8
Results and Discussion
To understand the effects of these factors on the discharge performance of this container, several performance indicators or response variables of practical relevance were identified. However, due to space constraints, only a couple of them are discussed here. To isolate the factors or factor interactions that have significant effects, normal probability plots and Pareto charts were constructed for each response variable using MINITAB. The results for the time until the discharge flow rate is constant, and for the standard volume of H2 discharged are shown in Figures 1 and 2.
Figure 1. Normal probability plot and Pareto Chart for the estimated effects of the time until the discharge flow rate is constant.
Figure 2. Normal probability plot and Pareto Chart for the estimated effects of the standard volume of H2 discharged.
Table 1. Fractional Factorial Study Operating Conditions Factors Factor Levels
Surface Insulation No Yes Water Flow Rate (gpm) 2 4 Water Temperature (oC) 25 55
Initial Bed Temperature (oC) 25 55 Initial Bed Pressure (atm) 12 20
H2 Discharge Flow Rate (SLPM) 10 30 Hysteresis No Yes
- 4 -3 - 2 -1 0 1
- 1
0
1
E ffe c t
Nor
mal
Sco
reF
A : In s u la tio n B : W a te r flo wC : W a te r te m pD : T iE : P iF : G a s flo w ra te
G : H ys te re s is
0 1 2 3
C
A G
A B DA B
A C
GB
B D
A
A DA E
A F
ED
FA : In s u la t io n B : W a te r f lo wC : W a te r te m pD : T iE : P iF : G a s f lo w r a teG : H y s te r e s is
-1000 0 1000
-1
0
1
E ffe c t
Nor
mal
Sco
re
E
A F
D
A: Ins u la tionB : W a te r flowC : W a te r tem pD : T iE : P iF : G as flow ra teG : Hys te res is
1 0 0 05 0 00
D
EA F
G
A CB
B D
FA EA D
A
CA B
A B DA G
( p p )
A : In s u la t io nB : W a te r f lo wC : W a te r t e m pD : T iE : P iF : G a s f lo w r a teG : H y s te r e s is
Fuel Chemistry Division Preprints 2003, 48(1), 275

The time duration for which the molar flow rate stays constant is an important variable for assessing the performance of the hydrogen storage system as it provides information on how long the bed can be operated at the desired flow rate. Figure 1 shows the effects of the factors and the factor interactions for an alpha value of 0.10, which corresponds to a 90% confidence level. The only factor that had any significant effect was the hydrogen gas discharge flow rate.
The standard volume of hydrogen discharged, which also represents the bed capacity, is important for knowing how much hydrogen can be stored in the solid state and taken out during discharge. This quantity was based on the volume discharged up until 20 % of the set value was reached. From Figure 2 it is evident that the factors influencing this variable were the initial pressure (Pi), initial temperature (Ti) and interaction between insulation (In) and gas flow rate (Qg). Since this was a resolution IV fractional factorial design, two-factor interactions were confounded with each other. Hence, In-Qg had an alias with two other factor interactions, namely Qw-Hy and Ti-Pi, and since real interaction effects are not likely to occur unless at least one of the factors involved in the interaction has a main effect,9 it was safe to assume that the alias structure of the two-factor interaction was dominated by the interaction between Ti-Pi, as they both occurred as significant main effects.
Fuel Chemistry Division Preprints 2003, 48(1), 276
Figure 3. Comparison of the experimental pressure and temperature histories during discharge with different model predictions.
Mathematical Model Simulations The models developed in a previous work8 were calibrated with a standard discharge run to obtain the heat and mass transfer coefficients; it was then used to predict other experimental runs at different hydrogen gas discharge flow rates. The same set of heat and mass transfer coefficients was able to predict the performance of all the runs with the same, reasonable accuracy. However, to understand the real potential of these models, they need to be tested under diverse conditions, such as used in this fractional factorial study. Thus, 8 runs, all corresponding to the insulation on condition, were used to test various models under very diverse conditions.
Figure 3 shows the predictions from several models for one of the runs from this study under extreme conditions. Here, the water flow rate was kept at its high value, while using hot water as the heat exchanger fluid. The initial bed pressure, temperature and discharge flow rate were also set at their high levels; and the hysteresis “yes” condition was used (recall, however, that its effect was insignificant). The predictions from the axial model with the same value of heat and mass transfer coefficients obtained from the previous study8 (132.4 W/m2/K) resulted in poor predictions; the value of heat transfer coefficient had to be adjusted to 41.625 W/m2/K to obtain a good fit. Nevertheless, the axial flow, radial energy (AFRE) model, using the same value of the bed conductivity (2.78 W/m/K) from the previous work,8 was able to predict the pressure discharge characteristics with reasonable accuracy. However, these predictions were improved by
making the bed conductivity a linear function of loading. This trend was also evident in the temperature histories, where the variable conductivity model gave the best predictions among all the models.
Figure 4. Comparison of the experimental pressure and temperature histories during discharge with different model predictions.
Similar results were observed for another experimental run
obtained at extreme conditions, as shown in Figure 4. The water flow rate was again high, but cold water was used as the heat exchanger fluid. The initial bed temperature and pressures were set at the low values, and the discharge flow rate was set at the high value. Again, the hysteresis “yes” condition was set. This time the old value of the heat transfer coefficient was able to predict the discharge characteristics. Typically, the lower value of 41.625 W/m2/K was needed when hot water was used, and the value of 132.4 W/m2/K was needed when cold water was used. Just like the previous case, the AFRE model with the same value of the bed conductivity predicted the pressure discharge curve with reasonable accuracy, which was further improved with the variable conductivity model. The temperature curves followed a similar trend. The AFRE predictions were good but they did not capture the characteristic dip in temperature just before the bed became exhausted. Interestingly, the variable conductivity model did capture this dip, at least qualitatively. Similar trends were observed with all the other experimental runs from this fractional factorial design study.
0 1 2 3 4t (hrs)
15
20
25
Experimenth = 132 W/m2/Kh = 41.625 W/m2/KAFREVariable Conductivity
310
320
330
T (o K
)
AverageTopRHSBottomLHSh = 41.625 W/m2/Kh = 132 W/m2/KAFREVariable Conductivity
0 1 2 3 4t (hrs)
0
4
8
12
P (a
tm)
Experimenth = 132 W/m2/Kh = 41.625 W/m2/KAFREVariable Conductivity
0 1 2 3 4t (hrs)
160
200
240
280
320
T (o K
)
AverageTopRHSBottomLHSh = 41.625 W/m2/Kh = 132 W/m2/KAFREVariable Conductivity
290
300
0 1 2 3 4t (hrs)
0
5
10
P (a
tm)
Acknowledgements
Financial support provided by the National Reconnaissance Office under contract NRO-00-C-0134 is greatly appreciated. References 1. National Hydrogen Energy Roadmap, US DOE, November 2002,
http://www.eren.doe.gov/hydrogen/features.html. 2. Heung, L. K. Hypothesis II conference proceedings, Norway,
1997, 1. 3. Mat, M. D.; and Kaplan, Y. Int. J. Hydro. Energy, 2001, 26, 957. 4. Levesque, S.; Ciureanu, M.; Roberge, R.; and Motyka, T. Int. J.
Hydro. Energy, 2000, 25, 1095-1105. 5. Das, L. M. Int. J. Hydro. Energy, 1996, 21, 789-800. 6. Jemni, A.; Nasrallah, S. B.; and Lamloumi, J.; Int. J. Hydro.
Energy, 1999, 24, 631-644. 7. Nakagwa, T.; Inomata, A.; Aoki, H.; and Miura, T. Int. J. Hydro.
Energy, 2000, 25, 339-350. 8. Gadre, S. A.; Ebner, A. D.; Al-Muhtaseb, S. A.; Ritter, J. A. Ind.
Eng. Chem. Res., submitted, 2003; unpublished results. 9. Lochner, R. H.; Mater, J. E. Designing for Quality: An
Introduction to the Best of Taguchi and Western Methods of Statistical Experimental Design. Quality Resources, New York; ASQC Quality Press, Wisconsin, 1990.
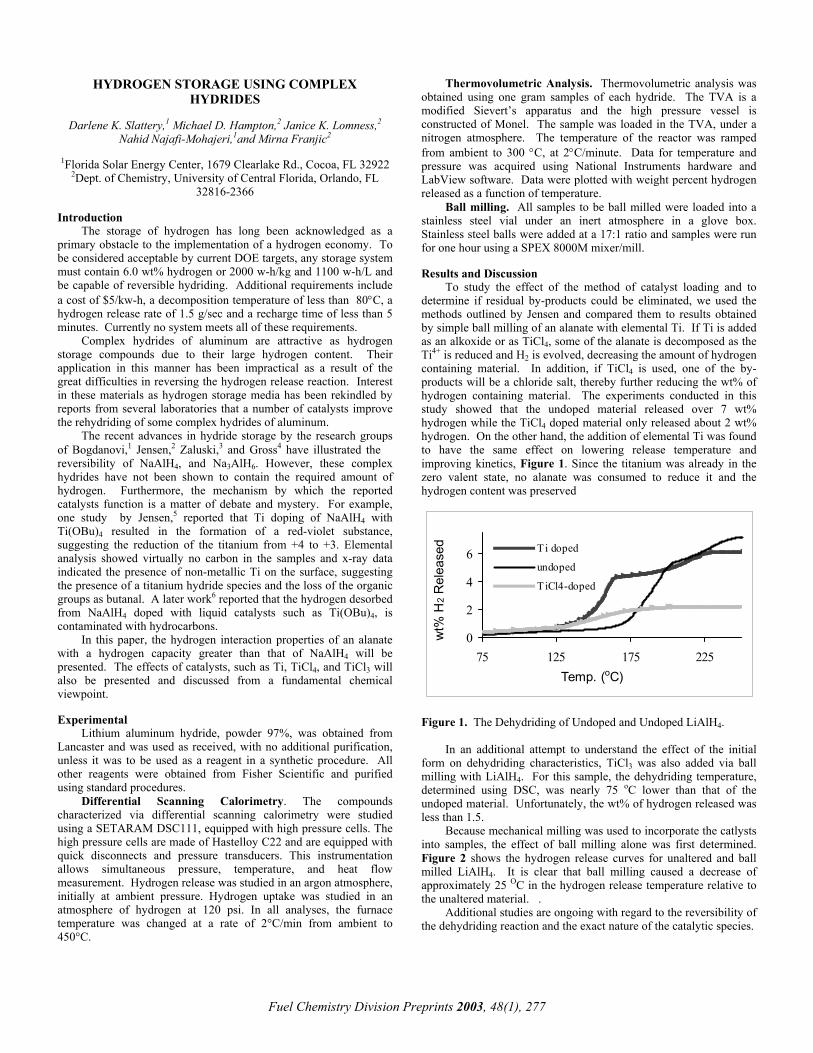
HYDROGEN STORAGE USING COMPLEX HYDRIDES
Thermovolumetric Analysis. Thermovolumetric analysis was obtained using one gram samples of each hydride. The TVA is a modified Sievert’s apparatus and the high pressure vessel is constructed of Monel. The sample was loaded in the TVA, under a nitrogen atmosphere. The temperature of the reactor was ramped from ambient to 300 °C, at 2°C/minute. Data for temperature and pressure was acquired using National Instruments hardware and LabView software. Data were plotted with weight percent hydrogen released as a function of temperature.
Darlene K. Slattery,1 Michael D. Hampton,2 Janice K. Lomness,2
Nahid Najafi-Mohajeri,1and Mirna Franjic2
1Florida Solar Energy Center, 1679 Clearlake Rd., Cocoa, FL 32922
2Dept. of Chemistry, University of Central Florida, Orlando, FL 32816-2366
Ball milling. All samples to be ball milled were loaded into a stainless steel vial under an inert atmosphere in a glove box. Stainless steel balls were added at a 17:1 ratio and samples were run for one hour using a SPEX 8000M mixer/mill.
Introduction The storage of hydrogen has long been acknowledged as a
primary obstacle to the implementation of a hydrogen economy. To be considered acceptable by current DOE targets, any storage system must contain 6.0 wt% hydrogen or 2000 w-h/kg and 1100 w-h/L and be capable of reversible hydriding. Additional requirements include a cost of $5/kw-h, a decomposition temperature of less than 80°C, a hydrogen release rate of 1.5 g/sec and a recharge time of less than 5 minutes. Currently no system meets all of these requirements.
Results and Discussion
To study the effect of the method of catalyst loading and to determine if residual by-products could be eliminated, we used the methods outlined by Jensen and compared them to results obtained by simple ball milling of an alanate with elemental Ti. If Ti is added as an alkoxide or as TiCl4, some of the alanate is decomposed as the Ti4+ is reduced and H2 is evolved, decreasing the amount of hydrogen containing material. In addition, if TiCl4 is used, one of the by-products will be a chloride salt, thereby further reducing the wt% of hydrogen containing material. The experiments conducted in this study showed that the undoped material released over 7 wt% hydrogen while the TiCl4 doped material only released about 2 wt% hydrogen. On the other hand, the addition of elemental Ti was found to have the same effect on lowering release temperature and improving kinetics, Figure 1. Since the titanium was already in the zero valent state, no alanate was consumed to reduce it and the hydrogen content was preserved
Complex hydrides of aluminum are attractive as hydrogen storage compounds due to their large hydrogen content. Their application in this manner has been impractical as a result of the great difficulties in reversing the hydrogen release reaction. Interest in these materials as hydrogen storage media has been rekindled by reports from several laboratories that a number of catalysts improve the rehydriding of some complex hydrides of aluminum.
The recent advances in hydride storage by the research groups of Bogdanovi,1 Jensen,2 Zaluski,3 and Gross4 have illustrated the reversibility of NaAlH4, and Na3AlH6. However, these complex hydrides have not been shown to contain the required amount of hydrogen. Furthermore, the mechanism by which the reported catalysts function is a matter of debate and mystery. For example, one study by Jensen,5 reported that Ti doping of NaAlH4 with Ti(OBu)4 resulted in the formation of a red-violet substance, suggesting the reduction of the titanium from +4 to +3. Elemental analysis showed virtually no carbon in the samples and x-ray data indicated the presence of non-metallic Ti on the surface, suggesting the presence of a titanium hydride species and the loss of the organic groups as butanal. A later work6 reported that the hydrogen desorbed from NaAlH4 doped with liquid catalysts such as Ti(OBu)4, is contaminated with hydrocarbons.
0
2
4
6
75 125 175 225Temp. (oC)
wt%
H2 R
elea
sed Ti doped
undoped
T iCl4-doped
In this paper, the hydrogen interaction properties of an alanate with a hydrogen capacity greater than that of NaAlH4 will be presented. The effects of catalysts, such as Ti, TiCl4, and TiCl3 will also be presented and discussed from a fundamental chemical viewpoint. Experimental Figure 1. The Dehydriding of Undoped and Undoped LiAlH4.
Lithium aluminum hydride, powder 97%, was obtained from Lancaster and was used as received, with no additional purification, unless it was to be used as a reagent in a synthetic procedure. All other reagents were obtained from Fisher Scientific and purified using standard procedures.
In an additional attempt to understand the effect of the initial
form on dehydriding characteristics, TiCl3 was also added via ball milling with LiAlH4. For this sample, the dehydriding temperature, determined using DSC, was nearly 75 oC lower than that of the undoped material. Unfortunately, the wt% of hydrogen released was less than 1.5.
Differential Scanning Calorimetry. The compounds characterized via differential scanning calorimetry were studied using a SETARAM DSC111, equipped with high pressure cells. The high pressure cells are made of Hastelloy C22 and are equipped with quick disconnects and pressure transducers. This instrumentation allows simultaneous pressure, temperature, and heat flow measurement. Hydrogen release was studied in an argon atmosphere, initially at ambient pressure. Hydrogen uptake was studied in an atmosphere of hydrogen at 120 psi. In all analyses, the furnace temperature was changed at a rate of 2°C/min from ambient to 450°C.
Because mechanical milling was used to incorporate the catlysts into samples, the effect of ball milling alone was first determined. Figure 2 shows the hydrogen release curves for unaltered and ball milled LiAlH4. It is clear that ball milling caused a decrease of approximately 25 OC in the hydrogen release temperature relative to the unaltered material. .
Additional studies are ongoing with regard to the reversibility of the dehydriding reaction and the exact nature of the catalytic species.
Fuel Chemistry Division Preprints 2003, 48(1), 277

0
2
4
6
75 125 175 225
Temperature (oC)
wt%
H2 R
elea
sed
undoped
ballmilledLiAlH4
Figure 2. The Dehydriding of Ball Milled and Unaltered LiAlH4 Conclusions
The influence of the method of addition and the form of the titanium added to LiAlH4 were studied. Titanium added in the form of TiCl3 lowered the release temperature by the greatest amount but the quantity of hydrogen released was also the lowest. Adding elemental titanium via ball milling decreased the release temperature by 30 oC while maintaining the weight content of hydrogen. Ball milling in the absence of a catalyst was also shown to decrease the release temperature, increase kinetics and preserve hydrogen content.
Acknowledgement. The authors gratefully acknowledge funding from the Department of Energy under cooperative agreement DE-FC36-01GO11094.
Fuel Chemistry Division Preprints 2003, 48(1), 278
References
1 Bogdanovi, B., Brand, R. A., Marjanovic, A., Schwickardi, M. and
Tolle, J. J. Alloys and Compounds, 2000, 302, 36. 2 Jensen, C. M., Zidan, R., Mariels, N., Hee, A. and Hagen, C. Int. J.
Hydrogen E., 1999, 24, 461. 3 Zaluski, L., Zaluska A., and Ström-Olsen, J.O. J Alloys and Compounds,
1999, 290, 71. 4 Gross, K.J., Guthrie, S., Takara, S., and Thomas, G. J. Alloys Comp.,
2000, 297, 270. 5 Jensen, C. M., Zidan, R., Mariels, N., Hee, A., and Hagen, C. Int. J.
Hydrogen E., 1999, 24, 461. 6 Gross, K.J., Thomas, G.J., and Jensen, C.M. J. Alloys and Compounds,
2002, 330-332, 683.

PERFORMANCE OF METAL-DOPED SODIUM ALUMINIUM HYDRIDE FOR REVERSIBLE
HYDROGEN STORAGE
Results and Discussion Figure 1 shows the TGA results for catalyzed NaAlH4 with 1
to 4 mole% TiCl3. The 4 mole% Ti sample exhibits the best behavior with respect to the H2 desorption kinetics, while the 1 mole% Ti sample has the highest H2 capacity. In the recent study by Sandrock et al,6 they found that the TiCl3 was completely reduced by Na in the NaAlH4 to form NaCl and most likely zero-valent Ti. This solid state reaction can be written as: 6
Jun Wang1, Armin D. Ebner1, Keith R. Edison1, James A. Ritter1, and Ragaiy Zidan2.
1Department of Chemical Engineering
University of South Carolina Columbia, SC 29208 USA (1-x)NaAlH4+xTiCl3→(1-4x)NaAlH4+3xNaCl+xTi+3xAl+6xH2 (3) 2Westinghouse Savannah River Company where x is the mole fraction of TiCl3 in the NaAlH4. This reaction shows that the H2 capacity depends on the amount of TiCl3 in the sample. Theoretically, after doping with 4 mole% Ti, the H2 capacity decreases to 4.6 wt%; the experimental value obtained here is very close to this value at 4.5 wt%. Clearly, the TiCl3 loading has a negative effect on the H2 capacity. In contrast, the TiCl3 loading has a positive effect on the H2 desorption kinetics, which increases with increasing TiCl3 loading.
Savannah River Technology Center Aiken, SC 29804 USA
Introduction
Metal-doped NaAlH4 is becoming a very promising material for H2 storage because it contains a high concentration of useful hydrogen (5.6 wt%). At standard conditions, the dehydrogenation of NaAlH4 is thermodynamically favorable, but it is kinetically slow and takes place at temperatures well above 200°C in a two-step process involving the following reactions:1-4
0.0
1.0
2.0
3.0
4.0
5.0
50 100 150 200 250
Temperature (oC)
Des
orbe
d H
ydro
gen
(wt%
)
1% to 4%Ti
1% to 4%Ti
3NaAlH4 Na3AlH6 + 2Al + 3H2 (1) Na3AlH6 3NaH + Al + 3/2H2 (2) The first work on the doping of NaAlH4 with Ti used solution chemistry techniques, whereby nonaqueous solutions of NaAlH4 and either TiCl3 or Ti(OBun)4 catalyst precursors were decomposed to solid Ti-doped NaAlH4.1 Zidan et al.2 and other investigators3-5 discovered later that a further lowering of the dehydrogenation temperature was highly dependent on the doping and homogenization procedures. They also found that Zr when mixed with Ti improved the dehydrogenation reversibility of NaAlH4 over Ti alone. These favorable effects of using mixed metals as the dopant generated interest in trying other combinations of mixed metal catalysts. The objective of this study is to show the effects of Ti, Fe, Zr and their combinations on the H2 desorption kinetics of NaAlH4.
Figure 1. TGA analyses of NaAlH4 doped with 1 to 4 mole% Ti. Figure 2 shows the TGA analyses for NaAlH4 doped with 4 mole% each of the three different metal chlorides. The 4 mole% Ti sample exhibits the best behavior with respect to the H2 desorption kinetics, followed by 4 mole% Zr and then 4 mole% Fe. This result confirms that Ti by itself is the best catalyst with respect to the kinetic behavior. Figure 3 shows the TGA analyses for NaAlH4 catalyzed with 4 mole% metal, but in different combinations and with each containing with 1 mole% Fe. The 1 mole% Fe-3 mole% Ti sample exhibits the best behavior with regard to the H2 desorption kinetics and again the kinetics increase with increasing Ti loading. Figures 4 to 6 compare the 1 to 3 mole% Ti samples with different amounts of Fe and Zr and Ti itself. All the mixed metal samples with the same Ti loading have similar profiles, i.e., the samples with 1 or 2 mole% Ti exhibit similar kinetics and H2 capacity. However, by comparing with Ti alone at the same loading, the 1 or 2 mole% Ti mixed with different metals show an improved kinetic profile, while losing some H2 capacity. Surprisingly, the 1 mole% Fe-3 mole% Ti sample is better than the 4 mole% Ti sample with respect to H2 desorption kinetics, but it does nothing for improving the kinetics of the second reaction depict in eq 2. This synergistic behavior with the Fe-Ti mixed catalyst system is very interesting and needs to be explored in more detail. In general, however, all the samples containing Ti exhibited the best behavior.
Experimental TiCl3 (Aldrich), FeCl3 (Aldrich, 99.99%, anhydrous) and ZrCl4 (Aldrich, 99.9%) were used as received as the catalyst precursors. Crystalline NaAlH4 (Fluka) was purified from a THF (Aldrich, 99.9%, anhydrous) solution and vacuum dried. The dried NaAlH4 was mixed with a predetermined amount of catalyst in THF to produce a doped sample in the desired concentration up to 4 mole% total metal. Samples containing a single catalyst or a combination of them were all prepared in this manner. The THF was evaporated while the NaAlH4 and the catalyst were mixed manually for about 30 minutes using a mortar and pestle, or until the samples were completely dry. These mixtures were then ball-milled for 2 h, using a high-energy SPEX 8000 mill. The above procedures were carried out in a N2–laden glove box free of oxygen and moisture. A Perkin-Elmer thermogravimetric analyzer (TGA) was used to determine the hydrogen desorption kinetics at atmospheric pressure. This instrument was located in another glove box under nitrogen atmosphere to prevent any exposure of the samples to air and moisture. Samples were heated to 250°C at a ramping rate of 5°C/min under 1 atm of He, using an initial 1 minute delay to ensure an environment of pure He. Approximately 10 mg of sample were used in the TGA.
Fuel Chemistry Division Preprints 2003, 48(1), 279

0.0
1.0
2.0
3.0
4.0
5.0
50 100 150 200 250
Temperature (oC)
Des
orbe
d H
ygro
gen
(wt%
)
4%Ti
4%Fe
4%Zr
0.0
1.0
2.0
3.0
4.0
5.0
50 100 150 200 250Temperature (oC)
Des
orbe
d H
ydro
gen
(wt%
)
2%Ti
4%Ti
2%Ti+2%Fe
2%Ti+2%Zr
2%Ti+1%Zr+1%Fe
Figure 5. TGA analyses of NaAlH4 doped with 4 mole% metal, with at least 2 mole% Ti and varying amounts of Fe and Zr.
Figure 2. TGA analyses of NaAlH4 doped with varying amounts of the three pure metal chloride catalysts.
0.0
1.0
2.0
3.0
4.0
5.0
50 100 150 200 250
Temperature (oC)
Des
orbe
d H
ydro
gen
(wt%
)
4%Ti1Fe%+3%Ti
0.0
1.0
2.0
3.0
4.0
5.0
50 100 150 200 250Temperature (oC)
Des
orbe
d H
ydro
gen
(wt%
)
1%Fe+3%Zr
1%Fe+1%Ti+2%Zr1%Fe+2%Ti+1%Zr
1%Fe+3%Ti
Figure 6. TGA analyses of NaAlH4 doped with 1 mole% Fe-3 mole% Ti and 4 mole% Ti.
Figure 3. TGA analyses of NaAlH4 doped with 4 mole% metal, but in different combinations and with each containing with 1 mole% Fe.
Overall, these results continue to prove that doping NaAlH4 with transition metals, especially Ti, improves the H2 dehydrogenation kinetics. However, more research still needs to be done to lower the dehydrogenation temperature even further, especially for the second reaction depict in eq 2. In this study, the effect of the different transition metals played an insignificant role in reducing the dehydrogenation temperature or increasing the kinetics of the second reaction. Other metals and metal combinations are currently being explored for this purpose, as well as to further reduce the dehydrogenation temperature of the first reaction.
0.0
1.0
2.0
3.0
4.0
5.0
50 100 150 200 250
Temperature (oC)
Des
orbe
d H
ydro
gen
(wt%
)
4%Ti
1%Ti
1%Ti+3%Zr
1%Ti+2%Zr+1%Fe
1%Ti+3%Fe
1%Ti+1%Zr+3%Fe
Acknowledgements Financial support provided by SCUREF/WSRC/DOE under contract WEST052, KG09725-O, and the National Reconnaissance Office under contract NRO-00-C-0134 is greatly appreciated. Figure 4. TGA analyses of NaAlH4 doped with 4 mole% metal, but
in different combinations and with each containing with 1 mole% Ti. References 1. B. Bogdanovic, M. Schwickardi, J. Alloys Comp. 253 (1997) 1. Conclusions 2. B. Bogdanovic, R. A. Brand, A. Marjanovic, M. Schwickardi, J. Tölle, J.
Alloys Comp. 302 (2000) 36. In an ongoing effort to reduce the kinetic limitation of the dehydrogenation of NaAlH4, while maintaining sufficient H2 capacity, the effect of different transition metal catalysts (Ti, Zr, Fe) in various combinations have been investigated using thermogravimetric analyses. The Ti doped systems, in all cases, exhibited the lowest H2 desorption temperature, with the H2 desorption kinetics improving with an increase in the Ti loading, but at the expense of decreasing the H2 capacity. In all samples doped with 4 mole% combinations of Ti, Zr and Fe, the Ti played the most important role; however, an interesting synergistic behavior was revealed when doping NaAlH4 with 1 mole% Fe and 3 mole% Ti.
3. R. A. Zidan, S. Takara, A. G. Hee C. M. Jensen, J Alloys Comp. 285 (1999) 119.
4. C. M. Jensen, R. Zidan, N. Mariels, A. Hee, C. Hagen, Inter. J. Hydrogen Energy 24 (1999) 461.
5. C. M. Jensen, K. J. Gross, Appl. Phys. A: Mat. Sci. Proc. 72 (2001) 213. 6. G. Sandrock, K. J. Gross, G. Thomas, J Alloys Comp. 339 (20002) 299.
Fuel Chemistry Division Preprints 2003, 48(1), 280
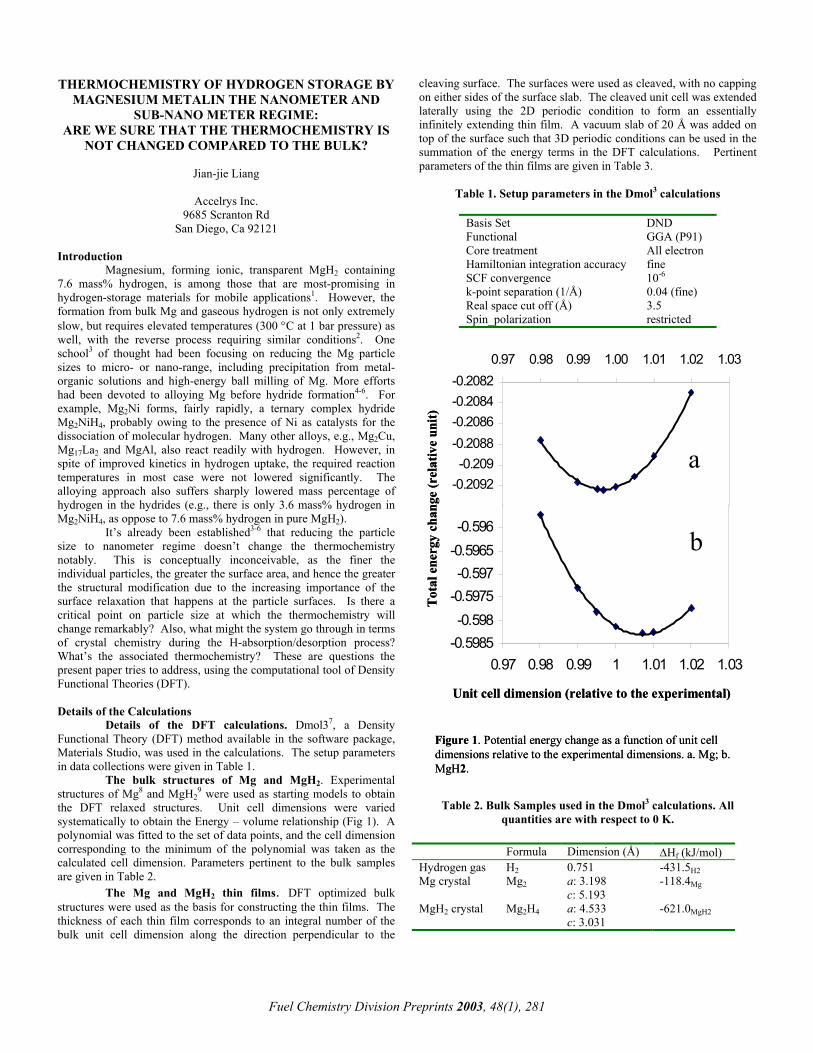
THERMOCHEMISTRY OF HYDROGEN STORAGE BY MAGNESIUM METALIN THE NANOMETER AND
SUB-NANO METER REGIME: ARE WE SURE THAT THE THERMOCHEMISTRY IS
NOT CHANGED COMPARED TO THE BULK?
Jian-jie Liang
Accelrys Inc. 9685 Scranton Rd
San Diego, Ca 92121 Introduction
Magnesium, forming ionic, transparent MgH2 containing 7.6 mass% hydrogen, is among those that are most-promising in hydrogen-storage materials for mobile applications1. However, the formation from bulk Mg and gaseous hydrogen is not only extremely slow, but requires elevated temperatures (300 °C at 1 bar pressure) as well, with the reverse process requiring similar conditions2. One school3 of thought had been focusing on reducing the Mg particle sizes to micro- or nano-range, including precipitation from metal-organic solutions and high-energy ball milling of Mg. More efforts had been devoted to alloying Mg before hydride formation4-6. For example, Mg2Ni forms, fairly rapidly, a ternary complex hydride Mg2NiH4, probably owing to the presence of Ni as catalysts for the dissociation of molecular hydrogen. Many other alloys, e.g., Mg2Cu, Mg17La2 and MgAl, also react readily with hydrogen. However, in spite of improved kinetics in hydrogen uptake, the required reaction temperatures in most case were not lowered significantly. The alloying approach also suffers sharply lowered mass percentage of hydrogen in the hydrides (e.g., there is only 3.6 mass% hydrogen in Mg2NiH4, as oppose to 7.6 mass% hydrogen in pure MgH2).
It’s already been established3-6 that reducing the particle size to nanometer regime doesn’t change the thermochemistry notably. This is conceptually inconceivable, as the finer the individual particles, the greater the surface area, and hence the greater the structural modification due to the increasing importance of the surface relaxation that happens at the particle surfaces. Is there a critical point on particle size at which the thermochemistry will change remarkably? Also, what might the system go through in terms of crystal chemistry during the H-absorption/desorption process? What’s the associated thermochemistry? These are questions the present paper tries to address, using the computational tool of Density Functional Theories (DFT). Details of the Calculations
Details of the DFT calculations. Dmol37, a Density Functional Theory (DFT) method available in the software package, Materials Studio, was used in the calculations. The setup parameters in data collections were given in Table 1.
The bulk structures of Mg and MgH2. Experimental structures of Mg8 and MgH2
9 were used as starting models to obtain the DFT relaxed structures. Unit cell dimensions were varied systematically to obtain the Energy – volume relationship (Fig 1). A polynomial was fitted to the set of data points, and the cell dimension corresponding to the minimum of the polynomial was taken as the calculated cell dimension. Parameters pertinent to the bulk samples are given in Table 2.
The Mg and MgH2 thin films. DFT optimized bulk structures were used as the basis for constructing the thin films. The thickness of each thin film corresponds to an integral number of the bulk unit cell dimension along the direction perpendicular to the
cleaving surface. The surfaces were used as cleaved, with no capping on either sides of the surface slab. The cleaved unit cell was extended laterally using the 2D periodic condition to form an essentially infinitely extending thin film. A vacuum slab of 20 Å was added on top of the surface such that 3D periodic conditions can be used in the summation of the energy terms in the DFT calculations. Pertinent parameters of the thin films are given in Table 3.
Table 1. Setup parameters in the Dmol3 calculations
Basis Set DND Functional GGA (P91) Core treatment All electron Hamiltonian integration accuracy fine SCF convergence 10-6 k-point separation (1/Å) 0.04 (fine) Real space cut off (Å) 3.5 Spin_polarization restricted
-0.5985-0.598
-0.5975-0.597
-0.5965-0.596
-0.5955
0.97 0.98 0.99 1 1.01 1.02 1.03
0 2094-0.2092-0.209
-0.2088-0.2086-0.2084-0.2082
0.97 0.98 0.99 1.00 1.01 1.02 1.03
Unit cell dimension (relative to the experimental)
Tot
al e
nerg
y ch
ange
(rel
ativ
e un
it)
a
b
Figure 1. Potential energy change as a function of unit cell dimensions relative to the experimental dimensions. a. Mg; b. MgH2.
-0.5985-0.598
-0.5975-0.597
-0.5965-0.596
-0.5955
0.97 0.98 0.99 1 1.01 1.02 1.03
0 2094-0.2092-0.209
-0.2088-0.2086-0.2084-0.2082
0.97 0.98 0.99 1.00 1.01 1.02 1.03
-0.5985-0.598
-0.5975-0.597
-0.5965-0.596
-0.5955
0.97 0.98 0.99 1 1.01 1.02 1.03
0 2094-0.2092-0.209
-0.2088-0.2086-0.2084-0.2082
0.97 0.98 0.99 1.00 1.01 1.02 1.03
-0.5985-0.598
-0.5975-0.597
-0.5965-0.596
-0.5955
0.97 0.98 0.99 1 1.01 1.02 1.03
0 2094-0.2092-0.209
-0.2088-0.2086-0.2084-0.2082
0.97 0.98 0.99 1.00 1.01 1.02 1.03
Unit cell dimension (relative to the experimental)
Tot
al e
nerg
y ch
ange
(rel
ativ
e un
it)
a
b
Figure 1. Potential energy change as a function of unit cell dimensions relative to the experimental dimensions. a. Mg; b. MgH2.
Table 2. Bulk Samples used in the Dmol3 calculations. All
quantities are with respect to 0 K.
Formula Dimension (Å) ∆Hf (kJ/mol) Hydrogen gas H2 0.751 -431.5H2 Mg crystal Mg2 a: 3.198
c: 5.193 -118.4Mg
MgH2 crystal Mg2H4 a: 4.533 c: 3.031
-621.0MgH2
Fuel Chemistry Division Preprints 2003, 48(1), 281

Table 3. Mg and MgH2 surface slabs used in the Dmol3 calculations
Cell Depth Formula Thickness
(Å) ∆Hf(0K)Mg (kJ/mol)
Mg 110 1 Mg2 1.599 -60.855 2 Mg4 3.198 -89.317 3 Mg6 4.798 -99.477 4 Mg8 6.397 -105.053 5 Mg10 7.996 -108.001 6 Mg12 9.595 -110.029 7 Mg14 11.194 -111.458 8 Mg16 12.794 -112.621 9 Mg18 14.393 -113.523
MgH2 001
1 Mg2H4 3.031 -563.267 2 Mg4H8 6.062 -578.529 3 Mg6H12 9.093 -591.243 4 Mg8H16 12.124 -598.410 5 Mg10H20 15.155 -602.856 6 Mg12H24 18.186 -605.871 7 Mg14H28 21.217 -608.030 8 Mg16H32 24.248 -609.652 9 Mg18H36 27.279 -610.916
Table 4. Thermochemical cycle used in the calculation of enthalpy of formation at 0 K of MgH2 from gaseous H and crystalline
MgH2 Reaction ∆H (kJ/mol) (1) H (element) + H (element) → H2 (gas) -431.5 (2) H (element) + H (element) + Mg (element)
→ MgH2 (crystal) -621.0
(3) Mg (element) → Mg (crystal) -118.4 Mg (crystal) + H2 (gas) → MgH2 (crystal) ∆Hf = - ∆H1 + ∆H2 - ∆H3 -71.1 The enthalpy of formation at 0 K (Table 4) for MgH2 is –71.1 kJ/mol. The value is well within the experimental uncertainty to the observed value11 of –68.00 ± 9.2 KJ/mol.
Thin Films. Table 3 gives the enthalpies of formation from elements of the Mg and MgH2 thin films of various thickness obtained directly from the Dmol3 calculations. For both Mg and MgH2, the enthalpy of formation becomes steadily less negative as the film thickness decreases, and , in the range of 9 to 1 unit-cell thickness, the net enthalpy change amount to ~ 50 kJ/molMg. It is apparent that, as the film thickness decreases, the structural stability of the materials decreases considerably.
Based on these enthalpies of formation from elements, the
enthalpies of hydridation were calculated and plotted in Figure 2.
Calculation of enthalpy of formation. Dmol3 calculations give binding energy, EB, the energy to separate the constituent elements to infinity at 0 K, corrected with the zero point vibration term10:
Thin film thickness (in number of unit-cell depth)
Enth
alpy
of f
orm
atio
n (k
J/m
ol)
-75
-70
-65
-60
-55
-500 1 2 3 4 5 6 7 8 9 10
∆Hf BULK
Figure 2. Variation of enthalpy of formation of hydriding Mg thin films as a function of Mg film thickness. Solid squares represent data points derived from the DFT calculation results.
∑=es
normal
iivib hE
mod
2/1 ν (1)
where h is the Planck’s constant, ν the frequency of a normal mode. By definition, EB is the enthalpy of formation of the compound under consideration from elements. For a given reaction, e.g., Mg (crystal) + H2 (gas) = MgH2 (crystal) (2) a thermochemical cycle (Table 4) can be constructed to calculate the enthalpy of formation, based on the enthalpies of formation of the individual compounds given by the Dmol3 calculations. Note that the enthalpy of formation in this example corresponds to that at 0 K. With the set of normal modes also given by the DMol3 calculation, corrections can be made to account for the finite temperature effects10 such that the enthalpy of formation at a given temperature can be obtained.
The smallest enthalpy change, corresponding to 2 unit-cell thickness (1.6 Å Mg / 3.0 Å MgH2) of the film, is 57.7 KJ/molMg. This enthalpy change is over 10 KJ/mol smaller than that of the bulk. In addition, it is important to note that the upper bound of enthalpy change for systems that are suitable for mobile storage is 24 kJ/molH
1. As there are 2 H per MgH2, the enthalpy change corresponding to films of 2 unit-cell thickness is 57.7/2 = 28.9 kJ/molH, a mere 5 kJ/molH over the desired value.
In the present paper, enthalpy of formation all referred to the 0 K state, unless specifically specified otherwise. Results and Discussions
Bulk Materials. The optimized unit cell dimensions based on the energy – volume relation (Fig. 1) are within –0.4 and 0.7% to the experimental values for bulk Mg and MgH2, respectively. The good agreement between the calculated and the experimentally observed cell dimension is an indication that the DFT functional and the basis set chosen are appropriate for the systems under study.
Excluding the case of thin film thickness of 1 unit-cell depth, there’s a clear trend that, as the film thickness increases, the enthalpy change also increases steadily. When the film thickness increased to that of 9 cell depth (14 Å Mg / 27 Å MgH2), the enthalpy
Fuel Chemistry Division Preprints 2003, 48(1), 282

change becomes 65.9 kJ/molMg, approaching that of the balk of 71.1 kJ/molMg. Therefore, it’s not surprising that, even when the particle sizes were reduced to the nanometer range, there’s still no apparent change in the enthalpy of formation3-6. The thin film of thickness of just 1 unit-cell depth behaves differently from the other films of greater thickness, by breaking the trend of decreasing change of enthalpy of formation and giving a value close to that of the bulk (Fig. 2). This behavior can be explained as a result of MgH2 loosing its identity structurally compared to the bulk (Fig. 3). While Mg and H are 6- and 3-coordinated, respectively, in the bulk structure, they are 4- and 2-coordinated in the film of 1 unit-cell depth. In fact, attempts to cap the surfaces of the film with H only resulted in the stoichometrically excess hydrogen to be driven away from the surfaces to form molecular hydrogen in a Dmol3 geometry optimization.
Fuel Chemistry Division Preprints 2003, 48(1), 283
How will the thermochemistry change if there is cohesive
addition/subtraction to the layers in the hydrogen absorption/desorption processes? Using the same set of thermochemical data in Table 3 and the thermochemical cycle similar to that in Table 4, thermochemistry of such hypothetical combinations can be mapped out (Fig. 4). Two important points can be drawn. First, be it a forward (absorption) or reverse (desorption) reaction, if there is a decrease in film thickness of the product (e.g. in a decrepitation), the enthalpy change will increase significantly (by as much as 50 kJ/molMg in the present system). While such change is unfavorable in the desorption process, it may be beneficial in the absorption process. Secondly, if there is a cohesive increase of film thickness of the product, the enthalpy change decreases steadily. For example, when the MgH2 films of 2 unit-cell thickness desorb and forms Mg films that are structurally coehsive in 9 unit-cell thickness, then the enthalpy change becomes 33 kJ/molMg, or 17 kJ/molH, well within the range suitable for mobile storage, of 15 - 24 kJ/molH1. Conclusions
The DFT method reliably reproduced the known value of enthalpy of formation of bulk MgH2 formed from gas-phase H and crystalline Mg. The same method was extended to thin films of Mg and MgH2 of thickness ranging from 1 to 9 unit cell depths (sub-nanometer to low nanometer thickness). A clear trend was observed that, as the thickness of the film decreases, so does the enthalpy change, to a smallest value of 29 KJ/molH at 2 unit-cell depth, close to the upper bound (24 KJ/molH) of the desired enthalpy change for
systems that are suitable for mobile storage. On the other hand, the enthalpy change approaches that of the bulk value (or to within the error limit of experimental observations) as the thin film thickness increases towards the high nanometer regime. The results also suggested that it is thermo- chemically advantageous if there is cohesion of the products during the desorption process.
1.00
3.00
5.00
7.00
9.00 1.00
3.005.00
7.009.00
-120-110-100
-90-80-70-60-50-40-30-20-10
0
Thin film thickness, MgH2 Thin film thickness, M
gE
ntha
lpy
of fo
rmat
ion,
Hyd
ridi
ng (k
J/m
ol)
1.00
3.00
5.00
7.00
9.00 1.00
3.005.00
7.009.00
-120-110-100
-90-80-70-60-50-40-30-20-10
0
-120-110-100
-90-80-70-60-50-40-30-20-10
0
Thin film thickness, MgH2 Thin film thickness, M
gE
ntha
lpy
of fo
rmat
ion,
Hyd
ridi
ng (k
J/m
ol)
Figure 4. Variation of enthalpy of formation of hydriding Mg thin films. The thin films hypothetically assumes arbitrary thickness (in term of the number of unit-cell depth) before and after hydridation. Solid dots represent data points of comparable thin film thickness before and after hydridation (e.g. 1 unit-cell depth before and after hydridation).
1.00
3.00
5.00
7.00
9.00 1.00
3.005.00
7.009.00
-120-110-100
-90-80-70-60-50-40-30-20-10
0
Thin film thickness, MgH2 Thin film thickness, M
gE
ntha
lpy
of fo
rmat
ion,
Hyd
ridi
ng (k
J/m
ol)
1.00
3.00
5.00
7.00
9.00 1.00
3.005.00
7.009.00
-120-110-100
-90-80-70-60-50-40-30-20-10
0
-120-110-100
-90-80-70-60-50-40-30-20-10
0
Thin film thickness, MgH2 Thin film thickness, M
gE
ntha
lpy
of fo
rmat
ion,
Hyd
ridi
ng (k
J/m
ol)
Figure 4. Variation of enthalpy of formation of hydriding Mg thin films. The thin films hypothetically assumes arbitrary thickness (in term of the number of unit-cell depth) before and after hydridation. Solid dots represent data points of comparable thin film thickness before and after hydridation (e.g. 1 unit-cell depth before and after hydridation).
acb
Figure 3. Structure models of MgH2. a. Dmol3 optimized 2D repeating unit of 1 unit-cell depth cleaved along the 001 surface; b. Dmol3 optimized 2D repeating unit of 2 unit-cell depth cleaved along the 001 surface; c. Bulk unit cell.
acb
acb
Figure 3. Structure models of MgH2. a. Dmol3 optimized 2D repeating unit of 1 unit-cell depth cleaved along the 001 surface; b. Dmol3 optimized 2D repeating unit of 2 unit-cell depth cleaved along the 001 surface; c. Bulk unit cell.
References
1. Schlapbach, L. & Zuttel, A., Nature, 2001, 414, 353 2. Schlapbach, L. (e.d.) Hydrogen in Intermetallic Compounds I.
Electronic, Thermodynamic, and Crystallographyic Properties (Topics in Applied Physics Vol 63) (Springer, 1988)
3. Zaluska, A., Zaluski, L., & Stroem-Olsen, J. O., Appl. Phys. A, 2001, 72, 157
4. Akiba, E. & Iba, H., Intermetallics 6, 1998, 461 5. Kuriiwa, T. et al., J. Alloys Compounds, 1999, 295, 433 6. Tsukahara, M. et al., J. Electrochem. Soc., 2000, 147, 2941 7. Delley, B., J. Chem. Phys., 1990, 92, 508 8. Wyckoff, R.W.G., in Crystal Structures, volume 1, Interscience,
John Wiley & Sons, 1963. 9. Zachariasen, B.H., Holley, C.E., Jr, and Stamper, J.F., Jr., Acta
Cryst., 1963, 16, 352 10. Hehre, W.J., Radom, L., Schleyer, P.v.R., Pople, J.A., AB Initio
molecular orbital theory (John wiley & Sons, 1986) 11. Gurvih, L.V., Veyts, I.V., and Alocock, C.B. (eds) Thermodynamic
properties of individual substances, 4th ed; Vol. 2, Part I, II. (Hemisphere, New York, 1990)

Hydrogen Separation by Zeolite Membranes 3. NaA Zeolite Membrane Synthesis One side of the support was coated with NaA zeolite crystals as nucleation seeds before synthesis.6 The synthesis mixture was prepared by mixing sodium aluminate, sodium silicate solution, sodium hydroxide and water. The molar ratio of the resultant gel mixture was 3Na2O:2SiO2:Al2O3: 200H2O. The synthesis was carried out at 363 K for 24 hours in a stainless steel autoclave with the seeded support held vertically in the synthesis mixture by a Teflon holder. After synthesis, the membrane was washed several times with deionized water until the pH of the washings became neutral, then dried at 423 K for 3 hours. In order to obtain a high quality NaA zeolite membrane, the synthesis was repeated two times (refer to as three-stage synthesis).
Xiaochun Xu*,1,2, Weishen Yang*,2, Chunshan Song*,1, Jie Liu2, and Liwu Lin2
1. Clean Fuels and Catalysis Program, The Energy Institute, and Department
of Energy & Geo-Environmental Engineering, The Pennsylvania State University, 209 Academic Projects Building, University Park, PA 16802,
USA 2. State Key Laboratory of Catalysis, Dalian Institute of Chemical Physics,
Chinese Academy of Sciences, Dalian 116023, China * Corresponding author: Xiaochun Xu (E-mail: [email protected]; Tel: +1-814-
865-6617; Fax: +1-814-234-8461); Weishen Yang (E-mail: [email protected]; Tel: +86-411-4379073; Fax: +86-411-4694447); Chunshan Song (E-mail: [email protected]; Tel: +1-814-863-4466; Fax: +1-
814-865-3248) 4. Characterization The structure of the as-synthesized membranes were determined by X-ray diffraction (XRD) patterns. XRD was carried out on a Ragaku D max/b powder diffractometer using Cu Kα (λ=1.54 Å) radiation operating at 40KV and 50mA. The morphology and thickness of the as-synthesized membrane were examined by scanning electron microscope (SEM). The SEM photographs were obtained on a JEM-1200E scanning electron microscope.
Introduction
Hydrogen is a potential ultra-clean energy for the future and an important chemical for the chemical and refining industries.1 With the introduction of fuel cells for vehicular propulsion and power generation, the demand of hydrogen may increase significantly.2 Using hydrogen in these areas will contribute to the reduction of energy-related environmental impacts, including anthropogenic carbon emissions; mobile source emissions such as CO, NOx, SOx, and particulates. Hydrogen can be produced from fossil fuels or non-fossil fuels such as biomass. The separation of hydrogen from its source gas mixtures is often the first step for the hydrogen applications. Membrane separation is one of the promising methods for hydrogen separation. Currently, palladium (or palladium alloy) membranes3 are widely studied and mixed protonic-electronic conducting membranes4 was reported recently. Palladium and mixed conducting hydrogen membrane showed high hydrogen selectivity. However, they have the disadvantage of the low flux. In addition, the palladium membrane shows hydrogen brittleness and may not be applied for long-term use.3
5. Gas Permeation Measurement The as-synthesized membranes were sealed in a permeation module with the zeolite membrane on the high-pressure side. The gas permeances (flux) of the membranes were measured by a soap-film flowmeter under a pressure difference of 0.10 MPa at different temperatures. The permselectivity of A/B is defined as the permeance ratio of the gas A and the gas B. Results and Discussions
1. MFI zeolite Membrane The as-synthesized membrane was characterized by XRD and SEM. The XRD patterns (not shown) represented the sum of the diffraction patterns of MFI zeolite and α-Al2O3 support, which indicated that pure MFI zeolite membrane was synthesized on the support surface. SEM images (Figure 1) showed that the zeolite crystals inter-grew well and the thickness of the MFI zeolite membrane was about 35 µm.
The molecular size of hydrogen is 2.89 Å, and is much smaller than those of the other gases, e.g., 3.64 Å for N2 and 4.3 Å for normal alkanes.5 Zeolite is a kind of crystalline materials with uniform-sized pores between 3-10 Å. Therefore, hydrogen can be separated from gas mixtures through molecular sieving or configuration diffusion mechanism if zeolite can be configured into membrane form. Here, we report the synthesis and hydrogen separation properties of MFI and NaA zeolite membrane. Experimental 1. Support A self-made porous α-Al2O3 disk (30 mm in diameter, 3 mm in thickness, 0.1~0.3 µm pore radius, about 50% porosity) was used as the support. The surface of the support was polished with sand paper on both sides, after which the support was cleaned with deionized water in an ultrasonic cleaner for ca. 3-5 min to remove the loose particles created during polishing. Before hydrothermal synthesis or coating the nucleation seeds, the cleaned support was calcined in air at 673 K for 3 hours with a heating and cooling rate of 4 K/min to burn off the organics on the support surface.
(a) (b) Figure 1. Top view (a) and cross-section (b) SEM image of MFI zeolite
membrane.
2. MFI Zeolite Membrane Synthesis The synthesis mixture was prepared from silica sol, sodium hydroxide, tetrapropylammonium bromide (TPABr) and water. The molar ratio of the resultant solution mixture was 4Na2O:5TPABr:100SiO2: 10000H2O. The crystallization was carried out at 453 K for 24 hours in a stainless steel autoclave with the support held vertically in the synthesis mixture by a Teflon holder. After synthesis, the membrane was washed several times with deionized water, dried at 373 K and calcined at 773 K in the air to remove TPABr which occluded the zeolite channels.
Gas permeation property of the MFI zeolite membrane was shown in Figure 2. Before synthesis, the α-Al2O3 support showed a H2 permeance of 1.69×10⁻⁵ mol/m2.s.Pa, and H2/N2, H2/n-C4H10 permselectivity of 2.68 and 1.51 at 298 K (Figure 5). After synthesized the MFI zeolite membrane on the support, the H2 permeance decreased to 5.98×10⁻⁸ mol/m2.s.Pa, which was only 0.35% of the α-Al2O3 support. The H2/N2 permselectivity slightly increased to 3.08 and the H2/n-C4H10 permselectivity sharply increased to 47.8. With the increase in permeation temperature, gas permeances increased. The H2/N2 permselectivity hardly changed and the H2/n-C4H10 permselectivity gradually decreased.
2. NaA zeolite Membrane XRD patterns of the as-synthesized membrane showed that only diffraction patterns of NaA zeolite and the α-Al2O3 support appeared in the diffraction diagram (not shown),
Fuel Chemistry Division Preprints 2003, 48(1), 284

which indicated that only NaA zeolite membrane was synthesized on the support surface. SEM images (Figure 3) showed that the zeolite crystals highly inter-grew and the thickness of the NaA zeolite membrane was about 18 µm.
Gas permeation property of the NaA zeolite membrane was shown in Figure 4. The NaA zeolite membrane showed a H2 permeance of 2.86×10⁻⁷ mol/m2.s.Pa. The H2/N2 and H2/n-C4H10 permselectivity was 23.8 and 106, respectively, at 298 K. With the increase in permeation temperature, gas permeance increased. The H2/N2 and H2/n-C4H10 permselectivity gradually decreased with the increase in permeation temperature.
5
5.5
6
6.5
7
7.5
8
8.5
9
9.5
10
270 300 330 360 390 420 450
Temperature (K)
Perm
eanc
e (×
10-8
mol
.m-2
.S-1
.Pa-1
)
0
10
20
30
40
50
60
Perm
sele
ctiv
ity
H2H2/N2H2/n-C4
Figure 2. Gas permeation Properties of MFI zeolite membrane.
Fuel Chemistry Division Preprints 2003, 48(1), 285
(a) (b) Figure 3. Top view (a) and cross-section (b) SEM image of NaA zeolite
membrane.
25
29
33
37
41
45
270 300 330 360 390 420 450
Temperature (K)
Perm
eanc
e (×
10-8
mol
.m-2
.S-1
.Pa-1
)
0
20
40
60
80
100
120
Perm
sele
ctiv
ity
H2H2/N2H2/n-C4
Figure 4. Gas permeation Properties of NaA zeolite membrane.
3. Comparison
Gas permeation properties of the α-Al2O3 support, MFI zeolite membrane and NaA zeolite membrane are compared in Figure 5. Compared the MFI zeolite membrane with NaA zeolite membrane, the NaA zeolite membrane showed not only a high permeance but
also a large permselectivity. The higher permeance of NaA zeolite membrane than that of MFI zeolite membrane can be explained by the formation of a thinner membrane for NaA zeolite membrane than for MFI zeolite membrane. The membrane thickness was 18 µm and 35 µm for NaA zeolite membrane and for MFI zeolite membrane respectively. The difference in permselectivity can be related to the different pore size of NaA zeolite and MFI zeolite. The molecular size for H2, O2, N2, n-C4H10 and i-C4H10 are 2.89 Å, 3.46 Å, 3.64 Å, 4.3 Å and 5.0 Å respectively. The pore size of NaA zeolite is 4.1 Å and the pore size of MFI zeolite is ~ 5.5 Å. Therefore, n-C4H10 should not permeate through a defect-free NaA zeolite membrane and n- C4H10 can permeate through the MFI zeolite channels. The gas separation of H2/n-C4H10 was controlled by molecular sieving for NaA zeolite membrane and by configuration diffusion for MFI zeolite membrane. This can explain the higher H2/n-C4H10 permselectivity of NaA zeolite membrane than that of MFI zeolite membrane. Since the pore size of MFI zeolite is much larger than the molecular size of N2 and the pore size of NaA zeolite is near the molecular size of N2, the H2/N2 separation showed a configuration diffusion mechanism for NaA zeolite membrane and a Knudsen diffusion behavior for MFI zeolite membrane. This can explain the higher H2/N2 permselectivity of NaA zeolite membrane than that of MFI zeolite membrane. Worthy to mention is that, n-C4H10 and i-C4H10 can all permeate through the MFI zeolite channels. Due to the configuration diffusion, MFI zeolite membrane showed a high n-C4H10/i-C4H10 permselectivity. However, since n-C4H10 and i-C4H10 all permeate through the defects in NaA zeolite membrane, NaA zeolite membrane did not show any separation on n-C4H10 and i-C4H10.
0.001
0.01
0.1
0.25 0.3 0.35 0.4 0.45 0.5 0.55
Kinetic Diameter (nm)
Perm
eanc
e (
NaAMFISupport
Figure 5 Comparison of the gas permeation properties of α-Al2O3
support, MFI zeolite membrane and NaA zeolite membrane.
1
10
100
1000
10000
×10-8
mol
.m-2
.S-1
.Pa-1
)
H2
O2 N2
n-C4H10i-C4H10
Conclusions MFI membrane and NaA zeolite membrane were successfully
synthesized on the porous α-Al2O3 support. Both the MFI and NaA zeolite membrane showed a high H2/n-C4H10 permselectivity. Since NaA zeolite has a smaller pore size than MFI zeolite, the NaA zeolite membrane has a higher H2/n-C4H10 permselectivity.
References (1) Song, C. Catalysis Today, 2002, 77, 17-50; Song, C.; Gaffney, A. M.; Fujimoto, K. (Eds). CO2 Conversion and Utilization. American Chemical Society (ACS), Washington DC, ACS Symp. Series, Vol. 809, 2002, 448 pp; (2) Armor, J.N. Applied Catalysis A: General, 1999, 176 (2), 159-176; U.S. DOE. Carbon Sequestration-Research and Development. 1999, http://www.fe.doe.gov/coal_power/sequestration/reports/ rd/index.html. (3) Paglieri, S.N.; Way, J.D. Innovations in palladium membrane research, Separ. Purif. Meth., 2002, 31, 1-169. (4) Bose, A.C.; Richards, R.E.; Sammells, A.F.; Schwartz, M. Beyond state-of-the-art gas separation processes using ion-transport membranes, Desalination, 2002, 144, 91-92. (5) Breck, D.W. (Eds). Zeolite Molecular Sieves: Structure, Chemistry and Use, John Wiley & Sons, New York, 1974. (6) Xu, X.C.; Yang, W.S.; Liu, J.; Lin, L.W. Synthesis of NaA zeolite membrane from clear solution, Microporous and Mesoporous Materials, 2001, 43, 299-311.

MECHANISM OF PERMEATION IN HYDROGEN SELECTIVE SILICA MEMBRANES
S. T. Oyama, D. Lee
Environmental Catalysis and Materials Laboratory
Department of Chemical Engineering Virginia Tech
Blacksburg, VA 24061 Introduction
Composite membranes formed by the deposition of a thin SiO2 layer on a porous Vycor glass support are well known (1-9). In this work we analyze in detail the permeation mechanism of small gas species through this silica layer. The order of permeance through the silica layer is highly unusual, He > H2 > Ne, following neither molecular weight nor size. This is the same order as observed in vitreous silica glass, but occurs with lower activation energies in the silica layer. The order of permeation is explained for the first time using a statistical approach, which takes into consideration the density of solubility sites for the various species and the vibrational frequency of the species within the sites.
The membranes are generally prepared by chemical vapor deposition of a silica precursor at low temperatures using H2O, O2 or O3 as co-reactants. This work describes the preparation of a special highly hydrogen permeable silica membrane, referred to as Nanosil, obtained by an adaptation of the method. Instead of using low temperatures, the SiO2 layer is deposited at high temperatures by thermal decomposition. This gives rise to a composite membrane with excellent selectivity (~104) for the small gas molecules (He, Ne and H2) over other larger gas molecules (CO2, CO, and CH4). The gas permeance on the deposited silica layer was obtained by applying a series analysis of gas permeation on the combined silica layer and Vycor support composite system. The experimental gas permeation data on Vycor glass support alone could be explained by a mechanism involving Knudsen diffusion in parallel with surface diffusion. Experimental
The Nanosil membrane was prepared by depositing a thin silica layer on a porous Vycor support by the chemical vapor deposition (CVD) of tetraethylorthosilicate (TEOS) at 873 K in an argon stream. Vycor glass (7930 glass, Corning, Inc.) with a 4 nm nominal average pore size was used as a substrate for the silica deposition. It had a tubular geometry with an outside diameter of 10 mm and a thickness of 1 mm. A 4 cm section of the Vycor glass was connected to two pieces of quartz tubing by glassblowing joints. This substrate was installed concentrically inside another piece of tubing of 14 mm inside diameter using machined Swagelok fittings with Teflon ferrules. After placing the assembly in an electric furnace, argon gas flows were introduced on the outer shell side (20 µmol s-1) and inner tube side (8 µmol s-1) of the reactor (flow rates in µmol s-1 may be converted to cm3 min-1 (NTP) by multiplying by 1.5), and the temperature was raised to 873 K. A flow of tetraethylorthosilicate (TEOS, Aldrich, 98%) was introduced on the inside of the Vycor substrate through a bubbler (at 298 K) using argon (3 µmol s-1) as a carrier gas. This stream was premixed with the tube stream of argon before introducing it to the tube side to produce a stream with a TEOS concentration of 0.03 mol m-3 (0.07 mol %).
General gas permeation measurements were conducted in the temperature range of 300 – 873 K by flowing 20 µmol s-1 of a pure gas at 123 kPa in the outer shell side. The permeation rate of each gas exiting from the inside of the membrane tube was measured with a sensitive bubble flow meter at atmospheric pressure. The
permeance of gas was obtained from Qi = Fi / A ∆P, where Qi is the permeance (mol m-2 s-1 Pa-1), Fi is the gas flow rate on the tube side (mol s-1), A is the surface area (m2) of the membrane section, and ∆P is the pressure difference (Pa) between the shell and tube side.
For higher sensitivity the permeance of the gases was also measured with a gas chromatograph (GC) equipped with a thermal conductivity detector (SRI, Model 8610B). The shell side gas flow rates and pressure conditions were the same as above, however, on the tube side an argon flow was introduced as a sweep gas for the permeated gas. The tube side outlet gas flow rate was measured using a bubble flow meter, and the flow was injected into the GC to obtain the concentration of the permeated gas. The permeance was then calculated using the outlet gas flow rate and the concentration of the permeated gas on the tube side. Results and Discussion
It is found that the Nanosil membrane has 100% selectivity to the small gas molecules He, H2 and Ne. Larger species like CO2, CO, CH4 are completely excluded. This is likely to be a size effect. The structure of the silica layer can be viewed as a disordered form of cristobailite containing rings formed from connected SiO4 units. The rings contain between 5-8 units and the limiting size is 0.3 nm. Thus, the larger species (Fig. 1) cannot pass through because their molecular size exceeds this limit. He: 0.260 nm H2: 0.289 nm Ne : 0.275 nm
4 au 2 au 20 au
CO2: 0.33 nm CO: 0.376 nm CH4: 0.38 nm
44 au 28 au 16 au
Figure 1. Sizes and molecular weights of permeating species.
Careful studies have been made on the permeation of these
species on the Vycor support (10). The permeance is typical for this type of membrane, of the order of ~10-8 mol m-2 s-1 Pa-1. It is found that the small gas species He, H2, and Ne permeate by a Knudsen diffusion mechanism. The larger species, CO2, CO, and CH4 permeate by a parallel Knudsen diffusion and surface diffusion mechanisms. This is reasonable, as the interaction of these condensable molecules with the surface of the membrane is stronger.
In a previous paper, atomic force microscopy (AFM) images of the Vycor and the Nanosil membrane surface were reported (11). The thickness of the silica layer deposited on the Vycor was deduced to be approximately 10 nm from the change in surface topology after the silica deposition. Therefore, it appears that the unusually high H2 selectivity on the Nanosil membrane originates from the thin defect free SiO2 layer, with only the small gas molecules (He, Ne and H2) being able to pass through the silica layer. Considering the pore size of the Vycor support (3.6 nm), this 10 nm thickness of the silica layer may be of the order of the smallest thickness level that can be achieved by the CVD technique. This thickness is much smaller than the thickness (500 nm) obtained by conventional CVD of silica (12).
The Nanosil membrane can be viewed as a composite system composed of the Vycor support and a the thin layer of silica on top. A schematic is shown in Fig. 2.
Fuel Chemistry Division Preprints 2003, 48(1), 286

Fuel Chemistry Division Preprints 2003, 48(1), 287
Figure 2. Schematic of Nanosil membrane.
The gas permeance of He, Ne, and H2 on the silica layer in the Nanosil membrane can be obtained using a series analysis of gas diffusion, where the total resistance for gas permeation on the Nanosil membrane is a summation of the resistance on the Vycor support and the silica layer.
silicaVycorNanosil
111QQQ
+=
where Q is the permeance (mol m-2 s-1 Pa-1). Since the gas permeance of He, H2 and Ne on the Vycor alone is known, the permeance on the top silica layer can be calculated.
The permeance order obtained is He > H2 > Ne, which follows neither size nor mass of the species. This unusual order of gas permeance may be explained using a statistical gas permeance model on vitreous silica glass (13).
/RTE∆2Tk2/νhTk2/νh
AS23
22K
** e)ee(
)N/N(Tkmπ2
hhd
L61 −
−−
=Q
The silica layer thickness, L, and the jump distance, d, used for the calculation were 10 nm and 0.3 nm respectively. The adjustable parameters were the number of solubility sites (Ns) and the activation energy of permeation (∆EK). The model fitting was carried out using the Nelder-Mead simplex method. The fitting results and the best-fit parameter values are shown in Figure 3 and Table 1. The results showed a good fit between the model analysis and the experimental data with a permeance order of He > H2 > Ne that agreed with the observations. The model analysis was able to account for the unusual order of the small gas permeance on the silica layer of the Nanosil membrane. The order is due to a tradeoff between the number of solubility sites and the vibrational frequency (ν*). The number of solubility sites in the silica layer is larger than that found in vitreous glass, consistent with a more open structure. The number of solubility sites is also physically realistic. The inverse cube root of the quantity gives a value of ~ 1 nm, which is of the same order of
1E-6
-1
300 400 500 600 700 800 9001E-9
1E-8
1E-7
Ne
H2
He
Perm
eanc
e / m
ol m
-2 s
-1 P
a
Temperature / K
magnitude as the jump distance. Further details are presented in a full paper (10).
Figure 3. Experimental and calculated permeance in the silica layer.
Gas
SolubNs ( m-3) --1)
ivation energy Ea (kJ mol-1)
Table 1. Results of Model Fitting.
ility sites ν* ( s
Act
He 3.4 × 1 27 0 6.90 x 10¹² 9.7 H2 1. × 10 1.22 x 10134 27 13.6 Ne 1.4 × 1027 4.38 x 10¹² 14.0
onclu C sions
he permeation characteristics of the gas molecules, He, Ne, H2, O2, on the composite Vycor-supported silica
s were
yer was
.; Inoue, H., J. Membr. Sci. 1989, 42, 109.
(2) Gavalas, G. R.; Megiris, C.E.; Nam, S.W., Chem. Eng. Sci. 1989, 44,
5,
er. Res. 1996, 11, 3164.
(8) .; Yamaguchi, T.; Okubo, T.; Suematsu, H.; Keizer, K.; Nakao,
(10) . 2002, 210, 291.. a, Y., J. Mater.
(13) , R.M., J. Chem. Phys. 1973, 59,1198.
TCH4, CO and Cmembrane, referred to as Nanosil, were investigated. The gas transport characteristics on the Vycor and Nanosil membranediscussed with relevant diffusion models. Surface diffusion enhanced Knudsen diffusion was a good model for the gas transport on the Vycor support. Gas transport on the deposited silica lasuccessfully described by a statistical solid state diffusion model. Acknowledgement. The authors thank the Director of the Division of Chemical and Thermal Systems (Grant CTS-9815041) of the National Science Foundation for the support of this project.
References
(1) Okubo, T
1829. (3) Ha, H.Y.; Nam, S.W.; Hong, S-A.; Lee, W. K., J. Membr. Sci. 1993, 8
279. (4) Levy, R. A.; Ramos, E. S.; Krasnoperov, L. N.; Datta, A.; Grow, J. M.,
J. Mat(5) Nakao, S-I.; Suzuki, T.; Sugawara, T.; Tsuru, T.; Kimura, S., Micropor.
Mesopor. Mat. 2000, 37, 145. (6) Morooka, S.; Yan, S.; Kusakabe, K.; Akiyama,Y., J. Membr. Sci. 1995,
101, 89. (7) Sea, B.K.; Kusakabe, K.; Morooka, S., J. Membr. Sci. 1997, 130, 41.
Nair, B.NS-I., J. Membr. Sci. 1997, 135, 237.
(9) de Vos, R.M.; Verweij, H., Science 1998, 279, 1710. Lee, D.; Oyama, S. T., J. Membr. Sci
(11) Oyama, S.T.; Lee, D.; Sugiyama, S.; Fukui, K.; IwasawSci. 2001, 36, 5213.
(12) Tsapatsis, M.; Gavalas, G. R., J. Membr. Sci. 1994, 87, 281. Masaryk, J.S.; Fulrath
Key parameters: ν = vibrational frequency
d = jump distance
ΔEk
Ns = number of solubility sites
SiO2 layer
Vycor
Nanosil

ADVANCES IN FUEL PROCESSING FOR PEM FUEL CELLS
Levi T. Thompson
University of Michigan,
Department of Chemical Engineering, Ann Arbor, MI 48109
Introduction
Proton Exchange Membrane (PEM) fuel cells have emerged as leading candidates to provide primary and auxiliary power for stationary, automotive and portable electronic device applications. A key challenge to their use is the availability of sufficiently small and cost-effective H2 sources. Hydrogen can either be stored or produced from suitable fuels. The H2 loadings for pressurized containers or in adsorbent materials are relatively low. Chemical sources are able to yield the equivalent of more than 5 wt% H2. Work described in this paper focuses on H2 production via hydrocarbon “reforming” or fuel processing reactions. The reforming of liquid hydrocarbons like methanol and gasoline is attractive because of their high energy densities.
The principal functions accomplished by the fuel processor are the production of syngas and CO removal (see Figure 1). Syngas, a mixture principally of H2 and CO, is most often produced using steam reforming and/or partial oxidation reactions. The amount of CO must typically be reduced because the noble metal fuel cell electrocatalysts are very susceptible to poisoning by as little as 10-100 ppm CO.1,2 While significant advances in PEM fuel cell technology are expected through the development of poison-tolerant electrocatalysts and/or high temperature membranes, more selective reforming and/or partial oxidation processes, and improved CO removal catalysts will have to be developed.
Water GasShift Reactor
PreferentialOxidizer orMethanizer
Reformerand/orPartial
Oxidizer
10%CO
2,000ppmCO
Syngas(<10 ppm CO)
GasolineDiesel
AlcoholCNG
<1ppm
sulfur
Desulfurizer
Figure 1. Schematic of key steps in the conversion of hydrocarbons
into syngas for fuel cells (CNG=compressed natural gas).
Presently carbon monoxide removal is accomplished via water gas shift and preferential oxidation or methanation reactions. Many commercial and military applications including automobiles and soldier individual power favor the use of gasoline, diesel and/or logistic fuels as H2 sources. These fuels contain deleterious amounts of sulfur and present important challenges because most of the CO removal catalysts are susceptible to poisoning by sulfur.
The University of Michigan has been engaged in projects to significantly improve hydrocarbon fuel processors via the integration high performance catalysts into low-cost micro-reactor systems. This talk will describe the properties of carbide and nitride based fuel processing catalysts including characteristics of the active sites. In addition, their deposition on engineering supports, and their integration into micro-reactor systems will be discussed.
Discussion
We have developed a series or carbide and nitride based materials and evaluated their use as methanol steam reforming and water gas shift (WGS) catalysts. These materials were typically prepared in high surface area form using temperature programmed reaction methods and characterized using a variety of methods
including sorption analysis, x-ray diffraction, x-ray photoelectron spectroscopy and infrared spectroscopy.
The carbide and nitride based catalysts were very active for methanol steam reforming. For example, methanol conversion rates for one of the Mo2N based catalysts were comparable to those for a commercial Cu-Zn-Al catalyst, however, the CO2 selectivities were lower (Figure 2). The selectivities and rates improved when the CH3OH:H2O was increased suggesting competition between CH3OH and CO for active sites. The carbide and nitride based catalysts were also much more stable at high temperatures (up to 400 °C)_than the Cu-Zn-Al catalyst.
0
20
40
60
80
100
Mo2N-based catalyst Cu-Zn-Al catalyst
Rat
e (µ
mol
/g/s
) or
Sel
ectiv
ity (m
ol%
) Rate
Selectivity
Figure 2. Methanol conversion rate and CO2 selectivity for Mo2N
based and Cu-Zn-Al catalysts at 230 °C, atmospheric pressure and a CH3OH:H2O molar ratio of 1:1.
The carbides and nitrides were also very active for the WGS.
In fact, several of the formulations substantially outperformed a commercial Cu-Zn-Al WGS catalyst (Figure 3).
10
100
1.94 1.96 1.98 2.00 2.02 2.04 2.06 2.08
CO
Con
sum
ptio
n R
ate
(µm
ol/g
•sec
)
1000/T (K -1)
Cu-Zn-Al
UM-3
UM-2
UM-1
UM-4
Figure 3. Comparison of WGS rates for selected carbide and Cu-Zn-Al catalysts at atmospheric pressure.
The carbides were more active than the nitrides, and the
performance was a function of the pretreatment conditions employed. For example, pretreatment in the CH4/H2 mixture typically resulted in catalysts that were more active than those same catalysts pretreated in pure H2. In situ x-ray photoelectron spectroscopic results suggested that active sites on the carbide surfaces were linked to carbidic carbon. In particular, the WGS rates increased proportionally with the amount of carbidic carbon (Figure 4).
Fuel Chemistry Division Preprints 2003, 48(1), 320

References
(1) Appleby, A.J. and Foulkes, F.R., Fuel Cell Handbook, Van Nostrand Reinhold, NY (1989).
(2) Kordesch, K. and Simander, G., Fuel Cells and Their Application, VCH Publishers, NY (1996).
Figure 4. X-ray photoelectron spectra (C 1s region) for an Mo
carbide catalyst following A) passivation in 1% O2 in He, B) pretreatment in H2/Ar at 500 ˚C, and C) pretreatment in CH4/H2/Ar at 500 ˚C.
We have also demonstrated that the carbide and nitride based
catalysts can be washcoated onto engineering supported including cordierite monoliths and ceramic foams (Figure 5), and infiltrated into micro-reactor systems. These and other results will be discussed during the presentation.
Figure 5. Carbide washcoated ceramic foam. Acknowledgement
Financial support from the Department of Energy and Osram Sylvania was used to carry out work described in this paper.
Fuel Chemistry Division Preprints 2003, 48(1), 321

HYDROGEN PRODUCTION FROM PROPANE THROUGH PARTIAL OXIDATION AND
AUTOTHERMAL REFORMING IN MICROSTRUCTURED REACTORS
Torbjørn Gjervan1, Hilde Venvik1, Ingrid Aartun2, Anders Holmen2,
Oliver Görke3, Peter Pfeifer3, Klaus Schubert3
1 SINTEF Applied Chemistry, N-7465 Trondheim, Norway
2 Department of Chemical Engineering, NTNU, N-7491 Trondheim, Norway
3 Institute for Micro Process Engineering (IMVT), Forschungszentrum Karlsruhe (FZK), Postfach 3640, D-76021
Karlsruhe, Germany
Introduction
The size and compactness of microstructured reactors makes them interesting for application in small-scale fuel reformer units for distributed hydrogen production. Because of the small linear channel dimension and thus the high surface to volume ratio, efficient mass and heat transfer is possible. In addition, well-defined flow conditions facilitate narrow residence time distribution. Manufacturing the catalyst system in metal results in high thermal conductivity. This is favorable for combination of exothermic partial oxidation and endothermic steam and CO2 reforming, since the heat from the exothermic oxidation reactions is effectively transported along the flow direction.
The present work aims at studying the effect of varying catalyst material, addition of steam/oxygen, and residence time on the selectivity and yield of hydrogen during partial oxidation (POX) and autothermal reforming (ATR) of propane. Reactors of two different lengths have been tested. These were either made from rhodium or from the high temperature alloy Fecralloy [1]. The latter material was oxidized and impregnated with catalytic particles prior to testing. Experimental
The experimental work has been done both at IMVT in Germany and SINTEF/NTNU in Norway using different reactor housings. The experimental set up at IMVT is described elsewhere [2]. At IMVT, the reactor housing contained a ceramic holding unit for the microstructured reactor. This unit was equipped with a heating wire for rapid heating of the reactor. In Trondheim the microstructured reactor was placed in a quartz tube situated in a Thermcraft Trans Temp furnace. In both cases the temperature was measured with a thermocouple at the reactor exit. At IMVT, the temperature was also monitored with a pyrometer through a quartz window. The product gas mixture was measured by gas chromatography.
The reactors have been manufactured from rhodium or Fecralloy (72.6% Fe, 22% Cr, 4.8% Al) at IMVT, Karlsruhe, with channels of small linear dimensions (approximately 120×130 µm2). Each reactor is made of several microstructured foils that are stacked and welded to a compact honeycomb reactor through diffusion bonding. The reactors were manufactured in two different lengths in order to study different contact times. Table 1 gives the physical data for the different reactors.
The Fecralloy reactor was oxidized at high temperature in air in order to form a thin α-Al2O3 surface layer and then subsequently impregnated with nickel or rhodium. After oxidization, the specific surface area of reactor 2 was measured by Kr-BET and was found to be approximately 146 cm2 (> 8 times larger than the geometric area). Nickel was deposited on the reactor by allowing a saturated aqueous
solution of Ni(NO3)2⋅6H2O to flow through the channels several times. This was followed by drying at 120°C over night, calcination at 600°C for 4 hours in flowing air, and reduction in hydrogen at 600°C for 1 hour. Rhodium was similarly impregnated using an aqueous solution (0.03 M) of RhCl3, drying at 120°C over night, and reduction at 800°C for 3 hours in hydrogen. The mass increase after impregnation was found to correspond to approximately 50 mg Ni and 5 mg Rh deposited on the channel walls of the two reactors (Reactor 3).
Table 1: Physical Data of the Microstructured Reactors Reactor no. 1 2 3
Material Rhodium Fecralloy Fecralloy
H×W×L [mm] 5.5×5.6× 20
5.5×5.6× 5.0
5.5×5.6× 20
Channels 644 675 675 Channel dimension [µm2]
120×130 120×130 120×130
Geom. surface of channel [cm2]
67.8 17.3 67.8
Porosity 0.34 0.33 0.34 Residence time (τ) at 1 Nl/min
10.5 3.0 10.5
The reactor/catalyst was installed in the reactor holder unit and
reduced before the first experiment. The furnace temperature was raised to 300°C, and the premixed gases were introduced. Partial oxidation was performed keeping a C/O ratio of 0.8 using synthetic air as oxygen source (10 vol. % C3H8, 71 vol. % N2, and 19 vol. % O2). For ATR experiments steam was added to the reactant gas. The C/O ratio was thereby decreased to 0.5, keeping the total flow and C3H8 concentration constant. The furnace temperature was increased stepwise until a maximum temperature of 1000°C was reached.
In order to compare hydrogen selectivity from different experiments, it has been calculated as follows:
8383
2
,
,
,
,2 4)(
HCinHC
outH
intot
outtot
XCC
FF
HS⋅⋅
⋅= (1-1)
where S(H2) = hydrogen selectivity, Ftot,in = total volumetric gas flow at reactor inlet, Ftot, out = total volumetric gas flow at reactor exit, CH2,out = hydrogen concentration in product gas, CC3H8,in = propane concentration in feed gas, and X C3H8= conversion of propane. Hydrogen may be produced both from propane and water, and the selectivity can therefore exceed one on the ATR. Results and discussion
The results show that partial oxidation gives the highest hydrogen yield is using the Rh/Fecralloy reactor. The product composition as a function of temperature for reactor 2 is shown in Figure 1, where the gas flow is 1 Nl/min giving a residence time of 3.0 ms. It can be observed that below 600°C total oxidation to water and CO2 is dominant. Further increase in the temperature favor endothermic reforming reaction, increasing the production of hydrogen. At 1000°C complete conversion of propane is reached,
Fuel Chemistry Division Preprints 2003, 48(1), 322
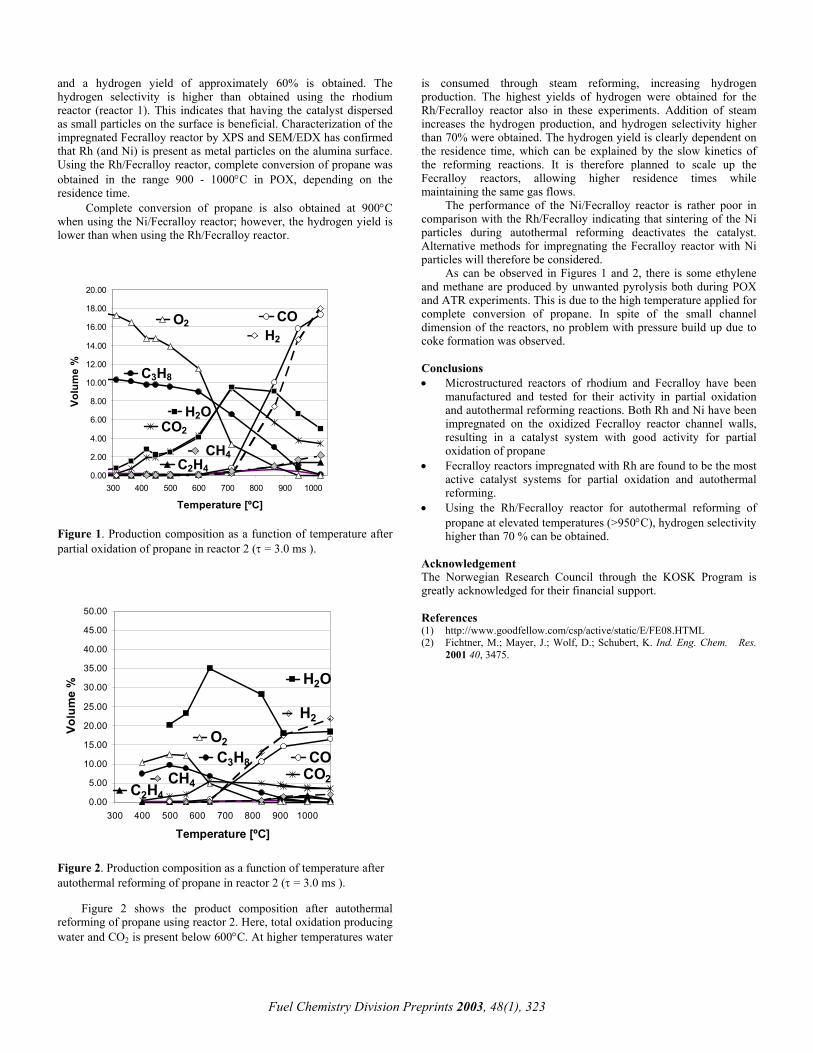
and a hydrogen yield of approximately 60% is obtained. The hydrogen selectivity is higher than obtained using the rhodium reactor (reactor 1). This indicates that having the catalyst dispersed as small particles on the surface is beneficial. Characterization of the impregnated Fecralloy reactor by XPS and SEM/EDX has confirmed that Rh (and Ni) is present as metal particles on the alumina surface. Using the Rh/Fecralloy reactor, complete conversion of propane was obtained in the range 900 - 1000°C in POX, depending on the residence time.
Fuel Chemistry Division Preprints 2003, 48(1), 323
CO2
C2H4
C3H8
H2O
COH2
O2
CH4
0.00
2.00
4.00
6.00
8.00
10.00
12.00
14.00
16.00
18.00
.00
300 400 500 600 700 800 900 1000
Temperature [ºC]
Volu
me
%
20
Complete conversion of propane is also obtained at 900°C when using the Ni/Fecralloy reactor; however, the hydrogen yield is lower than when using the Rh/Fecralloy reactor.
Figure 1. Production composition as a function of temperature after partial oxidation of propane in reactor 2 (τ = 3.0 ms ).
Figure 2. Production composition as a function of temperature after autothermal reforming of propane in reactor 2 (τ = 3.0 ms ).
Figure 2 shows the product composition after autothermal reforming of propane using reactor 2. Here, total oxidation producing water and CO2 is present below 600°C. At higher temperatures water
is consumed through steam reforming, increasing hydrogen production. The highest yields of hydrogen were obtained for the Rh/Fecralloy reactor also in these experiments. Addition of steam increases the hydrogen production, and hydrogen selectivity higher than 70% were obtained. The hydrogen yield is clearly dependent on the residence time, which can be explained by the slow kinetics of the reforming reactions. It is therefore planned to scale up the Fecralloy reactors, allowing higher residence times while maintaining the same gas flows.
The performance of the Ni/Fecralloy reactor is rather poor in comparison with the Rh/Fecralloy indicating that sintering of the Ni particles during autothermal reforming deactivates the catalyst. Alternative methods for impregnating the Fecralloy reactor with Ni particles will therefore be considered.
As can be observed in Figures 1 and 2, there is some ethylene and methane are produced by unwanted pyrolysis both during POX and ATR experiments. This is due to the high temperature applied for complete conversion of propane. In spite of the small channel dimension of the reactors, no problem with pressure build up due to coke formation was observed.
Conclusions • Microstructured reactors of rhodium and Fecralloy have been
manufactured and tested for their activity in partial oxidation and autothermal reforming reactions. Both Rh and Ni have been impregnated on the oxidized Fecralloy reactor channel walls, resulting in a catalyst system with good activity for partial oxidation of propane
• Fecralloy reactors impregnated with Rh are found to be the most active catalyst systems for partial oxidation and autothermal reforming.
• Using the Rh/Fecralloy reactor for autothermal reforming of propane at elevated temperatures (>950°C), hydrogen selectivity higher than 70 % can be obtained.
Acknowledgement The Norwegian Research Council through the KOSK Program is greatly acknowledged for their financial support.
CO2C2H4
C3H8
H2O
CO
H2
O2
CH4
0.00
5.00
10.00
15.00
20.00
25.00
30.00
35.00
40.00
45.00
50.00
300 400 500 600 700 800 900 1000
Temperature [ºC]
Volu
me
%
References (1) http://www.goodfellow.com/csp/active/static/E/FE08.HTML (2) Fichtner, M.; Mayer, J.; Wolf, D.; Schubert, K. Ind. Eng. Chem. Res.
2001 40, 3475.

THE STABILITY OF MOLYBDENUM CARBIDE CATALYSTS IN METHANE REFORMING
David C. LaMont, Anna R. S. Darujati, Benjamin N. Gallaher,
William J. Thomson
Department of Chemical Engineering Washington State University Pullman, WA 99164-2710
The application of bulk molybdenum carbide catalysts to the reforming of hydrocarbon fuels for fuel cell hydrogen production, has been a subject of research ever since a group at Oxford showed that these catalysts could be operated at stoichiometric feed conditions and maintain stability for 70 hours. However, despite these remarkable results, they are potentially susceptible to deactivation by both oxidation and coking. Catalyst Characterization The molybdenum carbide catalyst used in this study was a commercial Alfa Aesar Mo2C lot# K17J11 (99.5% metals purity, <325 mesh), with a BET surface area less than 2 sq. m/g. The high surface area catalysts were synthesized via Temperature Programmed Reaction, producing a surface area of 70 sq m/g and by a “solution derived” technique, which produced surface areas as high as 240 sq m/g. Effect of Molybdenum Carbide Surface Area The high and low surface area catalysts were compared under identical conditions of steam reforming at 950 C, 8 bars pressure, using a stoichiometric steam-methane feed in a packed bed reactor. Whereas the high surface area catalyst began deactivating after 40 hours on stream, the low surface area catalyst maintained equilibrium conversions for 100 hours. Analysis of the spent high surface area catalyst showed a high level of refractory carbon, suggesting that the excess synthesis carbon on the fresh catalyst may have acted as nucleation sites for refractory coke deposition. There was no sign of catalyst oxidation under these conditions. Controlled Oxidation Experiments The low surface area catalysts were placed in a Dynamic X-Ray Diffractometer and scanned for both the carbide and oxide peaks as the temperature was ramped from 500 C to 850 C in the presence of oxidizing gases (steam, carbon dioxide), as well as those gases with various concentrations of hydrogen and carbon monoxide. It was found that the oxidation commenced at 625 C but that the rate of oxidation increased dramatically at about 750 C. It is hypothesized that the high temperature path includes decomposition to the metal, which is then immediately oxidized. It was also found that hydrogen and carbon monoxide was able to eliminate the first stage of oxidation and significantly hinder the oxidation at the higher temperature. Effect of Sulfur In order to evaluate the effect of sulfur on these catalysts, dimethyl sulfide (DMS) was chosen as a model sulfur compound for methane reforming and experiments were performed in a TGA/MS unit as well as in a packed bed reactor. The data from the TGA/MS unit
indicated that DMS decomposes in the gas phase at about 550 C. In the absence of hydrogen, the primary sulfur product was carbon disulfide and in the presence of sulfur, it was hydrogen sulfide. At 900 C the carbon disulfide readily adsorbed on the catalyst whereas sulfur was not detectable on the catalyst in the presence of hydrogen, indicating that hydrogen sulfide does not readily adsorb at these temperatures. In separate dry reforming experiments at 1050 C and atmospheric pressure, the catalyst was allowed to reach steady state methane equilibrium conversion values ( 95%) and then exposed to methane/carbon dioxide in the presence of 1000 ppm DMS. The conversion immediately dropped to levels between 65 and 45%, depending on the hydrogen concentration in the reactor, and remained at these levels for at least 7 hours with no further loss in activity. In one experiment, after suffering a loss of conversion in the presence of sulfur, the sulfur concentration was lowered to zero and the conversion returned to its equilibrium value after about one hour. This indicates that the catalyst is capable of being regenerated, in-situ, once exposed to sulfur.
Fuel Chemistry Division Preprints 2003, 48(1), 324

Partial methane oxidation on yttria and ceria supported platinum catalysts
Fabio B. Passos1, Elaine R. Oliveira1, Carlos E.E.L. Rego1, Lisiane
V. Mattos2, and Fabio B. Noronha2 1 Departamento de Engenharia Química, Universidade Federal Fluminense, Rua Passo da Patria, 156. São Domingos, Niteroi RJ 24210-240, Brazil, Fax: 552127174446, [email protected] 2 Laboratório de Catálise, Instituto Nacional de Tecnologia Introduction
Partial methane oxidation of methane is an interesting alternative for synthesis gas production. The reaction is exothermic and produces a synthesis gas mixture with a H2/CO ratio to 2, which is more adequate for the subsequent Fischer-Tropsch synthesis1-3 . A two-step mechanism has been proposed for the partial oxidation of methane. According to this mechanism, in the first step, combustion of methane takes place, producing CO2 and H2O. In the second step, synthesis gas is produced via carbon dioxide and steam reforming reaction of unreacted methane2 . On the other hand, a direct mechanism was claimed to occur on Ru/TiO2
4 , Ni/CaO.2Al2O35 and
on ytria-zirconia6. In this work, we investigate the use of platinum supported
different oxides (Al2O3, ZrO2,, CeO2 and Y2O3) in the partial
oxidation of methane. The effect of the oxygen storage capacity of the catalysts on the stability of the catalysts is reported as well as the effect of the support on the controlling mechanism of the reaction.
Experimental
The Al2O3, CeO2 , ZrO2 and Y2O3 supports were prepared by calcination of γ-Al2O3, (NH4)2Ce(NO3)6, Zr(OH)4 and Y(NO3)3, respectively, at 800oC for 1 h in flowing . Another sample of ceria (CeO2 ppt) was prepared by precipitation as described by Hori et al7.
The catalysts were prepared by incipient wetness impregnation of the supports with an aqueous solution of H2PtCl6.6H2O. All samples contained 1.5 wt.% of Pt and were calcined under air (50 mL/min) at 700oC for Pt/Al2O3 catalysts and at 400oC for the other. The catalysts were characterized by Oxygen Storage Capacity (OSC) measurements and the mechanism investigated by Temperature Programmed Superficial Reaction (TPSR). Partial oxidation of methane was performed in a system previously described8.
Oxygen Storage Capacity (OSC). Oxygen storage capacity (OSC) measurements were carried out in a micro-reactor coupled to a quadrupole mass spectrometer (Balzers, Omnistar). The samples were reduced under H2 at 500oC for 1h and heated to 800oC in flowing He. Then, the samples were cooled to 650oC and a 5%O2/He mixture was passed through the catalyst until the oxygen uptake was finished. The reactor was purged with He and the dead volume was obtained by switching the gas to the 5%O2/He mixture. Finally, N2 pulses were injected in order to calculate the amount of oxygen consumed on the catalysts taking into account a previous calibration of the mass spectrometer.
Temperature Programmed Superficial Reaction (TPSR). Temperature Programmed Surface Reaction (TPSR) experiments were performed in the same apparatus used for TPR. After reduction at 500oC under H2 for 1 h , the sample (300 mg) was purged in He at 800oC for 30 min, and cooled to room temperature. Then the sample was submitted to a flow of CH4/O2/He (2:1:27) at 30 cm3/min while the temperature was raised up to 800oC at a heating rate of 20 K/min.
Partial Oxidation of Methane. Reaction was performed in a quartz reactor at atmospheric pressure. Prior to reaction, the catalyst
was reduced under H2 at 500oC for 1h and then heated to 800oC under N2. The reaction was carried out at 800oC and WHSV = 523 h-
1 over all catalysts. A reactant mixture with CH4:O2 ratio of 2:1was used with a flow rate of 100 cm3/min. The exit gases were analyzed using a gas chromatograph (Agilent 6890) equipped with a thermal conductivity detector and a CP-carboplot column (Chrompack). Results and Discussion
Oxygen storage capacity (OSC) results for the several catalysts are presented on Table 1. Pt/Al2O3 and Pt/Y2O3
catalysts have not showed any OSC uptakes, while for Pt/ZrO2 e Pt/CeO2 ppt the values were quite low. Pt/CeO2 catalyst was the only catalyst that presented a considerable OSC uptake. Several studies reported that cerium oxide has a very high oxygen exchange capacity9,10. This capacity is associated to the ability of cerium to act as an oxygen buffer by storing/releasing O2 due to the Ce4+/Ce3+ redox couple9.
Table 1. Oxygen Uptakes of Pt catalysts
Catalysts O2 Uptake (µmol/gcat)
Pt/Al2O3 0 Pt/ZrO2 9 Pt/CeO2 194 Pt/Y2O3 0
Pt/CeO2 ppt 18 The Temperature Programmed Superficial Reaction results
indicated different mechanisms for Pt/CeO2 and Pt/Y2O3 catalysts. Pt/Al2O3, Pt/ZrO2, Pt/CeO2 and Pt/CeO2 ppt catalysts presented TPSR profiles consistent to the indirect mechanism. Figure 1 presents a representative profile for Pt/CeO2. For temperatures between (300oC and 400oC) platinum is covered with oxygen and the catalyst is active for total oxidation of methane to carbon dioxide and water. After this step, the catalyst is active for steam and CO2 reforming of methane, forming the synthesis gas.
The TPSR profile for Pt/Y2O3 is shown in Figure 2. The reaction starts at 480oC, yielding H2, CO, H2O and CO2 as products. H2O is not consumed indicating there is not a steam reforming step for this catalyst. CO2 formation is consumed at higher temperatures indicating a additional dry reforming reaction. .
25 200 400 600 800
318
isothermal
H2O
CO2
CO
O2
H2 (/4)
CH4
M.S
. sig
nal (
a.u.
)
T (0C)
Figure 1. Temperature Programmed Superficial Reaction of Pt/CeO2 catalyst.
Fuel Chemistry Division Preprints 2003, 48(1), 325

Fuel Chemistry Division Preprints 2003, 48(1), 326
Figure 2. Temperature Programmed Superficial Reaction of Pt/Y2O3 catalyst.
Figure 3. Methane conversion on partial oxidation of methane versus time on stream at 800oC and CH4:O2=2:1. (WHSV = 523 h-1)
Figure 3 shows the methane partial oxidation results for the
several catalyts. For the catalysts that followed the indirect mechanism, Pt/Al2O3 and Pt/ZrO2 presented high initial conversions but deactivated during time on stream. Pt/CeO2 ppt was neither active nor stable. On the other hand Pt/CeO2 was quite active and stable during the time of reaction. This result was explained by the high oxygen storage capacity of CeO2 that promotes the removal of carbon from the surface of catalyst. First, CH4 decomposes on the metal particle, resulting in the formation of carbon and hydrogen. Carbon formed can partially reduce the support near the metal particles. Then, on the second step of the reaction, CO2 dissociates on the support followed by the formation of CO and O2 which can reoxidize the support.
Pt/Y2O3 presented a high initial conversion, and was as stable as Pt/CeO2. For Pt/Y2O3, the stability cannot be explained by the same mechanism of Pt/CeO2 and Pt/Y2O3 has not shown any OSC uptake. This stability is related to the change of mechanism, when Y2O3 is used as support. When yttria-zirconia was evaluated in the partial oxidation of methane, a direct mechanism was also observed6, with a Mars van Krevelen type mechanism being proposed.
Figure 4 shows the variation of the selectivity to CO for the several catalysts. The selectivity to CO decreased as the conversion
decreased for the catalysts that showed the indirect mechanism, as the carbon formation suppressed the consequent reforming of methane with carbon dioxide. Pt/CeO2 and Pt/Y2O3 catalysts presented similar CO selectivities that were not affected during the course of the reaction.
25 200 400 600 800 isothermal
CO2
H2O
CH4
O2CO
H2 (/4)
479
M.S
. sig
nal (
a.u.
)
T (°C)
0 5 10 15 20 250
10
20
30
40
50
60
70
80
90
100 Pt/Al2O3 Pt/CeO2 Pt/ZrO2 Pt/Y2O3 Pt/CeO2 ppt
CO
sel
ectiv
ity (%
)
time on stream (h)
Figure 5. Selectivity towards CO versus time on stream at 800oC and CH4:O2 = 2:1. (WHSV = 523 h-1)
0 5 10 15 20 250
10
20
30
40
50
60
70
80
90
100 Pt/Al2O3
Pt/CeO2 Pt/ZrO2 Pt/Y2O3
Pt/CeO2 ppt
CH
4 con
vers
ion
(%)
time on stream (h)
Conclusions For Pt/Al2O3, Pt/ZrO2 and Pt/CeO2, temperature programmed
surface reaction (TPSR) studies showed partial oxidation of methane comprehends two steps: combustion of methane and CO2 and steam reforming of unreacted methane, while for Pt/Y2O3 a direct mechanism was observed. Oxygen Storage Capacity (OSC) evaluated the reducibility and oxygen transfer capacity of the catalysts. Pt/CeO2 catalyst showed the highest stability on partial oxidation. The results were explained by the higher reducibility and oxygen storage/release capacity which allowed a continuous removal of carbonaceous deposits from the active sites, favoring the stability of the catalyst. For Pt/Al2O3 and Pt/ZrO2 catalysts the increase of carbon deposits around or near the metal particle inhibits the CO2 dissociation on CO2 reforming of methane. Pt/Y2O3 was active for partial oxidation of methane and the stability was explained by the change in the reaction mechanism, with the participation of a lattice oxygen in a Mars Van Krevelen Mechanism.
Acknowledgement. Financial support from CNPq, Finep (CT-PETRO), Faperj and Petrobras is gratefully acknowledged. References (1) Torniainen, P.M.; Chu, X.; Schmidt, L. D. J.Catal. 1994 , 146, 1. (2) Dissanayake, D.; Rosynek, M. P.; Kharas, K.C.C.; Lunsford, J. H.
J.Catal,. 1991, 132, 117. (3) Vernon, P.D.F.; Green, M.L.H; Cheetham, A.K.; Ashcroft, A.T. Catal.
Lett., 1990, 6, 181. (4) Boucouvalas, Y.; Zhang. Z.; Verykios, X. E. Catal. Lett. 1996, 40, 1989. (5) Lemonidou, A. A.; Stambouli, A.E.; Tjatjopoulos, G. J., Vasalos, I.A.
Catal. Lett., 1997, 43, 235. (6) Steghuis, A.G.; van Ommen, J.G.; Lercher, J.A. Catal. Today, 1998, 46,
91. (7) Hori, C. E.; Permana, H.; Simon Ng, K.Y.; Brenner, A.; More, K.;
Rahmoeller, K.M.; Belton, D. Appl. Catal. Envir. B, 1998, 16, 105. (8) Mattos, L.V.; Oliveira, E.R.; Resende, P.D.; Noronha, F.B.; Passos, F.B.,
to be published in Catalysis Today. (9) Kaspar, J.; Fornasiero, P.; Graziani, M. Catal. Today, 1999, 50, 285. (10) Yao, M.H.; Baird, R.J.; Kunz, F.W.; Hoost, T.E. J. Catal., 1997, 166,
67.

METHANOL STEAM REFORMIMG OVER NITRIDE BASED CATALYSTS
Shyamal K. Bej, Easwar S. Ranganathan and Levi T. Thompson
Department of Chemical Engineering, University of Michigan,
Ann Arbor, MI-48109 Introduction
Methanol is emerging as a potential fuel for the production of hydrogen for fuel cell applications. Hydrogen is easily extracted from methanol through the steam reforming reaction. This reaction takes place in two steps. The first stage is the endothermic decomposition of methanol into CO and H2 followed by the exothermic water gas shift reaction.
CH3OH CO + 2H2 CO + H2O CO2 + H2
The concentration of CO and CO2 in the outlet gas depends on
the water gas shift activity of the catalysts. The Cu-Zn-Al catalyst is commonly used for this reaction. However, it has number of limitations considering vehicular applications. For example, Cu-Zn-Al catalysts are very sensitive to the reduction procedures and the transient conditions typical of vehicular applications. Moreover, it loses its activity slowly upon frequent exposure to condensed water. Membrane based separation processes are gaining importance to produce pure H2 from mixtures of H2, CO2 and CO. Generally, the membrane based H2 separation processes are carried out in the temperature range of 300–350 °C. For use in conjunction with membranes, the methanol steam reforming catalyst must be active and stable in this temperature range. Presently available Cu-Zn-Al catalysts are not stable at temperatures higher than approximately 300 °C.
There is growing interest in the development of better methanol reforming catalysts. In this work, we report the performance of high surface area Mo2N based formulations. Since early transition metal carbides and nitrides have been reported to be good catalysts for water gas shift reaction, it is expected that these materials would also be very active for the methanol steam reforming reaction1. The results obtained for the Mo2N based catalysts were compared with those for a commercial Cu-Zn-Al catalyst. Experimental
High surface area Mo2N based catalysts were prepared by the temperature programmed reaction method. Details regarding synthesis of the catalyst are given elsewhere2, 3. In brief, about 1.5 g of ammonium paramolybdate was placed in a quartz reactor and heated in a programmed manner in presence of ammonia. The temperature program was defined based on the results of a thermogravimetric analysis experiment. The Cu-Zn-Al catalyst was obtained from Sud Chemie Ltd. The BET surface area of the Mo2N based catalysts were typically 130 m2/g while that of the Cu-Zn-Al was 60 m2/g.
The methanol steam reforming experiments were performed using a 4 mm ID quartz reactor. A mixture of methanol and water in appropriate proportions was pumped using a HPLC pump. Nitrogen was used as a carrier gas. Analysis of the effluents of the reactor was performed with an on-line gas chromatograph (HP 5890) equipped with a TCD and Carboxen-1000 column.
Before measuring the catalytic activity, the Mo2N based catalyst was reduced at 480 °C for 4 hrs using a mixture of 15% CH4 in H2. The Cu-Zn-Al catalyst was reduced at 200 °C for 4 hrs using a mixture of 4% hydrogen in nitrogen. The catalytic activity
measurements were conducted at 230-330 °C. The higher temperature limit was selected to be consistent with operating temperatures for membrane reactors. Experiments were conducted at methanol to water molar ratios of 1:1 to 1:3.
Results and Discussion Low temperature methanol steam reforming:
Methanol conversion rates and selectivities towards CO2 for selected catalysts at 230 °C and a methanol to water molar ratio of 1:1 are shown in Figure 1. The methanol conversion was limited to ~25 mol%. The methanol conversion rate for the Mo2N based catalyst was comparable to that for the Cu-Zn-Al catalyst, however, the selectivity was lower.
0
20
40
60
80
100
Mo2N-based catalyst Cu-Zn-Al catalystR
ate
(mic
rom
ol/g
/s)
Or S
elec
tivity
(mol
%)
Rate
Selectivity
Selectivity
Figure 2. Effect of methanol to water molar ratio on methanol conversion rate and CO2 selectivity for Mo2N based catalyst at 230 °C.
Figure 1. Methanol conversion rate and CO2 selectivity for Mo2N based and Cu-Zn-Al catalysts at 230 °C and a methanol:H2O molar ratio of 1:1.
Since the selectivity toward CO2 for the Mo2N based catalyst was low, the methanol to water molar ratio was varied in order to understand its role on CO2 selectivity. The results are shown in Figure 2. Again, the conversions were limited to ~ 25 mol%.
0
30
60
90
120
150
180
MeOH:H2O = 1:1 MeOH:H2O = 1:3
Rat
e (m
icro
mol
/g/s
)
0
20
40
60
80
100
Sele
ctiv
ity (m
ol%
)
Rate
The higher concentration of water increased the rate of methanol
conversion and CO2 selectivity significantly. A comparison of the results shown in Figures 1 and 2 suggests that the surface of the Mo2N based catalyst had a lower affinity for water as compared to that of the Cu-Zn-Al catalyst. Therefore, a relatively higher concentration of water was necessary to achieve high selectivities.
Fuel Chemistry Division Preprints 2003, 48(1), 327

Experiments were also conducted over the Mo2N based catalyst at methanol conversions near 60 mol% to assess the effect of lower methanol partial pressures on the activity and CO2 selectivity. The temperature and the methanol to water molar ratio were kept constant at 230 °C and 1:1, respectively. The results are compared with those obtained at lower conversions. As the conversion was increased, the rate decreased from 90 to 50 µmol/g/s. This is expected for a reaction having a positive dependency on the partial pressure of the reactant (in this case on the partial pressure of methanol).
0
200
400
600
800
0 5 10 15Time on stream (hr)
Rat
e (m
icro
mol
/g/s
)
0
20
40
60
80
100
Sel
ectiv
ity (m
ol%
)
Mo2N-based catalyst (rate) Cu-Zn-Al (rate)
Mo2N-based catalyst (sel) Cu-Zn-Al (sel)
0
20
40
60
80
100
Low conv (~25%) High conv (~60%)
Rat
e (m
icro
mol
/g/s
)
0
20
40
60
80
100
Sele
ctiv
ity (m
ol%
)
Figure 3. Methanol conversion rate and CO2 selectivity over Mo2N based catalyst at low and high conversion at a temperature of 230 °C and a methanol to water molar ratio of 1:1.
RateSelectivity
Figure 4. Time on stream methanol conversion rate and CO2 selectivity over Mo2N based catalyst and Cu-Zn-Al catalyst at 330 °C and at a MeOH:H2O molar ratio of 1:1.
Conclusions
The activity for the Mo2N based catalyst was comparable with that of the Cu-Zn-Al catalyst for low temperature methanol steam reforming reaction. However, the selectivity towards CO2 was lower as compared to that of the Cu-Zn-Al catalyst. At higher temperature, the pseudo-steady state rate for methanol conversion for the MO2N based formulation was about fives time than that of the Cu-Zn-Al catalyst.
Acknowledgement. The authors would like to acknowledge financial support from the Osram Sylvania.
The CO2 selectivity increased on increasing the conversion. Two reasons could explain this observation. First, the longer CO contact time with the catalyst could produce more CO2. However, as the contact time was increased, more CO was also generated from methanol. The average contact times of CO with the catalyst were calculated and found to be in the similar range for both the case of low and high conversions. The second and possibly the most plausible explanation is that methanol competed with CO for active sites. At high conversions, the partial pressure of methanol was lower and as a result more sites were available for the adsorption and reaction of CO.
References (1) Patt, J.; Moon, D. J.; Phillips, C.; and Thompson, L. T. Catal. Letters
2000, 65, 193. (2) Neylon, M. K.; Kwon, H. H.; Choi, S.; Curry, K. E.; and Thompson, L.
T. Appl. Catal.A: General 1999, 183, 253. (3) Neylon, M. K.; Bej, S. K.; Bennet, C. A.; Thompson, L. T. Appl. Catal.
A: General 2002, 232, 13.
High temperature methanol steam reforming:
The rates and selectivities as a function of time for the Mo2N based formulation at a temperature of 330 °C and a methanol to water molar ratio of 1:1 are compared with those for the Cu-Zn-Al catalyst in Figure 2. The initial methanol conversions for both the catalysts were ~75 mol%. For the Mo2N based catalyst, the activity decreased during the first 5 hrs on stream, however, after this period the change in activity was not very significant. On the other hand, the activity of the Cu-Zn-Al catalyst decreased sharply during the initial 8 hrs. In addition, this catalyst deactivated slowly beyond this period of initial deactivation. The CO2 selectivity for the Mo2N based catalyst did not change significant and was about 30 mol% after 12 hrs, whereas selectivity for the Cu-Zn-Al catalyst was nearly 100% and steady. The lower selectivity toward CO2 for the Mo2N based catalyst may not be a problem for membrane based systems.
Fuel Chemistry Division Preprints 2003, 48(1), 328

NON-NOBLE METAL WATER-GAS SHIFT CATALYSTS FOR AUTOMOTIVE FUEL CELL
APPLICATIONS Valery D. Sokolovskii, Jeffrey M. Zalc, Damodara Poojary, Tek Ho,
Douglas J. Taube, Grigoriy Malukhin, and Ralph A. Dalla Betta
Catalytica Energy Systems 430 Ferguson Drive
Mountain View, CA 94043 Introduction
In light of the distribution and storage issues associated with hydrogen, on-board fuel processing is the likely route of H2 delivery for PEM fuel cells in automotive applications. Generation of a hydrogen-rich stream from a gasoline feed is achieved by steam reforming (SR) or autothermal reforming (ATR) with the resulting reformate containing about 10 mole % carbon monoxide. The CO level in the fuel cell feed must be less than 10 ppmv to prevent irreversible poisoning of the anode electrocatalyst. This reduction in CO can be accomplished by sequential water-gas shift (WGS) and preferential oxidation (PrOx) reactors.
The target for the WGS unit is to convert 90% of the carbon monoxide via the reaction CO + H2O = CO2 + H2. Although high temperatures favor high catalytic activity, the equilibrium level of CO conversion decreases with increasing temperature. A viable water-gas shift catalyst must be highly active at temperatures around 250-300ºC and have a useful lifetime of 2000-5000 hours. In addition, the catalyst must be non-pyrophoric and not require long or high temperature in-situ pre-reduction. It is widely acknowledged that the WGS unit poses the greatest technical challenge to the development of a commercial fuel processing system.
Previous work by our group demonstrated that precious metal/ceria WGS catalysts possessed low activity, had poor durability, and would result in excessive cost of the WGS unit1. The poor catalyst stability appeared to be due to the high hydrogen concentration in the reactant stream. Other researchers have recently shown that Pt-CO interactions are affected by the extent of ceria reduction2. Although addition of a small concentration of oxygen to the reactant feed stream may help stabilize the catalyst activity, precious metal costs would still make such catalysts impractical even if there were no catalyst deactivation, considering the long-term Department of Energy goal that the entire fuel processor have a cost of $10/kW, or $500. The use of even small amounts of precious metals is incompatible with meeting this objective. Consequently, efforts have been focused on developing non-noble metal water-gas shift catalysts suitable for use in an automotive fuel processor. Experimental
A series of non-noble metal catalyst materials were formulated using Cu as the active component with Cu loading between 6 and 12 wt%. Catalysts were tested in a dilute-bed reactor using an approximate feed stream molar composition of 46.5% H2, 11% CO, 7.5% CO2, and 35% H2O. Experiments were performed at temperatures of 230-260ºC with gas hourly space velocities of 200,000-300,000 hr-1. Effluent gas was analyzed by gas chromatography to determine CO conversion. Deactivation studies were performed on promising materials by monitoring CO conversion over several hundred hours.
Catalysts were also characterized using XRD and N2O adsorption. XRD was performed using a XDS 2000 Powder X-ray diffractometer on both the as prepared catalyst and catalyst samples after WGS testing followed by inert gas purge and passivation in air. Cu dispersion was measured by N2O adsorption on Micrometrics AutoChem 2910 using a pulse adsorption technique. The catalyst
sample was reduced in hydrogen at 250ºC, then hydrogen was replaced by Ar, cooled to 85ºC, and then pulses of N2O added to the argon flow over the catalyst sample. Adsorption was monitored by mass spectrometry, recording intensity of molecular mass of N2O. The amount of Cu on the catalyst surface was calculated based on the assumed stoichiometry:
N2O +2Cu(s) = Cu(s)2O + N2. Results and Discussion
These developed catalysts do not require not require a special or extensive reduction. Typical conversion versus time-on-stream data are shown in Fig. 1 for a fresh catalyst. The CO conversion rises slightly at short times, apparently due to rapid in-situ reduction of the catalyst by the reaction mixture, and then stabilizes.
0
10
20
30
40
50
0 20 40 60 80 100 120
Time (hrs)
Con
vers
ion
(%)
WGS 116
Figure 1. Data for CO conversion versus time-on-stream are shown for the start-up of one of our catalysts operated at 248ºC and 275,000 hr-1. The molar composition of the feed is 11% CO, 7.5% CO2, 46.6% H2, 34.9% H2O. Also, these catalysts are air-tolerant, which is a beneficial characteristic because it makes material handling easier. Conversion versus time-on-stream data are shown in Fig. 2 for normal operation and after air exposure.
0
10
20
30
40
50
0 40 80 120 160 200
Time (hrs)
Con
vers
ion
(%)
WGS 102(2)
Figure 2. The effect of air exposure on the catalyst performance is illustrated for operation at 246ºC and 275,000 hr-1. Feed composition is the same as in Fig. 1 and open symbols represent data recorded after exposure to air.
Fuel Chemistry Division Preprints 2003, 48(1), 329
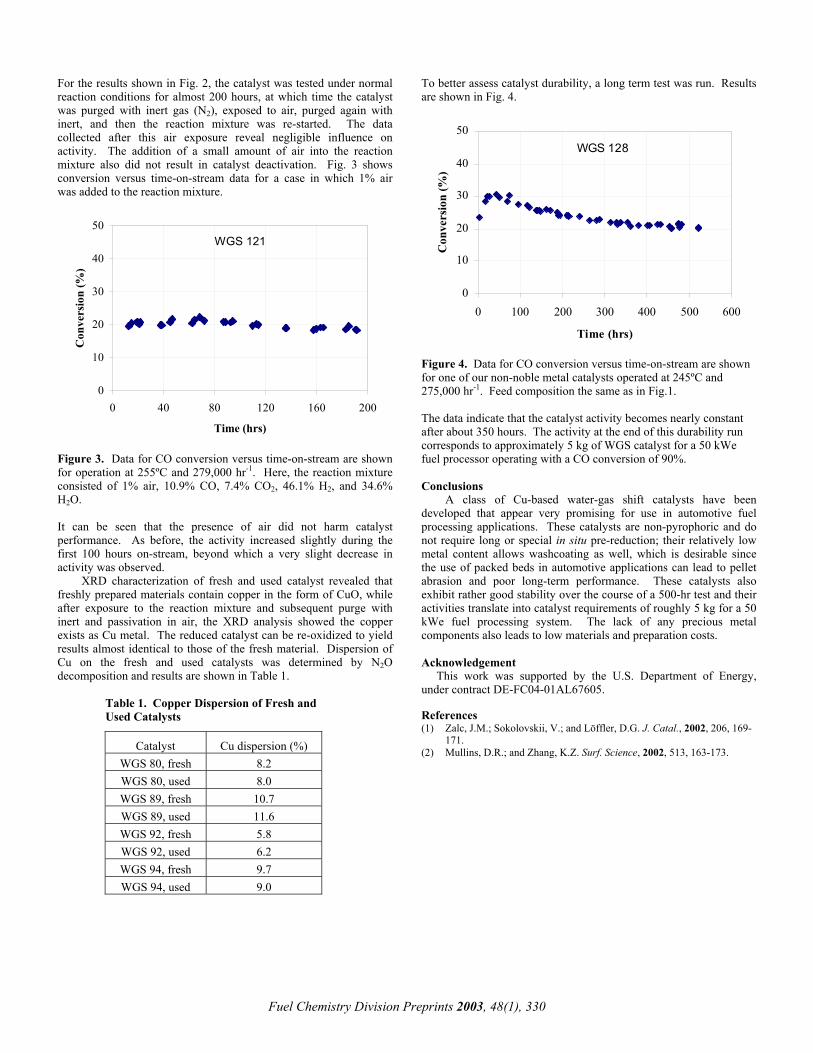
To better assess catalyst durability, a long term test was run. Results are shown in Fig. 4.
For the results shown in Fig. 2, the catalyst was tested under normal reaction conditions for almost 200 hours, at which time the catalyst was purged with inert gas (N2), exposed to air, purged again with inert, and then the reaction mixture was re-started. The data collected after this air exposure reveal negligible influence on activity. The addition of a small amount of air into the reaction mixture also did not result in catalyst deactivation. Fig. 3 shows conversion versus time-on-stream data for a case in which 1% air was added to the reaction mixture.
0
10
20
30
40
50
0 100 200 300 400 500 600
Time (hrs)
Con
vers
ion
(%)
WGS 128
0
10
20
30
40
50
0 40 80 120 160 200
Time (hrs)
Con
vers
ion
(%)
WGS 121
Figure 3. Data for CO conversion versus time-on-stream are shown for operation at 255ºC and 279,000 hr-1. Here, the reaction mixture consisted of 1% air, 10.9% CO, 7.4% CO2, 46.1% H2, and 34.6% H2O.
Figure 4. Data for CO conversion versus time-on-stream are shown for one of our non-noble metal catalysts operated at 245ºC and 275,000 hr-1. Feed composition the same as in Fig.1. The data indicate that the catalyst activity becomes nearly constant after about 350 hours. The activity at the end of this durability run corresponds to approximately 5 kg of WGS catalyst for a 50 kWe fuel processor operating with a CO conversion of 90%. Conclusions
A class of Cu-based water-gas shift catalysts have been developed that appear very promising for use in automotive fuel processing applications. These catalysts are non-pyrophoric and do not require long or special in situ pre-reduction; their relatively low metal content allows washcoating as well, which is desirable since the use of packed beds in automotive applications can lead to pellet abrasion and poor long-term performance. These catalysts also exhibit rather good stability over the course of a 500-hr test and their activities translate into catalyst requirements of roughly 5 kg for a 50 kWe fuel processing system. The lack of any precious metal components also leads to low materials and preparation costs.
It can be seen that the presence of air did not harm catalyst performance. As before, the activity increased slightly during the first 100 hours on-stream, beyond which a very slight decrease in activity was observed.
XRD characterization of fresh and used catalyst revealed that freshly prepared materials contain copper in the form of CuO, while after exposure to the reaction mixture and subsequent purge with inert and passivation in air, the XRD analysis showed the copper exists as Cu metal. The reduced catalyst can be re-oxidized to yield results almost identical to those of the fresh material. Dispersion of Cu on the fresh and used catalysts was determined by N2O decomposition and results are shown in Table 1.
Acknowledgement This work was supported by the U.S. Department of Energy, under contract DE-FC04-01AL67605.
Table 1. Copper Dispersion of Fresh and References Used Catalysts (1) Zalc, J.M.; Sokolovskii, V.; and Löffler, D.G. J. Catal., 2002, 206, 169-
171.
Catalyst Cu dispersion (%) WGS 80, fresh 8.2 WGS 80, used 8.0 WGS 89, fresh 10.7 WGS 89, used 11.6 WGS 92, fresh 5.8 WGS 92, used 6.2 WGS 94, fresh 9.7 WGS 94, used 9.0
(2) Mullins, D.R.; and Zhang, K.Z. Surf. Science, 2002, 513, 163-173.
Fuel Chemistry Division Preprints 2003, 48(1), 330

ON-SITE PRODUCTION OF HYDROGEN FROM HYDROCARBON FUELS WITH MINIMAL
GREENHOUSE GAS EMISSIONS
Nazim Z. Muradov
Florida Solar Energy Center, University of Central Florida, 1679 Clearlake Road, Cocoa, FL 32922
Introduction
Fossil fuel based power systems are major producers of greenhouse gas (primarily, CO2) emissions, which are linked to the global climate change and other serious environmental and health-related problems. Hydrogen is seen by many as an answer to these environmental problems; however, the main question is how to produce hydrogen from fossil fuels without CO2 emissions. Special devices, called “fuel reformers” are being developed for extracting hydrogen from different hydrogen-containing fuels, e.g., natural gas (NG), gasoline, methanol, etc. Conventional fuel reformers are based on methane steam reforming (MSR), partial oxidation (POx) and autothermal reforming (ATR) processes. Although being energy efficient, these reformers are complex, multi-stage and expensive. They include several (3-4) catalytic stages, which make them prone to catalyst deactivation/replacement problems. POx- and ATR-based reformers produce low quality hydrogen gas ([H2]< 40 v%). Furthermore, the conventional reformers produce large amounts of CO2 emissions, which significantly diminish an environmental appeal of hydrogen-based energy systems. CO2 sequestration (underground or under the ocean) is envisioned by many as a potential solution to this environmental problem; however, it is better suited to large centralized hydrogen plants. Removing CO2 from relatively small sources, collecting it, transporting it, and sequestering it are daunting tasks.1
One alternative to conventional fuel reforming technologies is to produce hydrogen via single-step thermal (or thermocatalytic) decomposition of hydrocarbon feedstock (e.g., NG): CH4 → C + 2H2 ∆Ho= 75.6 kJ/mol (CH4) No carbon oxides are formed during the process, due to the absence of oxidants (e.g., H2O and/or O2) in the reactor. Methane decomposition is a moderately endothermic reaction. The energy input requirements (per mole of H2) for the decomposition process is significantly less than that of MSR (37.5 and 63.3 kJ/mol H2, respectively).
It is well known that the use of transition metal catalysts (e.g., Ni, Fe, Co) significantly reduces the maximum temperature of the methane decomposition process. However, there is a catalyst deactivation problem associated with the carbon build-up on the catalyst surface. The fuel reformers have been developed where carbon produced during hydrocarbon decomposition stage was combusted, providing heat for the endothermic reaction.2 This, however, decreases the overall energy efficiency of the process and results in the production of large amounts of CO2 (comparable with that of conventional reformers). The main objective of this work is to develop an efficient and economical process for the on-site (decentralized) production of hydrogen with minimal CO2 emissions. Experimental Methane (99.99 v.%, Air Products and Chemicals, Inc.) and propane (99.0 v.%, Praxair) were used without further purification. Samples of activated carbons were obtained from Barneby Sutcliffe Corp. and NORIT Americas. Cabot Corp. provided different samples of carbon black. All carbon samples were used in the form of fine
powder (<100µm). The experimental set-up for hydrocarbon fuel decomposition consists of 3 main subsystems: (1) a fluidized bed thermocatalytic reactor (with temperature-controlled electric heater and pre-heater), (2) a hydrocarbon metering and delivering sub-system, and (3) an analytical sub-system. The catalytic reactors were made out of a fused quartz in order to reduce the effect of the reactor material on the rate of hydrocarbon decomposition. The analysis of the products of hydrocarbon decomposition was performed gas chromatographically: SRI- 8610A (a thermal conductivity detector, Ar carrier gas, a silica gel column, temperature programming from 25 to 180oC), and Varian-3400, flame ionization detector, He-carrier gas, stationary phase- Hysep DB. Results and Discussion
The concept is based on thermocatalytic decomposition of methane or other hydrocarbons using carbon-based catalysts in an air/water-free environment. This results in the following advantages: (i) no concurrent CO/CO2 production and, hence, no need for water gas shift, preferential oxidation, and other stages, (ii) no catalyst deactivation due to sulfur poisoning, (iii) production of a valuable byproduct carbon, and (iv) significant reduction in CO2 emissions. The detailed information on the catalytic properties of carbon catalysts for methane decomposition reaction has been published elsewhere.3
Fig. 1 depicts kinetic curves of methane and methane-propane (3:1 by volume) decomposition over carbon black (BP2000) catalyst using fluidized bed reactor.
time, min.
0 60 120 180 240
H2
conc
entra
tion,
v.%
0
10
20
30
40
50
60
70
80
CH4, 950oC
CH4-C3H8, 950oCCH4-C3H8, 850oC
Figure 1. Methane and methane-propane (3:1 by volume) decomposition over carbon black (BP2000) catalyst using fluidized bed reactor It can be seen that H2 concentration in the effluent gas gradually decreases which can be explained in terms of carbon catalyst deactivation due to the deposition of catalytically inactive form of carbon and the reduction in catalytic surface area. It was determined earlier that carbon particulates produced by thermal decomposition of different hydrocarbons exhibit dissimilar catalytic activities in methane decomposition reaction.4 The catalytic activity of carbons produced from different hydrocarbons can be arranged in the following order: naphthalene > benzene > ethylene > propane > methane. Thus, carbon produced from methane is least catalytically active in methane decomposition reaction, which agrees with the above experiment. On the other hand, the enhanced catalytic activity of carbon particles produced from ethylene and other unsaturated and aromatic hydrocarbons could potentially be used for the accelerating
Fuel Chemistry Division Preprints 2003, 48(1), 331

methane decomposition process (via in-situ generation of catalytically active carbon species).
low-BTU gas
Fuel Chemistry Division Preprints 2003, 48(1), 332
In principle, the surface area of carbon particulates can be increased via their surface treatment with activating agents at elevated temperatures. High temperature steam, CO2 or their mixtures are the most common activating agents in the production of activating carbons from a variety of carbonaceous materials. This approach was applied to increase the surface area and, consequently, catalytic activity of carbon particulates in methane decomposition reaction. The deactivated carbon samples (after exposure of a carbon catalyst to methane at 850oC for more than 6 h) were subjected to the treatment by equimolar amounts of steam, steam-CO2, CO2 and O2 (air) at 950oC. The effect of carbon activation on methane decomposition rate is shown in Fig. 2.
1 2 3 4 5
met
hane
dec
ompo
sitio
n ra
te,
µm
ol/m
in-g
0
5
10
15
20
25
1- non-activated2- activated by air3- activated by CO2 4- activated by H2O5- activated by CO2 + H2O
Figure 2. Effect of carbon catalyst activation by different activating agents on methane decomposition rate at 850oC.
It is evident that the treatment of carbon particles with steam and steam-CO2 (1:1 by volume) mixtures resulted in significant increase in methane decomposition rate. Air exhibited a relatively low carbon activating efficiency.
Fig. 3 depicts a simplified schematic diagram of the proposed TCD process for the decentralized (on-site) production of hydrogen and carbon. A preheated stream of a hydrocarbon feedstock enters the reactor (1) where it is pyrolyzed at the temperature range of 800-900oC, and the pressure of 1-10 atm over the fluidized bed of catalytically active carbon particulates. The resulting hydrogen-containing gas is directed to a gas separation unit (e.g., a polymeric membrane, or pressure swing adsorption system) (4), where hydrogen gas with the purity of >99.0 v.% is separated from the gaseous stream and directed to a hydrogen end-user. Non-permeate gas is recycled back to the reactor (1). Non-permeate gas is enriched with ethane, propane, ethylene and other high hydrocarbons that upon decomposition produce carbon particles with enhanced catalytic activity (compared to carbon produced from methane). Carbon product is continuously withdrawn from the reactor, and portion of it is ground in a grinder (3), heated in a heater (2) and returned to the reactor (1). The activation of carbon particles with steam and CO2 is accomplished in the heater (2) where temperature conditions (900-1000oC) are suitable for the activation process. Thus, the above scheme allows to apply both modes of catalyst activation (i.e., in-situ generation of catalytically active carbon species and increase in catalyst surface area) which contributes to the improvement in the process sustainability.
2 H2 (99 v.%) 1 4 NG steam air 3 carbon
Figure 3. Schematic diagram of the process for on-site production of hydrogen from natural gas. 1-TCD-reactor, 2- Heater, 3- Grinder, 4- Gas separation unit
Although the TCD process produces certain amount of CO2 emissions, its quantity is small compared to MSR reformers due to relatively low endothermicity of the process and the lack of energy intensive steam generating and gas conditioning units. It is evident that most of the carbon in the feedstock ends up in the form of carbon. According to Steinberg, the overall net energy efficiencies of TCD and MSR processes become close (58 and 60%, respectively) after accounting for 15% energy loss due to CO2 sequestration.4 One should consider that TCD produces a valuable byproduct carbon, whereas, in MSR process 40% of the energy is lost irreversibly due to high endothermicity and CO2 sequestration. Carbon can be sold, thus, reducing cost of hydrogen production. Conclusions
The production of hydrogen from renewable energy sources would be an ultimate solution for energy and environmental problems. It is understood, however, that it would take two-three or even more decades before these technologies will come on the stage. Meantime, new technological approaches, such as TCD, could play an important role as transitional technologies bridging the gap between fossil fuel and renewable energy based economies. The technical feasibility of TCD of methane with the production of CO/CO2-free hydrogen-rich gas and carbon byproduct is demonstrated in this paper.
Acknowledgement. This work is supported by U.S. DOE Hydrogen Program. References (1) Ogden, J. Physics Today, 2002, 13, 94 (2) Calahan, M. Proc. Conf. Power Sources, 1974, 26, 181. (3) Muradov, N. Catalysis Communications, 2001, 2, 89 (4) Muradov, N. Energy & Fuels, 1998, 12, 41 (5) Steinberg, M. Int. J. Hydrogen Energy, 1999, 24, 771

ULTRA RAPID REFORMING OF HYDROCARBONS BY THERMO-NEUTRAL REACTION METHOD
ON A MULTI-FUNCTIONAL CATALYST FOR HYDROGEN PRODUCTION
AND FUEL CELL SYSTEMS
Tomoyuki Inui
Senior Consultant Air Water Inc.
6-40, Chiko Shinmachi, 2-Cho, Sakai, Osaka 592-8331, Japan
Introduction Hydrogen production is increasing importance from the viewpoints of ultimate clean and high caloric energy source, and especially for the use of fuel cell. However, the dead rock is its expensive cost. Among more than two dozen of known methods for hydrogen-production, the large-scale commercialized production is almost limited in steam reforming of natural gas or methanol. The most conventional steam reformers are consisted of the catalytic reactor with heating from outside of the reactor wall to inject the large endothermic heat of the reforming reactions. Even at a high furnace temperature level such as 950ºC, the amount of heat conducted from the reactor wall is limited in considerably low level. Therefore, the reaction is usually operated with a very low space velocity of the feed gas around 1,500 - 2,000 h-1. In other words, a huge reactor for the steam reforming is employed. It is obviously a neck of application to the compact H2-supplying systems such as fuel-cell equipping cars and co-generation systems for domestic use. In addition to these difficulties, conventional commercial reforming catalysts, consisted of Ni as the major catalytic component, suffer from deactivation owing to the coke deposit on the active sites of the catalyst. In order to moderate the coke deposition, excessive steam in the reaction feed is used, anticipating the reaction between deposited coke and water to form CO. The use of excessive steam lowers energy efficiency. To avoid coke formation, Ru catalyst used as an advanced catalyst, but it has a lower sulfur tolerance. In order to supply the large heat for steam reforming, auto thermal methods are apt to be employed. However, the most of them are that a part of the natural gas in the feed is priori combusted before the catalytic reformer, and then the heated gas is introduced to the catalyst bed. Therefore, the heat supply is limited in a level of heat capacity of the reactant gases, and it does not achieve essential improvement. Recently, a partial catalytic oxidative reforming of natural gas is operating in some pilot plants for GTL processes. In these cases, one of the advantages is that the syngas having lower H2/CO molar ratio can be directly used for successive catalytic converters to produce liquid products. Therefore, regulation process of H2/CO molar ratio can be eliminated. Although the large endothermic heat for the steam-reforming of natural gas is avoided by the exothermic partial oxidation heat, the hydrogen atoms in water, i.e., the cheap and plenty resources for hydrogen, is not utilized as a part of hydrogen source. Therefore, for the purpose of hydrogen production, this method is not sufficient. Furthermore, this process cannot avoid combustion of the fed gas and produced gases, resulting the decrease in the selectivity to H2 and/or CO. A number of studies on developing coke-resisted catalysts have been done in the past decade. To this purpose, CO2 reforming has been focused2, because coke formation occurs much easier than in steam reforming. A solid solution of Ni-magnesia and a Ni-based composite catalyst, Ni-Ce2O3-Pt-Rh3, are very successful ones for the purpose. The catalyst structure of the latter had been designed as
highly enhancing hydrogen spillover effect to avoid both coke formation and sulfidation of the catalyst metals. The catalyst has not only the functions of the reforming but also the catalytic combustion. Therefore, more easily combustible hydrocarbons such as C2 - C4 paraffins contained in the natural gas react with O2 fed at considerably lower temperatures and generate large exothermic reaction heat. This reaction heat elevates catalyst-bed temperature up to 800 - 900ºC. Simultaneously, the CO2-reforming4 and/or H2O-reforming5 of CH4 are induced while suppressing excessive raise of catalyst temperature. This automatic thermo-neutralization on the catalyst surface can maintain the reactions very fast and stable. In this keynote lecture, typical results obtained by the thermo-neutral reaction method in a pilot plant test of hydrogen production by steam reforming of natural gas is presented putting the focus onto feature and performance of the novel reformer. As an extension steam reforming of LP gas for hydrogen supply to polymer electrolyte fuel cell and other applications will be presented. Experimental Catalyst. The Ni-Ce2O3-Pt-Rh catalyst was prepared by incipient impregnation method by step wise in the order of Rh, Pt, and then ( Ni + Ce) simultaneously. The atomic ratio was consistently kept in Ni:Ce:Pt:Rh = 100:20:3:1, irrespective of different loading on various supports. Fiber Flax (ceramic fiber texture), cordierite honeycomb, and high-temperature calcined alumina spherical particles were applied to the support. In case of the former two, alumina-washcoat was made to increase the surface area. The detail procedures for preparation are described in elsewhere4, 5. Reaction methods. Reforming of methane or NG (Natural gas) was conducted by three steps, 5 l/h4, 5, 2 m3/h, and 20 m3/h as expressed with volume rate of produced H2. The former was operated under atmospheric pressure, and the later two were operated under 0.8 MPa. Reforming of LPG (liquid petroleum gas) was conducted 1m3 H2/h scale under atmospheric pressure for the purpose of supplying to 1 kW class PEFC (polymer electrolyte fuel cell). In case of pure hydrogen (99.999% purity) production, desulfurization catalyst, H2O-CO shift catalyst, and PSA units were employed from commercial ones, respectively. Larger scale reactor systems were fully controlled by computers. Analyses of reactants and products were made by using on-line micro-gas chromatographs. Results and Discussion
20 Nm3/h scale pilot plant for 99.999% H2 production. As the catalyst of reformer, the Ni-Ce2O3-Pt-Rh catalyst supported on spherical theta-alumina of 2.4-4.0 mm in diameter was used. Loading of Ni was 6%. Loading of other components were the same as mentioned above. A reactor for the reforming was made of Inconel 800HT and has an inner diameter of 50 mm. The catalyst was packed in the reactor by 196 ml, or the catalyst-bed length was 10 cm. a city gas, A city gas A-13 (calorie-enhanced natural gas), composed of 88.71%CH4, 5.29%C2H6, 3.05%C3H8, 2.70%C4H10, and 0.24% H2 was added to remove the organic sulfur compounds in the city gas through the desulfurization catalyst bed. One of the typical compositions of the feed gas to the reformer was settled at 23.48%NG, 15.50%O2, and 61.50%H2O. The feed gas was fed to the reformer with a space velocity (SV) of 203,800 h-1 under 0.77 MPa, and at an entrance temperature of 407ºC. The reforming reactor was heated by an electric furnace at 800ºC for only to maintain the surrounding temperature. The order of feed-gas introduction to the to the reformer was in the order of steam, desulfurized NG and O2. The introduction of O2 was done while gradually increase of the concentration within ca. 10 - 20 minutes. As shown in Figure 1, catalyst-bed temperature of the reformer instantaneously raised to
Fuel Chemistry Division Preprints 2003, 48(1), 370

Figure 1. A time course of the reforming of NG with the thermo-neutral reaction method. Conditions are described in the text.
Figure 3. A time course of the reforming of LPG with the thermo-neutral reaction method. Conditions are described in the text.
900 ± 28ºC at the 10 mm position from the entrance, and gradually decreased to 826 ± 17ºC at 80 mm position. The catalyst temperature was very stable within the fluctuation of ± 28ºC. Oxygen and C2 –C4 hydrocarbons in the NG fed were totally converted, and conversion of CH4 was 92.8%. The formed gas was composed of 64.97% H2, 19.76% CO, 13.40%CO2, and 1.87% CH4 as expressed by dry-gas basis. The space-time yield (STY) in the reformer was 4,730 mol/l/h, which is two-order magnitude larger than that in conventional reformers equipped with a heating furnace of the reactors.
length of 13 – 250 mm. Oxygen concentration in the feed gas was varied from 0 to 12.75%, with keeping the volume rates of LPG and H2O(gas) at 165.6 l/h and 1,404 l/h, respectively. LPG used involves 96%C3H8, 2% C2H6, 3% C4H10, and ca.5 ppm of sulfur compounds. Dependence of O2 concentration on the steam reforming of LPG at the catalyst volume 33.3 ml or 106 mm in packed length was shown in Figure 2. Space velocity was changed from 47,750 to 54,730 h-1
by the increase of O2 concentration. Above 11% of O2 concentration C3H8 conversion almost attained to 100%. The increase O2 concentration enhanced while elevating catalyst-bed temperature, however, above 12% O2, part of CO and H2 formed were combusted and the maximum catalyst-bed temperature beyond 900 – 950 ºC, resulting the decrease in H2 yield. With lower O2 concentration CH4 formed from C3H8 remains in the product. A time course of the reforming was presented in Figure 3. Compared with the case of NG reforming as shown in Figure 1, since absolute partial pressure of O2 in the NG reforming was lower in LPG reforming, by ca. 1/10, due to the condition of total pressure, time course of the reactions is extended; however, essential reaction courses were the same. From the detailed reaction analyses on material balance and heat balance, precise reaction passes have been elucidated. Application to reforming of n-hexane, gasoline, and methanol will be mentioned.
The formed gas was cooled to 218ºC by passing through a couple of heat exchangers, and then it was introduced to a shift reactor to convert CO to H2 and CO2. The conversion of CO was 86.5%. The formed gas was introduced a pressure-swing adsorption units to separate other gases. The recovering H2 was 90%. Thus, 99.999% purity H2 was obtained with a flow rate of 20.0 Nm3/h. Life test of the catalyst for continuous 914 h showed its stability.
Reforming of LPG for 1kW polymer electrolyte fuel cell. The same catalyst used in the NG reforming was used for LPG reforming. An Inconel 800HT tubular reactor having 20 mm in inner diameter was used under atmospheric pressure condition. The catalyst was packed in the reactor by 4.1 – 78.5 ml, or catalyst-bed
Conclusions By keeping the good balance between exothermic catalytic combustion and endothermic catalytic reforming, extra ordinary reforming rate was realized using the non-coke deposited catalyst. Acknowledgement
The work of LP gas reforming was supported by NEDO and LPG Center under contact of a 5-years national project “Development of Fuel Cell System with Liquefied Petroleum Gas”. References (1) Inui, T. Catalysis, Royal Soc. Chem., 2002, 16, p.133-154. (2) Inui, T., CO2 Conversion and Utilization, ACS Symp. Ser. 809, Amer.
Chem. Soc., Song, et. al., edits., 2002, p. 133-154. (3) Inui, T., Stud. Surf. Sci. Catal., 1993, 77, 17-26.. (4) Inui, T., Appl. Organometal. Chem. 2001, 15, 87-94. (5) Inui, T., Takeguchi, T., Matsuoka, I., Current Topics in Catal., 1999, 2,
73-82.
Figure 2 Dependence of O2 concentration on the reforming of LPG
Fuel Chemistry Division Preprints 2003, 48(1), 371

PREREFORMING OF NATURAL GAS
Rune Lødeng1, De Chen2, Kjersti O. Christensen2, Henrik S. Andersen3, Morten Rønnekleiv4, Anders Holmen2
1SINTEF Applied Chemistry, N-7465 Trondheim, Norway. 2Dept. of
Chemical Engineering, Norwegian University of Science and Technology (NTNU), N-7491, Norway. 3Norsk Hydro, PO. Box 2560, N-3901 Porsgrunn, Norway. 4Statoil, Postuttak, N-7005
Trondheim, Norway.
Introduction A prereforming step is common in modern plants for production of synthesis gas to increase feed flexibility, reduce energy consumption, and lower investments. Adiabatic prereforming is basically low temperature steam reforming, combined with equilibration of water-gas shift and hydrogenation [1]. The process is endothermic for natural gas. CnHm+ nH2O ⇀nCO + (n +1/2m) H2 -∆H0
298 < 0 CO + H2O ⇋ CO2 + H2 -∆H0
298 = 41.2 kJ/mol CO + 3H2 ⇋ CH4 + H2O -∆H0
298 = 206.2 kJ/mol Poisoning and coke (gum) formation are the most common reasons for deactivation [2]. Poisoning are caused by inorganic elements like S, Si, K, and Na. Other causes of deactivation include sintering of nickel and of the support [3]. Different types of carbon forming on nickel [4,5,6,7,8] include filamentous, gum, and more or less ordered encapsulating carbon. The gum and filament formation has been described [2] as follows: CnHx - * ⇀ -CH2CH2- * ⇀ gum (aromatic) CnHx - * ⇀ C- * (atomic C) ⇀ filaments While gum carbon is encapsulating the active nickel surface, filaments are breaking up the pellets without covering the surface. Carbon can be avoided by operating at high steam to carbon ratios and by adding alkali metals and basic oxides like MgO and CaO to the catalyst. The aim of the present work was to study prereforming of natural gas over commercial nickel catalysts and in particular the conditions for catalyst deactivation. Experimental An industrial prereforming catalyst (PR) with 45 wt% nickel, 10 wt% MgO and 10 wt% α-Al2O3 was used. Most of the tests were performed with catalyst (PR-S) which had been stabilized prior to the experiments by exposing the fresh catalyst (PR-F) to a mixture of natural gas and steam for 600 hours at a S/C ratio of 2 at 490oC. Surface areas (BET) are 26 m2/g for the stabilized catalyst and 155 m2/g for the fresh catalyst. Tests with a fresh steam reforming catalyst (SR-F) containing 11 wt% Ni, and 9 wt% CaO in spinel with Al2O3 (BET surface area: 5 m2/g) were performed for comparison. The experiments were carried out using a Tapered Element Oscillating Microbalance (TEOM) reactor which has been described in detail previously [9]. The catalyst bed consisted of 3-10 mg of 0.3-0.5 mm catalyst particles diluted with similar α-Al2O3 grains and held in place by Nextel610 alumina wool. Materials containing SiO2 were avoided because of instability in presence of steam. Catalyst reduction was done with an equimolar H2/Ar mixture heated to 550 oC at a rate of 2 oC/min. The following conditions were used: Total pressure 20 bar, temperatures 450–580 oC, steam to carbon ratios in the range 0.3- 1.3, and gas hourly space velocities (GHSV) of 7.4·105–3.3·106 ml
(reactants)/gcat,h. Different sulfur free mixtures of methane and C2/C3 hydrocarbons have been used as feed (Ar as balance). The mass was followed continuously with the TEOM and the products were analyzed on-line with a HP5890 SII GC using N2 as an internal standard. Results and Discussion A prereforming catalyst is designed for low temperature service. It has normally high nickel loading, reasonable porosity, and relatively high surface area. The average crystallite size is relatively small (<50 nm) compared to catalysts designed for high temperature service (200–1000 nm). Nickel catalysts can sinter seriously at high temperature, especially in presence of steam [3]. Recent results [10] indicate that a steam reformer catalyst also can sinter seriously at low temperature, 500 0C, in a H2O/H2 = 10 mixture at 30 bars pressure. The rates of sintering were initially high and gradually stabilizing over 300 hours. The present work indicates a significant decrease in BET surface area after 600 h in steam/natural gas even at 490 oC. Figure 1 shows a comparison of PR-F, PR-S, and SR-F at 460oC. While no visible carbon forms on the fresh catalyst (for 30 hours on-stream), carbon is readily formed on the sintered sample.
0
25
50
75
100
0 3 6 9 12 15Time on stream [hours]
C3H
8 con
vers
ion
[%]
-5
0
5
10
15
20
Mas
s ch
ange
[%]
PR-S SR-F PR-F
Figure 1. Comparison of fresh (PR-F) and stabilized (PR-S) pre-reformer catalyst and a fresh steam reformer catalyst (SR-F). T=460 oC, PT=20 bar, PH2=0.1 bar. Feed composition for PR-S and PR-F: PCH4=3.3 bar, PC2H6=0.4 bar, PC3H8=0.18 bar, PH2O=1.46 bar. Feed composition for SR-F: PCH4=3.8 bar, PC3H8=0.15 bar, PH20=1.2 bar The feed composition is important for carbon formation and deactivation. Previous results have shown [11|] that for steam reforming of CH4 or CH4 + C3H8 mixtures at 650 oC and 20 bar and at conditions where carbon formation is possible, large amounts of filamentous carbon can be formed resulting in only a very small deactivation following the initial carbon. However, the deactivating effect of carbon seems to be stronger at prereforming conditions as shown on Figure 2 where the conversion of C3H8 and C2H6 dropped from about 90 % to about 75 % after a coke deposition of 100 wt%. Adding olefins to the feed increases strongly the deactivating effect of carbon. Adding 800 ppm C3H6 to the feed resulted in a drop in the conversion of C3H8 from about 90 % to about 60 % after a coke deposition of only 40 wt%. Experiments at different temperatures also clearly indicate that most of the deactivating effect of carbon formed on the catalyst is due to C3H6 favoring encapsulating carbon.
Fuel Chemistry Division Preprints 2003, 48(1), 372
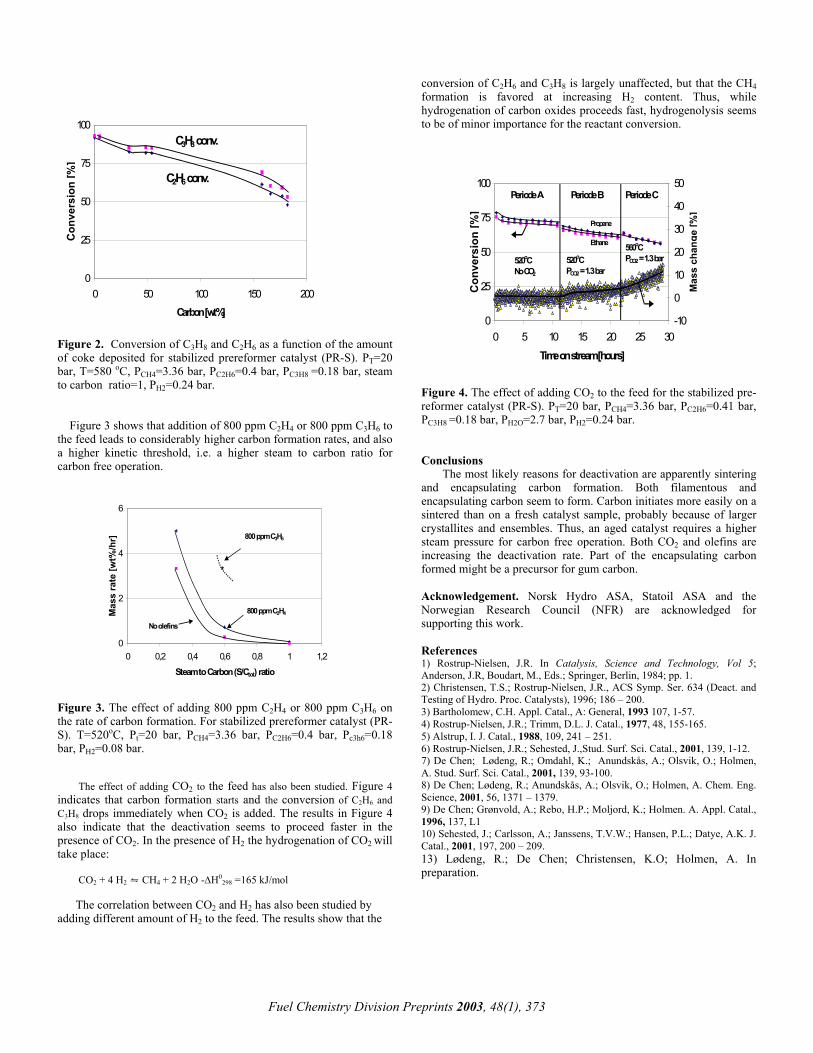
conversion of C2H6 and C3H8 is largely unaffected, but that the CH4 formation is favored at increasing H2 content. Thus, while hydrogenation of carbon oxides proceeds fast, hydrogenolysis seems to be of minor importance for the reactant conversion.
0
25
50
75
100
0 50 100 150 200Carbon [wt%]
Con
vers
ion
[%]
C3H8 conv.
C2H6 conv.
0
25
50
75
100
0 5 10 15 20 25 30Time on stream [hours]
Con
vers
ion
[%]
-10
0
10
20
30
40
50
Mas
s ch
ange
[%]
Ethane
Propane
520oCNo CO2
520oCPCO2 = 1.3 bar
560oCPCO2 = 1.3 bar
Periode A Periode B Periode C
Figure 2. Conversion of C3H8 and C2H6 as a function of the amount of coke deposited for stabilized prereformer catalyst (PR-S). PT=20 bar, T=580 oC, PCH4=3.36 bar, PC2H6=0.4 bar, PC3H8 =0.18 bar, steam to carbon ratio=1, PH2=0.24 bar.
Figure 4. The effect of adding CO2 to the feed for the stabilized pre-reformer catalyst (PR-S). PT=20 bar, PCH4=3.36 bar, PC2H6=0.41 bar, PC3H8 =0.18 bar, PH2O=2.7 bar, PH2=0.24 bar.
Figure 3 shows that addition of 800 ppm C2H4 or 800 ppm C3H6 to the feed leads to considerably higher carbon formation rates, and also a higher kinetic threshold, i.e. a higher steam to carbon ratio for carbon free operation.
Conclusions The most likely reasons for deactivation are apparently sintering and encapsulating carbon formation. Both filamentous and encapsulating carbon seem to form. Carbon initiates more easily on a sintered than on a fresh catalyst sample, probably because of larger crystallites and ensembles. Thus, an aged catalyst requires a higher steam pressure for carbon free operation. Both CO2 and olefins are increasing the deactivation rate. Part of the encapsulating carbon formed might be a precursor for gum carbon.
0
2
4
6
0 0,2 0,4 0,6 0,8 1 1,2Steam to Carbon (S/Ctot) ratio
Mas
s ra
te [w
t%/h
r]
800 ppm C2H4
No olefins
*
800 ppm C3H6
Acknowledgement. Norsk Hydro ASA, Statoil ASA and the Norwegian Research Council (NFR) are acknowledged for supporting this work. References 1) Rostrup-Nielsen, J.R. In Catalysis, Science and Technology, Vol 5; Anderson, J.R, Boudart, M., Eds.; Springer, Berlin, 1984; pp. 1. 2) Christensen, T.S.; Rostrup-Nielsen, J.R., ACS Symp. Ser. 634 (Deact. and Testing of Hydro. Proc. Catalysts), 1996; 186 – 200.
Figure 3. The effect of adding 800 ppm C2H4 or 800 ppm C3H6 on the rate of carbon formation. For stabilized prereformer catalyst (PR-S). T=520oC, Pt=20 bar, PCH4=3.36 bar, PC2H6=0.4 bar, Pc3h6=0.18 bar, PH2=0.08 bar.
3) Bartholomew, C.H. Appl. Catal., A: General, 1993 107, 1-57. 4) Rostrup-Nielsen, J.R.; Trimm, D.L. J. Catal., 1977, 48, 155-165. 5) Alstrup, I. J. Catal., 1988, 109, 241 – 251. 6) Rostrup-Nielsen, J.R.; Sehested, J.,Stud. Surf. Sci. Catal., 2001, 139, 1-12. 7) De Chen; Lødeng, R.; Omdahl, K.; Anundskås, A.; Olsvik, O.; Holmen, A. Stud. Surf. Sci. Catal., 2001, 139, 93-100.
8) De Chen; Lødeng, R.; Anundskås, A.; Olsvik, O.; Holmen, A. Chem. Eng. Science, 2001, 56, 1371 – 1379.
The effect of adding CO2 to the feed has also been studied. Figure 4 indicates that carbon formation starts and the conversion of C2H6 and C3H8 drops immediately when CO2 is added. The results in Figure 4 also indicate that the deactivation seems to proceed faster in the presence of CO2. In the presence of H2 the hydrogenation of CO2 will take place:
9) De Chen; Grønvold, A.; Rebo, H.P.; Moljord, K.; Holmen. A. Appl. Catal., 1996, 137, L1 10) Sehested, J.; Carlsson, A.; Janssens, T.V.W.; Hansen, P.L.; Datye, A.K. J. Catal., 2001, 197, 200 – 209. 13) Lødeng, R.; De Chen; Christensen, K.O; Holmen, A. In preparation.
CO2 + 4 H2 ⇋ CH4 + 2 H2O -∆H0298 =165 kJ/mol
The correlation between CO2 and H2 has also been studied by adding different amount of H2 to the feed. The results show that the
Fuel Chemistry Division Preprints 2003, 48(1), 373

Reforming of Liquid Hydrocarbon Fuels for Micro Fuel Cells. Steam Pre-reforming of Jet Fuel over Supported
Metal Catalysts
Reaction system. A catalyst (1.0 gram with particle size of 18~35 mesh) is placed into the middle of stainless steel reactor tube (Inconel 800H alloy, with 0.54” O.D. X 0.375” I.D. and 24” long), with the remaining tube filled with α-Al2O3 beads. Before introducing the fuel, the catalyst is heated up to a certain temperature (500˚C) under the hydrogen flow of 20 ml/min, which is controlled by the mass flow controller system, and kept at this temperature for two hours. Then the carrier gas is switched to nitrogen. At the same time, the pre-heater is turned up to certain temperature high enough for vaporizing of the fuel (C12H26, b.p. 216˚C) and water before entering the reactor.
Jian Zheng, Jian-Ping Shen, Chunshan Song*, Wei Pan, James Jon
Strohm
Clean Fuels and Catalysis Program, The Energy Institute and Department of Energy & Geo-Environmental Engineering, Pennsylvania State University, University Park, PA 16802
*Email: [email protected]; Tel: 814-863-4466; Fax: 814-865-3248 To start the test, water was first introduced for 30 minutes
before opening the fuel flow to ensure that there is always steam accompanying fuel flow in the reactor lines. The fuel is then introduced with one of the two HPLC pumps through the pre-heater into the reactor with a volumetric flow rate of 1.38 ml/hr. The water flow is kept at 4.02 ml/hr with a steam to carbon ratio of 3:1.
Introduction
Fuel cell has been identified as a potential device for portable power supply because it is convenient, quiet and energy efficient. In general, all the fuel cells operate without combusting fuel and with few moving parts, and thus they are very attractive from both energy and environmental viewpoints. Inside a fuel cell there are separate reactions at the anode and the cathode, and charged ions move through the electrolyte, while electrons move round an external circuit. Fuel processing is applicable to both high-temperature fuel cells such as solid-oxide fuel cell (SOFC, operating at about 800-1000°C) and low-temperature fuel cells such as proton exchange membrane fuel cells (PEMFC, operating at about 80°C).
During the reaction, the liquid products are collected every hour by a liquid condenser with volume measured for the calculation of total conversion; the gas products are analyzed on-line by a multi-gas analyzer GC-TCD for the calculation of product distributions. The reactor system is pictured in Figure 1.
The strategy of fuel processing depends on the nature of fuel and type of fuel cells. The choice of liquid fuels such as jet fuel and diesel fuel as logistic fuels is an important consideration for portable fuel cells, because they are widely available and have lower volume and higher energy density.
Temperaturecontroller
Mass flowcontroller
Data collectingsystem Online GC-TCD/FID
multi-gas analyzer
GC-FID for liquid
HPLC pump
Back pressure regulator
Three zone furnace
Pre-heater
Liquid condenser
Fuel tank
On the other hand, the choice of fuel cells has a significant impact on the fuel processing strategies for on-board fuel pre-processor. The general status of fuel cells and fuel processing are described in a book by Larminie & Dicks1. The challenges and opportunities on fuel processing for fuel cell applications have been discussed in a recent review2.
Some recent advances in laboratory research has made it possible to make a solid oxide fuel cell for direct electro-chemical oxidation of light hydrocarbons such as methane and ethane3. However, it is widely known that the use of heavy hydrocarbons of > C4 can cause significant deactivation and coking problem associated with most anode catalysts for SOFC1. A series of work by our group has also demonstrated that JP-8 type jet fuels can easily undergo thermal decomposition to form carbonaceous solid deposits both in batch reactor4-6 and in flow reactor7-9 in the temperature range (400-700°C).
Figure 1. Schematic photo of the integrated reforming system Results and Discussion
Based on our experience in the thermal decomposition of jet fuels4-9, we expect that proper pre-mixing of feed fuel and steam is important for the prevention of coke formation prior to the pre-reforming.
Therefore, one of the main problems in developing fuel pre-processor for micro-fuel cell application using liquid fuel such as JP-8 jet fuel is how to eliminate the carbon formation from higher hydrocarbons during reforming.
In order to improve the pre-mixing, we added a wick material (made of quartz) into the stainless steel tube between the outlet of fuel line and the inlet of reactor (the pre-mixing zone). We then examined the effects of using wick mixer for feed introduction on carbon formation at different temperatures. Interestingly we find that, in order to prevent carbon formation in the pre-mixing zone as revealed by the color of wick, the fuel line should be kept at lower temperature (160ºC-200°C) before fuel meets steam, i.e., rather than allowing the fuel to evaporate at the wick, the steam must serve to vaporize the fuel, which also results in more homogeneous pre-mixing.
Our approach to solving this problem is to conduct catalytic fuel reformation in two stages with a pre-reformer (oxygen-assisted if necessary) to break-down most C8-C13 hydrocarbons to C1 to C2 molecules plus CO and H2, followed by steam reforming (possibly also oxygen-assisted) in main reformer to produce reformates (H2, CO, CO2). The present paper reports on our preliminary work on the pre-reforming of model jet fuel (also desulfurized real jet fuel in the near future) in a lab-scale reforming system. The reforming work (following pre-reforming) is reported in a companion paper at this meeting. The conventional pre-reforming of natural gas or light naphtha
is usually run in an adiabatic reactor, i.e., there is no external heat supply during the reaction10. It is therefore important for us to set up suitable temperature profiles for pre-reforming of model jet fuels using our tubular furnace as shown in Figure 1.
Experimental
Noble metals such as Rh, Ru, etc. supported on MgO and CeO2-Al2O3 have been prepared and tested as catalysts. Normal dodecane (C12H26) has been used as a model jet fuel.
Fuel Chemistry Division Preprints 2003, 48(1), 374

-
20
40
60
80
0 2 4 6 8 10 12
TOS (hour)
0
20
40
60
80
100
Dod
ecan
e C
onve
rsio
n (%
)
H2 CH4CO CO2Conv. (%)
In general, higher temperature will result in higher conversion of the fuels, since the steam reforming alone is endothermic. However, there is also a risk for carbon formation. We carried out blank run by flowing n-dodecane and steam with same ratio through only α-Al2O3 beads without any catalyst in the reactor. It is found that if reaction temperature reaches as high as 600ºC, there is a significant amount of carbon deposition during the reaction, since the alumina beads unloaded from the pre-reformer were dark in color. This result indicates that thermal cracking of fuel can take place in the pre-reformer, leading to the formation of carbon on these beads. Therefore, in order to prevent carbon formation, the pre-reforming temperature should be below 600ºC.
Although base-metal catalysts (e.g. Ni) are of interest in terms of lower cost, our results on pre-reforming of dodecane using a commercial Al2O3-supported Ni (G-91 from Süd Chemie) shows that the initial conversion is only around 57% at 550˚C, yet rapid deactivation was observed and the reaction has to be stopped due to serious carbon formation (tube fouling) after a few hours. Subsequently, we prepared noble-metal catalysts in order to identify more active and stable catalysts for micro-fuel processor.
Figure 3. Pre-reforming of dodecane on 2% Rh/MgO catalyst (steam/carbon ratio=3, GHSV=3200h-1) at 485˚C, atm.
0 200 400 600 800 1000Temperature (ÞC)
Figure 2 shows the pre-reforming results of n-dodecane on 1% Rh/MgO at 500˚C. It can be seen that the initial activity is very high (almost total conversion), however, it gradually deactivates with time on stream. An addition of certain amount of O2 can recover the activity, but due to the co-existence of combustion reaction, the H2 yield is reduced.
0
20
40
60
80
100
0 2 4 6 8TOS (hour)
Conv.H2
H2O/C=3O2/C=0
H2O/C=3O2/C=0.4
Figure 4. TPO-IR results of used 2% Rh/MgO catalyst after pre-reforming of dodecane at 485˚C for 10 hours. catalyst, supported rhodium catalysts show not only very high activity but also high resistance to deactivation due to carbon formation. The reformates from the current pre-reformer contain little or no higher hydrocarbons, besides significant amount of CH4, which can be further converted to H2 and CO by subsequent reforming.
Acknowledgement. We are grateful to the Palm Power Program of DARPA/DoD for supporting this work. We also wish to thank Dr. Mehdi Namazian of Altex Technologies Inc. for helpful discussions on the pre-mixing. Thanks also go to Mr. Ronald Copenhaver of PSU for help in setting up the reactor system.
Figure 2. Pre-reforming of dodecane at 500˚C on 1% Rh/MgO catalyst (steam/carbon ratio=3, GHSV=3200h-1) with or without the presence of O2 (O2/carbon ratio=0.4)
By increasing the amount of metal loading from 1 wt% to 2 wt% for Rh, we achieved a more effective pre-reforming of n-dodecane at 485˚C, as seen in Figure 3. It is clear that the 2% Rh/MgO shows a more stable activity for pre-reforming of the model jet fuel for 10 hours.
References (1) Larminie, J.; Dicks, A. In Fuel cell Systems Explained; John Wiley: New
York, 2000, pp.308. (2) Song, C. Catalysis Today, 2002,77, 17-49.
Figure 4 shows the TPO-IR spectrum of the used 2% Rh/MgO after pre-reforming of dodecane at the conditions described above for 10 hours. There are a few peaks shown in the TPO-IR temperature ranges of <400˚C, which can be attributed to the desorption of CO2 previously adsorbed on the used catalyst. There is almost no peak appearing in the range of 400˚C-600˚C that may be attributed to filament carbon, indicating no significant carbon formation on the laboratory-prepared supported 2% Rh/MgO catalyst.
(3) Park, S. D.; Vohs, J.M.; Gorte, R.J. Nature, 2000, 404 (6775), 265-267. (4) Song C.; Eser, S.; Schobert, H.H.; Hatcher, P.G. Energy & Fuels, 1993,
7 (2), 234-243 (5) Song, C.; Lai, W.C.; Schobert, H.H. Ind. Eng. Chem. Res. 1994, 33 (3),
548-557. (6) Lai, W.C.; Song, C. Fuel. Proc. Technol., 1996, 48 (1), 1-27. (7) Andrésen, J. M.; Strohm, J.J.; Coleman, M.M.; Song, C. Prepr. Pap. -
Am. Chem. Soc., Div. Petrol. Chem., 2000, 45 (3), 454-458. (8) Andrésen, J. M.; Strohm, J.J.; Song, C.S. Prepr. Pap. - Am. Chem. Soc.,
Div. Petrol. Chem., 1999, 44 (3), 562-566. Conclusions (9) Strohm, J.J.; Andrésen, J. M.; Song, C. Prepr. Pap. - Am. Chem. Soc.,
Div. Petrol. Chem., 2000, 45 (3), 465-469. Proper pre-mixing of feed liquid fuels and steam has been found to be important for the prevention of coke formation prior to pre-reforming. As compared with commercial Ni supported Al2O3
(10) Christensen, T.S. Appl. Catal. A: Gen., 1996, 138, 285-309.
Fuel Chemistry Division Preprints 2003, 48(1), 375
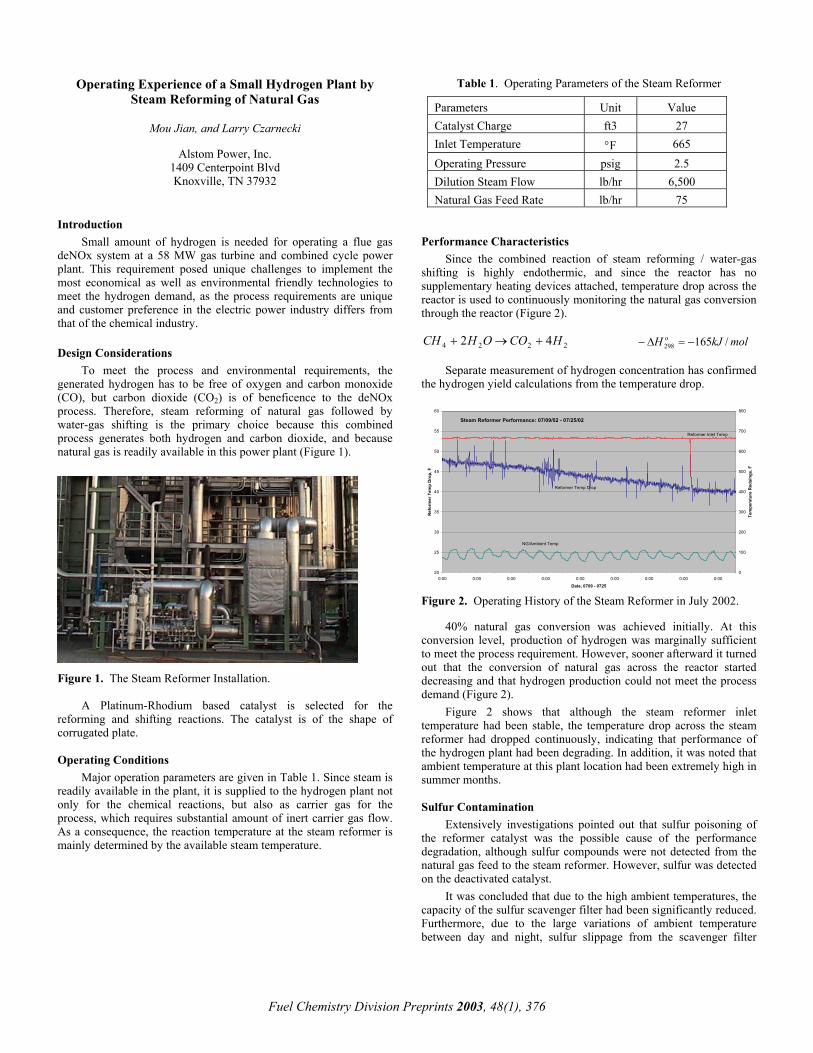
Operating Experience of a Small Hydrogen Plant by Steam Reforming of Natural Gas
Table 1. Operating Parameters of the Steam Reformer
Parameters Unit Value Catalyst Charge ft3 27 Inlet Temperature °F 665 Operating Pressure psig 2.5 Dilution Steam Flow lb/hr 6,500 Natural Gas Feed Rate lb/hr 75
Mou Jian, and Larry Czarnecki
Alstom Power, Inc.
1409 Centerpoint Blvd Knoxville, TN 37932
Introduction
Performance Characteristics Small amount of hydrogen is needed for operating a flue gas deNOx system at a 58 MW gas turbine and combined cycle power plant. This requirement posed unique challenges to implement the most economical as well as environmental friendly technologies to meet the hydrogen demand, as the process requirements are unique and customer preference in the electric power industry differs from that of the chemical industry.
Since the combined reaction of steam reforming / water-gas shifting is highly endothermic, and since the reactor has no supplementary heating devices attached, temperature drop across the reactor is used to continuously monitoring the natural gas conversion through the reactor (Figure 2).
2224 42 HCOOHCH +→+ molkJH o /165298 −=∆− Design Considerations
Separate measurement of hydrogen concentration has confirmed the hydrogen yield calculations from the temperature drop.
To meet the process and environmental requirements, the generated hydrogen has to be free of oxygen and carbon monoxide (CO), but carbon dioxide (CO2) is of beneficence to the deNOx process. Therefore, steam reforming of natural gas followed by water-gas shifting is the primary choice because this combined process generates both hydrogen and carbon dioxide, and because natural gas is readily available in this power plant (Figure 1).
20
25
30
35
40
45
50
55
60
0:00 0:00 0:00 0:00 0:00 0:00 0:00 0:00 0:00
Date, 0709 - 0725
Ref
orm
er T
emp
Dro
p, F
0
100
200
300
400
500
600
700
800
Tem
pera
ture
Red
aing
s, F
Steam Reformer Performance: 07/09/02 - 07/25/02
NG/Ambient Temp
Reformer Inlet Temp
Reformer Temp Drop
Figure 2. Operating History of the Steam Reformer in July 2002.
40% natural gas conversion was achieved initially. At this conversion level, production of hydrogen was marginally sufficient to meet the process requirement. However, sooner afterward it turned out that the conversion of natural gas across the reactor started decreasing and that hydrogen production could not meet the process demand (Figure 2).
Figure 1. The Steam Reformer Installation.
A Platinum-Rhodium based catalyst is selected for the reforming and shifting reactions. The catalyst is of the shape of corrugated plate.
Figure 2 shows that although the steam reformer inlet temperature had been stable, the temperature drop across the steam reformer had dropped continuously, indicating that performance of the hydrogen plant had been degrading. In addition, it was noted that ambient temperature at this plant location had been extremely high in summer months.
Operating Conditions
Major operation parameters are given in Table 1. Since steam is readily available in the plant, it is supplied to the hydrogen plant not only for the chemical reactions, but also as carrier gas for the process, which requires substantial amount of inert carrier gas flow. As a consequence, the reaction temperature at the steam reformer is mainly determined by the available steam temperature.
Sulfur Contamination
Extensively investigations pointed out that sulfur poisoning of the reformer catalyst was the possible cause of the performance degradation, although sulfur compounds were not detected from the natural gas feed to the steam reformer. However, sulfur was detected on the deactivated catalyst.
It was concluded that due to the high ambient temperatures, the capacity of the sulfur scavenger filter had been significantly reduced. Furthermore, due to the large variations of ambient temperature between day and night, sulfur slippage from the scavenger filter
Fuel Chemistry Division Preprints 2003, 48(1), 376

Fuel Chemistry Division Preprints 2003, 48(1), 377
could have well occurred only in a very short time window, which was very difficult to detect.
Although most noble metal based steam reformer catalyst is said to be able to tolerate a few ppmv of sulfur, it is certainly not the case for the present installation, possibly due to the low operating temperatures. In addition, certain sulfur compounds in the natural gas feed to the steam reformer may be easier to slip through the scavenge filter than others, such as hydrogen sulfide (H2S) and carbonyl sulfide (COS), both exist in the current natural gas feed.
Upon successfully regeneration of the steam reformer catalyst, initial catalytical activity has been restored, and furthermore, additional operation margin has since been implemented for further operations. Conclusions
Temperature drop across the steam reformer reactor has been successfully used to monitor the performance of the steam reforming/WGS reactions.
Sulfur slip from scavenger sorbent may easily occur at extreme weather conditions, and certain sulfur-containing compounds are earlier to escape the sulfur trap than others.

Reforming of Liquid Hydrocarbon Fuels for Micro Fuel Cells. Steam Reforming of Pre-reformate from Jet Fuel
over Supported Metal Catalysts
Jian Zheng, Chunshan Song*
Clean Fuels and Catalysis Program, The Energy Institute and Department of Energy & Geo-Environmental Engineering, Pennsylvania State University, University Park, PA 16802
*Email: [email protected]; Tel: 814-863-4466; Fax: 814-865-3248 Introduction
Recently, increasing attention has been paid on exploring compact and efficient fuel processors for fuel cell applications around the world1,2. We are exploring a fuel-cell fuel processor using logistic fuel (such as JP-8 jet fuel) for portable fuel cell application. As mentioned in a preceding paper2, our approach to solving the potential problem of carbon formation during reforming of higher hydrocarbon fuels is to conduct catalytic fuel reformation in two stages, with a pre-reformer (oxygen-assisted if necessary) to break-down most C8-C13 hydrocarbons to C1 to C2 molecules plus CO and H2, followed by steam reforming (possibly also oxygen-assisted) in main reformer to produce reformats (H2, CO, CO2). Our preliminary studies on pre-reformer are discussed elsewhere2.
The target for the main reformer sub-section in our integrated fuel-cell fuel processor is to convert smaller hydrocarbons (mainly C1, with some C2-C4) from the pre-reformer into carbon monoxide and hydrogen without any significant carbon formation. The main concern here is that gas mixtures including also H2 and CO2, instead of pure CH4 and/or C2-C4, will be the feed for the main reformer, since there will be no gas separation device between pre-reformer and reformer. The presence of H2, CO2 and CO produced from pre-reformer inevitably affects the activity and the carbon formation behavior of catalysts used for reformer. Furthermore, the compositions of the effluent from pre-reformer are uncertain, considering that different catalysts and reaction conditions in the pre-reformer are also being screened and tested. Therefore, we began the study of reforming using some model gas mixtures to simulate both the better and worse cases of products from pre-reformer.
Most industrial steam reforming of light hydrocarbons (C1-C4) uses a supported Ni catalyst. While the studies on steam reforming using noble-metal catalysts are limited, there are evidences indicating that these materials can be more active and more resistant to carbon formation than conventional Ni catalysts3-11. However, the metal activity over various supported materials for steam reforming under different conditions results in some contradictory trends in the literature. The specific activities of metals supported on alumina or magnesia have generally been found to be3: Rh ~ Ru > Ni ~ Pd ~ Pt > Re > Co. Turnover numbers have also been reported for steam reforming of methane and ethane on noble metals relative to Ni. For silica-supported catalysts used for methane steam reforming, the relative activities are4: Rh (1.6) > Ru (1.4) > Ni (1) > Pd (0.6) > Pt (0.5), whereas for alumina-supported systems with ethane5, 6: Rh (13) > Ru (9.5) > Pd (1.0) ~ Ni (1.0) > Pt (0.9). For the steam reforming of propane/propene mixtures, the order of activity is7: Rh ~ Ir > Pt > Co > Ru > Ni ~ Re. While the order of activity per metal site (on the base 100 for Rh) for the toluene steam reforming is8: Rh (100) > Pd (29) > Pt (19) > Ni (17) > Ir (13). It seems that rhodium has been generally found to be the most active metal, whereas no common agreement and knowledge has been achieved on the activity of iridium as catalyst for steam reforming of hydrocarbons.
With the need for on-board reforming for fuel cell applications, there has been renewed interest in developing more active catalysts
that can operate under more severe conditions and lower steam to carbon ratios for steam reforming of hydrocarbons. Instead of using Al2O3 as support, some new materials (e.g., CeO2, ZrO2, etc.) especially those having unique features, such as stabilization of noble metal dispersion and the ability to improve the storage of oxygen, have been utilized9-13. Catalytic properties of CeO2 and CeO2-containing materials have been studied extensively12. Noble metal based catalysts (Pt, Pd and Rh) deposited on various support such as Al2O3, CeO2 and ZrO2, have been tested in various reforming processes, and they provide good catalytic activity in methane, propane or n-butane steam reforming reactions9, 13-14. The presence of CeO2 as a promoter has also been found to confer high catalytic activity to the alumina-supported Pd catalyst for methane steam reforming11. Furthermore, the catalytic activity and the synergetic effect for the Pd/CeO2/Al2O3 catalysts are strongly dependent on the crystallinity, dispersion and stoichiometry of the CeO2 promoter deposited. Highly crystalline CeO2 increases the catalytic activity of a Pd-supported catalyst when used in methane steam reforming11.
In the present work, various noble metals have been supported on CeO2 modified Al2O3 for the steam reforming of two gas mixtures simulating the effluents from pre-reformer. Interestingly, iridium shows the highest activity for the steam reforming under severe conditions. Experimental
CeO2-Al2O3 (containing 20wt% CeO2) support was prepared by wet impregnation of γ-Al2O3 (LaRoche, 155 m2/g) with Ce(NO3)3
.6H2O (Aldrich) followed by calcinations at 800˚C in air for 3 hours. Various noble metals (such as Pt, Pd, Ru, Rh, Ir) have been supported on CeO2.Al2O3 by wet impregnation, with nominal metal content fixed at 1 wt%.
Commercial SMR catalyst (G-91) was obtained from Süd Chemie, with 15-25% NiO, 45-60% Al2O3, 5-15% CaAlO2, 5-15% CaO and 1-10% K2O (as per the data provided by vendor).
Simulated gas mixtures. SGM-1 (34.2% CH4, 16.2% H2,
15.5% CO2, and 34.2% Ar) was prepared to simulate a scenario where the pre-reforming is complete and has converted all higher hydrocarbons into C1 species and H2 in the pre-reformer. According to the literature15, the equilibrium gas composition from adiabatic pre-reforming is 51.7% CH4, 24.3% H2, 23.4% CO2, and 0.6% CO. We considered two factors in selecting the SGM-1. First, since the CO concentration is very low in the equilibrium gas composition, it was neglected. Another modification is that we added same amount of argon as that of CH4, which is to simulate the nitrogen concentration in the use of air for the purpose of “oxidative” pre-reforming.
SGM-2 (47.5% CH4, 35.5% H2, 7.0% CO2, 9.0% C2H6, and 1.0% C3H8) is chosen as an example for the reformats from incomplete pre-reforming, since there is a significant concentration of higher hydrocarbons (C2H6 and C3H8).
Reaction conditions. A given amount of catalyst sample (0.4 g or 0.1g, depending on the reaction need) was loaded in the middle of the stainless steel reactor tube (Inconel 800H alloy, with 0.54” O.D. X 0.375” I.D. and 24” long), with the remaining tube filled with α-Al2O3 beads. CH4 feed flow rate was chosen to be 13.7 ml/min. This is to simulate the real conditions defined by the calculations for 20 watts solid-oxide fuel cell.
Before starting the reforming, water was introduced for 30 minutes before opening the gas mixtures to ensure that there is always steam accompanying hydrocarbon flow in the reactor lines. Catalyst screening is then performed in a laboratory continuous-down-flow tubular reactor (as described in our previous paper3) at atmospheric pressure in the temperature range of 600-800°C, and
Fuel Chemistry Division Preprints 2003, 48(1), 378

steam to carbon ratio from 1.5 to 3.0. During the reaction, the gas products after condensing of remaining steam are analyzed on-line by a multi-gas analyzer GC-TCD for the calculation of conversion and product distributions.
50
60
70
80
90
100
550 600 650 700 750 800 850Temperature (ÞC)
SGM-1
SGM-2
Results and Discussion
Figure 1 shows methane conversion for steam reforming of SGM-1 and SGM-2 on a commercial G-91 catalyst (Ni supported on Al2O3 with some promoters) at temperatures of 600-800˚C. It can be seen that, for the steam reforming of the simulated effluents from the complete pre-reforming (SGM-1), the non-precious metal catalyst can reach almost equilibrium conversions. For SGM-2, since there are significant amounts of higher hydrocarbons (C2H6 and C3H8), which can produce CH4 during the reaction, the conversion of CH4 itself has been decreased as compared to the steam reforming of SGM-1, especially at lower temperatures. However, reacting at 800˚C, the non-precious metal catalyst can still achieve nearly complete conversion.
Figure 1. Steam reforming of SGM-1 and SGM-2 on G-91 catalyst (0.4g of catalyst, GHSV=13250h-1, S/C=3, atm)
These results indicate that these reforming conditions (including the temperature of 800°C and space velocity) are sufficient for the main reforming even using commercial Ni catalysts.
0
20
40
60
80
100
Pt Pd Rh Ru IrMetal types
In order to identify more active catalysts for reforming, we then reduced the catalyst amount to 0.1g under the same feed flow, so that the space velocity can be increased. Also the steam to carbon ratio was reduced from 3.0 to 1.5 to give us more flexibility for future potential applications.
Figure 2 shows the steam reforming results of SGM-2 at 800˚C over different metal supported catalysts. It can be seen that, while some of the noble metal catalysts (such as Pt and Pd) show even lower activity than that of commercial Ni supported G-91 catalyst (around 85%), the Ru supported catalyst shows similar activity to Rh (around 90%). Interestingly, the Ir supported on CeO2-Al2O3 shows the highest activity, which is as high as 95% conversion for CH4 out of the simulated gas mixtures (SGM-2).
The trend of metal activity for converting the lower hydrocarbons in the presence of H2 and CO2 (as in the case of SGM-2) is as follows: Figure 2. Steam reforming of SGM-2 over different metal catalysts
supported on CeO2-Al2O3 (0.1g catalyst, GHSV=21500h-1, 800˚C, S/C=1.5, atm)
Ir > Ru ~ Rh > Ni ~ Pd ~ Pt. Figure 3 shows the 10-hour steam reforming experiment of
SGM-2 over 1% Ir supported on CeO2-Al2O3 under the above-mentioned conditions. It is clear that the catalyst has high activity and is stable during the 10-hour run, with H2 being the dominant product (70%), together with some CO (25%) and small amount of CO2 (3%).
-
20
40
60
80
100
0 2 4 6 8 10 12TOS (hour)
0
20
40
60
80
100
CH
4 C
onve
rsio
n (%
)H2 CO
CO2 CH4 Conv.
We further studied the behavior of this catalyst under various temperatures, and found that we could achieve even higher conversion at slightly higher reaction temperatures. Furthermore, by carrying out TPO-IR, we detected no carbon formation on this catalyst. Therefore, Ir/CeO2-Al2O3 is a promising reforming catalyst for our proposed integrated fuel processor for micro-solid oxide fuel cells.
Figure 3. Steam reforming of SGM-2 on 1% Ir supported on CeO2-Al2O3 (0.1g of catalyst, GHSV=21500h-1, 800°C, S/C=1.5, atm)
Fuel Chemistry Division Preprints 2003, 48(1), 379

Fuel Chemistry Division Preprints 2003, 48(1), 380
Conclusions The reforming reaction can reach equilibrium conversion under sufficiently higher temperature and lower space velocity even on commercial Ni catalyst. However, under more demanding conditions (lower catalyst amount, higher space velocity and lower steam to carbon ratio), Ir/CeO2-Al2O3 catalyst shows the highest activity among all the CeO2-Al2O3 supported noble metal catalysts. The novel noble catalysts are stable for relatively long-duration laboratory tests, which are promising for use in a fuel processor for micro-fuel cell applications.
Acknowledgement. We are grateful to the Palm Power Program of DARPA/DoD for supporting this work. We also wish to thank Dr. Mehdi Namazian of Altex Technologies Inc., Dr. Wei Pan and Mr. J. Jon Strohm of PSU for helpful discussions on fuel reforming. Thanks also go to Dr. Jian-Ping Shen and Mr. Ronald Copenhaver of PSU for help in setting up the reactor system. References (1) Song, C. Catalysis Today, 2002,77, 17-49. (2) Trimm, D.L.; Onsan, Z.I. Catal. Rev., 2001, 43 (1,2), 31-84; Larminie,
J.; Dicks, A. In Fuel cell Systems Explained; John Wiley: New York, 2000, pp.308.
(3) Zheng, J.; Shen, J.P.; Song, C.; Pan, W.; Strohm, J.J. Prepr. Pap. - Am. Chem. Soc., Div. Fuel. Chem., 2003, 47 (1), in press.
(4) Kikuchi, E.; Tanaka, E.; Yamazaki, Y.; Morita, Y. Bull. Japan Petrol. Inst., 1974, 16, 95.
(5) Rostrup Nielsen, J.R. In Catalysis Science and Technology; Andersen, J.R.; Boudart, M., Ed.; Springer-Verlag, New York, 1984; Vol. 4, pp.34.
(6) Grenoble, D.C. J. Catal. 1973, 51, 203. (7) Gandhi, H.S.; Piken, A.G.; Stepien, H.K.; Shelef, M.; Delosh, R.G.;
Heyde, M.E. SAE Techn. Pap. Ser. No. 770166, in SAE Automotive Engineering Congress, Detroit, 1977.
(8) Duprez, D.; Pereira, P.; Grand, M.; Maurel, R. J. Catal., 1982, 75, 151. (9) Igarashi, A.; Ohtaka, T.; Motoki, S. Catal. Lett., 1991, 13, 189-194. (10) Wang, X.; Gorte, R.J. Catal. Lett., 2001, 73 (1), 15-19. (11) Craciun, R.; Daniell, W.; Knozinger, H. Appl. Catal. A: Gen., 2002, in
press. (12) Hofstad, K.H.; Rokstad, O.A.; Holman, A. Catal. Lett., 1996, 36, 25. (13) Barbier, J.Jr.; Duprez, D. Appl. Catal. B: Environ. 1993, 4, 105. (14) Kikuchi, E.; Nemoro, Y.; Kajiwara, M.; Uemiya, S.; Kojima, T. Catal.
Today, 2000, 56, 75. (15) Steinfeld, G.; Sanderson, R.; Ghezel-Ayagh, H.; Abens, S. In AICHE
Spring 2000 Meeting, March, 2000.

METHANOL AUTOTHERMAL REFORMING OVER OXIDE SUPPORTED NOBLE METAL CATALYSTS
Easwar S. Ranganathan, Shyamal K. Bej, and Levi T. Thompson
Department of Chemical Engineering
University of Michigan 2300 Hayward Ave.
Ann Arbor, MI 48109 Introduction
The apparently conflicting demands of high performance and environmental protection, in the design of vehicles, can be overcome by using fuel cells to generate electricity on-board. This concept would obviate the Carnot efficiency limitation faced by internal combustion engines, thus increasing the overall well to wheel fuel efficiency. Unfortunately, progress in producing hydrogen on-board is not matched by the advanced development of fuel cells.
Methanol steam reforming (SR) and autothermal reforming (ATR) are gaining interest for use in generating hydrogen for portable and automobile fuel cells.1 Methanol has several advantages over other candidate fuels. It is easier to transport than methane and other gaseous fuels, does not require desulfurization like present gasoline and diesel formulations, can be reformed at much lower temperatures (200-400 °C) than other hydrocarbons, and has a high energy density. Methanol SR is an endothermic reaction requiring external heating resulting in long start up times and poor transient responses, characteristics that are not desirable for most applications.2 Autothermal reforming combines endothermic steam reforming and exothermic partial oxidation to produce a near zero reaction enthalpy. The feed methanol/oxygen ratio can be varied to achieve the desired start-up times. For vehicular applications, the catalyst must have good activity at low temperatures to light off the reaction and it should also be stable at high temperatures to maintain the activity. In this paper, we report methanol ATR rates for a series of reducible oxide supported noble metal catalysts.
Experimental
Several oxide supported noble metal based catalysts were prepared. The oxide supports included ZnO, CeO2, ZrO2, ZnO-ZrO2, ZnO-CeO2, TiO2, and ZnO-TiO2. In addition to the monometallic catalysts, several bimetallic catalysts containing Pd, Cu and Pt were prepared. All of the catalysts were prepared using a wet impregnation method that is described elsewhere.3 The ATR activities were measured at 185-230 °C. In-depth activity measurements included testing the catalyst in the temperature range of 110-330 oC and atmospheric pressure with varying methanol to water ratios and varying oxygen to methanol ratios.
Reaction rate measurements were performed in a continuous flow system with a 4 mm ID quartz U-tube reactor, using 25-35 mg of catalyst diluted with 30-35 mg of inert silica. The catalyst bed was held between quartz glass wool plugs. The temperature of the reactor was maintained using a controller which powers an electric furnace. The thermocouple was placed 1 mm into the catalytic bed. The combined methanol-water mixture was fed using a HPLC pump at a rate of 1.8 ml/h and then preheated in a vaporizer. The air and nitrogen (diluent) flow rates were adjusted using mass flow controllers. The total flow was 100 ml(STP)/min, with a methanol molar concentration of 11.6% and oxygen to methanol ratios in the range of 0 to 0.5. The water to methanol molar ratio was varied in the range of 0 to 3. Experiments excluding water correspond to methanol decomposition or methanol partial oxidation, depending upon whether or not oxygen was added. The samples were reduced in situ
in a 4% H2/N2 stream at 200-400 oC. The exact reduction temperatures were determined by temperature programmed reduction (TPR). Analysis of the reactor effluents was performed using an on-line gas chromatograph (HP 5890) with a thermal conductivity detector and Carboxen 1000 column, using argon as the carrier gas.
Reaction runs for the commercial Cu-Zn-Al2O3 were performed to benchmark rates for the noble metal based catalysts.
Results and Discussion
For SR, the commercial Cu-Zn-Al2O3 catalyst out-performed the noble metal catalysts at all temperatures tested as shown in Figure 1. For ATR, the Cu-Zn-Al2O3 and 2% Cu/ZnO catalysts did not light-off until approximately 200 °C, therefore they were significantly less active than the noble metal catalysts below this temperature. Some of the noble metal catalysts were active for ATR at temperatures as low as 110 °C.
0
50
100
150
200
rate
( m
ol/g
/sec
).
SR ATR
Cu-Z
n-A
l 2O
3
2% C
u-Zn
O
2% P
d-Zn
O
2% P
d-Zn
O-C
eO2
1% P
d-1%
Cu-
ZnO
2% C
u-Zn
O
Figure 1. Methanol conversion rate during steam reforming and autothermal reforming for various catalysts at 230 oC; MeOH:H2O = 1:1, O2:H2O = 0.2:1(ATR)
We observed some evidence of synergy between Pd and Cu when supported on ZnO. The 1%Pd-1%Cu/ZnO catalyst was significantly more active than either the 2% Pd/ZnO or 2% Cu/ZnO catalysts as indicated by Figure 2. A mechanical mixture of 2% Pd/ZnO and commercial Cu-Zn-Al2O3 catalyst gave rates similar to those for the 1%Pd-1%Cu/ZnO for ATR at 185 °C. Similar activities were achieved when 2% Pd was impregnated onto the commercial Cu-Zn-Al2O3 catalyst suggesting that Pd helps light-off the Cu sites at lower temperatures. The CeO2 supported catalysts were also highly active for methanol SR and ATR, however, these materials typically had low CO2 selectivities. The CeO2-ZnO mixed oxide supported catalysts had low CO2 selectivities.
Fuel Chemistry Division Preprints 2003, 48(1), 381

0
20
40
60
80ra
te (
mol
/g/s
ec)
SR ATR
Cu-
Zn-A
l 2O
3
2% C
u-Zn
O
2% P
d-Zn
O
2% P
d-Zn
O-C
eO2
1% P
d-1%
Cu-
ZnO
0
50
100
150
200
1 2
rate
( m
ol/g
/sec)
Fresh
Reduced
2% Pd / ZnO
Cu-Zn-A
l2 O3
Figure 2. Methanol conversion rate during steam reforming and autothermal reforming for various catalysts at 185 oC; MeOH:H2O = 1:1, O2:H2O = 0.2:1(ATR)
Figure 4. Comparison of autothermal reforming activities of reduced and fresh catalysts at 230oC; MeOH:H2O = 1:1, O2:H2O = 0.2:1
The noble metal-based and commercial Cu-Zn-Al2O3 catalysts
were evaluated for SR and ATR at 330 °C. Reaction temperatures in this range would allow these catalysts to be used in combination with membrane reactors. The Pd/ZnO catalysts were very active and possessed good thermal stabilities at this temperature as shown in Figure 3. The Cu-Zn-Al2O3 catalyst was initially very active but deactivated rapidly due to thermal sintering. We also observed that the fresh catalysts (prior to reduction) were active for both methanol SR and ATR, though the activity was slightly lower as shown in Figure 4.
Conclusions Our preliminary results indicated that the ZnO supported Cu-Pd
bimetallic catalyst was highly active for methanol autothermal reforming, in particular at low temperatures. This will assist in lighting off of the ATR reactor at lower temperatures. Currently, we are investigating the effect of Pt as well as the effect of other mixed oxides on the methanol ATR activity and selectivity. Acknowledgement.
This work was funded by the U.S. Department of Energy.
References
Fuel Chemistry Division Preprints 2003, 48(1), 382
160
200
240
280
10 12Time (hrs)
Rat
e (
mol
/g/s
ec)
Cu-Zn-Al2O3
2% Pd / ZnO
Cu-Zn-Al2O3
2% Pd / ZnO
(1) D.L. Trimm.; Z.I. Onsan, Catal. Lett. 2001, 43(1&2), 31. (2) M. Schuessler.; O. Lamla.; T. Stefanovski.; C. Klein.; D. Megede.,
Chem. Eng. Technol., 2001, 24, 1141. (3) N. Iwasa.; S. Masuda.; N. Ogawa.; N. Takezawa., Appl. Catal. A: Gen.,
1995, 125, 145.
Figure 3. Comparison of steam reforming activities of commercial Cu-Zn-Al2O3 and 2% Pd / ZnO at 330oC; MeOH:H2O = 1:1.