Embed Size (px)
Citation preview

1
Steady State Box ModelA defined volume of air (the box) receives pollutionfrom a source, while pollution is removed at the same time by a sink process
Source Sink
In a “steady state” the concentration (and the totalamount) of the pollutant inside the box does notchange (is constant)
Box Model Formula
S Sq
VVτSq ×
=
V = Volume of boxS = Source rate
= Sink rate τ = residence time (τ: tau)q = steady state concentration
of pollutant in box
If we know the source rate of a pollutant and its residence time in the atmosphere, we can calculate its concentration in a given volume.
Sources and SinksSources:Everything that introduces pollutants into the air in the box
• direct emissions(cars, industry,…)
• transport by wind• chemical formation
Sinks:Processes that remove or convert pollutants
• wind blows pollutants away (ventilation)
• chemical conversion• pollutants are depositedon the ground (rainfall)

2
An Example: Your next party
numberof guests
q
8pm 10pm 2am 4am
in:source
guest arriving
guest leaving
out:sink
# guests insteady state
as many guest leave per hour as arrive
Box Model Formula
S Sq
VVτSq ×
=
V = Volume of boxS = Source rate
= Sink rate τ = residence time (τ: tau)q = steady state concentration
of pollutant in box
Source/Sink Rates
tintervaltimetintervaltimeinstemitted/losubstanceofAmountS =
in a steady state the source and the sink ratesare equal
Party: Source rate: People arriving per hourSink rate: People leaving per hourLet’s say S = 5 guests/hour

3
Residence time
τ = average period of time that a molecule of a pollutant is in the box before it is removed
Party: How long does a guest on average stayin your home.Let’s say τ = 2 hours
Box Model FormulaS Sq
VVτSq ×
=
Your party at steady-state:S = 5 guests/hourτ= 2 hoursV = 1
Average number of guests in your house? q=S x τ = 5 guests/hour x 2 hours = 10 guests

4
Sources of aerosols• Biological: seeds, pollen, spores (1-250 μm);
bacteria, algae, fungi, viruses (<1 μm)• Solid Earth: dust, volcanoes• Oceans: sea-salt• Anthropogenic (~20% mass): fires (soot and ash);
dust from roads; wind erosion of tilled land; fuel combustion; industrial processes
• Chemical formation: gas (SO2, HNO3, hydrocarbons,) condensing onto existing particles, or forming new particles.
SEA SPRAY
Dust Storm off West Africa (sept. 2005)
http://visibleearth.nasa.gov/view_rec.php?id=20238

5
Mount St. Helens (Fall, 1982)
Peter Frenzen, available fromMount Saint Helens National
Volcanic Monument Photo Gallery
Prescribed Burn in Big Horn National Forest, Wyoming (1981)
Fig. 5.7. U.S. Forest Service, available from National Renewable Energy Lab.
Urban Aerosol
Power generation Diesel
ConstructionAutomobiles
6
Dry Deposition
HNO3H2SO4
Aerosols are taken up by surfaces,i.e. ground, buildings,plants
Factors that govern dry deposition rates:
• Level of atmospheric turbulence
• Chemical properties of depositing species
• Nature of surface itself
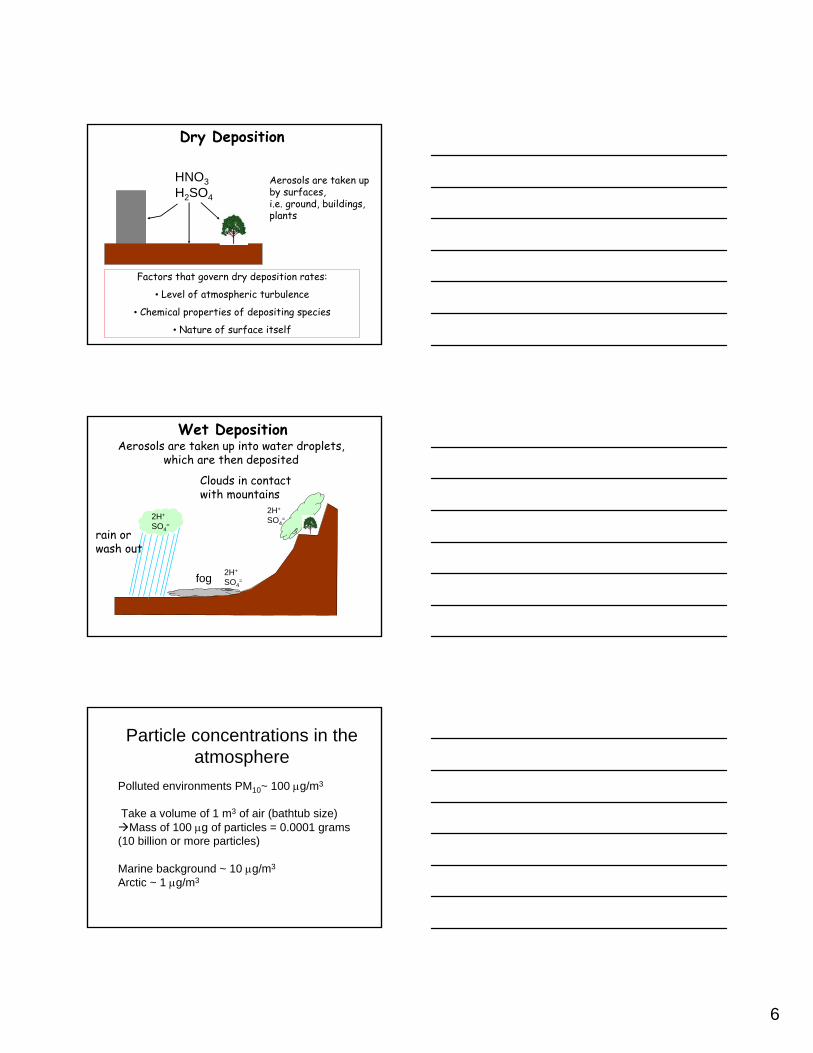
Wet DepositionAerosols are taken up into water droplets,
which are then deposited
2H+
SO4=
rain orwash out
fog
Clouds in contactwith mountains
2H+
SO4=
2H+
SO4=
Particle concentrations in the atmosphere
Polluted environments PM10~ 100 μg/m3
Take a volume of 1 m3 of air (bathtub size)Mass of 100 μg of particles = 0.0001 grams
(10 billion or more particles)
Marine background ~ 10 μg/m3
Arctic ~ 1 μg/m3

7
Hazy day: VR=80km
Clear day: VR=240km
Visibility impairment inMt. Rainier National
Park
VR = visibility range
Wavelengths vary over many orders of magnitude
Short wavelengthHigh frequency
High energy
Long wavelengthLow frequency
Low energy
http://www.nrao.edu/whatisra/mechanisms.shtml
WavelengthsVisible light (0.4 - 0.7 μm)
λ (μm)
Ultraviolet0.1 - 0.4 μm
blue
Energy
Infrared (heat)0.7 - 100μm
green yellow red
0.4 0.650.570.5

8
Gas (Rayleigh) ScatteringRedirection of radiation by a gas molecule without a net transfer
of energy to the molecule
Figure 7.4
Inco
min
g en
ergy
Probability distribution of where a gas molecule scatters incoming light
What is white light?Sum of all wavelengths in the visible region.
- +

9
Radiation Scattering by a Sphere
Figure 7.15
A Sidescattering
B
C
D SidescatteringE
Backscattering
Forwardscattering
VisibilityVisibility is defined as the ability to distinguisha perfectly black surface from a white background
Expressed asvisibility length
Good Visibility
Poor Visibility
Particles decreasevisibility!
Hazy day: VR=80km
Clear day: VR=240km
Visibility impairment inMt. Rainier National
Park
VR = visibility range

10
Processes Affecting Visibility
from “Introduction to Visibility” by William C. Malm
Particles and Visibility
image seen by observer
Physical target
Light reflectedby background
Scattering byparticles
Visibility at National Parkshttp://vista.cira.colostate.edu/improve/Education/VisConcepts.swf

11
Visibility in the US
Typical visual ranges• Western U.S.: 90-180 km (50-100 miles), ~ one-half of what it would be without human-made air pollution.• Eastern U.S.: 30-60 km (15-40miles), or about one-third of the visual range under natural conditions.
Visibility in the US
IMPROVE web site: http://vista.cira.colostate.edu/views/Web/GraphicViewer/seasonal.htm
Visibility in the US
from “Introduction to Visibility” by William C. Malm

12
Air Quality Standards for Particulate Matter (PM)
PM10: (particles smaller than 10 μm)24 hour average 150μg / m3
PM2.5: (particles smaller than 2.5 μm)24 hour average: 35μg / m3
annual average: 15μg / m3
PM = Particulate Matter = particles = aerosols
Air Quality Guide for Particle Pollution
People with heart or lung disease, older adults, and children should
avoid all physical activity outdoors. Everyone else should
avoid prolonged or heavy exertion.
201 - 300Very unhealthy (Alert)
People with heart or lung disease, older adults, and children should
avoid prolonged or heavy exertion. Everyone else should
reduce prolonged or heavy exertion.
151 – 200Unhealthy
People with heart or lung disease, older adults, and children should
reduce prolonged or heavy exertion.
101 – 150 Unhealthy for sensitive groups
Unusually sensitive people should consider reducing prolonged or
heavy exertion.
51 – 100Moderate
None.0 – 50Good
Health AdvisoryAir Quality Index (AQI)Air Quality
An AQI of 100 for particles up to 2.5 micrometers in diameter corresponds to a level of 40 micrograms per cubic meter (averaged over 24 hours). An AQI of 100 for particles up to 10
micrometers in diameter corresponds to a level of 150 micrograms per cubic meter (averaged over 24 hours).
Health effects of aerosol particles
“Our bodies natural defenses help us to cough or sneeze larger particles out of our bodies. But those defenses don’t keep out smaller particles, those that are smaller than 10 microns, or micrometers, in diameter, or about
one-seventh of the diameter of a single human hair. These smaller particles get trapped in the lungs, while the smallest are so minute they can pass through the lungs
into the blood stream, just like essential oxygen.”
Quote from the American Lung Association:
http://lungaction.org.reports/sota05_heffects.html

13
UW MESA Air Pollution Study
http://depts.washington.edu/mesaair/
U.S. SO2 emissions (1996)
Electric Utilityfuel combustion(67%)
Industrialfuel combustion(17%)
Industrial processes(5%)
Others(5%)
Sulfur content: Coal 1 - 6% SOil 1 - 2% SGas ~ 0.5% S
U.S. NOx emissions (2001)

14
Recent Trends in Sulfur Emissions (1980-2000)
Stern, Chemosphere 58 (2005)
Kuwait oil fires
Uptake of gases in water
waterdrop
SO2
SO2
Gas molecules canenter a water dropletthrough the surface
H2SO4
H2SO4
H+H+
SO4=
HNO3
HNO3
NO3-
H+
pH Scale
0 1 2 3 4 5 6 7 8 9 10 11 12 13 14
Naturalrainwater(5-5.6)
Distilledwater(7.0)
Seawater
(7.8-8.3)
Batteryacid(1.0)
Acidrain, fog(2-5.6)
More acidic More basic or alkaline
Lemonjuice(2.2)
VinegarCH3COOH(aq)
(2.8)
Apples(3.1)
Milk(6.6)
Bakingsoda
NaHCO3(aq)(8.2)
Ammoniumhydroxide
NH4OH(aq)(11.1)
LyeNaOH(aq)
(13.0)
Slaked limeCa(OH)2(aq)
(12.4)
pH
Figure 10.3

15
Acidity of acid rain
State-by-state SO2 emissions levels, 1990-2005
Natural pH of rain
waterdrop
CO2CO2
H2CO3
H+
CO3=
H+Uptake of CO2 in waterleads to Carbonic AcidH2CO3
→ at ~360 ppmv CO2natural rain is acidic
pH (natural rain) ~ 5.6
acid (+ H2SO4) rain pH ~ 5 - 4acid fog minimum reported pH ~ 1.7

16
Liming of a Lake in Sweden
Tero Niemi / Naturbild
Influence on EcosystemsForests
Damages leafs
removal of nutrients
nutrients: Ca, Mg, K
Effects depend onthe “buffering capacity”of soil
Acid rain weakens trees
aluminum (toxic)
Acidified Forest, Oberwiesenthal, Germany
(1991)
Stefan Rosengren/Naturbild

17
Acidified forest near Most, Czechoslovakia (1987)
Owen Bricker, United States Geological Survey
Effects on Aquatic Ecosystems
http://www.epa.gov/airmarkets/acidrain/effects/surfacewater.html#fish
Sandstone Figure in 1908 and 1968, Westphalia, Germany
Herr Schmidt-Thomsen

18
Export of sulfate aerosols from the U.S. & Asia
Transpacific transport of pollution from Asia accounts for 30% of background sulfate aerosols over US
Park et al. [2003]
Acid Rain Program in the US• Created under 1990 Clean Air Act Amendments• Goal: reduce SO2 emissions from power plants by
50% by 2010 from 1980 levels (10 million tons). Uses market-based cap and trade. Program started 1995. + also NOx reductions
• Over 10 year period (1995-2005): SO2 emissions from power plants down by 7 million tons (41% reduction compared to 1980 levels).
• Reduction in acid deposition (~30% reduction in NE US 1990-2005).
Cap and Trade – SO2

19
Cap and Trade Effectiveness
Reduction in acid rain deposition (sulfate): ~35% over 1990-2005
1985National Atmospheric Deposition Networkhttp://nadp.sws.uiuc.edu/amaps2/so4dep
Reduction in acid rain deposition (sulfate): ~35% over 1990-2005
2003

20
Costs of 1990 Clean air act amendment• Initially estimated to be ~$10 billion /year• Actual costs ~$1-2 billion/year
cap and trade is more economical than strict regulations. Scrubbers turned out to be cheaper than expected and unexpected gains from switching to low sulfur coal
Kerr, Science, 1998.
Cost-effectiveness of Acid Rain Program• Costs = $3 billion/year. • Benefits = $122 billion/year [PM human health;
visibility; ecosystems]• 40-to-1 benefit/cost ratio! Now: SO2 and NOx emissions from power plants were
planned (2005) to be regulated as part of the Clean Air Insterstate Rule (CAIR). (Also a clean air mercury rule) 3.7 million ton SO2 cap (2010). 1.5 million ton NOx cap (2010). Was supposed to go into effect January 1, 2009, but…went to DC circuit court and eliminated July 11, 2008, due to a fundamental argument about the cap and trade approach (among other arguments)
Clean Air Interstate Rule
The Clean Air Interstate Rule would have covered 28 eastern states and the District of Columbia. Air emissions in these states contribute to unhealthy levels of ground-level ozone, fine particles or both in downwind states. The rule uses a cap and trade system to reduce the target pollutants—sulfur dioxide (SO2) and
nitrogen oxides (NOx)—by 70 percent.

21
Problems with CAIR
July 11, 2008
North Carolina vs. EPA
Court found “more than several fatal flaws in the rule” and vacated the rule in its entirety
December 23, 2008
Court granted rehearing. The EPA needs to replace it with a new rule that fits the court’s view of the agency’s powers under the Clean Air Act.
North Carolina and some electric-power producers opposed aspects of the regulation. The major objection to CAIR was the inability of the EPA to guarantee each state would reduce its emissions sufficiently to prevent interference with air quality downwind. The emissions trading systems set up by CAIR was to reduce emissionsoverall, and prevent transport of pollution generally, but the EPA couldn’t promise that each state would reduce emissions sufficiently.
EPA proposes transport ruleJuly 6, 2010
• Will replace CAIR when final
•Addresses problems with CAIR by largely eliminating interstate trading.
• Will improve air quality in the eastern U.S. by reducing power plant emissions from 31 states and D.C.
• By 2014, would reduce power plant SO2emissions by 71%, and NOx emissions by 52%, over 2005 levels.

22
Clean Air Mercury RuleOn March 15, 2005, EPA issued the Clean Air Mercury Rule to permanently cap and reduce mercury emissions from coal-fired power plants for the first time ever.
On February 8, 2008, the D.C. Circuit Court vacated the Clean Air Mercury Rule (New Jersey vs. EPA). The plaintiffs maintained that cap-and-trade contributed to "hot spots" for mercury.
EPA intends to propose air toxics standards for coal- and oil-fired electric generating units by March 15, 2011 and finalize a rule by November 16, 2011.