Embed Size (px)
Citation preview

STDFTool
STDFTool is a full featured Data Visualization and Statistical Analysis Tool which analyzes
STDF, WAT, Bench data, or any data in proper tab delimited format. Graphs include
multiple data series histogram, parametric trend, box plot, normal probability plot,
correlation plot, bin trend, cumulative fail rate, functional test stacked pareto, wafermaps,
and characterization charts. Statistics include Mean, Median, StdDev, Cp, Cpk, and Robust
Sigma. Drill down to individual measurements for all tests and all parts. Raw test data can
be exported to CSV, Excel or JMP. Charts can be exported to PDF. Allows analyzing data
files separately or merged in any dataset grouping desired. All graphs include zoom, outlier
removal, series on/off, color selection, and much more.
• Fully interactive
• Analyze multiple files against each other
• Merge several files into one dataset
• Repeatability and Reproducibility
• Correlation against any criteria (test to test, site to site, load board to load board,
tester to tester, rev to rev, etc)
• Wafermaps: HardBin, SoftBin, Parametric Tests. All with stacking capability.
• Characterization: voltage conditions, temperatures, fab process skews
• Functional data: Stacked bar graph of most common fail vector, halt cycle and pin
• Access to individual measurements for every test for every part
• Cumulative Bin Rate, Cumulative Fail Rate, Bin Trend
• Outlier removal
• Virtual retest with ‘What If’ test limits; Recalculates fail rate, fallout, Cpk
• Generate full color reports
• Sort data by any column (Cpk, Cp, Fail Rate, Test Number, Tester Alarms, etc)
• Utilities: STDF�XML, STDF�CSV
• Data Filtering: Load by test #; Hide data by table sort and selection or test group
• Graph customizations: Show/Hide by data series, Color Selection, Drag Zoom
STDF, WAT, XML,
GZip, Bench
Data, Tab Delim
Excel, JMP,
CSV, PDF Analyze Interactively

Data Load Screen:

Detail Screen:
Breaks out Functional and Parametric Tests with associated statistics.
Table can be sorted by columns. Other columns can be added such as Cp, Robust Sigma, etc.
Histogram shown below with target range highlighted based on test limits.
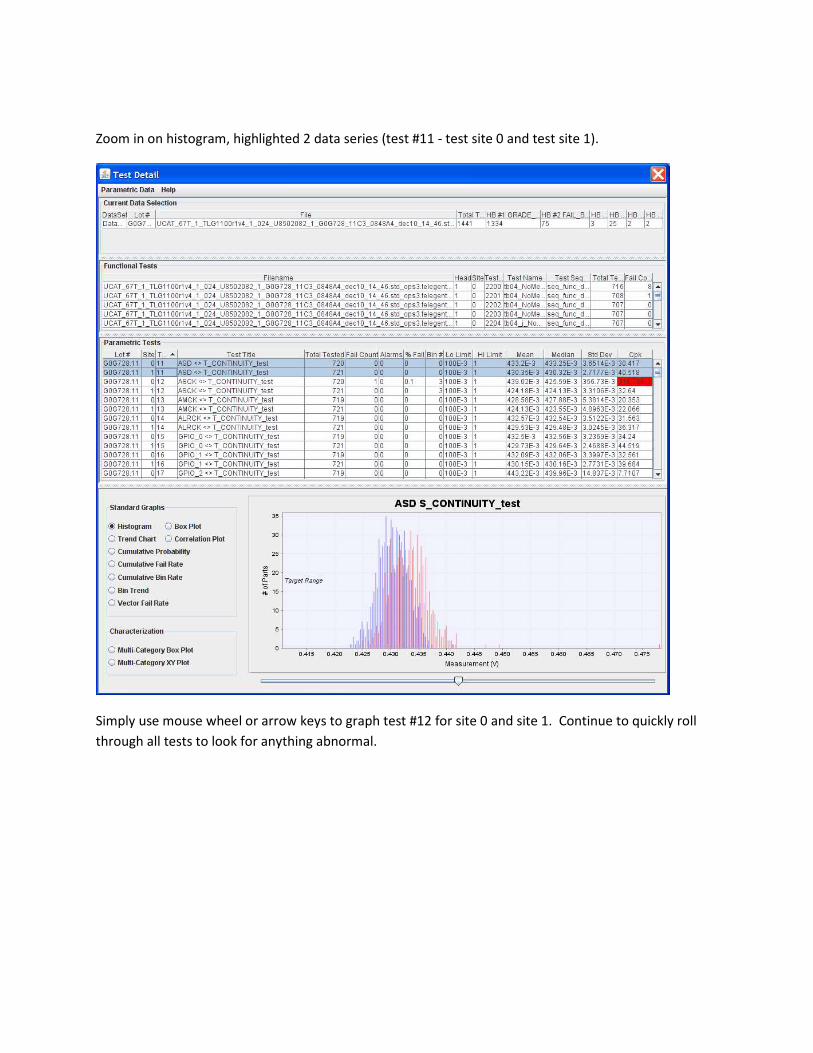
Zoom in on histogram, highlighted 2 data series (test #11 - test site 0 and test site 1).
Simply use mouse wheel or arrow keys to graph test #12 for site 0 and site 1. Continue to quickly roll
through all tests to look for anything abnormal.
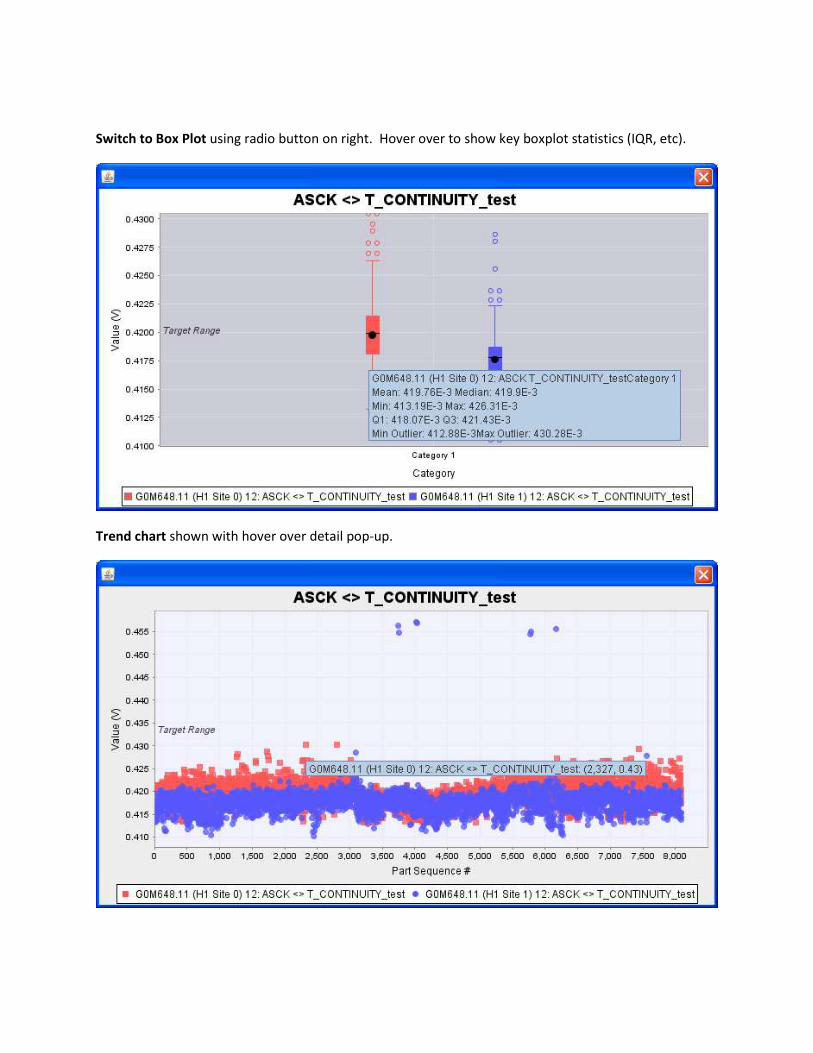
Switch to Box Plot using radio button on right. Hover over to show key boxplot statistics (IQR, etc).
Trend chart shown with hover over detail pop-up.

Cumulative Probability plot (Normal Quantile plot) shows how well data fits a normal distribution.
Correlation: Used for Test to Test correlation or dataset to dataset repeatability. Gives Correlation
Coefficient and R-square value. Performs a linear fit with slope and intercept.

Cumulative Fail Rate: To check for tester setup or test program issues
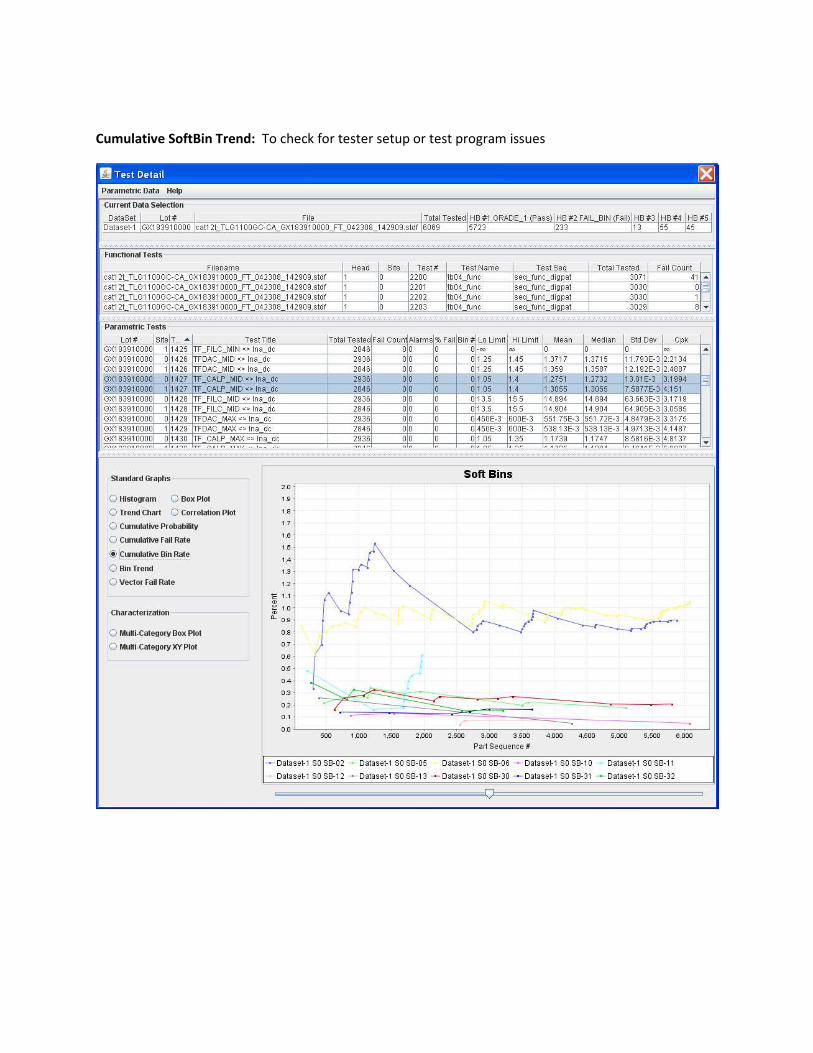
Cumulative SoftBin Trend: To check for tester setup or test program issues

Hard Bin Trend: Shows what parts go to which bin. Allows zoom in to individual parts and hover over
details (as all graphs do).
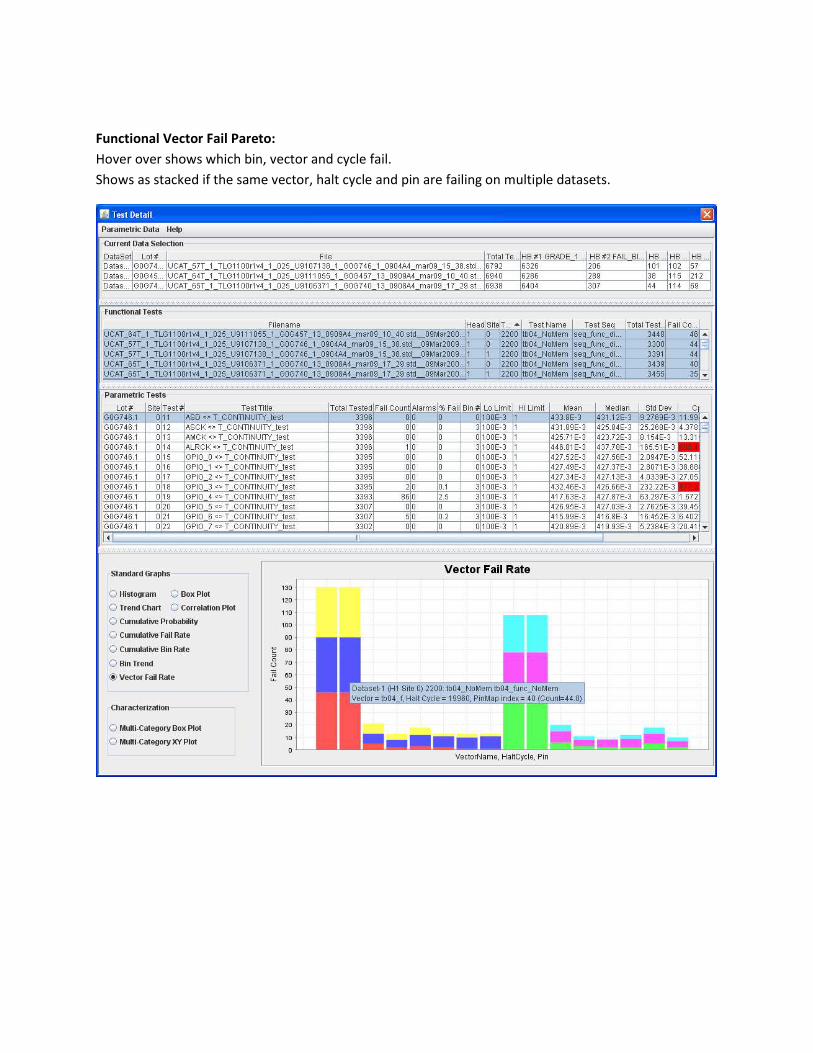
Functional Vector Fail Pareto:
Hover over shows which bin, vector and cycle fail.
Shows as stacked if the same vector, halt cycle and pin are failing on multiple datasets.


Detail of every measurement for each part for a parametric test.
Ability to exclude outliers from graph and statistics.
Also allows ‘What If’ test limits which will recalculate and give a new Cpk and fail count.

First Fail Data:

Table options from right-click menu
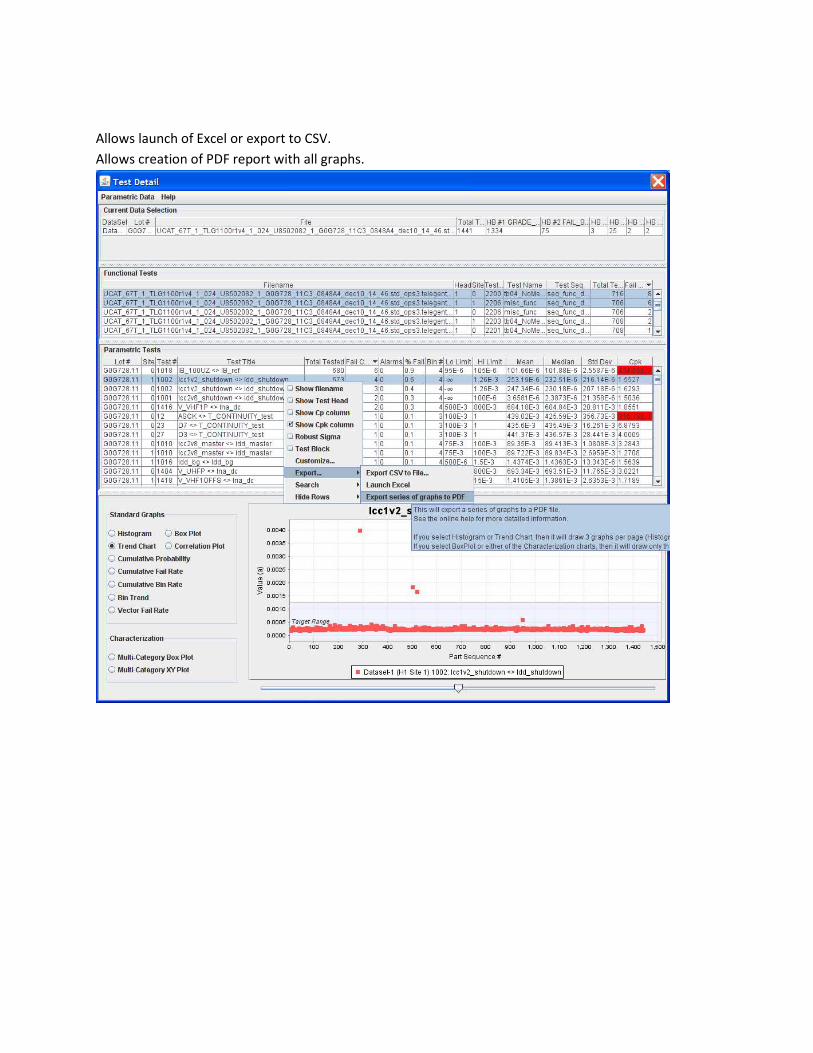
Allows launch of Excel or export to CSV.
Allows creation of PDF report with all graphs.

Characterization Graphs:
Fast, Slow, Typical fab process corners at Cold, Room, Hot temps at varying voltage conditions.

Data table at bottom summarizes by colored band.
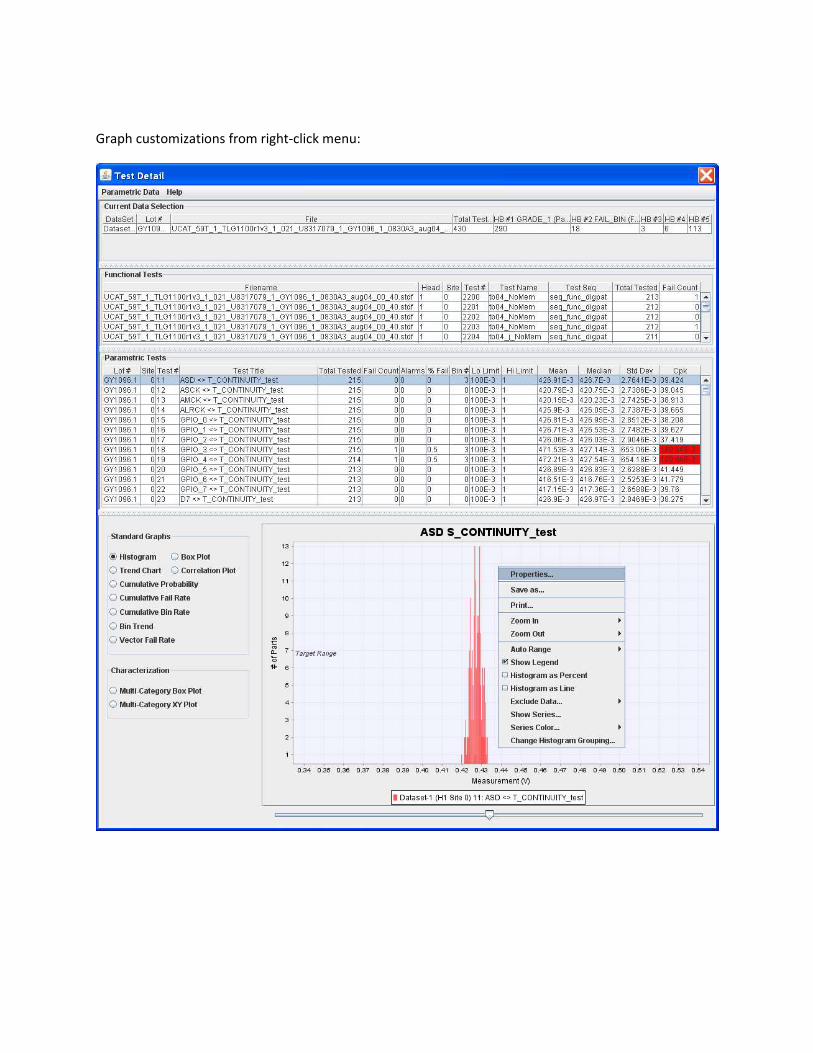
Graph customizations from right-click menu:

Parametric Wafermaps:

HardBin and SoftBin Wafermaps:

System Requirements:
• Platform: Java based application will run on Windows, Solaris, Linux
• RAM: 2GB
• Disk: 1GB
• Processor: 2GHz
• Hardware: Ethernet card only required for Floating license option