Embed Size (px)
Citation preview

Hong Kong STB
Market
Insights

2 STB Market Insights – Hong Kong
This publication ‘STB Market Insights’ serves as a reference to the trends of specific inbound
tourism markets to Singapore. All information in this publication is deemed to be correct at time
of publication.
While every effort has been made to ensure the accuracy of the data in this report, the Singapore
Tourism Board (STB) shall not be liable for any loss or damage caused by or arising from the use
of the data in this publication. Data derived from surveys cited is subject to sampling error. Users
are advised to exercise discretion when drawing any conclusion or inferences, or taking any
action, based on the data.
STB makes no representation or warranty, express or implied, as to the accuracy or completeness
of any information contained in this document. Appropriate professional advice should be
obtained before relying on or acting on any of the information contained in this document, and
neither STB nor any of its officers, employees or agents shall be held liable for any loss or
damage, whether direct or indirect, as a result of any improper or incorrect use of the information
in this document.
Consumer Research & Insights
Research Division
©2015 Singapore Tourism Board.
All rights reserved. No part of this publication may be reproduced, distributed, stored in a retrieval system, or transmitted
in any form or by any means, electronic, mechanical, photocopying, recording or otherwise, without the prior permission
of STB, or as otherwise permitted herein.
Contents of this report may be reproduced accurately in part in other publications if STB is acknowledged and attributed
as copyright owner.
Month of Publication: July 2015

3 STB Market Insights – Hong Kong
Contents Executive Summary ................................................................................................................................... 4
About The Market ....................................................................................................................................... 5
The Hong Kong Traveller ........................................................................................................................ 6
Media Consumption Habits ..................................................................................................................... 7
Hong Kong Visitors to Singapore ............................................................................................................... 8
The Hong Kong Leisure Traveller .............................................................................................................. 10
Needs of the Hong Kong Leisure Traveller ............................................................................................. 10
Considerations for Travel ....................................................................................................................... 10
Planning and Booking Trends ................................................................................................................ 11
Information Sources Before/During Travel ............................................................................................ 12
Advocacy ............................................................................................................................................... 12
Hong Kong Leisure Visitor in Singapore ..................................................................................................... 12
Leisure Activities in Singapore ............................................................................................................... 13
Barriers to Visiting Singapore ................................................................................................................ 14
Hong Kong BTMICE Visitors in Singapore .................................................................................................. 14
The Hong Kong BTMICE Visitor ............................................................................................................ 14
Perception of Singapore as a Business and Leisure Destination ................................................................ 15
Information Sources ............................................................................................................................ 15
Hong Kong BTMICE Visitors’ Leisure Activities ..................................................................................... 16
Key Findings and Implications ................................................................................................................... 17
Bibliography .............................................................................................................................................. 19

4 STB Market Insights – Hong Kong
Executive Summary Hong Kong was ranked 8th in terms of visitor arrivals (VA) to Singapore in 2014. VA had increased at
a CAGR of 13% over 2010 and 2014. Travelling formed a significant part of the lives of Hong Kong
travellers. Travel not only allowed them to take a break from the stress back home, but also to
broaden their horizons through new experiences. They also saw travelling as a good time to bond
with their family and loved ones. This, coupled with the lack of domestic tourism and excellent air
connectivity, resulted in Hong Kong recording the second highest ratio of outbound trips to
households in Asia Pacific.
As most Hong Kong consumers had only few annual leave days, they tend to time their trips around
public holidays. The length of trips also tend to be quite short, averaging 2 to 3 nights and
comprised mostly nearby destinations within Asia. Being value-conscious, Hong Kong consumers
tend to conduct elaborate price comparisons on multiple channels before making a booking which
offered the best value for their money. Travel planning typically took place within a month from
their departure since most of the trips were to familiar destinations which required less planning.
As most Hong Kong consumers were mature travellers who preferred short getaways, majority of
them had visited Singapore before. Singapore was perceived as a destination which was safe,
familiar and easy to travel to. However, many Hong Kong consumers also felt that Singapore was
similar to Hong Kong in many ways and there was nothing new to see or do in Singapore that they
could not find back home. This resulted in the perception that Singapore did not offer a
differentiated experience vis-à-vis other regional destinations such as Taiwan, South Korea and
Japan. Therefore, the challenge would be to effectively communicate unique and differentiated
leisure experiences that Singapore has to offer that cannot be found in Hong Kong.
In 2013, 1 in 3 arrivals from Hong Kong were here for business purposes. Hong Kong BTMICE visitors
generally held a high regard for Singapore as a business destination. During their free time, Hong
Kong BTMICE visitors enjoyed spending their time unwinding, having meals, shopping or engaging
in nightlife activities. Almost half of them would also revisit Singapore for leisure as they wanted to
visit Singapore with a different set of companions and to revisit particular sites they have been to
during their business trips.
Methodology of STB Primary Research Sources
Figures from this report are gathered from STB internal research as well as publicly available sources. The STB’s research sources are STB’s Overseas Visitors Survey
(OVS), the Leisure Segmentation Study (SEG), Business Traveller Study (BTS), Brand Health Tracking Study (BHTS) as well as various interviews and focus groups
done.
Overseas Visitors Survey (OVS) – conducted annually at exit points in Singapore, the OVS covers visitors from every nationality. The sample size is usually around
28,000 per year.
Leisure Segmentation Study (SEG) – conducted in 2013 in 4 key markets, SEG sought to understand the needs of different segments of frequent air travellers within
our key markets of United Kingdom, Germany, South Korea, and Hong Kong. The sample size was 600 per market, for a total of 2,400.
Business Traveller Study (BTS) – conducted over 2011-2012 in Singapore, BTS covers over 2,000 business travellers from our key business source markets to
understand their pre-trip and during trip considerations, behaviour and touch points. Markets covered include Australia, China, Hong Kong, India, Indonesia, Korea,
Philippines, Thailand, UK, US and Vietnam.
Leisure Traveller Study (FGD) – conducted in October 2012 in Hong Kong to gain deeper understanding of Hong Kong travellers, including their travel motivations
and habits, as well as attitude and perception towards Singapore.
Visitor Experience Study (VES) – conducted annually in Singapore since 2014 covering Leisure and BTMICE visitors from 14 top source markets to gain deeper
understanding of experiences they consume here and post-arrival satisfaction with Singapore experiences.

5 STB Market Insights – Hong Kong
About The Market
Population (million) (1) 7.2 (2014)
Distribution by Area (%) (1) Hong Kong Island: 18% Kowloon : 30% New Territories: 52%
Total Outbound Travel by air, land and sea (million) (2)
2010: 88.4 2011: 84.4 2012: 85.3 2013: 84.4
Outbound Travel by air (million) (2)
2010: 6.8 2011: 7.1 2012: 7.8 2013: 8.6
Top 5 Travel Destinations
in Asia (‘000) (18)
1. China 2. Macau 3. Taiwan 4. Thailand 5. Japan
Type of Outbound Trips (18) Business: 41%
Leisure: 59%
Sss
Jan Feb Mar Apr May Jun Jul Aug Sep Oct Nov Dec
Seasonality of Outbound Trips (15)

6 STB Market Insights – Hong Kong
The Hong Kong Traveller
For the first quarter of 2015, Hong Kong saw moderate GDP growth of 2.1% year-on-year as
compared to a 2.5% growth in 2014. The economy was forecasted to grow by only 1% to 3% for full
year 2015. This was mainly attributed to the slower global economic recovery that affected the
demand for Hong Kong’s exports of goods and sluggishness in inbound tourism. While external
demand was the main factor limiting Hong Kong’s economic growth, domestic demand remained a
strong driver for Hong Kong’s economy (19).
Hong Kong’s outbound travel by air continued to grow at a steady rate of 8% CAGR over 2010 to
2013 despite an economic slowdown (2). In 2014, Hong Kong households recorded the second
highest ratio (335%) of outbound trips to households in Asia Pacific, lagging only behind Singapore.
Total outbound trips were expected to grow by 7 times faster than total household growth over
2015 to 2020, resulting in a ratio of outbound trips to households of 428% by 2020 (4).
High consumer spending power coupled with Hong Kong’s lack of domestic tourism options were
key reasons encouraging strong overseas travel. Outbound travel was also facilitated by Hong
Kong’s excellent geographical location and accessibility as well as the Hong Kong Special
Administrative Region (SAR) passport, which does not require visa to visit over 140 countries
globally (18). Hence, overseas trips had become part of a lifestyle for most Hong Kong consumers,
who were always on the lookout for relief from their stressful lifestyles.
Outbound travel from Hong Kong was dominated by destinations within Asia, with China being the
most popular outbound destination. This was mainly due to China’s close proximity to Hong Kong,
which meant that Hong Kong travellers could take short leisure trips easily to China. In addition,
business travel also accounted for a significant proportion of outbound flows to China due to
increasing foreign direct investments targeting the huge Chinese consumer base (18).
Besides China and Macau, Taiwan was also another popular outbound destination for Hong Kong
travellers. This could be partly attributed to aggressive marketing done by the Taiwan Visitors
Association (TVA) in recent years, promoting Taiwan to Hong Kong consumers. TVA had
collaborated with numerous travel partners in Hong Kong to offer discounted travel packages to
entice Hong Kong consumers to shop in Taiwan (18).
public holidays. Families with school-going children also tend to time their trips with the school
holiday period. Hence, the peak travel period usually occurred during the Chinese New Year
holidays (February) and year end Christmas and New Year holidays (December to January). As a
result, most trips taken tend to be quite short, averaging 2 to 3 nights, and involved short haul
regional destinations, which offered direct flights (5).
When Hong Kong travellers were asked to name their aspirational
destinations in 2014 (4), regional destinations such as Tokyo (14.7%),
Australia (5.7%) and South Korea (4.2%) were in the top 4 positions,
alongside London (8.0%). This signalled the importance of Asia
Pacific destinations for Hong Kong travellers.
As an average worker in Hong Kong only had 10 to 14 days of
annual leave, Hong Kong travellers tend to plan their trips around

7 STB Market Insights – Hong Kong
Media Consumption Habits
Hong Kong’s internet penetration was one of the highest in Asia. In 2013, 7 in 10 adults were
Internet users (6). Hong Kong also recorded a higher proportion of older age group among its
internet base, with 24% aged between 45-54 years old, compared to the global average of 14%.
Hong Kong also recorded the highest video penetration among its internet audience globally, with
90% of the internet population viewing online videos in 2013. Chinese audience, in comparison, was
the number 2 consumer of videos globally, with 87% of the internet population watching online
videos. Yahoo! and Google were the most frequently accessed sites for online videos (7).
While digital media consumption was high, print media (e.g. newspapers and magazines) remained
important in Hong Kong. In 2014, there were 16 Chinese newspapers, 3 local English newspapers
and 3 regional English newspapers in circulation. Headline Daily, Oriental Daily News, Apple Daily
and The Sun recorded the highest market share in the Hong Kong newspaper segment (16).
Among Hong Kong consumers, Yahoo! sites were
most frequently accessed, followed by Google,
Microsoft sites and social networking site, Facebook (7).
While Facebook was the fourth most frequently
accesssed site, Hong Kong consumers spent the most
time on the site, at 244.6 minutes per visitor in 2013. In
contrast, Yahoo! sites only clocked 203.3 minutes per
visitor. In addition, Facebook topped the reach of
social networks at 63%, surpassing other popular social
networks such as Yahoo! Wretch and Sina
Microblogging, at 17% and 16% respectively.
Smartphone penetration in Hong Kong has
risen significantly over the recent years, from
35% in 2011 to 63% in 2013 (8). In 2013, Hong
Kong recorded the highest mobile internet
usage rate in Asia Pacific, with 96% of Hong
Kong smartphone users accessing mobile
internet daily. This was followed closely by
Japan (94%), Singapore (93%) and South
Korea (92%). 91% of Hong Kong users also
watched videos online on their smart
phones.

8 STB Market Insights – Hong Kong
ther
464 472 540 631
1,149 1,033 939 876
123 160 152 156 35,338
43,972 44,886 46,908
17%
34% 18%
4%
27% 13%
40% 16%
5%
27%
*All visitors are classified by country of residence unless otherwise stated. Visitor arrivals include all visitors arriving by air and sea and non-Malaysian citizens arriving by land. **Sightseeing, entertainment and gaming expenditure has been excluded from tourism receipts in the country breakdown due to commercial sensitivity of information. Other TR Components include expenditure on airfares, port taxes, local transportation, business, medical, education and transit visitors ***Others include those here for education, healthcare, work-related purposes, accompanying passengers and personal events.
Hong Kong Visitors to Singapore
Visitor Arrivals (‘000)*
2011
2012
2013
Tourism Receipts
($mil/%)**
Purpose of Visits (%)
Others***
VFR
BT/MICE
Holiday
Others
Transport
F&B
Accom.
Shopping
Tourism Receipts – per
capita ($)
Weekly Flight Statistics
(Flight Freq. /
Seat Capacity)
$534
$507
40 35 35 37
38 40 37 34
9 10 9 10 13 15 19 19
10%
39%
15%
6%
28%
$487
Flight Freq
Seat Capacity
2014
12%
43% 14%
5%
26%
$552
9 STB Market Insights – Hong Kong
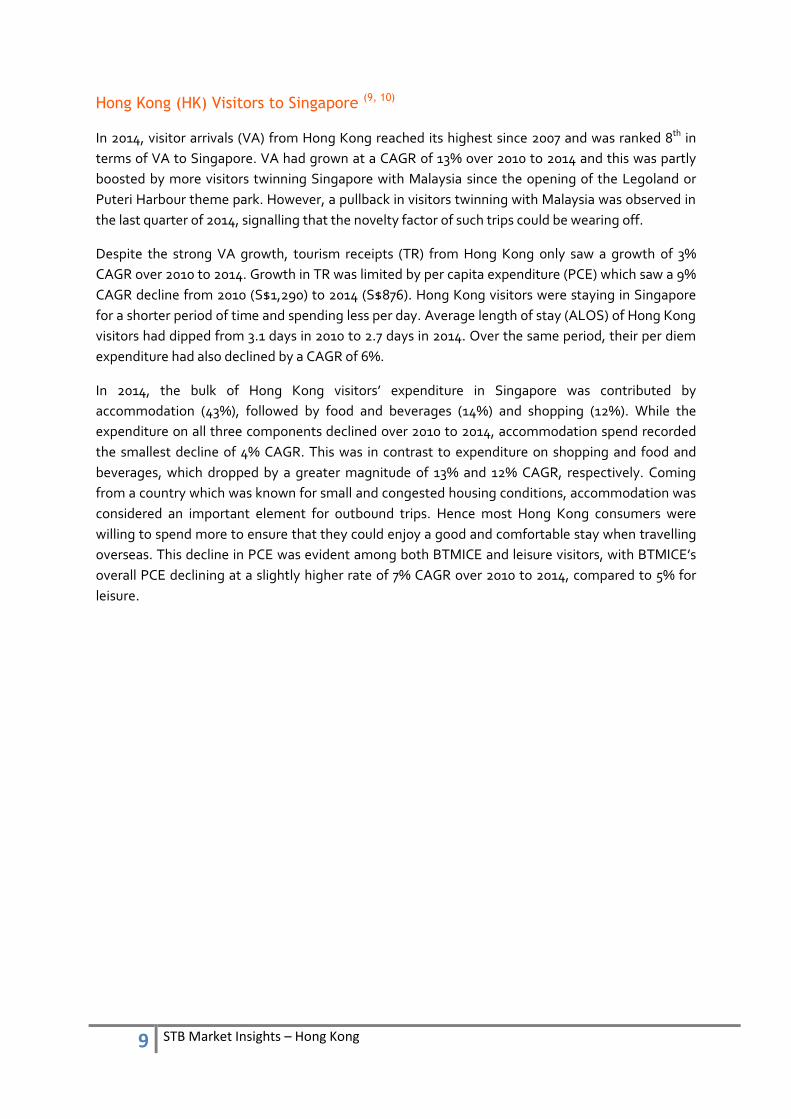
Hong Kong (HK) Visitors to Singapore (9, 10)
In 2014, visitor arrivals (VA) from Hong Kong reached its highest since 2007 and was ranked 8th in
terms of VA to Singapore. VA had grown at a CAGR of 13% over 2010 to 2014 and this was partly
boosted by more visitors twinning Singapore with Malaysia since the opening of the Legoland or
Puteri Harbour theme park. However, a pullback in visitors twinning with Malaysia was observed in
the last quarter of 2014, signalling that the novelty factor of such trips could be wearing off.
Despite the strong VA growth, tourism receipts (TR) from Hong Kong only saw a growth of 3%
CAGR over 2010 to 2014. Growth in TR was limited by per capita expenditure (PCE) which saw a 9%
CAGR decline from 2010 (S$1,290) to 2014 (S$876). Hong Kong visitors were staying in Singapore
for a shorter period of time and spending less per day. Average length of stay (ALOS) of Hong Kong
visitors had dipped from 3.1 days in 2010 to 2.7 days in 2014. Over the same period, their per diem
expenditure had also declined by a CAGR of 6%.
In 2014, the bulk of Hong Kong visitors’ expenditure in Singapore was contributed by
accommodation (43%), followed by food and beverages (14%) and shopping (12%). While the
expenditure on all three components declined over 2010 to 2014, accommodation spend recorded
the smallest decline of 4% CAGR. This was in contrast to expenditure on shopping and food and
beverages, which dropped by a greater magnitude of 13% and 12% CAGR, respectively. Coming
from a country which was known for small and congested housing conditions, accommodation was
considered an important element for outbound trips. Hence most Hong Kong consumers were
willing to spend more to ensure that they could enjoy a good and comfortable stay when travelling
overseas. This decline in PCE was evident among both BTMICE and leisure visitors, with BTMICE’s
overall PCE declining at a slightly higher rate of 7% CAGR over 2010 to 2014, compared to 5% for
leisure.

10 STB Market Insights – Hong Kong
The Hong Kong Leisure Traveller
Needs of the Hong Kong Leisure Traveller (11, 12)
For Hong Kong consumers, leisure travel was a necessary breakaway from stress and daily routines
and an opportunity to wind down and recharge.
Travelling was also seen as a form of personal enrichment that allowed them to broaden their
horizons. For families with children, they were more likely to bring their children to countries where
they have not visited before to increase their children’s exposure. As one respondent mentioned,
“Actual travel experience cannot be replaced by reading books, so I would like to bring my children
to actually go out and see it.”
Hong Kong parents’ enthusiasm to expose their children to new experiences could be attributed to
the country’s highly competitive education system. The stiff competition had been exacerbated
with the huge influx of students from Mainland China in recent years. To ensure that their children
stayed ahead of the curve, many affluent Hong Kong parents were willing to spend on children’s
education and enrichment activities which could help broaden their horizons. Hence learning
opportunities for their children while having fun on their leisure trips were highly sought after by
family travellers.
Considerations for Travel (11, 12)
Hong Kong travellers also saw travelling as a way to connect
with their family and loved ones. One respondent shared, “It
is a form of gathering with family members. Normally we are
busy and do not have much chance to spend quality time
together.” For those who travelled with their families, they
looked towards safer and more familiar destinations that
were short haul and convenient for their elderly parents and
children. However, if they travelled with friends, spouse or
partner, they were more likely to consider longer haul or
more exotic destinations.
As Hong Kong travellers had few annual leave days, the
number of days available for the trip was the most important
consideration for travel. Being value-conscious, it was also
important for Hong Kong travellers to get the best travel deal
which could fit their travel budget. For families who regarded
travelling as a time of bonding with their loved ones, travel
companions’ preferences and the safety and security of the
destinations were valued. As dining and shopping were
deeply ingrained in their local culture, Hong Kong travellers
also enjoyed exploring the city through good food and
shopping.

11 STB Market Insights – Hong Kong
Planning and Booking Trends (11, 12)
Majority of Hong Kong travellers planned and made bookings for their trips only within a month
from their travel dates. This could be due to the fact that most of their trips were to familiar
destinations within the region, which typically required less planning.
Among those who typically travelled with friends, spouse or partner, their decisions to travel could
also be easily triggered by deals and promotions offered by credit cards, airlines and hotels. Hence,
trip planning could sometimes be as short as a few days. This group of travellers also exhibited
stronger preference for low season travel when airfare and accommodation tend to be cheaper.
As for family travellers, their travel period would typically be restricted to school holidays, which
would coincide with peak travel periods. To better manage costs, some of them might book air
tickets and accommodation at least a month in advance to take advantage of costs savings. As a
result, trip planning period could be longer for this group of travellers.
Being mature travellers, most Hong Kong travellers were also comfortable making trip bookings
online and liaising directly with airlines and accommodation providers. This behaviour was also in
line with their value-conscious mind-set, whereby they would conduct elaborate price comparisons
on multiple channels (e.g. offline and online travel agents, airline websites, hotel websites etc)
before making a booking which offered the best value or could meet their preferences for specific
airlines or hotels. In line with Hong Kong travellers’ predominant need to rest and relax during their
trips, there was a much stronger preference for free and easy travel as opposed to guided package
tours, which tend to be associated with a more hectic itinerary. Hong Kong travellers were also
likely to travel to familiar destinations where they had visited before, thus they might not see the
need to book a package tour. However, Hong Kong travellers might consider booking package tours
if they were travelling to less familiar destinations with language barriers or if there were attractive
promotions available.
For those who booked flight and accommodation themselves, flight tickets were usually prioritised
to ensure availability and lower prices. Accommodation bookings were done only after flight tickets
were secured.

12 STB Market Insights – Hong Kong
Information Sources Before and During Travel (11, 12)
Due to Hong Kong’s high internet penetration rate, most pre-trip research was conducted online
through search engines such as Yahoo! or Google. There was also strong reliance on user-generated
content as such information was considered richer, less biased and more up-to-date. Examples of
such content would be online travel reviews on forums or blogs, which Hong Kong travellers found
to be the most useful information source. While many travellers also accessed the respective NTO
(National Tourism Organizations) websites as part of their pre-trip research, few found information
on such sources useful.
Hong Kong travellers also liked to purchase travel magazines and guidebooks during their trip
planning stage. Although some travellers felt that these sources were not as updated and
recommendations tend to be more “touristy” in nature, travel magazines and guidebooks remained
popular as a handy source of information when they arrived at their destinations.
During the trip, most Hong Kong travellers preferred to access free WIFI to search for information
(e.g. activities to do) via the variety of devices they travelled with, such as laptops, tablets or
smartphones, on the go. Travel magazines and guidebooks purchased pre-trip were typically
referred to as an information source.
Advocacy (12)
Similar to South Korean and Chinese travellers, Hong Kong travellers typically shared their travel
experiences online (60%) or talked to their family members or friends about the trip (50%). This was
in contrast with Japanese travellers who were more likely to share their experiences face-to-face
than via online channels (9).
Hong Kong Leisure Visitor in
Singapore
In 2014, over 60% of Hong Kong leisure visitors to Singapore were repeat visitors and 4 out of 10 of
these repeat visitors had come within the past 1 year. They typically stayed in Singapore for about 2
to 3 nights. As Hong Kong travellers tend to prefer short holidays, Singapore was a convenient and
fuss-free option for a quick getaway. Among repeat visitors, Singapore was perceived to be a city
that was easy to travel to since minimal planning was required. It was also seen as a dynamic city
which constantly renewed its offerings. Singapore cuisine also enjoyed strong appeal among Hong
Kong repeat visitors.
Singapore was also perceived to be a safe and well-organised destination and this was especially
valued by family visitors, who saw Singapore as an ideal place to bring their elderly parents and
children. Attractions which featured a strong enrichment component and appealed to all ages were
especially popular.

13 STB Market Insights – Hong Kong
Leisure Activities in Singapore
Shopping was the top activity for Hong Kong visitors when holidaying in Singapore. The top five
places that Hong Kong visitors shopped at when in Singapore included Changi Airport, Orchard
Road, Chinatown, followed by the Marina Bay area (9).
Hong Kong consumers were shoppers by nature. As shown by a MasterCard survey in 2015, Hong
Kong consumers topped Asia Pacific as having the most optimistic spending outlook on shopping in
the region, especially for luxury goods. As value-conscious consumers, it was also shown in the
study that shopping offers and discounts were key triggers for retail purchases. Hong Kong
consumers also enjoyed shopping in airports during their trips. Chocolates, cosmetics, fragrances
and personal care were the most popular categories purchased at the airports (17).
However, shopping expenditure in Singapore among Hong Kong leisure visitors had been declining
on a CAGR of 14% over 2010 to 2014 in almost all shopping categories such as fashion, accessories,
souvenirs and consumer technology. The only shopping category which saw an increase in spend
was confectionery and food items (9). It would thus be vital to understand the product categories
that appeal to Hong Kong visitors when they are in Singapore to better capitalise on their
propensity to spend.
Visits to well-known landmarks, nature or animal-related attractions and theme parks also appealed
to Hong Kong visitors (12). The top three free-access attractions frequented by Hong Kong visitors
were Orchard Road, Merlion Park and Singapore River (Clarke Quay and Boat Quay), while the top
three paid-access sites visited were the integrated resorts (MBS/ RWS), Sentosa and Gardens by the
Bay (9).
While Hong Kong family visitors were more likely to explore the different attractions in Singapore,
nightlife was a popular activity among visitors who came without children. The top night spot
visited was in the Singapore River area (e.g. Clark Quay, Boat Quay and Robertson Quay). In Hong
Kong, high-end night spots were often exclusive and networks were required to get access to such
clubs. Other night spots that were more easily accessible, however, tend to be perceived as less safe
and less appealing to those who desired a more premium experience. As a result, many non-family
visitors appreciated the safety and ease of access to the variety of nightlife experiences in
Singapore (14).
14 STB Market Insights – Hong Kong
Barriers to Visiting Singapore (11, 12)
While Hong Kong travellers valued Singapore for its safety and ease of travel, they also perceived
Singapore to be a formal and disciplined city with many restrictions and relatively little to do.
Furthermore, many travellers also felt that Singapore’s offerings were similar to Hong Kong and
preferred other neighbouring destinations which could offer more differentiated experiences.
The reason behind such perceptions could be attributed partly to the historical rivalry between
Hong Kong and Singapore since the coining of the “Four Asian Tigers” in the early 1960s. Besides
Hong Kong and Singapore, South Korea and Japan were the other two countries in Asia that were
referred to as nations that have undergone rapid industrialisation and saw exceptionally high
growth rates. Hong Kong and Singapore were, however, more heavily compared to each other,
especially by the Hong Kong media, since both countries shared numerous similarities (17). As a
result, Singapore’s leisure offerings were often downplayed in the local media while the perception
of Singapore being a successful but formal business city was entrenched in the minds of Hong Kong
consumers. Many Hong Kong consumers also believed that they were already familiar with what
Singapore had to offer and tend not to conduct any research on the destination.
Therefore, the challenge would be to change existing perceptions of Singapore among Hong Kong
travellers and communicate new and unique attractions and experiences that could not be found in
Hong Kong to interest them to visit Singapore.
Hong Kong BTMICE Visitor in
Singapore
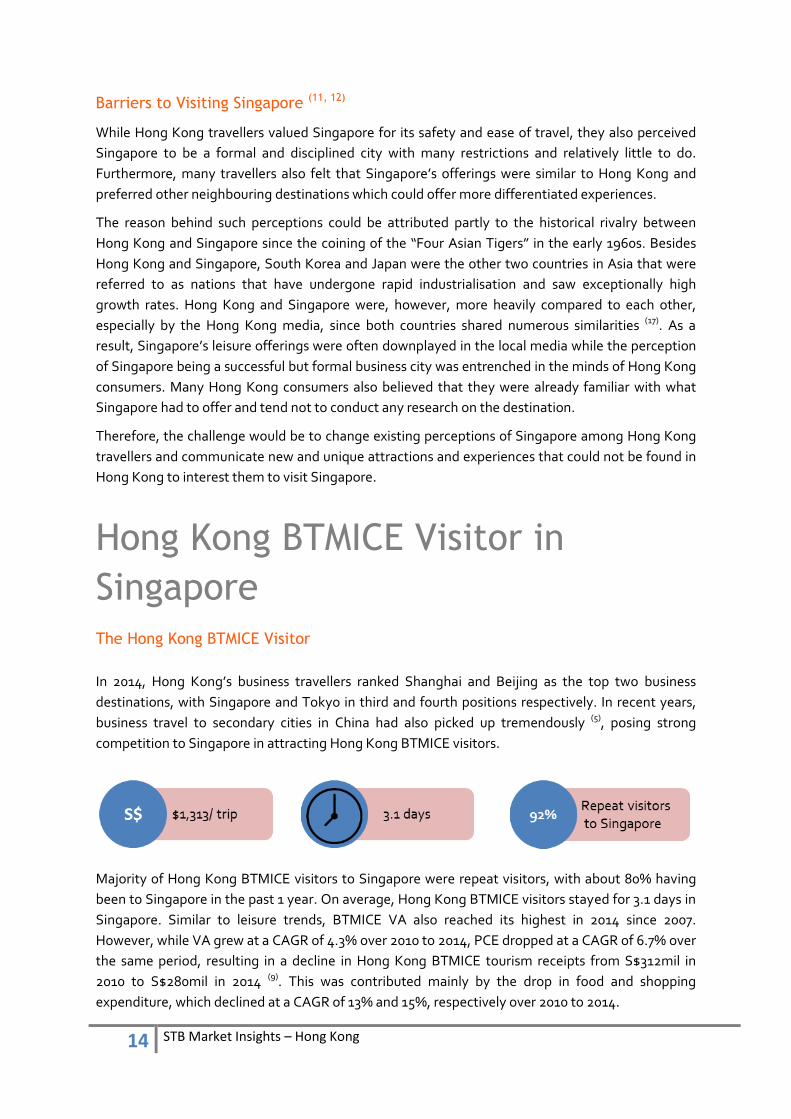
The Hong Kong BTMICE Visitor
In 2014, Hong Kong’s business travellers ranked Shanghai and Beijing as the top two business
destinations, with Singapore and Tokyo in third and fourth positions respectively. In recent years,
business travel to secondary cities in China had also picked up tremendously (5), posing strong
competition to Singapore in attracting Hong Kong BTMICE visitors.
Majority of Hong Kong BTMICE visitors to Singapore were repeat visitors, with about 80% having
been to Singapore in the past 1 year. On average, Hong Kong BTMICE visitors stayed for 3.1 days in
Singapore. Similar to leisure trends, BTMICE VA also reached its highest in 2014 since 2007.
However, while VA grew at a CAGR of 4.3% over 2010 to 2014, PCE dropped at a CAGR of 6.7% over
the same period, resulting in a decline in Hong Kong BTMICE tourism receipts from S$312mil in
2010 to S$280mil in 2014 (9). This was contributed mainly by the drop in food and shopping
expenditure, which declined at a CAGR of 13% and 15%, respectively over 2010 to 2014.

15 STB Market Insights – Hong Kong
Perception of Singapore as a Business and Leisure Destination (13)
Hong Kong BTMICE visitors valued Singapore for its safe and stable environment, its excellent
infrastructure and world class business facilities that were conducive to doing business. Singapore
was also seen as a systematic society with laws, regulations and processes in place.
With regards to leisure experiences in Singapore, most BTMICE visitors felt that Singapore was a
modern and cosmopolitan destination that was perfect to mix business and leisure. Singapore was
also appreciated for its friendly and efficient service and its ease to get around for visitors to enjoy
the destination.
32% of BTMICE visitors indicated that they were “likely” or “very likely” to visit Singapore for leisure
within the next two years. Respondents indicated that the main reasons were to visit Singapore
with a different set of companions and to revisit particular sites (e.g. attraction or dining place) they
have been to during their business trips.
However, 19% of Hong Kong BTMICE visitors indicated they were “unlikely” to revisit the
destination, a percentage that was significantly higher than the global average of 11%. Main
reasons were that they preferred to visit other destinations they have not been before or they felt
that there was nothing new or interesting about Singapore as they had already been to the key
sights and attractions.
Approximately 40% of BTMICE expenditure was contributed by
accommodation, followed by 24% on entertainment, 12% on
food, 11% on shopping and the rest on local transport and other
miscellaneous expenditure (13).

16 STB Market Insights – Hong Kong
Information Sources (13)
When planning for the trip, Hong Kong BTMICE visitors generally did very little pre-trip research.
While their companies were the main decision makers for flight and accommodation options, 57%
of Hong Kong BTMICE travellers indicated that they had control over their own itineraries, which
was significantly higher than the global average of 43%.
During the trip, 82% of Hong Kong BTMICE visitors did not research for any information when they
were in Singapore. For those who did, they relied mainly on their friends, family or colleagues
residing at the destination as their main source of information.
Hong Kong BTMICE Visitors’ Leisure Activities (13)
Once they were done with their business activities, which tend to be after 6pm, Hong Kong BTMICE
visitors enjoyed spending their after-work hours dining (93%), engaging in nightlife (29%) and
shopping (25%). Hong Kong BTMICE visitors spent the highest share on entertainment (which
included gaming and engaging in night life and other activities such as movies and karaoke),
compared to the other countries. While shopping was the top activity for Hong Kong leisure visitors,
BTMICE visitors had the lowest share of shopping spend relative to other Asian countries. 38% did
not shop when they were on business trip compared to the global average of 20%. For those who
shopped, they preferred to shop at locations convenient to where they were (21%) and bought gifts
for their family, friends and colleagues (20%).
Not surprisingly, convenience was the most important consideration for those who engaged in
nightlife experiences as they preferred bars or clubs that were in close proximity or easy to access
from their hotels and offices (54%).
In terms of food preferences, Hong Kong BTMICE visitors were keen to try local cuisine (55%)
although it might not be familiar to them as well as street food (42%). 40% also indicated that they
were willing to go out of the way for good food, a percentage that was significantly higher than the
global average.

17 STB Market Insights – Hong Kong
Findings and Implications As most Hong Kong travellers had been to Singapore before, it is vital to keep them interested in
order for Singapore to remain top priority in their consideration set, especially in the midst of
keener regional competition. Below are the key insights and opportunities we have identified for
the tourism sector:
Finding #1: Leverage Singapore’s strength as a family-friendly destination
Singapore’s safe environment and other hygiene strengths were valued for family travel. Besides
spending quality time with loved ones, broadening horizons and increasing exposure for their
children and themselves were key needs among such travellers. To leverage Singapore’s strength as
a family-friendly destination, it is thus important to highlight enriching and educational experiences
that are available so that everyone in the family, especially the children, could learn and enjoy the
holiday together.
Tips for the Industry:
Highlight enriching experiences which are differentiated from Hong Kong: Feature interactive and educational experiences or attractions which cannot be found in Hong Kong in family travel itineraries. For example, sleepover programmes at the Marine Life Park and Living Classrooms at the Singapore Zoo and Night Safari would allow children to interact directly with the animals and learn about them in the process. Gardens by the Bay also provides Junior Horticulturist programmes for children to learn about biodiversity through hands-on activities and other educational attractions such as the Maritime Experiential Museum, Kidstop at the Science Centre and the upcoming KidZania would be appealing experiences to highlight. Hong Kong’s education system is also trying to broaden their students’ exposure to other cultures. In this regard, Singapore’s multicultural society serves as a good learning ground to expose the children to. Experiences in our museums and cultural precincts which showcase Singapore’s multiculturalism and racial harmony (e.g. Masjid Jamae Chulia, Sri Mariamman Temple and the Buddha Tooth Relic Temple and Museum located along the same street) would provide Hong Kong visitors with a first-hand enriching experience in a multicultural destination.
Timing of marketing efforts: Hong Kong families usually time their travel with public and school holidays. Hence marketing efforts should be pushed out at least one month before these key holidays when potential travellers are starting to do planning and booking.

18 STB Market Insights – Hong Kong
Finding #2: Focus on differentiated and novel lifestyle experiences for non-family
travellers
Non-family travellers from Hong Kong enjoy exploring cities through lifestyle offerings such as
entertainment options, F&B and night life. However, as many Hong Kong travellers saw Singapore
as a familiar destination that shared many similarities to their home country, it is thus important to
effectively highlight our new offerings by differentiating them from Hong Kong and other regional
destinations in our marketing collaterals. New and novel developments and experiences should also
be timely updated to allow Singapore to remain relevant among repeat visitors and reinforce its
image as a dynamic city which constantly renews its offerings.
Another segment to focus on would be the business travellers with higher spending propensity and
who spend their after work hours on dining and night life leisure activities. When marketing such
lifestyle experiences to them, it is important to take into consideration their time-strapped
schedule.
Tips for the Industry:
New discoveries: Increase awareness of novel offerings that are unavailable back home or less-known in Hong
Kong to inspire and engage with Hong Kong travellers:
F&B: Singapore cuisine could be an important aspect to leverage. Itineraries could feature lesser-known hidden gems (e.g. old eateries) which locals frequent, focusing on the diversity of cuisine that cannot be found in Hong Kong. It is important to note, however, that Hong Kong consumers are not very adventurous with their palettes. Hence cuisine such as Peranakan food could be a good balance between being distinctly local and tastefully palatable.
Food souvenirs: Hong Kong travellers also like to buy food souvenirs back home. Hence raising awareness of local food brands and products such as Bengawan Solo pandan cakes and pastries, kaya and chicken rice paste would be key in driving souvenir spend.
Hotels: Hong Kong travellers are willing to spend on accommodation, especially new and novel ones that are value for money. Hence, when reaching out to them, showcase new offerings such as boutique hotels or hotels which offer a differentiated accommodation experience from the mainstream (e.g. heritage elements etc).
Greenery: Featuring greenery offerings (e.g. tree top walk at MacRitchie, Pulau Ubin, Marina Barrage and Gardens by the Bay) can potentially change perceptions of Singapore being another urban city similar to Hong Kong with little greenery and showcase how travellers can rest and relax in Singapore.
Night life: While Lan Kwai Fong is the most prolific night spot in Hong Kong, marketing messages to Hong Kong travellers can focus on the wide variety of night life experiences in Singapore that are unavailable in Hong Kong. For example, the Singapore River area and Marina Bay night life offerings allow visitors to experience Singapore’s beautiful skyline. Duxton Hill gives them an opportunity to enjoy a drink in a neighbourhood, while Club Street and Ann Siang Hill in Chinatown allow visitors to soak in the culture of the precinct while they party away.
Bring out the “value” in our events and lifestyle experiences: Being value-conscious consumers, it is
important to highlight the differentiated lifestyle or entertainment components which our events offer. When promoting events such as the Formula 1® and Women’s Tennis Association Tour Championship, it would be critical to highlight the entertainment (e.g. concerts) and lifestyle offerings (wine, dine and parties).
Package “bite-sized” lifestyle experiences to time-strapped business travellers: Marketing messages or itineraries catered to business travellers should be sharp and focus on the best of the best offerings that they can experience in a short amount of time.

19 STB Market Insights – Hong Kong
Bibliography
1. Hong Kong Census and Statistics Department. Hong Kong: The Facts. 2015.
2. Hong Kong Tourism Board. A Statistical Review of Hong Kong Tourism 2013. 2013.
3. BMI Research. Hong Kong Tourism Report. 2015.
4. MasterCard Centre for Inclusive Growth. The future of Outbound Travel in Asia Pacific. 2014.
5. Leading Hotels. Hong Kong and Taiwan. 2014.
6. Internet World Statistics. Usage and Population Statistics. 2014.
7. ComScore. Key Insights and Digital Trends in Shaping the Online Space in China, Taiwan and Hong
Kong. 2013.
8. Google Hong Kong. Mobile Planet Smartphone Research: Comparison between Hong Kong and
other Asian Countries. 2013.
9. Singapore Tourism Board. Overseas Visitors Survey. 2010-2014.
10. Singapore Tourism Board. Annual Report on Tourism Statistics. 2010-2013.
11. —. Hong Kong Leisure Visitors FGD. 2012.
12. —. Leisure Segmentation Study. 2014.
13. —. Business Travellers Users and Attitude Study. 2011.
14. —. Visitor Experience Study. 2014.
15. Euromonitor International. Travel and Tourism in Hong Kong, China. 2012.
16. PR Newswire. Asian Media Landscape Series. 2014.
17. MasterCard. Hongkongers Top the Asia/Pacific Charts in Dining Spending and Travel Frequency:
MasterCard Survey. 2015.
18. Euromonitor International. Tourism Flows Outbound in Hong Kong, China. 2013.
19. HKTDC Research. Economic and Trade Information on Hong Kong. 2015.

20 STB Market Insights – Hong Kong


![Seasonality PM Group[1]](https://img.dokumen.tips/doc/110x75/577cd3441a28ab9e789703ef/seasonality-pm-group1.jpg)


![STB & 451] : : HDMI STB STB 01 STB STB 7-690-0825 CATV IN](https://img.dokumen.tips/doc/110x75/61b247cbf155562f227eb91c/stb-amp-451-hdmi-stb-stb-01-stb-stb-7-690-0825-catv-in-.jpg)


![& 451] : —000 HDMI 1) STB STB Hi-vision STB ACM] STB 121](https://img.dokumen.tips/doc/110x75/61b24614aa01dd6d2408663d/amp-451-000-hdmi-1-stb-stb-hi-vision-stb-acm-stb.jpg)
