Embed Size (px)
Citation preview
STATUS OF WISCONSIN AGRICULTURE, 2006 Status of the Wisconsin Farm Economy Situation and Outlook: Farm Products, Farm Inputs and the General Economy Special Articles
• Women Farmers in Value-Added Agriculture
• Organic Farming in Wisconsin
• A New Wisconsin Cooperative Law Department of Agricultural and Applied Economics College of Agricultural and Life Sciences University of Wisconsin-Madison Cooperative Extension University of Wisconsin-Extension


STATUS OF WISCONSIN AGRICULTURE, 2006
An Annual Report by:
Department of Agricultural and Applied Economics College of Agricultural and Life Sciences
University of Wisconsin-Madison
And
Cooperative Extension University of Wisconsin-Extension
PREFACE Status of Wisconsin Agriculture is an annual agricultural situation and outlook report authored (except where noted) by faculty in the Department of Agricultural and Applied Economics. The report contains three parts. Part I provides a brief overview of the financial environment in the Wisconsin farming sector. In Part II, market analysts review current conditions in major Wisconsin commodity sub-sectors and offer their forecasts for 2006. Part III contains special articles dealing with longer-term issues facing Wisconsin agriculture. Additional copies of this report may be purchased for $5, including postage. Send requests to Ms. Linda Davis, Department of Agricultural and Applied Economics, UW-Madison, 427 Lorch Street, Madison, WI 53706. Copies may also be downloaded free from the Internet in Adobe Acrobat® format at http://www.aae.wisc.edu/www/pub/ The faculty of the Department of Agricultural and Applied Economics welcomes your comments and questions on material in this report. We also encourage your suggestions on rural Wisconsin issues that we might address in subsequent editions.
Acknowledgements Major funding for Status of Wisconsin Agriculture was provided by the University of Wisconsin Center for Dairy Profitability and by generous contributors to the University of Wisconsin Foundation. We also wish to thank Bob Mitchell, Department of Life Sciences Communication, for his production assistance. Ed Jesse, Editor Department of Agricultural and Applied Economics Henry Taylor Hall University of Wisconsin-Madison Madison, WI 53706 January 2006
ii

TABLE OF CONTENTS Summary ..............................................................................................................................v I. Status of the Wisconsin Farm Economy.........................................................................1 II. Current Outlook..............................................................................................................8
• Dairy ........................................................................................................................8 • Livestock and Poultry ............................................................................................17 • Corn and Soybeans ................................................................................................23 • Fruits and Vegetables.............................................................................................29 • Farm Production Resources ...................................................................................34 • The General Economy ...........................................................................................37
III. Special Articles ............................................................................................................42
• Women Farmers in Value-Added Agriculture.......................................................42
• Organic Farming in Wisconsin: Fad Forecast to Fade or Fundamental Feature of the Food System?...............................................................................................48
• A New Wisconsin Cooperative Law: What’s All the Fuss?..................................53
iii

iv
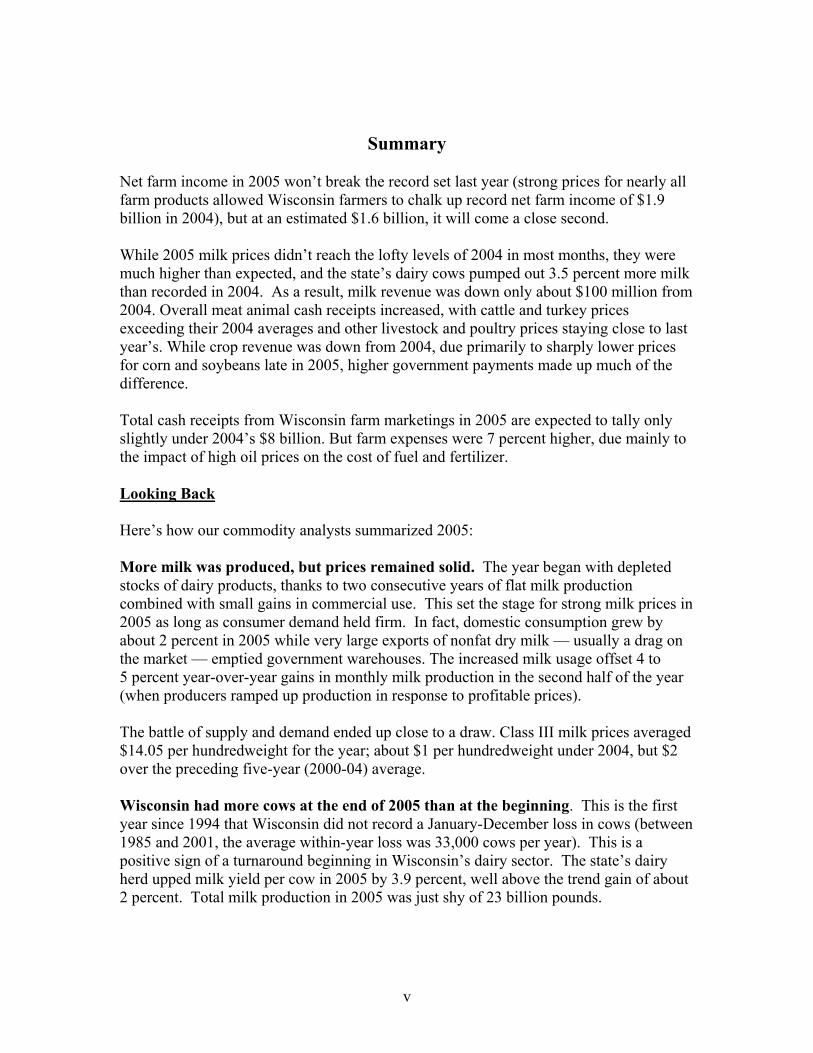
Summary Net farm income in 2005 won’t break the record set last year (strong prices for nearly all farm products allowed Wisconsin farmers to chalk up record net farm income of $1.9 billion in 2004), but at an estimated $1.6 billion, it will come a close second. While 2005 milk prices didn’t reach the lofty levels of 2004 in most months, they were much higher than expected, and the state’s dairy cows pumped out 3.5 percent more milk than recorded in 2004. As a result, milk revenue was down only about $100 million from 2004. Overall meat animal cash receipts increased, with cattle and turkey prices exceeding their 2004 averages and other livestock and poultry prices staying close to last year’s. While crop revenue was down from 2004, due primarily to sharply lower prices for corn and soybeans late in 2005, higher government payments made up much of the difference. Total cash receipts from Wisconsin farm marketings in 2005 are expected to tally only slightly under 2004’s $8 billion. But farm expenses were 7 percent higher, due mainly to the impact of high oil prices on the cost of fuel and fertilizer. Looking Back Here’s how our commodity analysts summarized 2005: More milk was produced, but prices remained solid. The year began with depleted stocks of dairy products, thanks to two consecutive years of flat milk production combined with small gains in commercial use. This set the stage for strong milk prices in 2005 as long as consumer demand held firm. In fact, domestic consumption grew by about 2 percent in 2005 while very large exports of nonfat dry milk — usually a drag on the market — emptied government warehouses. The increased milk usage offset 4 to 5 percent year-over-year gains in monthly milk production in the second half of the year (when producers ramped up production in response to profitable prices). The battle of supply and demand ended up close to a draw. Class III milk prices averaged $14.05 per hundredweight for the year; about $1 per hundredweight under 2004, but $2 over the preceding five-year (2000-04) average. Wisconsin had more cows at the end of 2005 than at the beginning. This is the first year since 1994 that Wisconsin did not record a January-December loss in cows (between 1985 and 2001, the average within-year loss was 33,000 cows per year). This is a positive sign of a turnaround beginning in Wisconsin’s dairy sector. The state’s dairy herd upped milk yield per cow in 2005 by 3.9 percent, well above the trend gain of about 2 percent. Total milk production in 2005 was just shy of 23 billion pounds.
v

Wisconsin’s meat sector gained revenue in 2005. Choice cattle prices were up about 1 percent in 2005 due to a smaller cow slaughter and good demand despite continued BSE-related bans on beef exports to Japan and other countries. Pork exports were up sharply, keeping prices very near 2004 levels. Broiler prices fell off only slightly from 2004’s record level despite higher output. Smaller turkey production strengthened 2005 prices slightly. Corn and soybean growers saw prices skid rapidly in 2005. Summer drought conditions were expected to trim 2005 harvests of corn and soybeans. That didn’t happen. Price began to fall in response to the August USDA crop report, which projected more production than the trade anticipated. Subsequent crop reports raised yield and production estimates even more, putting further downward pressure on prices. U.S. corn production in 2005 ended up above 11 billion bushels and soybean production at over 3 billion bushel. Both crops were the second largest ever. Wisconsin harvested about 430 million bushels of corn and 66 million bushels of soybeans in 2005. Transportation problems related to hurricane Katrina and lack of storage caused very weak local basis levels for Wisconsin corn and soybeans. Cranberry growers produced less than expected; sweet corn output climbed sharply. USDA estimated the 2006 Wisconsin cranberry crop at 3.6 million barrels in August. But a hot summer reduced berry size and dropped production to about 3.3 million barrels. Growers are expecting prices for the 2005 crop of around $35 per barrel. Wisconsin apple production was 3 percent higher than 2004 and prices were about the same. Tart cherry production in the state was down about 4 percent due to spring frosts and cool weather during blossom set, but larger crops elsewhere reduced prices from 2004. Potato growers bumped acreage in 2005 but experienced lower yields because of the hot, dry summer. A smaller national crop kept prices well above 2004. Sweet corn acreage was up 10 percent and yields were up 8 percent. Snap bean production was down 6 percent on smaller acreage. High oil prices upped the cost of purchased inputs. Fertilizer and fuel cost Wisconsin farmers much more in 2005. Anhydrous ammonia — a nitrogen fertilizer used heavily in corn production — is manufactured from natural gas and was especially impacted by high energy prices in 2005. Interest rates rose more than 2 percentage point during the year. Land rents remained constant but land prices rose sharply. The overall economy was jolted by high oil prices and hurricanes, but absorbed the shocks nicely. GDP growth continued strong in 2005, about matching 2004’s 4 percent increase. This surprised many analysts, who expected the oil price shock and hurricane-related disruptions to stifle economic growth. There was no apparent effect of high gasoline and heating fuel prices on consumer spending for food.
vi
Here’s what we expect for 2006. Milk prices will drop as the nation’s dairy herd expands. Cow numbers will increase slightly as herd expansions more than offset cow losses from dairy farm exits. Milk yield per cow will be up around 2.5 percent. Total milk production will be about 181.5 billion pounds. Demand should grow by at least 1.5 percent, to 182.4 billion pounds, even after accounting for the effect of higher energy costs. Expect 2006 milk prices generally to average about $1 per hundredweight lower than 2005. Meat animal prices will be off slightly. The beef industry has entered the expansion phase of the cattle cycle, meaning larger calf crops and more cattle available for slaughter. Broiler production will be up as well, causing some softening of broiler prices as well as prices for competing meats. Further lifting of imports bans would boost exports and diminish the negative price effect of larger domestic meat supplies Corn and soybean prices will remain under pressure. The large 2005 corn and soybean crops were accompanied by large carryover stocks from 2004 crops. This means a burdensome supply and lower new season prices unless plantings are sharply reduced or bad weather cuts 2006 yields. Corn and soybean producers are protected in part by counter-cyclical and loan deficiency payments, but these will be reduced as part of attempts to cut the federal deficit. Expanded Wisconsin cranberry acreage will yield a larger crop in 2006 if nature cooperates. Little change in output or price for other fruits is anticipated. Vegetable plantings on irrigated acreage in 2006 will depend in part on contract prices rising to offset the higher cost of pumping water. High energy prices will hurt. Current and expected natural gas prices suggest anhydrous ammonia prices above $500 per ton in 2006, and prices for mined P and K fertilizers will be higher because of more costly transportation. Fuel prices are expected to stay at late-2005 levels throughout 2006. Interest rates will likely remain close to current levels unless inflation rates pick up rapidly in 2006. Economic growth will help. Real GDP growth of about 3.5 percent in 2006 will help promote strong markets for farm products. Longer-term effects of high energy prices and the ballooning U.S. trade deficit are big question marks in the macroeconomic outlook. A new WTO agreement in 2006 may or may not occur. But even if a new trade pact is signed in 2006, the impact on agricultural trade will be felt in later years. The Wisconsin farm economy is sound based on conventional measures. Farm assets total about $50 billion and farm debt is only about $7.2 billion. A possible red flag is the composition of assets — close to 80 percent of asset value is in farm real estate. There is no clear evidence that the farm real estate market is about to collapse. But a doubling in the average value of an acre of Wisconsin farmland since 1999 has some observers nervous.
vii
An increasingly large percentage of Wisconsin farm household income is earned off the farm. Recent USDA data show that in 2004, farm income represented an average 11.6 percent of total household income for Wisconsin’s 75,500 family farm households. However, more than half of these farms were classified by USDA as “Residential/Lifestyle” farms having negative farm income but total household income over $100,000 annually. For Wisconsin farms with gross farm income exceeding $100,000, farm earnings represented more than two-thirds of household income.
********** This year’s Status of Wisconsin Agriculture contains three special articles. Two are authored by faculty and staff affiliated with the University of Wisconsin-Madison/Extension Program on Agricultural Technology Studies (PATS). Carol Roth and Christa Lachenmayer review the important role of women in agriculture, focusing on value-added farming operations, and Jeremy Foltz (PATS) and Michelle Miller (with the UW Center for Integrated Agricultural Systems) provide some early insights from a PATS study on the nature and importance of organic agriculture in Wisconsin. Cooperative specialist Kim Zeuli explains the controversy surrounding a proposed new Wisconsin law that would allow agricultural and other cooperatives to organize in a way that would encourage investment by non-patrons.
viii
I. Status of the Wisconsin Farm Economy Ed Jesse (608 262-6348)
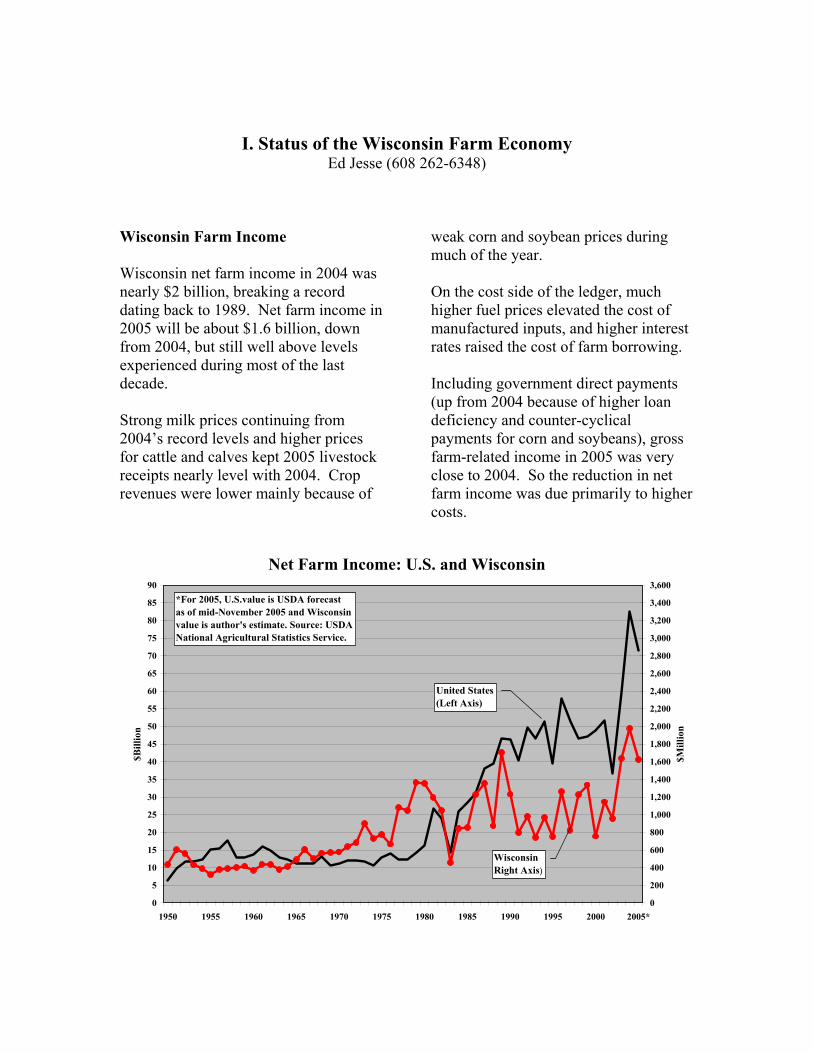
Wisconsin Farm Income Wisconsin net farm income in 2004 was nearly $2 billion, breaking a record dating back to 1989. Net farm income in 2005 will be about $1.6 billion, down from 2004, but still well above levels experienced during most of the last decade. Strong milk prices continuing from 2004’s record levels and higher prices for cattle and calves kept 2005 livestock receipts nearly level with 2004. Crop revenues were lower mainly because of
weak corn and soybean prices during much of the year. On the cost side of the ledger, much higher fuel prices elevated the cost of manufactured inputs, and higher interest rates raised the cost of farm borrowing. Including government direct payments (up from 2004 because of higher loan deficiency and counter-cyclical payments for corn and soybeans), gross farm-related income in 2005 was very close to 2004. So the reduction in net farm income was due primarily to higher costs.
Net Farm Income: U.S. and Wisconsin
0
5
10
15
20
25
30
35
40
45
50
55
60
65
70
75
80
85
90
1950 1955 1960 1965 1970 1975 1980 1985 1990 1995 2000 2005*
$Bill
ion
0
200
400
600
800
1,000
1,200
1,400
1,600
1,800
2,000
2,200
2,400
2,600
2,800
3,000
3,200
3,400
3,600
$Mill
ion
United States(Left Axis)
WisconsinRight Axis)
*For 2005, U.S.value is USDA forecastas of mid-November 2005 and Wisconsinvalue is author's estimate. Source: USDANational Agricultural Statistics Service.
Source: Economic Research Service, USDA for 2003–2004; author’s estimates for 2005.
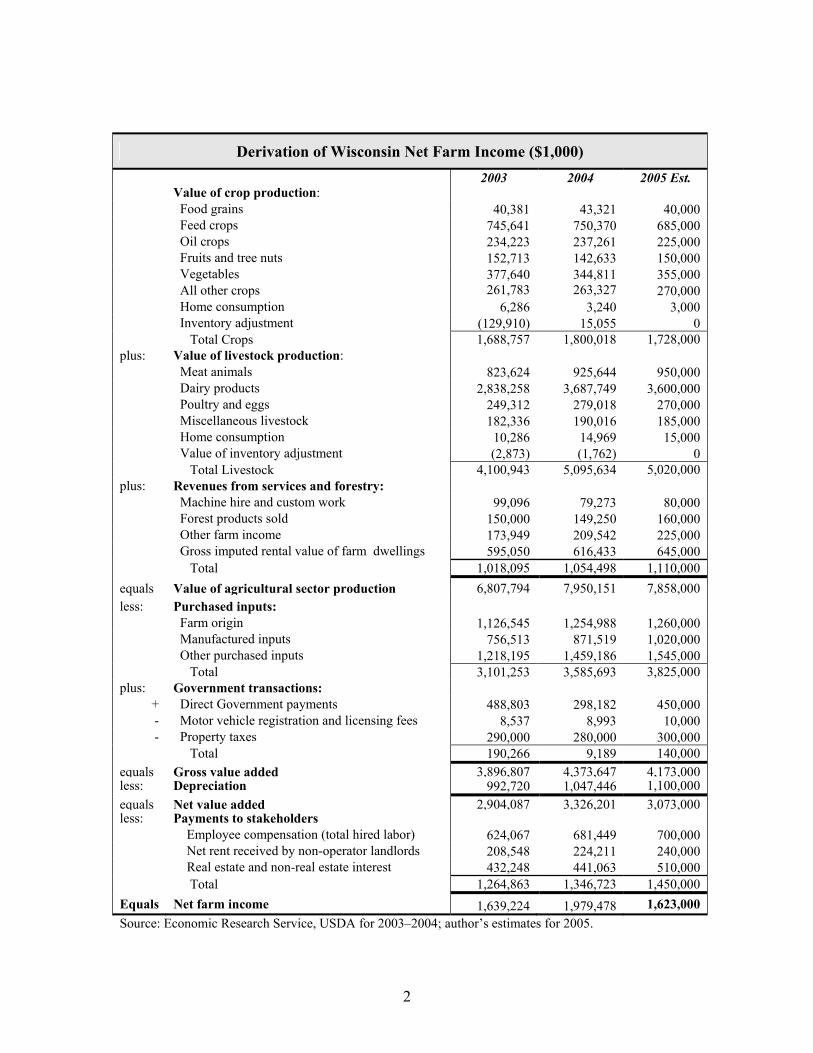
Derivation of Wisconsin Net Farm Income ($1,000) 2003 2004 2005 Est.
Value of crop production: Food grains 40,381 43,321 40,000 Feed crops 745,641 750,370 685,000 Oil crops 234,223 237,261 225,000 Fruits and tree nuts 152,713 142,633 150,000 Vegetables 377,640 344,811 355,000 All other crops 261,783 263,327 270,000 Home consumption 6,286 3,240 3,000 Inventory adjustment (129,910) 15,055 0 Total Crops 1,688,757 1,800,018 1,728,000 plus: Value of livestock production: Meat animals 823,624 925,644 950,000 Dairy products 2,838,258 3,687,749 3,600,000 Poultry and eggs 249,312 279,018 270,000 Miscellaneous livestock 182,336 190,016 185,000 Home consumption 10,286 14,969 15,000 Value of inventory adjustment (2,873) (1,762) 0 Total Livestock 4,100,943 5,095,634 5,020,000 plus: Revenues from services and forestry: Machine hire and custom work 99,096 79,273 80,000 Forest products sold 150,000 149,250 160,000 Other farm income 173,949 209,542 225,000 Gross imputed rental value of farm dwellings 595,050 616,433 645,000 Total 1,018,095 1,054,498 1,110,000equals Value of agricultural sector production 6,807,794 7,950,151 7,858,000 less: Purchased inputs: Farm origin 1,126,545 1,254,988 1,260,000 Manufactured inputs 756,513 871,519 1,020,000 Other purchased inputs 1,218,195 1,459,186 1,545,000 Total 3,101,253 3,585,693 3,825,000 plus: Government transactions:
+ Direct Government payments 488,803 298,182 450,000 - Motor vehicle registration and licensing fees 8,537 8,993 10,000 - Property taxes 290,000 280,000 300,000
Total 190,266 9,189 140,000 equals Gross value added 3,896,807 4,373,647 4,173,000 less: Depreciation 992,720 1,047,446 1,100,000 equals Net value added 2,904,087 3,326,201 3,073,000less: Payments to stakeholders Employee compensation (total hired labor) 624,067 681,449 700,000 Net rent received by non-operator landlords 208,548 224,211 240,000 Real estate and non-real estate interest 432,248 441,063 510,000 Total 1,264,863 1,346,723 1,450,000Equals Net farm income 1,639,224 1,979,478 1,623,000
2

Composition of Wisconsin Farm Cash Receipts, 2004
Dairy$3,688
Cattle & Calves$801
Poultry Products$279
Hogs$119
Other Livestock$196
Corn$669
Soybeans$237
Vegetables & Potatoes$345
Greenhouse & Nursery$237
Fruits$143
Other Crops$151
Crops
Value of farm sales in $MillionSource: Economic Research Service, USDA
Milk continues to account for the majority of Wisconsin farm cash receipts. In 2004, Wisconsin farm milk sales totaled $3.7 million, 53.7 percent of total farm cash receipts. Sales of all livestock products accounted for 74 percent of total cash receipts, with crop sales accounting for the remainder. Among Wisconsin crops, corn was the largest contributor to marketing receipts. Corn and beans together accounted for half of total crop revenue for the state. Farm Balance Sheet Assets held by Wisconsin farmers approached $50 billion in 2005. More than three-quarters of this value was in the form of farm real estate, primarily land. Debt, mostly in the form of farm real estate mortgages, has slowly increased. But land values have
expanded much more rapidly, so equity continues to expand. Wisconsin land values continue to escalate. Farm real estate reached an average $2,850 per acre on January 1, 2005, 14 percent higher than year-earlier.1 This compares to just over $1,000 per acre in 1995. Farmland values are being driven by both farmer and non-farm investor demand. Farmer demand has strengthened recently from a combination of low interest rates and higher than average farm income in the last two years. In addition, farmers displaced by urban sprawl have sought replacement farmland to defer capital
1 Estimate based on USDA-NASS survey. This value is not the same as the average value of farm real estate sales.
3

gain taxes. Non-farm demand continues to come from real estate developers and urban residents seeking recreational property. Since the late 1990s, the value of Wisconsin real estate has increased at a significantly higher annual rate than the national average and the growth rate for neighboring states. Between 1988 and 2005, Wisconsin farm real estate value per acre jumped by 130 percent compared to the U.S. average gain of 55 percent and 36 percent for Illinois.
Wisconsin Farm Balance Sheet: August 31, 2005 ($Million)
Farm assets: 49,406 Real estate 38,595 Livestock and poultry 3,573 Machinery and motor vehicles 4,263 Crops 859 Purchased inputs 328 Financial 1,787
Farm debt: 7,192 Real estate 3,782 Non-real estate 3,410 Equity 42,214 Debt/equity ratio 17.0% Debt/asset ratio 14.6%
Source: Estimated by author based on national data and historical Wisconsin proportions as provided by Economic Research Service, USDA.
Wisconsin Farm Assets and Debt on December 31
0
5
10
15
20
25
30
35
40
45
50
55
1961
1963
1965
1967
1969
1971
1973
1975
1977
1979
1981
1983
1985
1987
1989
1991
1993
1995
1997
1999
2001
2003
2005
*
$Bill
ion
TotalAssets
Debt
Equity
Source: Economic Research Service, USDA*2005 is estimated
4

Wisconsin, Illinois, and U.S. Farm Real Estate Values
0
200
400
600
800
1,000
1,200
1,400
1,600
1,800
2,000
2,200
2,400
2,600
2,800
3,000
3,200
1990 1991 1992 1993 1994 1995 1996 1997 1998 1999 2000 2001 2002 2003 2004 2005
$/A
cre
Source: National Agricultural Statistics Service, USDA
Wisconsin
U.S. Average
Illinois
Farm Household Income The income of farm families consists of income earned from farming activities as well as income derived from non-farm sources such as wages from off-farm jobs or non-farm businesses, interest and dividends from financial investments, and social security, disability, and other social service payments. Over time, the portion of farm household income coming from non-farm sources has increased and has come to represent the largest part of farm household income by far. In 2004, the Economic Research Service (ERS) of USDA estimated that 83.6 percent of U.S. farm households’
cash income came from off the farm. Because of strong commodity prices in 2004, this percentage was down from previous years — non-farm income was 95 percent of U.S. farm household income in 2000 and 2002. At first blush, these data suggest that U.S. farmers, on average, generate little income from farming and rely primarily on off-farm income to support their families. However, the data include a large number of “farms” whose operators either are financially challenged or do not expect to earn a living from farming.
5
U.S. Farm Income Household Income by Source
0
10,000
20,000
30,000
40,000
50,000
60,000
70,000
80,000
90,000
100,000
1996 1997 1998 1999 2000 2001 2002 2003 2004 2005*
$ pe
r H
ouse
hold
Non-Farm Income
Farm-Related Income
Source: Economic Research Service, USDA*2005 is Forecast
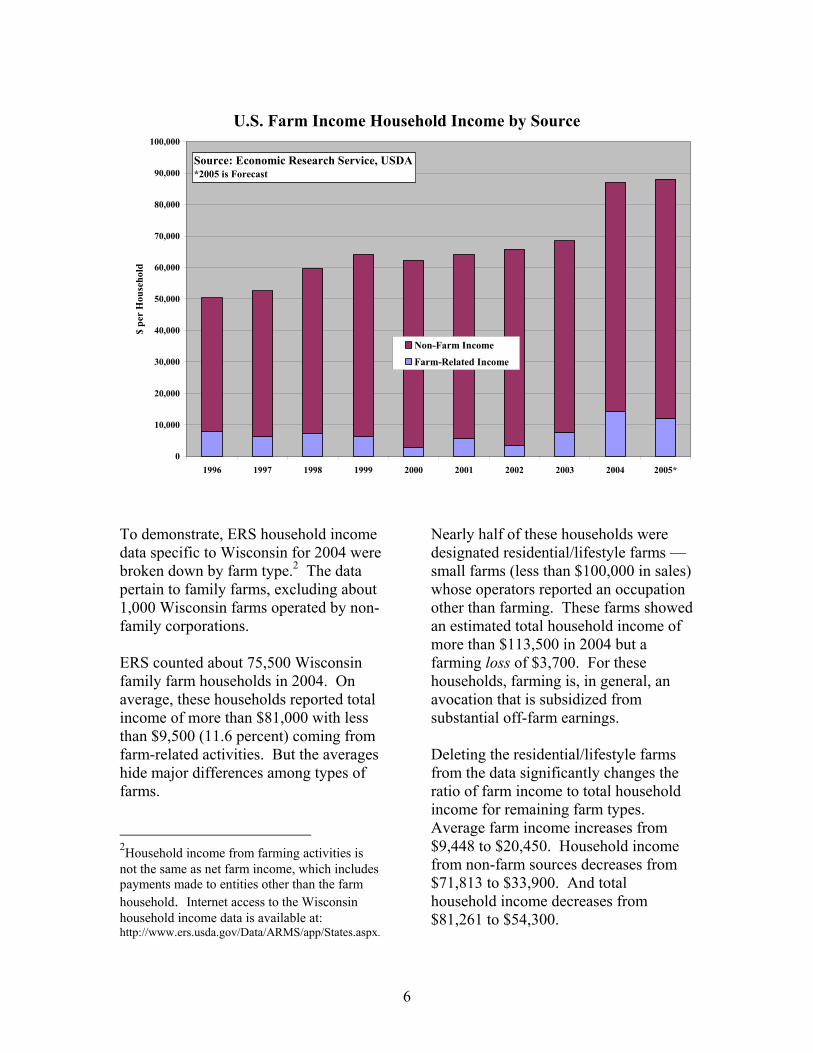
To demonstrate, ERS household income data specific to Wisconsin for 2004 were broken down by farm type.2 The data pertain to family farms, excluding about 1,000 Wisconsin farms operated by non-family corporations. ERS counted about 75,500 Wisconsin family farm households in 2004. On average, these households reported total income of more than $81,000 with less than $9,500 (11.6 percent) coming from farm-related activities. But the averages hide major differences among types of farms. 2Household income from farming activities is not the same as net farm income, which includes payments made to entities other than the farm household. Internet access to the Wisconsin household income data is available at: http://www.ers.usda.gov/Data/ARMS/app/States.aspx.
Nearly half of these households were designated residential/lifestyle farms — small farms (less than $100,000 in sales) whose operators reported an occupation other than farming. These farms showed an estimated total household income of more than $113,500 in 2004 but a farming loss of $3,700. For these households, farming is, in general, an avocation that is subsidized from substantial off-farm earnings. Deleting the residential/lifestyle farms from the data significantly changes the ratio of farm income to total household income for remaining farm types. Average farm income increases from $9,448 to $20,450. Household income from non-farm sources decreases from $71,813 to $33,900. And total household income decreases from $81,261 to $54,300.
6

Composition of Wisconsin Farm Household Income by Type of Farm
Household Income, 2004
Farm Type No. of Farms From
Farming Activities
From Non-Farm
Sources Total
Farm Income as a percent of
Total Household
Income
Limited Resources 8,139 -2,891 10,583 7,692 -37.6%Retirement 7,804 5,349 59,476 64,825 8.3%Residential/Lifestyle 34,381 -3,693 117,223 113,530 -3.3%Commercial: <$100K 11,170 413 39,603 40,016 1.0%Commercial: $100-250K 8,274 30,859 26,555 57,414 53.7%Commercial: $250-500K 3,781 80,462 33,873 114,335 70.4%Commercial: >$500K 1,981 130,352 26,951 157,303 82.9%All farms 75,531 9,448 71,813 81,261 11.6%
Source: Economic Research Service, USDA (http://www.ers.usda.gov/Data/ARMS/app/States.aspx) Another 21 percent of farm households were designated either retirement or limited-resource farms. Retirement farms are small farms whose operators report that they are retired. Limited-resource farms are farms with annual gross sales less than $100,000, total farm assets less than $150,000, and household income less than $20,000. These farms include retirees and persons claiming non-farm occupations as well as farmers who meet the three criteria. Retirement farms reported positive income from farming activities and a respectable $60,000 in non-farm income. Limited-resource farms, in contrast, lost money from farming and averaged only $10,600 in non-farm income to offset farming losses. These are clearly needy households. Households whose operators claimed farming as their primary occupation but had farm sales less than $100,000 in
2004 accounted for 15 percent of Wisconsin farm households in 2004. Farm income accounted for only 1 percent of household income for these small farms and total household income was only $40,000. These smaller commercial farms are clearly struggling financially. Farms with sales exceeding $100,000 annually represented less than 20 percent of Wisconsin farm households in 2004. For these farms, both household income and farm income as a percent of household income increased with sales. Farms with sales ranging from $100,000–$200,000 have average household income about equal to the U.S. average for 2004. Farms with more than $500,000 in annual sales earned $157,000 in household income in 2004, 83 percent from farming activities.
7

II. Current Outlook: Wisconsin Agricultural Commodities, Production Inputs and the General Economy
In this section, commodity specialists offer their insights on economic conditions for Wisconsin agriculture by commodity sub-sector. Forecasts for the general economy are also offered. Interested readers are encouraged to contact these specialists for more current or more detailed information.
Dairy Bob Cropp (608) 262-9483
Synopsis Prices for dairy products, particularly cheese and butter, and farm level milk prices are very sensitive to small changes in either milk production or commercial disappearance. This wasn’t the situation during the long period from 1950 to 1990, when the federal dairy price support program provided a much higher price safety net. But today’s support price of $9.80 per hundredweight (for milk with 3.5 percent butterfat) provides a very low safety net. Consequently, dairy product and farm milk prices are above support most of the time. Cows are milked 365 days per year, and neither raw milk nor most dairy products can be stored for any length of time in anticipation of better prices. So there is a very small distinction between a level of production that depresses milk prices and a level that results in relatively high prices. Stated in economic terms, this situation occurs because the price elasticity of both supply and demand are inelastic; that is, both dairy producers and
consumers don’t respond much to short-term changes in price. So the end result of this relatively low safety net is volatile dairy prices. It is unlikely that federal dairy policy will change this. Consequently, dairy producers will increasingly need to take actions to manage price uncertainty and volatility. The market environment entering 2006 We enter 2006 after two consecutive years of favorable milk prices. Milk prices set record highs in 2004, with an average Class III price of $15.39 and an average all-milk price for Wisconsin of $16.86. While prices averaged lower in 2005, they were still the third highest ever, with an average Class III price of $14.05 and an average Wisconsin all-milk price of $15.62. Due to several factors discussed below, milk prices in 2005 turned out higher than what had been predicted at this time last year. Consecutive years of virtually no increases in U.S. milk production in 2003 and 2004 and improved commercial disappearance tightened the supply and demand situation for 2005. The average annual number of milk cows declined 0.6 percent in 2003 and another 0.8 percent in 2004. The decline
8

in cow numbers and annual increases in milk per cow of less than 1 percent each of these years explain the absence of any significant growth in milk production. But after anemic performance in 2001 and 2002, commercial disappearance increased 2.2 percent in 2003 and another 1 percent in 2004. With stagnant milk production and improved commercial disappearance, stocks of dairy products in early 2005 were at levels that supported higher milk prices. January 31, 2005, butter and cheese stocks were down 49 percent and 6 percent, respectively, from year-earlier levels. And nonfat dry milk stocks were a fraction of historical levels.3 With market prices higher than the $0.80 per pound support price for nonfat dry milk, there have been no Commodity Credit Corporation (CCC) purchases of nonfat dry milk since November 2004. On January 31, 2005, government stocks were just 357 million pounds, 57 percent lower than the previous year. Total nonfat dry milk stocks (government plus commercial) were 439.8 million pounds, down 54 percent from the previous year and 44 percent below the five-year average for this date. Much of this reduction in nonfat dry milk stocks is attributable to a tighter supply and higher prices on the world market. This occurred primarily because of milk production shortfalls in New Zealand and Australia, two major world exporters. Higher world prices allowed
U.S. exporters to profitably sell nonfat dry milk overseas without export subsidies. Nonfat dry milk exports totaled 509 million pounds in 2004, an increase of 64 percent from 2003. For the first nine months of 2005, nonfat dry milk exports were 53.7 percent higher than for the same period in 2004.
3 On January 31, 2003, total nonfat dry milk stocks were a burdensome 1.135 billion pounds, more than 90 percent held by the government through dairy price support purchases.
Expanded exports not only raised nonfat dry milk prices to more than $1.00 per pound, but also tightened the overall supply of milk proteins. This enhanced the prices of other milk protein products, especially dry whey. Dry whey prices, which averaged less than 17 cents per pound in 2003, increased to an average of almost 24 cents in 2004 and were in the range of 24 cents to 33 cents all of 2005. These higher dry whey prices added 40 to 80 cents per hundredweight to the Class III price. And without nonfat dry milk exports, more milk would have gone into cheese vats and lowered cheese prices. Predictably, more favorable milk prices spurred some dairy expansion in 2005 and milk production is on the rebound. Beginning with May 2005, monthly milk production was more than 4 percent higher than the previous year. Total milk production for 2005 is estimated at 176.6 billion pounds, up 3.4 percent from 2004. Adjusting for leap year in 2004, the increase on a daily basis was 3.7 percent. The increase was driven by a larger U.S. dairy herd compared to a year ago, with the numbers building each month beginning with March.
9

The third round of the Cooperatives Working Together (CWT) herd retirement program removed more than 66,000 cows between mid-October and December 31st, 2005, but this was not enough to offset dairy expansions and reduce the size of the nation’s dairy herd. Further, dairy cow slaughter was down 6.4 percent from year-earlier for the first half of 2005, with slightly smaller declines July through October. During November and December, weekly slaughter was closer to — and in some weeks above — last year due to the extra cows being removed by CWT. December cow numbers were estimated to be 0.5 percent higher than the previous year and to average 9,035,000 head for the year, an increase of
0.3 percent. History offers ample evidence that an increase in cow numbers puts downward pressure on milk prices. Besides more cows, a major factor in the relatively strong recovery in milk production in 2005 was a higher per-cow milk yield. Since May 2005, milk per cow has been running 3.3 to 4.1 percent above year-earlier. This compares to a long-term trend increase of about 2 percent per year. For 2005, average milk per cow is estimated at 19,548 pounds, up 3.1 percent (3.4 percent on a daily basis). Favorable weather, a milk-feed-price ratio of more than 3.25, and full-allocation of rBST contributed to this relatively strong increase in milk per cow.
U.S. cow numbers, milk per cow and total milk production, 2005, and percent change from 2004
Month Cows (1,000)
% Change
Milk per cow (Pounds)
% change
Total milk (billion Lbs)
% change
Jan 8,995 0.1 1,622 1.2 14,586 1.3 Feb 8,984 -0.1 1,502 -0.7 13,498 -0.7 Mar 9,009 0.1 1,683 2.6 15,158 2.7 Apr 9,023 0.3 1,659 2.9 14,970 3.1 May 9,034 0.5 1,732 3.7 15,650 4.2 Jun 9,044 0.3 1,663 4.9 15,040 5.2 Jul 9,047 0.2 1,654 3.6 14,950 3.8 Aug 9,057 0.3 1,637 4.0 14,844 4.4 Sep 9,057 0.4 1,571 4.1 14,203 4.3 Oct 9,059 0.4 1,611 3.3 14,596 3.7 Nov 9,061 0.4 1,567 3.8 14,203 4.4 Dec 9,054 0.5 1,647 3.8 14,912 4.3 Tot/Avg 9,035 0.3 19,548 3.1 176,610 3.4
January – November: USDA, NASS. December and annual averages are author’s estimates.
10

Despite this relatively strong increase in milk production, dairy product prices held firm and supported higher farm level milk prices for most of 2005. Farm milk prices did not fall until November, when the Class III price was $13.35, down $1.00 from October and the lowest price for the year. The previous low was $13.60 for August, the result of Chicago Mercantile Exchange (CME) 40-pound block cheddar cheese prices declining from $1.55 per pound in mid-July to $1.36 per pound in early August. Cheese prices subsequently recovered, with CME 40-pound cheddar blocks reaching a high of $1.595 per pound at the end of September. Prices held above $1.40 through the end of October before dipping to $1.36 in early November. Surprisingly, 40-pound blocks once again recovered and stayed above $1.40 per pound until the last week of December. CME butter was at $1.67 per pound the end of September, held in the $1.55 to $1.62 range in October, fell into the $1.40 to $1.48 range most of November, and was below $1.40 in early December. Nonfat dry milk prices were around $1.00 per pound all year and dry whey prices ranged from $0.24 to $0.33 per pound. In summary, 2005 ended with a lot more milk, but yet a fairly balanced milk supply and demand situation, and relatively strong dairy product and farm-level milk prices. Commercial
disappearance and dairy exports absorbed much of 2005’s expanded milk production. Commercial disappearance for the year is estimated at 179.7 billion pounds (milk equivalent, fat basis), up about 2 percent from 2004. Retail prices have been favorable for increased sales. As of October 2005, the retail price index for all dairy products was just 0.3 percent higher than a year ago compared to a 2.2 percent gain for all food. Retail cheese and butter prices were 0.5 percent and 5.2 percent lower, respectively, than October 2004, and fresh whole milk prices were up just 0.5 percent. The table below compares stocks of dairy products on November 30, 2005, stocks with year-ago levels and the 5-year average for this date. Butter and cheese stocks were building towards year-end, with both higher than a year ago. Butter stocks were 23.5 percent lower than their five-year average, while cheese stocks were 4.7 percent higher. The nonfat dry milk stocks shown for November 30, 2005 are all commercial stocks — government surplus stocks were zero. For the first time in the 56-year history of the dairy price support program, there were no purchases of surplus dairy products in 2005. Neither were there purchases (export subsidies) under the Dairy Export Incentive Program (DEIP) for the first time since its inception in 1985.
11

Stocks of dairy products: November 30, 2005 compared to November 30, 2004 and 5-year average
for this date.
Percent Change from:
Product
Nov. 30, 2005
(Million Pounds)
Nov. 30, 2004
5-Year Average
Butter 61.3 6.2 -23.5 Total Cheese 716.8 1.8 4.7 Nonfat dry milk 92.0 -84.7 -89.8
USDA, NASS. Nonfat dry milk stocks are for October 31 Wisconsin in 2005 Wisconsin’s milk production also ended the year on a strong note. The year started with cow numbers 10,000 head (0.8 percent) less than the previous year and milk per cow just 0.3 percent higher, resulting in 0.5 percent less milk production. The year ended with cow numbers 1,000 head (0.1 percent) above a year ago and milk per cow almost 4 percent higher, resulting in 4.1 percent more milk. For the year, cow numbers averaged 1,235,000 head, down 0.4 percent. Annual milk per cow was at about 18,500 pounds, up 3.9 percent over 2004. The result was 22.9 billion pounds of milk, 3.5 percent more than 2004 (3.8 percent on a daily basis). In 2004, cow numbers declined 15,000 head (1.2 percent) and total milk
production was 22,085 billion pounds, down 0.8 percent from 2003. While the turnaround in cow numbers and the increase in milk production in 2005 are good news for Wisconsin, total production in 2005 was still about 9 percent less than the record 25 billion pounds produced in 1988. Wisconsin, along with the other four top dairy states of California, New York, Pennsylvania and Idaho, produce more than half of the nation’s milk supply. Two of the top five states, California and Idaho, expanded cow numbers in 2005, and all five states had substantial increases in milk production. The top five states added about 33,000 more cows in 2005 and increased milk production by 3.7 million pounds.
12

Wisconsin cow numbers, milk per cow and total milk production, 2005, and percent change from 2004.
Month Cows (1,000)
% Change
Milk per cow Lbs.)
% Change
Total milk (Mil. Lbs.)
% Change
Jan 1,235 -0.8 1,510 0.3 1,865 -0.5 Feb 1,234 -0.9 1,405 0.0 1,734 -0.9 Mar 1,233 -0.9 1,560 3.3 1,923 2.4 Apr 1,233 -0.7 1,535 3.4 1,893 2.7 May 1,234 -0.6 1,630 4.5 2,011 3.8 Jun 1,235 -0.5 1,585 6.7 1,957 6.2 Jul 1,236 -0.3 1,600 5.3 1,978 4.9 Aug 1,236 -0.3 1,595 5.6 1,971 5.3 Sept 1,237 -0.2 1,510 4.9 1,868 4.7 Oct 1,237 -0.1 1,535 4.1 1,899 4.0 Nov 1,238 +0.1 1,485 4.9 1,838 5.0 Dec 1,237 +0.1 1,550 4.0 1,917 4.1 Tot/Avg 1,235 -0.4 18,500 3.9 22,854 3.5 January – November: USDA, NASS. December and annual averages are author’s estimates
Estimated Changes in average annual number of cows, milk per cow and total milk production of the five leading dairy
states, 2005 versus 2004
State Milk cows (1,000)
% Change
Total Milk (Bil. Lbs.)
% Change
California 1,757 +1.9 37.5 +2.8 Wisconsin 1,235 -0.5 22.9 +3.5 New York 648 -1.0 12.1 +3.7 Pennsylvania 558 -0.8 10.5 +4.5 Idaho 442 +7.4 10.1 +11.6 5-state totals 4,640 +1.2 93.0 +4.1
Author’s estimates based on USDA-NASS data through November 2005. Forecast for 2006 There is no indication that cow numbers will fall below year-ago levels, at least for the first three-quarters of the year. Cow numbers will continue to grow in California, Idaho and other Western and
Southwestern states, more than offsetting declines elsewhere. Slaughter cow prices are forecast in the $40 to low $50 per hundredweight range and normal culling of the dairy herd is expected. Replacement heifer numbers are at levels to maintain and to grow the
13
nation’s dairy herd. July 1, 2005 numbers showed dairy replacements (heifers 500 pounds and heavier) at 3.7 million head, 3 percent higher than a year ago and a ratio of 40.9 heifers per 100 milk cows. About 38 to 40 percent of these were expected to enter the dairy herd in the course of a year. Some predict that the ban on importing replacements from Canada may be lifted by year’s end. But since only 65,000 to 75,000 replacements per year were coming in from Canada before the ban, lifting the ban will not change things much in 2006. The price of replacements has been relatively high but is expected to drop some with lower milk prices in 2006. The size of the nation’s herd in 2006 is forecast to average 9,053,000 head, 0.2 percent greater than 2005. Barring major adverse weather and poor-quality feed, average milk per cow could easily increase another 2.5 percent, to 20,040 pounds. While the price for high-quality hay will be higher this winter in the West and some other states, including Wisconsin, much lower corn and soybean prices will keep the milk-feed-price ratio near a favorable 3.0 for most months of the year. This combination of more cows and higher milk yield would result in 181.4 billion pounds of milk in 2006, 2.7 percent more than 2005. Altering total U.S. milk supply from domestic production are changes in dairy exports and imports. While nonfat dry milk exports are anticipated to drop some from very high 2005 levels, USDA forecasts that exports will absorb a significant amount of any increased milk
production. Dry whey exports are expected to be at 2005 levels or higher. The Dairy Export Assistance component of the CWT program has an objective of exporting 20 million pounds of cheese and 20 million pounds of butter and butter-related products during the period July 1, 2005, through June 30, 2006, with most of these exports occurring in calendar year 2006. This product volume is equivalent to about 330 million pounds of milk. The program is triggered when the CME 40-pound block cheddar cheese price falls below $1.40 per pound and the CME butter price falls below $1.30 per pound. On a milk-equivalent volume basis, total dairy exports are not expected to increase in 2006. Consequently, milk prices in 2006 will be affected primarily by changes in domestic milk production and commercial disappearance. The National Milk Producers Federation is evaluating the CWT herd retirement program. Whether a fourth round will be implemented after June 30, 2006 and what the dairy cow slaughter goals will be are unknown at this time. The commercial disappearance picture for 2006 is unclear. A big question is the impact of this winter’s higher home heating costs on consumer expenditures for food, both at home and away from the home. Restaurant traffic, which was up in 2005, is very important to cheese and butter consumption and prices.
14
U.S. milk supply and demand: 2005 and estimates for 2006
Market Factor 2005 2006 % Change
Cows, 1,000 head 9,035 9,053 +0.2 Milk per cow, pounds 19,548 20,040 +2.5 Production, Bil. Lbs. 176.619 181.422 +2.7 Farm use, Bil. Lbs. 1.1 1.1 +0.0 Marketings, Bil. Lbs 175.597 180.322 +2.7 Beg. Stocks, Bil. Lbs. 8.2 8.0 -2.4 Imports, Bil. Lbs milkfat equiv. 4.7 4.8 +2.1 Total supply, Bil. Lbs. 188.497 193.122 +2.5 Commercial use, Bil. Lbs. 179.732 182.428 +1.5 Avg. Class III price, $/cwt. $14.05 $12.80 - $1.25 Avg. Wisconsin All-milk price. $/cwt. $15.62 $14.40 - $1.30
2005 preliminary based on USDA, NASS data; 2006 are author’s estimates.
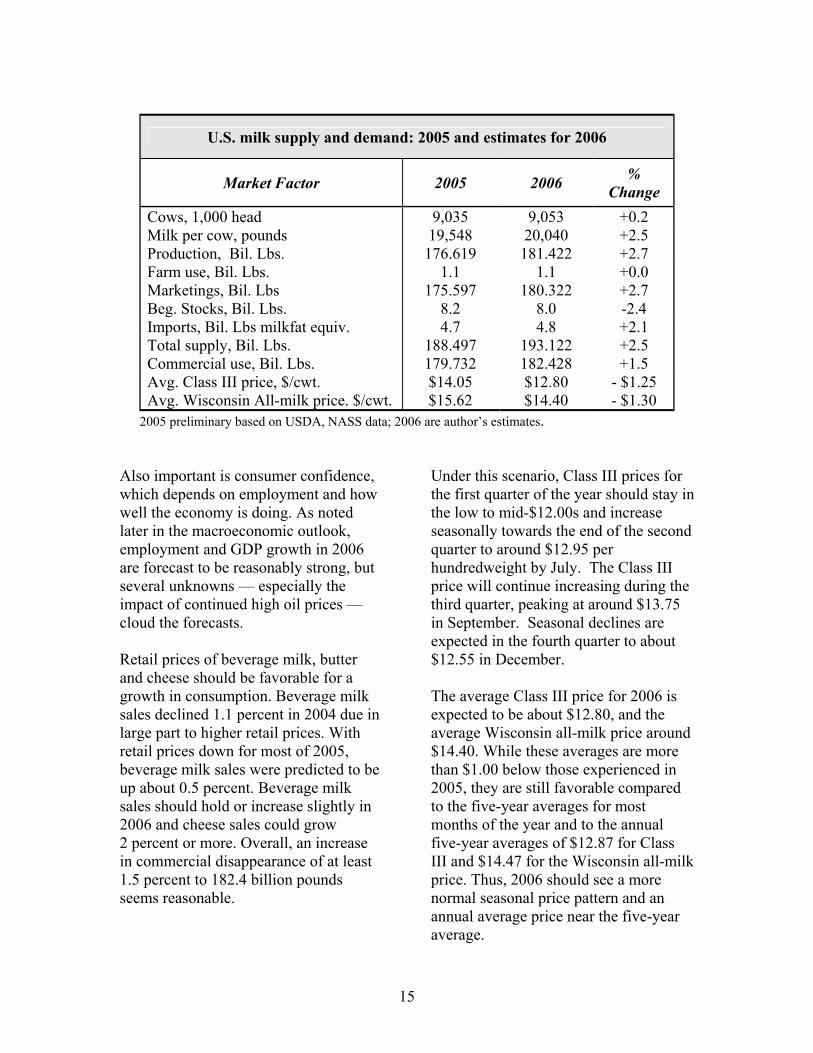
Also important is consumer confidence, which depends on employment and how well the economy is doing. As noted later in the macroeconomic outlook, employment and GDP growth in 2006 are forecast to be reasonably strong, but several unknowns — especially the impact of continued high oil prices — cloud the forecasts. Retail prices of beverage milk, butter and cheese should be favorable for a growth in consumption. Beverage milk sales declined 1.1 percent in 2004 due in large part to higher retail prices. With retail prices down for most of 2005, beverage milk sales were predicted to be up about 0.5 percent. Beverage milk sales should hold or increase slightly in 2006 and cheese sales could grow 2 percent or more. Overall, an increase in commercial disappearance of at least 1.5 percent to 182.4 billion pounds seems reasonable.
Under this scenario, Class III prices for the first quarter of the year should stay in the low to mid-$12.00s and increase seasonally towards the end of the second quarter to around $12.95 per hundredweight by July. The Class III price will continue increasing during the third quarter, peaking at around $13.75 in September. Seasonal declines are expected in the fourth quarter to about $12.55 in December. The average Class III price for 2006 is expected to be about $12.80, and the average Wisconsin all-milk price around $14.40. While these averages are more than $1.00 below those experienced in 2005, they are still favorable compared to the five-year averages for most months of the year and to the annual five-year averages of $12.87 for Class III and $14.47 for the Wisconsin all-milk price. Thus, 2006 should see a more normal seasonal price pattern and an annual average price near the five-year average.
15

Some dairy market analysts are forecasting considerably lower milk prices, particularly for the second half of the year. Lower prices are a very real possibility if milk production is higher and/or commercial sales lower than expected now. The range in possible prices from the current forecast could easily be $1.00 lower to $1.00 higher. At this time the probability for lower prices appears greater than the probability for higher prices.
The futures market and cash forward contracts offered by milk plants as late as December 2005 provided an opportunity to protect base milk prices well above average through most of 2006. Dairy producers need to watch for pricing opportunities. But, the decision to act on these pricing opportunities is not an easy one for many dairy producers.
Class III Prices: 2006 Forecast and 5-Year Average
10.00
10.50
11.00
11.50
12.00
12.50
13.00
13.50
14.00
14.50
Jan Feb Mar Apr May Jun Jul Aug Sept Oct Nov Dec
$/C
wt.
2001-05Average
2006Forecast
16

Livestock and Poultry Patrick Luby (608) 262-6974
2005 in Review
• Total U.S. meat production increased about 2 percent in 2005, following two years of flat production numbers. The three year (2002 to 2005) increase, which totaled only 1.7 percent, followed a 64 percent increase in output from 1982 to 2002.
• Broiler production rose more
than 3 percent in 2005, reaching another record high. It represented more than 40 percent of total U.S. meat output in 2005, also a new record high.
• Average annual livestock and
poultry prices were mixed in 2005. Choice cattle, boning cows and turkey prices were a little higher while hog and broiler prices averaged a little lower than in 2004.
• Pork exports increased about
25 percent in 2005 to a new record high. Pork imports fell about 10 percent. Net pork exports (exports less imports) were more than 8 percent of U.S. pork production, by far a new high.
• Beef exports continued to be
small for the second consecutive year as a result of many countries banning U.S. beef following the discovery of a BSE-infected
animal in the U.S. in December 2003. Beef exports in 2005 were up from 2004 but still down about 75 percent from 2003.
• Average feeder steer prices
reached new record highs for the third consecutive year and were about 75 percent above their cyclical low in 1996.
• Cow slaughter declined again in
2005 to the lowest level since 1963. It was down 20 percent from two years ago and down more than 53 percent from the record high set in 1975.
• Average retail beef, pork and
poultry prices were quite stable during 2005 at or near record highs. This followed steep increases during the preceding two years.
U.S. Meat Production Up Modestly Again in 2006 A moderate expansion in the production of beef, pork, broilers and turkey of about 3 percent is expected in 2006, to a record high of nearly 90 billion pounds. Broiler output is expected to account for nearly half of the tonnage increase. Recent good domestic demand for most meats, strong export demand for pork, favorable recent returns to most producers and low feed costs will all contribute to pushing meat production to a new high.
17
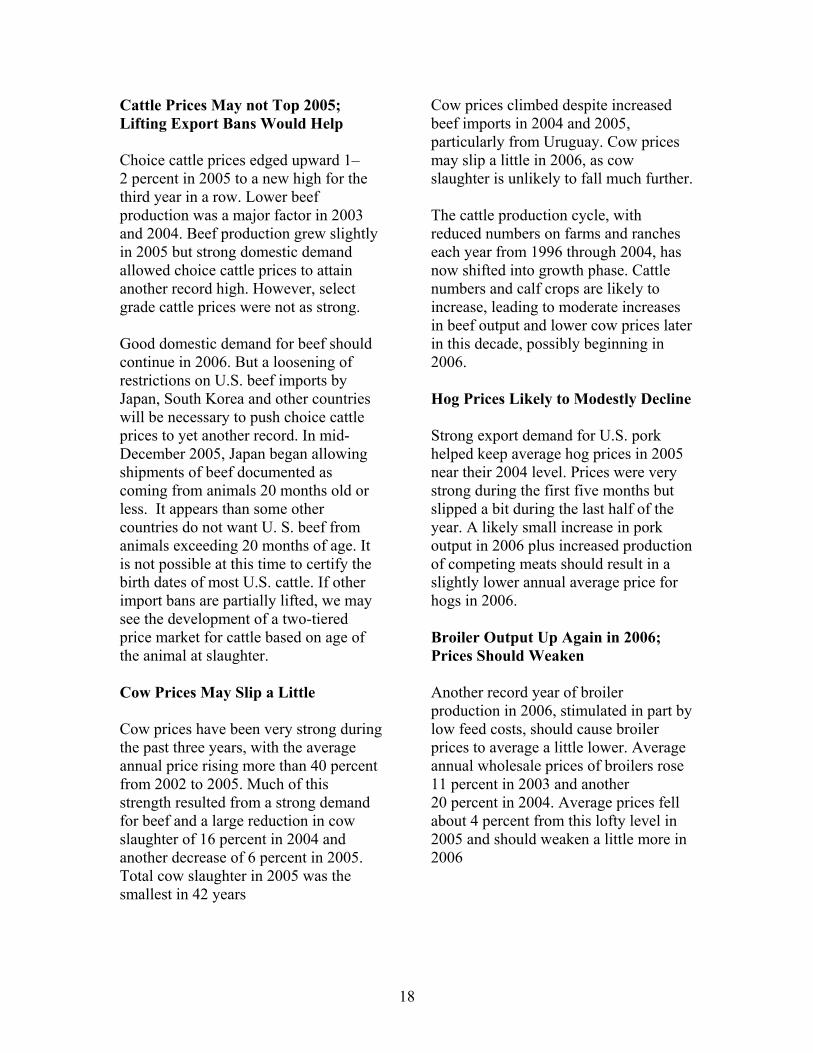
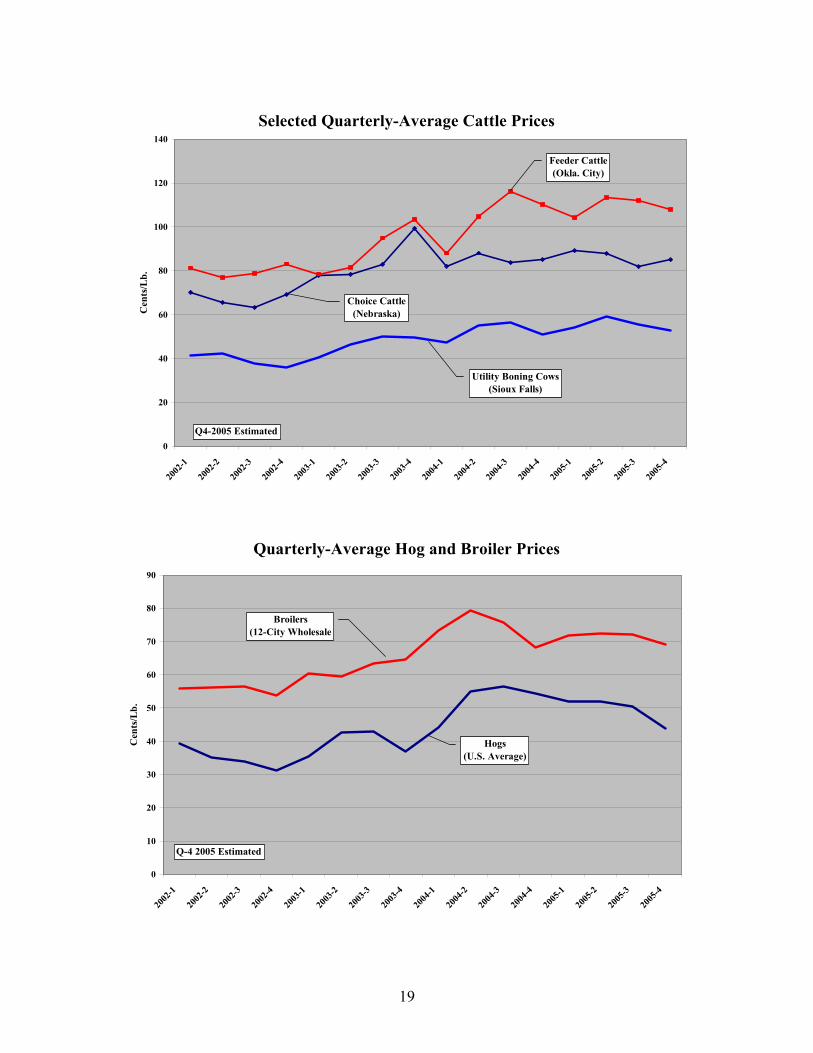
Cattle Prices May not Top 2005; Lifting Export Bans Would Help Choice cattle prices edged upward 1–2 percent in 2005 to a new high for the third year in a row. Lower beef production was a major factor in 2003 and 2004. Beef production grew slightly in 2005 but strong domestic demand allowed choice cattle prices to attain another record high. However, select grade cattle prices were not as strong. Good domestic demand for beef should continue in 2006. But a loosening of restrictions on U.S. beef imports by Japan, South Korea and other countries will be necessary to push choice cattle prices to yet another record. In mid-December 2005, Japan began allowing shipments of beef documented as coming from animals 20 months old or less. It appears than some other countries do not want U. S. beef from animals exceeding 20 months of age. It is not possible at this time to certify the birth dates of most U.S. cattle. If other import bans are partially lifted, we may see the development of a two-tiered price market for cattle based on age of the animal at slaughter. Cow Prices May Slip a Little Cow prices have been very strong during the past three years, with the average annual price rising more than 40 percent from 2002 to 2005. Much of this strength resulted from a strong demand for beef and a large reduction in cow slaughter of 16 percent in 2004 and another decrease of 6 percent in 2005. Total cow slaughter in 2005 was the smallest in 42 years
Cow prices climbed despite increased beef imports in 2004 and 2005, particularly from Uruguay. Cow prices may slip a little in 2006, as cow slaughter is unlikely to fall much further. The cattle production cycle, with reduced numbers on farms and ranches each year from 1996 through 2004, has now shifted into growth phase. Cattle numbers and calf crops are likely to increase, leading to moderate increases in beef output and lower cow prices later in this decade, possibly beginning in 2006. Hog Prices Likely to Modestly Decline Strong export demand for U.S. pork helped keep average hog prices in 2005 near their 2004 level. Prices were very strong during the first five months but slipped a bit during the last half of the year. A likely small increase in pork output in 2006 plus increased production of competing meats should result in a slightly lower annual average price for hogs in 2006. Broiler Output Up Again in 2006; Prices Should Weaken Another record year of broiler production in 2006, stimulated in part by low feed costs, should cause broiler prices to average a little lower. Average annual wholesale prices of broilers rose 11 percent in 2003 and another 20 percent in 2004. Average prices fell about 4 percent from this lofty level in 2005 and should weaken a little more in 2006
18
Selected Quarterly-Average Cattle Prices
0
20
40
60
80
100
120
140
2002
-1
2002
-2
2002
-3
2002
-4
2003
-1
2003
-2
2003
-3
2003
-4
2004
-1
2004
-2
2004
-3
2004
-4
2005
-1
2005
-2
2005
-3
2005
-4
Cen
ts/L
b.
Feeder Cattle(Okla. City)
Utility Boning Cows(Sioux Falls)
Choice Cattle(Nebraska)
Q4-2005 Estimated
Quarterly-Average Hog and Broiler Prices
0
10
20
30
40
50
60
70
80
90
2002
-1
2002
-2
2002
-3
2002
-4
2003
-1
2003
-2
2003
-3
2003
-4
2004
-1
2004
-2
2004
-3
2004
-4
2005
-1
2005
-2
2005
-3
2005
-4
Cen
ts/L
b.
Hogs(U.S. Average)
Broilers(12-City Wholesale
Q-4 2005 Estimated
19

Turkey Production will be up a Little, Prices Weaker After more than doubling from 1984 to 2002, turkey production declined 1 percent in 2003 and 4 percent in 2004 before rising slightly in 2005. The number of turkeys slaughtered fell, but the average weight rose enough to allow total production to move sidewise. A small production increase should cause turkey prices to weaken slightly in 2006. Lambs Should Hold Most of Recent Price Increases Lamb prices rose along with those for most meats and meat and poultry in 2003 and 2004 with annual increases of 27 percent and 5 percent, respectively, to nearly $100 per cwt. Prices climbed a bit more in 2005, but an expected boost in output in 2006 (the first in some years) makes further price increases unlikely. Little Change in Egg Output or Prices Wholesale egg prices rocketed to new highs in 2003 and early 2004 — to nearly $1.15 per dozen. Prices then collapsed into the 60–70 cent range by mid-2004 and have mostly remained there since. A likely 1-percent increase in egg output in 2006 should keep prices near 2005 levels.
Meat Exports Depend Partly on BSE-Related Decisions Pork exports were very strong in 2005, easily reaching record-high levels. For the second consecutive year, beef exports were very weak, as most major beef importers continued to ban U.S. beef following the discovery of a BSE-infected cow in the United States in December 2003. If existing beef import bans are completely lifted in early 2006, beef exports are likely to rise and the boom in pork exports would lose momentum. From 1995 through 2003, net beef imports (imports less exports) averaged 1.8 percent of U.S. beef output. Following the BSE incident, net beef imports soared to nearly 13 percent of U.S. beef production. Beef exports were about 2.5 billion pounds in 2002 and 2003 but less than 0.5 billion pounds in 2004 and barely above 0.6 billion pounds in 2005. Fortunately, the import ban coincided with the weak production phase of the decade-long cattle production cycle. Strong domestic demand for beef and the smallest U.S. beef production since 1994 in both 2004 and 2005 permitted cattle prices to reach record or near record high prices despite the severe decline in the export market.
20

U.S. Foreign Trade Balance (Exports minus Imports)as a Percent of Production
-15-14-13-12-11-10-9-8-7-6-5-4-3-2-10123456789
10
1993
1994
1995
1996
1997
1998
1999
2000
2001
2002
2003
2004
2005
1993
1994
1995
1996
1997
1998
1999
2000
2001
2002
2003
2004
2005
Perc
ent
Beef
Pork
Meanwhile, pork exports rose from 1.7 billion pounds in 2003 to nearly 2.2 billion pounds in 2004 and to near 2.7 billion pounds in 2005. Net pork exports (exports less imports) rose from about 3 percent of U.S. pork production in 2003 to 5.3 percent in 2004 and to 8.1 percent in 2005. Broiler exports in 2005 were about 14 percent of domestic output for the fourth consecutive year. Broiler exports have been between 12 percent and 18 percent of U.S production for each of the last 11 years. Meanwhile, turkey exports were the second largest on record in 2005 and reached a record high of 10.5 percent of domestic turkey output. Exports of both broilers and turkey are expected to remain large in 2006.
Little Change in Retail Meat Prices Expected in 2006 According to the Consumer Price Index, meat prices were flat in 2005 following a substantial rise in 2003 and 2004. Although meat prices leveled off in 2005, the average annual prices of beef, pork and poultry all reached record levels. However, the increase in the average retail price of meat in 2005 was less that the increase in all goods and services as reported in the Consumer Price Index for the first time since 2002.
21
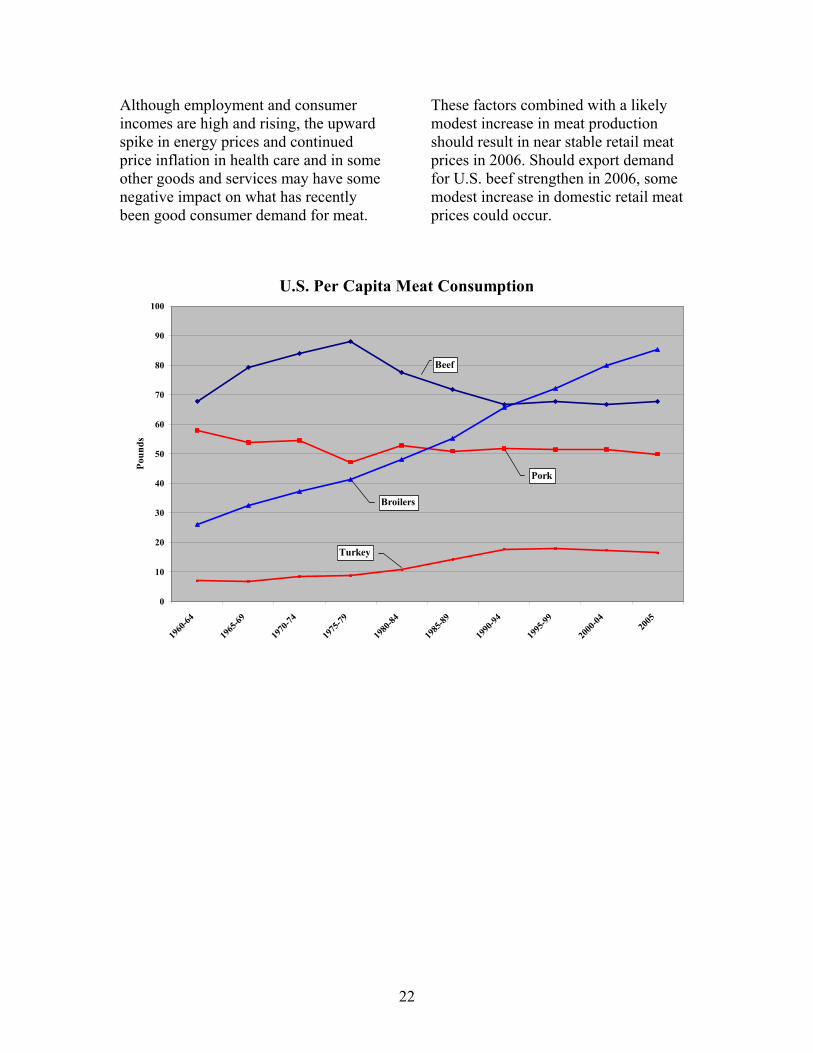
Although employment and consumer incomes are high and rising, the upward spike in energy prices and continued price inflation in health care and in some other goods and services may have some negative impact on what has recently been good consumer demand for meat.
These factors combined with a likely modest increase in meat production should result in near stable retail meat prices in 2006. Should export demand for U.S. beef strengthen in 2006, some modest increase in domestic retail meat prices could occur.
U.S. Per Capita Meat Consumption
0
10
20
30
40
50
60
70
80
90
100
1960
-64
1965
-69
1970
-74
1975
-79
1980
-84
1985
-89
1990
-94
1995
-99
2000
-04 2005
Poun
ds
Turkey
Pork
Broilers
Beef
22

Corn and Soybeans Randy Fortenbery (608) 262-4908
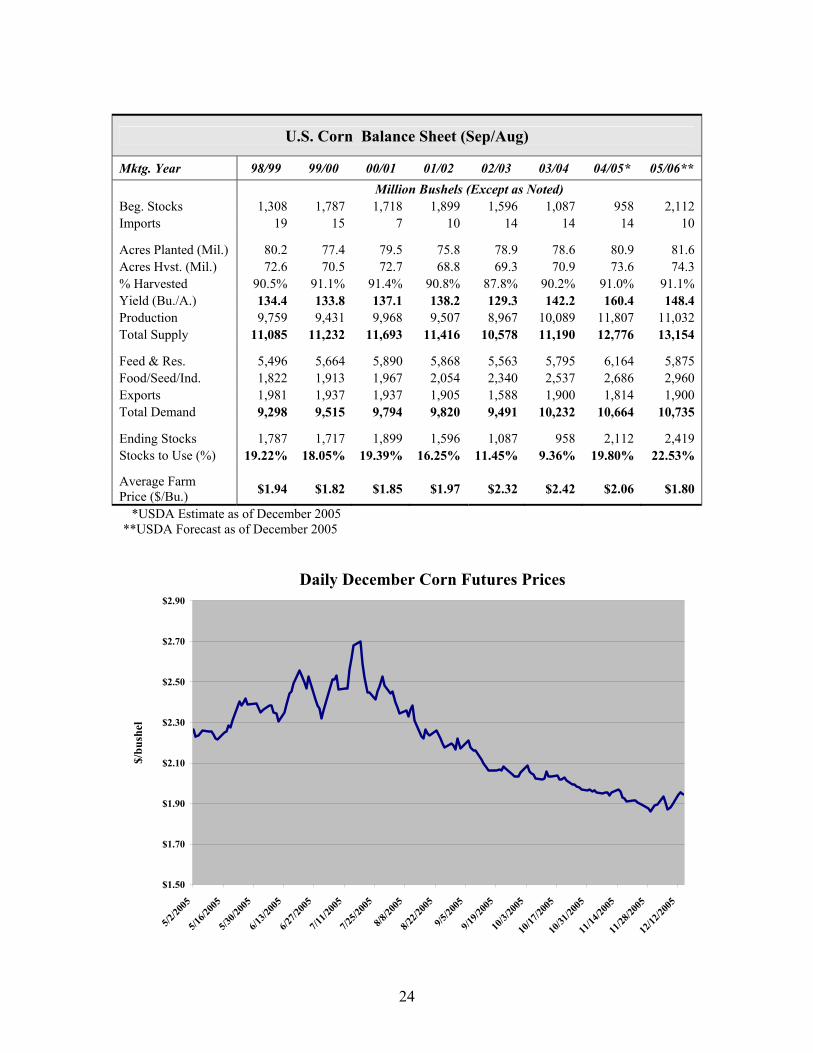
Synopsis Corn and soybean markets experienced significant volatility in the 2004/2005 marketing year. The combinations of drought, low river levels, export disruptions from hurricane Katrina, and better than expected yields all contributed to the volatility. The most attractive prices for both old crop and new crop occurred in the summer months, when producers were most concerned about poor yields. Prices fell quickly as exports were disrupted and actual yields came in well above initial expectations. Thus, while prices were quite attractive early in the production season, most producers were reluctant to market new crop grain and ended up facing low prices and abnormally weak basis levels at harvest. Problems were compounded by large carryover stocks from 2004 for both corn and soybeans. This caused significant strains on storage facilities and forced the use of non-conventional storage strategies. Corn On August 12, 2005 USDA predicted that the 2005/2006 U.S. corn crop would total 10.35 billion bushels, with an average yield of 139 bushels per acre. While this was substantially lower than the 11.8 billion bushels harvested in the
fall of 2004, it would still be the second largest crop on record. The 2004 crop came from fewer acres than planted in 2005, but average 2004 yields exceeded 160 bushels per acre. Despite significantly lower estimates of both average yield and total production relative to 2004, the market was surprised that estimated 2005 corn production was as big as it was given widespread drought in many growing regions. Corn prices fell with the August crop report. Each subsequent USDA crop report projected even higher corn production and yields. In December 2005, USDA estimated the 2005/2006 corn crop at over 11 billion bushels, with an average yield of 148.4 bushels per acre. Prices continued to fall as the expected size of the 2005 corn crop grew. Corn futures for December delivery lost more than 50 cents per bushel from August 2 through December 1. In addition to larger-than-expected production, the 2005/2006 corn market had to deal with abnormally high carry-over from the previous year’s record crop. On September 1 (the start of the 2005/2006 marketing year) there were still over 2 billion bushels of corn in storage from the 2004 harvest. This compares to less than 1 billion bushels on September 1, 2004 and represented the largest carry-over since 1993.
23
U.S. Corn Balance Sheet (Sep/Aug)
Mktg. Year 98/99 99/00 00/01 01/02 02/03 03/04 04/05* 05/06** Million Bushels (Except as Noted) Beg. Stocks 1,308 1,787 1,718 1,899 1,596 1,087 958 2,112 Imports 19 15 7 10 14 14 14 10
Acres Planted (Mil.) 80.2 77.4 79.5 75.8 78.9 78.6 80.9 81.6 Acres Hvst. (Mil.) 72.6 70.5 72.7 68.8 69.3 70.9 73.6 74.3 % Harvested 90.5% 91.1% 91.4% 90.8% 87.8% 90.2% 91.0% 91.1% Yield (Bu./A.) 134.4 133.8 137.1 138.2 129.3 142.2 160.4 148.4 Production 9,759 9,431 9,968 9,507 8,967 10,089 11,807 11,032 Total Supply 11,085 11,232 11,693 11,416 10,578 11,190 12,776 13,154
Feed & Res. 5,496 5,664 5,890 5,868 5,563 5,795 6,164 5,875 Food/Seed/Ind. 1,822 1,913 1,967 2,054 2,340 2,537 2,686 2,960 Exports 1,981 1,937 1,937 1,905 1,588 1,900 1,814 1,900 Total Demand 9,298 9,515 9,794 9,820 9,491 10,232 10,664 10,735
Ending Stocks 1,787 1,717 1,899 1,596 1,087 958 2,112 2,419 Stocks to Use (%) 19.22% 18.05% 19.39% 16.25% 11.45% 9.36% 19.80% 22.53%
Average Farm Price ($/Bu.) $1.94 $1.82 $1.85 $1.97 $2.32 $2.42 $2.06 $1.80
*USDA Estimate as of December 2005 **USDA Forecast as of December 2005
Daily December Corn Futures Prices
$1.50
$1.70
$1.90
$2.10
$2.30
$2.50
$2.70
$2.90
5/2/20
05
5/16/2
005
5/30/2
005
6/13/2
005
6/27/2
005
7/11/2
005
7/25/2
005
8/8/20
05
8/22/2
005
9/5/20
05
9/19/2
005
10/3/
2005
10/17
/2005
10/31
/2005
11/14
/2005
11/28
/2005
12/12
/2005
$/bu
shel
24

The combination of larger-than-expected production and abnormally large carryover hit Wisconsin farmers particularly hard. In August, USDA estimated Wisconsin’s 2005 corn crop at 364 million bushels. Average yield was estimated at 130 bushels per acre, a six-bushel drop from 2004. By November, however, the Wisconsin crop estimate had grown to 427.5 million bushels, an increase of almost 17.5 percent. The increase reflected a 50,000-acre increase over August expectations and a 20-bushel-per-acre hike in estimated yield. Despite widespread drought in the state, average 2005 Wisconsin corn yields exceeded 2004 by more than 10 percent. Like the rest of the country, Wisconsin’s 2005 corn supply was augmented by near-record carryover from the previous year. Wisconsin corn stocks — both on-
farm and off-farm — going into the 2005 harvest were almost 50 percent more than 2004. The huge supply, coupled with the effect of hurricane Katrina on moving barge traffic, resulted in record or near-record weak basis levels for most Wisconsin producers. Weak harvest basis levels combined with a positive carry in the futures market is generally a strong signal that producers will be rewarded for storing grain. However, because of the large 2004 carryover, storage facilities were at capacity going into harvest. Consequently, many producers were either forced to sell grain at harvest lows, or resort to unconventional means of storage, increasing both their storage costs and the risks of grain degradation during storage.
Monthly Corn Basis - Rock County, Wisconsin(Cash - Futures)
-0.70
-0.60
-0.50
-0.40
-0.30
-0.20
-0.10
0.00
Sep-04 Nov-04 Jan-05 Mar-05 May-05 Jul-05 Sep-05 Nov-05
$/bu
shel
Actual
3-Year HistoricalAverage
25
On the positive side, USDA currently projects another year of record corn demand. Feed usage for 2005/2006 is projected to be below year-ago levels, but this is offset by a substantial increase in seed and industrial use. Ethanol use is expected to continue to increase, exceeding last year’s use of corn for ethanol production by 19 percent. With passage of the U.S. Energy Bill in 2005, annual increases in the volume of corn used for ethanol will likely be sustained for at least the next five years. Projected corn exports at 1.9 billion bushels will also exceed last year’s level. As of late December 2005, exports were on pace to match or exceed USDA’s December projection. In addition, USDA is expecting reduced export activity from South Africa, Argentina, and China this marketing year. Loan Deficiency Payments (LDPs) at harvest averaged about 40 cents per bushel in Wisconsin. Consequently, Wisconsin producers who were able to store their 2005 crop at harvest and collect the LDP have already enjoyed some significant price improvement. However, there are large challenges ahead. USDA currently projects the 2006 carryin to exceed 2.4 billion bushels, several hundred million bushels more than 2005. If this happens, it will be difficult to sustain major improvement in new crop corn prices for fall 2006 without another significant weather scare during the growing season. As of late December 2005, December 2006 corn futures were trading at about $2.45 per bushel. With anything close to a 10-billion-bushel crop in 2006 and the
current 2006 carryout projection, this price will not hold through the 2006 harvest season. USDA is projecting the average U.S. farm price for corn in 2005/06 to be about $1.80 per bushel. This compares to an average U.S. price of $2.06 last marketing year. Corn buyers will likely be rewarded by aggressive forward purchasing early in the marketing year. Basic could still improve significantly during the spring months, and the futures market is offering near full carry. That is, futures prices for later delivery months relative to current delivery are near the maximum expected storage-related premiums. Soybeans USDA’s December 2005 estimate for U.S. soybean production was 3.04 billion bushels, with an average U.S. yield of 42.7 bushels per acre. Like corn, this represented a large increase from earlier production estimates. In August 2005, USDA estimated that the U.S. soybean crop would only total 2.3 billion bushels, with an average yield of 38.7 bushels per acre. Production in 2005 was augmented by 256 million bushels left over from the 2004 harvest, bringing total supply for the 2005/2006 marketing year to 3.3 billion bushels. Soybean production in 2005 was slightly below year-ago production, but still the second-largest crop on record. Carryin from the record 2004 crop was the largest since 2000, and more than 127 percent above the previous year’s carryin.
26

U.S. Soybean Balance Sheet (Sep/Aug)
Mktg. Year 98/99 99/00 00/01 01/02 02/03 03/04 04/05* 05/06** Million Bushels (Except as Noted) Beg Stocks 200 348 290 248 208 178 112 256 Imports 3 4 4 2 5 6 4 4
Acres Planted (Mil.) 72 73.7 74.3 74.1 74 73.4 75.2 72.2 Acres Hvst. (Mil.) 70.4 72.4 72.4 73.0 72.5 72.5 74 71.3 % Harvested 97.8% 98.2% 97.4% 98.5% 98.0% 98.8% 98.4% 98.8% Yield 38.9 36.6 38.1 39.6 38 33.9 42.2 42.7 Production 2,741 2,654 2,758 2,891 2,756 2,454 3,124 3,043 Total Supply 2,944 3,006 3,052 3,141 2,969 2,638 3,242 3,303
Crush Sep/Aug 1,590 1,578 1,641 1,700 1,615 1,530 1,696 1,720 Exports 801 973 998 1,064 1,044 887 1,103 1,020 F/S/R 205 165 165 169 130 109 187 158 Total Demand 2,595 2,716 2,804 2,933 2,791 2,526 2,986 2,898
Ending Stocks 348 290 248 208 178 112 256 405 Stocks To Use (%) 13.41% 10.68% 8.84% 7.09% 6.38% 4.43% 8.57% 13.98%
Avg. Farm Price $4.93 $4.63 $4.54 $4.38 $5.53 $7.34 $5.74 $5.35 *USDA Estimate as of December 2005 **USDA Forecast as of December 2005 Unfortunately from the standpoint of soybean price outlook, the U.S. is not the only nation to experience both near-record soybean production and large carryover from previous production. Worldwide, soybean production in 2005/2006 is expected to exceed the previous year by almost 4 percent, and stocks left over from 2004/2005 exceed the previous year’s carryout by almost 20 percent. Both Brazil and Argentina are expected to increase production in 2005/2006, with their combined production exceeding U.S. production by almost 20 percent. Argentina, Brazil and the United States will account for more than 80 percent of world soybean production in 2005/2006.
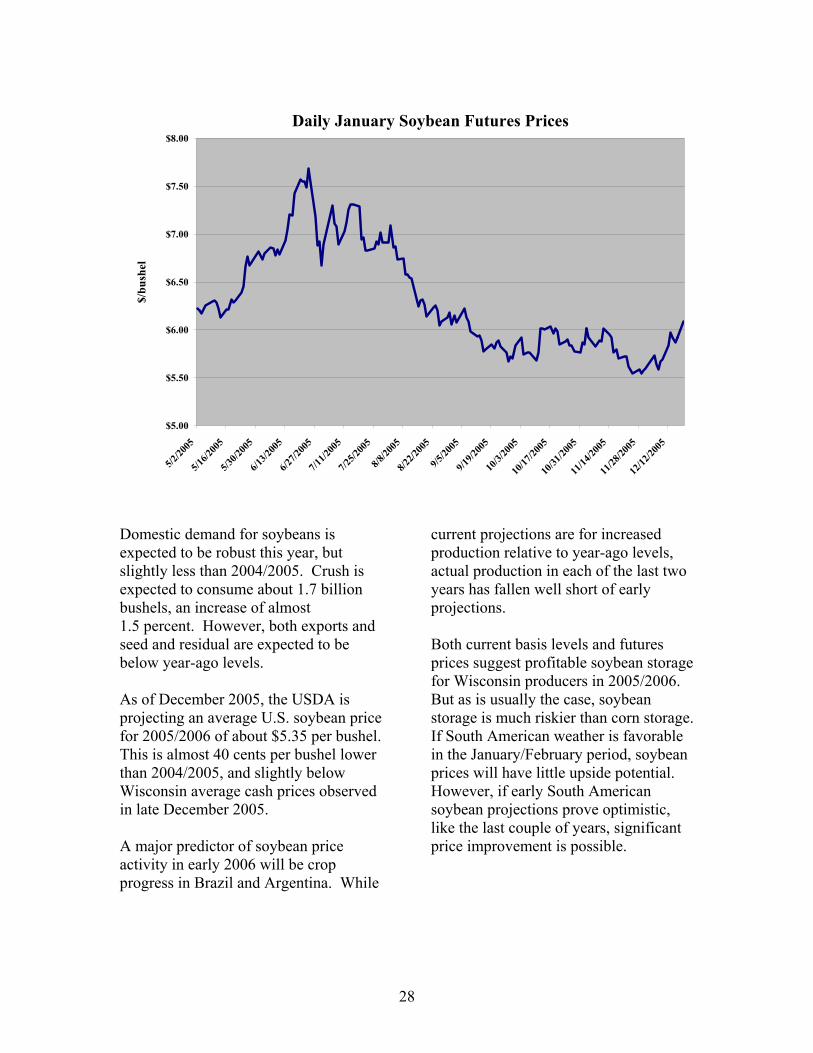
Wisconsin producers were estimated to have produced 66.4 million bushels of soybeans in 2005, with an average yield of 42 bushels per acre. This post-harvest estimate exceeds the expectations in late summer by a substantial amount. In August, Wisconsin was projected to produce only 56.5 million bushels, with an average yield of 36 bushels per acre. This was still an increase of 2 million bushels relative to 2004. Similar to corn, soybean prices reacted negatively to each revision in expected production through the fall. January 2006 soybean futures finally bottomed at $5.54 in late November before returning to $6.00 levels in mid-December.
27
Daily January Soybean Futures Prices
$5.00
$5.50
$6.00
$6.50
$7.00
$7.50
$8.00
5/2/20
05
5/16/2
005
5/30/2
005
6/13/2
005
6/27/2
005
7/11/2
005
7/25/2
005
8/8/20
05
8/22/2
005
9/5/20
05
9/19/2
005
10/3/
2005
10/17
/2005
10/31
/2005
11/14
/2005
11/28
/2005
12/12
/2005
$/bu
shel
Domestic demand for soybeans is expected to be robust this year, but slightly less than 2004/2005. Crush is expected to consume about 1.7 billion bushels, an increase of almost 1.5 percent. However, both exports and seed and residual are expected to be below year-ago levels. As of December 2005, the USDA is projecting an average U.S. soybean price for 2005/2006 of about $5.35 per bushel. This is almost 40 cents per bushel lower than 2004/2005, and slightly below Wisconsin average cash prices observed in late December 2005. A major predictor of soybean price activity in early 2006 will be crop progress in Brazil and Argentina. While
current projections are for increased production relative to year-ago levels, actual production in each of the last two years has fallen well short of early projections. Both current basis levels and futures prices suggest profitable soybean storage for Wisconsin producers in 2005/2006. But as is usually the case, soybean storage is much riskier than corn storage. If South American weather is favorable in the January/February period, soybean prices will have little upside potential. However, if early South American soybean projections prove optimistic, like the last couple of years, significant price improvement is possible.
28
Fruits and Vegetables Teryl Roper (608) 262-9751 A.J. Bussan (608) 262-35194
Synopsis Fruit and vegetable production provides important diversity to Wisconsin agriculture and has a substantial economic impact on the state’s economy. Apple production was up slightly from 2004. Spring frosts reduced production of tart cherries. Cranberry production was up slightly from 2004, but below forecast levels. Potato and snap bean production declined slightly from 2004. Sweet corn for processing was forecast to increase by about 20 percent. Apples USDA’s July 2005 apple production estimates showed Wisconsin production at 59 million pounds, an increase of 3 percent from 2004’s 57-million-pound crop. Orchard area remains constant at 6,000 acres. Tree density per acre has been increasing over time as growers replant orchards on full dwarfing rootstocks. Apple prices were expected to remain steady at an average of $0.39 per pound giving a farm-gate value of $23 million. Tart Cherries Spring frosts followed by cool weather reduced the tart cherry crop by about 4 percent compared to 2004. This is the
second year in a row that weather has reduced Wisconsin’s crop. For 2005 Wisconsin was forecast to produce about 2.6 percent of the nation’s tart cherries. The national decline in acreage has stabilized. A large Michigan crop suggests lower prices for 2005 — perhaps as much as 25 percent lower.
4 Teryl Roper is a professor and Extension fruit specialist and A.J. Bussan is an assistant professor and Extension vegetable specialist, Department of Horticulture, UW-Madison/Extension
Cranberries USDA forecast Wisconsin’s 2005 cranberry crop at 3.67 million barrels (one barrel = 100 pounds) in August. Grower observations indicate the crop will be short of this estimate, but slightly larger than 2004’s 3.3 million barrel output. Lower-than-expected production resulted from a hot dry summer that reduced berry size and also forced growers to irrigate more than normal. Wisconsin ranks first among states in cranberry production and will produce over 55 percent of the 2005 U.S. crop. Prices are expected to slightly top 2004’s average price of $34.70 per barrel. However, a warm September reduced fruit color and may dampen related color incentive payments. The August 31, 2005, U.S. cranberry inventory increased only marginally from 2004, suggesting that supply and demand are in reasonably good balance. This was a result of a slightly smaller crop in 2004 than 2003 and an emphasis on developing export markets for cranberry products. Currently the industry is targeting Germany, Japan, and Mexico.
29

August 31 Cranberry Inventory
0.0
0.5
1.0
1.5
2.0
2.5
3.0
3.5
4.0
4.5
1993 1994 1995 1996 1997 1998 1999 2000 2001 2002 2003 2004 2005
Mill
ion
Bar
rels
Source: Cranberry Marketing Committee
Potatoes USDA’s November estimate of 2005 potato production for Wisconsin was 29 million hundredweight on 71,000 acres. Planted acres increased by 1,000 from 2004. Yield per acre declined by 4.5 percent compared to 2004. The yield reduction was caused mainly by a very hot, dry summer. With a slightly smaller U.S. crop, potato prices will average higher than the 2004 price of $5.75 per hundredweight. Wisconsin 2005 fall potato prices were running about $1.00 per hundredweight above 2004 prices for the same month. Nationally, potato prices are expected to increase by about 18 percent and Wisconsin prices should reflect the national trend. If price forecasts hold,
this will be the first year since 2001 that potato prices have risen significantly. Potato prices have recovered in part due to a 60,000-acre reduction in planted acres in North America over the last year. U.S. per-capita consumption has steadily declined over the past several years leading to excess supplies. Potato growers have voluntarily reduced acres in response to poor prices. In addition, United Potato Growers of America and United Potato Growers of Wisconsin have organized acreage-reduction programs to help manage supply. Despite relatively strong prices in 2005, grower profitability has been constrained by higher costs. Current fertilizer cost estimates for the 2006 crop are more than 20 percent higher than last year. Fuel, labor, shipping, insurance, and
30
other costs are also higher compared to last year. Shipping is a growing concern. Limited trucking has affected the ability of the Wisconsin potato industry to deliver fresh product to end users. The condition was worsened by hurricane Katrina and the high demand for trucking created by that federal emergency. Sweet Corn Wisconsin sweet corn acreage was up 10 percent compared to 2004, but lower than 2003. Yield per acre was 7.05 tons, up 8 percent from 2004. Wisconsin ranks third nationally in sweet corn production for processing. Sweet corn is an important crop, not only to supply local canneries, but also as a major crop in rotation with potatoes. Wisconsin sweet corn acreage peaked in 1991 at 160,000 acres and, with the exception of 1994, has steadily declined since then. Over the same time, sweet corn production for processing has increased in Minnesota and Washington. Total acreage in Wisconsin, Minnesota, and Illinois combined tends to be steady year-to-year, but varies from state-to-state within the region. Total production in Wisconsin has remained relatively constant even though harvested acres have declined. The decline in sweet corn acreage is a result of several factors. Consolidation among processing companies led to the closing of many Wisconsin plants that specialized in processing sweet corn. Sweet corn production costs are higher in Wisconsin than in neighboring states, leading to a shift in acres from Wisconsin to Minnesota and Illinois. In
addition, in order to ensure more consistent yields and quality, sweet corn in Wisconsin is increasingly being shifted to more scarce irrigated fields. Early projections suggest 2006 acres will be constant or slightly lower due to larger carryover in 2005 and international market competition. Contracted sweet corn acres in 2006 will depend on inventories and national demand. International competition from Pacific Rim countries, especially Thailand, has dampened U.S. processed sweet corn exports and influenced acreage in Wisconsin and other North Central states. Contracted irrigated acreage may decrease substantially in 2006 unless contract prices increase to cover higher production and transportation costs resulting from the high cost of energy. With improved genetics and a shift of sweet corn production to irrigated acreage, Wisconsin yield per acre has increased since 1995. Warm summer conditions led to optimal sweet corn growth under irrigated conditions and contributed to high yields during 2005. But these same conditions also caused rapid ripening of sweet corn crops and bunching of harvest dates. Because of this bunching, a few Wisconsin sweet corn fields were not harvested. Season-average Wisconsin sweet corn prices (expressed in nominal terms) increased from less than $50/ton in 1980 to nearly $80/ton in 1996. Prices have fallen back from that high, ranging from $55-$70 since. With declining acreage, the value of the Wisconsin sweet corn crop has trended downward since 1991.
31

Wisconsin Sweet Corn for Processing: Harvested Acreage
0
20
40
60
80
100
120
140
160
180
1980
1981
1982
1983
1984
1985
1986
1987
1988
1989
1990
1991
1992
1993
1994
1995
1996
1997
1998
1999
2000
2001
2002
2003
2004
2005
1,00
0 A
cres
Source: National Agricultural Statistics Service, USDA
Wisconsin Sweet Corn for Processing:Yield per Acre and Total Production
0
200
400
600
800
1,000
1,200
1,400
1,600
1980
1981
1982
1983
1984
1985
1986
1987
1988
1989
1990
1991
1992
1993
1994
1995
1996
1997
1998
1999
2000
2001
2002
2003
2004
2005
Tot
al P
rodu
ctio
n (1
,000
tons
)
0
1
2
3
4
5
6
7
8
Yie
ld (T
ons p
er a
cre)
Yield
Production
Source: National Agricultural Statistics Service, USDA
32

Wisconsin Sweet Corn for Processing:Season-Average Price and Total Value of Production
0
10
20
30
40
50
60
70
80
90
1980
1981
1982
1983
1984
1985
1986
1987
1988
1989
1990
1991
1992
1993
1994
1995
1996
1997
1998
1999
2000
2001
2002
2003
2004
2005
Val
ue o
f Pro
duct
ion
($M
illio
n)
0
10
20
30
40
50
60
70
80
90
Seas
on A
vera
ge P
rice
($/T
on)
Price
Crop Value
Source: National Agricultural Statistics Service, USDA
Snap Beans Production of snap beans declined by 6 percent in 2005, to just under 300,000 tons. The reduced production was due to a 6-percent decline in acreage; yield per acre held steady at 4.4 tons per acre. Because of the presence of highly specialized processors in the state, Wisconsin snap bean production is fairly stable from year-to-year. As with sweet corn, contracted snap bean acreage is adjusted to accommodate changes in national inventories and demand. Also like sweet corn, Wisconsin snap bean
plantings are increasingly being contracted on irrigated acres. Warm summer temperatures led to optimal growth and rapid maturation of snap beans in 2005. Some bunching of harvest dates resulted from rapid growth and several fields were not harvested due to pods exceeding optimal size. Warm temperatures led to spider mite infestations in some fields. Viruses transmitted by soybean aphids may have further limited yields under conditions that would have otherwise resulted in yields above trend.
33

Farm Production Resources Bruce Jones (608) 265-8508
Fertilizer Since the production of a ton of anhydrous ammonia requires about 33,500 cubic feet of natural gas, anhydrous ammonia fertilizer prices are closely linked to the price of natural gas. Statistical relationships show that between 1984 and 2004, anhydrous ammonia prices have changed about $39 per ton for each $1 per thousand cubic foot change in the price of natural gas. Historic price data and forecasts published on the U.S. Department of Energy’s website show natural gas prices in the last half of 2005 and the first six months of 2006 that are 25–45 percent above year-earlier prices. This means that anhydrous ammonia prices will be correspondingly higher in 2006. Since natural gas prices are expected to be up $2 to $3 per 1,000 cubic feet, anhydrous prices are likely to be roughly $80 to $120 per ton higher in the 2006 crop year. It is possible that anhydrous ammonia prices could climb above $500 per ton in the spring of 2006. Since anhydrous ammonia is 82 percent nitrogen, this translates to a nitrogen price of about 31 cents per pound. The anhydrous-based value for nitrogen can be used to project the increase in prices for other nitrogen fertilizers in 2006. For example, a ton of fertilizer comprised of 28 percent nitrogen contains 560 pounds of nitrogen (28 percent of 2000 lbs/T). For a nitrogen value of 31 cents per pound, this 560 pounds of nitrogen is worth $173.60. Alternatively, the total value of the 560 pounds of nitrogen in a ton of
fertilizer would only be $123.70 if a pound of nitrogen is worth 22 cents. The $50.40 difference is the amount by which farmers would change their bids for the fertilizer if the value of nitrogen went from 22 cents a pound to 31 cents. The message here is that the cost of all nitrogen fertilizers will be affected by the steep rise in anhydrous ammonia prices.
U.S. Natural Gas Prices For Commercial Use
($ per Million Cubic Feet)
Sep ‘05 11.59 Oct 14.42 Nov 13.54 Dec 13.87
Jan ‘06 14.83 Feb 15.05 Mar 12.85 Apr 11.38 May 10.94 Jun 11.13 Jul 11.58
Aug 11.75 Sep 10.37 Oct 11.59 Nov 11.84 Dec 12.76
Source: Short Term Energy Outlook, Energy Information Administration (http://tonto.eia.doe.gov/STEO_Query/app/)
34
Prices for both potassium and phosphorus fertilizers could rise also, but for different reasons. Since potassium and phosphorus are mined, rather than manufactured, supplies of these two fertilizers are relatively unchanged. But demand is rising, due in part to increased usage of these fertilizers in China. This higher demand coupled with higher transport costs will put upward pressures on potassium and phosphorous prices in the coming year. Fuels Gasoline and diesel prices are highly correlated with crude oil prices. Price relationships estimated from monthly price data indicate that during the 1982–2004 period, every $1 increase in the per-barrel crude oil price brought a 2.73-cent increase in the wholesale price of a gallon of diesel fuel and a 2.66-cent increase in the wholesale price of a gallon of gasoline during the same month. Further analysis of these relationships suggest that the impact of crude oil prices on gasoline and diesel prices was greater in the first seven months of 2005 than for the 1982–2004 period. In 2005 the wholesale price of a gallon of gasoline rose 2.80 cents per $1 increase in the price of a barrel of crude oil while the wholesale price of diesel fuel increased 3.05 cents per gallon. It is unclear why changes in crude oil prices have had greater impacts on gas and diesel prices in 2005. Some critics of the oil industry believe that these firms have increased their mark-ups on wholesale prices for both gas and diesel. Others suggest that the higher pricing rates reflect changes in supplies and
demands for petroleum-based fuels. The changes in the relationships of gasoline and diesel prices and crude oil prices cannot be attributed to hurricanes in the Gulf, because the price data analyzed were generated before late August and early September, when Katrina and other hurricanes shut down Gulf Coast refineries. The U.S. Department of Energy is forecasting crude oil prices in the range of $58–$60 a barrel for most of 2006. This is mixed news. The good news is that crude oil prices will be relatively stable throughout most of 2006. The bad news is that crude oil prices will remain as high as they were the last half of 2005. This means gasoline and diesel prices are likely to be at or near their highs of the past year throughout most of 2006. Interest Rates The Open Market Committee of the Federal Reserve Board of Governors systematically increased the Federal funds rate from 2.25 percent at the beginning of 2005 to 4.25 percent on December 13.5 This 2-percentage-point hike came in increments of 25 basis points (1 percentage point equals 100 basis points). Steady, gradual interest-rate adjustments were intended to prevent an outbreak of inflation. To date it appears that this strategy has worked. Inflation has been held in check despite energy-related price shocks brought about by the hurricanes that shut down Gulf Coast gas and oil production.
5 The federal funds rate is the interest rate at which depository institutions lend balances at the Federal Reserve to other depository institutions overnight.
35
Higher interest rates will translate into higher repayment requirements on new loans and existing adjustable-rate loans. A 2-percentage-point hike in interest rates will boost the annual payment on a 30-year mortgage by about $1.60 for each $100 borrowed. Thus, a borrower with a $150,000 mortgage will pay about $2,400 more this year due to the 2005 interest-rate hike. Having raised interest rates more than 2 percentage points in the span of a year, the Federal Reserve Board is probably not inclined to push interest rates much higher in 2006. Inflation appears to be under control, and the U.S. economy needs some time to adjust to the sizeable increase in interest rates that occurred in 2005. Farmland Rent The Wisconsin Agricultural Statistics Service reports that in 2005, cash rents for Wisconsin cropland held constant at the 2004 average rate of $70 per acre. Cropland rents have risen at a very moderate rate since 2000. Stable cropland rents can be explained by the low returns that farmers have earned from corn, soybeans, alfalfa and other crops. Unlike land values, cropland rent is not driven by land speculation or residential demand. Consequently, cash rents bid by farmers will generally remain constant with constant cropping returns.
Economic theory suggests that crop yields should have a positive impact on cash rents; i.e., more productive land should command a higher rent. This hypothesis was tested by measuring the statistical relationship between rental value and corn yield for the 1967–2005 period for the states of Wisconsin, Illinois, Minnesota, Michigan, and Iowa. The results show that cash rents increase 3.0–3.5 percent for each 1-percent increase in average corn yield. Yield seemed to have the smallest effect on land rents in Michigan and Minnesota and the largest effect in Illinois. While the effect of yield on cash rents is similar across states, there are distinct differences in cash rents expressed per bushel of expected corn yield. In Illinois and Iowa, cash rents were equivalent to 80 to 90 cents per bushel of average corn yield (using a 5-year moving average). Cash rents were only 50 to 60 cents per bushel of average corn yield in Wisconsin, Minnesota, and Michigan. The lower rental rates (on the basis of expected corn yield) for the Great Lakes states make intuitive sense. In these states, a larger share of cropland is used for alfalfa, small grains, and other crops, which generate lower net returns than the corn and soybeans that dominate in Illinois and Iowa.
36
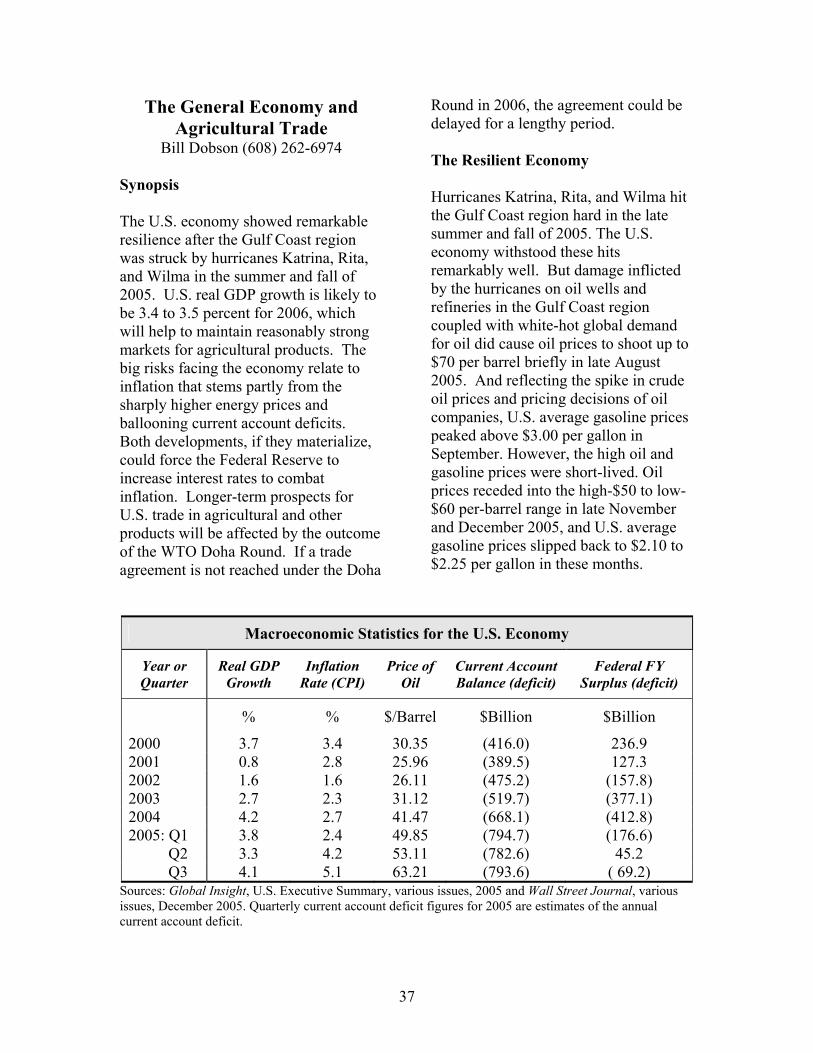
The General Economy and Agricultural Trade
Bill Dobson (608) 262-6974 Synopsis The U.S. economy showed remarkable resilience after the Gulf Coast region was struck by hurricanes Katrina, Rita, and Wilma in the summer and fall of 2005. U.S. real GDP growth is likely to be 3.4 to 3.5 percent for 2006, which will help to maintain reasonably strong markets for agricultural products. The big risks facing the economy relate to inflation that stems partly from the sharply higher energy prices and ballooning current account deficits. Both developments, if they materialize, could force the Federal Reserve to increase interest rates to combat inflation. Longer-term prospects for U.S. trade in agricultural and other products will be affected by the outcome of the WTO Doha Round. If a trade agreement is not reached under the Doha
Round in 2006, the agreement could be delayed for a lengthy period. The Resilient Economy Hurricanes Katrina, Rita, and Wilma hit the Gulf Coast region hard in the late summer and fall of 2005. The U.S. economy withstood these hits remarkably well. But damage inflicted by the hurricanes on oil wells and refineries in the Gulf Coast region coupled with white-hot global demand for oil did cause oil prices to shoot up to $70 per barrel briefly in late August 2005. And reflecting the spike in crude oil prices and pricing decisions of oil companies, U.S. average gasoline prices peaked above $3.00 per gallon in September. However, the high oil and gasoline prices were short-lived. Oil prices receded into the high-$50 to low-$60 per-barrel range in late November and December 2005, and U.S. average gasoline prices slipped back to $2.10 to $2.25 per gallon in these months.
Macroeconomic Statistics for the U.S. Economy
Year or Quarter
Real GDP Growth
Inflation Rate (CPI)
Price of Oil
Current Account Balance (deficit)
Federal FY Surplus (deficit)
% % $/Barrel $Billion $Billion
2000 3.7 3.4 30.35 (416.0) 236.9 2001 0.8 2.8 25.96 (389.5) 127.3 2002 1.6 1.6 26.11 (475.2) (157.8) 2003 2.7 2.3 31.12 (519.7) (377.1) 2004 4.2 2.7 41.47 (668.1) (412.8) 2005: Q1 3.8 2.4 49.85 (794.7) (176.6) Q2 3.3 4.2 53.11 (782.6) 45.2 Q3 4.1 5.1 63.21 (793.6) ( 69.2)
Sources: Global Insight, U.S. Executive Summary, various issues, 2005 and Wall Street Journal, various issues, December 2005. Quarterly current account deficit figures for 2005 are estimates of the annual current account deficit.
37
In the fourth quarter of 2005, growth of U.S. real Gross Domestic Product (GDP) will slow appreciably from the robust pace recorded during the first nine months of the year. However, real GDP growth will pick up substantially in early 2006 as rebuilding of the Gulf Coast accelerates. For 2006 as a whole, expect real GDP growth in the United States to average 3.4 to 3.5 percent. GDP growth in 2006 will be constrained by weaker consumer spending, traceable in part to the cooling of the U.S. housing market. While new home sales remained strong in October 2005, sales of existing homes fell by 2.7 percent in that month. Moreover, the inventory of unsold homes in October 2005 represented nearly a five-month supply at recent sales rates. Increases in the amount of equity in homes and low mortgage interest rates have encouraged home owners to refinance and cash out equity in recent years. Equity withdrawn from houses during refinancing has been an important source of consumer spending in the past few years. This source of funds for consumer spending will decrease in 2006. The domestic auto industry also will be a source of weakness in the economy in 2006 and 2007. General Motors and Ford both plan to shutter plants over the next couple of years. Many jobs were lost in New Orleans and other parts of the Gulf Coast region in the aftermath of the hurricanes. This was a disaster for those losing jobs, but U.S. unemployment rates have not shot up as a result of the hurricane damage. In particular, U.S. unemployment rates remained at 5.0 percent in both October and November 2005. These figures
differed little from the averages for mid-2005. Barring unforeseen developments, U.S. unemployment is likely to average 4.8 to 4.9 percent in 2006. Under likely scenarios, oil prices in 2006 will range in the high $50s to low $60s per barrel. If oil exploration and refinery construction proceed about as industry officials expect, then oil prices will decline into the high-$40 range by 2007. However, given the strength of global demand for oil — especially from China and India — even small supply disruptions will push oil prices above these ranges. Risks to the Forecasts There are downside risks to the forecasts. The most important of these relates to inflation. As noted in the statistics table, inflation during the second and third quarters of 2005 was higher than in recent years. This inflation was, of course, strongly connected to the run-up in oil, gasoline, and diesel fuel prices. Natural gas prices also increased sharply, which will increase consumers’ winter heating bills in late 2005 and 2006 and siphon money away from consumer spending on other items. Whether inflation will trigger draconian measures by the Federal Reserve depends heavily on the behavior of oil prices. If oil prices remain in the high-$50 to low-$60 per-barrel range, then the Federal Reserve will be able to push the federal funds interest rate up at a slow to moderate pace — probably to 4.75 percent in March 2006. However, if oil prices rise more than expected and energy prices become more fully embedded in other product prices, then
38
the Fed might find it necessary to raise the federal funds rate to over 6 percent to contain inflation. This action could depress U.S. real GDP growth to below 3 percent in late 2006 and to 1 to 2 percent in 2007. The current account deficit — mainly reflecting the excess of U.S. imports over exports — is a second major source of risk. For 2005, the current account deficit will be over 6.0 percent of GDP. Current account deficits of this size normally trigger a decline in the value of the dollar sufficient to shrink the deficit by making U.S. exports cheaper to foreign buyers. However, the dollar has risen in value relative to the Euro and the Yen in the past year, reflecting mainly the higher interest rates in the United States relative to the Euro-zone and Japan. At some future time, the dollar must adjust downward to reduce the current account deficit because foreigners will not be content to hold ever-increasing amounts of U.S.-dollar-denominated assets. If the dollar declines gradually, few problems will emerge. However, a collapse of the dollar would require the Federal Reserve to push up interest rates sharply to contain the inflation that would follow such a development. Federal budget deficits were headed lower during the first three quarters of 2005 (see statistics table). However, bigger deficits are in prospect for 2006 and 2007 partly because of the larger federal outlays that will be required to rebuild the Gulf Coast region, pay for new Medicare prescription drug benefits, and cover expenses associated with the Iraq war. The higher prospective deficits have implications for Federal Reserve
actions and will limit federal government spending. First, the budget deficits are financed partly by foreigners who may become skittish about holding more dollar-denominated assets. The Federal Reserve may need to push U.S. interest rates higher to entice them to hold the assets. Secondly, the higher deficits will constrain future federal expenditures for a host of other programs, including the 2007 Farm Bill. A third source of forecast risk involves the New Fed Chairman. President Bush appointed Ben Bernanke to replace Alan Greenspan as Chairman of the Federal Reserve effective February 2006. Bernanke has excellent academic credentials and has served as a Federal Reserve Bank Governor and as Chairman of President Bush’s Council of Economic Advisers. However, he lacks the private-sector finance experience that Greenspan brought to the Federal Reserve. And any person replacing Greenspan — who has near cult figure status as a result of his performance since being named Fed chairman in 1987 — will be regarded as a risk until he demonstrates that he can handle a financial crisis. In the absence of a crisis, expect Bernanke to operate the Fed much as Greenspan did. However, Bernanke is known to prefer monetary policy directed toward meeting inflation targets — generally of 1 to 2 percent per year for core inflation (excludes food and energy prices). Greenspan has eschewed inflation targeting, saying that such actions limit the Fed’s flexibility.
39

Trade Prospects U.S. trade prospects are not rosy. Economists at Global Insight forecast that the U.S. current account deficit will balloon to over $900 billion in 2006 and will remain above $800 billion from 2007 to 2010. The outsized deficits reflect the high cost of imported oil and a host of other developments, including changes in the U.S. agricultural trade balance. While the USDA forecasts U.S. agricultural exports of $63.5 billion for fiscal 2006, those exports will exceed imports by only about $2.5 billion. Thus, U.S. agriculture will no longer provide a large positive trade balance (often $25 billion or more a decade ago) to offset part of the negative trade balance produced by other U.S. sectors. Negotiations under the WTO Doha Round have important implications for U.S. agriculture. At the Hong Kong Trade Ministerial meetings in December 2005, trade ministers partially fleshed out an agreement that would spell an end to agricultural export subsidies by 2013. If the Doha Round is successfully completed, this action means an end to U.S. dairy export subsidies under the DEIP program and an end to the EU’s dairy export subsidies, which, at times, have sharply depressed prices in international dairy markets. The Hong Kong agreement also set an April 30, 2006, deadline for countries to work out formulas to reduce trade-distorting domestic support for agriculture and provide additional access for agricultural imports. While progress was made at the Hong Kong Ministerial, important agricultural and other trade issues remain to be resolved. And it will be essential for the
Doha Round negotiations to be completed by the end of 2006 so that the agreement can be ratified before mid-2007, when President Bush’s Trade Promotion Authority (fast-track negotiating authority) expires. Speedy action is needed because Congress is not likely to renew the President’s fast-track negotiating authority in the run-up to the 2008 Presidential and Congressional elections. If the President lacks fast-track negotiating authority — which requires a Congressional up-or-down vote and no tinkering with agreement provisions — other countries would likely refuse to ratify the Doha Agreement. This is because they would not know which provisions of the Doha Agreement would be accepted by Congress. It is uncertain whether a Doha Round agreement can be reached in 2006. A few analysts and policymakers suggest that the multilateral WTO negotiations are no longer a feasible way to carry out trade negotiations. Although multilateral negotiations under the WTO offer the greatest possibility for opening trade, the process is often slow and cumbersome. Former WTO Director General, Mike Moore of New Zealand, put it this way, “The WTO is like a car with one accelerator and 148 (now 149) handbrakes.” This difficulty of course explains in part the rash of bilateral trade agreements entered into by the United States and other countries in recent years. Old hands at negotiating point out that the WTO (previously GATT) negotiations always produce an agreement. This may be an excessively sanguine view of the outcome of the Doha Round. The Group of 20
40

developing countries led by Brazil and India (G-20) has made it clear that it will refuse to accept an agreement that fails to include substantially greater access to the EU and U.S. agricultural markets and fails to reduce the impact of trade-distorting EU and U.S. farm programs. A number of U.S. agricultural groups have made it clear that they believe that a bad agreement will be worse than no agreement. Hence, the seeds of a possible deadlock have been sown. Implications for the Wisconsin and U.S. Agricultural Sectors As in past years, the supply and demand conditions for individual farm products will influence agricultural prices more than the overall macroeconomic environment. However, the U.S. economy’s reasonably strong growth prospects (3.4 to 3.5 percent) for 2006 will maintain strength in markets for agricultural products. The partial opening of the Japanese market for U.S. beef (closed because of mad cow disease) will help to strengthen U.S. beef
prices, particularly if Japanese consumers readily accept the safety of the U.S. product. Grain prices in the Midwest in the fall of 2005 were negatively affected by the hurricanes which damaged the port of New Orleans, limited Mississippi River grain barge traffic, and backed up grain on farms and in country elevators in the Midwest. It is unclear how soon grain barge traffic will be restored to normal. An additional big negative, of course, is the high energy prices which affect many facets of farming. Natural gas prices, for example, in late 2005 were several times higher and much more volatile than in much of the 1990s. As pointed out elsewhere in this report, the price of nitrogen fertilizer in 2006 will be sharply higher than in recent years as a result of the high natural gas prices. Finally, the moderately higher interest rates in prospect for 2006 will have a negative impact on the interest-sensitive U.S. farm sector.
41

III. Special Articles
Women Farmers in Value-Added Agriculture
Carol J. Roth and Christa Lachenmayer Program on Agricultural Technology Studies (PATS)
Introduction Women farmers are an integral part of Wisconsin agriculture. The number of female primary operators on Wisconsin farms more than doubled between 1987 and 2002, consistent with national trends (see chart below). However, agricultural surveys, including the Census of Agriculture, have a tendency to under-represent the contribution of women by only identifying one primary operator within each farming operation. In 2004, the Wisconsin Value-Added Farm Poll, conducted by the Program on Agricultural Technology Studies, collected information on farmers disaggregated by gender so that the roles women play in the agricultural sector can be examined. Nationwide, slightly more than one in five farms with women as primary decision-makers are conventional farming operations (e.g., dairy, beef cattle).6 Nevertheless, the majority of women farmers tend to be involved in smaller, value-added enterprises. Results from a recent study in Wisconsin indicate that value-added agriculture is different than conventional agriculture with regard to even the most basic characteristics, such as farmer demographics, farm characteristics, and
quality of life.7 Women are a distinct group within the value-added sector.8 Knowing more about the makeup of value-added farmers, and women in particular, can help extension workers and policymakers design programs and policies to meet the needs of this growing population.
6 Census of Agriculture 2002.
Farmer Demographics Women farmers engaged in value-added agriculture often bring a different skill set than those involved in conventional enterprises. They typically have more formal education, with about half having earned at least a four-year degree. Oftentimes, their education is not related to agriculture. In addition, many do not have extensive on-farm experience. More than two-thirds have no farming background, and only about one in four have parents who were involved in farming. Women farm operators are relatively new to the farming business,
7 In 2004, the Program on Agricultural Technology Studies (PATS) conducted a mail survey (2004 Wisconsin Value-Added Farm Poll) of 2,000 randomly selected farmers from a compiled list of 6,700 value-added producers. Useable responses were obtained from 45 percent of those surveyed. 8Throughout the literature, value-added is defined in multiple ways. For the purpose of this article, value-added agriculture is used to describe a wide range of farmers who use specific production, marketing, or processing practices to add value to their farm products.
42
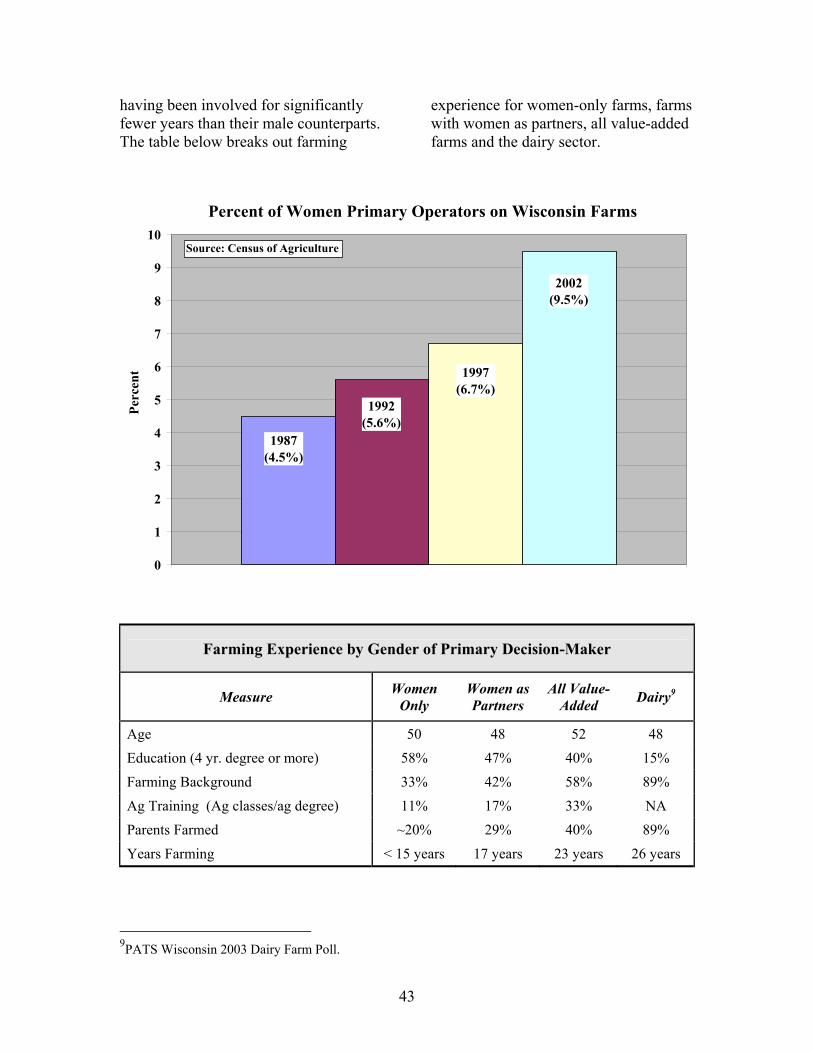
having been involved for significantly fewer years than their male counterparts. The table below breaks out farming
experience for women-only farms, farms with women as partners, all value-added farms and the dairy sector.
Percent of Women Primary Operators on Wisconsin Farms
1987(4.5%)
1992(5.6%)
1997(6.7%)
2002(9.5%)
0
1
2
3
4
5
6
7
8
9
10
Perc
ent
Source: Census of Agriculture
Farming Experience by Gender of Primary Decision-Maker
Measure Women Only
Women as Partners
All Value-Added Dairy9
Age 50 48 52 48 Education (4 yr. degree or more) 58% 47% 40% 15% Farming Background 33% 42% 58% 89% Ag Training (Ag classes/ag degree) 11% 17% 33% NA Parents Farmed ~20% 29% 40% 89% Years Farming < 15 years 17 years 23 years 26 years
43
9PATS Wisconsin 2003 Dairy Farm Poll.
Value-Added Farm Characteristics and Gender Differences Value-added farms differ from conventional farms in several ways. Like other Wisconsin farms, most value-added enterprises are sole proprietorships. Other types of business structures, such as partnerships or limited-liability corporations are present, but much less prevalent among value-added farms. Farm Size. As might be expected from the nature of the enterprises, farms producing value-added products are usually smaller in acreage than conventional farms. Value-added farms, where at least half of the owners/operators are women, have fewer than 100 acres. When women are the sole decision-makers, the farm often has less than 50 acres10. In comparison, a 2003 study of Wisconsin dairy farms reported that the average dairy farm had more than 300 acres.11 Type of Enterprise. Value-added farms typically produce a wide range of commodities. Types of enterprises range from fruits and vegetables to pastured poultry, sheep and goat milk or cheese, and non-dairy livestock. Women farmers engaged in value-added enterprises are most likely to raise vegetables and non-dairy livestock. Vegetable production has the advantage of requiring less acreage, maintenance, and capital investment than other
enterprises. And, unlike fruit production, which may not yield a first crop for several years, vegetable operations provide a relatively rapid return on investment. An appeal of non-dairy livestock, such as poultry, sheep and goats, is that the animals are smaller and easier to manage.
10 PATS 2004 Wisconsin Value-Added Farm Poll 11 In 2003, the Program on Agricultural Technology Studies (PATS) conducted a mail survey of more than 700 dairy farms randomly chosen from the state’s dairy producer list.
Production Practices. As shown in the chart below, most value-added farmers use conventional production practices. This means that they garner higher prices through other means, such as marketing or processing. Those that don’t use conventional production practices are most likely to employ organic practices and grass- or pasture-feeding. In terms of production practices, women farmers are similar to the value-added sector as a whole, except that they are more likely to use organic practices. Marketing Practices. Women in value-added agriculture market their products through a variety of channels. Like all farmers in the value-added sector, women operators prefer venues that allow them to have direct contact with their customers. As shown in the chart below, on-farm sales and farmers’ markets are the two venues used predominantly by value-added farmers. Women-only value-added farmers prefer these venues as well. In addition, women’s farms tend to use CSAs (Community Supported Agriculture) more than others in the sector.
44

Value-Added Production Practices in Wisconsin
59
42
31
24
23
27
4
0 10 20 30 40 50 60 7
Conventional
Organic
Grass/Pasture-Fed
Sustainable
Hormone/Antibiotic-Free
Integrated Pest Mgt.
Biodynamic
Percent
0
Based on 2004 survey data updated to 2005
Marketing Strategies Used by Wisconsin Value-Added Farmers, 2004
22
18
53
8
15
18
18
31
58
18
7
0 10 20 30 40 50 60
Grocery Store
Restaurant
Farmers' Market
CSA
Internet Sales
Natural/Spec. Food Store
U-Pick
Wholesale
On-Farm
Home Delivery
Auction
Percent
70
45

Business Characteristics. In terms of income generated, value-added farms tend to occupy the extreme ends of the scale. Many value-added farms do not generate enough income to support the farm household, others earn well over $100,000 per year, but few are found in between. Median farm revenues for value-added farms are approximately $17,000. Total sales from farm operations are significantly less on farms where women are the sole managers. In these cases, median total sales are approximately $6,000. Low revenues make off-farm work a necessity. For many value-added farms, off-farm work provides more than 50 percent of the household income. The net annual household income for women value-
added farmers ranges from $30,000 to $40,000. Obviously, these women are generating significant income outside the farming operation. In addition to income, off-farm work also provides essential benefits such as health insurance. Working off-farm to obtain benefits has become commonplace on all Wisconsin farms. Quality of Life In general, overall satisfaction with the quality of life is higher on value-added farms than on (conventional) dairy farms. Noteworthy in the chart below is that women indicated a higher level of satisfaction when more partners were involved in the value-added operation.
Overall Level of Satisfaction with Quality of Life
21
2
2
3
36
18
23
30
43
80
76
67
0% 10% 20% 30% 40% 50% 60% 70% 80% 90% 100%
All Dairy
All Value-Added
Women as Partners
Women Only
Dissatisfied or Very Dissatisfied Neutral Satisfied or Very Satisfied
46

Conclusions By looking more closely at the roles of women in value-added agriculture, several lessons have been learned: • Women are involved in all sectors of
agriculture, but are more broadly represented as primary decision-makers in value-added enterprises.
• Women enter value-added
agriculture with a different skill set than what has been documented in conventional agriculture. The principal contrasts are related to education, farming background and experiences, farm size, income and off-farm work.
• Women in agriculture, specifically
value-added agriculture, present new opportunities for university outreach programs and research.
While the farms associated with women in value-added agriculture may be small in terms of acreage and income, they
provide specialized agricultural products to a growing customer base. Their marketing techniques provide a more direct contact between consumers and Wisconsin farmers. This research will provide a baseline for the study of the development of the value-added sector in Wisconsin, with respect to women in particular. In addition to perceiving a higher quality of life, value-added farmers seem to expect to be farming for a longer period of time. As we continue to see a decline in the number of dairy farms in the state, the long-term view of value-added farm operators could be crucial in moderating that loss and strengthening Wisconsin agriculture. Editor’s Note: Carol Roth is an Outreach Specialist and Christa Lachenmayer is a Graduate Assistant with the Program on Agricultural Technology Studies, University of Wisconsin-Madison/Extension.
47

Organic Farming in Wisconsin: Fad Forecast to Fade or Fundamental Feature of the Food System?
Jeremy Foltz (PATS) and Michelle Miller (CIAS) Introduction Organic food is the fastest growing part of the consumer food market, with especially rapid growth in produce and dairy products. Although it still represents only 1–2 percent of the overall consumer market and growth rates have recently shown some leveling off, some environmentalists and food gurus have labeled organic food as the future of the U.S. food system. Other observers have expressed skepticism about the organic movement’s ability to fundamentally change farm production or consumer eating habits. How has this growth in consumer interest in organic food affected Wisconsin agriculture? Where does organic agriculture fit in the food system of Wisconsin? And what role does Wisconsin play in the growth of organic agriculture? Using data from the USDA and recent surveys conducted by the Program on Agricultural Technology Studies (PATS) and the Center for Integrated Agriculture Systems (CIAS) at the University of Wisconsin-Madison, this report seeks to shed some light on the importance of organic agriculture in Wisconsin. As outlined below, Wisconsin is a major player in the organic industry, although organic agriculture continues to play a minor role in the state’s overall agricultural production profile. The state is home to the nation’s largest organic cooperative, Organic Valley, and is a leader in production of a number of organic commodities. Wisconsin
Governor Jim Doyle recognized the potential of the organic industry to build and sustain Wisconsin’s economy in his 2003 Grow Wisconsin report. Later, Governor Doyle convened a group to discuss the status and future of organic farming and food systems in Wisconsin. It is a part of agriculture in Wisconsin that is attracting considerable notice and deserving of analysis. Farm Numbers, Acres, and Livestock Counting organic farms is complicated by varying definitions of “organic.” There are official certifications of organic farms, which are necessary to bear the USDA organic label. But farms that sell only to local farmers’ markets or other informal outlets sometimes adhere to the organic rules and advertise their output as organic without going through the official certification process. In 2003 the USDA estimated that there were 659 certified organic farms in Wisconsin.12 Estimates from PATS surveys in 2004 suggest that there approximately 880 organic farms, although this number counts some farms that sell their goods as organic, but are not officially certified.
12 The Economic Research Service of USDA collects data from state certification groups to document the extent of certified organic production by state. These data are available at the following web site: http://www.ers.usda.gov/Data/Organic/#tables
48

The number of organic farms in the state is growing rapidly, with USDA estimating a 41 percent growth in farm numbers from 2001–2003. Data from a 2005 CIAS telephone survey of the primary organic certifiers operating in Wisconsin indicated that the number of certified operations has increased by 25 percent over the 2003 USDA numbers. Yet these numbers still imply that organic farms represent slightly more than 1 percent of all farms in the state. Despite being small relative to all of agriculture in Wisconsin, the organic
industry in this state is relatively prominent within the national organic industry. Wisconsin has the second-largest number of organic farms. Wisconsin continues to be ranked first in the nation in total organic livestock, and first in the number of milk cows (one third of U.S. organic milk cows are in Wisconsin). The number of poultry in Wisconsin increased dramatically since USDA’s 2001 survey, placing the state first in layer hens after an increase of over 2,000 percent. The number of organic turkeys fell by 35 percent to just over 5,200.
Certified Organic Crop Acreage in Wisconsin and US, 2003
Wisconsin Values:
Wisconsin U.S. % of U.S.
Rank among States
% change, 2001-2003
No. of certified operations 659 8,035 8% 2 41%Cropland acres 91,906 1,451,601 6% 5 16%Pasture and rangeland acres 28,737 745,273 4% 8 130%Total organic acres 120,643 2,196,874 5% 7 32%Source: Economic Research Service, USDA
Certified Organic Livestock in Wisconsin and US, 2003
Number of Animals Wisconsin Values
Wisconsin U.S. % of US Rank
among States
% change, 2001-2003
Beef cows 1,807 27,285 7% 3 54% Milk cows 24,884 74,435 33% 1 130% Hogs & pigs 232 6,564 4% 5 33% Sheep & lambs ND 4,561 ND ND Total livestock 28,103 124,346 23% 1 125% Layer hens 342,122 1,591,181 22% 1 2,081% Broilers 132,959 6,301,014 2% 6 417% Turkeys 5,248 217,353 2% 5 -35% Total poultry 569,429 8,780,152 6% 4 1,051% Source Economic Research Service, USDA. ND = Not Disclosed
49
In terms of crops, Wisconsin supplies a significant amount of many organic products for the nation. Wisconsin growers supply 10 percent or more of the U.S. total for organic field crops including corn (18 percent), oats (16 percent), barley (12 percent), sorghum (10 percent), and rye (15 percent); soybeans (10 percent); alfalfa hay (15 percent); and cultivated and wild mushrooms (28 percent). The certified acres in crop production continue to increase for several crops over the past few years. Between 1997 and 2003, both soybean and pasture and hay acreage increased by over 1,000 percent, with soybean acreage increasing to 12,211 acres and pasture and hay to 28,700 acres. Dry peas and lentils acreage increased by 150 percent, and sorghum acreage by more than 1,000 percent to 409 acres. The certified acreage in vegetables increased by 115 percent to 1,237 acres. Certified acreage of other crops decreased — apples, for example, dropped from 90 to 25 acres. This demonstrates the small size of the organic industry, as the production choices of one or two farmers can dramatically affect acreage of a particular crop. Regional Distribution The CIAS data on organic farms was used to produce the map below showing the distribution by county of organic farms across Wisconsin. The greatest concentration of organic farms in Wisconsin is in the southwest quadrant of the state, with Vernon County having the largest number of certified operations (113). Monroe County has the next highest number with 33 certified
farms. The counties with the fewest organic operations are across the northern tier and along the eastern side of the state. Economic Importance of Organic Farming in Wisconsin Organic farming involves a number of restrictions on farming techniques that can raise the cost of production over conventional farming. But organic farmers are usually compensated for these added costs by receiving higher prices for their output. The table below presents evidence from two PATS surveys on the economic importance of organic farms in Wisconsin.13 They show reasonable average revenues for small farms: the average for non-dairy organic farms is $41,000, while the average for dairy farms is $150,000. Most of the dairy farms fall in the same revenue and profit ranges. However, this average masks what are very low revenues for the majority of non-dairy organic farms. Half of the non-dairy organic farms generate less than $11,000 in revenues and half show less than $7,100 in farm profits. This suggests that a large number of the organic farms are not currently able to support an average-size family on their own. The PATS data suggest that many organic farm families use off-farm work as a way to supplement their earnings.
13 Note the PATS surveys count both certified organic as well as farms that self-describe as organic without official certification. Thus the total estimates of the number of farms in table 3 are slightly above the USDA and CIAS estimates.
50

Wisconsin Certified Organic farms by County, 2005
Source: Center for Integrated Agricultural Systems, UW-Madison
Economic Features of Wisconsin Organic Farms
Number of Farms
Average Gross
Revenue
Average Net Farm Income
Full-time (non-family) Employees per farm
% of work done by family
Non-Dairy Organica ~700 $41,000 $22,486 0.44 87%
Organic Dairyb ~180 $150,000 $55,875 0.35 ~100%Sources: a.) PATS 2004 Value Added Survey (includes non-certified organic) and b.) PATS 2004 Organic Dairy Farm poll.
51

Organic farms in Wisconsin are almost exclusively small, family-run operations. In terms of employment, operators of organic farms in Wisconsin do the vast majority of the farm work and hire relatively few full-time workers. This implies that organic farms likely have a very minor impact on employment in Wisconsin . The Future of Organic Farming Organic agriculture in Wisconsin is clearly more than a passing fad that will soon fade. It is taking on an expanding role in the state’s farm economy. At the same time, it remains, for the moment, a minor part of overall production. The number of organic milk cows in Wisconsin is only 2 percent of the state’s total, while the number of certified farms and total certified acreage are each less
than 1 percent of the state’s total. Furthermore, the economic contribution of organic agriculture is also less than 1 percent of Wisconsin’s total market value of agricultural products sold. Organic agriculture in Wisconsin seems likely to continue to grow at the same rapid pace and increase its share of state agricultural production. Even with that rapid growth, organic agriculture will likely remain a minor part of the overall food system in Wisconsin for some time to come. Editor’s note: Michelle Miller is Coordinator, Pesticide Use and Risk Reduction Project, Center for Integrated Agricultural Systems, University of Wisconsin-Madison.
52
A New Wisconsin Cooperative Law: What’s All the Fuss? Kimberly Zeuli
The Context The decade of the 1990s ushered in an era of new cooperative structures and a revival of farmer interest in cooperatives. This trend was especially pronounced in the Upper Midwest, where over 50 so-called “New Generation” cooperatives were established during that decade. This previously obscure cooperative structure quickly gained popularity among farmers interested in creating value-added agribusinesses across the United States. Strict delivery contracts replaced uncertain and variable member supply, allowing cooperative processing firms to operate at optimal capacity and procure more profitable wholesale contracts. Members could also trade their membership stake in the cooperative. This motivated farmer investment, especially among younger producers who were unhappy with the long-term equity investment requirements typical of traditional cooperatives. They wanted their equity returned on demand as well as the chance to gain a profit on their cooperative investment that the New Generation Cooperative (NGC) model provided. When the NGC structure started to take hold, some cooperative scholars and leaders voiced their disapproval. They argued that NGCs were not true cooperatives, since they violated the fundamental cooperative principle of open membership, and they were also not compatible with the cooperative culture of social and community responsibility. Specifically, NGCs:
(1) aggressively pursued the same profit-maximization objectives as investor-owned firms (and hired qualified managers to ensure this happened); (2) closed their cooperatives to new members once the pre-determined “optimal” commodity quota was met; and (3) required significant up-front equity investments from members, preventing the farmers who needed cooperatives the most from joining. Whether or not NGCs met the strictest definition of a cooperative, the new structure did not violate any state or federal cooperative statutes. In fact, NGCs incorporated many traditional cooperative principals, such as one-member, one-vote, proportionality of investment, and no external (non-member) investors. The NGC’s delivery right mechanism ensures that all membership equity is held by farmers and that their investment is proportional to their patronage. Given their initial success and popularity, it is not surprising that the NGCs heralded another cooperative innovation in the early 2000’s — the Wyoming or Patron-Investor Cooperative (PIC) model. This model addressed the issue of access to sufficient capital, one of the constraints of both the traditional and the NGC models. The remainder of this article provides a brief history and overview of the new PIC model as well as a summary of the main points of the controversy that it has generated.
53
The Patron-Investor Cooperative Model On April 15, 2005, a new cooperative state statute (bill AB327) was introduced in the Wisconsin assembly for consideration.14 This statute would legalize a new type of cooperative, an unincorporated cooperative association based on the PIC model that was first ratified in Wyoming in 2001. Currently, Wisconsin cooperatives must be incorporated under Chapter 185, the existing cooperative state statute. The new law does not replace Chapter 185, but authorizes an alternative cooperative business model. The legal basis for the PIC model is the Wyoming Processing Cooperative Law, which was drafted in response to a group of Wyoming lamb producers interested in forming a New Generation lamb-processing cooperative. The producers were not satisfied with some of the constraints of the NGC model, particularly the inability of the cooperative to obtain equity from non-member investors and from members who wanted to invest more capital than their patronage share allowed (Hanson). In 1999, this group sought legal counsel to draft the new Wyoming cooperative statute and create the PIC model. Legislation authorizing PICs was subsequently adopted in Minnesota in 2003 (Chapter 308B), in Tennessee (Chapter 534) and in Iowa (Chapter 501A) in 2005. Although the statutes
differ somewhat across states, they all describe the basic elements of the PIC model, a hybrid business structure that combines characteristics of the traditional cooperative with those of a limited liability company (LLC).
14 The new cooperative statutes in Minnesota and Wisconsin were championed by the Wisconsin Federation of Cooperatives. Wisconsin Legislative Folio. AB 327, 2005 Legislative History of Proposals. http://folio.legis.state.wi.us/ (May 6, 2005).
There are two different membership classes in a PIC: (1) Patron members are traditional co-op members who supply commodities to or purchase products from the cooperative and invest equity capital. (2) Investor members supply capital, but have no patronage requirements.15 In traditional cooperatives, external equity is allowed (e.g., through preferred stock), but the investors cannot have any voting rights in the cooperative. As with most traditional cooperatives and NGCs, a PIC is governed by a board of directors with members comprising the majority of directors.16 In a PIC, both patron and investor members can be elected to the board of directors. However, the board must include at least one director elected exclusively by the patron members and at least 50 percent of the voting power of the board (51 percent under the proposed Wisconsin law) must be allocated to directors elected by the patron members (Hanson). Patron and investor members in a PIC may have the same voting rights (i.e., one-member, one-vote), or more complex voting rights may be defined in the cooperative bylaws or by state law.
15 States differ in how much of the membership equity investor members can supply — the Minnesota law allows up to 99.99 percent (Hensley and Swanson). 16 Under Chapter 185, only active members can serve on Wisconsin cooperative boards.
54

Under Wisconsin’s Chapter 185, cooperatives are required to adopt one-member, one-vote policies. However, cooperatives in other states can (and some do) allow proportional voting, granting members voting shares based on their patronage. In contrast, a PIC could grant voting shares based on investment, like an investor-owned firm, rather than patronage. However, the PIC state statutes do not require investor members to be afforded the right to vote and bylaws could be written to deny them voting rights. Further, the state laws mandate that patron members’ votes are counted collectively based on the majority (Hanson). For example, assume patron members possess 60 of the total 100 voting rights. If a majority, say 40, vote in favor of a proposal, 60 votes are actually counted as favoring the proposal. In traditional cooperatives and NGCs, the board of directors divides annual net profits between unallocated equity, which the cooperative keeps, and patronage refunds, which are distributed to its membership based on use. Some traditional cooperatives also distribute dividends to members, a share of net profits based on their investment.17 In a PIC, the share of net profits distributed to members includes patronage refunds and dividends. More specifically, the net profits allocated to patron members will be based on their patronage, while those allocated to investor members will be based on their investment. The PIC statutes require that, as a group, patron members must receive at least 15 percent
of the profits allocated to members; in the proposed Wisconsin statute, this limit is set at 30-51 percent (Hanson). In traditional cooperatives and NGCs, dividends are limited by federal and state statutes to 8 percent per year; PICs do not have any dividend constraints.
17 Note this is redundant in NGCs, since each member’s patronage share is equal to their investment share.
The PIC Controversy The PIC constitutes the first major change in the cooperative model since it was formally established in Rochdale, England in 1844. Consequently, it is not surprising that the new model has generated intense controversy in Wisconsin and elsewhere. The debate centers around three main issues: negative image for cooperatives, loss of producer control, and unnecessary legislative effort. As with the NGC model, some cooperative leaders and scholars have charged that the PIC is not a “true” cooperative, and therefore, it weakens the status and image of traditional cooperatives. Some are fighting to maintain what they consider the integrity of the cooperative business model as defined by the Rochdale principles. Others are more concerned about the political backlash that could result from a diminishing discernible difference between cooperatives and other types of business structures — why should cooperatives continue to receive favorable public policy treatment if they are no different from other businesses? This group believes that the anti-trust exemptions (most notably Capper-Volstead), the special tax provisions, the exclusive government-sponsored credit programs, and the federal funding for cooperative research and extension are all at risk. Some have also voiced
55

concern about weakening the cooperative “brand” that consumers have come to trust and value (Torgerson). Those supporting the PIC model argue that cooperatives are competitive businesses, not a social movement, and no longer need government support. They remind their opposition that the Capper-Volstead Act does not even mention the term, “cooperative,” and provides anti-trust exemption to a limited set of cooperatives (those owned by agricultural producers and that process, market, or handle agricultural goods). The PIC model (as defined by state statutes) does not meet the requirements of the Capper-Volstead act, the Agricultural Marketing Act of 1929, or a host of other “minor” laws that benefit cooperatives (Frederick). Also, it does not meet the exemption requirements for registration under the 1933 Securities Act and the eligibility requirements to receive loans from CoBank (although it is eligible for financing from Farm Credit Associations). In practice, however, PICs may incorporate traditional co-op characteristics that would qualify them for these benefits. State PIC laws only dictate what the cooperatives are permitted to do, not what they will actually implement through their bylaws. Moreover, PIC proponents believe that any loss of government protection or benefits is outweighed by the PIC’s ability to attract external investors such as venture capital companies. Without an expanded pool of capital, they reason, more cooperatives will fail, convert to investor-owned firms, or never get started in the first place. They point to
the fact that in most states, including Wisconsin, the number of new agricultural LLCs started in the past decade far exceeds the number of new cooperatives. According to the president of the Wisconsin Federation of Cooperatives, “The alternative to [the new Wisconsin cooperative statute] is not having any cooperatives at all” (Stein). The second major criticism of the PIC model stems from the fear that, despite safeguards, investor-members will be able to wrest control of the cooperative away from the patron members. If this happens, many of the advantages of the cooperative model could be lost. For example, profit-motivated outside investors would be unwilling to provide critical but unprofitable services in rural communities. Likewise, they may refuse to provide a stable market for patron-members if doing so diminishes cooperative profits. Non-patron investors, PIC opponents warn, will simply turn cooperatives into investor-owned firms. Even if this doesn’t happen, as the former Director of USDA’s Cooperative Services cautions, “the fundamental weakness of mixing ownership interests between member patrons and outside investors boils down to whose interests are being served…it is difficult to serve two masters” (Torgerson, p. 6). PIC proponents maintain that the patron-member governance safeguards included in the state statutes will ensure that patron-members maintain substantial control over their cooperatives. They do not believe that farmers will be easily “outsmarted” by the investor-members who may have less experience with cooperative leadership and
56
agribusinesses. The control of the cooperative will ultimately depend on the relative bargaining power of each group, which should give patron-members greater incentive to become active leaders in their cooperative. Further, all cooperatives, like all corporations, are at risk of having a weak board controlled by management whose interests are contrary to member interests. In addition, the PIC structure encourages community investment — it could be adopted in rural communities whose non-farmer citizens want to invest in value-added businesses to promote community development. In the end, the critics ask, why create this new business model when the LLC already exists and serves the same purpose? Isn’t it a waste of legislative effort that puts all existing cooperatives at risk for no real gain? The PIC proponents answer with their belief that laws and business models must be dynamic in order to reflect dynamic business environments. Legislative effort is inherently good, not bad, as is any debate about existing businesses. Conclusion Although the state legislation that would legalize the PIC model in Wisconsin is still under consideration, there are already PICs in the state.18 Farm groups interested in adopting this new model can already do so by registering in a state with PIC-enabling legislation.
18 For example, Landmark Services Cooperative, a joint venture between Cottage Grove Cooperative and Union Cooperative created in 2001, registered as a PIC in Wyoming. These cooperatives have since merged and are incorporated under Chapter 185 in Wisconsin.
This makes the debate over the introduction of this new law in Wisconsin somewhat irrelevant. A more productive endeavor for cooperative scholars, leaders, and members may be to consider the merits of the PIC model in general and its potential repercussions for all cooperatives. Are the costs of tapping new pools of capital too high for cooperatives or are they (however unfortunately) simply the costs of doing business in today’s competitive environment? Hopefully, the introduction of the PIC model in the U.S. will continue to challenge conventional thinking about cooperatives and spur additional business model innovation. References Frederick, D. “Is this really a ‘cooperative’ law?” The Cooperative Accountant. Summer 2002: 36-39. Hanson, M. “A new cooperative structure for the 21st century: the Wyoming processing cooperative law.” The Cooperative Accountant. Summer 2001: 3-9. Hensley, R. and D. Swanson. “Minnesota Legislature Adopts New Cooperative Associations Act: Co-ops Should Carefully Review Options to Avoid Pitfalls.” News Alert. May 2003. Stein, Jason. “Bill May Boost Business for Co-ops.” Wisconsin State Journal. April 11, 2005. Torgerson, R. “New Statutes Throw out the Baby with the Bathwater.” Cooperative Business Journal. March/April 2005.
57


![1RQSUR¿W 2UJDQL]DWLRQ U.S. POSTAGE PAID...2 Wisconsin 2014 Agricultural Statistics Wisconsin Agriculture and Economics Wisconsin farm production expenditures totaled $11.4 billion](https://img.dokumen.tips/doc/110x75/5faa1ba6f49c0b78ad785828/1rqsurw-2ujdqldwlrq-us-postage-paid-2-wisconsin-2014-agricultural-statistics.jpg)