Embed Size (px)
Citation preview

Status of the energycalibration
Jürgen Knödlseder & Enrica CisanaCESR (Toulouse) / IASF (Milano)
Co-I meeting january 2004
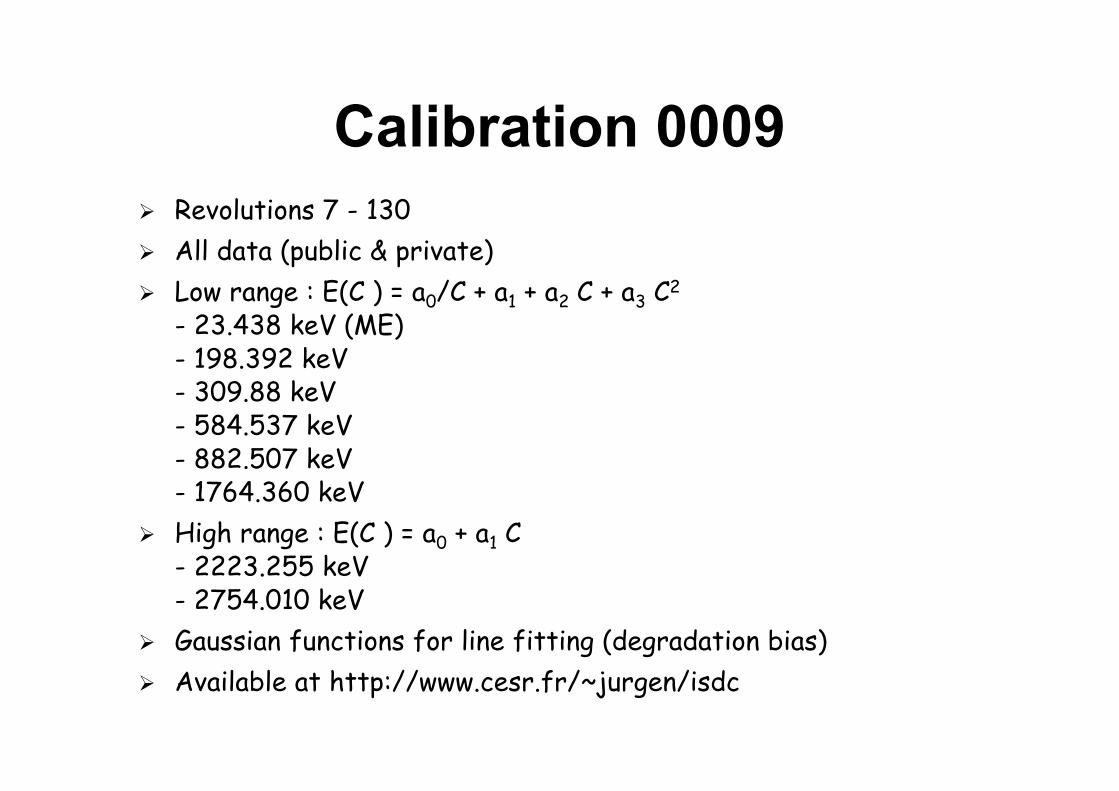
Calibration 0009ÿ Revolutions 7 - 130ÿ All data (public & private)ÿ Low range : E(C ) = a0/C + a1 + a2 C + a3 C2
- 23.438 keV (ME)- 198.392 keV- 309.88 keV- 584.537 keV- 882.507 keV- 1764.360 keV
ÿ High range : E(C ) = a0 + a1 C- 2223.255 keV- 2754.010 keV
ÿ Gaussian functions for line fitting (degradation bias)ÿ Available at http://www.cesr.fr/~jurgen/isdc

Calibration lines

Calibration lines

Calibration lines

Calibration lines

Calibration lines

Calibration lines

Calibration lines

Other background lines

Other background lines

Other background lines

Conclusionsÿ Validated over 140 - 2750 keV rangeÿ Few revolutions with bad calibration
- early mission (Rev. 7, 10)- annealing (Rev. 40, 42, 96)- solar flare (Rev. 129)
ÿ Relative accuracy : ~ 0.01 - 0.02 keVÿ Absolute accuracy : ~ 0.1 keV (worst around 400 keV)
198 keV : DME2 = 0.15 keV DME3 = 0.3 keV309 keV : DME2 = 0.25 keV DME3 = 0.5 keV584 keV : DME2 = 0.1 keV DME3 = 0.3 keV883 keV : DME2 = 0.05 keV DME3 = 0.15 keV1764 keV : DME2 = 0.05 keV DME3 = 0.1 keV2223 keV : DME2 = 0.05 keV DME3 = 0.1 keV2754 keV : DME2 = 0.0 keV DME3 = 0.1 keV
ÿ Degradation bias (in particular for ME)584 keV : DME2 = 0.05 keV883 keV : DME2 = 0.1 keV1764 keV : DME2 = 0.2 keV2223 keV : DME2 = 0.3 keV

Degradationcorrections
Jürgen KnödlsederCESR (Toulouse)
Co-I meeting january 2004

Principle
ÿ Adjust degradation between data and background modelÿ If data is more degraded than background :
- degrade background (convolution with exponential function)- shift background (positive)- optionally smooth data with Gaussian function (re-sampling)
ÿ If data is less degraded than background- degrade data (re-sampling using exponential function)- shift background (negative)- optionally smooth background with Gaussian function
ÿ Adjust «!globally!» or «!per detector!» by optimising Chi-squarestatistics over a specific energy window containing one orseveral instrumental background lines
ÿ Choice of energy window / background lines ?

1809 keV analysis
ÿ 1764 keV line- 1764.36 ± 0.04 keV 205Bi(EC)205Pb, T1/2 = 15.31 d- 1764.494 ± 0.014 keV 214Bi(b-)214Po, T1/2 = 19.9 minline narrow (lies on lower envelope of fitted instrumental linewidths) 214Bi component is probably negligible
ÿ 1779 keV line- 1775.79 ± 0.04 keV 205Bi(EC)205Pb, T1/2 = 15.31 d- 1778.969 ± 0.012 keV 28Al(b-)28Si, T1/2 = 2.2412 minline blend (90% 205Bi, 10% 28Al) with components that showdifferent time variabilities

1809 keV analysis : original data

1809 keV analysis : 1758 - 1790 keV

1809 keV analysis : 1772 - 1790 keV

1809 keV analysis : 1758 - 1770 keV

1809 keV analysis : 1758 - 1770 keV (global)

1173 keV analysis
ÿ 1106 keV line (blend)- 1107.01 ± 0.06 keV 69Ge(EC)69Ga, T1/2 = 39.05 h- 1108.2 keV 69Ge(EC)69Ga + L, T1/2 = 39.05 hcommon time variability
ÿ 1118 keV line (blend)- 1115.546 ± 0.004 keV 65Zn(EC)65Cu, T1/2 = 244.3 d- 1116.5 keV 65Zn(EC)65Cu + L, T1/2 = 244.3 d- 1117.38 ± 0.06 keV 69Ge(EC)69Ga + K, T1/2 = 39.05 hline blend with components that show different time variabilities
ÿ 1125 keV line- 1124.525 ± 0.004 keV 65Zn(EC)65Cu + K, T1/2 = 244.3 dunblended line

1173 keV analysis : original data

1173 keV analysis : 1102 - 1112 keV

1173 keV analysis : 1112 - 1122 keV

1173 keV analysis : 1122 - 1130 keV

Conclusionsÿ 1809 keV analysis (26Al)
1758 - 1770 keV
ÿ 1173 keV analysis (60Fe)1102 - 1112 keV or 1122 - 1130 keV
ÿ Open issues :- other energies (i.e. 511 keV)- impact of statistical nature of data on data degradation / smoothing optimisation- time-dependent degradation- other degradation functions