Embed Size (px)
Citation preview

TERRESTRIAL BIODIVERSITY IN A RAPIDLY CHANGING ARCTIC
Status and trends of tundra birds across the circumpolar Arctic
Paul A. Smith , Laura McKinnon, Hans Meltofte, Richard B. Lanctot,
Anthony D. Fox, James O. Leafloor, Mikhail Soloviev,
Alastair Franke, Knud Falk, Mikhail Golovatin, Vasiliy Sokolov,
Aleksandr Sokolov, Adam C. Smith
Received: 27 April 2019 / Revised: 18 September 2019 / Accepted: 9 December 2019 / Published online: 18 January 2020
Abstract Tundra-breeding birds face diverse conservation
challenges, from accelerated rates of Arctic climate change
to threats associated with highly migratory life histories.
Here we summarise the status and trends of Arctic
terrestrial birds (88 species, 228 subspecies or distinct
flyway populations) across guilds/regions, derived from
published sources, raw data or, in rare cases, expert
opinion. We report long-term trends in vital rates (survival,
reproduction) for the handful of species and regions for
which these are available. Over half of all circumpolar
Arctic wader taxa are declining (51% of 91 taxa with
known trends) and almost half of all waterfowl are
increasing (49% of 61 taxa); these opposing trends have
fostered a shift in community composition in some
locations. Declines were least prevalent in the African-
Eurasian Flyway (29%), but similarly prevalent in the
remaining three global flyways (44–54%). Widespread, and
in some cases accelerating, declines underscore the urgent
conservation needs faced by many Arctic terrestrial bird
species.
Keywords Arctic � Birds � Demography � Monitoring �Population trend � Tundra
INTRODUCTION
Circumpolar Arctic tundra environments support a unique,
and uniquely threatened, avifauna. Avian diversity declines
with latitude, and is low compared to temperate and trop-
ical regions (Gaston and Blackburn 2000). Only 2% of
global bird species are known to breed regularly in the
Arctic, and fewer still are Arctic specialists (Ganter and
Gaston 2013). Although diversity is low overall, groups
such as the geese (Anserini) and shorebirds (Scolopacidae,
Charadriidae) achieve their highest diversity at Arctic lat-
itudes, dominating the bird communities in many locations.
More unique still is the highly migratory nature of these
bird communities; nearly all Arctic-breeding bird species
migrate to warmer regions during the non-breeding season,
connecting the Arctic to all corners of the globe (Ganter
and Gaston 2013).
Conservation threats are present throughout this globe-
spanning range. In recent decades, the observed effects of
climate change have been most pronounced at high lati-
tudes (ACIA 2005; IPCC 2018), and in coming decades,
the Arctic is predicted to experience warming twice that of
the global average (Collins et al. 2013). Effects of rapid
climate change are already measurably impacting tundra
ecosystems, from a northward expansion of treeline
(Harsch et al. 2009) or shrub habitats (Myers-Smith et al.
2011), to a drying of landscapes (Liljedahl et al. 2016), or a
mismatch between the hatch of tundra birds’ chicks and the
emergence of their arthropod prey (McKinnon et al. 2012;
Senner et al. 2017). After the breeding season, Arctic-
breeding birds fan out from boreal to tropical habitats,
some travelling as far as the Antarctic. Throughout this
broad range, they face many anthropogenic pressures, from
modification and loss of habitats (e.g. loss of intertidal
staging habitats in the Yellow Sea; Studds et al. 2017), to
sport and subsistence harvest in flyways around the world
(e.g. Reed et al. 2018).
The population status and trends of Arctic-breeding
birds have been reviewed previously; however, widely
differing efforts across species groups, regions and time
periods (NABCI Canada 2012; Ganter and Gaston 2013;
Electronic supplementary material The online version of thisarticle (https://doi.org/10.1007/s13280-019-01308-5) contains sup-plementary material, which is available to authorised users.
123� The Author(s) 2020
www.kva.se/en
Ambio 2020, 49:732–748
https://doi.org/10.1007/s13280-019-01308-5

Deinet et al. 2015; this study) have reached different
conclusions about the species and regions in need of
greatest conservation attention. The Arctic Council’s Cir-
cumpolar Biodiversity Monitoring Program (CBMP;
Petersen et al. 2004) was designed to harmonise data col-
lection and synthesise results describing the status of bio-
diversity around the circumpolar Arctic. Birds are a
conspicuous feature of this biodiversity, and because of
their societal and ecological importance, they are identified
as Focal Ecosystem Components for monitoring under the
CBMP Terrestrial Monitoring Plan (Christensen et al.
2013).
Here, we review the status and trends of all terrestrial
bird species around the circumpolar Arctic, reporting on
trends in abundance, the most widely monitored metric.
We examine variation in trends across four major global
flyways, and across functional groups of birds, to identify
regional or taxon-specific patterns in trends that suggest
causation. We examine the quality of trend information
that contributes to the population status of species around
the circumpolar Arctic, and review the factors associated
with declining trends. We comment on the urgency of the
conservation issues facing terrestrial birds of the Arctic,
and suggest that coordinated, international efforts to study
and monitor populations are essential for understanding
and ultimately reversing the alarming declines.
METHODS
Study area
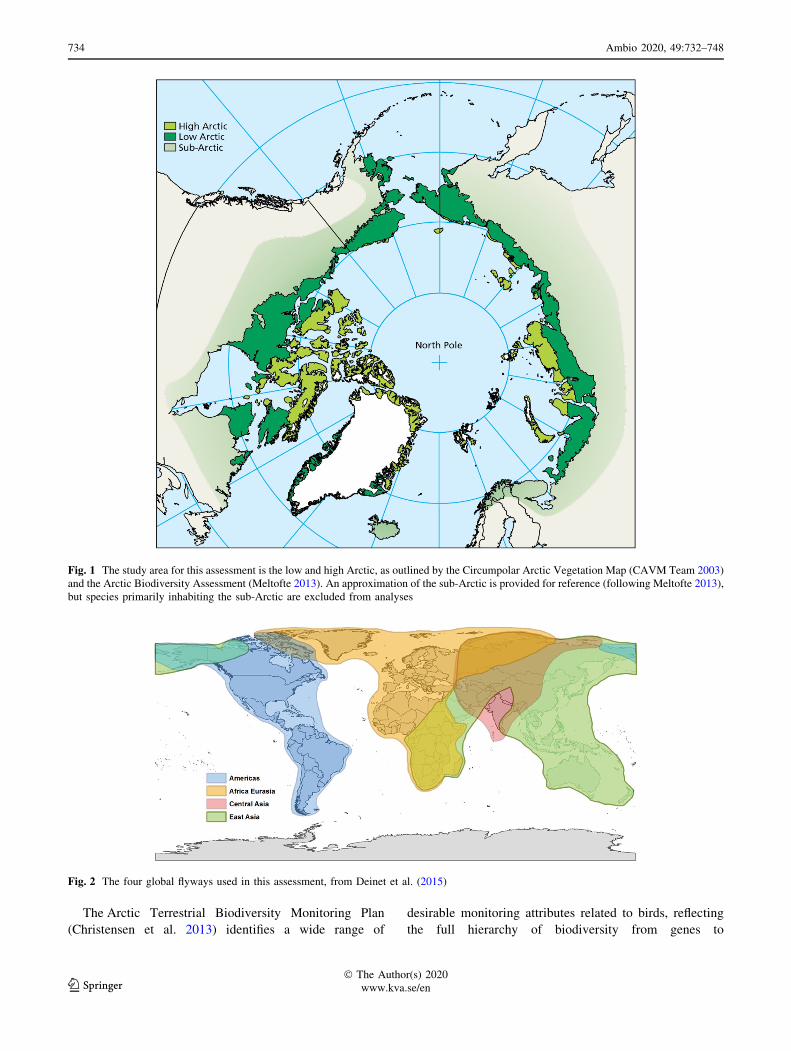
Our assessment is focused on the high and low Arctic as
defined in the Arctic Biodiversity Assessment (Meltofte
2013; Fig. 1). The distinction between high and low Arctic
reflects the division between bioclimatic zones C and D in
the Circumpolar Arctic Vegetation Map (CAVM Team
2003), on the basis of mean July Temp (5–7 �C vs. 7–9 �C)as well as primary production, plant species richness and
vegetative communities. Population trends for birds in the
sub-Arctic are not included in this assessment.
The Arctic comprises some 7.1 million km2 of terrestrial
habitats, varying from the lightly to heavily vegetated
shrub tundra of the low Arctic to the sparsely vegetated
barrens that dominate in the northernmost parts of the high
Arctic. This habitat variation is accompanied by a strong
latitudinal gradient in primary production, with net annual
production ten times lower in the islands of the high Arctic
in comparison to the low Arctic (e.g. Bazilevich et al.
1997). Primary production also varies longitudinally, sig-
nificantly greater in Arctic Alaska, coastal Russia west of
Novaya Zemlya, and on the Taymyr Peninsula, than else-
where (CAVM Team 2003).
These biogeographic patterns in Arctic habitats signifi-
cantly influence the diversity and abundance of birds
(Ganter and Gaston 2013, see below). Distributions are also
influenced by the routes birds take between breeding and
non-breeding ranges, avoiding major ecological barriers
and contributing to the emergence of distinct flyways. The
term ‘‘flyway’’, however, can have a variety of meanings
that combine ecological and political boundaries, and differ
with spatial scale (Boere and Stroud 2006). Here, for the
sake of reporting patterns in status of birds at a global
scale, we rely on four flyways (Fig. 2). Although finer
resolution is possible in some regions, and ecologically
appropriate for some species, this level of resolution allows
reporting at a scale that matches global conservation
agreements such as the African-Eurasian Waterbird
Agreement, the East Asian-Australasian Flyway Partner-
ship, or the North American Migratory Birds Convention.
Species and metrics considered
We focus on terrestrial species that rely primarily on Arctic
habitats for breeding. Approximately 200 species of birds
are known to breed regularly in the Arctic, with 162 spe-
cies considered to have 50% or more of their breeding
range confined to the Arctic (i.e. Categories 1 and 2, and
distinct Arctic subspecies of Category 3 species in Ganter
and Gaston 2013). Of these, we considered 88 species to be
terrestrial rather than marine (i.e. excluding seabirds and
some seaducks); the status of Arctic marine birds is
reported elsewhere (e.g. SAMBR: CAFF 2017). We further
divided these 88 species into recognised subspecies or
populations, following established species databases (e.g.
Partners in Flight 2017; Fox and Leafloor 2018; Wetlands
International 2018). This yielded 228 taxa for which status
and trends were reviewed (Supplementary Data S1).
For some analyses, we grouped these species into guilds
following the conventions of the Arctic Terrestrial Biodi-
versity Monitoring Plan (Christensen et al. 2013), namely
insectivores (shorebirds/waders, passerines), carnivores
(birds of prey, owls, jaegers/skuas), herbivores (geese,
swans, ptarmigan), and omnivores (cranes, ducks, pisci-
vores). These guilds are a simplification of the diet and
behaviour of many species; for example ‘‘insectivores’’ eat
many non-insect invertebrates, and many insectivorous
species have omnivorous diets outside of the breeding
season. However, the groupings are nonetheless useful to
capture broad divisions in species’ contributions to
ecosystem function. We report population trends for these
guilds, as well as for taxonomic groupings (waterfowl,
waders, other waterbirds, landbirds including passerines,
raptors and ptarmigan) for comparison with previous
assessments.
� The Author(s) 2020
www.kva.se/en 123
Ambio 2020, 49:732–748 733
The Arctic Terrestrial Biodiversity Monitoring Plan
(Christensen et al. 2013) identifies a wide range of
desirable monitoring attributes related to birds, reflecting
the full hierarchy of biodiversity from genes to
Fig. 1 The study area for this assessment is the low and high Arctic, as outlined by the Circumpolar Arctic Vegetation Map (CAVM Team 2003)
and the Arctic Biodiversity Assessment (Meltofte 2013). An approximation of the sub-Arctic is provided for reference (following Meltofte 2013),
but species primarily inhabiting the sub-Arctic are excluded from analyses
Fig. 2 The four global flyways used in this assessment, from Deinet et al. (2015)
123� The Author(s) 2020
www.kva.se/en
734 Ambio 2020, 49:732–748

communities. However, we presently do not monitor these
with sufficient intensity for circumpolar reporting, in par-
ticular, lacking time series for finer-scale metrics such as
genetic diversity. Christensen et al. (2013) identified the
status and trends in abundance, demographic parameters
and distribution for herbivores, carnivores and insectivores
as having the highest priorities for monitoring. Here, we
report on these priority measures of birds’ population sta-
tus, highlighting important regional and taxa-specific gaps.
Sources and quality of data
Data used to describe population sizes and trendswere drawn
from published and unpublished sources that varied greatly
in temporal and spatial coverage. Sources per species are
listed in Supplementary Data S1; important sources include
Wetlands International’s database of Waterbird Population
Estimates (Wetlands International 2018), the African-Eur-
asian Waterbird Agreement’s Conservation Status Review
(AEWA-CSR7), BirdLife International’s database (BirdLife
International 2018), North American analyses of trends from
the Audubon Christmas Bird Count (Soykan et al. 2016), the
International Shorebird Survey (PAS and ACS, unpubl.), a
comprehensive review of population size and trends for
waders in Australia (Hansen et al. 2016), and other regional-
or taxa-specific sources. For geese, we used the recent global
audit of goose populations (Fox and Leafloor 2018) and for
birds of prey the recent reviewof Franke (2020; this volume).
These data were combined to produce a comprehensive
database of species’ population sizes and trends, which was
then reviewed and updated by taxonomic and regional
experts to reflect the best available trend information for the
species.
Population sizes and trends are presented largely fol-
lowing the conventions of Wetlands International’s
Waterbird Population Estimates Database (Wetlands
International 2018). Categorical trend estimates were
assigned for long- (typically C 30 years) and short-term
periods (typically, 15 years), with data quality assessments
of the estimates, from 1 to 4, reflecting unreliable or no
supporting data (1) to international monitoring programs
with defined statistical precision (4; see Supplementary
Data S1 for additional details). Trend categories were
‘‘decline’’, ‘‘stable’’, ‘‘increase’’, ‘‘fluctuating’’ or ‘‘un-
known’’. The stable category was assigned when trends
were estimated to lie between - 0.64 to ? 0.64% per year,
equating to a 25% decrease or a 33% increase over a
45 year period, following the definition of stable for trend
reporting exercises in North America (NABCI Canada
2012). These modest rates of decline or increase, while not
trivial over long time scales, are often difficult to detect
given the imprecision in many large-scale surveys. Where a
single estimate of trend is reported, we used the trend
(short- vs. long-term) based upon higher quality data.
Where both were equally reliable, the long-term trend was
favoured unless otherwise indicated.
The Arctic Shorebird Demographics Network provides
valuable current demographic information, but no long-
term trends. The International Breeding Conditions Survey
on Arctic Birds (http://www.arcticbirds.net/; Tomkovich
and Soloviev 2017) provides long-term data, but often only
semi-quantitative. To our knowledge, there have been no
long-term, multi-species reviews of distributional changes
of Arctic birds for the circumpolar Arctic (but see Lappo
et al. 2012). Reporting on these attributes takes the form of
case studies, for regions where data exist.
Analyses
Categorical estimates of trend are presented across flyways,
guilds and taxonomic groupings. Recognising the qualitative
nature of these status assessments, we kept analyses of these
categorical data to aminimum. ForNorthAmerica, sufficient
quantitative monitoring data existed to summarise trends
using a multi-species index of abundance over time. A pre-
cision-weighted index was calculated across guilds/taxo-
nomic groupings using a hierarchical Bayesian model
described in Sauer and Link (2011), and as used in ‘‘State of
the Birds’’ reports in Canada and the United States (e.g.
NABCI Canada 2012). The model estimates the geometric
mean population change with respect to a base year; we used
1980 as our base year becausemost surveys provided reliable
estimates by this time. We calculated the population change
since the base year as a ratio of population estimates or
indices of population size for each species (Population2016/
Population1980). Because imprecise estimates of population
change tend to be extreme, the model accounts for the pre-
cision of each species’ estimated population change in cal-
culating the group mean. For each year in the time series, the
indices provide an estimate of the average population change
since 1980 across all species in the guild or taxonomic group.
The vertical axes of the index graphs (% change since 1980)
are plotted on a log-scale to ensure that the visual represen-
tations of increases and decreases are comparable (e.g. so
that a halving appears the same as a doubling).
RESULTS
Global patterns in diversity and abundance
Insectivores
At the species level, Arctic terrestrial birds are dominated
by waders, comprising 41 of the 88 species (47%). This
value is similar at the level of subspecies or populations,
� The Author(s) 2020
www.kva.se/en 123
Ambio 2020, 49:732–748 735

where waders represent 51% (117/228 taxa) of the diversity
of terrestrial birds across the circumpolar Arctic. This
dominance of wader subspecies richness is consistent
across all but the Central Asian Flyway, where the wader
and landbird group consists of the same number of taxa (15
each; Fig. 3). When waders and insectivorous landbirds are
combined into an ‘‘insectivore’’ guild, the guild is clearly
dominant across all flyways (Fig. 4). Within this guild,
49% of the taxa with known trends are believed to be
declining.
Although the overall diversity of landbirds is low (30/
228 taxa, or 13% across all flyways), some of these taxa are
abundant and broadly distributed. Several small passerine
species occur as a single taxonomic unit across the entire
circumpolar Arctic, and the 5 largest population sizes all
belong to passerines. The most abundant Arctic terrestrial
bird, the Lapland longspur (Calcarius lapponicus), is
estimated to have a global population size of perhaps
130 M individuals (Partners in Flight 2017), greater than
the sum of the maximum population estimates for all non-
passerines combined. For comparison, Arctic waders
worldwide may number up to 50 million individuals
(Zockler 2012).
Herbivores
In Arctic tundra habitats, geese are by far the dominant
herbivorous bird, with ptarmigan and tundra swans (Cygnus
columbianus) being the remaining species. The status and
trends of willow and rock ptarmigan (Lagopus lagopus, L.
mutus) are reviewed in detail by Fuglei et al. (2019; this
volume; trends aremost often cyclical and varywidely across
regions). The recently completed Northern Hemisphere
Goose Audit suggested that there are 39.0–39.2 million wild
geese belonging to 68 populations of 15 species (Fox and
Leafloor 2018); 11 species and 42 of the management units
are considered primarily Arctic tundra birds (Supplementary
Data S1). These populations are distributed throughout all
four flyways, with the greatest diversity in the African-Eur-
asian and Americas flyways.
The ‘‘white’’ geese (Chen) of North America are most
numerous (17.1 million individuals of 3 species); all six
populations have increased their abundance and distribu-
tion dramatically in the last 10 years, and several are listed
as overabundant by management authorities in Canada and
the United States (e.g. ECCC 2017). The Arctic taxa of
‘‘black’’ geese (Branta) number c.6.1 million individuals of
15 populations from 4 species, and all but one of these
populations is stable or increasing over the long term. The
Arctic ‘‘grey’’ geese (Anser) comprise 21 populations of 4
species, totalling approximately 6.4 million individuals, of
which 7 populations have declined in abundance over the
long term.
Carnivores
Only four birds of prey are considered true Arctic tundra
species, and each is distributed broadly across the cir-
cumpolar Arctic. The peregrine falcon (Falco peregrinus)
occurs as two distinct subspecies: the Arctic peregrine
falcon (F. p. tundrius) in the Nearctic and the Siberian
tundra peregrine (F.p. calidus) in the Russian Arctic. Both
subspecies are highly migratory, with many individuals
wintering south of the equator. The total number of adult
breeding birds in the Nearctic is 32 000 individuals based
on estimates from migration counts that include a propor-
tion of the non-arctic subspecies F. p. anatum (Franke
2016). In the Palearctic, the F. p. calidus population is
estimated at around 10 000 individuals, which is likely a
significant underestimate (White et al. 2013).
The gyrfalcon (Falco rusticolus) has a circumpolar
distribution with most adult birds resident in the North
year-round (Potapov and Sale 2005). Approximately 8 000
gyrfalcon are found in the Nearctic and 12 000 in the
Palearctic (Potapov and Sale 2005; Birdlife International
2018), with no significant long-term changes in population
size reported (see Watson et al. 2011). The gyrfalcon is
largely a prey specialist relying on ptarmigan, and their
reproductive output is often linked to the cyclic abundance
of ptarmigan.
The rough-legged hawk (Buteo lagopus) is the most
abundant raptor in the Arctic, with a global population size
in the range of 300 000 to 1 million mature individuals
(Supplementary Data S1). Occupancy and productivity
fluctuate with the cyclic abundance of their main prey,
small mammals. In some areas (e.g. Scandinavia, Yamal)
the population has declined dramatically since the 1970s,
because of changes in the abundance or cyclicity of small
mammals (Golovatin et al. 2010; Hellstrom 2014). Large-
scale surveys of rough-legged hawks in northern temperate
migration or wintering areas report high variability in
abundance, but suggest a long-term decline (e.g. Kjellen
2018).
The snowy owl (Bubo scandiacus) is also a specialist on
small mammals, with local breeding densities fluctuating
widely in response to cyclic small mammal populations.
Population size for this species has been the subject of
debate, once estimated at 200 000 individuals but now
believed to be as low as 8 000–28 000 individuals (Potapov
and Sale 2013); long-term declines in this small population
size have led to a recent IUCN classification of Vulnerable
for this species (BirdLife International 2018). Like the
gyrfalcon, some snowy owls remain in the Arctic during
the non-breeding season, taking advantage of concentra-
tions of seabirds in polynyas or other concentrations of
prey (Therrien et al. 2011).
123� The Author(s) 2020
www.kva.se/en
736 Ambio 2020, 49:732–748

Fig. 3 Trends in population abundance (increasing, stable, decreasing, unknown) for four taxonomic groupings of Arctic terrestrial bird species,
in four broad global flyways. Trends are displayed as the total number of taxa (species or recognised populations; top), and as the proportion of
the total taxa (bottom)
� The Author(s) 2020
www.kva.se/en 123
Ambio 2020, 49:732–748 737

Fig. 4 Trends in population abundance (increasing, stable, decreasing, unknown) for four guilds of Arctic terrestrial bird species, in four broad
global flyways. Trends are displayed as the total number of taxa (species or recognised populations; top), and as the proportion of the total taxa
(bottom)
123� The Author(s) 2020
www.kva.se/en
738 Ambio 2020, 49:732–748

Trends in abundance, all species
Trends in abundance differ greatly across taxonomic
groupings and across flyways, as did the quality of trend
information. Data were so poor that trends could not be
estimated for 32 of 228 taxa, ranging from 5% (3/64) of
waterfowl to 21% of waders (25/117). A single species
(Eskimo curlew, Numenius borealis) is currently believed
to be extinct, but not yet formally designated as such
(COSEWIC 2009). Across all flyways, excluding taxa with
unknown trends and the Eskimo curlew, declines were
most prevalent in waders (51% of 91 taxa with estimated
trends) and least prevalent in waterfowl (25% of 61 taxa).
Conversely, increasing population trends were most com-
mon in waterfowl (49%) and least common in waders
(15%) and other waterbirds (13% of 15 taxa).
These broad patterns were generally mirrored within
flyways, with some exceptions. Within flyways, increases
were generally most common in waterfowl and least
common among waders and waterbirds (Fig. 3). Fewer
waterfowl populations were increasing in the Central Asian
and East Asian-Australasian flyways. The largest number
of declining species was among the waders in all but the
Central Asian flyway, where a large majority of waders had
unknown trends. However, as a proportion of flyway taxa,
stable or increasing trends dominated among waders in the
African-Eurasian flyway, in contrast to other flyways
(Fig. 3). These differences between regions were similarly
pronounced for the insectivore guild (Fig. 4). Although
diversity of waders was moderate in the East Asian-Aus-
tralasian Flyway, fully 88% (15/17) of taxa with known
trends were estimated to be declining; the largest propor-
tion of any group.
Short- (most recent 15 years) and long-term
([ 30 years) trends were available for 157 taxa. Trends
were unchanged over the two time periods for a majority of
taxa (80%), improved for 11% of taxa and worsened for
9% of taxa. Differences among species groups were minor,
with the percentage of worsening trends ranging from 0%
for landbirds and waterbirds to 14% for waders.
Within North America, continuous time series of mon-
itoring data for most waterfowl and waders permitted the
calculation of quantitative indices of trend. In contrast,
waterbird, omnivore and carnivore groups had too few
species (\ 5) to calculate indices reliably. Arctic-breeding
waterfowl tripled in abundance relative to the 1980s, lar-
gely as a function of increases in white geese, while Arctic-
breeding waders halved in abundance and landbirds
declined by * 20%. All groups, including waterfowl or
herbivores showed a tendency towards accelerating decli-
nes in the last decade, with an inflection around 2010
(Fig. 5). While concerning, the cause of these coincident
trends remains unclear and warrants further investigation.
Data quality
The quality of the monitoring data documenting trends in
population abundance varied widely among regions and
taxonomic groups (Fig. 6). Trend data were lacking alto-
gether, for any time period, for 32 of 228 taxa (14%, trend
quality = 1; Supplementary Data S1). In all flyways,
waterfowl and waders had the highest quality monitoring
data, with a mean (± SD) trend quality of 3.2 ± 1.1 and
2.6 ± 1.1, respectively, in comparison to 2.4 ± 0.8 for
landbirds, and 2.1 ± 0.9 for waterbirds (scores range from
1 to 4). The quality of monitoring in the Americas flyway
(3.0 ± 1.1) and the African-Eurasian flyway (2.8 ± 1.0)
was better than in the East Asian-Australasian (2.2 ± 1.0)
or Central Asian (1.9 ± 1.0) flyways. The quality of
monitoring information was similar for declining species
(2.95 ± 0.8) versus stable or increasing species
(2.99 ± 0.97), offering no evidence that experts were
biased in their willingness to conclude declines versus
increases when confronted with poor data.
Importantly, the proportion of populations lacking trend
estimates for the most recent 15 years (25%) was similar to
the proportion over the long term (19%), with a similar
mean trend quality in both periods (2.5 ± 1.1 and
2.6 ± 1.1, respectively). These facts suggest that moni-
toring programs are neither more comprehensive nor more
rigorous in recent years than previously (Supplementary
Data S1).
DISCUSSION
Biogeographical patterns in density and diversity
Avian diversity generally follows gradients in productivity,
with higher diversity in the low vs. high Arctic, peaking in
Beringia and lowest in Greenland and Svalbard (Zockler
1998; Ganter and Gaston 2013). The resolution of our
global flyways, and their differing sizes, obscures this
relationship to some extent, with highest diversity in our
dataset in the two largest flyways: the Americas and
Africa-Eurasia. Within the Americas flyway, tundra bird
diversity is greater in Alaska than in Arctic Canada, and
wader densities are[ 5 times greater in parts of Arctic
Alaska than Arctic Canada (Bart and Smith 2012).
Even within these regions, density and diversity respond
to productivity gradients. Heavily vegetated wetlands
dominated by sedges, grasses and mosses constitute a small
fraction of the total land area in many regions of the cir-
cumpolar Arctic, but hold a disproportionate richness and
abundance of birds. Although wetlands constituted only c.
20% of Arctic North American vegetated habitats, they
held nearly 50% of waders, owing to 2.5–5 times greater
� The Author(s) 2020
www.kva.se/en 123
Ambio 2020, 49:732–748 739

Fig. 5 Composite indices of trends in abundance for North American Arctic birds of various taxonomic groupings, 1980–2016. Light and dark
shading denote 50% and 95% credible intervals, respectively. Groupings reflect standard taxonomic divisions (top) or foraging guilds (bottom).
The following groupings were omitted owing to small sample sizes (\ 5 taxa): waterbirds (such as loons and jaegers; top), omnivores, carnivores
(bottom)
123� The Author(s) 2020
www.kva.se/en
740 Ambio 2020, 49:732–748

Fig. 6 Quality of the monitoring information used to describe trends in abundance for the number (top) and proportion (bottom) of populations
within taxonomic bird groups in four global flyways. Trend quality categories are as follows: (1) data are lacking such that trends are unknown,
(2) regional and site-specific monitoring allow for assumptions of trend, (3) international monitoring allows estimation of trend direction, and (4)
rigorously designed international monitoring programs yield estimates of precision
� The Author(s) 2020
www.kva.se/en 123
Ambio 2020, 49:732–748 741

diversity and nesting densities there (Bart and Smith 2012).
Hence, circumpolar tundra bird abundance and diversity is
highly concentrated in the most productive habitats.
Correlates of trend
Insectivores
Waders dominate the insectivore guild in species numbers,
and emerged as a conservation priority throughout the
results, showing the largest proportions of declining spe-
cies of any taxonomic group, with the greatest proportion
of declining taxa in the East Asian-Australasian Flyway.
The dramatic declines of waders in this flyway are thought
to relate to a[ 65% loss of intertidal habitat in the Yellow
Sea (e.g. Studds et al. 2017). Proportions of species’ pop-
ulations staging in the Yellow Sea was the strongest pre-
dictor of population trend, suggesting that failure to accrue
sufficient resources during staging impacted a birds’ sur-
vival post departure (Studds et al. 2017). Similarly, in the
West Atlantic flyway, individuals of the endangered rufa
red knot (Calidris canutus rufa) have been shown to have
reduced migratory performance and survival when they
depart the primary staging site, Delaware Bay, USA, in
poor body condition, as a consequence of reduced avail-
ability of their preferred forage, horseshoe crab eggs
(Limulus polyphemus; Baker et al. 2004; Duijns et al.
2017). In contrast, in the East Atlantic portion of the
African-Eurasian flyway, where there are more stable and
positive wader trends than elsewhere, some have suggested
a link to increased forage availability from eutrophication
of coastal staging habitats (Meltofte et al. 2019).
These examples demonstrate the crucial importance of
conditions at migratory staging sites for Arctic waders,
most of which are long-distance migrants. The impacts of
poor energetic status during migration may be particularly
acute for individuals that migrate over the open ocean or
other ecological barriers, with limited ability to stop safely
en route. The large proportion of declining species in the
East Asian-Australasian and Americas flyways could
reflect a high proportion of oceanic migrants.
Poor energetic status of birds due to the loss or degra-
dation of migratory staging sites could also affect future
reproductive success (e.g. Senner et al. 2014; but see
Duijns et al. 2017; ). Reproductive success of Arctic tundra
waders is highly variable in space and time for many rea-
sons, for example increasing with latitude (McKinnon et al.
2010; but see Bulla et al. 2019), or varying with snow
conditions, weather, or variation in predator abundance and
their preferred small mammal prey (reviewed in Meltofte
et al. 2007). Changing environmental conditions in the
Arctic could help to explain why declines exist in some
species but not others in flyways where staging sites have
not declined radically in quality in recent years, such as in
the East Atlantic portions of the African-Eurasian Flyway.
However, quantitative evidence to link Arctic environ-
mental change to population declines remains limited (see
‘‘Climate-related Mismatch as a Stressor’’).
Although waders dominate tundra habitats in species
richness, passerine landbirds clearly dominate numerically.
Most of these abundant and broadly distributed species,
several with circumpolar distributions, appear to show
long-term increases in abundance. However, continuous
time series from North America suggest declines in the last
decade, consistent with observations of declines in some
portions of Russia (Supplementary Data S1). Despite their
ubiquity, the quality of trend information for these species
is poor, partly due to difficulties in combining regional
trend estimates across their broad and contiguous geo-
graphic ranges.
Herbivores
Most populations of geese showed increasing or
stable trends over the last 30 years, but our knowledge of
trends is highly variable (Zockler 2008). North American
population estimates are of the best quality and most
populations are increasing or stable, as are those in Europe,
probably due to increasing exploitation of agricultural
landscapes for food outside of the breeding season (Fox
and Abraham 2017). In Arctic North America, populations
have increased to such an extent that they are adversely
affecting their staging and breeding habitats through
intensive grazing of graminoids, and ‘‘grubbing’’ of the
below ground rhizomes, in some cases leading to lasting
vegetation loss and habitat degradation (Abraham et al.
2012; Mariash et al. 2018), with evidence emerging of
adverse density-dependent consequences for the geese
themselves (e.g. Ross et al. 2018). Similarly, recent studies
suggest that hyperabundant geese could have adverse
effects on the density, habitat selection or reproductive
success of sympatric tundra bird species at local and
regional scales (e.g. Flemming et al. 2016, 2019).
In contrast, many goose populations are declining in
Central and Eastern Asia, especially where species are
confined to natural habitats of declining quality (e.g. Yu
et al. 2017). However, good population estimates and count
data series are generally lacking, except in Korea and Japan
where many goose populations are associated with farm-
lands and are known to be increasing through coordinated
surveys (Jia et al. 2016). The quality of survey data is
rapidly improving in China, where count networks and
coordination with flyway partners are being established
(e.g. Zhao et al. 2012).
Although waterfowl had the highest quality monitoring
data for any taxonomic group in our analyses, important
123� The Author(s) 2020
www.kva.se/en
742 Ambio 2020, 49:732–748

gaps remain. A recent international review identified the
most urgent of these needs, including improved delineation
of flyway populations, more regular reporting of annual
changes in abundance for all northern hemisphere goose
populations, the initiation of demographic monitoring and
research programs to identify causes of decline, and eval-
uation of the potential adverse effects of overabundant
goose populations on habitats and sympatric species (Fox
and Leafloor 2018).
Carnivores
Many peregrine falcon populations (especially in Alaska,
parts of Canada and northern Fennoscandia) have now
largely recovered from dramatic reductions due to pesticide
contamination during the 1970s (Franke 2020; this vol-
ume). Overall, Arctic peregrine populations now appear
stable, with reports of a northward expansion among
peregrines in Northwest Greenland (Burnham et al. 2012),
as well as an advancing timing of breeding in several
Arctic regions (Franke 2020), likely as a consequence of
climate change. Gyrfalcon populations are also stable,
although poaching is an increasing concern in some areas
(Potapov 2011), and shrubification and a shrinking High
Arctic climate zone may pose challenges in the future,
mediated through impacts on their primary prey, ptarmigan
(Booms et al. 2011). The iconic snowy owl is believed to
be declining range-wide, and was recently uplisted by
IUCN to a status of vulnerable (Birdlife International
2018). Population trends for this lemming specialist are
believed to be influenced in part by declines in the abun-
dance of lemmings (Dicrostonyx spp., Lemmus spp.).
Declines in lemmings could adversely affect other lem-
ming predators as well, such as pomarine and long-tailed
skua (Stercorarius pomarinus, S. longicaudus), both of
which have declined dramatically in western Siberia
(Golovatin et al. 2010). However, the evidence for declines
in lemming abundance at a circumpolar scale is mixed
(Ehrich et al. 2020, this volume).
Climate-related mismatch as a stressor
Nearly all Arctic-breeding birds are migratory (Ganter and
Gaston 2013), and the timing of their life histories has
evolved in response to environmental cues across hemi-
spheric scales. The accelerated rate of climate change at
high latitudes (e.g. IPCC 2018) can potentially decouple
such cues, leading to mismatches. Indeed, climate-related
mismatches are widely proposed as among the leading
stressors of wildlife populations arising from anthro-
pogenic climate change (e.g. Both et al. 2006; Gilg et al.
2012). For herbivores, mismatched timing of breeding can
impair chick growth because of a reduced nutrient content
of forage plants later in the growing season (e.g. Clausen
and Clausen 2013; Ross et al. 2018). Insectivorous species,
too, could suffer due to phenological mismatch.
Arctic-nesting waders, for example, travel thousands of
kilometres each spring to take advantage of a burst of
arthropod prey during the Arctic summer. A phenological
mismatch between the timing of reproduction and the
period during which these arthropods are abundant is one
of the key hypothesised effects of climate change on Arctic
insectivores (Tulp and Schekkerman 2008; Saalfeld and
Lanctot 2017), with some evidence of reduced growth rates
of chicks due to mismatch (McKinnon et al. 2012), and
reduced body size of juvenile red knots during years of
early snowmelt in high Arctic Siberia (van Gils et al.
2016). However, there is considerable disagreement among
studies; Hudsonian godwits (Limosa haemastica) in Alaska
remain appropriately timed with respect to arthropods
(Senner et al. 2017), sanderling (Calidris alba) chicks in
Greenland have not been affected by the apparent mis-
match documented there (Reneerkens et al. 2016), and
there is evidence that temperature increases can alleviate
some of the negative effects of phenological mismatch for
waders via reduced thermoregulation costs (McKinnon
et al. 2013), although such thermoregulatory benefits might
be minor (Machın et al. 2018). Overall, despite the
hypothesised importance of mismatch, there is consider-
able variation both in the extent of mismatch across spe-
cies, and in the strength of evidence for its effects, perhaps
due to variable influence of local environmental drivers
across study sites, or life-history traits across species.
Climate effects on distribution
A northward shift in climatic conditions and habitats is
expected to result in a corresponding shift in the range of
Arctic species, which for high-latitude avian species can
result in an expansion of suitable climatic conditions (e.g.
Zockler and Lysenko 2000; Jensen et al. 2008), or an
‘‘arctic squeeze’’, as suitable conditions are pushed off the
edge of the map (Meltofte 2013; Wauchope et al. 2017).
Numerous examples of changes in range have been
reported for individual species of Arctic birds (reviewed in
Ganter and Gaston 2013; Lappo et al. 2012), but syntheses
of large-scale data to document range shifts across suites of
species remain exceedingly rare. Large-scale ‘‘bird atlas’’
surveys in Finland allowed researchers to document a
northward shift in range of 0.7 km/year for northern bird
species between the 1970s and 2000s, and similar national
atlases allow for similar analyses in Sweden and Norway
(e.g. Elmhagen et al. 2015). Although a northward
expansion of trees and shrubs is well documented (e.g.
Harsch et al. 2009; Myers-Smith et al. 2011), large-scale
and consistent monitoring schemes to track distributional
� The Author(s) 2020
www.kva.se/en 123
Ambio 2020, 49:732–748 743

changes in birds are lacking from the North American and
Russian Arctic, making similarly rigorous analyses
impossible.
The importance of long-term and large-scale studies
This synthesis highlights that consistent monitoring, at
large spatial scales and over long time periods, can play a
crucial role in our understanding of the status and trends of
Arctic bird populations. Some of these consistent moni-
toring efforts have arisen from collaborative research pro-
jects designed to address specific questions. For example,
the Arctic Shorebird Demographics Network (Lanctot et al.
2015) sought to estimate shorebird survival and reproduc-
tive success across the North American Arctic (and parts of
Russia) to determine the factors limiting populations (e.g.
Weiser et al. 2018). The recently established ‘‘Interactions
Working Group’’ is exploring predator–prey interactions
by implementing standardised protocols across a network
of sites spanning the circumpolar Arctic. Other programs
bring together pre-existing datasets for large-scale, post
hoc syntheses. For example, the International Breeding
Conditions Survey on Arctic Birds (http://www.arcticbirds.
net/; Tomkovich and Soloviev 2017) gathers circumpolar
site-specific data describing Arctic environmental condi-
tions, reproductive success, and bird abundance and
diversity. During the non-breeding season, existing surveys
of juvenile ratios and band resighting could provide
improved demographic information for many species if
analysed and reported in a coordinated fashion (Robinson
et al. 2005). At even larger spatial scales, novel analytic
approaches have been used to link demographic and phe-
nological variables across entire flyways to understand
when, where and how populations are limited (e.g.
Rakhimberdiev et al. 2018). Such collaborative projects all
draw primarily on existing field programs, adding value to
these programs by facilitating large-scale analyses through
the shared application of consistent monitoring and
research protocols.
This existing research and monitoring infrastructure in
the Arctic plays an even more crucial role in our under-
standing of the status and trends of Arctic birds and
ecosystems. Most parts of the Arctic are remote, chal-
lenging and expensive regions in which to work, and the
long-term maintenance of this infrastructure is both
essential and challenging. Although many bird populations
can be monitored outside of the Arctic, understanding
status and trends in demographic parameters requires work
on the Arctic-breeding grounds. Long-term field stations
have also played an essential role in developing our
understanding of Arctic ecosystem dynamics and responses
to environmental change. For example, work at Zacken-
berg, Greenland, Bylot Island, Canada, and the Taimyr
Peninsula, Russia, have transformed our understanding of
interactions between tundra birds and other ecosystem
components (e.g. Wirta et al. 2015; Reneerkens et al. 2016;
Schmidt et al. 2017). National or international programs to
maintain this field infrastructure through promotion of its
importance, such as the European Union’s INTERACT
program (https://eu-interact.org/), play an important role in
maintaining the integrity of monitoring programs for tun-
dra birds into the future.
Knowledge gaps identified
Despite our best efforts to monitor birds throughout the
Arctic, important data gaps remain. We demonstrate here
that nearly half of all populations of Arctic tundra birds
have monitoring information that is considered ‘‘poor’’ or
worse. In the Central Asian and East Asian-Australasian
flyways, less than one-third of populations exceed this
modest standard for data quality. Some of the best datasets
in the Americas and African-Eurasian flyways are available
in part to support international obligations, such as the
shared management of harvested waterfowl in North
America under the Migratory Bird Treaty or the reporting
obligations under the Agreement on the Conservation of
African-Eurasian Migratory Waterbirds (AEWA). Interna-
tional partnerships are developing in other flyways, such as
the East Asian-Australasian Flyway Partnership (EAAFP),
and could enhance the availability of monitoring data in the
future. Also, systematic efforts to collect and synthesise
data from local- and regional sources to produce broad-
scale indices, such as the Arctic Species Trend Index
(Deinet et al. 2015), can ensure that we make the best
possible use of the data that are collected. Importantly,
however, we show that the quality of monitoring infor-
mation has not yet improved when comparing trends over
the last 15 years with trends over longer-time periods.
Information describing status and trends in demographic
parameters is far more fragmentary, and is lacking for the
majority of species in even the best monitored flyways.
Improved understanding of demography is essential if we
are to achieve an understanding of the causes of decline,
which are likely multi-faceted, species-specific, and
occurring both within and outside of the Arctic. For some
species, such as the widespread Arctic passerines, even
population structure is poorly defined, making regional
gaps in monitoring difficult to identify. Addressing these
gaps and improving understanding of the status and trends
for Arctic tundra birds requires cooperation that is sus-
tained over decadal time scales, spans the circumpolar
Arctic and the global ranges of its migratory species, and
brings together datasets in novel, integrative ways. How-
ever daunting, this collaborative monitoring is essential if
123� The Author(s) 2020
www.kva.se/en
744 Ambio 2020, 49:732–748

we are to understand and ultimately reverse the declines of
Arctic tundra birds.
Acknowledgements We thank the countless professionals and vol-
unteers who contributed to the myriad datasets that were consulted for
this review. Maintaining these long-term studies is an immense
commitment in any environment, and especially so in the Arctic. We
also thank two anonymous reviewers and the editors, especially Niels
Martin Schmidt, for their helpful comments on earlier drafts.
Open Access This article is licensed under a Creative Commons
Attribution 4.0 International License, which permits use, sharing,
adaptation, distribution and reproduction in any medium or format, as
long as you give appropriate credit to the original author(s) and the
source, provide a link to the Creative Commons licence, and indicate
if changes were made. The images or other third party material in this
article are included in the article’s Creative Commons licence, unless
indicated otherwise in a credit line to the material. If material is not
included in the article’s Creative Commons licence and your intended
use is not permitted by statutory regulation or exceeds the permitted
use, you will need to obtain permission directly from the copyright
holder. To view a copy of this licence, visit http://creativecommons.
org/licenses/by/4.0/.
REFERENCES
Abraham, K.F., R.L. Jefferies, R.T. Alisauskas, and R.F. Rockwell.
2012. Northern wetland ecosystems and their response to high
densities of lesser snow geese and Ross’s geese. In Evaluation of
special management measures for midcontinent lesser snow
geese and Ross’s geese, ed. J.O. Leafloor, T.J. Moser, and B.D.J.
Batt, 9–45. Ottawa: Arctic Goose Joint Venture Special Publi-
cation. U.S. Fish and Wildlife Service, Canadian Wildlife
Service.
ACIA. 2005. Arctic climate impact assessment. Cambridge: Cam-
bridge University Press.
Baker, A.J., P.M. Gonzalez, T. Piersma, L.J. Niles, I. de Lima Serrano
do Nascimento, P.W. Atkinson, and G. Aarts. 2004. Rapid
population decline in red knots: Fitness consequences of
decreased refuelling rates and late arrival in Delaware Bay.
Proceedings of the Royal Society of London Series B 271:
875–882.
Bart, J., and P.A. Smith. 2012. Summary and conclusions. In Arctic
shorebirds in North America: A decade of monitoring, ed. J. Bart
and V.H. Johnston, 213–238 pp. Studies in Avian Biology 44,
Berkeley: University of California Press.
Bazilevich, N.I., A.A. Tishkov, and G.E. Vilchek. 1997. Live and
dead reserves and primary production in polar desert, tundra and
forest tundra of the former Soviet Union. Polar and Alpine
Tundra, 509–539 pp.
BirdLife International. 2018. IUCN red list for birds. Retrieved
October 1, 2018, from http://www.birdlife.org.
Boere, G.C., and D.A. Stroud. 2006. The flyway concept: What it is
and isn’t. In Waterbirds around the world, ed. G.C. Boere, C.A.
Galbraith, and D.A. Stroud, 40–47. Edinburgh: The Stationery
Office.
Booms, T., M. Lindgren, and F. Huettmann. 2011. Linking Alaska’s
predicted climate, Gyrfalcon, and ptarmigan distributions in
space and time: A unique 200-year perspective. In Gyrfalcons
and ptarmigan in a changing world, vol. 1, ed. R.T. Watson, T.J.
Cade, M. Fuller, G. Hunt, and E. Potapov, 177–190. Boise: The
Peregrine Fund. https://doi.org/10.4080/gpcw.2011.0116.
Both, C., S. Bouwhuis, C.M. Lessells, and M.E. Visser. 2006. Climate
change and population declines in a long-distance migratory
bird. Nature 441: 81–83.
Bulla, M., J. Reneerkens, E.L. Weiser, A. Sokolov, A.R. Taylor, B.
Sittler, B.J. McCaffery, and B. Kempenaers. 2019. Technical
comment on Global patterns of nest predation is disrupted by
climate change in shorebirds. Science. https://doi.org/10.1126/
science.aaw8529.
Burnham, K.K., W.A. Burnham, I. Newton, J.A. Johnson, and A.G.
Gosler. 2012. The history and range expansion of peregrine
falcons in the Thule Area, Northwest Greenland. Monographs on
Greenland Bioscience 60: 1–106.
CAFF. 2017. State of the Arctic marine biodiversity report. Conser-
vation of Arctic Flora and Fauna International Secretariat,
Akureyri, Iceland. 978-9935-431-63-9.
CAVM Team. 2003. Circumpolar Arctic vegetation map scale
1:7,500,000. Conservation of Arctic Flora and Fauna (CAFF)
Map No. 1. Anchorage, U.S. Fish and Wildlife Service.
Christensen, T., J. Payne, M. Doyle, G. Ibarguchi, J. Taylor, N.M.
Schmidt, M. Gill, M. Svoboda, et al. 2013. The Arctic terrestrial
biodiversity monitoring plan. CAFF Monitoring Series Report
Nr. 7. CAFF International Secretariat. Akureyri, Iceland. ISBN
978-9935-431-26-4.
Clausen, K.K., and P. Clausen. 2013. Earlier Arctic springs cause
phenological mismatch in long-distance migrants. Oecologia
173: 1101–1112.
Collins, M., R. Knutti, J. Arblaster, J.-L. Dufresne, T. Fichefet, P.
Friedlingstein, X. Gao, W.J. Gutowski, et al. 2013. Long-term
climate change: projections, commitments and irreversibility. In
Climate change 2013: The physical science basis. Contribution
of working group I to the fifth assessment report of the
intergovernmental panel on climate change, ed. T.F. Stocker,
D. Qin, G.-K. Plattner, M. Tignor, S.K. Allen, J. Boschung, A.
Nauels, and Y. Xia. Cambridge: Cambridge University Press.
COSEWIC. 2009. COSEWIC assessment and status report on the
Eskimo Curlew Numenius borealis in Canada. Committee on the
Status of Endangered Wildlife in Canada. Ottawa. vii ? 32 pp.
Deinet, S., C. Zockler, D. Jacoby, E. Tresize, V. Marconi, L. McRae,
M. Svoboda, and T. Barry. 2015. The Arctic species trend index:
Migratory birds index. Akureyri: Conservation of Arctic Floraand Fauna. ISBN 978-9935-431-44-8.
Djuins, S., L.J. Niles, A. Dey, Y. Aubry, C. Friis, S. Koch, A.M.
Anderson, and P.A. Smith. 2017. Body condition explains
migratory performance of a long-distance migrant. Proceedings
of the Royal Society B. https://doi.org/10.1098/rspb.2017.1374.
Ehrich, D., N.M. Schmidt, G. Gauthier, R. Alisauskas, A. Angerbjorn,
K. Clark, F. Ecke, N. Eide, et al. 2020. Documenting lemming
population change in the Arctic: Can we detect trends? Ambio.
https://doi.org/10.1007/s13280-019-01198-7.
Elmhagen, B., J. Kindberg, P. Hellstrom, and A. Angerbjorn. 2015. A
boreal invasion in response to climate change? Range shifts and
community effects in the borderland between forest and tundra.
Ambio 44: 39–50. https://doi.org/10.1007/s13280-014-0606-8.
Environment and Climate Change Canada, Canadian Wildlife Service
Waterfowl Committee. 2017. Population status of migratory
game birds in Canada, November 2017.
Flemming, S., A. Calvert, E. Nol, and P.A. Smith. 2016. Do
hyperabundant Arctic-nesting geese pose a problem for sym-
patric species? Environmental Reviews 4: 393–402.
Flemming, S., E. Nol, L.V. Kennedy, and P.A. Smith. 2019.
Hyperabundant herbivores limit habitat availability and influ-
ence nest site selection of Arctic-breeding birds. Journal of
Applied Ecology. https://doi.org/10.1111/1365-2664.13336.
� The Author(s) 2020
www.kva.se/en 123
Ambio 2020, 49:732–748 745

Fox, A.D., and K.F. Abraham. 2017. Why geese benefit from the
transition from natural to agricultural habitats. Ambio 46:
188–197. https://doi.org/10.1007/s13280-016-0879-1.
Fox A.D., J.O. Leafloor. 2018. A global audit of the status and trends
of Arctic and northern hemisphere goose populations. Conser-
vation of Arctic Flora and Fauna International Secretariat:
Akureyri, Iceland. ISBN 978-9935-431-66-0. 31 pp.
Franke, A. 2016. Population estimates for northern juvenile peregrine
falcons with implications for harvest levels in North America.
Journal of Fish and Wildlife Management 7: 36–45.
Franke, A., K. Falk, K. Hawkshaw, S. Ambrose, D.L. Anderson, P.J.
Bente, T. Booms, K.K. Burnham, et al. 2020. Status and trends
of circumpolar peregrine falcon and gyrfalcon populations. In
Terrestrial biodiversity in a rapidly changing Arctic, eds. N.M.
Schmidt, and H. Johannesdottir, Ambio vol. 49, Special Issue.
https://doi.org/10.1007/s13280-019-01300-z.
Fuglei, E., J.A. Henden, C.T. Callahan, O. Gilg, J. Hansen, R.A. Ims,
A.P. Isaev, and K. Martin. 2020. Circumpolar status of Arctic
Ptarmigan: Population dynamics and trends. Ambio. https://doi.
org/10.1007/s13280-019-01191-0.
Ganter, B., and A.J. Gaston. 2013. Birds. In Arctic biodiversity
assessment, ed. H. Meltofte, 142–181. Akureyri: The Conserva-
tion of Arctic Flora and Fauna (CAFF).
Gaston, K.J., and T.M. Blackburn. 2000. Pattern and process in
macroecology. Oxford: Blackwell Scientific.
Gilg, O., K.M. Kovacs, J. Aars, J. Fort, G. Gauthier, D. Gremillet,
R.A. Ims, and H. Meltofte, et al. 2012. Climate change and the
ecology and evolution of Arctic vertebrates. Annals of the New
York Academy of Sciences 1249: 166–190.
Golovatin, M.G., L.M. Morozova, S.N. Ektova, and S.P. Paskhalny.
2010. The change of tundra biota at Yamal peninsula (the North
of the Western Siberia, Russia) in connection with anthropogenic
and climatic shifts. In Tundras: Vegetation, wildlife and climate
trends, ed. B. Gutierrez and C. Pena, 1–46. New York: Nova Sci.
Publ.
Hansen, B.D., R.A. Fuller, D. Watkins, D.I. Rogers, R.S. Clemens, M.
Newman, E.J. Woehler, and D.R. Weller. 2016. Revision of the
East Asian-Australasian flyway population estimates for 37
listed migratory shorebird species. Unpublished report for the
Department of the Environment. BirdLife Australia, Melbourne.
Harsch, M.A., P.E. Hulme, M.S. McGlone, and R.P. Duncan. 2009.
Are treelines advancing? A global meta-analysis of treeline
response to climate warming. Ecology Letters 12: 1040–1049.
Hellstrom, P. 2014. Predator responses to non-stationary rodent
cycles. PhD thesis. Department of Zoology, Stockholm Univer-
sity, Stockholm.
IPCC. 2018. Global warming of 1.5�C: An IPCC special report on the
impacts of global warming of 1.5�C above pre-industrial levels
and related global greenhouse gas emission pathways, in the
context of strengthening the global response to the threat of
climate change, sustainable development, and efforts to eradicate
poverty, ed. V. Masson-Delmotte, P. Zhai, H. O. Portner, D.
Roberts, J. Skea, P.R. Shukla, A. Pirani, Y. Chen, et al. In Press.
Jensen, R.A., J. Madsen, M. O’Connell, M. Wisz, H. Tommervik, and
F. Mehlums. 2008. Prediction of the distribution of Arctic-
nesting pink-footed geese under a warmer climate scenario.
Global Change Biology 14: 1–10.
Jia, Q., K. Koyama, C.-Y. Choi, H.-J. Kim, L. Cao, D. Gao, G. Liu,
and A.D. Fox. 2016. Population estimates and geographical
distributions of swans and geese in East Asia based on counts
during the non-breeding season. Bird Conservation International
26: 397–417.
Kjellen, N. 2018. Migration counts at Falsterbo, SW Sweden. www.
falsterbofagelstation.se.
Lanctot, R.B., E.L. Weiser, B.K. Sandercock, and S.C. Brown. 2015.
2010–2014 Final report: using a network of sites to evaluate how
climate-mediated changes in the Arctic ecosystem are affecting
shorebird distribution, ecology and demography. Unpublished
report by the U.S. Fish and Wildlife Service, Kansas State
University, and Manomet Center for Conservation Sciences to
the Arctic Landscape Conservation Cooperative. U.S. Fish and
Wildlife Service, Anchorage, AK. 74 p.
Lappo, E., P. Tomkovich, and E. Syroechkovskiy. 2012. Atlas of
breeding waders in the Russian Arctic, 448. Moscow: UF
Ofsetnaya Pechat.
Liljedahl, A.K., J. Boike, R.P. Daanen, A.N. Fedorov, G.V. Frost, G.
Grosse, L.D. Hinzman, Y. Iijma, et al. 2016. Pan-Arctic ice-
wedge degradation in warming permafrost and its influence on
tundra hydrology. Nature Geoscience 9: 312–318.
Machın, P., J. Fernandez-Elipe, and R.H.G. Klaassen. 2018. The
relative importance of food abundance and weather on the
growth of a sub-arctic shorebird chick. Behavioural Ecology and
Sociobiology 72: 42. https://doi.org/10.1007/s00265-018-2457-y.
Mariash, H., P.A. Smith, and M.L. Mallory. 2018. Decadal response
of Arctic freshwaters to burgeoning goose populations. Ecosys-
tems 21: 1230–1243.
McKinnon, L., E. Nol, and C. Juillet. 2013. Arctic-nesting birds find
physiological relief in the face of trophic constraints. Scientific
Reports 3: 1816.
McKinnon, L., M. Picotin, E. Bolduc, C. Juillet, and J. Bety. 2012.
Timing of breeding, peak food availability, and effects of
mismatch on chick growth in birds nesting in the High Arctic.
Canadian Journal of Zoology 90: 961–971.
McKinnon, L., P.A. Smith, E. Nol, J.L. Martin, F.I. Doyle, K.F.
Abraham, H.G. Gilchrist, et al. 2010. Lower predation risk for
migratory birds at high latitudes. Science 327: 326–327. https://
doi.org/10.1126/science.1183010.
Meltofte, H. (ed.). 2013. Arctic Biodiversity assessment. Status and
trends in Arctic biodiversity. Akureyri: Conservation of Arctic
Flora and Fauna.
Meltofte, H., J. Durinck, B. Jakobsen, C. Nordstrøm, and F.F. Riget.
2019. Trends in the autumn passage numbers of Arctic and
boreal waders in W Denmark 1964–2017 as a contribution to
East Atlantic Flyway population trends. Ardea 107: 211. https://
doi.org/10.5253/arde.v107i2.a7.
Meltofte, H., T. Piersma, H. Boyd, B. McCaffery, B. Ganter, V.V.
Golovnyuk, K. Graham, et al. 2007. Effects of climate variation
on the breeding ecology of Arctic shorebirds. Meddelelser om
Grønland Bioscience 59. Copenhagen, Danish Polar Center
2007. 48 pp.
Myers-Smith, I.H., B.C. Forbes, M. Wilmking, M. Hallinger, T.
Lantz, D. Blok, K.D. Tape, M. Macias-Fauria, et al. 2011. Shrub
expansion in tundra ecosystems: Dynamics, impacts and
research priorities. Environmental Research Letters 6: 045509.
North American Bird Conservation Initiative Canada. 2012. The State
of Canada’s Birds, 2012. Environment Canada, Ottawa, Canada.
36 p.
Partners in Flight. 2017. Avian Conservation Assessment Database,
version 2017. Retrieved fromhttp://pif.birdconservancy.org/
ACAD.
Petersen, A., C. Zockler, and M.V. Gunnarsdottir. 2004. Circumpolar
Biodiversity Monitoring Program Framework Document—
CBMP Report No. 1.
Potapov, E. 2011. Gyrfalcons in Russia: Current status and conser-
vation problems. In Gyrfalcons and Ptarmigan in a Changing
World, ed. Watson, R.T., T.J. Cade, M. Fuller, G. Hunt, and E.
Potapov. The Peregrine Fund, Boise, Idaho, USA. http://dx.doi.
org/10.4080/gpcw.2011.0218.
Potapov, E., and R. Sale. 2005. The gyrfalcon. New Haven: Yale
University Press.
123� The Author(s) 2020
www.kva.se/en
746 Ambio 2020, 49:732–748

Potapov, E., and R. Sale. 2013. Chapter 8: Numbers and Population
Density. In The snowy owl, ed. E. Potapov and R. Sale, 159–198.
London: T & AD Poyser.
Rakhimberdiev, E., S. Duijns, J. Karagicheva, C.J. Camphuysen, A.
Dekinga, R. Dekker, and M. Soloviev. 2018. Fuelling conditions
at staging sites can mitigate Arctic warming effects in a
migratory bird. Nature Communications 9: 4263.
Reed, E.T., K.J. Kardynal, J.A. Horrocks, and K.A. Hobson. 2018.
Shorebird hunting in Barbados: Using stable isotopes to link the
harvest at a migratory stopover site with sources of production.
Condor 120: 357–370.
Reneerkens, J., N.M. Schmidt, O. Gilg, J. Hansen, L.H. Hansen, J.
Moreau, and T. Piersma. 2016. Effects of food abundance and
early clutch predation on reproductive timing in a high Arctic
shorebird exposed to advancements in arthropod abundance.
Ecology and Evolution 6: 7375–7386.
Robinson, R.A., N.A. Clark, R. Lanctot, S. Nebel, B. Harrington, J.A.
Clark, J.A. Gill, H. Meltofte, et al. 2005. Long term demographic
monitoring of wader populations in non-breeding areas. Wader
Study Group Bull. 106: 17–29.
Ross, M., R. Alisauskas, D. Douglas, D. Kellett, and K. Drake. 2018.
Density-dependent and phenological mismatch effects on growth
and survival in lesser snow and Ross’s goslings. Journal of Avian
Biology 2018: e01748.
Saalfeld, S.T., and R.B. Lanctot. 2017. Multispecies comparisons of
adaptability to climate change: a role for life-history character-
istics? Ecology and Evolution 7: 10492–10502.
Sauer, J.R., and W.A. Link. 2011. Analysis of the North American
Breeding Bird Survey using hierarchical models. Auk 128:
87–98.
Schmidt, N.M., B. Hardwick, O. Gilg, T.T. Høye, P.H. Krogh, H.
Meltofte, A. Michelsen, et al. 2017. Interaction webs in Arctic
ecosystems: determinants of arctic change? Ambio 46: 1–25.
https://doi.org/10.1007/s13280-016-0862-x.
Senner, N.R., W.M. Hochachka, J.W. Fox, and V. Afanasyev. 2014.
An exception to the rule: Carry-over effects do not accumulate in
a long-distance migratory bird. PLoS ONE. https://doi.org/10.
1371/journal.pone.0086588.
Senner, N.R., M. Stager, and B.K. Sandercock. 2017. Ecological
mismatches are moderated by local conditions for two popula-
tions of a long-distance migratory bird. Oikos 126: 61–72.
Soykan, C.U., J. Sauer, J.G. Schuetz, G.S. LeBaron, K. Dale, and
G.M. Langham. 2016. Population trends for North American
winter birds based on hierarchical models. Ecosphere 7: 01351.
https://doi.org/10.1002/ecs2.1351.
Studds, C.E., B.E. Kendall, N.J. Murray, H.B. Wilson, D.I. Rogers,
R.S. Clemens, K. Gosbell, C.J. Hassell, et al. 2017. Rapid
population decline in migratory shorebirds relying on Yellow
Sea tidal mudflats as stopover sites. Nature Communications 8:
14895. https://doi.org/10.1038/ncomms14895.
Therrien, J.F., G. Gauthier, and J. Bety. 2011. An avian terrestrial
predator of the Arctic relies on the marine ecosystem during
winter. Journal of Avian Biology 42: 363–369.
Tomkovich, P.S., and M.Y. Soloviev. 2017. Breeding bird conditions
in the circumpolar Arctic during 2015. ABBCS report. Retrieved
from http://www.arcticbirds.net/review2015.pdf.
Tulp, I., and H. Schekkerman. 2008. Has prey availability for arctic
birds advanced with climate change? Hindcasting the abundance
of tundra arthropods using weather and seasonal variation. Arctic
61: 48–60.
van Gils, J.A., S. Lisovski, T. Lok, W. Meissner, A. O _zarowska, J. deFouw, E. Rakhimberdiev, M.Y. Soloviev, et al. 2016. Body
shrinkage due to Arctic warming reduces red knot fitness in
tropical wintering range. Science 352: 819–821.
Watson, R.T., T.J. Cade, M. Fuller, G. Hunt, and E. Potapov (eds.).
2011. Gyrfalcons and Ptarmigan in a changing world, vol.
I. Boise: The Peregrine Fund.
Wauchope, H., J.D. Shaw, Ø. Varpe, E.G. Lappo, D. Boertmann, R.B.
Lanctot, and R.A. Fuller. 2017. Rapid climate-driven loss of
breeding habitat for Arctic migratory birds. Global Change
Biology 23: 1085–1094.
Weiser, E.L., S. Brown, R.B. Lanctot, H.R. Gates, K.F. Abraham,
R.L. Bentzen, J. Bety, et al. 2018. Effects of environmental
conditions on reproductive effort and nest success of Arctic-
breeding shorebirds. Ibis 160: 608–623.
Wetlands International. 2018. Waterbird Population Estimates.
Retrieved 1 October, 2018, from http://wpe.wetlands.org.
White, C.M., T.J. Cade, and J.H. Enderson. 2013. Peregrine falcons
of the world. Barcelona: Lynx Edicions.
Wirta, H., E. Vesterinen, P. Hamback, E. Weingartner, C. Rasmussen,
J. Reneerkens, N. Schmidt, and O. Gilg, et al. 2015. Exposing
the structure of an Arctic food web. Ecology and Evolution 5:
3842–3856.
Yu, H., X. Wang, L. Cao, L. Zhang, Q. Jia, H. Lee, and A.D. Fox.
2017. Are declining populations of wild geese in China
‘prisoners’ of their natural habitats? Current Biology 27 (10):
R376–R377.
Zhao, M., P. Cong, M. Barter, A.D. Fox, and L. Cao. 2012. The
changing abundance and distribution of Greater White-fronted
Geese Anser albifrons in the Yangtze River floodplain: Impacts
of recent hydrological changes. Bird Conservation International
22: 135–143.
Zockler, C. 1998. Patterns in biodiversity in Arctic birds. WCMC
Biodiversity Bulletin No. 3, World Conservation Press.
Zockler, C. 2008. The role of the goose specialist group in the
Circumpolar Biodiversity Monitoring Programme (CBMP).
Vogelwelt 129: 127–130.
Zockler, C. 2012. Status, threat, and protection of Arctic waterbirds.
In Protection of the three poles, ed. F. Huettmann, 203–216.
Tokyo: Springer.
Zockler, C. and I. Lysenko. 2000. Water birds on the edge: first
circumpolar assessment of climate change impact on Arctic
breeding water birds. WCMC Biodiversity Series no. 11, World
Conservation Press.
Publisher’s Note Springer Nature remains neutral with regard to
jurisdictional claims in published maps and institutional affiliations.
AUTHOR BIOGRAPHIES
Paul A. Smith (&) is a Research Scientist with Environment and
Climate Change Canada. His research interests include terrestrial
ecology of the Arctic and the breeding ecology of tundra birds.
Address: Wildlife Research Division, Environment and Climate
Change Canada, National Wildlife Research Centre, 1125 Colonel By
Dr, Ottawa, ON K1S 5B6, Canada.
Address: National Wildlife Research Centre, 1125 Colonel By Dr,
Ottawa, ON K1S 5B6, Canada.
e-mail: [email protected]
Laura McKinnon is an Assistant Professor in the Bilingual Biology
Program and Graduate Program in Biology at York University
Glendon Campus. Her research interests include the reproductive and
migratory ecology of shorebirds in arctic and temperate environ-
ments.
Address: Department of Multidisciplinary Studies and Graduate
Program in Biology, York University, Glendon Campus, 2275 Bay-
view Ave, Toronto, ON M5B 3M6, Canada.
e-mail: [email protected]
� The Author(s) 2020
www.kva.se/en 123
Ambio 2020, 49:732–748 747

Hans Meltofte is Senior Advisor Emeritus at Aarhus University. He
has been working with wildlife and the effects of climate change in
the Arctic for half a century.
Address: Department of Bioscience, Aarhus University, Frederiks-
borgvej 399, 4000 Roskilde, Denmark.
e-mail: [email protected]
Richard B. Lanctot is the Shorebird Coordinator for the Alaska
Region of the U.S. Fish and Wildlife Service. His research focuses on
understanding the factors that limit population size of arctic-breeding
shorebirds on their breeding grounds and while migrating and win-
tering.
Address: Migratory Bird Management, U.S. Fish and Wildlife Ser-
vice, 1011 East Tudor Road, Anchorage, AK 99503, USA.
e-mail: [email protected]
Anthony D. Fox is Professor of Waterbird Ecology at Aarhus
University. His research focuses on applied goose ecology issues
throughout the northern hemisphere.
Address: Department of Bioscience, Aarhus University, Kalø, Gre-
navej 14, 8410 Rønde, Denmark.
e-mail: [email protected]
James O. Leafloor is a Waterfowl Biologist with the Canadian
Wildlife Service, where he specialises in the abundance, demography
and systematics of northern goose populations.
Address: Wildlife Research Division, Environment and Climate
Change Canada, National Wildlife Research Centre, 1125 Colonel By
Dr, Ottawa, ON K1S 5B6, Canada.
Address: Canadian Wildlife Service, Environment and Climate
Change Canada, 150-123 Main St, Winnipeg, MB R3C 4W2, Canada.
Address: National Wildlife Research Centre, 1125 Colonel By Dr,
Ottawa, ON K1S 5B6, Canada.
e-mail: [email protected]
Mikhail Soloviev is a Senior Researcher at the Lomonosov Moscow
State University. His research interests include the ecology of Arctic
birds and global change in Arctic terrestrial ecosystems.
Address: Department of Vertebrate Zoology, Lomonosov Moscow
State University, Moscow, Russia 119991.
e-mail: [email protected]
Alastair Franke is Principal Investigator of the Arctic Raptors Pro-
ject, a research group working in Nunavut, Canada, focused on the
ecology of Arctic-nesting raptors and their prey within the context of
climate change. He holds an adjunct professorship in the Department
of Biological Sciences at the University of Alberta.
Address: Department of Biological Sciences, University of Alberta,
Edmonton, AB, Canada.
e-mail: [email protected]
Knud Falk is an independent researcher and consultant on Arctic
biodiversity monitoring and management. Together with Søren
Møller, he has co-led the peregrine falcon monitoring project in South
Greenland since 1981.
Address: www.vandrefalk.dk, Ljusstoparbacken 11A, 11765 Stock-
holm, Sweden.
e-mail: [email protected]
Mikhail Golovatin is a Director of the Institute of Plant and Animal
Ecology. His research interests focus on habitat use, numbers and
population dynamics of birds in north-western Siberia and the Ural
Mountains.
Address: Institute of Plant and Animal Ecology Ural Branch, Russian
Academy of Sciences, 8 Marta Str, 202, Ekaterinburg, Russia 620144.
e-mail: [email protected]
Vasiliy Sokolov is a Researcher at the Institute of Plant and Animal
Ecology. His research explores the structure and dynamics of Arctic
bird species, and their communities, in the high Arctic of the Yamal
peninsula.
Address: Institute of Plant and Animal Ecology Ural Branch, Russian
Academy of Sciences, 8 Marta Str, 202, Ekaterinburg, Russia 620144.
e-mail: [email protected]
Aleksandr Sokolov is a Senior Researcher at the Arctic Research
Station of the Institute of Plant and Animal Ecology. He is interested
in studies of the structure and function of terrestrial tundra ecosys-
tems.
Address: Arctic Research Station, Institute of Plant and Animal
Ecology, Zelenaya Gorka Str., 21, Yamal-Nenets Autonomous Dis-
trict, Labytnangi, Russia 629400.
e-mail: [email protected]
Adam C. Smith is Senior Biostatistician with the Canadian Wildlife
Service, and an adjunct professor at Carleton University. He studies
the statistical and ecological aspects of monitoring species population
status and trends, particularly for migratory birds.
Address: Canadian Wildlife Service, Environment and Climate
Change Canada, 1125 Colonel By Dr, Ottawa, ON K1S 5B6, Canada.
Address: Department of Biology, Carleton University, 1125 Colonel
By Dr, Ottawa, ON K1S 5B6, Canada.
Address: National Wildlife Research Centre, 1125 Colonel By Dr,
Ottawa, ON K1S 5B6, Canada.
e-mail: [email protected]
123� The Author(s) 2020
www.kva.se/en
748 Ambio 2020, 49:732–748