Embed Size (px)
Citation preview

Rail Diesel Study, WP 1 “Status and future development of the diesel fleet”Final Report, 21.07.2005
1
Rail Diesel StudyWP1 Final Report
Status and future developmentof the diesel fleet
ByMarkus Halder, Andreas Löchter, DB AG
21.07.2005

Rail Diesel Study, WP 1 “Status and future development of the diesel fleet”Final Report, 21.07.2005
2
Contents
1 Management summary of WP 1........................................................................................ 3
2 Status of the diesel fleet in Europe ................................................................................... 5
2.1 Relevance and role of diesel traction............................................................................... 52.1.1 Diesel traction share........................................................................................................................................52.1.2 Absolute performance of diesel traction (UIC-member railways)..........................................................62.1.3 Running performance per train traffic........................................................................................................102.1.4 Wagon-load per train in freight traffic .......................................................................................................11
2.2 Characterisation of European diesel fleet ..................................................................... 122.2.1 Absolute number of diesel vehicles (including rolling stock information from non-UIC sources)122.2.2 Engine power distribution............................................................................................................................142.2.3 Average age and age distribution ...............................................................................................................152.2.4 Re-engined tractive units..............................................................................................................................17
2.3 Energy consumption and exhaust emission................................................................... 182.3.1 Diesel consumption.......................................................................................................................................182.3.2 Emission limit values....................................................................................................................................202.3.3 Emission behaviour of European fleet .......................................................................................................212.3.4 Case study: Emission behaviour of DB’s fleet .........................................................................................242.3.5 Sulphur content of diesel fuel......................................................................................................................26
3 Future development of the diesel fleet in Europe .......................................................... 283.1 UIC member’s expectations for their fleet development ............................................... 28
3.2 Decommissioning age and future life expectancy .......................................................... 30
3.3 Scenarios for European diesel fleet development .......................................................... 323.3.1 Scenario A “Average number of new diesel engines”............................................................................353.3.2 Scenario B “Low number of new diesel engines”...................................................................................363.3.3 Scenario C “High number of new diesel engines”..................................................................................38
4 Annex............................................................................................................................... 40
4.1 Covered UIC member railways ..................................................................................... 40
4.2 Absolute performance figures ....................................................................................... 41
4.3 Figures with specific wagon load / performance values ................................................. 43
4.4 Figures characterising the diesel fleet composition........................................................ 44
4.5 Questionnaire A: Fleet details ....................................................................................... 47

Rail Diesel Study, WP 1 “Status and future development of the diesel fleet”Final Report, 21.07.2005
3
1 Management summary of WP 1The results of Work Package 1 “Status and future development of the diesel fleet”serve as an important basis for the subsequent work packages in the “Rail DieselStudy”, especially for assessing technical and operational possibilities for dieselexhaust emission reductions, to assess the relevance of diesel exhaust emissions onlocal air quality and to develop strategies and scenarios for emission reductions.
The information that has been collected on the existing diesel fleet in Europe, and theestimates that have been made for the future development of the fleet, highlight thecomplexity of the topic. There are in many cases a large number of indicatorscharacterising the diesel fleet due to different situations in various countries orrailway companies:§ Rail diesel traction has comparably high absolute operating performances in
countries like Germany, France, UK, the Baltic states and further new EU memberstates. The new EU 10 represent more than one third of the covered Europeandiesel operating performance.
§ In the Baltic States, Ireland and Greece, there is almost no electrified track anddiesel traction is the backbone of rail traffic. This is in contrast to countries suchas Germany and France where diesel traction is typically used for feeder traffic onsparsely used lines (although it should be recognised that diesel traction stillaccounts for 10% of all rail traffic in France, and 20% in Germany). In a fullyelectrified country like Switzerland, diesel traction is only rarely used for somemaintenance and shunting operations.
§ Different situations in various countries also result in there being a large numberof indicators that describe the intensity of use of the diesel fleet, e.g. the averagetrain-km per tractive unit or the average wagon load in tonnes per diesel freighttrain. Due to the fact that diesel traction is widely used also for shunting and civilengineering processes and on lines with low traffic density, average utilisation ismuch lower compared to electric traction. The main exceptions to this are theheavy haul diesel freight trains in the Baltic countries with an average wagon loadof up to 3000 tonnes per train.
As diesel exhaust emissions and the costs and benefits of applying emissionabatement measures are directly related to the number of diesel engines, theinvestigations carried out for this study were aimed at identifying the number of dieselrail engines rather than of the number of diesel rail vehicles. UIC members’ fleetsrepresents around 85 % of European diesel rail engines with around 17 000locomotive and 14 000 railcar engines. Around 2 700 locomotive and 2 600 railcardiesel engines are used by non-UIC members.
It has to be noted that these engines do not represent an homogenous entity, assome of them are intensively used in heavy haul freight trains or in passenger crosscountry or Intercity trains, others less intensively e.g. for shunting, civil engineering oron rural passenger lines or they just fulfil the function of supplementary tractive units.The latter is often the case for very old diesel tractive units that still appear in railwayrolling stock statistics.
The majority of the railways in a questionnaire survey sent to UIC members inEurope confirmed that very old tractive units are used less intensively than youngerones. The results of this survey show that one third of locomotives and 7 % of railcar

Rail Diesel Study, WP 1 “Status and future development of the diesel fleet”Final Report, 21.07.2005
4
diesel engines are older than 35 years. Taking these ones into account the averageage of diesel railcar engines is reported to be 16 years, for locomotives the averageengine age is 27 years, again with a very large range of values for different Europeanrailway companies.
Emission factors for representative vehicles reported from UIC member railways aresignificantly lower for newer railcars and locomotives (classified as those that enteredservice after 1990) compared to older ones, however with a rather high range ofvalues. This is in accordance to the development of the UIC emission requirementswith stricter limit values from stage to stage.
As SO2 emissions are directly related to the sulphur content of the fuel and a lowsulphur content is a prerequisite for some exhaust after-treatment measures, aquestionnaire survey asked UIC members for the quality of the used diesel fuel. Onequarter of the railway companies report that they already now use low sulphur dieselfuel with a maximum of 10 ppm sulphur content.
When asked about expectations for the future development of their diesel fleets, UICmembers assumed that on average there would be a decline in the total numbers ofvehicles in their entire diesel fleets, but that there would be an increasing number ofdiesel railcars. It can furthermore be noticed that for many new rail operators on themarket, diesel traction offers more flexibility and a quicker route to some form ofinteroperability especially in cross-border traffic.
The main influencing parameters for scenarios to describe the future development ofthe diesel fleet in Europe are the life expectancy, or decommissioning age of thevehicles, and the anticipated market development for rail traffic (amended for dieseltraction). Productivity development and the effects of market liberalisation have alsobeen taken into account.
Based on basic assumptions for the different influencing parameters, it is expectedthat around 8 500 railcars, and between 9 000 new locomotives will be purchased inEurope between 2005 and 2020. However these values should be viewed as roughestimates as it was not possible within the scope of this study to carry out a verydetailed assessment of the future development of the very complex rail diesel market.
Rail Diesel Study, WP 1 “Status and future development of the diesel fleet”Final Report, 21.07.2005
5
2 Status of the diesel fleet in EuropeThe aim of this chapter is to describe the existing railway diesel fleet in Europe asbasis for the subsequent steps in the study. First, the relevance and role of dieseltraction in different countries is examined in comparison to electric traction. Second,the composition of the diesel fleet is characterised in more detail.
The main focus of the analysis is on the UIC member railways, representing mainlythe major, in most cases state owned railway companies, however rolling stockinformation from non-UIC railways is also taken into account (see chapter 2.2.1).
Table 16 (see Annex 4.1) lists the UIC member railways, the abbreviations used in thereport and the members providing statistical data through the survey carried out aspart of the study.
2.1 Relevance and role of diesel tractionThe following evaluations make use of the official UIC statistic database Railisa withmost recent data available from the different UIC members. Implausible and missingvalues have been corrected and estimated as far as possible to allow for analysingthe relevance of diesel traction in Europe. Detailed validation of every value (e.g. atstatistical departments of the companies) was not feasible within the time frame ofthe study. Nevertheless, the results allowed development of a suitable description ofthe relevance and role of diesel traction in different European countries.
2.1.1 Diesel traction shareWhen looking at the share of diesel traction in different European countries (Figure 1)it is obvious that diesel traction is the backbone of railway traffic in countries with littleor no electrification of the railway network. This is the case for Baltic countriesEstonia, Latvia and Lithuania as well as Ireland and Greece. In countries with a majorproportion of electrification, diesel traction is normally used less intensively thanelectric traction. Non-electrified lines of them have often a low traffic density, forexample feeder lines to shunting yards for freight traffic or rural lines for passengertraffic. The main corridors with high traffic density in these countries are mostlyelectrified.
An example with no regular diesel traffic occurring can be found in Switzerland, whichhas a fully electrified railway network. Diesel locomotives are only rarely used forsome maintenance and shunting operations.
The average diesel traction share for all covered countries is approximately 20 %based on the operating performance. The average share of non-electrified railwaylines is approximately 50%.

Rail Diesel Study, WP 1 “Status and future development of the diesel fleet”Final Report, 21.07.2005
6
0,0%
10,0%
20,0%
30,0%
40,0%
50,0%
60,0%
70,0%
80,0%
90,0%
100,0%
CH
-GR
LG-L
T
EV
R-E
E
LDZ
-LV
CIE
-IE
NS
B-N
O
AT
OC
-GB
CP
-PT
CFR
-RO
CF
L-LU
VR
-FI
DB
AG
-DE
MA
V-H
U
SZ
-SI
CD
-CZ
ZS
SK
-SK
RE
NF
E-E
S
SN
CB
/NM
BS
-BE
SN
CF-
FR
BD
Z-B
G
PK
P-P
L
SJ
AB
-SE
GyS
EV
/RÖ
EE
-HU
FS
-IT
ÖB
B-A
T
Gre
en C
argo
-SE
CF
F/S
BB
/FF
S-C
H
BLS
-CH
0%
10%
20%
30%
40%
50%
60%
70%
80%
90%
100%
%tkm diesel %lines non-electrified
Figure 1: Share of diesel of overall operating performance in gross-tkm hauled (left axis, blue bars) &share of kilometres non-electrified (right axis, red lines)1 (Source: UIC statistics)
It should be noted for Figure 1 that the percentage of diesel traction is based upon theoperating performance displayed in gross-tkm hauled. This unit describes the loadhauled in tonnes (without the weight of a locomotive) times the kilometres. This valueallows for a combination of both passenger and freight traffic in one unit, in contrastto traffic performance values like passenger-km in passenger traffic or net-tkm infreight traffic.
An alternative unit is running performance in train-km. Using this measure, a smallrailcar running one kilometre would count the same as a very long freight trainrunning one kilometre. Thus the running performance gives a good figure for trainmovements, the gross-tkm hauled are more linked to the work performed by thetractive unit and consequently to the energy consumption and exhaust emission, thatare the main focus of the study.
2.1.2 Absolute performance of diesel traction (UIC-member railways)Despite of having a diesel traction share below 20 %, companies like DB AG(Germany) and SNCF (France) end up with comparably high absolute dieseloperating performances simply due to their size (Figure 2). Furthermore railways inthe Baltic countries and Great Britain show above-average diesel operatingperformance values. Smaller companies with a minor diesel traction share, such asSJ AB (Sweden), CFL (Luxembourg) or NS (Netherlands) contribute to a very lowextent to the overall European operating performance with diesel traction. 1 Data not for every country available in UIC statistics

Rail Diesel Study, WP 1 “Status and future development of the diesel fleet”Final Report, 21.07.2005
7
0
10.000
20.000
30.000
40.000
50.000
60.000
70.000
DB
AG
-DE
LDZ
-LV
SN
CF
-FR
ATO
C-G
B
LG-L
T
EV
R-E
E
CF
R-R
O
PK
P-P
L
VR
-FI
CD
-CZ
RE
NFE
-ES
MA
V-H
U
FS-IT
SN
CB
/NM
BS
-BE
CIE
-IE
ZSS
K-S
K
CP
-PT
DS
B-D
K
CH
-GR
ÖB
B-A
T
NS
B-N
O
BD
Z-B
G
Gre
en C
argo
-SE
SZ-
SI
SJ
AB
-SE
CF
L-LU
NS
-NL
[106 tkm]
Figure 2: Operating performance of different European railways in gross-tkm hauled (Source: UICstatistics)
The importance of the new EU Member States can be seen in Figure 3, as theyaccount for more than one third of the European diesel operating performance withjust 16 % of the enlarged Europe’s population. The UIC member railways in EU 15represent nearly 60 %, the other non-EU member countries covered in the study(Norway, Switzerland, Bulgaria and Romania) fill out the missing 7 %, with 5 % fromRomania.
165.364
104.910
18.856
EU 15
EU 10
NO, CH, BG, RO
Figure 3: Diesel operating performance in gross-tkm hauled for EU 15, EU 10 (New EU members) andNorway, Switzerland, Romania, Bulgaria (Source: UIC statistics)

Rail Diesel Study, WP 1 “Status and future development of the diesel fleet”Final Report, 21.07.2005
8
Comparable conclusions can be drawn when looking at the running performancemeasured in train-km with diesel traction (Figure 4). Compared with Figure 2companies with a lot of diesel passenger traffic like DB, SNCF or the ATOCcompanies rank relatively higher than countries with a high share of diesel freighttraffic. An example for the latter are the Baltic countries with a high percentage ofheavy diesel freight trains as displayed in Figure 5. This figure shows the distributionof the diesel operating performance for passenger and for freight traffic in differentEuropean railway companies. A comparable figure is shown in Figure 6, based on therunning performance.
0
50.000
100.000
150.000
200.000
250.000
DB
AG
-DE
AT
OC
-GB
SN
CF-
FR
CD
-CZ
FS
-IT
MA
V-H
U
CFR
-RO
RE
NF
E-E
S
DS
B-D
K
PK
P-P
L
ÖB
B-A
T
CH
-GR
ZS
SK
-SK
LDZ
-LV
LG-L
T
CIE
-IE
SJ
AB
-SE
VR
-FI
SN
CB
/NM
BS
-BE
EV
R-E
E
SZ
-SI
BD
Z-B
G
NS
-NL
NS
B-N
O
Gre
en C
argo
-SE
CF
L-LU
GyS
EV
/RÖ
EE
-HU
[103 km]
Figure 4: Diesel running performance of different European railways in train-km (Source: UICstatistics)

Rail Diesel Study, WP 1 “Status and future development of the diesel fleet”Final Report, 21.07.2005
9
0
5.000
10.000
15.000
20.000
25.000
30.000
35.000
40.000
DB
AG
-DE
LDZ-
LV
SN
CF
-FR
ATO
C-G
B
LG-L
T
EV
R-E
E
CF
R-R
O
PK
P-P
L
VR
-FI
CD
-CZ
RE
NFE
-ES
MA
V-H
U
FS
-IT
SN
CB
/NM
BS
-BE
CIE
-IE
ZSS
K-S
K
CP
-PT
DS
B-D
K
CH
-GR
ÖB
B-A
T
NS
B-N
O
BD
Z-B
G
Gre
en C
argo
-SE
SZ-
SI
SJ
AB
-SE
CF
L-LU
NS
-NL
Diesel Passenger Diesel Freight
[106 tkm]
Figure 5: Diesel operating performance (gross-tkm hauled) differentiated by passenger and freight(Source: UIC statistics)
0
50.000
100.000
150.000
200.000
250.000
DB
AG
-DE
ATO
C-G
B
SN
CF
-FR
CD
-CZ
FS
-IT
MA
V-H
U
CF
R-R
O
RE
NFE
-ES
DS
B-D
K
PK
P-P
L
ÖB
B-A
T
CH
-GR
ZSS
K-S
K
LDZ-
LV
LG-L
T
CIE
-IE
SJ
AB
-SE
VR
-FI
SN
CB
/NM
BS
-BE
EV
R-E
E
SZ-
SI
BD
Z-B
G
NS
-NL
NS
B-N
O
Gre
en C
argo
-SE
CFL
-LU
GyS
EV
/RÖ
EE
-HU
Diesel Passenger Diesel Freight
[103 km]
Figure 6: Diesel running performance (train-km) differentiated by passenger and freight (Source: UICstatistics)
The average for the covered companies share of diesel freight traffic is 59 % of theoperating performance in gross-tkm and 13 % of the running performance in train-km(Figure 7). This means that in Europe more tonne-km are hauled by diesel traction in

Rail Diesel Study, WP 1 “Status and future development of the diesel fleet”Final Report, 21.07.2005
10
freight traffic than in passenger traffic but the diesel train movements, described bythe train-kilometres, are much higher in passenger traffic.
However, the share between diesel freight and passenger traffic in single railwaycompanies can differ significantly from these average values.
41%
59% tkm diesel passenger
tkm diesel freight
87%
13%
km diesel passenger
km diesel freight
Figure 7: Share of diesel passenger and freight traffic (left: based on gross-tkm hauled, right: based ontrain-km) (Source: UIC statistics)
When considering passenger traffic, on average over 70 % of all train-km in UICstatistics have been performed by railcars, less than 30 % by locomotives with a highrange of values depending on the company (Figure 35 in annex 4.2.). From the diesellocomotives in average 64 % of the train-km were performed for passenger, 36 % forfreight traffic (Figure 36 in annex 4.2.).
2.1.3 Running performance per train trafficThe intensity of use of the tractive units can be estimated through dividing therunning performance with diesel traction by the number of diesel tractive units in eachcompany. In Figure 8 the solid bars show the average train-km per tractive unit fordiesel locomotives and railcars compared to an average value for electric traction.(Line bars indicate the ranges of values for different companies). In particular, diesellocomotives (around 20 000 km per tractive unit) are on average used much lessthan their electric counterparts. This is mainly due to their use for feeder traffic onrather short and sparsely used lines. Furthermore this very low value could also be aresult of a high number of locomotives appearing in statistics, although no longer inintensive use, but rather having the function of supplementary tractive units, beingused as shunting or as civil engineering locomotive.
As indicated with the span between the minimum and maximum values in Figure 8 therunning performance per tractive unit can differ significantly between the differentrailway companies. The company specific values are displayed in the annex, Figure37 - Figure 39, with for example the upper limits of about 220 000 km per railcar at SJin Sweden and 230 000 km per diesel loco at ATOC in the UK.

Rail Diesel Study, WP 1 “Status and future development of the diesel fleet”Final Report, 21.07.2005
11
0
50
100
150
200
250
Electric Traction Diesel Locos Diesel Railcar
[103 km per tractive unit]
Figure 8: Average annual running performance (train-km) per tractive unit plus indicated minimum andmaximum value (Source: UIC statistics)
2.1.4 Wagon-load per train in freight traffic
Another figure to describe the role of diesel traction is the average wagon load perfreight train, calculated by dividing the gross-tkm hauled by the train-km. Figure 9shows the average values for electric and diesel freight traffic. Whereas an electricfreight locomotive hauls on average about 1070 tonnes in Europe, an average dieselfreight locomotive hauls around 2850 tonnes in the Baltic countries and around 720tonnes in the other European countries. The broad span of values indicated in Figure9 can also be seen in Figure 40 in the annex with the individual company values.Whereas in the Baltic countries diesel traction is used for very heavy bulk good trainsalso on main lines, it is in most other countries used more for feeder traffic. As resultthe wagon-loads per diesel train are lower than for electric trains. Furthermore thereare higher wagon-loads possible in the Baltic state with different couplings and biggerstructure gauges.
0
500
1.000
1.500
2.000
2.500
3.000
Electric Freight Diesel Freight Diesel Freight Baltic
[t/ train]
Figure 9: Wagon load (tonnes) per freight diesel train for electric and diesel traction as average andrange in Europe (without Baltic nations) and in the Baltic nations. (Source: UIC statistics)

Rail Diesel Study, WP 1 “Status and future development of the diesel fleet”Final Report, 21.07.2005
12
2.2 Characterisation of European diesel fleetThe following chapter describes the composition of the railway diesel fleet in Europe.The evaluation mainly utilises the feedback on a questionnaire survey of UICmembers, supplemented by UIC statistic values and additional sources for non-UICrailway companies. In February 2005 this questionnaire to collect fleet details wassent out to 35 UIC member railway operating or integrated companies in Europe. 26companies answered the questionnaire, covering most major railway companies inEurope (see annex 4.1). Fleet data from ATOC members in UK have been in thiscontext aggregated for one value. The questionnaire with a summary of answers toeach question can be found in the annex 4.5.
Additional to the absolute number of diesel engines there is other detailedinformation concerning power and age distribution available in the questionnairesurvey data. Therefore the analysis in chapter 2.2.2 - 2.2.4 will mainly be based onthis source.
2.2.1 Absolute number of diesel vehicles (including rolling stock information fromnon-UIC sources)
Based on the UIC statistics there are around 17640 diesel locomotives and 8775diesel railcars in operation in UIC member railways (company specific values can befound in Figure 41 in annex 4.4).
A railcar is a self-propelled railway vehicle designed to transport passengers. Theterm 'railcar' is usually used in reference to a train consisting of a single poweredcarriage (including driver's cab and seats for passengers), that may be used on itsown, or that may be coupled to unpowered trailing carriages. Powered railcars mayalso be coupled together to form multiple unit trainsets consisting of two or morepowered railcars. When powered by diesel engines, these are referred to as DMU(diesel multiple unit) trainsets. In many cases, such trainsets are always used in afixed configuration that has more than one powered railcar. For example, in the UK,the Class 180 Adelante DMU trainset consists of five carriages, each of which has itsown engine. This trainset is never split up to operate with fewer than five carriages,and for the purposes of the vehicle statistics presented in this report, such a trainsetis considered as one vehicle. Where a single railcar is used to pull unpoweredcarriages, this is also considered as a single vehicle. However, in calculating thetotal number of engines in a trainset, it is clear that for the Class 180 Adelantetrainset, there are five engines per trainset, and this factor is taken into account. Forthe purposes of this study, single railcars and DMU trainsets have been consideredtogether, but in estimating the total number of railcar/DMU engines, it has beennecessary to take into account the total number of engines in each trainset.
To crosscheck these UIC values additional the two sources Jane’s World Railways(JWR) and statistics from www.Railfaneurope.net (RFE) have been used, showing acomparable vehicle proportion of one third for railcars and two thirds for locomotives(see Table 1). Compared to UIC statistics, the absolute numbers of JWR and RFE areabout 5-15 % lower. Possible reasons for this differences could be on one hand thatUIC statistic data still contains vehicles that are no longer in use, or on the other handthat JWR and RFE do not cover all existing vehicles.

Rail Diesel Study, WP 1 “Status and future development of the diesel fleet”Final Report, 21.07.2005
13
UIC member diesel vehicle numbersSource:
Locomotives Railcars /DMU trainsets
17640 8775UIC statisticsShare 67 % 33 %
15402 7775Jane’s World RailwaysShare 66 % 34 %
16989(9773 Mainline, 7216 Shunting)
7453Railfaneurope.net
Share 70 % 30 %
Table 1: Number of diesel locomotive and railcar vehicles in UIC-members fleets (Sources: UICstatistics, Jane’s World Railways (2004-2005), Railfaneurope.net)
As for the emission behaviour of the vehicles and possible emission abatementtechnologies that are subject of this study the number of diesel engines are morerelevant as the number of diesel vehicles, the UIC questionnaire asked for numberand characteristics of diesel engines. Within the covered companies 15844 diesellocomotive and 11074 diesel railcar engines have been reported (see Table 2).As there is often more than one engine in a railcar the proportion of railcar engines inthe survey is higher than railcar vehicle numbers from UIC statistics.To compare the questionnaire values for engines with the values for vehicles in Table1 the number of diesel railcar vehicles were corrected in Table 2, assuming anaverage of 1.7 engines per railcar resp. diesel trainset. For locomotives it wasassumed that there is always one engine per locomotive. All sources show anaverage proportion of 54 % - 59 % locomotive and 41 % - 46 % railcar engines.
UIC member diesel engine numbersSource:
Locomotive Engines Railcar Engines
15844 11074Questionnaire survey (not all railwayscovered!) Share 59% 41%
17640 14887UIC statistics (as calculation basis)Share 54% 46%
15402 13218Jane’s World Railways (as calculation basis)Share 54% 46%
16989(9773 Mainline, 7216 Shunting) 12670
Railfaneurope.net (as calculation basis)
Share 57% 43%
Table 2: Number of diesel locomotives and railcar engines in UIC-members fleets (Sources:questionnaire survey, UIC statistics, Jane’s World Railways (2004-2005), Railfaneurope.net)
Although the values show a rather consistent proportion between locomotives andrailcars on average in Europeans diesel fleet, this value can differ significantly fromcompany to company (see Figure 42 in annex 4.4): from 94 % railcars at DSB(Denmark) to 0 % at ZSSK Cargo (Slovakia), CFF/SBB/FFS (Switzerland) and EVR(Estonia).
Additional to the number of locomotives and railcars from UIC members there arearound 2500 locomotives and 1200 railcars from non-UIC member railways in thecovered countries, based on statistics from Jane’s World Railways 2003-2004 (seeTable 3). Locomotive and railcar vehicle proportions are similar to those from UICstatistics.

Rail Diesel Study, WP 1 “Status and future development of the diesel fleet”Final Report, 21.07.2005
14
Non- UIC member diesel vehicle numbersSource:
Locomotives Railcars /DMU trainsets
2474 1184Jane’s World RailwaysShare 68 % 32 %
2917(1958 Mainline, 959 Shunting)
1945Railfaneurope.net
Share 60 % 40 %
Table 3: Number of diesel locomotive and railcar vehicles in non-UIC member fleets (Sources: Jane’sWorld Railways (2004-2005), Railfaneurope.net statistics)
Compared to the JWR data statistics from www.Railfaneurope.net (RFE) show ahigher proportion of railcars compared to locomotives. The number of railcars arewith 1945 significantly higher than in JWR with 1184 railcars, whereas thelocomotives are with 2917 just 18 % more than in JWR. As the RFE values for UIC-members are lower, these differences could be due to lower accuracy in trackingchanges to stock between UIC and non-UIC fleets. However, RFE statistics do alsoshow the split between mainline and shunting locomotives.
Table 4 shows the calculated number of diesel engines from non-UIC membersassuming as above in average 1.7 engines per railcar resp. diesel trainset.
Non- UIC member diesel engine numbersSource:
Locomotive Engines Railcar Engines
2474 2013Jane’s World Railways (as calculation basis)Share 55 % 45 %
2917(1958 Mainline, 959 Shunting)
3307Railfaneurope.net (as calculation basis)
Share 47 % 53 %
Table 4: Number of diesel locomotive and railcar engines in non-UIC member fleets (Sources: Jane’sWorld Railways (2004-2005), Railfaneurope.net statistics)
2.2.2 Engine power distributionIn the questionnaire the number of vehicles in the power categories used in the NonRoad Mobile Machinery Directive (amended through 2004/26/EC) was requested.
Locomotive > 2000 kW
9% Locomotive 130 - 560 kW
28%
Locomotive 561 - 2000 kW
63%
Figure 10: Engine power distribution for locomotives (Source: questionnaire survey)

Rail Diesel Study, WP 1 “Status and future development of the diesel fleet”Final Report, 21.07.2005
15
Most locomotive engines (63 %) are powered with 561-2000 kW and a smallerproportion below 560 kW (28 %). Just 9 % of the locomotive engines are above 2000kW.
For railcars a clear trend towards more powerful engines can seen from thequestionnaire results (see summary of question A4.1 in annex 4.5.). For locomotivesa trend to more powerful engines was reported in just in one third of the companies.The named age categories are not very helpful to differentiate between shunting andmain line locomotives as the middle power class contains certainly shuntinglocomotives as well as mainline locomotives.
2.2.3 Average age and age distributionThe average age of diesel railcar engines from all reported countries is 16 years, forlocomotives the average age is 27 years (Figure 11).
16
27
0
5
10
15
20
25
30
35
40
Railcars Locomotives
Years
Figure 11: Average and range of age of diesel railcar and diesel locomotive engines in Europeanrailways (Source: questionnaire survey)
The results show that in the fleet the youngest railcar engines (on company’saverage) can be found with 3 years at SNCB (Belgium) and VR (Finland), the oldestat SZ (Slovenia) with about 26 years. The maximum value of 30 years is due to just 4very old railcars in the fleet of the freight operator CFR Freight (Romania) and 2railcars at ZSSK Cargo (Slovakia). For locomotive engines the span is from 17 yearson average for the CFF/SBB/FFS (Switzerland) up to 35 years at SNCF (France), VR(Finland) or NSB (Norway) (Figure 43, annex 4.4).
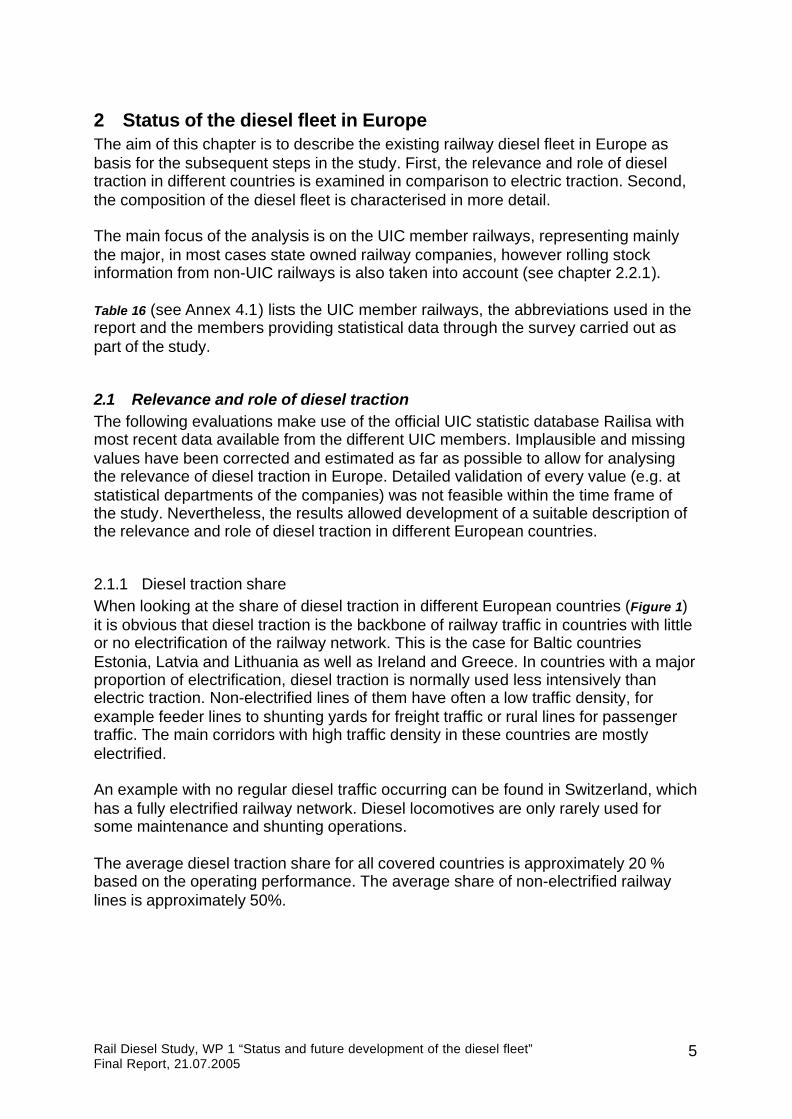
Figure 12 and Figure 13 show the age distribution for diesel railcars and locomotives.Whereas for railcars more than 50% of the engines are younger than 15 years(>=1990), it is just 20% for locomotives. One third of the locomotive and 7 % of therailcar engines are older than 35 years (1969 and older). However, it can beassumed that the very old vehicles are used much less intensively than more modernones, confirmed by the majority of railways in the questionnaire responses (seesummary of question A3.3 in annex 4.5). Engines older than 25-30 years are often
Rail Diesel Study, WP 1 “Status and future development of the diesel fleet”Final Report, 21.07.2005
16
used less intensively, although this depends a lot on the series and their reliability.There is often no formal reduced service. Newer locomotives are normally purchasedwith a defined application in mind and they are therefore used to cover this demand.This may lead to older locomotives (which are at the same time often less versatile,less powerful or less reliable than their new counterparts) being used less frequently.
2000 and newer23%
1995-199918%
1990-199412%
1980-198925%
1970-197915%
1969 and older7%
1990-199930%
Figure 12: Age distribution of diesel railcar engines (Source: questionnaire survey)
2000 and newer12%
1995-19994%
1990-19944%
1980-198914%
1970-197933%
1969 and older33%
1990-1999 8%
Figure 13: Age distribution of diesel locomotive engines (Source: questionnaire survey)
Rail Diesel Study, WP 1 “Status and future development of the diesel fleet”Final Report, 21.07.2005
17
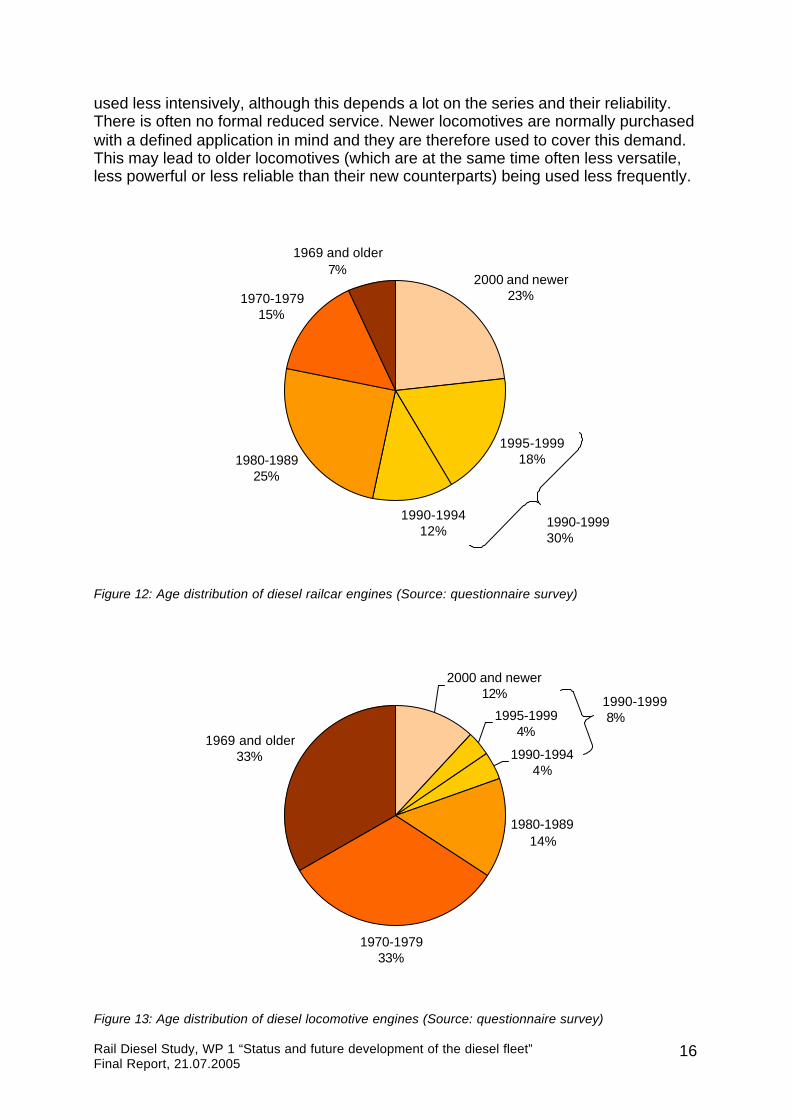
2.2.4 Re-engined tractive unitsRe-engining in this study is defined by an engine being replaced by a different engineof a new design to that originally provided with a vehicle. Re-engining of diesel rollingstock with new modern engines can be an alternative to purchasing completely newvehicles. The results of the questionnaire showed that 18 out of 26 railwaycompanies answering the questionnaire had done some kind of re-engining withintheir diesel fleet.
6,7%5,3%10,1%
0,0%
10,0%
20,0%
30,0%
40,0%
50,0%
60,0%
70,0%
80,0%
90,0%
100,0%
Railcars Mainline Locos Shunting Locos
Figure 14: Percentage of engines being re-engined: average and range of individual railway values(Source: questionnaire survey)
The average of all the re-engining proportions of the companies that answered thequestionnaire is between 5 % for main line locomotives and 10 % for railcars (Figure14). High re-engining proportions can be found at MAV (Hungary), with 80 % ofrailcars, 10 % of mainline and 50 % of shunting locomotives being re-engined.
Furthermore more than 40 % of railcar engines are re-engined at ZSSK Cargo(Slovakia) and ÖBB (Austria). Mainline locomotives are re-engined in rather highpercentages at ÖBB (Austria) with 38 % and at ATOC members (UK, average of thecompanies that answered the questionnaire) with 37 %. Re-engining quota forshunting locomotives are rather high at DB AG (36 %), FS (Italy) (29 %) andCFF/SBB/FFS (Switzerland) (22 %).

Rail Diesel Study, WP 1 “Status and future development of the diesel fleet”Final Report, 21.07.2005
18
2.3 Energy consumption and exhaust emission
2.3.1 Diesel consumptionAbsolute diesel consumption values are only available for a few railway companies inUIC statistics. Therefore estimation of consumption factors based on gross-tkmhauled are used to fill gaps in statistics, differentiated by freight and passengerlocomotives and railcars. An estimated total of about 2 Mio tonnes of diesel is usedyearly by the covered UIC-member railways.
The sum of all diesel consumption values reported in the questionnaire survey arearound 1,5 Mio tonnes. This is divided between the different railway companies asshown in Figure 15.
0
50
100
150
200
250
300
350
DB
AG
-DE
SN
CF
-FR
PK
P-P
L
FS
-IT
CF
R P
ass.
-RO
CD
-CZ
LDZ
-LV
LG-L
T
CF
R F
reig
ht-R
O
MA
V-H
U
DS
B-D
K
VR
-FI
EV
R-E
E
SN
CB
/NM
BS
-BE
CIE
-IE
ÖB
B-A
T
BD
Z-B
G
CP
-PT
ZSS
K C
argo
-SK
ZSS
K-S
K
SZ
-SI
NS
B-N
O
BLS
-CH
CF
F/S
BB
/FF
S-C
H
[1000 tonnes]
Figure 15: Diesel consumption in thousand tonnes of different railway companies (Source:questionnaire survey)
For describing the fuel efficiency of the diesel engines in operation, the railwaycompanies were asked for diesel consumption values in g/kWh of engines in typicalrailcars, mainline and shunting locomotives of their fleet. The values presented havebeen calculated from 19 railcars, 30 mainline and 17 shunting locomotives. Whencomparing the average values for engines older than 1990 to the younger ones, asmall decline of 3 - 4 % in fuel consumption can be seen for the newer railcars andshunting locomotives and more than 10 % for mainline locomotive engines (Figure16).

Rail Diesel Study, WP 1 “Status and future development of the diesel fleet”Final Report, 21.07.2005
19
224216218
0
50
100
150
200
250
300
Railcars (all) Railcars < 1990 Railcars > 1990
g / kWh
230
206
224
0
50
100
150
200
250
300
Mainline Locos (all) Mainline Locos < 1990 Mainline Locos > 1990
g / kWh
230222228
0
50
100
150
200
250
300
Shunting Locos (all) Shunting Locos < 1990 Shunting Locos > 1990
g / kWh
Figure 16: Average and range of diesel consumption factors (in g/kWh) for representative dieselrailcar, mainline and shunting locomotive engines (Source: questionnaire survey)

Rail Diesel Study, WP 1 “Status and future development of the diesel fleet”Final Report, 21.07.2005
20
2.3.2 Emission limit valuesThe UIC and its members have for many years had a homologation procedure forrailway diesel traction units and the mandatory UIC technical leaflet 624 representsthe current version (“UIC 2” in Figure 17). The development of emission levelsaccording to these railway standards has improved continuously for more than twodecades (Figure 17).
4 3 3 2.54
2.4 1.6 0.8 0.8 0.6
24
20
16
129.9
6
0 0 0 0 0.25 0.25
12
8
0
5
10
15
20
25
30
g/k
Wh
CO (g/kWh)
HC (g/kWh)
NOx(g/kWh)
PM
Pre 1982 1982 1993 1997 2003< 560 kW
2003> 560 kW
UIC 1 UIC 2
>560 kW <560 kW
(g/kWh)
Figure 17: Development of the UIC requirements to diesel traction engines (1982 – 2003)
The UIC limit values are measured using the ISO Cycle F (60 % idling, 15 %intermediate, 25 % full power).
Future diesel exhaust emission standards for rail applications are regulated by theNon-Road Mobile Machinery Directive (amended by Directive 2004/26/EC) Theamended Directive will regulate the limit values for new engines in diesel tractiveunits (railcars and locomotives) as listed in Table 5 .
Limit values according to NRMM Directive
Limit values in forceStage Category NetPower (P)
(kW)
Pro-pulsionby Type
approvalfrom
Placing onthe market
from
CO
g/kWh
HC
g/kWh
NOx
g/kWh
PT
g/kWh
Testcycle(ISO
8178-4)
RC A P > 130 kW Railcar 01.07.2005 01.01.2006 3,5 4,0 0,2 C1
RL A 130 kW < P< 560 kW
Loco-motives
01.01.2006 01.01.2007 3,5 4,0 0,2 F
RH A P > 560 kW Loco-motives
01.01.2008 01.01.2009 3,5 0,5 6,0 0,2 F
IIIA
RH A P > 2000kW and
SV> 5l/cyl
Loco-motives
01.01.2008 01.01.2009 3,5 0,4 7,4 0,2 F
RC B P > 130 kW Railcar 01.01.2011 01.01.2012 3,5 0,19 2,0 0,025 C1IIIB
R B P > 130 kW Loco-motives
01.01.2011 01.01.2012 3,5 4,0 0,025 F
Table 5: Limit values according to the amended Non-Road Mobile Machinery Directive (2004/26/EC)

Rail Diesel Study, WP 1 “Status and future development of the diesel fleet”Final Report, 21.07.2005
21
Stage III B of the Directive has to be reviewed before 31 December 2007. This reviewshall consider the available technology, including cost/benefits, with a view of the IIIBlimit values for 2011/12. Further the application of test cycles for engines in railcarsand locomotives and in the case of engines in locomotives the cost and benefits of afurther reduction of emission limit values in view of the application of NOx after-treatment technology shall be evaluated. Furthermore the need for a system for "in-use compliance" and possible options for its implementation shall be assessed(Article 2 of the Directive 2004/26/EC).
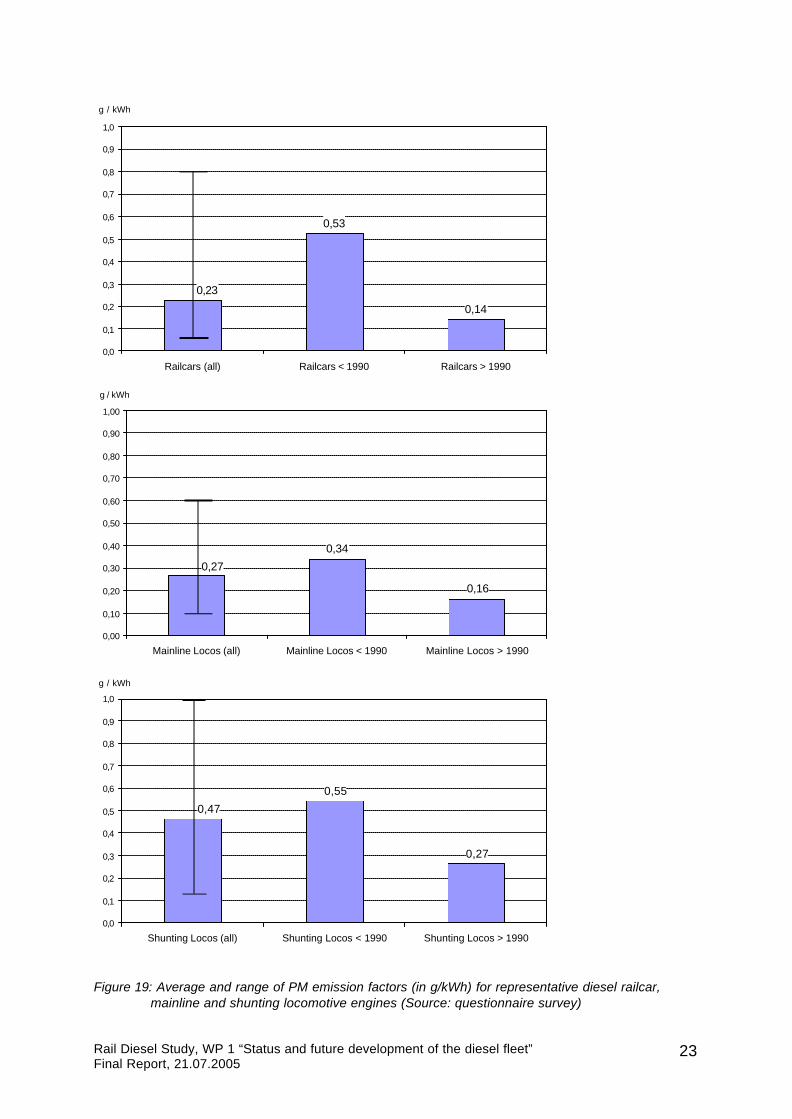
2.3.3 Emission behaviour of European fleetWithin the questionnaire the railway operating companies were asked to name anddescribe examples for representative vehicles of their fleet. As one of thecharacteristics the emission factors for NOx as well as PM in g/kWh should have tobe named for representative railcars, mainline and shunting locomotives. Figure 18shows the results out of 12 named railcars, 18 mainline and 11 shunting locomotivesfor the engines NOx emissions in g/kWh, Figure 19 for PM emission out of 9 railcars,10 mainline and 7 shunting locomotives. The comparably low number of reported PMvalues is mainly due to often not available values in the unit g/kWh. PM values havebeen typically measured in the past in the unit “Bosch value”. The figures show abroad range of values with around +/- 50 % compared to the average NOx and aneven higher range for the PM emission factors. However, significantly lower valuescan be seen for the engines built after 1990 compared to those built before 1990.

Rail Diesel Study, WP 1 “Status and future development of the diesel fleet”Final Report, 21.07.2005
22
7,0
13,7
8,7
0
2
4
6
8
10
12
14
16
18
20
22
Railcars (all) Railcars < 1990 Railcars > 1990
g / kWh
10,7
15,414,1
0
2
4
6
8
10
12
14
16
18
20
22
Mainline Locos (all) Mainline Locos < 1990 Mainline Locos > 1990
g / kWh
11,912,612,4
0
2
4
6
8
10
12
14
16
18
20
22
Shunting Locos (all) Shunting Locos < 1990 Shunting Locos > 1990
g / kWh
Figure 18: Average and range of NOx emission factors (in g/kWh) for representative diesel railcar,mainline and shunting locomotive engines (Source: questionnaire survey)
Rail Diesel Study, WP 1 “Status and future development of the diesel fleet”Final Report, 21.07.2005
23
0,53
0,14
0,23
0,0
0,1
0,2
0,3
0,4
0,5
0,6
0,7
0,8
0,9
1,0
Railcars (all) Railcars < 1990 Railcars > 1990
g / kWh
0,16
0,34
0,27
0,00
0,10
0,20
0,30
0,40
0,50
0,60
0,70
0,80
0,90
1,00
Mainline Locos (all) Mainline Locos < 1990 Mainline Locos > 1990
g / kWh
0,27
0,55
0,47
0,0
0,1
0,2
0,3
0,4
0,5
0,6
0,7
0,8
0,9
1,0
Shunting Locos (all) Shunting Locos < 1990 Shunting Locos > 1990
g / kWh
Figure 19: Average and range of PM emission factors (in g/kWh) for representative diesel railcar,mainline and shunting locomotive engines (Source: questionnaire survey)

Rail Diesel Study, WP 1 “Status and future development of the diesel fleet”Final Report, 21.07.2005
24
2.3.4 Case study: Emission behaviour of DB’s fleetIn the following section, some additional information describing the diesel fleet of DBAG (Germany) is provided. This has to be seen as one case study representingEurope’s biggest diesel fleet company. Emission behaviour in other Europeancompanies could be similar, but could also differ significantly from this example.Conclusions on average European values should therefore be avoided.
The source of data is a project carried out with the German Federal EnvironmentalAgency to determine emission factors for the diesel fleet. Values are eithermanufacturer data or measurement data using the ISO F cycle.
Figure 20 shows the average NOx emission factors for DB’s railcars and locomotives,Figure 21 the average PM emission factors. When looking at the range of valuesindicated in the figures it is obvious that there can be quite big differences in betweenthe different engines in operation. That is especially the case for the PM emissionfactors of locomotives that can be (for single engines) 8 times higher than for engineswith the lowest factors. But this applies to rather old locomotives with high emissionfactors that are only used less intensively than newer models.
11,69,8
0
2
4
6
8
10
12
14
16
18
20
Railcars Locomotives
NOx [g/kWh]
Figure 20: Average and range of NOx emission factors for DB diesel railcars and locomotives (Source:DB AG)
0,15
0,33
0,00
0,10
0,20
0,30
0,40
0,50
0,60
0,70
0,80
0,90
Railcars Locomotives
PM [g/kWh]
Figure 21: Average and range of PM emission factors for DB diesel railcars and locomotives (Source:DB AG)
Rail Diesel Study, WP 1 “Status and future development of the diesel fleet”Final Report, 21.07.2005
25
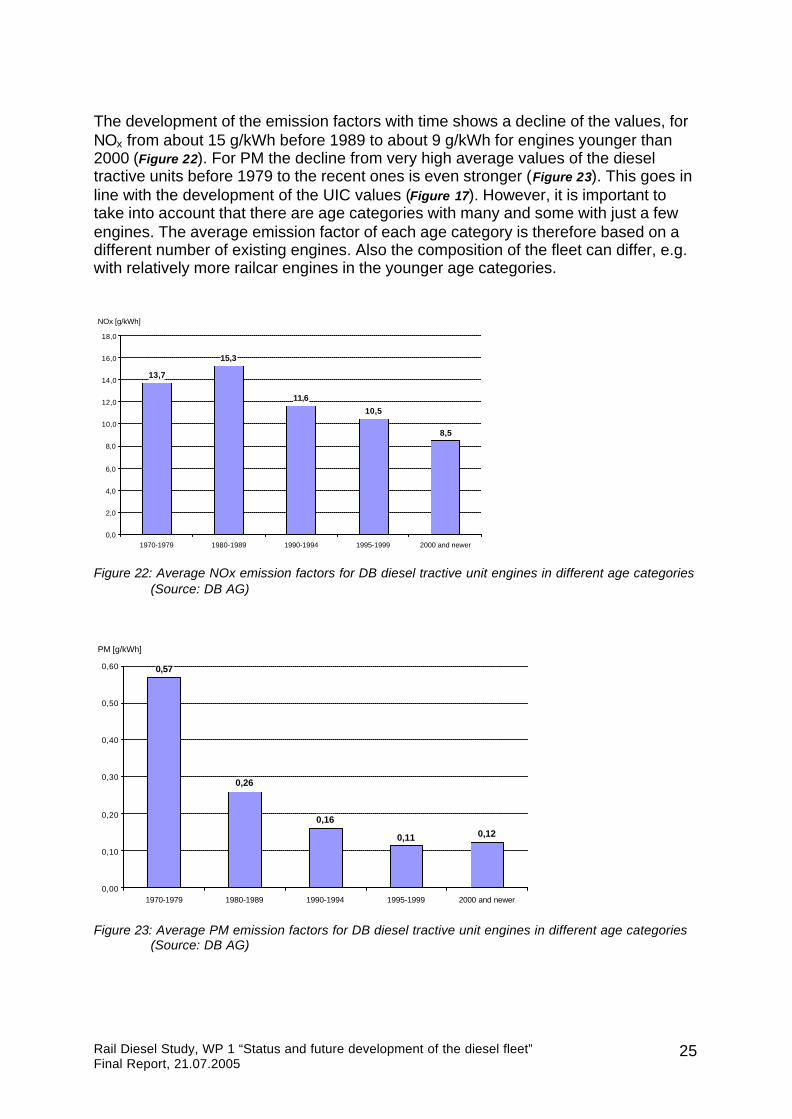
The development of the emission factors with time shows a decline of the values, forNOx from about 15 g/kWh before 1989 to about 9 g/kWh for engines younger than2000 (Figure 22). For PM the decline from very high average values of the dieseltractive units before 1979 to the recent ones is even stronger (Figure 23). This goes inline with the development of the UIC values (Figure 17). However, it is important totake into account that there are age categories with many and some with just a fewengines. The average emission factor of each age category is therefore based on adifferent number of existing engines. Also the composition of the fleet can differ, e.g.with relatively more railcar engines in the younger age categories.
13,7
15,3
11,6
10,5
8,5
0,0
2,0
4,0
6,0
8,0
10,0
12,0
14,0
16,0
18,0
1970-1979 1980-1989 1990-1994 1995-1999 2000 and newer
NOx [g/kWh]
Figure 22: Average NOx emission factors for DB diesel tractive unit engines in different age categories(Source: DB AG)
0,57
0,26
0,16
0,11 0,12
0,00
0,10
0,20
0,30
0,40
0,50
0,60
1970-1979 1980-1989 1990-1994 1995-1999 2000 and newer
PM [g/kWh]
Figure 23: Average PM emission factors for DB diesel tractive unit engines in different age categories(Source: DB AG)
Rail Diesel Study, WP 1 “Status and future development of the diesel fleet”Final Report, 21.07.2005
26
2.3.5 Sulphur content of diesel fuelThe sulphur content in diesel fuel is directly related to the SO2 emission out of engineoperation. A low fuel sulphur content is furthermore a prerequisite for some exhaustaftertreatment measures.
As of 2011, Non Road Mobile Machinery Directive 2004/26/EC introduces PM andNOX standards for railway engines (see chapter 2.3.2) that require on-highwayengine and aftertreatment technologies to be transferred to non-road engines.In order to meet those standards, an integrated systems approach of enginetechnology, aftertreatment systems and fuel quality is required. Therefore, theavailability of fuel qualities that are compatible to those emission reductiontechnologies is a prerequisite for them to work under best possible conditions andkeep their functionality over lifetime (durability and in-use compliance).Furthermore the fuel quality by itself has a significant effect on engine emissions. Themajor contribution comes from sulphur that is reacting to sulphates during thecombustion and the exhaust dilution process. Sulphates are one of the majorcomponents of Particulate Matter (PM). Consequently, the 2010 PM standard is likelyto be exceeded at Sulphur levels above 20 mg/kg. In addition, reducing fuel sulphurwill lower PM levels immediately across all engines already operating in the field.
The sulphur content of gas oil is regulated in the EU Directive 99/32/EC (amending93/12/EEC). According to this directive Member States must ensure that gas oil(including gas oil for maritime use) is not used on their territory from:
• 1 July 2000 if the sulphur content is more than 0.20% by mass (=2000 ppm);• 1 January 2008 if it is more than 0.10% by mass (=1000 ppm).
Fuels used in non-road mobile machinery and agricultural tractors are excluded fromthis definition, however.
Sulphur content of diesel fuel is regulated by EU Directives 98/70/EC and2003/17/EC. Table 6 shows the development of maximum sulphur content values ofdiesel fuel according to the named directives. Directive 98/70/EC states that “For gasoils used for engines in non-road mobile machinery and agricultural tractors MemberStates may require the same sulphur content as defined for diesel fuels in thisDirective or the sulphur content as defined for diesel fuels in Directive 93/12/EEC”.
Maximum sulphur content in ppm01.01.2000 35001.01.2005 5001.01.2009 10
Table 6: Sulphur content in diesel fuel (Source: EU Directives 98/70/EC, 2003/17/EC)
Lower sulphur content fuels are in some countries already in place before the datesnamed for mandatory introduction in the Directives. For example, in Germany themineral oil industry is offering all diesel fuel with <10 ppm sulphur (also known aszero sulphur or sulphur free fuel) already since 01.01.2003 due to tax reasons. Asrailway fuel consumption is relatively low compared to road, the diesel fuel forrailways has in this case the same properties as road diesel fuel.
Rail Diesel Study, WP 1 “Status and future development of the diesel fleet”Final Report, 21.07.2005
27
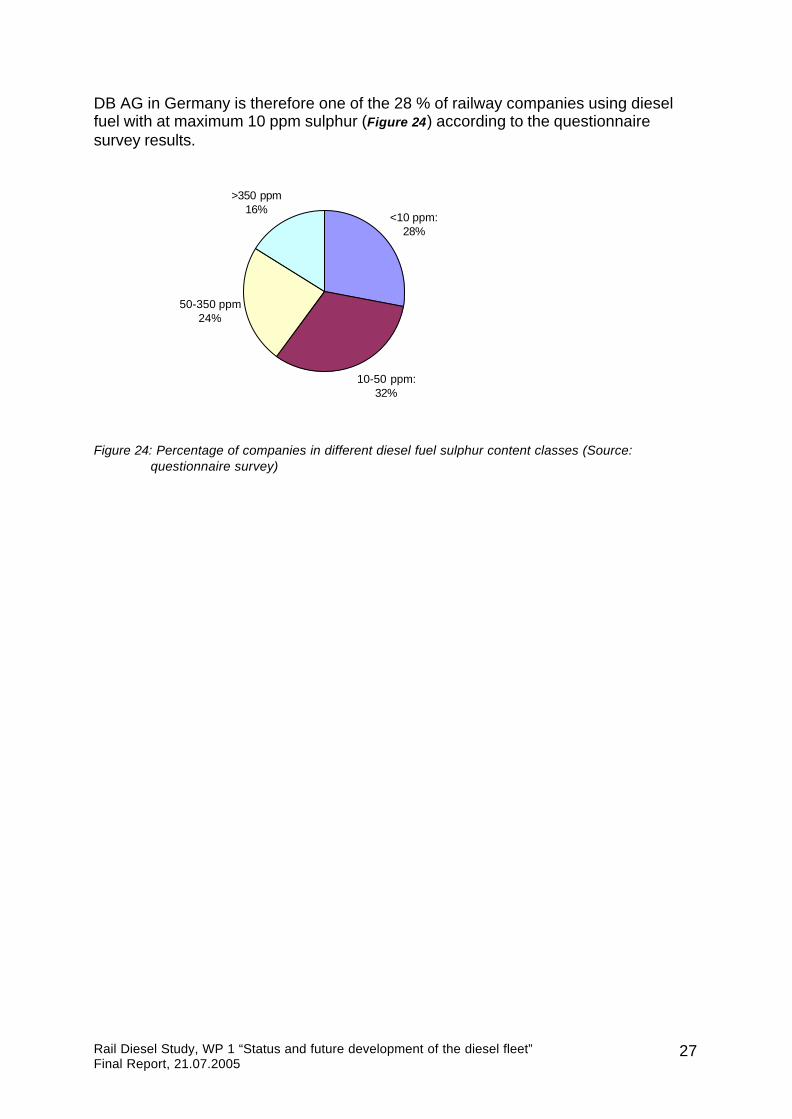
DB AG in Germany is therefore one of the 28 % of railway companies using dieselfuel with at maximum 10 ppm sulphur (Figure 24) according to the questionnairesurvey results.
<10 ppm:28%
10-50 ppm:32%
50-350 ppm24%
>350 ppm16%
Figure 24: Percentage of companies in different diesel fuel sulphur content classes (Source:questionnaire survey)

Rail Diesel Study, WP 1 “Status and future development of the diesel fleet”Final Report, 21.07.2005
28
3 Future development of the diesel fleet in EuropeBased on the information about the existing diesel fleet in the previous chapter andthe answers collected from UIC-members within the survey about futureexpectations, possible scenarios for the future fleet development until 2020 are setup and described in the following sections.
3.1 UIC member’s expectations for their fleet developmentA basis for estimating the future development of the diesel fleet in Europe are theanswers given by railway operators to the questions on how they expect their fleetsto develop. For the total fleet, and especially for locomotives, only a small percentageof operators expect their fleets to increase in size. However, for railcars, 45 % ofoperators assume that their railcar fleets will increase in size, and just 20 % expect adecrease in the number of railcars in operation (Figure 25). The expectations for agrowing number of diesel railcars is even more explicit when the answers given areweighted by the number of vehicles in each fleet. More than three quarter of theweighted companies expect an increasing number of railcars. This reflects thegeneral trend towards using railcars instead of locomotives for passenger railvehicles. Reasons for this trend to railcars are besides others that they allow complexroutes with the possibility to couple and de-couple for optimisation of load factorsaccording to changing passenger numbers on a route. Furthermore smallerpassenger numbers especially in rural areas can be transported more flexible andwith less vehicle weight resulting in lower fuel consumption compared to a heavylocomotive hauling just few wagons.
Total Diesel Fleet
increase14%
remain29%
decrease57%
Railcars
increase45%
remain35%
decrease20%
Mainline Locomotives
increase6%
remain31%
decrease63%
Shunting Locomotives
increase5%
remain51%
decrease44%
Figure 25: UIC-members’ expectations for the development of their diesel fleets (Source:questionnaire survey)
However, it has to be taken into account that this data has only been obtained fromUIC member railways. Many new rail operators are entering the market, and they willalso take some of the market share of the incumbent railway operators. Where someUIC member railways have estimated that their diesel fleets could be smaller in thefuture, this could be due to expected higher market shares for new operators.

Rail Diesel Study, WP 1 “Status and future development of the diesel fleet”Final Report, 21.07.2005
29
According to a study carried out by Vossloh and SCI (“Der Weltmarkt fürBahntechnologie”, 2003, on www.vossloh.com), around 200-250 new diesel railcarsare manufactured and delivered to railway operators every year in Western Europe.Whereas there is already a high share of new vehicles in the fleets of state ownedrailways in central and northern Europe, and in the fleets of many private operators,in Southern and Eastern European countries there is still a high demand for moderndiesel railcars.
Other reasons for the expected decrease in the size of diesel fleets could be due toplans for electrification, or for increased productivity of the existing fleet meaning amore effective use of the existing vehicles. Furthermore diesel traction is often usedfor, in many cases, economically less attractive feeder traffic, a shift of feeder trafficto the road, and a concentration on more attractive long distance rail traffic (often onelectrified routes) would also mean a reduction in the number of diesel tractive unitsneeded.
Operators were also asked whether they planned to move towards using higher orlower powered engines for their fleets in the future (see Figure 26). The majority ofoperators (53 %) believed that for railcars, they would be using higher poweredengines in the future, whilst for mainline locomotives, the majority (64 %) indicatedthat the engine power would remain the same in future. No operator expectsdecreasing engine powers for mainline locomotives. For shunting locomotives, 68 %of operators believed that their future fleets would use engines of broadly the samepower as now, with 23 % expecting to use higher power engines.
Railcars
more53%remain
34%
less13%
Shunting Locomotives
increase23%
remain68%
decrease9%
Mainline Locomotives
increase36%
remain64%
decrease0%
Railcars
increase53%remain
34%
decrease13%
Figure 26: UIC-members’ expectations for future engine power (Source: questionnaire survey)
When weighting the answers by the number of railcars, resp. locomotives of thecompanies, the expectations for a growing engine powers for railcars with nearly90 % of the weighted answers are even more obvious. For locomotives the answersshow a comparable distribution.
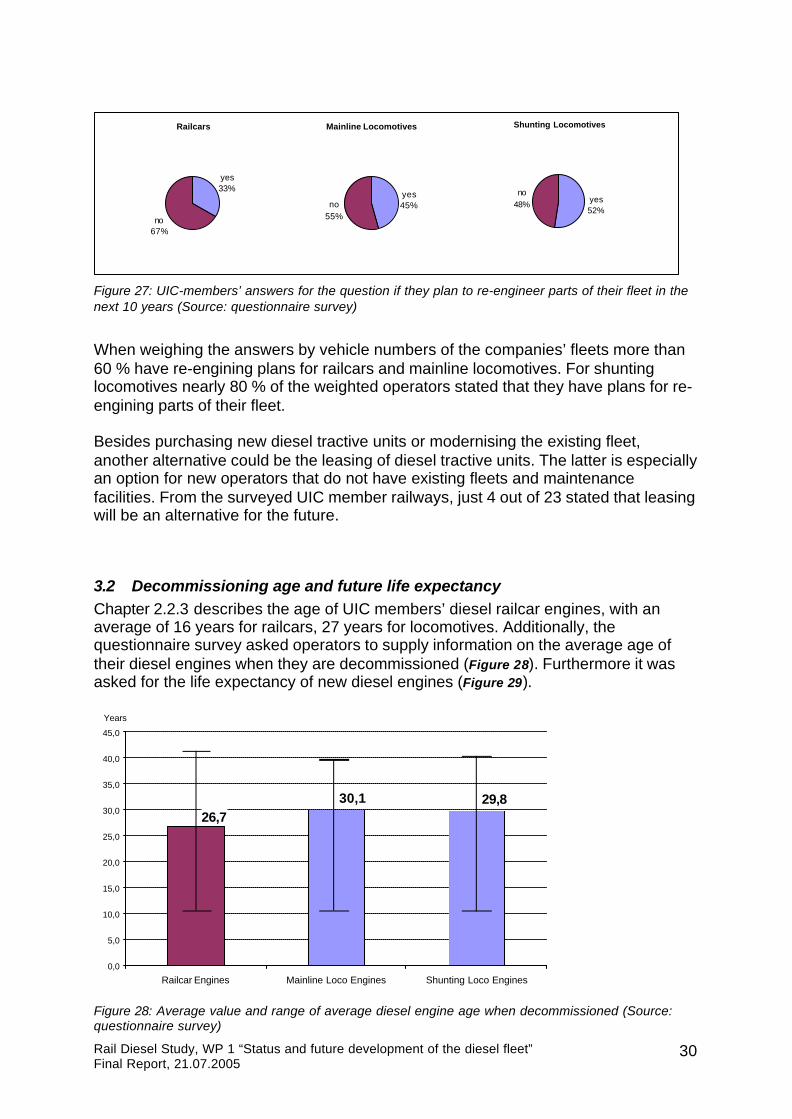
Although just a minor percentage of the diesel fleet has so far been re-engined withengines of a newer design (Figure 14 in chapter 2.2.4), about half of the operatorssurveyed plan to re-engine at least part of their locomotive fleet in the next 10 years.For railcars, just one third of the responding operators stated that they have re-engining plans (Figure 27).
Rail Diesel Study, WP 1 “Status and future development of the diesel fleet”Final Report, 21.07.2005
30
Railcars
yes33%
no67%
Mainline Locomotives
yes45%no
55%
Shunting Locomotives
yes52%
no48%
Figure 27: UIC-members’ answers for the question if they plan to re-engineer parts of their fleet in thenext 10 years (Source: questionnaire survey)
When weighing the answers by vehicle numbers of the companies’ fleets more than60 % have re-engining plans for railcars and mainline locomotives. For shuntinglocomotives nearly 80 % of the weighted operators stated that they have plans for re-engining parts of their fleet.
Besides purchasing new diesel tractive units or modernising the existing fleet,another alternative could be the leasing of diesel tractive units. The latter is especiallyan option for new operators that do not have existing fleets and maintenancefacilities. From the surveyed UIC member railways, just 4 out of 23 stated that leasingwill be an alternative for the future.
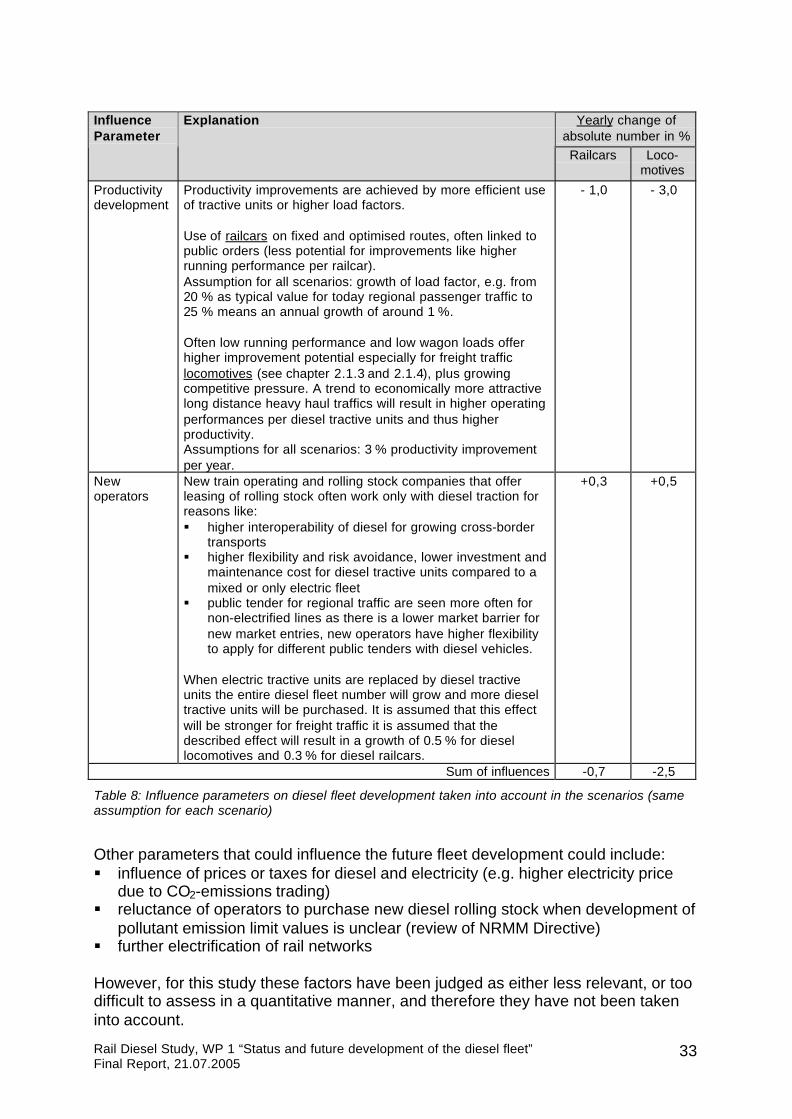
3.2 Decommissioning age and future life expectancyChapter 2.2.3 describes the age of UIC members’ diesel railcar engines, with anaverage of 16 years for railcars, 27 years for locomotives. Additionally, thequestionnaire survey asked operators to supply information on the average age oftheir diesel engines when they are decommissioned (Figure 28). Furthermore it wasasked for the life expectancy of new diesel engines (Figure 29).
29,830,126,7
0,0
5,0
10,0
15,0
20,0
25,0
30,0
35,0
40,0
45,0
Railcar Engines Mainline Loco Engines Shunting Loco Engines
Years
Figure 28: Average value and range of average diesel engine age when decommissioned (Source:questionnaire survey)

Rail Diesel Study, WP 1 “Status and future development of the diesel fleet”Final Report, 21.07.2005
31
20,422,8
20,0
0,0
5,0
10,0
15,0
20,0
25,0
30,0
35,0
40,0
45,0
Railcar Engines Mainline Loco Engines Shunting Loco Engines
Years
Figure 29: Average value and range of life expectancies in years for new diesel engines (Source:questionnaire survey)
The current average age for engines being decommissioned at this point in time isabout 27 years for railcars, and 30 years for locomotives. For new railcar andlocomotive engines, operators have indicated that the average anticipated lifeexpectancy for rail cars and shunting locomotive engines to 20 years, whilst formainline locomotive engines this rises to almost 23 years. The range bars on thegraph in the above figure indicate the large variation in anticipated life expectancy fornew engines, ranging from 5 years to 30 years for railcars engines, and from 10years to 35 years for mainline locomotive engines. It is possible that these largevariations are indicative of the different procurement and maintenance strategies indifferent railway companies.
In addition to data on the life times of current and new engines, the questionnairealso asked operators to provide life expectancy estimates for current and new dieselvehicles (see Figure 44 and Figure 45 in Annex 4.4). The average age at which dieselrail vehicles are decommissioned ranges from 32 to 35 years, whilst the averagefuture life expectancy for new diesel vehicles is about 27 years for railcars, and 30years for locomotives.

Rail Diesel Study, WP 1 “Status and future development of the diesel fleet”Final Report, 21.07.2005
32
3.3 Scenarios for European diesel fleet developmentScenarios have been developed to describe the possible future development ofEuropean diesel rail fleet. The main influencing parameters expected to affect thefuture development of the fleet are described in the following two tables. Table 7describes the parameters which have been varied for the different scenarios, whilstTable 8 shows the parameters that remain the same in all scenarios.
InfluenceParameter
Explanation
Lifeexpectancyof vehicles
According to the results of the questionnaire survey (chapter 3.2), the average age ofdiesel railcar engines being decommissioned in the next years is about 27 years,whilst for locomotive engines this figure is about 30 years.Newly purchased railcar engines are judged to have, on average, a life expectancy of20 years; for new locomotive engines, this is about 22 years.
Marketdevelopmentfor rail trafficas such
Market development for passenger and freight traffic:
Market development figures for European traffic and rail traffic as such can be found inProgTrans “European Transport Report 2004” for the years 2005-2015. This reportindicates the following:+ 1,9 % per year for freight+ 1,3 - 1,6 % per year for passenger transport
Further sources are values from the the EU White Book:+ 2,8 % per year for freight,+ 1,9 % per year for passenger transportThese figures are more or less in line with statistics in the EU Energy and Transport inFigures statistical pocketbook 2004.
Higher values are assumed in the ERRAC Rail Research Agenda2:+ 6 % per year for freight,+ 5 % per year for passenger transport
Derived market development for railcars and locomotives:Based on the above described market developments for freight and passenger trafficthe figures for railcars and locomotives have been derived taking into account thefollowing aspects (see chapter 2.1.2):§ Current share of railcars in passenger traffic: 70% of train-km§ 64 % of diesel locomotives train-km are used for passenger traffic. (percentage of
number of vehicles is probably lower as diesel locomotives are often used lessintensively for feeder traffic in freight transport)
§ Trend in passenger traffic to railcars instead of locomotive driven trains (seeFigure 25)
In consequence the market growth for railcars is assumed to be higher than theindicated growth in passenger traffic. The growth for locomotives is assumed to be inbetween the value for passenger and freight traffic.
Adaptedmarketdevelopmentfor dieseltraction
Most growing sectors for rail traffic will be inner-city traffic, commuter traffic, Point-to-point relations in between conurbations, long distance freight traffic. These sectors arein many countries mainly served by electric traction, whereas, e.g. rail diesel feedertraffic is often switched to road. Diesel traction will therefore contribute to a lowerextent to the market growth than electric traction.
Table 7: Influence parameters on diesel fleet development taken into account in the scenarios(adapted for each scenario)
2 The values have been recalculated based on the following assumptions in the description of the AgendasBusiness environment for Europe 2020:Freight: Market share in 2020: 15 %; Growth in traffic volume (from 2000, Western Europe): + 70 % to 6000 billiontkmPassenger: Market share in 2020: 12 %; Growth in traffic volume (from 2000, Western Europe): + 40 % to 7500billion Pkm
Rail Diesel Study, WP 1 “Status and future development of the diesel fleet”Final Report, 21.07.2005
33
Yearly change ofabsolute number in %
InfluenceParameter
Explanation
Railcars Loco-motives
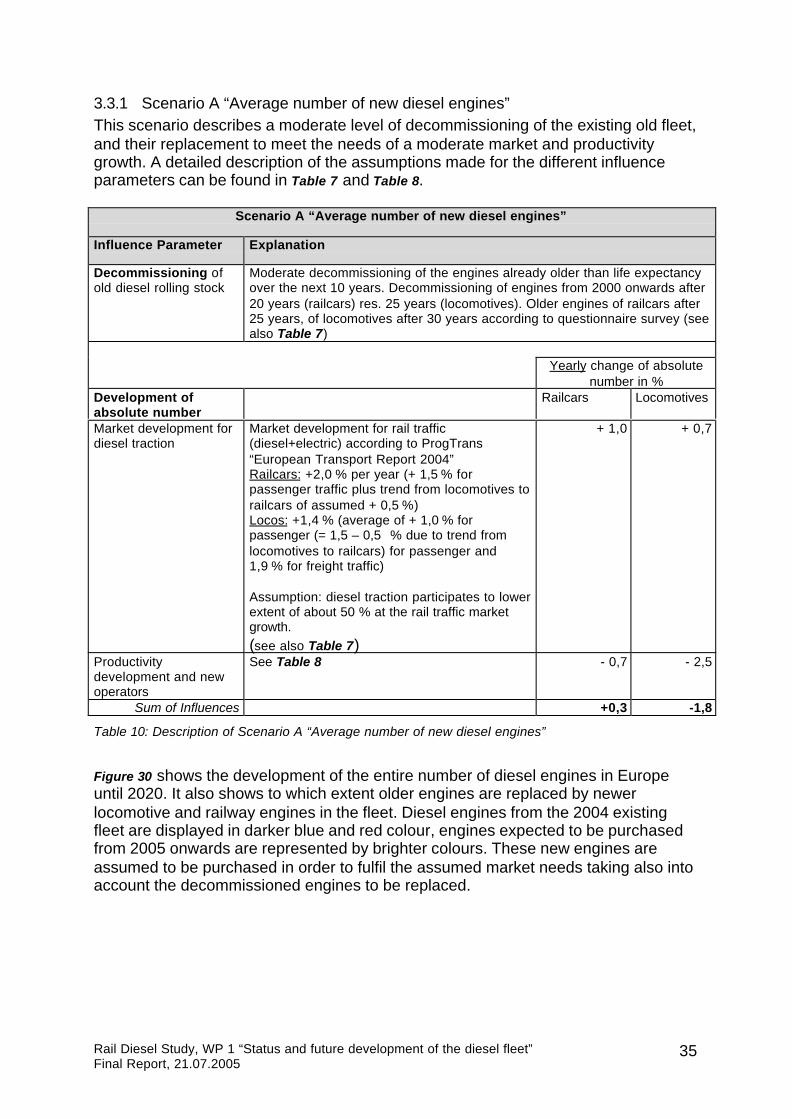
Productivitydevelopment
Productivity improvements are achieved by more efficient useof tractive units or higher load factors.
Use of railcars on fixed and optimised routes, often linked topublic orders (less potential for improvements like higherrunning performance per railcar).Assumption for all scenarios: growth of load factor, e.g. from20 % as typical value for today regional passenger traffic to25 % means an annual growth of around 1 %.
Often low running performance and low wagon loads offerhigher improvement potential especially for freight trafficlocomotives (see chapter 2.1.3 and 2.1.4), plus growingcompetitive pressure. A trend to economically more attractivelong distance heavy haul traffics will result in higher operatingperformances per diesel tractive units and thus higherproductivity.Assumptions for all scenarios: 3 % productivity improvementper year.
- 1,0 - 3,0
Newoperators
New train operating and rolling stock companies that offerleasing of rolling stock often work only with diesel traction forreasons like:§ higher interoperability of diesel for growing cross-border
transports§ higher flexibility and risk avoidance, lower investment and
maintenance cost for diesel tractive units compared to amixed or only electric fleet
§ public tender for regional traffic are seen more often fornon-electrified lines as there is a lower market barrier fornew market entries, new operators have higher flexibilityto apply for different public tenders with diesel vehicles.
When electric tractive units are replaced by diesel tractiveunits the entire diesel fleet number will grow and more dieseltractive units will be purchased. It is assumed that this effectwill be stronger for freight traffic it is assumed that thedescribed effect will result in a growth of 0.5 % for diesellocomotives and 0.3 % for diesel railcars.
+0,3 +0,5
Sum of influences -0,7 -2,5
Table 8: Influence parameters on diesel fleet development taken into account in the scenarios (sameassumption for each scenario)
Other parameters that could influence the future fleet development could include:§ influence of prices or taxes for diesel and electricity (e.g. higher electricity price
due to CO2-emissions trading)§ reluctance of operators to purchase new diesel rolling stock when development of
pollutant emission limit values is unclear (review of NRMM Directive)§ further electrification of rail networks
However, for this study these factors have been judged as either less relevant, or toodifficult to assess in a quantitative manner, and therefore they have not been takeninto account.

Rail Diesel Study, WP 1 “Status and future development of the diesel fleet”Final Report, 21.07.2005
34
Three scenarios are defined. Scenario A aims to describe the most probabledevelopment of the fleet. In scenarios B and C, the influencing parameters are set tofind a possible low and a high number of diesel engines to be purchased betweennow and 2020, thereby setting some kind of framework for further investigations. Thescenarios build on the number of diesel railcar and locomotive engines existing intoday’s European fleet, as described in chapter 2.2.1. Detailed information about agedistributions as taken from the questionnaire survey results for UIC-members havealso been applied to non-UIC members. The same applies for the above describedaverage life expectancies and different assumptions for decommissioning of very oldengines. New engines to be purchased are either to replace decommissioned onesor to meet new market demands, taking into account the influencing parametersdescribed in Table 8. It was assumed that all influence parameters are directlyconnected to the number of diesel tractive units needed.
For 2004 the number of diesel railcars and locomotives is based on the numbers outof the statistical sources described in chapter 2.2.1. As there is a significant numberof locomotive and railcar engines in the fleet that are older than the typicaldecommissioning age (see chapter 3.2) it is assumed that these ones appear instatistic but are not used in the same intensity as younger ones. In consequence theywould not be replaced one by one with newer ones when finally officiallydecommissioned and erased from statistics. This assumption is backed by theanswers in the questionnaire survey (see Annex 4.5, question A 3). A majority of therailway companies confirmed that older vehicles are used less intensively. For thisreasons locomotive engines from before 1969 and railcar engines from before 1979are counted with half of their number already for the starting year 2004 of thescenarios.
Based on the available information and the scope of the study the scenarios aredescribed on a more global level for locomotives and railcars as such. Taking intoaccount more specific market related aspects for different types of locomotives andrailcars (e.g. shunting, heavy haul, transfer or civil engineering locomotives; Intercity,cross country or rural railcars) was not possible within the study.
As result of the three scenarios that are described in more detail below, it has beenestimated that the following numbers of new rail diesel engines will be needed up to2020 (Table 9).
Sum of New Engines until 2020 Scenario A Scenario B Scenario CNumber of New Locomotive Engines 8.576 7.894 13.253Number of New Railcar Engines 9.024 8.441 14.790Total number of Rail Diesel Engines 17.600 16.335 28.043
Table 9: Sum of new diesel railcar and locomotive engines to be purchased according to scenario A-C
Rail Diesel Study, WP 1 “Status and future development of the diesel fleet”Final Report, 21.07.2005
35
3.3.1 Scenario A “Average number of new diesel engines”This scenario describes a moderate level of decommissioning of the existing old fleet,and their replacement to meet the needs of a moderate market and productivitygrowth. A detailed description of the assumptions made for the different influenceparameters can be found in Table 7 and Table 8.
Scenario A “Average number of new diesel engines”
Influence Parameter Explanation
Decommissioning ofold diesel rolling stock
Moderate decommissioning of the engines already older than life expectancyover the next 10 years. Decommissioning of engines from 2000 onwards after20 years (railcars) res. 25 years (locomotives). Older engines of railcars after25 years, of locomotives after 30 years according to questionnaire survey (seealso Table 7)
Yearly change of absolutenumber in %
Development ofabsolute number
Railcars Locomotives
Market development fordiesel traction
Market development for rail traffic(diesel+electric) according to ProgTrans“European Transport Report 2004”Railcars: +2,0 % per year (+ 1,5 % forpassenger traffic plus trend from locomotives torailcars of assumed + 0,5 %)Locos: +1,4 % (average of + 1,0 % forpassenger (= 1,5 – 0,5 % due to trend fromlocomotives to railcars) for passenger and1,9 % for freight traffic)
Assumption: diesel traction participates to lowerextent of about 50 % at the rail traffic marketgrowth.(see also Table 7)
+ 1,0 + 0,7
Productivitydevelopment and newoperators
See Table 8 - 0,7 - 2,5
Sum of Influences +0,3 -1,8
Table 10: Description of Scenario A “Average number of new diesel engines”
Figure 30 shows the development of the entire number of diesel engines in Europeuntil 2020. It also shows to which extent older engines are replaced by newerlocomotive and railway engines in the fleet. Diesel engines from the 2004 existingfleet are displayed in darker blue and red colour, engines expected to be purchasedfrom 2005 onwards are represented by brighter colours. These new engines areassumed to be purchased in order to fulfil the assumed market needs taking also intoaccount the decommissioned engines to be replaced.

Rail Diesel Study, WP 1 “Status and future development of the diesel fleet”Final Report, 21.07.2005
36
0
5.000
10.000
15.000
20.000
25.000
30.000
35.000
40.000
2004 2005 2006 2007 2008 2009 2010 2011 2012 2013 2014 2015 2016 2017 2018 2019 2020
Existing Locomotives Existing Railcars New Locomotives New Railcars
Nr. Diesel Engines
Figure 30: Scenario A “Average number of new diesel engines” for future development of Europeandiesel fleet
The results show a small decline in the absolute number of railway diesel engines inEurope with 25 % less locomotive and 5 % more railcars engines in 2020 comparedto 2004. The decline for locomotives is mainly due to the assumed much higherproductivity especially in freight traffic. In this scenario, by 2016 the number of dieselengines purchased in 2005 or later would be higher than the number of enginesdating from before 2005. In 2020 less than 40 % of engines are older than 2005(Table 11).
Scenario A 2010 2015 2020Existing Diesel Engines 23.072 76% 15.043 51% 10.730 38%New Diesel Engines 7.231 24% 14.217 49% 17.600 62%
Table 11: Scenario A: Number and Percentage existing diesel engines (before 2005) compared tonew engines (2005 and later)
3.3.2 Scenario B “Low number of new diesel engines”For scenario B it is assumed that the existing old fleet will be decommissioned ratherslowly. Furthermore, the assumption of relatively low market growth leads to acomparably low figure for the number of new diesel engines to be purchased. Theassumptions for product development and new operators have been kept the sameas in scenario A.
The total number of railcars and the total number of locomotives are expected todecline between 2005 and 2020 at rates of –0.2% and –2,2% per year respectively(Table 12).

Rail Diesel Study, WP 1 “Status and future development of the diesel fleet”Final Report, 21.07.2005
37
Scenario B “Low number of new diesel engines”
Influence Parameter Explanation
Decommissioning ofold diesel rolling stock
Slow decommissioning of the engines already older than life expectancywithin next 15 years. Other assumptions for life expectancy like in scenario A.(see also Table 7)
Yearly change of absolutenumber in %
Development ofabsolute number
Railcars Locomotives
Market development fordiesel traction
Half of predicted growth values from Scenario A(EU White Book, around 30 % lower valuesthan in ProgTrans)(see also Table 7)
+ 0,5 + 0,4
Productivitydevelopment and newoperators
See Table 8 - 0,7 - 2,5
Sum of Influences - 0,2 - 2,2
Table 12: Description of Scenario B “Low number of new diesel engines”
In 2020, Scenario B assumes that the absolute number of diesel locomotive engineswill be 29 % lower, and the number of railcar engines will be 3 % lower compared to2004 (Figure 31).
0
5.000
10.000
15.000
20.000
25.000
30.000
35.000
40.000
2004 2005 2006 2007 2008 2009 2010 2011 2012 2013 2014 2015 2016 2017 2018 2019 2020
Existing Locomotives Existing Railcars New Locomotives New Railcars
Nr. Diesel Engines
Figure 31: Scenario B “Low number of new diesel engines” for future development of European dieselfleet
By 2019, the proportion of “new” engines (meaning engines purchased after 2004)would be higher than the remaining engines dating from 2004 and before, 3 yearslater than in Scenario A. In 2010 there would still be 86 % of all diesel engines from2004 and before in service, mainly due to the slow decommissioning rate of very oldexisting engines in this scenario. In 2020 this proportion will drop to below 40 % of allengines (Table 13).
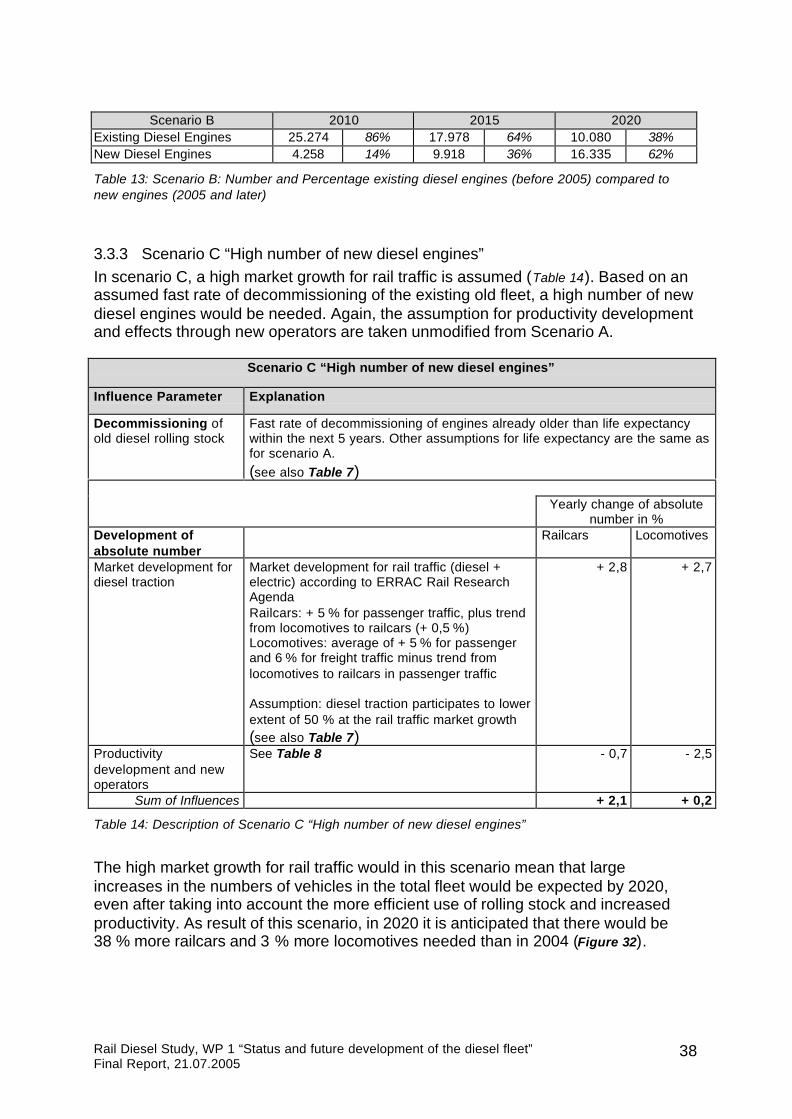
Rail Diesel Study, WP 1 “Status and future development of the diesel fleet”Final Report, 21.07.2005
38
Scenario B 2010 2015 2020Existing Diesel Engines 25.274 86% 17.978 64% 10.080 38%New Diesel Engines 4.258 14% 9.918 36% 16.335 62%
Table 13: Scenario B: Number and Percentage existing diesel engines (before 2005) compared tonew engines (2005 and later)
3.3.3 Scenario C “High number of new diesel engines”In scenario C, a high market growth for rail traffic is assumed (Table 14). Based on anassumed fast rate of decommissioning of the existing old fleet, a high number of newdiesel engines would be needed. Again, the assumption for productivity developmentand effects through new operators are taken unmodified from Scenario A.
Scenario C “High number of new diesel engines”
Influence Parameter Explanation
Decommissioning ofold diesel rolling stock
Fast rate of decommissioning of engines already older than life expectancywithin the next 5 years. Other assumptions for life expectancy are the same asfor scenario A.(see also Table 7)
Yearly change of absolutenumber in %
Development ofabsolute number
Railcars Locomotives
Market development fordiesel traction
Market development for rail traffic (diesel +electric) according to ERRAC Rail ResearchAgendaRailcars: + 5 % for passenger traffic, plus trendfrom locomotives to railcars (+ 0,5 %)Locomotives: average of + 5 % for passengerand 6 % for freight traffic minus trend fromlocomotives to railcars in passenger traffic
Assumption: diesel traction participates to lowerextent of 50 % at the rail traffic market growth(see also Table 7)
+ 2,8 + 2,7
Productivitydevelopment and newoperators
See Table 8 - 0,7 - 2,5
Sum of Influences + 2,1 + 0,2
Table 14: Description of Scenario C “High number of new diesel engines”
The high market growth for rail traffic would in this scenario mean that largeincreases in the numbers of vehicles in the total fleet would be expected by 2020,even after taking into account the more efficient use of rolling stock and increasedproductivity. As result of this scenario, in 2020 it is anticipated that there would be38 % more railcars and 3 % more locomotives needed than in 2004 (Figure 32).

Rail Diesel Study, WP 1 “Status and future development of the diesel fleet”Final Report, 21.07.2005
39
0
5.000
10.000
15.000
20.000
25.000
30.000
35.000
40.000
2004 2005 2006 2007 2008 2009 2010 2011 2012 2013 2014 2015 2016 2017 2018 2019 2020
Existing Locomotives Existing Railcars New Locomotives New Railcars
Nr. Diesel Engines
Figure 32: Scenario C “High number of new diesel engines” for future development of European dieselfleet
As a result of the assumed fast rate of decommissioning for this scenario, by 2012there would already be considerably more “new” diesel engines in the fleet than theones that came into service before 2005. By 2020 this proportion would rise up to74 % (Table 15).
Scenario C 2010 2015 2020Existing Diesel Engines 18.670 55% 15.043 42% 10.080 26%New Diesel Engines 15.231 45% 20.870 58% 28.043 74%
Table 15: Scenario C: Number and Percentage existing diesel engines (before 2005) compared tonew engines (2005 and later)
This scenario has been judged by the reference and steering group of the study to beless realistic than Scenario A and B.

Rail Diesel Study, WP 1 “Status and future development of the diesel fleet”Draft, 21.06.2005
40
4 Annex
4.1 Covered UIC member railwaysNation UIC member Activity ID SurveyAustria Österreichische Bundesbahnen IC ÖBB-AT XBelgium Société Nationale des Chemins de fer Belges IC SNCB/NMBS-BE XBulgaria Bulgarian railways RO BDZ-BG XBulgaria National Railway Infrastructure Company IM NRIC-BGCzech Republic Ceské drahy IC CD-CZ XDenmark Danske Statsbaner PO DSB-DK XDenmark Banedanmark IM BDK-DKEstonia Aktsiaselts Eesti Raudtee IC EVR-EE XFinland Ratahallintokeskus IM RHK-FIFinland VR-Group Ltd RO VR-FI XFrance Connex IC CONNEX-FRFrance Réseau Ferré de France IM RFF-FRFrance Société Nationale des Chemins de fer Français RO SNCF-FR XGermany Deutsche Bahn AG IC DB AG-DE XGreece Organisme des Chemins de fer helléniques IC CH-GRHungary Györ-Sopron-Ebenfurti Vasut Részvénytarsasag IC GySEV/RÖEE-HU XHungary Magyar Allamvasutak Rt. IC MAV-HU XIreland Coras Iompair Eireann IC CIE-IE XItaly Ferrovie dello Stato SpA IC FS-IT XLatvia Valsts Akciju Sabiedriba "Latvijas Dzelzcels" IC LDZ-LV XLithuania SPAB "Lietuvos Gelezinkeliai" IC LG-LT XLuxembourg Société Nationale des Chemins de Fer Luxemb. IC CFL-LUNetherlands N.V. Nederlandse Spoorwegen PO NS-NL XNetherlands ProRail IM ProRail-NLNorway Jernbaneverket IM JBV-NONorway Norges Statsbaner BA RO NSB-NO XPoland Polskie Koleje Panstwowe S.A. IC PKP-PL XPortugal Caminhos de Ferro Portugueses, E.P RO CP-PT XPortugal Rede Ferroviaria Nacional, E.P. IM REFER-PTRomania Societatea Nationala a Cailor Ferate Române IC CFR-RO XSlovakia Zeleznice Slovenskej Republiky IM ZSR-SKSlovakia Zeleznica spolocnost', a.s. PO ZSSK-SK XSlovakia Zeleznica spolocnost Cargo Slovakia, a.s. FO ZSSK Cargo-SK XSlovenia Slovenske Zeleznice d.d. IC SZ-SI XSpain Red Nacional de los Ferrocarriles Españoles RO RENFE-ESSpain Administracion de infrastucturas ferroviarias IM ADIF-ESSweden Banverket IM BV-SESweden Statens Järnvägar AB PO SJ AB-SESweden Green Cargo AB FO Green Cargo-SESwitzerland BLS Lötschbergbahn AG IC BLS-CH XSwitzerland Chemins de fer fédéraux IC CFF/SBB/FFS-CH XUnited Kingdom Association of Train Operating Companies PO ATOC-GB XUnited Kingdom Eurostar (UK) Ltd. PO Eurostar-GBUnited Kingdom Eurotunnel IC Eurotunnel-GBUnited Kingdom Network Rail Ltd IM Network Rail-GBUnited Kingdom English Welsh & Scottish Railway Limited FO EWS-GBIM = Infrastructure manager; FO= Freight operator; PO= Passenger transportation operator;RO= Freight and passenger transportation operator; IC= Integrated company
Table 16: Covered UIC member railways by UIC statistics and the questionnaire survey (last column)with IDs used in figures of the study

Rail Diesel Study, WP 1 “Status and future development of the diesel fleet”Draft, 21.06.2005
41
4.2 Absolute performance figures
0
50.000
100.000
150.000
200.000
250.000D
B A
G-D
E
AT
OC
-GB
SN
CF-
FR
CD
-CZ
FS
-IT
MA
V-H
U
CFR
-RO
RE
NF
E-E
S
DS
B-D
K
PK
P-P
L
ÖB
B-A
T
CH
-GR
ZS
SK
-SK
LDZ
-LV
LG-L
T
CIE
-IE
SJ
AB
-SE
VR
-FI
SN
CB
/NM
BS
-BE
EV
R-E
E
SZ
-SI
BD
Z-B
G
NS
-NL
NS
B-N
O
Gre
en C
argo
-SE
CF
L-LU
GyS
EV
/RÖ
EE
-HU
[103 km]
Figure 33: Diesel running performance of different European railways in train-km (Source: UICstatistics)
0
50.000
100.000
150.000
200.000
250.000
DB
AG
-DE
ATO
C-G
B
SN
CF
-FR
CD
-CZ
FS
-IT
MA
V-H
U
CF
R-R
O
RE
NFE
-ES
DS
B-D
K
PK
P-P
L
ÖB
B-A
T
CH
-GR
ZSS
K-S
K
LDZ-
LV
LG-L
T
CIE
-IE
SJ
AB
-SE
VR
-FI
SN
CB
/NM
BS
-BE
EV
R-E
E
SZ-
SI
BD
Z-B
G
NS
-NL
NS
B-N
O
Gre
en C
argo
-SE
CFL
-LU
GyS
EV
/RÖ
EE
-HU
Diesel Passenger Diesel Freight
[103 km]
Figure 34: Diesel running performance (train-km) differentiated by passenger and freight (Source: UICstatistics)
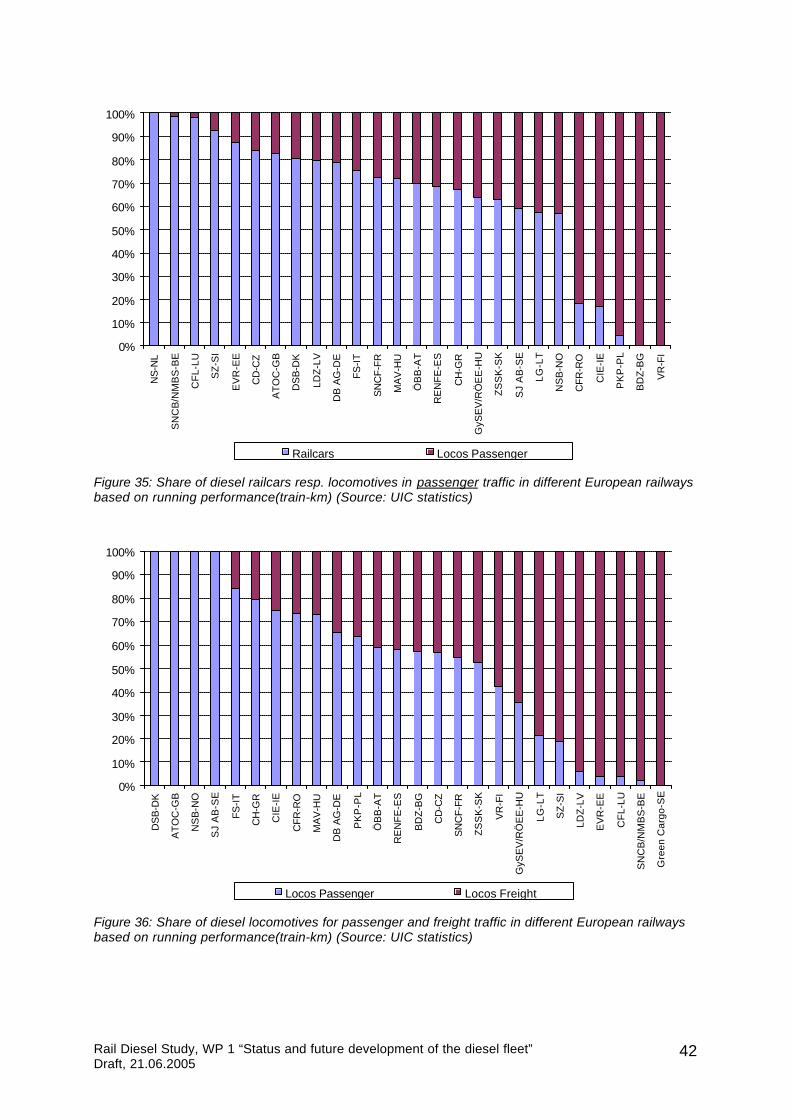
Rail Diesel Study, WP 1 “Status and future development of the diesel fleet”Draft, 21.06.2005
42
0%
10%
20%
30%
40%
50%
60%
70%
80%
90%
100%
NS
-NL
SN
CB
/NM
BS
-BE
CF
L-LU
SZ
-SI
EV
R-E
E
CD
-CZ
AT
OC
-GB
DS
B-D
K
LDZ
-LV
DB
AG
-DE
FS
-IT
SN
CF-
FR
MA
V-H
U
ÖB
B-A
T
RE
NF
E-E
S
CH
-GR
GyS
EV
/RÖ
EE
-HU
ZS
SK
-SK
SJ
AB
-SE
LG-L
T
NS
B-N
O
CFR
-RO
CIE
-IE
PK
P-P
L
BD
Z-B
G
VR
-FI
Railcars Locos Passenger
Figure 35: Share of diesel railcars resp. locomotives in passenger traffic in different European railwaysbased on running performance(train-km) (Source: UIC statistics)
0%
10%
20%
30%
40%
50%
60%
70%
80%
90%
100%
DS
B-D
K
AT
OC
-GB
NS
B-N
O
SJ
AB
-SE
FS
-IT
CH
-GR
CIE
-IE
CFR
-RO
MA
V-H
U
DB
AG
-DE
PK
P-P
L
ÖB
B-A
T
RE
NF
E-E
S
BD
Z-B
G
CD
-CZ
SN
CF-
FR
ZS
SK
-SK
VR
-FI
GyS
EV
/RÖ
EE
-HU
LG-L
T
SZ
-SI
LDZ
-LV
EV
R-E
E
CF
L-LU
SN
CB
/NM
BS
-BE
Gre
en C
argo
-SE
Locos Passenger Locos Freight
Figure 36: Share of diesel locomotives for passenger and freight traffic in different European railwaysbased on running performance(train-km) (Source: UIC statistics)

Rail Diesel Study, WP 1 “Status and future development of the diesel fleet”Draft, 21.06.2005
43
4.3 Figures with specific wagon load / performance values
0
50
100
150
200
250
ATO
C-G
B
SJ
AB
-SE
DS
B-D
K
RE
NF
E-E
S
NS
B-N
O
DB
AG
-DE
GyS
EV
/RÖ
EE
-HU
ÖB
B-A
T
MA
V-H
U
SN
CF
-FR
CF
L-LU
SZ
-SI
FS
-IT
CIE
-IE
CH
-GR
VR
-FI
SN
CB
/NM
BS
-BE
CD
-CZ
LDZ
-LV
CP
-PT
EV
R-E
E
CFR
-RO
NS
-NL
PK
P-P
L
BD
Z-B
G
LG-L
T
CF
F/S
BB
/FF
S-C
H
ZS
SK
-SK
Electric Traction
[103 km per tractive unit]
Figure 37: Running performance (train-km) per electric tractive unit for different European railways(Source: UIC statistics)
0
50
100
150
200
250
ATO
C-G
B
SJ
AB
-SE
DS
B-D
K
RE
NF
E-E
S
NS
B-N
O
DB
AG
-DE
GyS
EV
/RÖ
EE
-HU
ÖB
B-A
T
MA
V-H
U
SN
CF
-FR
CF
L-LU
SZ
-SI
FS-IT
CIE
-IE
CH
-GR
VR
-FI
SN
CB
/NM
BS
-BE
CD
-CZ
LDZ
-LV
CP
-PT
EV
R-E
E
CFR
-RO
NS
-NL
PK
P-P
L
BD
Z-B
G
LG-L
T
CF
F/S
BB
/FF
S-C
H
ZS
SK
-SK
Diesel Locos
[103 km per tractive unit]
Figure 38: Running performance (train-km) per diesel locomotive for different European railways(Source: UIC statistics)
0
50
100
150
200
250
ATO
C-G
B
SJ
AB
-SE
DS
B-D
K
RE
NF
E-E
S
NS
B-N
O
DB
AG
-DE
GyS
EV
/RÖ
EE
-HU
ÖB
B-A
T
MA
V-H
U
SN
CF
-FR
CF
L-LU
SZ
-SI
FS-IT
CIE
-IE
CH
-GR
VR
-FI
SN
CB
/NM
BS
-BE
CD
-CZ
LDZ
-LV
CP
-PT
EV
R-E
E
CFR
-RO
NS
-NL
PK
P-P
L
BD
Z-B
G
LG-L
T
CF
F/S
BB
/FF
S-C
H
ZS
SK
-SK
Diesel Railcar
[103 km per tractive unit]
Figure 39: Running performance (train-km) per railcar for different European railways (Source: UICstatistics)

Rail Diesel Study, WP 1 “Status and future development of the diesel fleet”Draft, 21.06.2005
44
0
500
1.000
1.500
2.000
2.500
3.000
3.500E
VR
-EE
LDZ-
LV
LG-L
T
CFL
-LU
SN
CB
/NM
BS
-BE
VR
-FI
Gre
en C
argo
-SE
CIE
-IE
PK
P-P
L
SN
CF
-FR
CF
R-R
O
RE
NFE
-ES
DB
AG
-DE
ZSS
K-S
K
SZ-
SI
MA
V-H
U
ÖB
B-A
T
BD
Z-B
G
CD
-CZ
CH
-GR
FS
-IT
GyS
EV
/RÖ
EE
-HU
Electric Freight Diesel Freight
[t/ train]
Figure 40: Wagon load (tonnes) per freight diesel train for electric and diesel traction for differentEuropean railways (Source: UIC statistics)
4.4 Figures characterising the diesel fleet composition
0
1.000
2.000
3.000
4.000
5.000
6.000
DB
AG
-DE
SN
CF
-FR
FS
-IT
CD
-CZ
PK
P-P
L
CF
R-R
O
AT
OC
-GB
MA
V-H
U
ZS
R-S
K
ZS
SK
-SK
CF
F/S
BB
/FF
S-C
H
ÖB
B-A
T
RE
NF
E-E
S
SN
CB
/NM
BS
-BE
VR
-FI
BD
Z-B
G
LG-L
T
LDZ-
LV
SJ
AB
-SE
CH
-GR
CP
-PT
DS
B-D
K
Gre
en C
argo
-SE
CIE
-IE
EV
R-E
E
SZ
-SI
NS
-NL
CFL
-LU
BV
-SE
NS
B-N
O
GyS
EV
/RÖ
EE
-HU
Eur
otun
nel-G
B
Diesel RailcarsDiesel Locos
Tractive units
Figure 41:. Number of diesel tractive units (railcars and locomotives) in different European railways(Source: UIC statistics)

Rail Diesel Study, WP 1 “Status and future development of the diesel fleet”Draft, 21.06.2005
45
0%
20%
40%
60%
80%
100%
DS
B-D
K
NS
-NL
NS
B-N
O
ZSS
K-S
K
AT
OC
-UK
FS
-IT
CIE
-IE
CP
-PT
BLS
-CH
DB
AG
-DE
MA
V-H
U
SZ-
SI
CD
-CZ
CF
R P
ass.
-RO
LG-L
T
SN
CB
/NM
BS
-BE
SN
CF
-FR
ÖB
B-A
T
LDZ-
LV
VR
-FI
BD
Z-B
G
PK
P-P
L
CF
R F
reig
ht-R
O
ZSS
K C
argo
-SK
CF
F/S
BB
/FF
S-C
H
EV
R-E
E
Railcar Engines Locomotive Engines
% of number
Figure 42: Share of number of railcar engines resp. locomotive engines in different European railways(Source: questionnaire survey)
0
5
10
15
20
25
30
35
40
DB
AG
-DE
SN
CF
-FR
FS
-IT
CD
-CZ
MA
V-H
U
CF
R P
ass.
-RO
SN
CB
/NM
BS
-BE
DS
B-D
K
CFR
Fre
ight
-RO
LG-L
T
CF
F/S
BB
/FF
S-C
H
ZS
SK
Car
go-S
K
LDZ-
LV
CP
-PT
BD
Z-B
G
VR
-FI
NS
-NL
CIE
-IE
SZ
-SI
EV
R-E
E
NS
B-N
O
BLS
-CH
UK
-AT
OC
ZS
SK
-SK
OE
BB
-AT
PK
P-P
L
Railcars LocomotivesYears
Figure 43: Average age of railcar and locomotive engines in different European railways (Source:questionnaire survey)

Rail Diesel Study, WP 1 “Status and future development of the diesel fleet”Draft, 21.06.2005
46
33,3 32,334,6
0,0
5,0
10,0
15,0
20,0
25,0
30,0
35,0
40,0
45,0
Railcars Mainline Locos Shunting Locos
Years
Figure 44: Average value and range of average diesel vehicle age when decommissioned (Source:questionnaire survey)
30,030,027,1
0,0
5,0
10,0
15,0
20,0
25,0
30,0
35,0
40,0
45,0
Railcars Mainline Locos Shunting Locos
Years
Figure 45: Average value and range of life expectancies in years for new diesel vehicles (Source:questionnaire survey)

Rail Diesel Study, WP 1 “Status and future development of the diesel fleet”Draft, 21.06.2005
47
4.5 Questionnaire A: Fleet detailsThe following questionnaire as first section out of 3 has been sent to UIC memberrailways in Europe on 3rd of February 2005 with deadline 1st of March 2005. Laterincomes until 17th of June 2005 had been taken into account in an update of thereport. The questionnaire was answered by the railway companies marked in Table 16in Annex 4.1. A summary of the collected answers is filled in each question box incursive and red letters.The other sections of the questionnaire are focussing on emission reductionmeasures (Section B) and air quality (Section C). They are a basis for the workpackages 2 and 3 of the Rail Diesel Study.
RAIL DIESEL STUDY QUESTIONNAIRESECTION A: FLEET DETAILS
QUESTION A1: Data on Fleet Age and PowerPurpose ofquestion:
The data matrix will be the basis for all analysis of the current state and future development of theEuropean diesel fleet.
A1.1: Please fill in the following matrix about the current state of the DIESEL fleet of yourcompany. If you already participated in the pre-study, please note that the age categories havebeen updated.
Categories according toamendment of directive 97/68
Year that traction engine* was placed intoservice Number of traction engines* - sum
2000 and newer 2.5751995-1999 2.0051990-1994 1.3341980-1989 2.717
1970-1979 1.6611969 and older 782
Railcar > 130 kW
Total no. of traction engines 11.074
2000 and newer 717
1995-1999 1121990-1994 333
1980-1989 5551970-1979 645
1969 and older 2.018
Locomotive 130 - 560 kW
Total no. of traction engines 4.380
2000 and newer 8061995-1999 321
1990-1994 1671980-1989 1.5601970-1979 3.994
1969 and older 3.196
Locomotive 560 - 2000 kW
Total no. of traction engines 10.044
2000 and newer 3481995-1999 139
1990-1994 1761980-1989 178
1970-1979 5321969 and older 47
Locomotive > 2000 kW
Total no. of traction engines 1.420
* Please indicate the number of engines for traction, not auxiliary engines (e.g. generators) and not thenumber of vehicles.
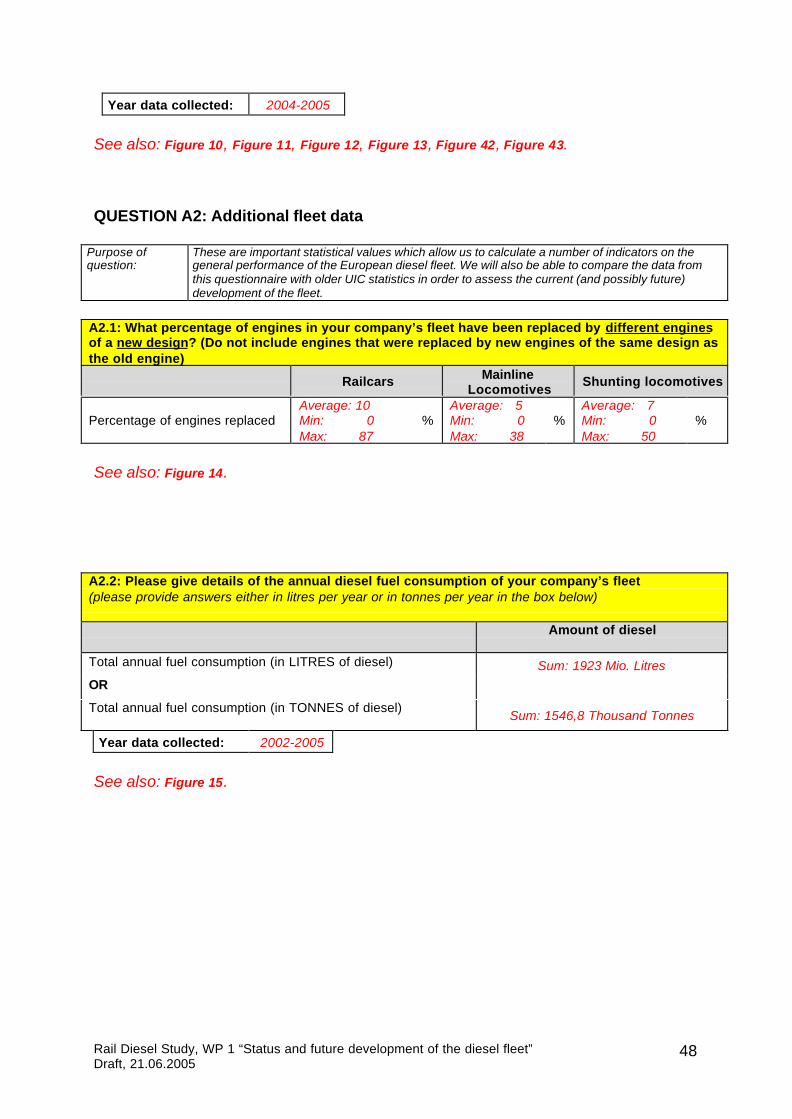
Rail Diesel Study, WP 1 “Status and future development of the diesel fleet”Draft, 21.06.2005
48
Year data collected: 2004-2005
See also: Figure 10, Figure 11, Figure 12, Figure 13, Figure 42, Figure 43.
QUESTION A2: Additional fleet data
Purpose ofquestion:
These are important statistical values which allow us to calculate a number of indicators on thegeneral performance of the European diesel fleet. We will also be able to compare the data fromthis questionnaire with older UIC statistics in order to assess the current (and possibly future)development of the fleet.
A2.1: What percentage of engines in your company’s fleet have been replaced by different enginesof a new design? (Do not include engines that were replaced by new engines of the same design asthe old engine)
Railcars MainlineLocomotives
Shunting locomotives
Percentage of engines replacedAverage: 10Min: 0Max: 87
%Average: 5Min: 0Max: 38
%Average: 7Min: 0Max: 50
%
See also: Figure 14.
A2.2: Please give details of the annual diesel fuel consumption of your company’s fleet(please provide answers either in litres per year or in tonnes per year in the box below)
Amount of diesel
Total annual fuel consumption (in LITRES of diesel) Sum: 1923 Mio. LitresOR
Total annual fuel consumption (in TONNES of diesel)Sum: 1546,8 Thousand Tonnes
Year data collected: 2002-2005
See also: Figure 15.

Rail Diesel Study, WP 1 “Status and future development of the diesel fleet”Draft, 21.06.2005
49
A2.3: Please give details of the sulphur content of the diesel fuel your company uses
Amount of sulphur (in parts permillion)
Sulphur content of diesel fuel <10 - 2000 ppm
See also: Figure 24.
If you can make a judgement on the quality of the data provided above or give additional information, pleasedo so here:Single comments:§ “This is highest allowable sulphur content determined from delivery agreement. Actual sulphur content is
lower and variable over delivery case.”§ “These data are collected from the analysis documents of the diesel fuel – delivery made by few
companies.”§ “related to SR EN ISO 20846:2004 –max. limit for S content = 50 mg/ kg fuel and SR EN ISO
20884:2004 – max. limit for S content = 350 mg/ kg fuel.”§ “Since 2004, a levy is collected on fuel containing more than 10 ppm sulphur. As a consequence, there
is virtually no more fuel available commercially that exceeds 10 ppm sulphur.”
QUESTION A3: Life expectancy of vehicles in your company’s fleetPurpose ofquestion:
One of the crucial parameters for the assessment of the future development of the European dieselfleet and the total emissions by rail vehicles is the renewal rate of the fleet.
A3.1: What is the average age (in years) of vehicles and engines when they are decommissionedfrom service?
Pre-study results: The answers to this question in the pre-study were very diverse. The average life expectancy wasapprox. 25-35 years for a locomotive and 15-20 years for a railcar. Some train operating companiesreplace the engines of their vehicles regularly, others stated that the life expectancy of their dieselengines was higher than that of their vehicles.
Railcars MainlineLocomotives
Shunting locomotives
VehiclesAverage: 33Min: 25Max: 45
Average: 32Min: 20Max: 40
Average: 35Min: 20Max: 45
EnginesAverage: 27Min: 10Max: 42
Average: 30Min: 10Max: 40
Average: 30Min: 10Max: 41
Additional information, comments:Single comments:§ “In the past, tractive units for shunting and maintenance operations had a life expectancy of 40 years.
Diesel engines in these tractive units averaged also about 40 years. However, with new locomotives lifeexpectancy is assumed to be 25 years (as a consequence of accelerated technical development). Whenit reaches the end of the calculatory life expectancy, a locomotive series is evaluated with respect to theeconomical, ecological an technical benefits of replacement, retrofitting or overhaul. There are noexperiences on mainline locomotives, since until recently all of them used to be run with electricity.”
§ “Normally the engine replacement occurs when there are no spare parts available or when itsmaintenance cost became too high.”
See also: Figure 28, Figure 44.

Rail Diesel Study, WP 1 “Status and future development of the diesel fleet”Draft, 21.06.2005
50
A3.2: How long does your company expect NEW vehicles and engines to remain in operation?
Railcars MainlineLocomotives
Shunting locomotives
VehiclesAverage: 27Min: 13Max: 40
Average: 30Min: 10Max: 40
Average: 30Min: 10Max: 40
EnginesAverage: 20Min: 5Max: 30
Average: 23Min: 10Max: 35
Average: 20Min: 5Max: 35
Please explain if the conclusion of the pre-study, that life expectancy is decreasing, also applies toyour company.Single comments:§ “We expect life expectancy to decrease, although as of now there are many old locomotives still in
service. Reasons are accelerated technical development regarding engines and locomotives on onehand, accelerated organisational changes leading to shifting demands for traction units on the otherhand.”
§ “The minimum life expectancy for “body” is 30 years, for the engines at least the half (15 years) but youhave to consider that during an engine’s overhaul his life is resettled so if you don’t have any externalconstraint (new emission limits for example) you could maintain the same engine in use till the vehicle(30 years). This is what happened, in fact, till now.”
See also: Figure 29, Figure 45.
A3.3: Reduced use of old engines
Pre-study result: From comments to the pre-study, we concluded that vehicles with old engines are oftennot used anymore but kept in standby for backup and auxiliary services (but still appear instatistics), while a major part of the rail operations are carried out with newer vehicles.
Yes: 15 answersAre newer engines used more intensively than older engines in the fleetof your company? (Please mark appropriate answer with “X”) No: 10 answers
If you answered with “Yes” above, as of what engine age are vehiclesusually put into reduced service in your company?
Average: 27Min: 18Max: 33
years
Please provide numbers if possible (e.g. X % of operations performed by vehicles with enginesnewer than year Y), additional information, comments:
Single comments:§ “Due to delivery of new locomotives the use of the older types is automatically decreasing, no number
can be defined since it is depending on locomotive series.”§ “It’s impossible to indicate a exact number of years: this number depends on engine’s “residual”
reliability. If an engine, even if very old, is reliable his vehicles will have a very high level of utilisation.”§ “There is no formal reduced service. The fact that newer locomotives are used more heavily is that they
are purchased with a defined application in mind and they are therefore used to cover this demand. Thismay lead to older locomotives (which are at the same time often less versatile, less powerful or lessreliable than their new counterparts) being used less frequently.”

Rail Diesel Study, WP 1 “Status and future development of the diesel fleet”Draft, 21.06.2005
51
QUESTION A4: Future development of your company’s vehicle fleet
Purpose ofquestion:
The information given here will help us predict the future ratio between newly procured and re-engined vehicles, between decommissionings and new procurements and finally also between thethree types of locomotives specified hereunder.
A4.1: Compared to the current size and composition of your company’s fleet, how do you expect thenumber of vehicles to change in the future?(Please mark “X” in the relevant boxes below).
Railcars Mainlinelocomotives
Shuntinglocomotives
Total dieselfleet
Number of vehicles will increase 9 answers 1 answer 1 answer 3 answersNumber of vehicles will stay the same 10 answers 7 answers 11 answers 7 answersNumber of vehicles will decrease 4 answers 14 answers 9 answers 13 answers
Please provide numbers if possible, additional information, comments:
Single comments:§ “There may be a slight increase in diesel mainline locomotives for transboundary lines. More
importantly, the number of vehicles for shunting and the diversity of types will decrease in an attempt toreduce costs of maintenance.”
§ “the strategy is railcars”§ “old locomotives with new engines of a new design and new locomotives will be more powerful. So
number of vehicles will decrease”§ “Electrification of track net is continuing so need of diesel traction is decreasing.”
See also: Figure 25.
A4.2: For vehicles in your company’s fleet, is there a trend towards using more powerful or less powerfulengines, or are engine power categories remaining broadly the same?(Please mark “X” in the relevant boxes below).
Trend Railcars Mainlinelocomotives
Shuntinglocomotives
Trend to more powerful engines 12 answers 8 answers 5 answers
Engine power is remaining the same 8 answers 15 answers 15 answers
Trend to less powerful engines 3 answers 0 answers 2 answers
Please provide numbers if possible, additional information, comments:
Single comments:§ “By increasing the performance/power of the engines we aim at increasing the operation life of the
combustion engine.”§ “For mainline locomotives discussions are ongoing for more powerful engines and locomotives but no
decision has been taken.”
See also: Figure 26.

Rail Diesel Study, WP 1 “Status and future development of the diesel fleet”Draft, 21.06.2005
52
A4.3: Does your company have plans to re-engine* part of its diesel fleet in the next ten years?(Please mark “X” in the relevant boxes below).
*Only mark “Yes” if the new engines will be of a newer design.
Railcars MainlineLocomotives
Shuntinglocomotives
YES, part of the fleet will be re-engined 6 answers 10 answers 11 answers
NO, the fleet will not be re-engined 12 answers 12 answers 12 answers
Please provide numbers if possible, additional information, comments:
See also: Figure 27.
A4.4: In future, does your company plan to externalise its fleet and to rely more on leased or rentedvehicles owned by rolling stock leasing companies?(Please mark “X” in appropriate box and give more details below)
Yes 4 answers No 19 answers
Please quantify, if possible, additional information, comments:

Rail Diesel Study, WP 1 “Status and future development of the diesel fleet”Draft, 21.06.2005
53
QUESTION A5: Representative vehicles and emissions factors
Purpose ofquestion:
One of the central aspects of the rail diesel study is the evaluation of the life-cycle costs of differentemissions reduction technologies for vehicles which are typical of the European diesel fleet.Your information will be used to find the best representative vehicles for life cycle cost assessments,feasibility analyses of emissions reduction measures etc. The results of the Rail Diesel Study will beavailable to the participants.
A5.1: Instructions: Please describe a railcar, a mainline locomotive, and a shunting locomotive which youfeel are typical for the vehicles owned by your company. We recommend choosing vehicles with a highoperating performance (i.e. vehicles that are highly used) compared to the rest of your fleet. If you would liketo describe more than one railcar, mainline or shunting locomotive, please feel free to copy this table to thenext page for further vehicles (e.g. from different age categories).
Railcar Mainline locomotive Shunting locomotive
Type of vehicle
Type and name of engine
Age of vehicle
Age of engine
5 vehicles with engineage < 1990
14 vehicles with engineage >1990
23 vehicles withengine age < 1990
7 vehicles withengine age >1990
13 vehicles withengine age < 1990
4 vehicles withengine age >1990
Engine power [kW] Average: 337Min: 155Max: 560
Average: 337Min: 155Max: 560
Average: 337Min: 155Max: 560
Type of power transmission(diesel-electric, diesel-hydraulic,
diesel mechanical)
4 diesel mechanic14 diesel hydraulic
1 diesel electric
5 diesel hydraulic25 diesel electric
11 diesel hydraulic6 diesel electric
Diesel consumption [g/kWh],average value (if available):
Average: 218Min: 191Max: 245
Average: 224Min: 198Max: 293
Average: 228Min: 212Max: 256
NOx emissions factor [g/kWh] Average: 8,7Min: 4,7Max: 17,0
Average: 4,1Min: 6,5Max: 20,9
Average: 12,4Min: 6,2Max: 19,4
For comparison: Average NOxemissions factor of your fleet
[g/kWh]
Just few answers Just few answers Just few answers
PM emissions factor [g/kWh] Average: 0,23Min: 0,06Max: 0,80
Average: 0,27Min: 0,10Max: 0,61
Average: 0,47Min: 0,12Max: 1,00
For comparison: Average PMemissions factor of your fleet
[g/kWh]
Just few answers Just few answers Just few answers
Test cycle (ISO-F, EURO etc.) 11 x ISO F6 x EURO1 x “direct
measurements”
13 x ISO F3 x ORE
1 x “directmeasurements”
9 x ISO F1 x ORE
Annual average operatingperformance [gross tkm]
Please add additional information and comments here. If possible, please explain how you calculatedaverage values.
See also: Figure 16, Figure 18, Figure 19.

Rail Diesel Study, WP 1 “Status and future development of the diesel fleet”Draft, 21.06.2005
54
QUESTION A6: Additional information
A6.1: If you have additional information, a comment or a personal opinion on the subject of emissions fromrailway diesel vehicles and emissions control, please feel free to add it here. Any contribution is welcome!
Just few data/company specific answers