Embed Size (px)
Citation preview

1
5 August 2015
StatPro Group plc
Interim results for the six months ended 30 June 2015 StatPro Group plc (AIM: SOG), the AIM listed provider of portfolio analysis and asset pricing services for
the global asset management industry, announces its interim results for the six months ended 30 June 2015.
Six months ended 30 June 2015
Six months ended 30 June 2014
Change Constant currency
Revenue £15.44 m £15.71 m (2%) 2%
Annualised Recurring Revenue (1) £28.62 m £28.40 m 1% 4%
Profit before tax £0.82 m £1.08 m (24%) (15%)
Adjusted EBITDA (2) £1.73 m £2.03 m (15%) (9%)
Earnings per share – basic 0.8p 1.0p (20%)
– adjusted (2) 1.0p 1.3p (23%)
Interim dividend per share 0.85p 0.85p -
Financial highlights:
Group Annualised Recurring Revenue (“ARR”) (1) up 4% (4) to £28.62 million (2014 at constant currency: £27.54 million)
StatPro Revolution annualised recurring revenue (1) up 61% (4) to £6.47 million (2014 at constant currency: £4.01 million)
Recurring revenue from StatPro Revolution accounts for 23% of Group ARR (2014: 15%)
As expected, continued investment in product development and cloud technology resulted in lower
adjusted EBITDA (2) of £1.73 million (2014 at constant currency: £1.90 million)
Forward order book of contracted revenue (3) grew by 4% (4) to £37.01 million (2014 at constant currency: £35.60 million)
Free cash flow of £0.78 million (2014: £0.54 million)
Interim dividend maintained at 0.85 pence per share
Operating highlights:
Advanced Risk Management module in StatPro Revolution releases in May and September 2015
Continued focus on revenue per client; average annualised revenue for StatPro Revolution clients
increased 73% to £21,400 (2014: £12,400)
StatPro Revolution Performance module is on track for release in H1 2016
Signed new £20 million, five year banking facility with Wells Fargo
(1) Annualised Recurring Revenue is the annual value of revenue contractually committed at period end. (2) Adjusted EBITDA and adjusted earnings per share are EBITDA and earnings per share after adjustment for amortisation of
acquired intangible assets, and share based payments (notes 2 and 4). (3) Forw ard order book of contracted revenue is the total amount of software and professional services revenue that is contractually
committed at period end. (4) At constant currency.

2
Justin Wheatley, Chief Executive of StatPro, commented: “We have maintained our high levels of recurring revenue and driven sales in our cloud-based
service, StatPro Revolution, to both our existing customer base and a range of new customers. “StatPro Revolution saw annualised recurring revenue increase by 61% over the last 12 months and
now contributes 23% of the Group’s total recurring revenue. “We have also secured a £20 million banking facility with Wells Fargo which will provide us with
added flexibility to support our growth. “With our forward order book of contracted revenue continuing to grow and the momentum that
StatPro Revolution is developing, we remain on course to establish the Group as a lower cost, higher margin pure cloud-based business.”
Enquiries:
StatPro Group plc
Justin Wheatley, Chief Executive 020 8410 9876
Andrew Fabian, Finance Director
Panmure Gordon – Nomad and Broker
Corporate Finance – Freddy Crossley / Fred Walsh 020 7886 2500
Corporate Broking – Tom Salvesen
Instinctif Partners
Adrian Duffield / Lauren Foster 020 7457 2020
About StatPro StatPro is a global provider of award winning portfolio analytics solutions for the investment community.
The Group’s cloud-based platform provides vital analysis of portfolio performance, attribution, risk and compliance. This multi-asset class analytics platform helps StatPro’s clients increase assets under management, improve client service, meet tough regulations and reduce costs.
The Group’s integrated and global data coverage includes over 3.2 million securities such as equities, bonds, mutual funds, FX rates, futures, options, OTCs, sector classifications and much else besides. StatPro also covers most families of benchmarks including MSCI, FTSE, Russell, NASDAQ and the licence
free Freedom Index. StatPro has grown its Annualised Recurring Revenue from less than £1 million in 1999 to around £29 million
at 30 June 2015. The Group has operations in Europe, North America, South Africa, Asia and Australia, with hundreds of clients in 37 countries around the world. Approximately 80% of recurring revenues are generated outside the UK. StatPro Group plc shares are listed on AIM.
Overview The Group reached an inflexion point at the beginning of the current financial year in the roll out of its cloud-
based product StatPro Revolution and continues to build on this. The Annualised Recurring Revenue (“ARR”) of StatPro Revolution jumped by 61% over the last 12 months and now contributes some 23% of the Group’s total ARR (2014: 15%). This change in the revenue mix underpins the Group’s strategy to
becoming a pure cloud services provider.
3
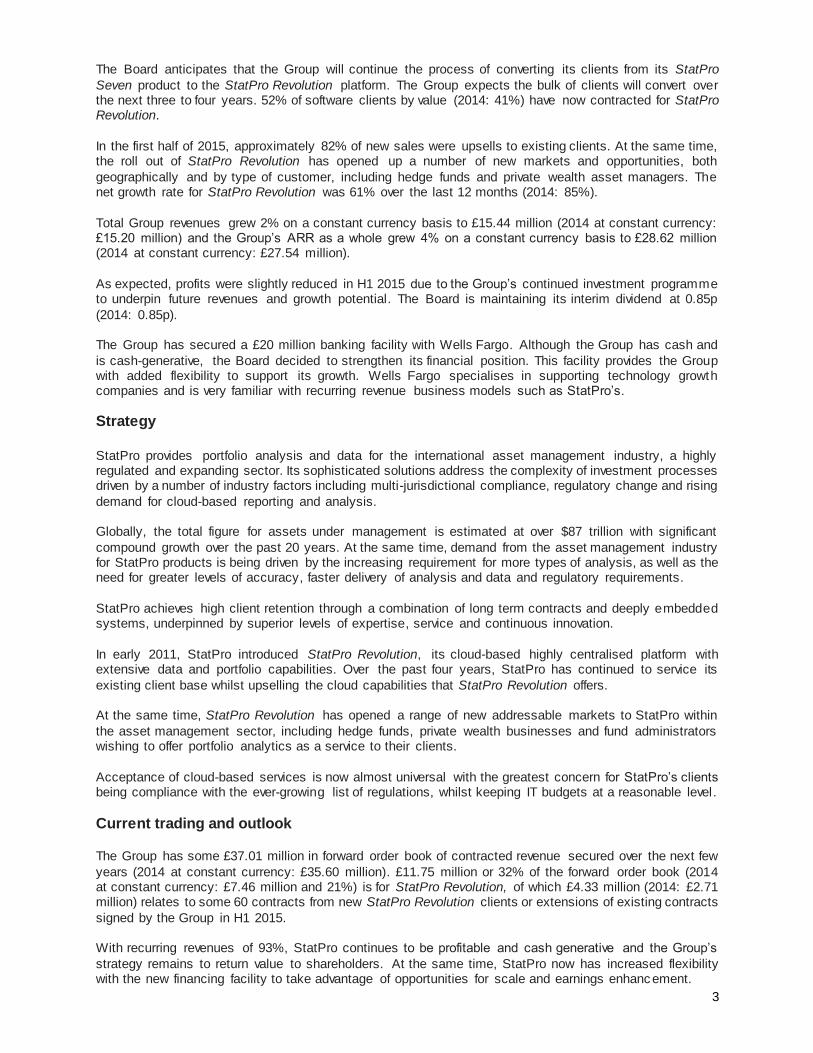
The Board anticipates that the Group will continue the process of converting its clients from its StatPro
Seven product to the StatPro Revolution platform. The Group expects the bulk of clients will convert over the next three to four years. 52% of software clients by value (2014: 41%) have now contracted for StatPro Revolution.
In the first half of 2015, approximately 82% of new sales were upsells to existing clients. At the same time, the roll out of StatPro Revolution has opened up a number of new markets and opportunities, both
geographically and by type of customer, including hedge funds and private wealth asset managers. The net growth rate for StatPro Revolution was 61% over the last 12 months (2014: 85%).
Total Group revenues grew 2% on a constant currency basis to £15.44 million (2014 at constant currency: £15.20 million) and the Group’s ARR as a whole grew 4% on a constant currency basis to £28.62 million (2014 at constant currency: £27.54 million).
As expected, profits were slightly reduced in H1 2015 due to the Group’s continued investment programme to underpin future revenues and growth potential. The Board is maintaining its interim dividend at 0.85p
(2014: 0.85p). The Group has secured a £20 million banking facility with Wells Fargo. Although the Group has cash and
is cash-generative, the Board decided to strengthen its financial position. This facility provides the Group with added flexibility to support its growth. Wells Fargo specialises in supporting technology growth companies and is very familiar with recurring revenue business models such as StatPro’s.
Strategy
StatPro provides portfolio analysis and data for the international asset management industry, a highly regulated and expanding sector. Its sophisticated solutions address the complexity of investment processes driven by a number of industry factors including multi-jurisdictional compliance, regulatory change and rising
demand for cloud-based reporting and analysis. Globally, the total figure for assets under management is estimated at over $87 trillion with significant
compound growth over the past 20 years. At the same time, demand from the asset management industry for StatPro products is being driven by the increasing requirement for more types of analysis, as well as the need for greater levels of accuracy, faster delivery of analysis and data and regulatory requirements.
StatPro achieves high client retention through a combination of long term contracts and deeply embedded systems, underpinned by superior levels of expertise, service and continuous innovation.
In early 2011, StatPro introduced StatPro Revolution, its cloud-based highly centralised platform with extensive data and portfolio capabilities. Over the past four years, StatPro has continued to service its
existing client base whilst upselling the cloud capabilities that StatPro Revolution offers. At the same time, StatPro Revolution has opened a range of new addressable markets to StatPro within
the asset management sector, including hedge funds, private wealth businesses and fund administrators wishing to offer portfolio analytics as a service to their clients.
Acceptance of cloud-based services is now almost universal with the greatest concern for StatPro’s clients being compliance with the ever-growing list of regulations, whilst keeping IT budgets at a reasonable level. Current trading and outlook
The Group has some £37.01 million in forward order book of contracted revenue secured over the next few
years (2014 at constant currency: £35.60 million). £11.75 million or 32% of the forward order book (2014 at constant currency: £7.46 million and 21%) is for StatPro Revolution, of which £4.33 million (2014: £2.71 million) relates to some 60 contracts from new StatPro Revolution clients or extensions of existing contracts
signed by the Group in H1 2015. With recurring revenues of 93%, StatPro continues to be profitable and cash generative and the Group’s
strategy remains to return value to shareholders. At the same time, StatPro now has increased flexibility with the new financing facility to take advantage of opportunities for scale and earnings enhanc ement.
4
With this level of momentum and growing revenue visibility, the Board is confident that the Group will continue to deliver against its strategic objectives and drive further growth in StatPro Revolution revenues.
Operational review
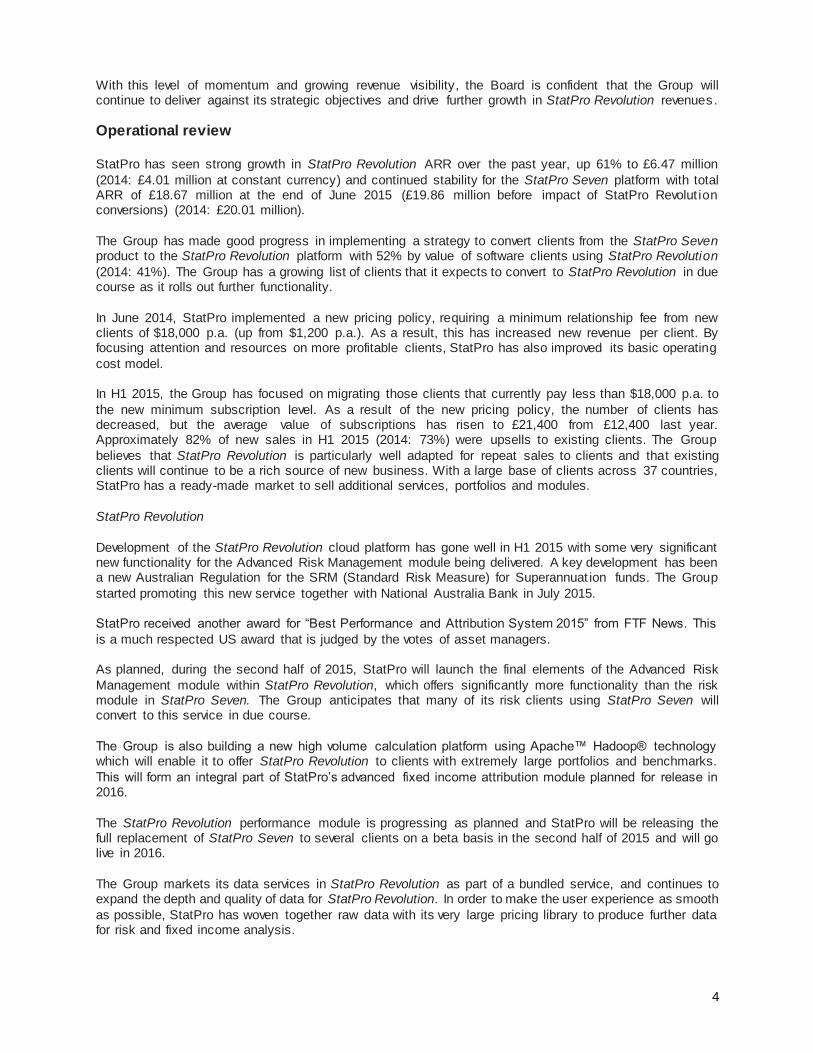
StatPro has seen strong growth in StatPro Revolution ARR over the past year, up 61% to £6.47 million
(2014: £4.01 million at constant currency) and continued stability for the StatPro Seven platform with total ARR of £18.67 million at the end of June 2015 (£19.86 million before impact of StatPro Revolut ion conversions) (2014: £20.01 million).
The Group has made good progress in implementing a strategy to convert clients from the StatPro Seven product to the StatPro Revolution platform with 52% by value of software clients using StatPro Revolution
(2014: 41%). The Group has a growing list of clients that it expects to convert to StatPro Revolution in due course as it rolls out further functionality.
In June 2014, StatPro implemented a new pricing policy, requiring a minimum relationship fee from new clients of $18,000 p.a. (up from $1,200 p.a.). As a result, this has increased new revenue per client. By focusing attention and resources on more profitable clients, StatPro has also improved its basic operating
cost model. In H1 2015, the Group has focused on migrating those clients that currently pay less than $18,000 p.a. to
the new minimum subscription level. As a result of the new pricing policy, the number of clients has decreased, but the average value of subscriptions has risen to £21,400 from £12,400 last year. Approximately 82% of new sales in H1 2015 (2014: 73%) were upsells to existing clients. The Group
believes that StatPro Revolution is particularly well adapted for repeat sales to clients and that existing clients will continue to be a rich source of new business. With a large base of clients across 37 countries, StatPro has a ready-made market to sell additional services, portfolios and modules.
StatPro Revolution
Development of the StatPro Revolution cloud platform has gone well in H1 2015 with some very significant new functionality for the Advanced Risk Management module being delivered. A key development has been a new Australian Regulation for the SRM (Standard Risk Measure) for Superannuat ion funds. The Group
started promoting this new service together with National Australia Bank in July 2015. StatPro received another award for “Best Performance and Attribution System 2015” from FTF News. This
is a much respected US award that is judged by the votes of asset managers. As planned, during the second half of 2015, StatPro will launch the final elements of the Advanced Risk
Management module within StatPro Revolution, which offers significantly more functionality than the risk module in StatPro Seven. The Group anticipates that many of its risk clients using StatPro Seven will convert to this service in due course.
The Group is also building a new high volume calculation platform using Apache™ Hadoop® technology which will enable it to offer StatPro Revolution to clients with extremely large portfolios and benchmarks.
This will form an integral part of StatPro’s advanced fixed income attribution module planned for release in 2016.
The StatPro Revolution performance module is progressing as planned and StatPro will be releasing the full replacement of StatPro Seven to several clients on a beta basis in the second half of 2015 and will go live in 2016.
The Group markets its data services in StatPro Revolution as part of a bundled service, and continues to expand the depth and quality of data for StatPro Revolution. In order to make the user experience as smooth
as possible, StatPro has woven together raw data with its very large pricing library to produce further data for risk and fixed income analysis.

5
Each market has different conventions and habits and StatPro Revolution is able to cater for hundreds of methodologies to give users the view of their portfolio to suit their specific requirements. This is one of the ways that StatPro Revolution is a considerable enhancement on StatPro Seven. StatPro Revolution
provides software, IT and data in a combined service that enables StatPro to offer a significantly enhanced service.
StatPro Seven Repeat revenue from StatPro Seven was very stable in H1 2015 with new sales largely offsetting
reductions. New sales tend to come from existing clients buying additional modules and user licences as well as new sales of StatPro Composites.
StatPro continues to support its clients on the StatPro Seven product, offering upgrades and maintenance. StatPro Seven provides essential services for the Group’s clients by delivering accurate and comprehens ive analysis for reporting to their clients.
Client feedback indicates that the operators of StatPro Seven want greater control over their data giving higher confidence that they will always publish accurate analysis. Whereas in the past, sending out
approximately correct performance numbers was common practice, the new regulatory environment makes this unacceptable. This in turn has led to clients expanding the use of accurate systems like StatPro Seven to a broader range of portfolios such as private wealth mandates. StatPro Revolution offers the crucial
solution: complete control of data and huge scale and speed compared to StatPro Seven and other systems using older technology.
Financial review
Revenue Group revenue increased by 2% at constant currency to £15.44 million, and was 2% lower at actual rates (2014: £15.71 million). 93% of Group revenue in H1 2015 was recurring revenue (2014: 92%).
Contracted revenue The forward order book of contracted revenue increased by 4% at constant currency (1% at actual rates)
to £37.01 million (2014 at constant currency: £35.60 million). The proportion by value of recurring revenue contracts at the end of June 2015 secured to the end of June
2016 or beyond amounted to 72% (2014: 75%); the weighted average length of contracts committed remained at 16 months.
New contracted revenue New sales of recurring contracts were up 14% to £2.09 million (2014: £1.84 million). Professional services revenue reduced slightly to £1.04 million (2014: £1.18 million).
Approximately 82% of new recurring contracted revenue came from existing clients (2014: 73%).
Recurring revenue
The Group’s business model of Software as a Service (“SaaS”) and recurring revenue contracts continues to provide excellent visibility of revenue.
The annualised recurring revenue at the end of June 2015 increased by 4% over the previous 12 months at constant currency to £28.62 million (2014: £27.54 million). The net growth rate for StatPro Revolution was 61% over the same period (2014: 85%).
The recurring revenue for StatPro Seven before the impact of conversions to StatPro Revolution was
£19.86 million, less than 1% reduction at constant currency (2014: 1% reduction). After the impact of conversions to StatPro Revolution, StatPro Seven annualised recurring revenue reduced to £18.67 million (2014: £20.01 million).

6
Revenue by segment
Revenue increased in the EMEAA region by 4% at constant currency to £9.98 million (2014 at constant currency: £9.60 million). In the North American region, revenue reduced by 2% at constant currency to
£5.46 million (2014 at constant currency: £5.60 million), as shown below:
Unaudited Unaudited Change
Six months
to 30 June
Six months
to 30 June
2015 2014 *
£ million £ million %
Revenue
EMEAA 9.98 9.60 4%
North America 5.46 5.60 (2%)
15.44 15.20 2%
FX - 0.51
Group rev enue 15.44 15.71 (2%)
* At constant currency
Revenue by service
Cloud revenues (incorporating StatPro Revolution, Risk and Data) grew by 7% as shown in the table below:
Revenue Six months to Six months to Change
30 June 2015 30 June 2014*
£ million £ million %
StatPro Revolution, Risk and Data 5.38 5.05 7%
StatPro Seven and non-cloud 10.06 10.15 (1%)
15.44 15.20 2%
FX - 0.51
Group revenue 15.44 15.71 (2%)
* At constant currency
StatPro Revolution recurring revenue is now 23% of the Group total (2014: 15%) and has grown at a higher rate than other revenues as the service is developed on a highly scalable technology platform.
The total recurring revenue from clients whose subscription, includes StatPro Revolution, was £13.10 million (2014: £9.83 million at constant currency) representing 52% (2014: 41%) of total software recurring revenue.
Following the decision in June 2014 to raise the minimum client fee, the average revenue per StatPro Revolution client has increased by 73% at constant currency to £21,400 (2014: £12,400). The total number
of clients for StatPro Revolution has also reduced following this decision to focus on profitable client relationships.
Revenues from StatPro Seven and non-cloud products reduced by 1% to £10.06 million (2014 at constant currency: £10.15 million).
Operating expenses Operating expenses (before amortisation of intangible assets) increased by 1% (4% at constant currency) to £12.74 million (2014: £12.57 million). The increase in expenditure related to the investment in cloud
technology, including additional employee costs, data costs, software and communications costs and cloud infrastructure. The average number of employees was 245 (2014: 253).
7
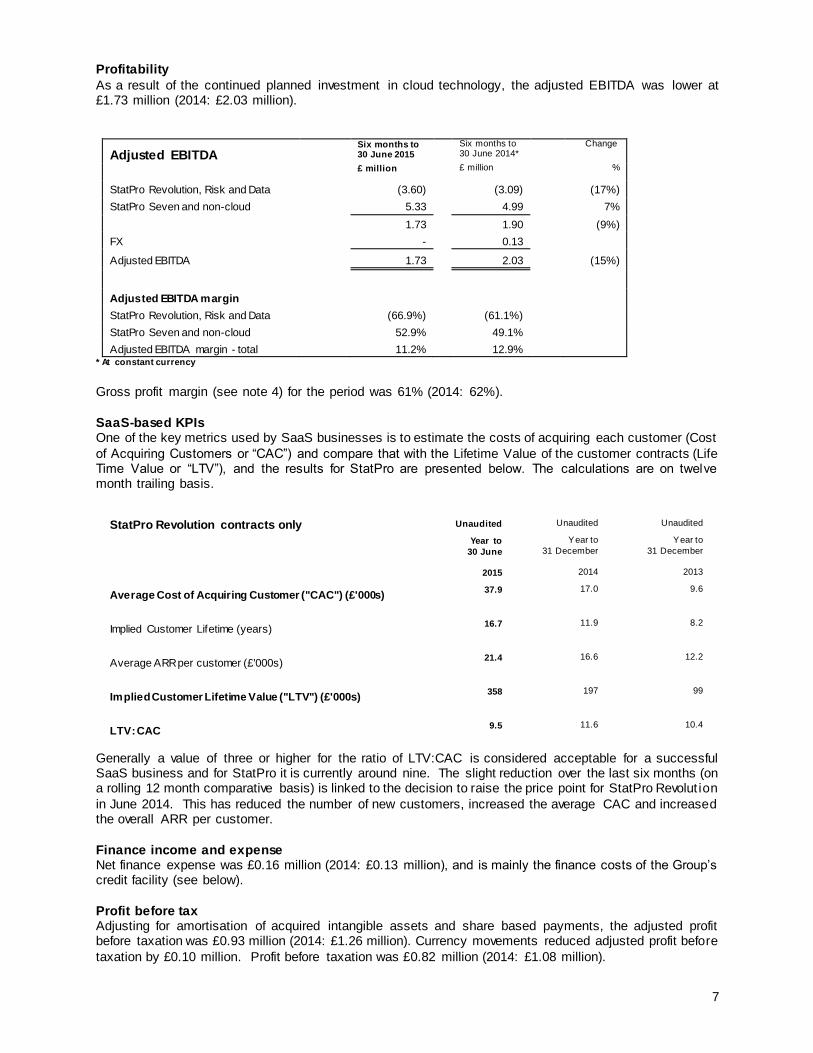
Profitability
As a result of the continued planned investment in cloud technology, the adjusted EBITDA was lower at £1.73 million (2014: £2.03 million).
Adjusted EBITDA Six months to 30 June 2015
Six months to 30 June 2014*
Change
£ million £ million %
StatPro Revolution, Risk and Data (3.60) (3.09) (17%)
StatPro Seven and non-cloud 5.33 4.99 7%
1.73 1.90 (9%)
FX - 0.13
Adjusted EBITDA 1.73 2.03 (15%)
Adjusted EBITDA margin
StatPro Revolution, Risk and Data (66.9%) (61.1%)
StatPro Seven and non-cloud 52.9% 49.1%
Adjusted EBITDA margin - total 11.2% 12.9% * At constant currency
Gross profit margin (see note 4) for the period was 61% (2014: 62%).
SaaS-based KPIs One of the key metrics used by SaaS businesses is to estimate the costs of acquiring each customer (Cost
of Acquiring Customers or “CAC”) and compare that with the Lifetime Value of the customer contracts (Life Time Value or “LTV”), and the results for StatPro are presented below. The calculations are on twelve month trailing basis.
StatPro Revolution contracts only Unaudited Unaudited Unaudited
Year to 30 June
Year to
31 December
Year to
31 December
2015 2014
2013
Average Cost of Acquiring Customer ("CAC") (£'000s) 37.9 17.0
9.6
Implied Customer Lifetime (years) 16.7 11.9
8.2
Average ARR per customer (£'000s) 21.4 16.6
12.2
Implied Customer Lifetime Value ("LTV") (£'000s) 358 197
99
LTV: CAC 9.5 11.6
10.4
Generally a value of three or higher for the ratio of LTV:CAC is considered acceptable for a successful SaaS business and for StatPro it is currently around nine. The slight reduction over the last six months (on a rolling 12 month comparative basis) is linked to the decision to raise the price point for StatPro Revolut ion
in June 2014. This has reduced the number of new customers, increased the average CAC and increased the overall ARR per customer.
Finance income and expense Net finance expense was £0.16 million (2014: £0.13 million), and is mainly the finance costs of the Group’s credit facility (see below).
Profit before tax Adjusting for amortisation of acquired intangible assets and share based payments, the adjusted profit before taxation was £0.93 million (2014: £1.26 million). Currency movements reduced adjusted profit before
taxation by £0.10 million. Profit before taxation was £0.82 million (2014: £1.08 million).
8
Taxation
The tax charge is £0.27 million (2014: £0.38 million). The overall effective tax rate is 32% (2014: 35%). This is higher than the prevailing UK rate mainly due to the impact of operations in countries with higher tax rates than the UK.
Earnings per share Adjusted earnings per share was 1.0p (2014: 1.3p). Actual and diluted earnings per share was 0.8p
(2014: 1.0p). Interim dividend
An interim dividend of 0.85 pence per ordinary share (2014: 0.85 pence) will be paid on 4 November 2015 to shareholders on the register at the close of business on 9 October 2015 (ex -div date will be 8 October 2015).
Balance sheet The Group’s net assets at the period end were £42.49 million (2014: £45.64 million). The reduction was
primarily due to the currency impact on revaluation of goodwill. Cash flow and financing
StatPro continues to be cash generative with cash generated from operations of £3.69 million (2014: £4.49 million), although lower than the prior year, mainly due to lower operating profits and lower working capital movements. The free cash flow increased to £0.78 million (2014: £0.54 million), and the Group ended the
period with net cash of £2.03 million (2014: £3.18 million). New financing facility - post balance sheet event
The Group has signed in July 2015 a new £20 million financing facility with Wells Fargo. The key features of the facility are:
Five year commitment period to July 2020
£10 million committed revolving credit facility
£10 million uncommitted additional facility available for acquisitions, share buy backs and general corporate purposes
The primary financial covenants are linked to recurring revenue and adjusted EBITDA while allowing the Group to invest for growth. The financing costs of approximately £0.4 million will be amortised over the five year term.
This new facility strengthens the Group’s long-term financial structure.
Research and development and capex The research and development team is now focused solely on the Group’s cloud-based solutions, the StatPro Revolution platform. R&D expenditure increased overall by 11% to £2.55 million as planned (2014:
£2.30 million), equating to 17% of Group revenue (2014: 15%). Included within investment in intangible assets are capitalised development costs of £1.67 million (2014:
£1.80 million) and amortisation on internal development was £1.57 million (2014: £1.67 million). Capital expenditure on property, plant and equipment was £0.51 million (2014: £1.19 million); this was lower
than the prior year, which included a number of office relocation projects. Principal risks and uncertainties
The directors continue to evaluate the principal business risks and uncertainties affecting the Group and further discussion of the principal risks and uncertainties can be found on pages 25 to 27 of the 2014 Annual Report.
9
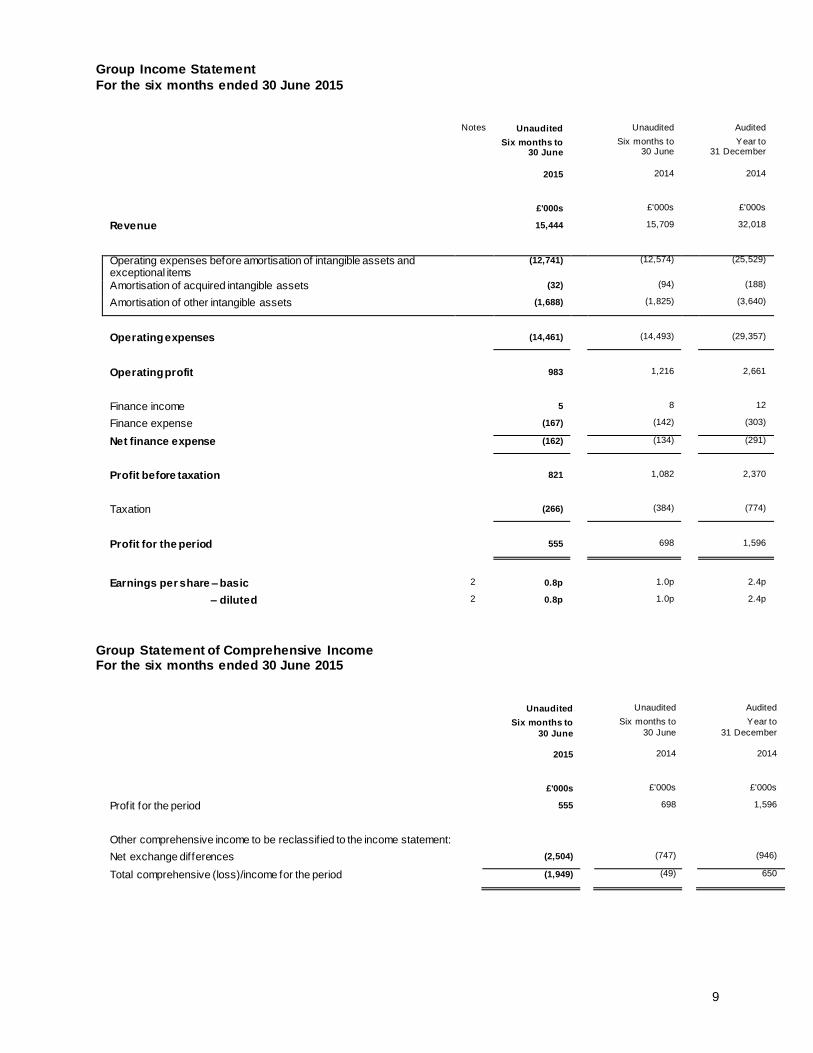
Group Income Statement
For the six months ended 30 June 2015
Notes Unaudited Unaudited Audited
Six months to 30 June
Six months to 30 June
Year to 31 December
2015 2014 2014
£'000s £'000s £'000s
Revenue 15,444 15,709 32,018
Operating expenses before amortisation of intangible assets and exceptional items
(12,741) (12,574) (25,529)
Amortisation of acquired intangible assets (32) (94) (188)
Amortisation of other intangible assets (1,688) (1,825) (3,640)
Operating expenses (14,461) (14,493) (29,357)
Operating profit 983 1,216 2,661
Finance income 5 8 12
Finance expense (167) (142) (303)
Net finance expense (162) (134) (291)
Profit before taxation 821 1,082 2,370
Taxation (266) (384) (774)
Profit for the period 555 698 1,596
Earnings per share – basic 2 0.8p 1.0p 2.4p
– diluted 2 0.8p 1.0p 2.4p
Group Statement of Comprehensive Income For the six months ended 30 June 2015
Unaudited Unaudited Audited
Six months to 30 June
Six months to 30 June
Year to
31 December
2015 2014 2014
£'000s £'000s £'000s
Profit for the period 555 698 1,596
Other comprehensive income to be reclassif ied to the income statement:
Net exchange differences (2,504) (747) (946)
Total comprehensive (loss)/income for the period (1,949) (49) 650

10
Group Balance Sheet
At 30 June 2015
Notes Unaudited Unaudited Audited
At 30 June At 30 June At 31 December
2015 2014 2014
£'000s £'000s £'000s
Non-current assets
Goodw ill 9 43,644 46,737 46,724
Other intangible assets 9 5,788 5,885 5,822
Property, plant and equipment 2,375 2,498 2,470
Other receivables 101 145 109
Deferred tax assets 1,138 535 988
53,046 55,800 56,113
Current assets
Trade and other receivables 6,607 6,468 7,722
Financial instruments - other 58 26 27
Current tax assets - 11 -
Cash and cash equivalents 2,192 3,193 2,692
8,857 9,698 10,441
Liabilities
Current liabilities
Financial liabilities - borrow ings (63) (12) (12)
Financial instruments - other (8) - (15)
Trade and other payables (4,942) (4,510) (6,088)
Current tax liabilities (608) (398) (828)
Deferred income (12,323) (13,179) (12,603)
Provisions 10 (705) (769) (725)
(18,649) (18,868) (20,271)
Net current liabilities (9,792) (9,170) (9,830)
Non-current liabilities
Financial liabilities - borrow ings (102) - -
Other creditors (60) (129) (76)
Deferred tax liabilities (503) (644) (449)
Deferred income (101) (94) (60)
Provisions - (120) (13)
(766) (987) (598)
Net assets 42,488 45,643 45,685
Shareholders’ equity
Share capital 11 678 677 677
Share premium 23,537 23,472 23,474
Shares to be issued 63 63 63
Treasury shares 11 (249) (249) (249)
Other reserves 4,200 6,903 6,704
Retained earnings 14,259 14,777 15,016
Total shareholders’ equity 42,488 45,643 45,685

11
Group Statement of Cash Flows For the six months ended 30 June 2015
Unaudited Unaudited Audited
Notes Six months to
30 June
Six months to
30 June
Year to
31 December
2015 2014 2014
£'000s £'000s £'000s
Operating activities
Cash generated from operations 6 3,690 4,492 7,705
Finance income 5 8 12
Finance costs (25) (8) (22)
Tax received - 79 -
Tax paid (669) (626) (1,173)
Net cash flow from operating activities 3,001 3,945 6,522
Investing activities
Investment in intangible assets (1,708) (2,209) (4,053)
Purchase of property, plant and equipment (513) (1,192) (1,863)
Proceeds from the disposal of property, plant and equipment - 5 12
Net cash flow used in investing activities (2,221) (3,396) (5,904)
Financing activities
Proceeds from issue of ordinary shares 64 - 2
Net proceeds from finance leases 153 - -
Dividends paid to shareholders (1,386) (1,316) (1,889)
Net cash flow used in financing activities (1,169) (1,316) (1,887)
Net decrease in cash and cash equivalents (389) (767) (1,269)
Cash and cash equivalents at start of period 2,692 4,014 4,014
Effect of exchange rate movements (111) (54) (53)
Cash and cash equivalents at end of period 2,192 3,193 2,692

12
Group Statement of Changes in Shareholders’ Equity For the six months ended 30 June 2015
Unaudited
Share
capital
Share
premium
Shares to
be issued
Treasury
shares
Other
reserves *
Retained
earnings
Total
equity
£’000s £’000s £’000s £’000s £’000s £’000s £’000s
At 1 January 2014 677 23,472 63 (249) 7,650 15,295 46,908
Prof it f or the period - - - - - 698 698
Other comprehensiv e income - - - - (747) - (747)
Total comprehensive income - - - - (747) 698 (49)
Transactions with owners:
Share based pay ment transactions - - - - - 88 88
Tax relating to share option scheme - - - - - 12 12
Div idends - - - - - (1,316) (1,316)
At 30 June 2014 677 23,472 63 (249) 6,903 14,777 45,643
Unaudited
Share
capital
Share
premium
Shares to
be issued
Treasury
shares
Other
reserves *
Retained
earnings
Total
equity
£’000s £’000s £’000s £’000s £’000s £’000s £’000s
At 1 January 2015 677 23,474 63 (249) 6,704 15,016 45,685
Prof it f or the period - - - - - 555 555
Other comprehensiv e income - - - - (2,504) - (2,504)
Total comprehensive income - - - - (2,504) 555 (1,949)
Transactions with owners:
Share based pay ment transactions - - - - - 77 77
Tax relating to share option scheme - - - - - (3) (3)
Shares issued 1 63 - - - - 64
Div idends - - - - - (1,386) (1,386)
At 30 June 2015 678 23,537 63 (249) 4,200 14,259 42,488
* Other reserves includes a merger reserve of £2,369,000 (2014: £2,369,000) and a translation reserve surplus of £1,831,000 (2014: £4,534,000). The merger reserve arose on acquisitions and represents the difference between the fair value and the nominal value of the shares issued. The translation reserve incorporates the gains and losses on revaluation of the net assets and liabilities of subsidiary undertakings and other currency gains and losses that are presented in equity.

13
Notes to the interim financial information For the six months ended 30 June 2015 1. This interim report w as approved by the Board of directors on 4 August 2015. The f inancial information set out in this interim
report has been prepared under IFRS as adopted by the European Union and on the basis of the accounting policies set out in
the statutory accounts of StatPro Group plc for the year ended 31 December 2014, amended as explained below . The following new IFRIC interpretation is mandatory for the f irst time in the current period and has no signif icant impact on the Group consolidated results or f inancial position.
International Accounting Standards (“IAS/IFRS”)
IFRIC 21 Levies
This report is not prepared in accordance with IAS 34, w hich is not mandatory. This interim report has not been audited but has been review ed in accordance w ith ISRE 2410 by the Company’s auditors, Ernst & Young LLP. The f inancial information does
not constitute statutory accounts within the meaning of section 435 of the Companies Act 2006. Statutory accounts for StatPro Group plc for the year ended 31 December 2014 reported under IFRS have been delivered to the Registrar of Companies. The auditors' report on those accounts was unqualif ied, did not draw attention to any matters by way of emphasis and did not contain a statement under Section 498 (2) or (3) of the Companies Act 2006. Copies of this report w ill be posted or provided
electronically to shareholders. Further copies are available free of charge on request from the Company Secretary at the Company’s registered off ice, Mansel Court, Mansel Road, London SW19 4AA.
Basis of preparation – going concern After making appropriate enquiries, the directors have a reasonable expectation that the Group has adequate resources to continue in operational existence for the foreseeable future. For these reasons, the Board continues to adopt the going conc ern basis in preparing the interim report.

14
2. Earnings per share
Basic earnings per share has been calculated based on the profit after taxation of £0.56 million (2014: £0.70 million) and the w eighted average number of shares of 67.55 million (2014: 67.48 million). The diluted earnings per share w ere 0.8p (2014: 1.0p) based on potentially dilutive shares outstanding of 0.39 million (2014: 0.07 million).
Earnings
W eighted average
number of
shares
Earnings
per share Earnings
Weighted average
number of
shares
Earnings per
share
Six months to 30 June
Six months to 30 June
Six months to 30 June
Six months to 30 June
Six months to 30 June
Six months to 30 June
2015 2015 2015 2014 2014 2014
Unaudited Unaudited Unaudited Unaudited Unaudited Unaudited
£’000s ’000s pence £’000s ’000s pence
Earnings per share - basic 555 67,548 0.8 698 67,479 1.0
Potentially dilutiv e shares - 389 (0.0) - 67 (0.0)
Earnings per share - diluted 555 67,937 0.8 698 67,546 1.0
Adjusted earnings per share are show n in the table below .
Earnings
W eighted average
number of shares
Earnings per share Earnings
Weighted average
number of shares
Earnings per share
Six months to
30 June
Six months to
30 June
Six months
to 30 June
Six months
to 30 June
Six months
to 30 June
Six months
to 30 June
2015 2015 2015 2014 2014 2014
Unaudited Unaudited Unaudited Unaudited Unaudited Unaudited
£’000s ’000s pence £’000s ’000s pence
Earnings per share – basic 555 67,548 0.8 698 67,479 1.0
Add back: amortisation of acquired intangibles 32 - 0.1 94 - 0.2
Add back: share based pay ments 77 - 0.1 88 - 0.1
Adjusted earnings per share 664 67,548 1.0 880 67,479 1.3
Potentially dilutiv e shares - 389 (0.0) - 67 (0.0)
Adjusted earnings per share - diluted 664 67,937 1.0 880 67,546 1.3
3. Revenue analysis
Revenue for the period is analysed as follow s:
Unaudited Unaudited Audited
Six months
to 30 June
Six months
to 30 June
Year to
31 December
2015 2014 2014
£'000s £'000s £'000s
EMEAA 9,983 10,157 20,820
North America 5,461 5,552 11,198
Total 15,444 15,709 32,018
Revenue increased in the EMEAA region by 4% at constant currency to £9.98 million (2014 at constant currency: £9.60 million). In
the North American region, revenue reduced by 2% at constant currency to £5.46 million (2014 at constant currency: £5.60 million).
15
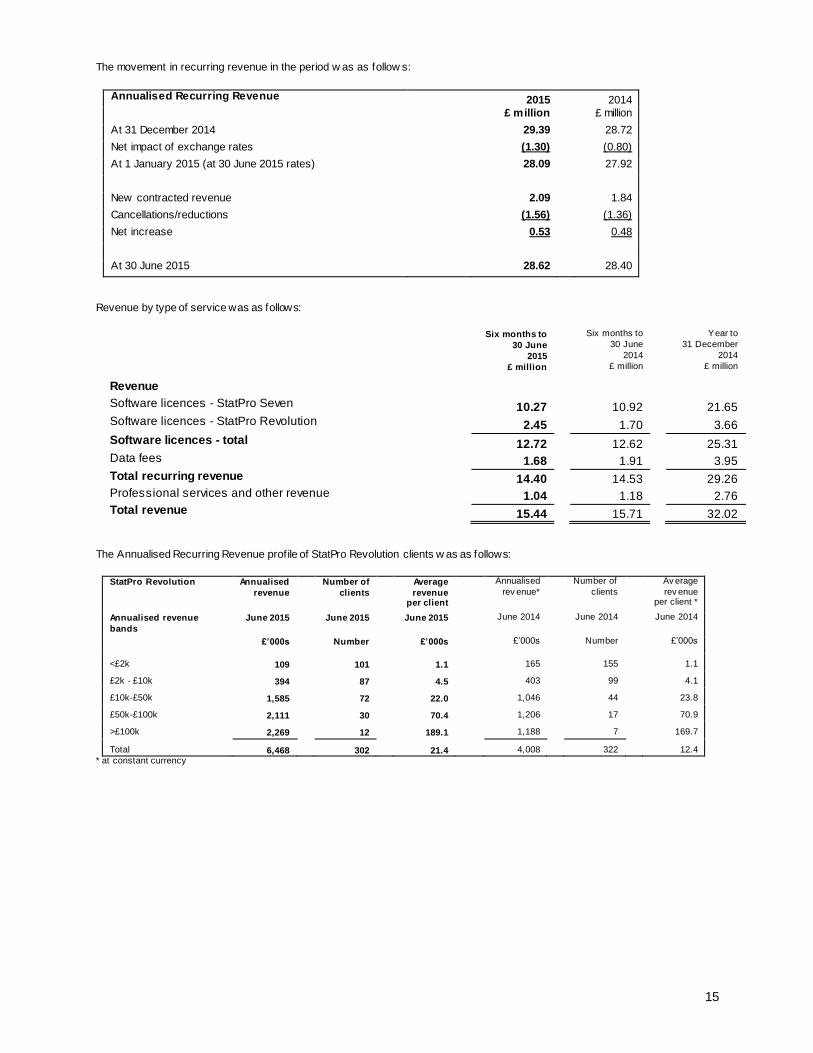
The movement in recurring revenue in the period w as as follow s:
Annualised Recurring Revenue 2015 2014
£ million £ million
At 31 December 2014 29.39 28.72
Net impact of exchange rates (1.30) (0.80)
At 1 January 2015 (at 30 June 2015 rates) 28.09 27.92
New contracted revenue 2.09 1.84
Cancellations/reductions (1.56) (1.36)
Net increase 0.53 0.48
At 30 June 2015 28.62 28.40
Revenue by type of service was as follows:
Six months to Six months to Year to
30 June 30 June 31 December
2015 2014 2014
£ million £ million £ million
Revenue
Software licences - StatPro Seven 10.27 10.92 21.65 Software licences - StatPro Revolution 2.45 1.70 3.66
Software licences - total 12.72 12.62 25.31 Data fees 1.68 1.91 3.95
Total recurring revenue 14.40 14.53 29.26 Professional services and other revenue 1.04 1.18 2.76 Total revenue 15.44 15.71 32.02
The Annualised Recurring Revenue profile of StatPro Revolution clients w as as follows:
StatPro Revolution Annualised
revenue
Number of
clients
Average
revenue per client
Annualised
rev enue* Number of
clients Av erage
rev enue per client *
Annualised revenue
bands
June 2015 June 2015 June 2015 June 2014 June 2014 June 2014
£’000s Number £’000s £’000s Number £’000s
<£2k 109 101 1.1 165 155 1.1
£2k - £10k 394 87 4.5 403 99 4.1
£10k-£50k 1,585 72 22.0 1,046 44 23.8
£50k-£100k 2,111 30 70.4 1,206 17 70.9
>£100k 2,269 12 189.1 1,188 7 169.7
Total 6,468 302 21.4 4,008 322 12.4
* at constant currency

16
4. Adjusted profit before taxation, adjusted operating profit, adjusted EBITDA and gross margin analysis
a) Adjusted profit before taxation
Unaudited Unaudited Audited Six months to
30 June Six months to
30 June Year to
31 December
2015 2014 2014
£’000s £’000s £’000s
Profit before tax ation 821 1,082 2,370
Add back: Amortisation on acquired intangible assets 32 94 188
Add back: Share based payments 77 88 26
Adjusted profit before tax 930
1,264
2,584
b) Adjusted operating profit
` Unaudited Unaudited Audited
Six months to 30 June
Six months to 30 June
Year to 31 December
2015 2014 2014
£’000s £’000s £’000s
Operating profit 983 1,216 2,661
Add back: Amortisation on acquired intangible assets 32 94 188
Add back: Share based payments 77 88 26
Adjusted operating profit 1,092
1,398
2,875
c) Adjusted EBITDA
Unaudited Unaudited Audited
Six months to
30 June
Six months to
30 June
Year to
31 December
2015 2014 2014
£’000s £’000s £’000s
Operating profit 983 1,216 2,661
Add back: Depreciation of property , plant and equipment 517 479 1,192
Add back: Amortisation on purchased intangible assets 117 152 292
Add back: Amortisation on acquired intangible assets 32 94 188
Add back: Share based payments 77 88 26
Adjusted EBITDA 1,726 2,029 4,359
Adjusted EBITDA margin 11.2% 12.9% 13.6%

17
d) Gross profit margin analysis
Gross profit margin analysis helps us assess the profitably of incremental revenue as the business evolves into a pure cloud business and the costs drivers begin to change. As there are a number of methodologies for allocating costs, w e have described how we have allocated the cost elements. The cloud segment currently has a low er margin than the non-cloud part given the investment that is
being undertaken, how ever, the Board’s view is that, as the business grow s, the inherent scalability of cloud technology w ill lead to greater profitability in the future.
Unaudited Unaudited Unaudited
Six months to 30 June
Six months to 30 June
Year to 31 December
2015 2014 2014
% % %
Revenue 100.0% 100.0% 100.0%
Cost of services (38.9%) (38.0%) (38.1%)
Gross profit margin 61.1% 62.0% 61.9%
R&D costs (5.1%) (4.7%) (4.6%)
Sales & Marketing costs (11.9%) (12.2%) (11.0%)
General & Administration
costs (33.4%) (32.8%) (32.8%)
(50.4%) (49.7%) (48.4%)
Share based payments 0.5% 0.6% 0.1%
Adjusted EBITDA 11.2% 12.9% 13.6%
Definition of cost category for gross margin analysis: Cost of services includes Clients Services employee salaries, Data employee salaries, Development employee salaries related to support, contractors costs, data costs, costs of softw are and hardw are maintenance.
R&D includes the element of Development employee salaries that relates to new research and development. Sales & marketing includes Sales and Marketing employee salaries, external marketing costs and sales commissions. General & administration includes the Finance, HR and IT employee salaries, communications costs, occupancy costs, professional fees, travel and expenses, and other costs.
5. Free cash flow
Unaudited Unaudited Audited
Six months to 30 June
Six months to 30 June
Year to 31 December
2015 2014 2014
£’000s £’000s £’000s
Cash generated f rom operations 3,690 4,492 7,705
Net interest paid (20) - (10)
Net tax paid (669) (547) (1,173)
Purchase of property , plant and equipment (513) (1,192) (1,863)
Inv estment in intangible assets (1,708) (2,209) (4,053)
Free cash flow 780 544 606

18
6. Reconciliation of profit before tax to net cash inflow from operating activities
Unaudited Unaudited Audited
Six months to
30 June
Six months to 30
June
Year to 31
December
2015 2014 2014
£'000s £'000s £'000s
Prof it bef ore taxation 821 1,082 2,370
Net f inance expense 162 134 291
Operating prof it 983 1,216 2,661
Depreciation of property , plant and equipment 517 479 1,192
Loss on disposal of property , plant and equipment - 53 42
Amortisation of intangible assets 1,720 1,919 3,828
Decrease/(increase) in receiv ables 1,058 (305) (1,597)
(Decrease)/increase in pay ables and prov isions (961) 174 1,364
Increase in def erred income 296 868 189
Share based pay ments 77 88 26
Net cash inflow from operating activities 3,690 4,492 7,705
7. Reconciliation of net cash flow to movement in net cash
Unaudited Unaudited Audited
Six months to
30 June
Six months to 30
June
Year to
31 December
2015 2014 2014
£'000s £'000s £'000s
Decrease in cash and cash equiv alents in the period (389) (767) (1,269)
Mov ement on f inance leases (153) - -
Exchange mov ements (111) (54) (53)
Movement in net cash (653) (821) (1,322)
Net cash at beginning of period 2,680 4,002 4,002
Net cash at end of period 2,027 3,181 2,680
8. Dividend
An interim dividend for 2015 of 0.85 pence per Ordinary Share (2014: 0.85 pence) w ill be paid on 4 November 2015 to shareholders on the register on 9 October 2015. A f inal dividend for 2014 of 2.05 pence per ordinary share was paid on 27 May 2015.
9. Goodwill and other intangible assets The decrease in goodw ill since 31 December 2014 of £3.08 million relates to exchange losses on revaluation of goodwill denominated in foreign currencies. Other intangible assets comprise internally generated development costs capitalised,
acquired intangible assets (client contracts) and purchased intangible assets. 10. Provisions
Provisions of £0.71 million at 30 June 2015 (2014: £0.89 million) relates to deferred contingent consideration for the
acquisition of the non-controlling interest in SiSoft Sarl and onerous contracts.
11. Share capital and treasury shares 106,000 shares w ere issued during the period (2014: nil). At 30 June 2015, there w ere 67,813,650 shares (Dec 2014:
67,707,650 shares) in issue including 225,000 (2014: 225,000) held in treasury (67,588,650 excluding treasury shares). The treasury shares do not accrue dividends and are excluded from the earnings per share calculation.
12. Post balance sheet event - New financing facility
The Group has signed in July 2015 a new £20 million f inancing facility w ith Wells Fargo. The key features of the facility are: Five year commitment period to July 2020
£10 million committed revolving credit facility

19
£10 million uncommitted additional facility available for acquisitions, share buy backs and general corporate
purposes
The primary f inancial covenants are linked to recurring revenue level and EBITDA w hile allow ing the Group to invest for grow th. The f inancing costs of approximately £0.4 million w ill be amortised over the f ive-year term.
This new facility strengthens the Group’s long-term financial structure.

20
Independent review report to StatPro Group plc Introduction We have been engaged by the Company to review the condensed set of financial statements in the half-yearly financial report for the six months ended 30 June 2015, which comprises the Group Income Statement, Group Statement of Comprehensive Income, Group Balance Sheet, Group Statement of Cash Flows, Group Statement of Changes in Shareholders’ Equity and the related notes 1 to 12. We have read the other information contained in the half yearly financial report and considered whether it contains any apparent misstatements or material inconsistencies with the information in the condensed set of financial statements. This report is made solely to the Company in accordance with guidance contained in International Standard on Review Engagements 2410 (UK and Ireland) "Review of Interim Financial Information Performed by the Independent Auditor of the Entity" issued by the Auditing Practices Board. To the fullest extent permitted by law, we do not accept or assume responsibility to anyone other than the company, for our work, for this report, or for the conclusions we have formed. Directors' Responsibilities The half-yearly financial report is the responsibility of, and has been approved by, the directors. The directors are responsible for preparing the Interim Report in accordance with the AIM Rules issued by the London Stock Exchange which require that it is presented and prepared in a form consistent with that which will be adopted in the Company’s annual accounts having regard to the accounting standards applicable to such annual accounts. As disclosed in note 1, the annual financial statements of the Group are prepared in accordance with IFRS’s as adopted by the European Union. The condensed set of financial statements included in this half-yearly financial report has been prepared in accordance with the AIM Rules issued by the London Stock Exchange. Our Responsibility Our responsibility is to express to the Company a conclusion on the condensed set of financial statements in the half -yearly financial report based on our review. Scope of Review We conducted our review in accordance with International Standard on Review Engagements (UK and Ireland) 2410, "Review of Interim Financial Information Performed by the Independent Auditor of the Entity" issued by the Auditing Practices Board for use in the United Kingdom. A review of interim financial information consists of making enquiries, primarily of persons responsible for financial and accounting matters, and applying analytical and other review procedures. A review is substantially less in scope than an audit conducted in accordance with International Standards on Auditing (UK and Ireland) and consequently does not enable us to obtain assurance that we would become aware of all significant matters that might be identified in an audit. Accordingly, we do not express an audit opinion. Conclusion Based on our review, nothing has come to our attention that causes us to believe that the condensed set of financial statements in the half-yearly financial report for the six months ended 30 June 2015 is not prepared, in all material respects, in accordance with the accounting policies outlined in Note 1, which comply with IFRS’s as adopted by the European Union and in accordance with the AIM Rules issued by the London Stock Exchange. Ernst & Young LLP London 4 August 2015