Embed Size (px)
Citation preview

ATLANTIC SALMON IN NORWEGIAN RIVERS-CHALLENGES AND OPPORTUNITIES Morten Stickler, PhD
Environmental Advisor- Corporate CR&HSE staff
Environmental coordinator- Innovation Department

Statkraft at glance
Peru
271 MW
Chile
157 MW
Turkey
20 MW
Nepal 34 MW
Philippines
293 MW
Brazil
137 MW
Panama
(project)
Zambia
11 MW
Norway
11 442 MW Sweden
1 516 MW Finland
66 MW
UK
272 MW
Sri Lanka
2 MW
Laos 100 MW
Germany
2 670 MW
India
136 MW
Installed capacity*
17 000 MW Power production (2012)*
60 TWh
90% renewable energy
3 600 employees
AGUA IMARA
SN POWER
STATKRAFT
* Includes: Share in subsidiaries where Statkraft is majority owner 100 % of SN Power and Agua Imara’s installed capacity

3
Illustration: M. Stickler
“You cannot step twice into the same stream…” (Heraclitus, quoted by Platon in Cratylus)
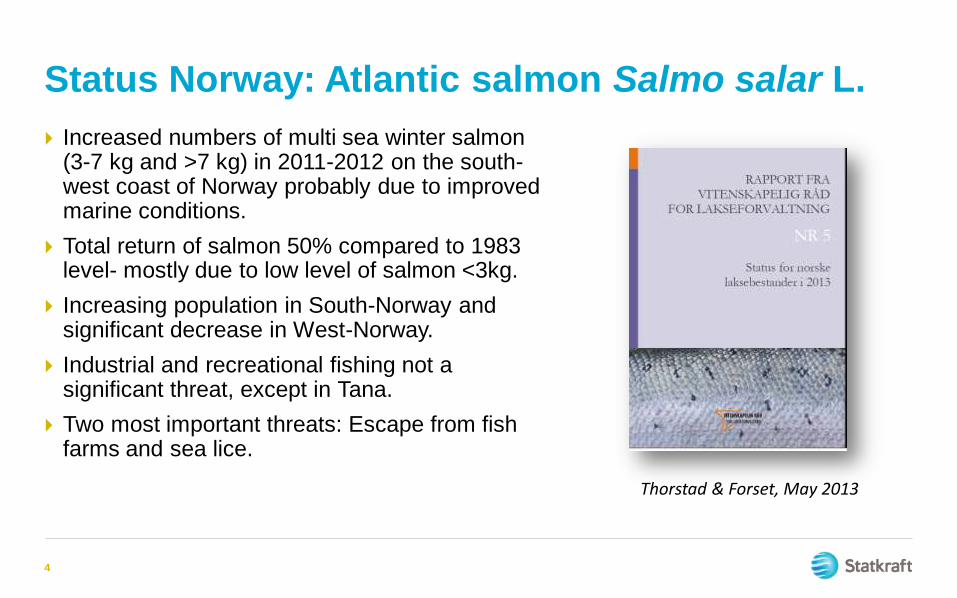
Status Norway: Atlantic salmon Salmo salar L.
Increased numbers of multi sea winter salmon (3-7 kg and >7 kg) in 2011-2012 on the south-west coast of Norway probably due to improved marine conditions.
Total return of salmon 50% compared to 1983 level- mostly due to low level of salmon <3kg.
Increasing population in South-Norway and significant decrease in West-Norway.
Industrial and recreational fishing not a significant threat, except in Tana.
Two most important threats: Escape from fish farms and sea lice.
4
Thorstad & Forset, May 2013

Holistic and adaptive management

The national gene bank for salmon
established by the Directorate for Nature
Management in 1986 due to the difficult
situation for Norwegian wild salmon in many
rivers.
Statkraft has 2 gene bank and 8 hatcheries
(2 presmolt, 5 smolt, 1 for eggstocking).
Genebanks: Preserve genes, e.g. after
rotenon treatment of gyro infected rivers.
Restocking of wild fish less successful due to
low survival and low rate of returns (0.5-1%).
Internal new (2014) R&D program to evaluate
effect of restocking in rivers and reservoirs.
Targeting no restocking and focusing on sustainable populations of Atlantic salmon
6

How much water is needed….?
7
Flow
Environment
Is more better….?

How much water is needed….?
8
Flow
Environment
A carrying capacity vs flow level….?

How much water is needed….?
9
Flow
Environment
Seasonal requirements….? Holistic view…?
egg survival,
winter habitat
Sm
olt m
igra
tion
fry dis-
place-
ment? Spawning
Main
tain
geom
orp
holo
gy
Attra
ct
spaw
ners
Habitat
July

Our key challenges hydropower and salmon in Norway
10
1. Migration barrier and loss of connectivity
2. Spawning success and growth of juveniles

1. Migration barrier and loss of connectivity: Case Nidelva, South-East Norway
Challenges:
Weirs from 70’s build for estethic and
recreational reasons
Still water/low flow velocity, pike
Sedimented and silted areas
Limited population of salmon
Qmin: 3 and 15 cms
11
Weirs

Migration barrier and loss of connectivity:
Case Nidelva, south-East Norway
Solutions:
Hydraulic modeling to analyze removal
of weirs testing different scenarios and
outcomes
Removal of weirs
Biological monitoring of spawning and
juvenile densities of Atlantic salmon
before (since 2002) and after (2007) to
evaluate results
12

Removal of weirs, before - after

Spawning areas before-after removal of weirs
Fjeldstad et al., 2012
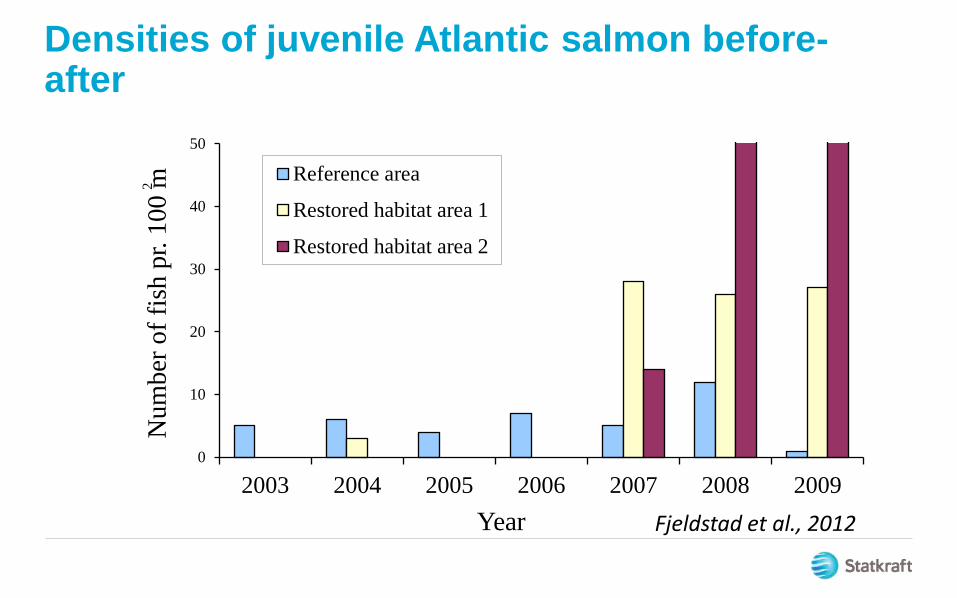
Densities of juvenile Atlantic salmon before-after
2
0
10
20
30
40
50
2003 2004 2005 2006 2007 2008 2009
Num
ber
of
fish
pr.
100 m
.
Year
Reference area
Restored habitat area 1
Restored habitat area 2
Fjeldstad et al., 2012

Our key challenges hydropower and salmon in Norway
16
1. Migration barrier and loss of connectivity
2. Spawning success and growth of juveniles

2. Successful spawning and survival of eggs and juveniles
Case Bjoreio and spawning- North-West Norway
Challenges:
Critical low level of Atlantic salmon population.
High level (>20%) of escaped farmed salmon
New action plan and investigations replaced
mandatory restocking in the river.
Hydro-regulation and low winter flow causing
drying and freezing of spawning areas and
eggs of Atlantic salmon
Lower water temperature during the first
feeding period (June/July) reduce fish growth
and increase mortality the following winter
17

Spawning in Atumn Winter time conditions
Winter flow and stranding of spawning areas

How much water to have 100% egg survival?
0
10
20
30
40
50
60
70
80
90
100
-50 0 50 100 150 200
Surv
ival (%
)
Water depth (cm)
Aure
Laks
Ukjent
Trout
Salmon

20
Correlation between water level during spawning period and proportion stranded redds
Water Depth last week October (m) # Sp
awn
ing
nes
ts in
str
and
ing
risk
are
as (
%)

21
Mapped needed discharge to obtain zero stranding of spawning redds.
0.0
5.0
10.0
15.0
20.0
25.0
30.0
35.0
40.0
45.0
0 0.5 1 1.5 2
Vannføring (m3/s)
Ande
l str
ande
te g
yteg
rope
r (%
)2004
2005
2006
2007
2008
2009
2010
2011
Gj.sn.
Discharge (cms)
# st
ran
ded
sp
awn
ing
red
ds
(%)

Spatial distribution of spawning areas is vital to increase total production of salmon.
1069 spawning areas registered
and analyzed 2004-2012.
Strong correlations between
river scale juvenile density
and the percentage river area
suitable for spawning
and the spatial distribution of
spawning areas.

Salmon
2
0
5
10
15
20
25
30
1999 00 01 02 03 04 05 06 07 2008
Nu
mb
ero
ffi
shp
r. 1
00
m .
0+
> 0+
Increased juvenile growth and density by altered water temperature
Modelled growth of juvenile salmon vs
water temperature
Replaced 40% of the cold water with
2-4 degrees warmer water by
releasing water from two other intakes
during summer.
Measured growth and densities of 0+,
1+ and 2+
Increased growth and densities as a
direct result of altered temperature in
the minimum release
23
Temperature on anadromous part of Bjoreio
0.0
2.0
4.0
6.0
8.0
10.0
12.0
14.0
1. jan. 1. mar. 1. mai. 1. jul. 1. sep. 1. nov.
Tem
pera
ture
(˚C
)
Before water manipulation (1988-91)
After water manipulation (2003-06)

By small modifications of the flow
regime a win-win situation is created by
improved environmental conditions for
salmon with limited level of production
loss
But it takes time, and data before-after
is critical, i.e. holistic and adaptive
management and crossdisciplinary
planning is crucial
Foto: LFI-Unifob v/B. Barlaup
Overall positive outcomes

Future..?
25

Handbook on hydropower and environmental design finalized Sept-2013
Focus species: Atlantic salmon (S.salar L.)
Up to date knowledge on hydropower and
Atlantic salmon- Environmental Design
Two main parts
1. Diagnosis
2. Solutions
Multidisciplinary linking biology and
hydrology
26

27
19 countries
35 key note speakers
230 young professionals
Total investment appr. : 210 000 Euro’s
Appr 1000 per reviewed papers
9 Global meetings
www.nowpas.eu

www.statkraft.com
THANK YOU