Embed Size (px)
Citation preview

December 7, 2017
Technolo
gy
India
THIS REPORT HAS BEEN PREPARED BY KIM ENG SECURITIES INDIA PVT LTD
SEE PAGE 40 FOR IMPORTANT DISCLOSURES AND ANALYST CERTIFICATIONS
Neerav Dalal [email protected] (91) 22 6623 2606
Vakrangee (VKI IN)
King of Convenience Services
Highly scalable network & services We initiate coverage of VKI with a BUY and INR830 TP, at 36x FY19E EPS.
This implies a 0.83 PEG vs Indian consumer stocks’ 2.1. VKI has evolved
into an asset-light convenience-service chain. It provides government-to-
citizen services, real-time banking services and assisted e-commerce,
using franchisees. We forecast that its store or “kendra” revenue and
EBITDA will triple over FY17-20E, from: a) a doubling of kendras to
75,461; b) Amazon’s activation of services in 58% of its kendras; and c)
an increase in mature stores to 75% from 45%. Catalysts are expected
from the launch of new services such as lead generation for loans, visa
services and reverse logistics.
More mileage from Amazon & other partners From working on Government of India projects such as passports and
elections, VKI has opportunistically transformed itself into a multiple-
service kendra operator. It helps its bank partners save costs by
eliminating the need to run rural branches. It also helps partners such as
Amazon, insurers and logistics companies reach India’s deep hinterlands.
Of Amazon’s 12k+ assisted e-commerce stores in India, 10k+ belong to
VKI. We forecast that by FY20E, assisted e-commerce, insurance and
logistics will form 49% of its kendra revenue, up from 14% in FY17.
No major challenger yet… While providing one service is not profitable, VKI’s gamut of offerings
offers it an EBITDA margin of 18%. VKI can be likened to the ubiquitous
convenience-store 7-Eleven in Asian markets. Most of its Indian peers are
small and unlisted. We see barriers to entry from its: a) extensive brick-
&-mortar franchisee network, which dwarfs competitors’ scale; b) depth
of reach, which makes it the preferred choice of its partners; and c)
strong customer footfalls from its Amazon partnership.
… which should protect its high growth & ROEs VKI’s stock has risen 166% YTD, on the back of its earnings growth. Still,
we believe there is steam left. While 7-Eleven’s ASEAN partners trade at
31.7x FY19E EPS, we value VKI at 36x FY19E, implying a 0.83 PEG. This
still represents a 62% discount to Indian consumer stocks’ 2.1 PEG.
Catalysts could include the launch of new services such as lead
generation for loans, visa services and reverse logistics, in our view.
Share Price INR 732
12m Price Target INR 830 (+13%)
BUY
Company Description
Statistics
52w high/low (INR)
3m avg turnover (USDm)
Free float (%)
Issued shares (m)
Market capitalisation
Major shareholders:
23.7%
12.3%
6.6%
529
25.9
Vakrangee delivers real-time banking, insurance, e-
Governance, e-Commerce and logistics services across
India
Vakrangee Holdings Pvt Ltd
Vakrangee Capital Pvt Ltd
Life Insurance Corp. of India
749/266
55.6
INR387.5B
USD6.0B
Price Performance
50
100
150
200
250
300
350
400
100
200
300
400
500
600
700
800
Dec-15 Mar-16 Jun-16 Sep-16 Dec-16 Mar-17 Jun-17 Sep-17
Vakrangee - (LHS, INR) Vakrangee / BSE SENSEX 30 Index - (RHS, %)
-1M -3M -12M
Absolute (%) 33 49 160
Relative to index (%) 37 44 109
Source: FactSet
FYE Mar (INR m) FY16A FY17A FY18E FY19E FY20E Revenue 31,907 40,005 59,772 90,812 121,583 EBITDA 8,208 9,460 12,364 17,852 23,005 Core net profit 3,949 5,308 8,144 12,207 15,588 Core EPS (INR) 7 10 15 23 29 Core EPS growth (%) 16.7 34.4 53.4 49.9 27.7 Net DPS (INR) 1 2 4 7 9 Core P/E (x) 98.1 73.0 47.6 31.7 24.9 P/BV (x) 24.5 18.9 14.8 11.4 8.8 Net dividend yield (%) 0.2 0.3 0.5 0.9 1.2 ROAE (%) 28.4 29.2 34.8 40.5 40.0 ROAA (%) 19.2 24.3 32.7 39.1 38.5 EV/EBITDA (x) 12.9 17.9 30.4 21.0 16.1 Net gearing (%) (incl perps) 9.6 net cash net cash net cash net cash Consensus net profit - - - - - MKE vs. Consensus (%) - - - - -

December 7, 2017 2
Vakrangee
Value Proposition
One-stop shop for government, banking, assisted e-
commerce, logistics & other business-to-consumer
services. dependence on capex-heavy e-governance as a
contractor for government projects.
Targets 2x increase in kendras to 75k by 2020, the bulk
franchised.
Leading distributor of Government of India’s financial
inclusion programme & major partner for Amazon’s
assisted e-commerce.
Continues to add services such as visa filing, lead
generation for finance companies and transport ticket
bookings.
By FY20, share of Amazon & assisted e-commerce,
insurance and logistics services to rise to 49% from 14% in
FY17.
No. of centres
Source: Company, Maybank Kim Eng
Price Drivers
Historical share price
Source: Company, Maybank Kim Eng, Factset
1. Selected as common banking correspondent for Rajasthan
and Delhi for financial inclusion project.
2. Announced Vision 2020 to open 75k kendras by Mar 2020
from 12,568 in Mar 2015.
3. Partners Amazon to offer assisted e-commerce at its
kendras.
4. Ties up with Indian Oil Corporation to set up kendras at
more than 20,000 IOC outlets.
5. Announcement that over 10k of its centres will offer
Amazon assisted e-commerce services, out of Amazon
India’s 12k centres offering this service.
Financial Metrics
We forecast a 45% revenue CAGR & 43.2% EPS CAGR for
FY18-20E, led by an increase in centres to 75,461 from
35,206 in FY17.
Kendra revenue to touch 94.4% of total from 64.5%.
EBITDA margins to decline to 18.9% from 23.6% in FY17 as
franchisees’ revenue share increases to 80% from 75%.
High FCF as capex for kendra business is minimal.
ROEs of 30%+. Cash could average 38% of net worth in
FY18-20E.
Revenue mix of kendra business
Source: Company, Maybank Kim Eng, FY17 indicative numbers given by co.
Swing Factors
Upside
75k centres before 2020.
Possible stake sale to a global e-commerce major.
Reverse logistics business takes off.
Downside
Delays in reaching its 75k-centre target.
Amazon reduces reliance on VKI or ceases partnership.
Delays in rollout of services.
12,568
20,677
35,206
50,461
65,461
75,461
0
20,000
40,000
60,000
80,000
100,000
FY15 FY16 FY17 FY18E FY19E FY20E
no of centres
0
200
400
600
800
1,000
1,200
0
100
200
300
400
500
600
Oct-12 Oct-13 Oct-14 Oct-15 Oct-16
Vakrangee - (LHS, INR) Vakrangee / MSCI AC Asia ex JP - (RHS, %)
20% 14% 11% 10%
40%
29% 29% 29%
40%56% 59% 60%
0%
20%
40%
60%
80%
100%
FY17 FY18E FY19E FY20E
Govt-to-citizen services Banking & insurance services
eCommerce services & others
1
1
2
3
5
4

December 7, 2017 3
Vakrangee
Table of Contents 1. Investment Summary ................................................................................................................ 4
2. Focus Charts .......................................................................................................................... 6
3. Corporate Information .............................................................................................................. 7
4. Scalability to 2x current kendras .................................................................................................. 16
5. Competition ........................................................................................................................... 26
6. Financial Analysis .................................................................................................................... 27
7. Valuation ............................................................................................................................... 32
8. Risks .................................................................................................................................... 34
9. Appendix ............................................................................................................................... 35

December 7, 2017 4
Vakrangee
1. Investment Summary
1.1 Scalability to 2x current kendras Working as a contractor of the government for government-to-citizen
(G2C) services and a business correspondent for banks, VKI has set up
kendras or stores across India. As of Sep 2017, it had 40,461 kendras in 18
Indian states. Of these, 71% was in rural India. The company has a target
to increase this to 75k by FY20. Two-thirds will be in rural areas and the
balance, in more than 650 urban centres, up from 365 in FY17. It aims to
cover more than 19,000 postal codes by then, from 5,000 in FY17. We
believe this is achievable, considering: a) its average quarterly rollout of
2,750 kendras in the last eight quarters; and b) its partnership with Indian
Oil Corporation (IOC), which allows it to set up kendras at IOC’s more than
20,000 fuelling stations. So far, only 200+ have been opened.
1.2 More mileage for services… To monetise its penetration of rural and semi-urban India, VKI has tied up
with businesses to deliver services to India’s hinterlands. Operating via
franchisees, it offers a gamut of services. These range from G2C services
such as Aadhar enrolment and government fee collection. Banking services
are also offered, such as the opening of bank accounts, deposits &
withdrawals. VKI also sells life and non-life insurance policies and is a lead
generator for non-banking financial companies. On top of Amazon-assisted
e-commerce, it offers courier-booking services; direct-to-home top-ups;
bus-booking services; railway-booking services; Reliance Jio top-ups and
mobile sales. Based on a planned 2x increase in stores to 75,461 by FY20E
and expectations of higher revenue per store after the activation of all
services, we forecast that its kendra revenue will increase to 94.4% of its
total by FY20E, from 64.5% in FY17. Non-kendra revenue primarily comes
from e-governance project work.
1.3 …& partnerships, particularly with Amazon In a 2016 study, the Reserve Bank of India estimates the cost of a bank-
branch transaction at INR59. This towers above VKI’s INR29. For most
services, VKI does not charge its customers directly; its partners pay VKI
fees and commissions. For Amazon, insurance and other businesses, it
provides reach and the opportunity to monetise the footfalls it gets for its
other services.
Amazon India has over 12,000 stores in India providing assisted e-
commerce services. Of these, more than 10,000 are VKI’s kendras.
Amazon has already reported strong traction in this segment which it dubs
‘Project Udaan’. In a recently-concluded festive-season sale, Amazon
reported a 29x YoY jump in its average daily number of customers and a
12x leap in its sales. We believe that by FY20E, Amazon services would be
activated in at least 58% of VKI’s kendras, or 44k.
VKI has opened 50-60m bank accounts for Indians, out of the 280m opened
under the government’s financial-inclusion scheme from 2013 to 2017. In
the first four months of FY18, the government has already transferred
INR337b to Indians through 314 schemes. One of the ways was direct cash
transfers to the bank accounts of beneficiaries.
VKI sells insurance policies for nine life and non-life companies. India’s
life and non-life penetration, as measured by premiums to GDP, was 3.4%
in FY16. At almost half the global average of 6.2%, this implies growth
opportunities. Overall, we forecast that the share of new services such as

December 7, 2017 5
Vakrangee
Amazon-assisted e-commerce, insurance and logistics will increase to 49%
of its kendra revenue by FY20E, from 14% in FY17.
1.4 Barriers to entry While providing one service is not profitable, VKI’s gamut of offerings
offers it an EBITDA margin of 18%. VKI can be likened to the ubiquitous
convenience-store 7-Eleven in Asian markets. Most of its Indian peers are
small and unlisted. We see barriers to entry from: a) its extensive brick-
&-mortar franchisee network, which dwarfs competitors’ scale; b) depth
of reach, which makes it the preferred choice of its partners;; and c)
strong customer footfalls from its Amazon partnership
1.5 Risks: changes in RBI rules, discontinued partnerships &
delays As a banking business correspondent, VKI is governed by RBI rules. Any
unfavourable changes in these rules may affect its business. However,
considering the RBI’s impetus on financial inclusion, we do not foresee any
immediate threat. Its Amazon partnership is also valid for five years.
While change or discontinuation remains a risk, either seems unlikely in
the foreseeable future, given their current service ramp-up. Delays in the
activation of services may slow down VKI’s revenue growth. To safeguard
against this, it has appointed block leaders to oversee clusters of
franchisees and train them to ensure timely and complete service rollout.
1.6 Premium valuations justified VKI trades at 31.7x FY19E EPS, up from 21x a year ago as investors’
confidence improves with a pick-up in its Amazon services and rollout of
new services. It can be likened to 7-Eleven, whose partners in ASEAN
trade at 30.7x FY19E EPS. Offline Indian retailers trade at 50x. We
forecast an EPS CAGR of 43.2% for FY18-20E. A prospective FY18E ROE of
34.8% and cash at 42% of net worth arguably justify a P/E target of 36x.
We initiate coverage with a BUY and INR830 TP, implying a 0.83 PEG. This
is at a discount to the 2.1 for Indian consumer stocks. Catalysts are
expected from a deepening of relations with Amazon, the launch of new
services and any stake acquisition by Amazon.

December 7, 2017 6
Vakrangee
2. Focus Charts
Fig 1: Kendra business to form 94.4% of revenue by FY20E
Source: Company, Maybank Kim Eng
Fig 2: No. of kendras to surpass 75,000 then
Source: Company, Maybank Kim Eng
Fig 3: Kendra revenue is increasingly coming from e-commerce
Source: Company, Maybank Kim Eng
Fig 4: EBITDA margins are declining as it has started awarding its franchisees 80% of revenue, up from 75%. The trade-off is a bigger scale, which could attract more partners and franchisees
Source: Company, Maybank Kim Eng
Fig 5: Improving FCF
Source: Company, Maybank Kim Eng
Fig 6: Strong ROEs & ROCE
Source: Company, Maybank Kim Eng
11,935 17,08925,783
49,106
82,279
114,756
15,87014,818
14,221
10,666
8,533
6,826
0
25,000
50,000
75,000
100,000
125,000
FY15 FY16 FY17 FY18E FY19E FY20E
Kendra revenue (INRm) e-Governance projects revenue (INRm)
12,568
20,677
35,206
50,461
65,461
75,461
0
20,000
40,000
60,000
80,000
100,000
FY15 FY16 FY17 FY18E FY19E FY20E
no of centres
20% 14% 11% 10%
40%
29% 29% 29%
40%56% 59% 60%
0%
20%
40%
60%
80%
100%
FY17 FY18E FY19E FY20E
Govt-to-citizen services Banking & insurance services
eCommerce services & others
23.8
%
21.4
%
19.5
%
19.0
%
18.5
%
28.0
%
27.7
%
26.0
%
26.0
%
26.0
%
25.7
%
23.6
%
20.7
%
19.7
%
18.9
%
0.0%
7.0%
14.0%
21.0%
28.0%
35.0%
FY16 FY17 FY18E FY19E FY20E
Vakrangee Kendra e-Governance projects Blended
-1,056 -1,581
-194 -9 -55
2,585
6,576
8,860
4,650
8,845
-4,000
-2,000
0
2,000
4,000
6,000
8,000
10,000
FY11 FY12 FY13 FY14 FY15 FY16 FY17 FY18E FY19E FY20E
FCF (INRm)
32.6
%
28.4
%
29.2
%
34.8
%
40.5
%
40.0
%50.4
%
45.4
%
47.6
%
52.4
%
58.6
%
58.4
%
0.0%
12.0%
24.0%
36.0%
48.0%
60.0%
FY15 FY16 FY17 FY18E FY19E FY20E
ROE ROCE

December 7, 2017 7
Vakrangee
3. Corporate Information
3.1 From government contractor to one-stop shop Back when it was founded in 1990, VKI was only a contractor and sub-
contractor of the government. It computerised and digitised records for
government departments, including the Election Commission of India,
initially in Maharashtra and then in other states. The company continued
to secure other government projects such as Sarva Shiksha Abhiyan, which
issues Aadhar cards to all Indians under the auspices of the Unique
Identification Development Authority of India (UIDAI).
Over time, VKI progressed from a sub-contractor to an independent
bidder. Gaining experience from setting up centres and kiosks to provide
government-to-citizen (G2C) services, it launched its Vakrangee kendra
business in FY2012. These stores offer real-time banking, e-governance,
insurance, e-commerce and logistics services to Indians who have no or
limited access to banking and the Internet. Correspondingly, e-governance
revenue decreased to 36% in FY17 from 100% in FY12. In the past few
years, VKI also decided to cut its exposure to e-governance projects and
not re-bid for them when they come up for renewal.
Fig 7: Revenue share from kendras is increasing
Source: Company
0%
34% 39% 43%54%
64%
100%
66% 61% 57%46%
36%
0%
20%
40%
60%
80%
100%
FY12 FY13 FY14 FY15 FY16 FY17
Vakrangee Kendra e-Governance projects

December 7, 2017 8
Vakrangee
Fig 8: Its e-governance business in the past
Source: Company
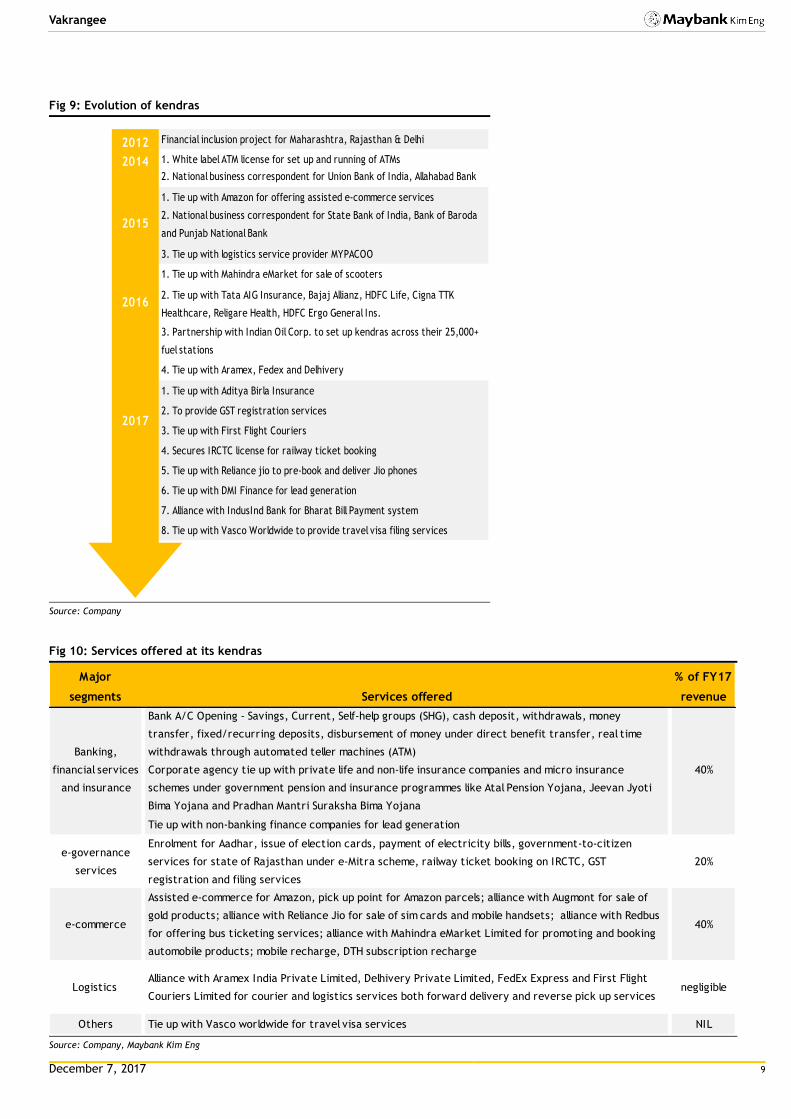
3.2 Evolution of kendras Its kendra business originated in 2012-13, after it secured a common
banking-correspondent project from the states of Maharashtra, Rajasthan
and Delhi. Later, VKI became the national business correspondent of
nationalised banks such as the State Bank of India, Allahabad Bank, Bank
of Baroda, Union Bank of India and Punjab National Bank. Their contracts
required VKI to set up kendras in selected locations. VKI also secured a
licence from the Reserve Bank of India to set up white-label ATMs across
India. It is now a national business correspondent for eight state-owned
banks and a common correspondent for 26 banks in Maharashtra and
Rajasthan.
With a view to monetising its presence across rural India, the company
approached Amazon in 2015 to offer assisted e-commerce at its kendras.
It also tied up with insurance companies to offer life and non-life
insurance products at its kendras. It further teamed up with logistics
companies to facilitate the booking of couriers and parcels; non-banking
financial institutions for the lead generation of loan products; and product
companies like Reliance Jio for the pre-booking and sale of Jio phones.
Company incorporation
Computerisation of Central Election Commission
MCA21 project from Ministry of Corporate Affairs
1. Land record digitisation in UP
2. Rashtriya Swasthya Bima Yojna (RSBY) – Uttar Pradesh,
Haryana & Rajasthan
Land record digitisation for Govt. of Philippines
1. Passport Seva Kendra project
2. Common service centre (CSC) project in Punjab
3. Sarva Shiksha Abhiyan
1. Issue of Aadhar cards under Unique identification
development authority of India (UIDAI)
2. Link Aadhar with Haryana public distribution system
1. Digitisation of property records, Maharashtra
2. National population register
3. Common service centre for Rajasthan
1990
1993
2005
2007
2009
2010
2011
2013
December 7, 2017 9
Vakrangee
Fig 9: Evolution of kendras
Source: Company
Fig 10: Services offered at its kendras
Source: Company, Maybank Kim Eng
Financial inclusion project for Maharashtra, Rajasthan & Delhi
1. White label ATM license for set up and running of ATMs
2. National business correspondent for Union Bank of India, Allahabad Bank
1. Tie up with Amazon for offering assisted e-commerce services
2. National business correspondent for State Bank of India, Bank of Baroda
and Punjab National Bank
3. Tie up with logistics service provider MYPACOO
1. Tie up with Mahindra eMarket for sale of scooters
2. Tie up with Tata AIG Insurance, Bajaj Allianz, HDFC Life, Cigna TTK
Healthcare, Religare Health, HDFC Ergo General Ins.
3. Partnership with Indian Oil Corp. to set up kendras across their 25,000+
fuel stations
4. Tie up with Aramex, Fedex and Delhivery
1. Tie up with Aditya Birla Insurance
2. To provide GST registration services
3. Tie up with First Flight Couriers
4. Secures IRCTC license for railway ticket booking
5. Tie up with Reliance jio to pre-book and deliver Jio phones
6. Tie up with DMI Finance for lead generation
7. Alliance with IndusInd Bank for Bharat Bill Payment system
8. Tie up with Vasco Worldwide to provide travel visa filing services
2012
2014
2015
2016
2017
Major
segments Services offered
% of FY17
revenue
Bank A/C Opening - Savings, Current, Self-help groups (SHG), cash deposit, withdrawals, money
transfer, fixed/recurring deposits, disbursement of money under direct benefit transfer, real time
withdrawals through automated teller machines (ATM)
Corporate agency tie up with private life and non-life insurance companies and micro insurance
schemes under government pension and insurance programmes like Atal Pension Yojana, Jeevan Jyoti
Bima Yojana and Pradhan Mantri Suraksha Bima Yojana
Tie up with non-banking finance companies for lead generation
e-governance
services
Enrolment for Aadhar, issue of election cards, payment of electricity bills, government-to-citizen
services for state of Rajasthan under e-Mitra scheme, railway ticket booking on IRCTC, GST
registration and filing services
20%
e-commerce
Assisted e-commerce for Amazon, pick up point for Amazon parcels; alliance with Augmont for sale of
gold products; alliance with Reliance Jio for sale of sim cards and mobile handsets; alliance with Redbus
for offering bus ticketing services; alliance with Mahindra eMarket Limited for promoting and booking
automobile products; mobile recharge, DTH subscription recharge
40%
Logistics Alliance with Aramex India Private Limited, Delhivery Private Limited, FedEx Express and First Flight
Couriers Limited for courier and logistics services both forward delivery and reverse pick up servicesnegligible
Others Tie up with Vasco worldwide for travel visa services NIL
Banking,
financial services
and insurance
40%

December 7, 2017 10
Vakrangee
Fig 11: Drivers of various businesses and potential threats
Source: Company, Maybank Kim Eng Aadhar is a 12-digit unique identity number issued to all Indian residents based on their biometric and demographic data
3.3 India’s answer to Alibaba’s Rural Taobao As of 31 Dec 2016, 590m Chinese resided in China’s rural areas, according
to the National Bureau of Statistics of China. Rural consumption is highly
constrained by geographical and infrastructure limitations, as the cost of
distribution to dispersed and remote locations, is prohibitively high. To
overcome this and to tap anticipated rural demand, Alibaba launched its
Rural Taobao programme in 2014. As of Mar 2017, it had penetrated
26,500 villages. Villagers can place orders at these service centres.
Consumer goods such as electronic appliances and agricultural supplies
can be ordered online for delivery to county-level stations, before their
distribution by local couriers to village service centres for pick-up.
Coordinated by Cainiao Network, its logistics arm, almost all packages can
be delivered from county-level stations to village service centres the next
day. VKI is replicating this set-up through its partnership with Amazon.
Services offered Drivers Threats
- Correction/change request in Aadhar card - New Aadhar card issuing to reduce
- Making of plastic Aadhar card - Shift from offline to online
- GST enrolment, filing and payment services
- Bharat Bill Pay Services for utility bill payment
- Ticketing tie up with Indian Railways
- Direct benefit transfer into bank accounts and
remittances- Competition from fintech
- Increase in number of bank accounts driving
more transactions
- Shift from offline to online. Mobile
banking & new tech modes account
for meagre 1.6% of country's
electronic payments
- Lead generation fees to sell loan products from
non-banking finance companies
- Number of new account opening to
taper
- Sells only motor insurance in non-life insurance
and in life insurance it sells standard small-ticket
term or endownment plans
- require specific skills and knowledge
to sell life insurance products. This
risk is minimised as the product
category is restricted
- Kendras at IOC fuel filling stations to drive
motor insurance- Competition from fintech
- Low insurance penetration
- Activation of services across more kendras
- Touchpoint for claim redress gives confidence
- Under-penetration of Amazon/e-commerce - Addition of more partners by Amazon
- Activation of services across more kendras - Discontinuation of partnership
- lack of mobile/internet literacy for e-commerce - Shift from offline to online
- Adding new product tie-ups for sale
- Adding business-to-business (B2B) e-commerce
- Under-penetration of last mile - Competition from start-ups
- Activation of services across more kendras
- Addition of reverse logistics business
Logistics services
Government-to-citizen
services
Banking and financial
services
Amazon/assisted ecommerce
Insurance

December 7, 2017 11
Vakrangee
3.4 Kendras are franchised
Kendras are opened by franchisees who incur all the capex and opex. VKI
shares the commissions it receives for its services with its franchisees. Of
its 40,461 operating kendras as at end-Sep 2017, just 22 were owned by
VKI. From awarding 75% of its kendra revenue to its franchisees, it has
started awarding 80%, keeping 20%. This is to increase the attractiveness
of its kendras to franchisees.
In most cases such as banking, insurance and e-governance, money is
directly received by VKI. VKI keeps its share and transfers the balance to
its franchisees. For changes in Aadhar, the making of plastic Aadhar cards
and Amazon services, money is received by the franchisees directly.
Franchisee selection
Franchisee selection is reasonably stringent and has been fine-tuned over
time. As its franchisees act as banks’ business correspondents, their final
selection is done by the banks. VKI advertises in the areas where it wants
to set up kendras. It shortlists a few candidates and sends them to bank
branch managers for their final selection. A basic know-your-customer
form is filled, an aptitude test taken and police / credit / referral checks
made. This is followed by GST registration and verification of the
franchisees’ PAN / Aadhar cards. The franchisees would also need to clear
a few basic exams. For e-governance, there is the NSE IT UIDAI exam. For
banking, there is the Indian Institute of Banking & Finance (IIBF) exam.
Thereafter, basic training on various products and services is given to the
franchisees.
Economics for a franchisee: urban & rural
Franchisees need to at least pass their higher secondary certificate
examination or 12th standard. This is the basic requirement for the IIBF
examination. VKI does not fund any part of the capex or working capital of
its franchisees.
In urban areas, its franchisees could be ex-bankers, accountants,
insurance agents or potential entrepreneurs. They usually have some
capital and the capacity to secure small loans. Typically, they need to
invest INR1.2-2m. The amount could be lower, depending on the
requirements of the corresponding bank. One-time capex is INR0.5-0.8m.
The balance INR0.7-1.2m is for working capital to maintain balances with
the corresponding banks.
In rural areas, its franchisees could be persons of repute in the localities
or aspiring entrepreneurs already running a shop or with space to set up
one. They have to invest INR385k, of which one-time capex is INR85k and
the balance INR0.3m used to maintain balances with the corresponding
banks. Here again, they usually have some capital. Their balance funding
could come from loans from MUDRA or the Micro Units Development &
Refinance Agency Ltd. Launched in Apr 2015, MUDRA was set up by the
Government of India to develop and refinance micro enterprises. It offers
loans of up to INR1m. To date, it has disbursed INR4,167b.

December 7, 2017 12
Vakrangee
Fig 12: Capex requirements for franchisees
INR Urban Rural
Capex - one time
Hardware 500k 85k
ATM 300k 300k
Working capital
excl ATM 700k 300k
for ATM 500k 100k
Source: Company
Fig 13: Franchise economics
INR Urban Rural
Capex + WC
incl ATM 2,000,000
excl ATM 1,200,000 385,000
Operating costs per month
Operator salary (INR10k/person) 30,000 10,000
Manager salary 20,000
Rent 25,000 1,000
Office expenses 15,000 10,000
Marketing costs 10,000 4,000
Total 100,000 25,000
Avg. revenue per kendra per month
incl ATM 200,000
excl ATM 168,750 62,500
Revenue per kendra per year
incl ATM 2,400,000
excl ATM 2,025,000 750,000
Franchisee share of revenue
incl ATM 1,920,000
excl ATM 1,620,000 600,000
Net earning for franchisee
incl ATM 720,000
excl ATM 420,000 300,000
Payback period (years)
incl ATM 2.8
excl ATM 2.9 1.3
Source: Company, Maybank Kim Eng
Internet-based platform
VKI’s entire franchise operation is paperless. Customer verification is done
through its unique-identity Aadhar facility. VKI has also developed an
Internet-based technology platform called the Vakrangee Kendra
Management System on which all its services are activated. It employs
1,000 block coordinators to supervise 35-45 kendras each. These co-
ordinators report to district-level officers who in turn report to state-level
officers. The block co-ordinators must ensure services are active and train
franchisees to provide all the services activated.

December 7, 2017 13
Vakrangee
Fig 14: The kendra model
Source: Company
Fig 15: How kendras generate revenue
Source: Company
Services offered Rate Paid by Recd. by
Government-to-citizen services
Issue of new Aadhar INR35 UIDAI VKI
Correction/change in Aadhar INR25 Customer Franchisee
Making of Aadhar PVC card INR30 Customer Franchisee
G2C services (Rajasthan)diff. rates for
diff. services
Gov't of India
/ CustomerFranchisee
Banking services
Overallfixed monthly
feeBank VKI
Account opening INR20-50 Bank VKI
Cash deposit/withdrawal 0.35-0.5% Bank VKI
ATM - financial transaction INR15 Bank VKI
ATM - non-financial transaction INR5 Bank VKI
Insurance
Sale of insurance policies
10-20% of
premium as
per IRDA rules
Insurance
companyVKI
e-commerce services
DTH/mobile recharges 3-6% Company VKI
Amazon/assisted e-commerce,
Reliance Jio, Augmont
Jewellery
4-15% of bill
amountCompany VKI
Courier services
20-25% of
courier
charges
Company VKI
Bus ticket booking services5-7% of
booking feeCompany VKI

December 7, 2017 14
Vakrangee
Training is crucial: dedicated teams from partners
Training is crucial for the growth of its kendra business, especially as the
number of its kendras explodes. Franchisees have some knowledge of
banking and G2C services once they pass their IIBF and NSE IT UIDAI
examinations. Further training is given at the time of setting up hardware
systems. VKI’s block managers may also collaborate with its partners to
set up camps in various regions to train franchisees. With its growing
operations, VKI has approached its partners to secure dedicated training
teams from them. This should further aid its training programme. VKI has
also set up a call centre with 80-100 staff to provide technical support to
its franchisees.
3.5 Kendra EBITDA margins may trend down Revenue-sharing has moved from 65:35 to 75:25 for franchisees / VKI. VKI
is in the midst of further improving it to 80:20, to increase the
attractiveness of its franchise and build scale. This brought its EBITDA
margins down to 21.4% in FY17 from 30.2% in FY15.
E-governance EBITDA margins have been 23-28% in the last four years.
Management guides for a more or less stable 25-30%. Blended EBITDA
margins are expected to stabilise at around 18%.
Fig 16: EBITDA margins of the two businesses
Source: Company
30.2
%
23.8
%
21.4
%
22.6
%
28.0
%
27.7
%
26.0
%
25.7
%
23.6
%
0.0%
7.0%
14.0%
21.0%
28.0%
35.0%
FY15 FY16 FY17
Vakrangee Kendra e-Governance projects Blended

December 7, 2017 15
Vakrangee
Fig 17: Top management
Source: Company
Name Position Remarks
Dinesh Nandwana Managing Director & CEO Promoter, a certified chartered accountant by qualification
Dr Nishikant Hayatnagarkar Director - R&D24 years experience in the IT sector. Holds a Doctorate in Computer
Science from the Indian Institute of Technology, Mumbai
Sumit Jain CEO - e-commerce
Has worked with Barclays, Credit Suisse and Intel Corporation. Holds an
MBA from Stern School of Business at New York University and B.Tech in
computer science from Indian institute of Technology, Bombay
Rajeev Ranjan CEO - e-governance
Earlier was CEO of Vakrangee's Philippines business. He has worked with the
Tata group and has vast experience delivering simultaneous National level,
large scale and mission–critical projects
Rahul Dev Pal CEO - banking business
Has 26 years experience in the field of sales and marketing. He has in-depth
knowledge of the banking vertical. Starting his career with HCL he worked
with companies like Xerox, Pertech Computers , BPL and Godrej. His last
assignment in Godrej was as a National Head
Nitin Sharma CEO - ATM business
Over 17 years of cross-cultural experience in Operations, Implementation,
Retail and Project Management. Was COO of Vakrangee's Philippines
business. Holds an executive MBA from IIM Kolkata and Masters in
operations, IR and social work from Premier Institute, Udaipur
Subhash Singhania Chief Finance Officer Qualified chartered accountant with vast experience in accounts and
taxation

December 7, 2017 16
Vakrangee
4. Scalability to 2x current kendras
4.1 Strong execution VKI has a record of working on mission-mode projects for the Government
of India. These include data collection and data management for the
Election Commission of India in the last 25 years. It has moved up the
value chain from sub-contractor to independent bidder for large
government projects. For the issuance of Aadhar cards, it received a T3F4
licence from UIDAI, the highest for any provider.
As of Sep 2017, VKI had 40,461 kendras in 18 Indian states. Of these, 71%
were in rural India where agriculture is the main source of income. It
wants to double this to 75,000 at least by 2020. Two-thirds will be in rural
areas and the rest in more than 650 urban districts, up from 365 in FY17.
With this expansion, it hopes to cover more than 19,000 postal codes,
dramatically up from 5,000 in FY17.
We don’t think its target is unrealistic, considering: a) its average
quarterly rollout of 2,750 kendras in the last eight quarters; and b) its
partnership with IOC, which allows it to set up kendras at IOC’s more than
20,000 fuelling stations. As only 200+ have been opened so far, there is
room to open at least another 19,800.
Fig 18: Kendras are multiplying
Source: Company
Of its 40,461 kendras as at Sep 2017, 91% were located in the three states
of Rajasthan, Maharashtra and Uttar Pradesh. When it opens more and
more kendras, management thinks this geographical concentration may
come down to 70-75%.
15,6
71
16,1
04
19,3
39
21,5
80
25,1
31
26,7
37
29,3
94
5,0
06
5,7
16 6,8
49
7,7
34 10,0
75
10,9
51
11,0
67
0
9,000
18,000
27,000
36,000
45,000
2Q
15
3Q
15
4Q
15
1Q
16
2Q
16
3Q
16
4Q
16
1Q
17
2Q
17
3Q
17
4Q
17
1Q
18
2Q
18
Rural Urban

December 7, 2017 17
Vakrangee
Fig 19: 2Q18 kendras in rural and urban areas by state
Source: Company
As of 28 Nov 2017
4.2 More mileage for Amazon In retailing, VKI has partnered Reliance Jio, Augmont Jewellery, Mahindra
eMarket and Amazon. For Reliance Jio, VKI enables the pre-booking of its
Jio phones as well as mobile top-ups. The Jio phones were launched in
Aug 2017. In May 2015, it started offering Amazon-assisted e-commerce
services, namely marketing, promotions and pick-up services, at its
kendras. Via their 5-year agreement which will expire in Jul 2020, Amazon
India hopes to piggyback on VKI’s network to reach India’s deep
hinterlands. Amazon doubled its ‘Project Udaan’ or assisted-shopping
stores from 6,000 to 12,000+ in the last four weeks leading to its big
festival sale in Sep 2017. Of these, over 10,000 were VKI’s kendras.
Amazon has similar tie-ups with Smart Buy, Rajasthan Government’s
eMitra project, Connect India and Store King, all unlisted. Under Project
Udaan, Amazon appoints offline associates at retail points such as kirana
stores, medical stores and mobile-phone retail shops. It provides them
with PC-based websites. The store owners are trained to help customers
find and buy products, earning a commission in the process. Amazon then
delivers the products to the customers’ doorsteps or to the centres and
accepts cash on delivery.
Their ramp-up will depend on how fast Amazon India can set up fulfilment
centres and warehouses across the country. Amazon has a target of 41
fulfilment centres in 13 Indian states for this year. The states are
Maharashtra, Gujarat, Rajasthan, Uttar Pradesh, Delhi, Punjab, Haryana,
Karnataka, Andhra Pradesh, Telangana, Tamil Nadu, West Bengal and
Madhya Pradesh.
States Rural Urban Total Amazon #
Bihar 433 109 542 27
Chandigarh 2 12 14 12
Chhattisgarh 67 20 87 21
Dadra & Nagar Haveli 1 1
Delhi 21 125 146 89
Goa 31 27 58 57
Gujarat 245 212 457 165
Haryana 102 158 260 240
HP 15 12 27 11
Jharkhand 193 90 283
Karnataka 10 4 14 8
MP 656 361 1,017 292
Maharashtra 7,815 2,729 10,544 3,259
Odisha 75 45 120 28
Punjab 110 235 345 227
Rajasthan 10,821 3,066 13,887 2,534
UP 8,746 3,824 12,570 2,980
Uttarakhand 52 37 89 50
Total 29,394 11,067 40,461 10,000

December 7, 2017 18
Vakrangee
Amazon also provides customers with the option to get their parcels
delivered to any of its designated pick-up locations in 45 cities. This
service is free for customers, while Amazon pays INR15 per package to its
designated pick-up stores.
The Indian Brand Equity Foundation estimates that India’s retail market
will reach USD1.3t by 2020 from USD672m in 2016. Organised retailing’s
share will reach 19% from 9%. Online retailing is expected to touch
USD60b by 2020, 4x 2016’s USD14.5b. Amazon launched its online
marketplace in India on 5 Jun 2013. To date, it has invested USD2.5-3b,
with a commitment to increasing this to USD5b.
Amazon is gaining momentum in India. During its ‘Great Indian Festival
Sale’ during 21-24 Sep 2017, its gross merchandise sales, excluding
returns, were up 4.5x from normal times. About 86% of its new customers
came from small towns. Daily transactions under Project Udaan ballooned
29x YoY while sales leapt 12x. As a result, Amazon amassed a customer
market share of 44% and transaction share of 42% in online retailing during
its sale, according to a Kantar IMRB survey.
Fig 20: A VKI–Amazon advertisement in Economic Times on 5 Oct 2017
Source: Company
Fig 21: Another in Rajasthan Patrika on 23 Sep 2017
Source: Company
VKI dishes out incentives to its franchisees regularly to push sales higher.
Its latest was a INR15,500 cash incentive for franchisees to enrol for its
Amazon services.

December 7, 2017 19
Vakrangee
Fig 22: Incentives offered by VKI
Source: Company
To take its business to another level, VKI is also considering business-to-
business (B2B) retailing. It is in discussions with leading retailers,
including Amazon.
Benefits of Amazon partnership
From its Amazon partnership, VKI earns: 1) commissions of 4-15% on the
GMV of products sold; and 2) INR15 for each package picked up at its
kendras. Out of Amazon India’s 12,000+ stores offering assisted e-
commerce, 10,000+ belong to VKI. After a slow ramp-up in the first couple
of years, from zero to 2,000+, Amazon’s subsequent ramp-up was very
strong, to 10,000+ in six months. We believe that by FY20E, at least 58%
of VKI’s kendras will offer assisted e-commerce services. We forecast that
the share of Amazon and other assisted e-commerce services will form
41% of kendra revenue by then, up from an estimated 10% in FY17.
Fig 23: Share of assisted e-commerce revenue set to jump
Source: Maybank Kim Eng
4.3 Insurance: penetration weak but improving India’s life and non-life penetration, as measured by premiums to GDP,
was 3.4% in FY16. At almost half the global average of 6.2%, we see
growth opportunities. VKI has partnered nine life and non-life companies:
Life Insurance Corporation (LIC), HDFC Life Insurance, Bajaj Allianz, Tata
AIG Insurance, Aditya Birla Health Insurance, Cigna TTK Health Insurance,
Religare Health Insurance, Reliance General Insurance and HDFC Ergo
General Insurance. In non-life insurance, it only sells motor insurance. In
life, it sells either term insurance or endowment policies. Companies like
HDFC Life have launched sub-INR1,000-premium policies for rural India.
Amazon business opportunity INR
Create 100 customer accounts in a month and earn 3,500
Sell 30 mobile phones of average price of INR5,000 in a month and earn 4,000
Sell 10 pair of shoes/shirts/pants/sarees/of an average price of
INR1,000 in a month and earn 1,000
Get 100 customers to order home/kitchen products (mixer/cooker,
oil, toothpaste, detergent powder, soaps) worth INR1,000 per month
and earn 7,000
Total 15,500
28%
37%
41%
0%
10%
20%
30%
40%
50%
FY18E FY19E FY20E
Amazon & other e-commerce

December 7, 2017 20
Vakrangee
Its tie-up with IOC to open kendras at fuelling stations should provide an
avenue for selling vehicle-insurance products. VKI adds value to its
insurance partners by providing reach at negligible customer acquisition
costs. Consumers also seem to prefer brick-&-mortar kendras for claim
reporting and redress.
Fig 24: India’s life-insurance penetration is below the world average
Source: IRDA
Fig 25: Its non-life insurance penetration is at the bottom of the pack
Source: IRDA
The typical commission allowed by the regulators for selling motor
insurance is 15%. In life insurance, commissions are 5-20%. VKI commands
10-20%. Its typical volumes are five life policies and 10-15 motor insurance
per month per mature franchisee. Corporate agents like VKI were
responsible for 8.4-8.8% of non-life distribution in the last three years and
1.3-1.4% of life distribution.
Fig 26: How non-life insurance is distributed in India…
Source: ICICI Lombard RHP
Fig 27: … and life
Source: IRDA annual reports
2.3
%
0.3
% 2.7
%
2.3
%
11
.5%
7.4
%
16
.7%
7.2
%
16
.2%
5.5
%
3.0
%
7.6
%
3.5
%0.0%
4.0%
8.0%
12.0%
16.0%
20.0%
Bra
zil
Russ
ia
India
Chin
a
South
Afr
ica
South
Kore
a
Taiw
an
Japan
Hong K
ong
Sin
gapore US
UK
Worl
d
1.8
%
1.1
%
0.8
%
1.8
%
2.7
% 4.7
%
3.3
%
2.4
%
1.4
%
1.7
%
4.3
%
2.6
%
2.8
%
0.0%
4.0%
8.0%
12.0%
16.0%
20.0%
Bra
zil
Russ
ia
India
Chin
a
South
Afr
ica
South
Kore
a
Taiw
an
Japan
Hong K
ong
Sin
gapore US
UK
Worl
d
Distribution mix 2012 2013 2014 2015 2016 2017
Brokers 23.1% 29.3% 29.4% 25.2% 30.3% 28.8%
Corporate agents - banks 11.4% 11.6% 11.7% 13.2% 12.5% 10.4%
Corporate agents - others 3.1% 3.8% 5.5% 8.4% 8.9% 8.8%
Direct business 42.9% 33.3% 31.2% 29.1% 26.4% 35.7%
Individual agents 19.1% 21.7% 22.0% 21.3% 20.3% 16.1%
All others 0.5% 0.2% 0.1% 2.6% 1.6% 0.2%
Distribution mix FY12 FY13 FY14 FY15 FY16
Brokers 1.8% 1.7% 1.6% 1.8% 1.6%
Corporate agents - banks 15.0% 16.2% 15.6% 20.8% 23.8%
Corporate agents - others 2.7% 2.1% 1.3% 1.4% 1.4%
Direct business 1.9% 2.6% 3.1% 4.4% 4.4%
Individual agents 78.7% 77.5% 78.4% 71.4% 68.3%
All others 0.0% 0.0% 0.0% 0.0% 0.6%

December 7, 2017 21
Vakrangee
Fig 28: VKI’s insurance revenue to reach 7% of its total by FY20E
Source: Maybank Kim Eng
4.4 Opportunities from financial inclusion, Aadhar & direct
transfers The Government of India has a financial inclusion programme to bank the
unbanked. This is on top of its mandate to issue 12-digit unique-identity
Aadhar numbers and cards to all Indian residents. Eventually, it hopes to
link these numbers to bank accounts to enable the direct transfer of funds
under various social-welfare schemes.
VKI is present across this value chain. In 2012, it secured financial-
inclusion projects from the states of Maharashtra, Rajasthan and Delhi.
Later, it was selected as the national business correspondent of the State
Bank of India, Bank of Baroda, Allahabad Bank, Union Bank of India and
Punjab National Bank.
It holds T3F4 licences for the issue of Aadhar numbers and cards. Direct
transfers of benefits to the accounts of beneficiaries mean higher
transaction values. VKI has opened 50-60m of the 280m bank accounts
created by the financial-inclusion programme since 2012. It has issued
close to 70m Aadhar cards of the 1.1b total.
VKI helps banks avoid the cost of running rural branches and servicing
footfalls in urban branches. A 2016 Reserve Bank of India study estimates
the cost of a branch transaction at INR59 vs INR29 for business
correspondents. This keeps banks interested in working with
correspondents like VKI.
In banking services, VKI earns a fixed monthly fee from the banks, a
commission of 0.35-0.5% on the amount of deposits or withdrawals made
and INR20-50 per account opening. It also earns a small fee for
successfully soliciting each bank deposit.
In G2C services, VKI is paid INR35 by UIDAI for issuing a new Aadhar
number. For subsequent changes, the customer pays INR25 and INR30 for
printing an Aadhar PVC card. Charges for other G2C services vary from
state to state.
We forecast that banking and G2C revenue will continue to grow, albeit at
a slower clip than e-commerce and insurance services, as the former are
more mature businesses.
4%
5%
6%
7%
0%
2%
4%
6%
8%
10%
FY17 FY18E FY19E FY20E
Insurance

December 7, 2017 22
Vakrangee
Fig 29: Banking-service revenue to grow by 46% on average a year
Source: Maybank Kim Eng
Fig 30: G2C’s revenue share to decline
Source: Maybank Kim Eng
Size of unbanked market
The government first attempted to cover villages with populations of
more than 2,000 in 2010. A total of 74,414 villages were identified and
allocated to public-sector, private-sector and regional rural banks. All the
identified villages have been provided banking services since, via
branches, business correspondents or other modes such as ATMs and
mobile vans. In Jun 2012, another attempt was made to provide banking
services to unbanked villages with populations of less than 2,000. A total
of 491,825 villages were allocated to various banks. As of 31 Mar 2017,
96% or 472,136 had been covered. Of these, 19,875 villages had brick-&-
mortar branches, 431,359 had business correspondents and 20,902, other
modes. Convenor banks have been advised to review and identify
unbanked rural centres in villages with populations of above 5,000 and
ensure that such centres have core-banking-system-enabled outlets by 31
Dec 2017.
As of Mar 2017, 534m new savings accounts had been opened by bank
branches and business correspondents. Of this number, 52% was opened by
business correspondents.
Fig 31: Financial Inclusion Plan’s progress report Note the high percentage of villages served by correspondents and their average transaction values
Source: Reserve Bank of India
36%
25% 23% 22%
64%
42%
33%
0%
15%
30%
45%
60%
75%
0%
9%
18%
27%
36%
45%
FY17 FY18E FY19E FY20E
Banking services YoY % [RHS]
20% 14% 11% 10%
87%
62%
22%
0%
10%
20%
30%
40%
50%
60%
70%
80%
90%
100%
0%
5%
10%
15%
20%
25%
FY17 FY18E FY19E FY20E
Govt-to-citizen services YoY % [RHS]
Particulars Mar-10 Mar-11 Mar-12 Mar-13 Mar-14 Mar-15 Mar-16 Mar-17
Banking Outlets in Villages -Total 67,694 116,208 181,753 268,454 383,804 553,713 586,307 598,093
Branches 33,378 34,811 37,471 40,837 46,126 49,571 51,830 50,860
Branchless mode 34,316 81,397 144,282 227,617 337,678 504,142 534,477 547,233
Other Modes 142 595 3,146 6,276 4,678 4,142 3,248 3,761
BCs 34,174 80,802 141,136 221,341 333,000 500,000 531,229 543,472
Villages>2000-BCs 8,390 na na na na na 98,958 105,402
Villages<2000- BCs 25,784 na na na na na 432,271 438,070
Urban Locations covered through BCs 447 3,771 5,891 27,143 60,730 96,847 102,552 102,865
No of bank accounts - Total (m) 73 105 139 182 243 398 469 534
through branches (m) 60 73 81 101 126 210 238 254
through BCs (m) 13 32 57 81 117 188 231 280
Account balance - Total (INRb) 55 76 120 183 312 440 638 976
through branches (INRb) 44 58 110 165 273 365 474 691
through BCs (INRb) 11 18 11 18 39 75 164 285

December 7, 2017 23
Vakrangee
Direct transfers reduce pilferage & reach beneficiaries
To cut pilferage, the Government of India has been transferring funds
under its public-welfare programmes directly to the bank accounts of
their intended beneficiaries. This increases the number of withdrawal
transactions for business correspondents like VKI. As of Aug 2017, 314
schemes had been brought under direct transfers, up from 140 in FY17.
Funds transferred totalled INR337b in the first five fiscal months of FY17.
Also, the share of Aadhar-based payments increased to 49% from 40% YoY,
indicating increasing usage of this mode of payment. This is positive for
banking correspondents like VKI.
Fig 32: Funds transferred directly to beneficiaries (INRm)
Source: Government of India
Two data points we will be monitoring are: a) the average value of
transactions; and b) Aadhar payments directly transferred. Our channel
checks suggest an average banking value per day of INR200-250k for a
mature kendra. This includes deposits, withdrawals and fund transfers. In
FY17, the government disbursed INR746b through direct transfers. This
should increase to INR810b in FY18E, from annualised 5-month data. If so,
it implies a big addressable market. Balances in bank accounts opened by
business correspondents amounted to INR285b as at end-FY17, according
to RBI.
Fig 33: Average value of transactions through business correspondents (INR)
Source: Ministry of Finance
Fig 34: % of direct transfers through the Aadhar payment gateway
Source: Ministry of Finance
Threat from electronic payments?
The world is inexorably moving towards mobile banking. As per the
telecom regulatory authority of India (TRAI), India’s wireless penetration
is 92%: urban 168% and rural 57%. Its government is hoping to improve
broadband penetration to the last mile via its BharatNet project, which
also envisages improving broadband speeds from 512 Mbps to 2 Gbps by
Mar 2019. New modes of payment - like mobile banking, unstructured
supplementary service data (USSD) for making payments by text messages,
Government schemes FY14 FY15 FY16 FY17 FY18
PAHAL (cooking gas subsidy) 53,949 93,844 214,210 158,765 72,526
MGNREGS (employment guarantee) 0 200,101 258,618 373,119 160,858
NSAP (social assistance) 9,062 60,494 83,647 54,100 9,633
Scholarship schemes 0 0 51,199 128,596 33,028
Others 10,666 34,823 10,570 31,495 61,708
Total 73,677 389,262 618,243 746,076 337,751
No of schemes using DBT 28 34 59 140 314
259
689623
934
1,596
1,803
2,040
2,288
0
500
1,000
1,500
2,000
2,500
Mar-10 Mar-11 Mar-12 Mar-13 Mar-14 Mar-15 Mar-16 Mar-17
Avg value of transaction through BCs (INR)
19% 22%
22% 2
7% 31%
31% 33%
34%
41%
41%
27%
52%
43%
43%
52%
54%
48%
0%
12%
24%
36%
48%
60%
Mar-
16
Apr-
16
May-1
6
Jun-1
6
Jul-
16
Aug-1
6
Sep-1
6
Oct-
16
Nov-1
6
Dec-1
6
Jan-1
7
Feb-1
7
Mar-
17
Apr-
17
May-1
7
Jun-1
7
Jul-
17
% of DBT transfer through Aadhar payment bridge

December 7, 2017 24
Vakrangee
prepaid payment instructions via e-wallets and unified payment interface
for instant real-time payments through applications - account for just 1.6%
of all electronic payments. Their monthly value is INR115.7t.
But although mobile payments could rise, we do not foresee any
immediate threat to VKI. This is because: a) outside the metropolises and
excluding millennials, many Indians still gravitate towards touchpoints; b)
we think the size of the industry would allow for multiple channels; and c)
China’s 4G penetration is already 67% whereas India’s 3G/4G broadband
penetration is only 20-25%. India’s adoption of mobile payments is much
slower than China’s.
Also, we believe that branch banking will be supported by:
a. Its low penetration in India, at 13.5 commercial branches per 100k
adults vs 28.2 in the US and 27.5 in the EU in 2015, according to the
World Bank.
b. The low penetration of banking products. Only 13% of farm
households in the income bracket of less than USD1,000 has access to
bank loans.
Even in the US, the Federal Deposit Insurance Corp estimates that US
banks scaled back their branches by only 6% from 2009 to 2016. As the
number of FDIC-insured banks also declined 25% over the same period,
their culling seems even smaller. We also believe that with the cost
advantage offered by business correspondents, there might actually be an
increase in the number of correspondent centres in India.
Fig 35: New technology payment systems account for only 1.6% of electronic banking, indicating no immediate threat from mobile payments
Source: Maybank Kim Eng
4.5 Logistics: high potential but time & money needed VKI has a much bigger plan for logistics services. It has signed on Fedex
Express, Aramex India, Delhivery and First Flight Couriers to offer courier-
booking services in 16 states. It serves 852 postal codes out of its 5,200
reach. In the medium term, it is eyeing last-mile delivery and reverse
logistics. It has started pilot-testing 69 postal codes and completed the
pick-up and delivery of more than 220k packages.
Customers visit its kendras to book a courier and provide sender /
recipient & shipment details. They pay consignment fees at the kendras.
The franchisees will schedule pick-up by one of their employees. Courier
Modes of electronic payment systems Nov-16 Dec-16 Jan-17 Feb-17 Mar-17 Apr-17 May-17 Jun-17 Jul-17 Aug-17 Sep-17 Oct-17
Real time gross settlement (RTGS) 82.4% 79.8% 78.9% 79.2% 81.7% 79.7% 79.8% 80.5% 80.4% 80.4% 81.3% 79.6%
National electronic fund transfer (NEFT) 9.2% 10.9% 11.6% 11.6% 10.8% 10.9% 11.0% 11.0% 11.1% 11.3% 11.3% 12.0%
Cheque truncating system (CTS) 5.7% 6.5% 6.7% 6.4% 5.3% 6.3% 6.0% 5.6% 5.9% 5.6% 5.0% 5.5%
Immediate payment service (IMPS) 0.3% 0.4% 0.5% 0.5% 0.4% 0.5% 0.5% 0.5% 0.6% 0.6% 0.6% 0.6%
National automated clearing house (NACH) 0.6% 0.6% 0.6% 0.6% 0.5% 0.8% 0.6% 0.6% 0.7% 0.7% 0.5% 0.8%
Unified payment interface (UPI) 0.0% 0.0% 0.0% 0.0% 0.0% 0.0% 0.0% 0.0% 0.0% 0.0% 0.0% 0.1%
Unstructured supplementary service data (USSD) 0.0% 0.0% 0.0% 0.0% 0.0% 0.0% 0.0% 0.0% 0.0% 0.0% 0.0% 0.0%
Debit/Credit card & point of sale (POS) 0.4% 0.5% 0.5% 0.4% 0.3% 0.4% 0.4% 0.4% 0.4% 0.4% 0.4% 0.5%
Prepaid payment instruction (PPI) 0.0% 0.0% 0.0% 0.0% 0.0% 0.0% 0.0% 0.0% 0.0% 0.0% 0.0% 0.0%
Mobile banking 1.3% 1.3% 1.2% 1.2% 1.0% 1.3% 1.7% 1.4% 0.9% 0.9% 0.9% 1.0%
Total 100% 100% 100% 100% 100% 100% 100% 100% 100% 100% 100% 100%
Total (INRt) 95.2 105.4 98.2 93.7 151.1 111.0 113.0 115.3 108.4 110.9 125.8 115.7
Traditional payment systems (RTGS to NACH) 98.3% 98.2% 98.2% 98.4% 98.7% 98.3% 97.8% 98.2% 98.6% 98.6% 98.7% 98.4%
New payment systems (UPI to Mobile banking) 1.7% 1.8% 1.8% 1.6% 1.3% 1.7% 2.2% 1.8% 1.4% 1.4% 1.3% 1.6%

December 7, 2017 25
Vakrangee
companies pick up the consignments according to schedule and the
franchisees change the status of the consignments on their platforms to
“picked”. VKI earns 20-25% of the courier charges.
VKI has set up a 100% subsidiary, Vakrangee Logistics Private Limited, to
develop this business. Revenue in its first year of operations was INR9.3m,
in FY17. Net loss was INR6.3m, which was negligible at the group level.
The company has developed back-end technology for seamless reverse
logistics. It is in discussions with partners. We believe reverse logistics will
need a higher amount of franchisee co-operation and investments in
manpower. For now, we have not factored in any revenue.
Fig 36: VKI’s reverse-logistics proposal
Source: Company

December 7, 2017 26
Vakrangee
5. Competition
5.1 VKI’s advantages: 100% bricks & mortar vs touchpoints;
sheer scale
The RBI says that business correspondents currently operate 543,472
banking outlets in villages and 102,865 in urban centres. VKI operates
35,206 for a 5.5% market share. Our channel checks suggest it is different
in several aspects: a) many of its competitors offer touchpoint, mobile or
part-time services; b) their services are often restricted to banking or
G2C; c) they have a much smaller presence in urban areas than VKI; d)
they lack technology platforms; and e) their EBITDA margins are lower due
to their restricted service offerings. VKI has brick-&-mortar stores which
offer a gamut of services. Its Internet-based Vakrangee Kendra
Management Systems also enables the quick activation of services and
monitoring of franchisees. Finally, being present in 18 states gives VKI a
head-start over the others.
Of the 199,375 touchpoints provided by CSC E-governance Services India
Ltd (CSC), a company set up by the Ministry of Electronics and Information
Technology, only about 11,900 offer banking services. All of VKI’s 40,461
franchisees offer banking services. Also, CSC allocates 90% of its revenue
to its franchisees, keeping 10%. This compares with VKI’s evolving 80:20,
explaining the difference in their margins.
Among its other rivals, FINO has been converted into a payment bank. But
FINO’s representatives only work on selected days at specific locations,
which implies part-time services. Sahaj is part of the SREI Group (SREI IN,
BUY, TP160), which provides only touchpoint services and that too,
skewed towards G2C.
Fig 37: VKI is way ahead in size and financial performance
Source: Company filings on Ministry of Corporate Affairs (MCA) website
Parameters VKI Kendra Sahaj
CSC e-
Governance FINO
centre/touchpoint centres touchpoints touchpoints touchpoints
no. of centres 37,688 65,251 199,375 30,000
as of Mar-17 Mar-17 Mar-16as per
website
FY16 Revenue (INRm) 17,089 658 3,543 1,864
FY16 EBITDA (INRm) 4,060 -143 394 268

December 7, 2017 27
Vakrangee
6. Financial Analysis
6.1 Forecast revenue growth of 3x from FY18E to FY20E Assuming a 64.5% CAGR in kendra revenue, we forecast revenue increases
to INR121.6b by FY20E from INR40b in FY17, for a 3x jump. Kendra’s
revenue share should rise to 94% from 64%, led by: a) a potential swelling
in the number of centres to 75,461 from 35,206; b) more service
activation; c) an increase in urban kendras’ revenue share to 33% from
29%, which translates into higher revenue per kendra; and d) the maturing
of 75% of its stores, up from 45% in FY17. A store becomes mature after
operating for 12 months. We model average SSSG of 8% pa. We forecast
that the share of new services such as assisted e-commerce, insurance and
logistics will surge to 49% from 14% in FY17. Correspondingly, the share of
G2C, banking and mobile/DTH top-up businesses should drop to 51% from
86%.
Fig 38: Revenue growth from FY18E
Source: Company, Maybank Kim Eng
Fig 39: Share of kendra business to reach 94%
Source: Company, Maybank Kim Eng
Fig 40: Kendra revenue to grow at a 67% CAGR over FY18-20E
Source: Company, Maybank Kim Eng
Fig 41: E-governance contributions to decline
Source: Company, Maybank Kim Eng
15%
25%
49%52%
34%
0%
12%
24%
36%
48%
60%
0
26,000
52,000
78,000
104,000
130,000
FY16 FY17 FY18E FY19E FY20E
Revenue (INRm) YoY %
54%64%
82%91% 94%
46%36%
18%9% 6%
0%
20%
40%
60%
80%
100%
FY16 FY17 FY18E FY19E FY20E
Vakrangee Kendra e-Governance projects
43%
51%
90%
68%
39%
0%
20%
40%
60%
80%
100%
0
20,000
40,000
60,000
80,000
100,000
FY16 FY17 FY18E FY19E FY20E
Kendra revenue (INRm) YoY %
0
4,000
8,000
12,000
16,000
20,000
FY16 FY17 FY18E FY19E FY20E
e-Governance projects revenue (INRm)
December 7, 2017 28
Vakrangee
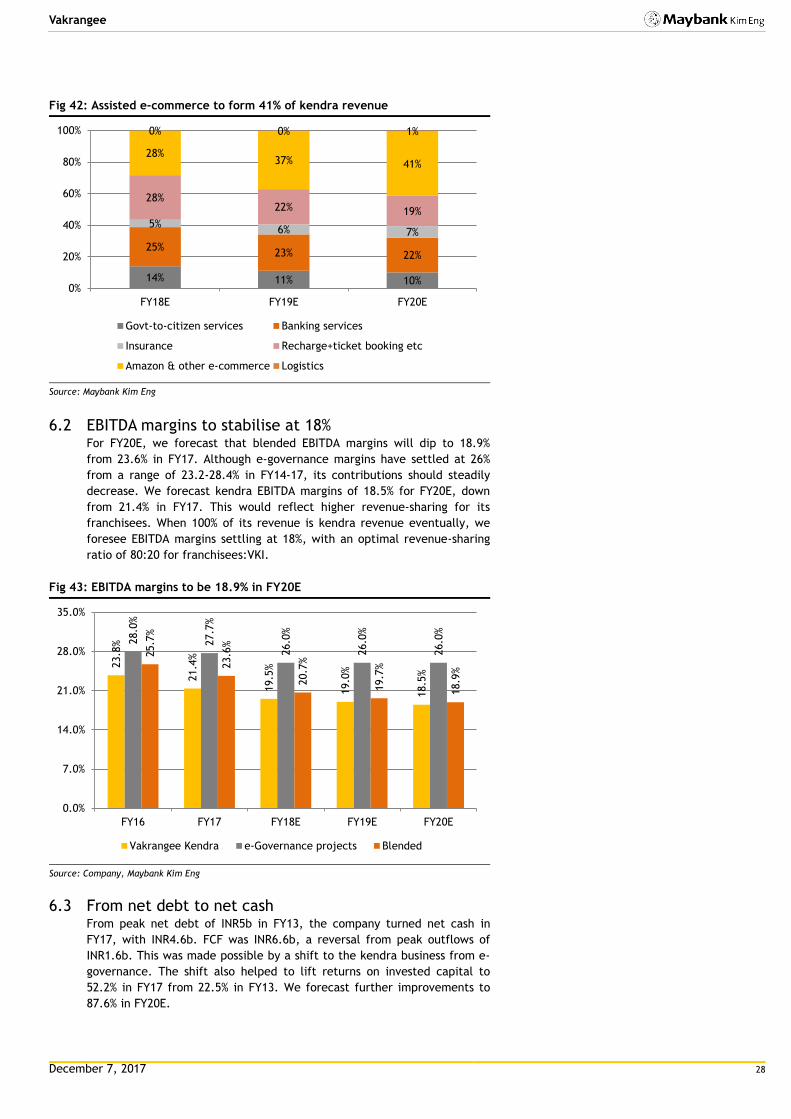
Fig 42: Assisted e-commerce to form 41% of kendra revenue
Source: Maybank Kim Eng
6.2 EBITDA margins to stabilise at 18% For FY20E, we forecast that blended EBITDA margins will dip to 18.9%
from 23.6% in FY17. Although e-governance margins have settled at 26%
from a range of 23.2-28.4% in FY14-17, its contributions should steadily
decrease. We forecast kendra EBITDA margins of 18.5% for FY20E, down
from 21.4% in FY17. This would reflect higher revenue-sharing for its
franchisees. When 100% of its revenue is kendra revenue eventually, we
foresee EBITDA margins settling at 18%, with an optimal revenue-sharing
ratio of 80:20 for franchisees:VKI.
Fig 43: EBITDA margins to be 18.9% in FY20E
Source: Company, Maybank Kim Eng
6.3 From net debt to net cash From peak net debt of INR5b in FY13, the company turned net cash in
FY17, with INR4.6b. FCF was INR6.6b, a reversal from peak outflows of
INR1.6b. This was made possible by a shift to the kendra business from e-
governance. The shift also helped to lift returns on invested capital to
52.2% in FY17 from 22.5% in FY13. We forecast further improvements to
87.6% in FY20E.
14% 11% 10%
25%23% 22%
5%6% 7%
28%22% 19%
28%37% 41%
0% 0% 1%
0%
20%
40%
60%
80%
100%
FY18E FY19E FY20E
Govt-to-citizen services Banking services
Insurance Recharge+ticket booking etc
Amazon & other e-commerce Logistics
23.8
%
21.4
%
19.5
%
19.0
%
18.5
%
28.0
%
27.7
%
26.0
%
26.0
%
26.0
%
25.7
%
23.6
%
20.7
%
19.7
%
18.9
%
0.0%
7.0%
14.0%
21.0%
28.0%
35.0%
FY16 FY17 FY18E FY19E FY20E
Vakrangee Kendra e-Governance projects Blended
December 7, 2017 29
Vakrangee
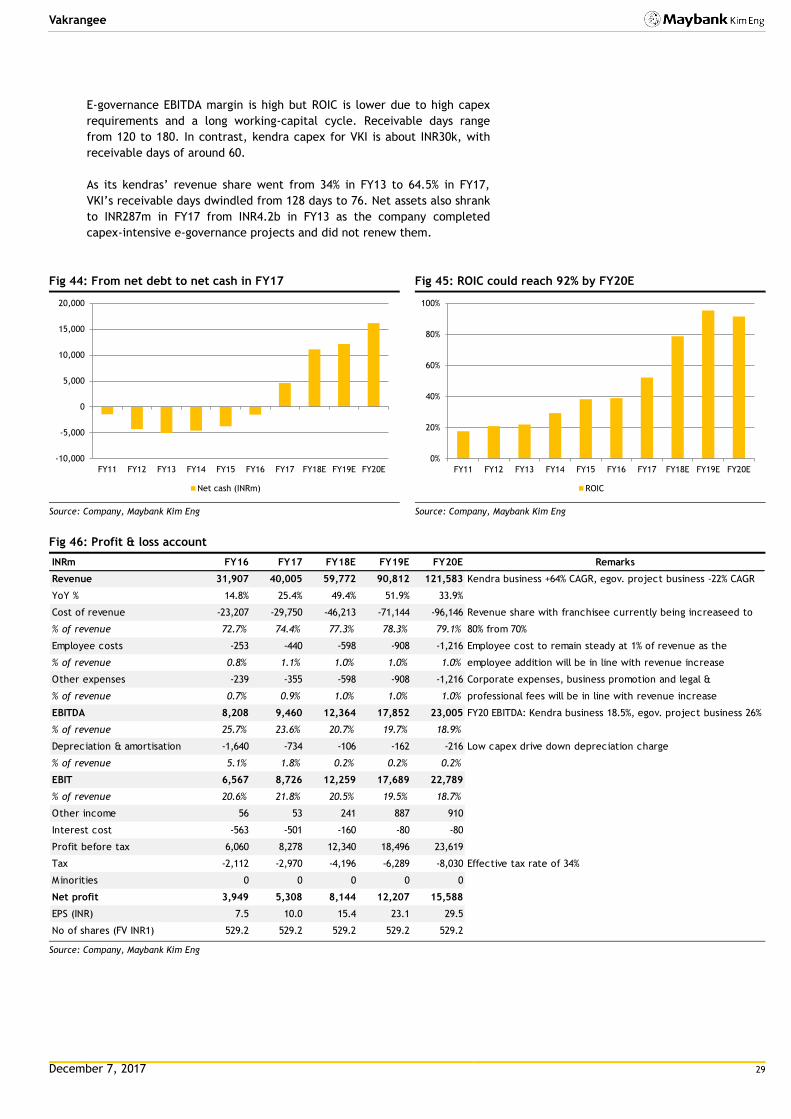
E-governance EBITDA margin is high but ROIC is lower due to high capex
requirements and a long working-capital cycle. Receivable days range
from 120 to 180. In contrast, kendra capex for VKI is about INR30k, with
receivable days of around 60.
As its kendras’ revenue share went from 34% in FY13 to 64.5% in FY17,
VKI’s receivable days dwindled from 128 days to 76. Net assets also shrank
to INR287m in FY17 from INR4.2b in FY13 as the company completed
capex-intensive e-governance projects and did not renew them.
Fig 44: From net debt to net cash in FY17
Source: Company, Maybank Kim Eng
Fig 45: ROIC could reach 92% by FY20E
Source: Company, Maybank Kim Eng
Fig 46: Profit & loss account
Source: Company, Maybank Kim Eng
-10,000
-5,000
0
5,000
10,000
15,000
20,000
FY11 FY12 FY13 FY14 FY15 FY16 FY17 FY18E FY19E FY20E
Net cash (INRm)
0%
20%
40%
60%
80%
100%
FY11 FY12 FY13 FY14 FY15 FY16 FY17 FY18E FY19E FY20E
ROIC
INRm FY16 FY17 FY18E FY19E FY20E Remarks
Revenue 31,907 40,005 59,772 90,812 121,583 Kendra business +64% CAGR, egov. project business -22% CAGR
YoY % 14.8% 25.4% 49.4% 51.9% 33.9%
Cost of revenue -23,207 -29,750 -46,213 -71,144 -96,146
% of revenue 72.7% 74.4% 77.3% 78.3% 79.1%
Employee costs -253 -440 -598 -908 -1,216
% of revenue 0.8% 1.1% 1.0% 1.0% 1.0%
Other expenses -239 -355 -598 -908 -1,216
% of revenue 0.7% 0.9% 1.0% 1.0% 1.0%
EBITDA 8,208 9,460 12,364 17,852 23,005 FY20 EBITDA: Kendra business 18.5%, egov. project business 26%
% of revenue 25.7% 23.6% 20.7% 19.7% 18.9%
Depreciation & amortisation -1,640 -734 -106 -162 -216 Low capex drive down depreciation charge
% of revenue 5.1% 1.8% 0.2% 0.2% 0.2%
EBIT 6,567 8,726 12,259 17,689 22,789
% of revenue 20.6% 21.8% 20.5% 19.5% 18.7%
Other income 56 53 241 887 910
Interest cost -563 -501 -160 -80 -80
Profit before tax 6,060 8,278 12,340 18,496 23,619
Tax -2,112 -2,970 -4,196 -6,289 -8,030 Effective tax rate of 34%
Minorities 0 0 0 0 0
Net profit 3,949 5,308 8,144 12,207 15,588
EPS (INR) 7.5 10.0 15.4 23.1 29.5
No of shares (FV INR1) 529.2 529.2 529.2 529.2 529.2
Revenue share with franchisee currently being increaseed to
80% from 70%
Employee cost to remain steady at 1% of revenue as the
employee addition will be in line with revenue increase
Corporate expenses, business promotion and legal &
professional fees will be in line with revenue increase
December 7, 2017 30
Vakrangee
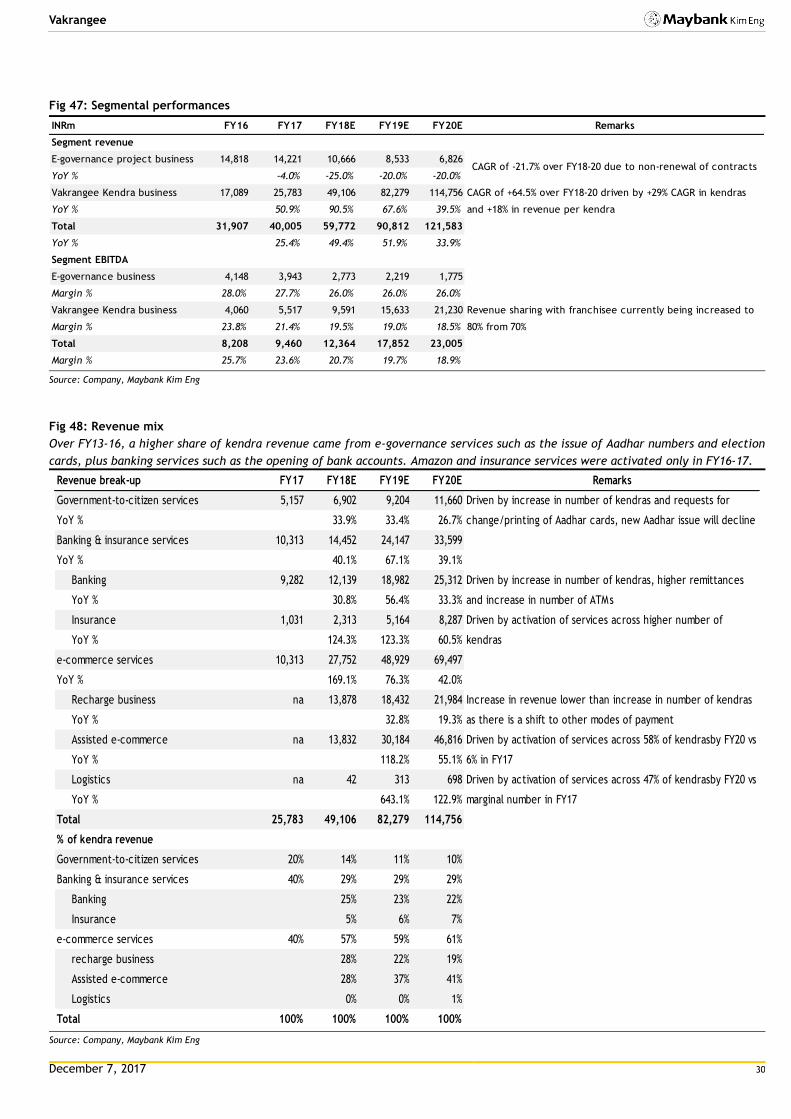
Fig 47: Segmental performances
Source: Company, Maybank Kim Eng
Fig 48: Revenue mix
Over FY13-16, a higher share of kendra revenue came from e-governance services such as the issue of Aadhar numbers and election
cards, plus banking services such as the opening of bank accounts. Amazon and insurance services were activated only in FY16-17.
Source: Company, Maybank Kim Eng
INRm FY16 FY17 FY18E FY19E FY20E Remarks
Segment revenue
E-governance project business 14,818 14,221 10,666 8,533 6,826
YoY % -4.0% -25.0% -20.0% -20.0%
Vakrangee Kendra business 17,089 25,783 49,106 82,279 114,756
YoY % 50.9% 90.5% 67.6% 39.5%
Total 31,907 40,005 59,772 90,812 121,583
YoY % 25.4% 49.4% 51.9% 33.9%
Segment EBITDA
E-governance business 4,148 3,943 2,773 2,219 1,775
Margin % 28.0% 27.7% 26.0% 26.0% 26.0%
Vakrangee Kendra business 4,060 5,517 9,591 15,633 21,230
Margin % 23.8% 21.4% 19.5% 19.0% 18.5%
Total 8,208 9,460 12,364 17,852 23,005
Margin % 25.7% 23.6% 20.7% 19.7% 18.9%
CAGR of -21.7% over FY18-20 due to non-renewal of contracts
CAGR of +64.5% over FY18-20 driven by +29% CAGR in kendras
and +18% in revenue per kendra
Revenue sharing with franchisee currently being increased to
80% from 70%
Revenue break-up FY17 FY18E FY19E FY20E Remarks
Government-to-citizen services 5,157 6,902 9,204 11,660
YoY % 33.9% 33.4% 26.7%
Banking & insurance services 10,313 14,452 24,147 33,599
YoY % 40.1% 67.1% 39.1%
Banking 9,282 12,139 18,982 25,312
YoY % 30.8% 56.4% 33.3%
Insurance 1,031 2,313 5,164 8,287
YoY % 124.3% 123.3% 60.5%
e-commerce services 10,313 27,752 48,929 69,497
YoY % 169.1% 76.3% 42.0%
Recharge business na 13,878 18,432 21,984
YoY % 32.8% 19.3%
Assisted e-commerce na 13,832 30,184 46,816
YoY % 118.2% 55.1%
Logistics na 42 313 698
YoY % 643.1% 122.9%
Total 25,783 49,106 82,279 114,756
% of kendra revenue
Government-to-citizen services 20% 14% 11% 10%
Banking & insurance services 40% 29% 29% 29%
Banking 25% 23% 22%
Insurance 5% 6% 7%
e-commerce services 40% 57% 59% 61%
recharge business 28% 22% 19%
Assisted e-commerce 28% 37% 41%
Logistics 0% 0% 1%
Total 100% 100% 100% 100%
Driven by increase in number of kendras and requests for
change/printing of Aadhar cards, new Aadhar issue will decline
Driven by increase in number of kendras, higher remittances
and increase in number of ATMs
Driven by activation of services across higher number of
kendras
Driven by activation of services across 58% of kendrasby FY20 vs
6% in FY17
Driven by activation of services across 47% of kendrasby FY20 vs
marginal number in FY17
Increase in revenue lower than increase in number of kendras
as there is a shift to other modes of payment

December 7, 2017 31
Vakrangee
Fig 49: Assumptions for Vakrangee Kendra business
Source: Company, Maybank Kim Eng
Fig 50: Balance sheet
Source: Company, Maybank Kim Eng
Fig 51: Cash flow statement
Source: Company, Maybank Kim Eng
Assumptions FY16 FY17 FY18E FY19E FY20E
Vakrangee Kendra business
Opening number of kendras 12,568 20,677 35,206 50,461 65,461
Addition during the year 8,109 14,529 16,445 16,683 12,078
Churn during the year na na -1,190 -1,683 -2,078
Closing number of kendras 20,677 35,206 50,461 65,461 75,461
Rural kendras 76% 71% 71% 69% 67%
Urban kendras 24% 29% 29% 31% 33%
Avg. rev. per kendra pm (INR) 85,914 81,647 95,537 118,297 135,721
YoY % -5.0% 17.0% 23.8% 14.7%
INRm FY16 FY17 FY18E FY19E FY20E Remarks
Cash & equivalents 1,672 6,038 11,088 12,138 16,184
Receivables 8,595 8,244 12,287 18,162 23,641 Days to decline to 62 days for FY20 vs 116 days in FY16
Inventories 5,071 4,992 2,491 3,279 3,715 Decline due to de-focus from e-gov projects business
Other current assets 4,041 3,042 433 395 371 Declining due to de-focus in e-gov. projects business
Tangible assets (net) 1,322 287 775 1,213 1,560
Other non-current assets 222 82 96 113 133
Total assets 20,923 22,684 27,170 35,300 45,603
Current liabilities 1,744 683 911 1,236 1,572
Debt 3,199 1,440 0 0 0
Deferred tax liabilities 130 0 0 0 0
Other long term liabilities 18 23 28 34 40
Shareholders' funds 15,831 20,538 26,231 34,031 43,991
Total liabilities 20,923 22,684 27,170 35,300 45,603
INRm FY16 FY17 FY18E FY19E FY20E Remarks
Profit before tax 6,060 8,278 12,340 18,496 23,619
Adjustments:
Depreciation 1,640 734 106 162 216
Tax paid -2,922 -2,945 -4,196 -6,289 -8,030
Interest paid/received 535 481 -81 -807 -830
Other non-cash items -49 66 0 0 0
Change in working capital -2,547 74 1,285 -6,312 -5,567
Cash from operations 2,719 6,687 9,454 5,251 9,407
Capex -134 -112 -593 -600 -562 Largely driven by capex of INR30,000 per new centre
Others 43 648 241 887 910
Cash from investing -90 537 -352 286 348
FCF 2,585 6,576 8,860 4,650 8,845
Debt -407 -122 -1,440 0 0
Cash from equity raised 7 1 0 0 0
Interest paid/received -563 -501 -160 -80 -80
Dividend paid incl tax -159 -796 -2,451 -4,408 -5,629 Payout ratio of 25-30% in FY18-20
Others 0 0 0 0 0
Cash from financing -1,121 -1,419 -4,051 -4,488 -5,709
Change in cash 1,507 5,806 5,051 1,049 4,046
December 7, 2017 32
Vakrangee
7. Valuation
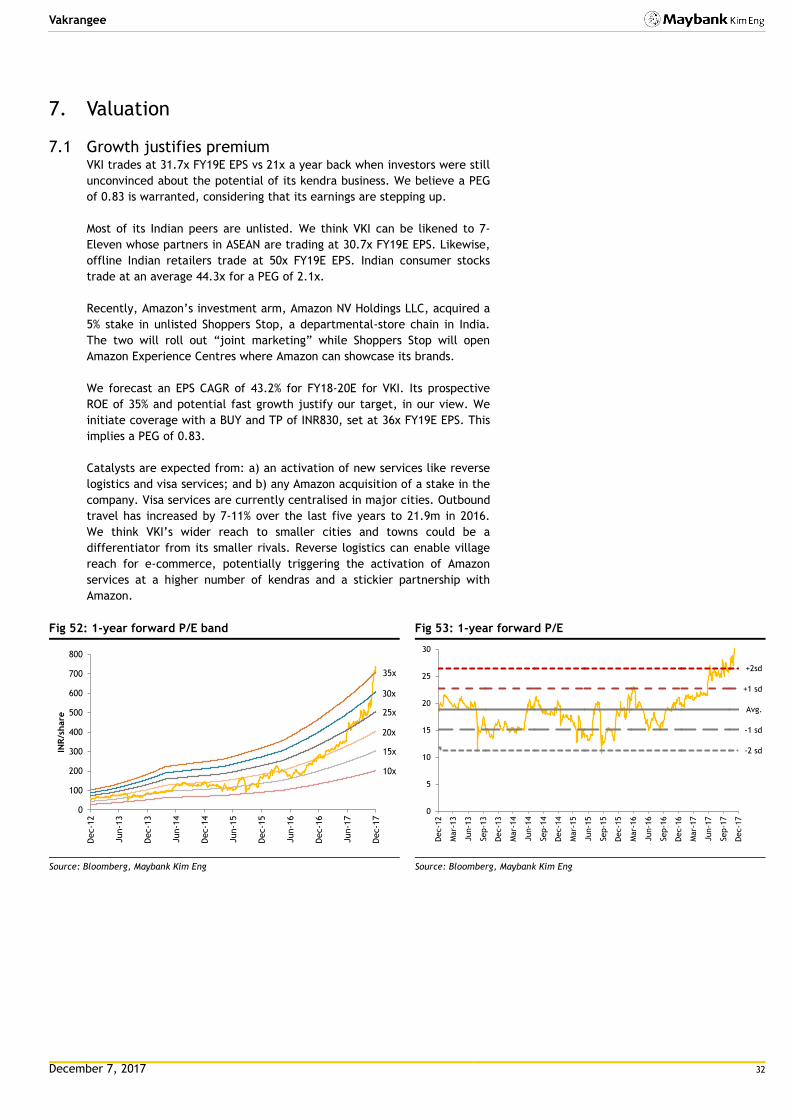
7.1 Growth justifies premium VKI trades at 31.7x FY19E EPS vs 21x a year back when investors were still
unconvinced about the potential of its kendra business. We believe a PEG
of 0.83 is warranted, considering that its earnings are stepping up.
Most of its Indian peers are unlisted. We think VKI can be likened to 7-
Eleven whose partners in ASEAN are trading at 30.7x FY19E EPS. Likewise,
offline Indian retailers trade at 50x FY19E EPS. Indian consumer stocks
trade at an average 44.3x for a PEG of 2.1x.
Recently, Amazon’s investment arm, Amazon NV Holdings LLC, acquired a
5% stake in unlisted Shoppers Stop, a departmental-store chain in India.
The two will roll out “joint marketing” while Shoppers Stop will open
Amazon Experience Centres where Amazon can showcase its brands.
We forecast an EPS CAGR of 43.2% for FY18-20E for VKI. Its prospective
ROE of 35% and potential fast growth justify our target, in our view. We
initiate coverage with a BUY and TP of INR830, set at 36x FY19E EPS. This
implies a PEG of 0.83.
Catalysts are expected from: a) an activation of new services like reverse
logistics and visa services; and b) any Amazon acquisition of a stake in the
company. Visa services are currently centralised in major cities. Outbound
travel has increased by 7-11% over the last five years to 21.9m in 2016.
We think VKI’s wider reach to smaller cities and towns could be a
differentiator from its smaller rivals. Reverse logistics can enable village
reach for e-commerce, potentially triggering the activation of Amazon
services at a higher number of kendras and a stickier partnership with
Amazon.
Fig 52: 1-year forward P/E band
Source: Bloomberg, Maybank Kim Eng
Fig 53: 1-year forward P/E
Source: Bloomberg, Maybank Kim Eng
10x
15x
20x
25x
30x
35x
0
100
200
300
400
500
600
700
800
Dec-1
2
Jun-1
3
Dec-1
3
Jun-1
4
Dec-1
4
Jun-1
5
Dec-1
5
Jun-1
6
Dec-1
6
Jun-1
7
Dec-1
7
INR
/share
Avg.
+1 sd
-1 sd
+2sd
-2 sd
0
5
10
15
20
25
30
Dec-1
2
Mar-
13
Jun-1
3
Sep-1
3
Dec-1
3
Mar-
14
Jun-1
4
Sep-1
4
Dec-1
4
Mar-
15
Jun-1
5
Sep-1
5
Dec-1
5
Mar-
16
Jun-1
6
Sep-1
6
Dec-1
6
Mar-
17
Jun-1
7
Sep-1
7
Dec-1
7

December 7, 2017 33
Vakrangee
Fig 54: Peer comparisons
Source: Bloomberg, Maybank Kim Eng
Bbg M. cap Curr CMP Rating TP ROE PEG
Company code USDm FY18E FY18E FY19E FY20E (x)
Vakrangee VKI IN 6,006 INR 732 BUY 830 35% 47.6 31.7 24.9 0.7
Government-to-citizen service provider
BLS International BLSIN IN 363 INR 228 NR NR 49% 22.1 18.6 NA 0.5
7-Eleven store operator
7-Eleven Malaysia Holdings SEM MK 473 MYR 1.56 SELL 1.24 99% 41.1 32.5 28.4 4.6
CP ALL PCL CPALL TB 19,725 THB 74 NR NR 32% 34.0 28.9 24.5 1.6
Average 66% 37.5 30.7 26.4 3.1
Offline retailers
Shoppers Stop SHOP IN 684 INR 528 NR NR 5% 135.4 49.0 28.9 -0.2
Trent TRENT IN 1,722 INR 334 NR NR 8% 89.5 59.7 44.4 1.3
Future Retail FRETAIL IN 4,010 INR 528 NR NR 22% 41.9 25.2 22.2 0.5
Dmart DMART IN 10,875 INR 1,124 NR NR 18% 90.5 66.3 51.7 1.6
Vmart VMART IN 382 INR 1,361 NR NR NA NA NA NA NA
Average 13% 89.3 50.0 36.8 1.1
Consumer-driven
Colgate CLGT IN 4,386 INR 1,040 NR NR 47% 43.7 37.6 32.0 2.5
Dabur DABUR IN 9,355 INR 343 NR NR 27% 43.2 37.6 32.8 2.9
Glaxosmithkline SKB IN 3,977 INR 6,099 NR NR 21% 36.7 32.1 28.1 2.8
Godrej Consumer GCPL IN 10,603 INR 1,004 NR NR 25% 46.6 39.3 33.7 2.5
Hindustan Unilever HUVR IN 42,806 INR 1,276 NR NR 81% 54.0 45.8 38.9 2.8
ITC ITC IN 47,543 INR 252 NR NR 25% 26.9 23.5 21.0 1.9
Jubilant Foodworks JUBI IN 1,745 INR 1,706 NR NR 16% 81.1 60.1 46.0 1.0
Nestle NEST IN 11,523 INR 7,709 NR NR 39% 59.7 51.2 43.9 2.2
Tata Global Beverages TGBL IN 2,690 INR 275 NR NR 8% 32.6 29.3 24.3 1.5
United Breweries UBBL IN 4,188 INR 1,022 NR NR 15% 72.1 60.0 50.9 1.9
United Spirits UNSP IN 7,570 INR 3,360 NR NR 25% 89.1 62.1 48.9 0.5
Asian Paints APNT IN 16,423 INR 1,104 NR NR 27% 49.4 41.5 35.5 2.7
Titan TTAN IN 10,648 INR 774 NR NR 24% 60.3 47.7 39.4 1.4
Marico MRCO IN 6,119 INR 306 NR NR 35% 45.4 38.2 32.9 2.6
Page Industries PAG IN 3,827 INR 22,128 NR NR 44% 75.2 58.4 47.9 2.4
Average 30% 54.4 44.3 37.1 2.1
P/E (x)

December 7, 2017 34
Vakrangee
8. Risks
8.1 Changes in RBI rules Business correspondents for banks are governed by ‘guidelines for
engaging business correspondents’ laid down by RBI. If there are any
changes in the rules which are detrimental to them, VKI’s business may be
affected. However, considering RBI’s impetus on financial inclusion, we do
not foresee any immediate adverse changes. As at end-Mar 2017, 90% of
banking outlets in villages was operated by correspondents, making them
an integral part of the banking system. VKI’s banking services contributed
37% to its FY17 revenue. This should dwindle to 25% by FY20E as other
services gain prominence.
8.2 Breakdown in partnership with Amazon We estimate that 45% of its incremental revenue over the next three years
will stem from its Amazon partnership. Their current partnership is valid
for five years, starting Jul 2015. Any slower-than-expected activation by
Amazon of its services could affect VKI’s growth rates. That said, over
10,000 of its kendras are now activated, up from 2,000 at the start of
FY18. Based on their momentum, we forecast that at least 58% of its
kendras will offer Amazon services by FY20E.
8.3 Delays in service activation or training Delays in the activation of new services may slow down its revenue
growth. To safeguard against this, the company has appointed block
leaders to oversee its franchisees. They must ensure that adequate
training is given and all services are offered by the franchisees to end-
customers. If the latter is not met, a franchise may be shut down.
Franchisees are also incentivised to bring in more business, reducing the
risk of delays. As size increases, training all franchisees could become
more and more difficult to execute. VKI is responding to this by roping in
dedicated training executives from its partners to co-ordinate with its
block managers. It collaborates with its partners to hold training camps
continuously at different locations.
8.4 Competition VKI’s smaller competitors include Sahaj, FINO and CSC E-Governance. Its
biggest differentiator is its 100% physical stores vs touchpoints or kiosks. A
presence in 18 states also gives VKI a headstart over its competitors, in
our view.

December 7, 2017 35
Vakrangee
9. Appendix
Fig 55: VKI’s partnerships
Source: Company
Fig 56: Selected kendras
Source: Company

December 7, 2017 36
Vakrangee
Fig 57: Their spread
Source: Company
Video of Vakrangee Kendra
http://vakrangee.in/video_2.html

December 7, 2017 37
Vakrangee
FYE 31 Mar FY16A FY17A FY18E FY19E FY20E
Key Metrics
P/E (reported) (x) 19.9 23.7 47.6 31.7 24.9
Core P/E (x) 98.1 73.0 47.6 31.7 24.9
P/BV (x) 24.5 18.9 14.8 11.4 8.8
P/NTA (x) 24.5 18.9 14.8 11.4 8.8
Net dividend yield (%) 0.2 0.3 0.5 0.9 1.2
FCF yield (%) 0.7 1.7 2.3 1.2 2.3
EV/EBITDA (x) 12.9 17.9 30.4 21.0 16.1
EV/EBIT (x) 16.2 19.4 30.7 21.2 16.3
INCOME STATEMENT (INR m)
Revenue 31,907.4 40,004.6 59,772.2 90,812.3 121,582.8
Gross profit 6,806.3 9,081.3 12,856.3 18,597.3 24,004.5
EBITDA 8,207.5 9,460.1 12,364.2 17,851.6 23,004.8
Depreciation (1,640.4) (733.9) (105.5) (162.4) (216.1)
Amortisation 0.0 0.0 0.0 0.0 0.0
EBIT 6,567.1 8,726.2 12,258.6 17,689.2 22,788.7
Net interest income /(exp) (506.8) (448.1) 81.3 806.6 829.9
Associates & JV 0.0 0.0 0.0 0.0 0.0
Exceptionals 0.0 0.0 0.0 0.0 0.0
Other pretax income 0.0 0.0 0.0 0.0 0.0
Pretax profit 6,060.3 8,278.1 12,339.9 18,495.8 23,618.6
Income tax (2,111.8) (2,970.2) (4,195.6) (6,288.6) (8,030.3)
Minorities 0.0 0.0 0.0 0.0 0.0
Discontinued operations 0.0 0.0 0.0 0.0 0.0
Reported net profit 3,948.6 5,308.0 8,144.3 12,207.3 15,588.3
Core net profit 3,948.6 5,308.0 8,144.3 12,207.3 15,588.3
Preferred Dividends 0.0 0.0 0.0 0.0 0.0
BALANCE SHEET (INR m)
Cash & Short Term Investments 1,672.0 6,037.6 11,088.4 12,137.7 16,183.9
Accounts receivable 8,595.2 8,243.6 12,286.5 18,162.5 23,641.1
Inventory 5,070.6 4,991.9 2,490.5 3,279.3 3,715.0
Property, Plant & Equip (net) 1,322.2 287.5 775.3 1,213.4 1,559.6
Intangible assets 0.0 0.0 0.0 0.0 0.0
Investment in Associates & JVs 0.0 0.0 0.0 0.0 0.0
Other assets 4,262.9 3,123.9 529.5 507.5 503.7
Total assets 20,922.9 22,684.4 27,170.3 35,300.3 45,603.4
ST interest bearing debt 2,827.5 1,440.2 (0.0) (0.0) (0.0)
Accounts payable 916.3 306.8 475.0 731.2 988.2
LT interest bearing debt 371.6 0.0 0.0 0.0 0.0
Other liabilities 976.0 400.0 464.0 538.0 624.0
Total Liabilities 5,091.4 2,146.9 938.8 1,269.3 1,612.6
Shareholders Equity 15,831.5 20,537.5 26,231.4 34,031.0 43,990.8
Minority Interest 0.0 0.0 0.0 0.0 0.0
Total shareholder equity 15,831.5 20,537.5 26,231.4 34,031.0 43,990.8
Perpetual securities 0.0 0.0 0.0 0.0 0.0
Total liabilities and equity 20,922.9 22,684.4 27,170.3 35,300.3 45,603.4
CASH FLOW (INR m)
Pretax profit 6,060.3 8,278.1 12,339.9 18,495.8 23,618.6
Depreciation & amortisation 1,640.4 733.9 105.5 162.4 216.1
Adj net interest (income)/exp 534.6 480.8 (81.3) (806.6) (829.9)
Change in working capital (2,546.6) 74.0 1,284.9 (6,312.2) (5,567.2)
Cash taxes paid (2,921.7) (2,945.0) (4,195.6) (6,288.6) (8,030.3)
Other operating cash flow (48.5) 65.7 0.0 0.0 0.0
Cash flow from operations 2,718.5 6,687.5 9,453.5 5,250.8 9,407.2
Capex (133.6) (111.6) (593.4) (600.5) (562.3)
Free cash flow 2,585.0 6,575.9 8,860.2 4,650.3 8,844.9
Dividends paid (158.7) (796.2) (2,450.6) (4,407.7) (5,628.5)
Equity raised / (purchased) 7.4 0.7 0.2 0.0 0.0
Change in Debt (406.5) (122.2) (1,440.2) 0.0 0.0
Other invest/financing cash flow (520.0) 147.6 81.3 806.6 829.9
Effect of exch rate changes (0.0) (0.0) 0.0 0.0 0.0
Net cash flow 1,507.0 5,805.8 5,050.8 1,049.2 4,046.3

December 7, 2017 38
Vakrangee
FYE 31 Mar FY16A FY17A FY18E FY19E FY20E
Key Ratios
Growth ratios (%)
Revenue growth 14.8 25.4 49.4 51.9 33.9
EBITDA growth 13.5 15.3 30.7 44.4 28.9
EBIT growth 17.6 32.9 40.5 44.3 28.8
Pretax growth 23.8 36.6 49.1 49.9 27.7
Reported net profit growth 22.7 34.4 53.4 49.9 27.7
Core net profit growth 22.7 34.4 53.4 49.9 27.7
Profitability ratios (%)
EBITDA margin 25.7 23.6 20.7 19.7 18.9
EBIT margin 20.6 21.8 20.5 19.5 18.7
Pretax profit margin 19.0 20.7 20.6 20.4 19.4
Payout ratio 16.8 19.9 25.0 30.0 30.0
DuPont analysis
Net profit margin (%) 12.4 13.3 13.6 13.4 12.8
Revenue/Assets (x) 1.5 1.8 2.2 2.6 2.7
Assets/Equity (x) 1.3 1.1 1.0 1.0 1.0
ROAE (%) 28.4 29.2 34.8 40.5 40.0
ROAA (%) 19.2 24.3 32.7 39.1 38.5
Liquidity & Efficiency
Cash conversion cycle 144.7 128.5 87.6 71.8 71.6
Days receivable outstanding 116.2 75.8 61.8 60.4 61.9
Days inventory outstanding 51.9 60.0 28.8 14.4 12.9
Days payables outstanding 23.4 7.3 3.0 3.0 3.2
Dividend cover (x) 6.0 5.0 4.0 3.3 3.3
Current ratio (x) 4.2 10.5 28.9 27.5 27.9
Leverage & Expense Analysis
Asset/Liability (x) 4.1 nm nm nm nm
Net gearing (%) (incl perps) 9.6 net cash net cash net cash net cash
Net gearing (%) (excl. perps) 9.6 net cash net cash net cash net cash
Net interest cover (x) 13.0 19.5 na na na
Debt/EBITDA (x) 0.4 0.2 nm nm nm
Capex/revenue (%) 0.4 0.3 1.0 0.7 0.5
Net debt/ (net cash) 1,527.1 (4,597.4) (11,088.5) (12,137.7) (16,184.0)
Source: Company; Maybank

December 7, 2017 39
Vakrangee
Research Offices
REGIONAL
Sadiq CURRIMBHOY
Regional Head, Research & Economics (65) 6231 5836 [email protected]
WONG Chew Hann, CA
Regional Head of Institutional Research (603) 2297 8686 [email protected]
ONG Seng Yeow
Regional Head of Retail Research
(65) 6231 5839 [email protected]
TAN Sin Mui
Director of Research (65) 6231 5849
ECONOMICS
Suhaimi ILIAS Chief Economist Malaysia | Philippines | China (603) 2297 8682 [email protected]
CHUA Hak Bin Regional Thematic Macroeconomist (65) 6231 5830 [email protected]
LEE Ju Ye Singapore (65) 6231 5844 [email protected]
Dr Zamros DZULKAFLI (603) 2082 6818 [email protected]
Ramesh LANKANATHAN (603) 2297 8685 [email protected]
FX
Saktiandi SUPAAT Head, FX Research (65) 6320 1379 [email protected]
Christopher WONG (65) 6320 1347 [email protected]
Leslie TANG (65) 6320 1378 [email protected]
Fiona LIM (65) 6320 1374 [email protected]
STRATEGY
Sadiq CURRIMBHOY
Global Strategist (65) 6231 5836 [email protected]
Willie CHAN
Hong Kong / Regional (852) 2268 0631 [email protected]
FIXED INCOME
Winson Phoon, ACA (603) 2074 7176 [email protected]
Se Tho Mun Yi (603) 2074 7606 [email protected]
MALAYSIA
WONG Chew Hann, CA Head of Research (603) 2297 8686 [email protected] • Strategy
Desmond CH’NG, ACA (603) 2297 8680 [email protected] • Banking & Finance
LIAW Thong Jung (603) 2297 8688 [email protected] • Oil & Gas Services- Regional
ONG Chee Ting, CA (603) 2297 8678 [email protected] • Plantations - Regional
Mohshin AZIZ (603) 2297 8692 [email protected] • Aviation - Regional • Petrochem
YIN Shao Yang, CPA (603) 2297 8916 [email protected] • Gaming – Regional • Media
TAN Chi Wei, CFA (603) 2297 8690 [email protected] • Power • Telcos
WONG Wei Sum, CFA (603) 2297 8679 [email protected] • Property
LEE Yen Ling (603) 2297 8691 [email protected] • Building Materials • Glove • Ports • Shipping
Ivan YAP (603) 2297 8612 [email protected] • Automotive • Semiconductor • Technology
Kevin WONG (603) 2082 6824 [email protected] • REITs • Consumer Discretionary
LIEW Wei Han
(603) 2297 8676 [email protected] • Consumer Staples
Adrian WONG
(603) 2297 8675 [email protected] • Constructions • Healthcare
Jade TAM
(603) 2297 8687 [email protected] • Media • Building Materials
Mohd Hafiz Hassan (603) 2082 6819 [email protected] • Small & Mid Caps
TEE Sze Chiah Head of Retail Research (603) 2082 6858 [email protected]
Nik Ihsan Raja Abdullah, MSTA, CFTe (603) 2297 8694 [email protected]
SINGAPORE
Neel SINHA Head of Research (65) 6231 5838 [email protected] • Strategy • SMID Caps – Regional
CHUA Su Tye (65) 6231 5842 [email protected] • REITs
Derrick HENG, CFA (65) 6231 5843 [email protected] • Property • REITs (Office)
Luis HILADO (65) 6231 5848 [email protected] • Telcos
John CHEONG, CFA
(65) 6231 5845 [email protected] • Small & Mid Caps • Healthcare • Transport
NG Li Hiang (65) 6231 5840 [email protected] • Banks
HONG KONG / CHINA
Christopher WONG (852) 2268 0652 [email protected] • HK & China Properties
Jacqueline KO, CFA (852) 2268 0633 [email protected] • Consumer Staples & Durables
Ka Leong LO, CFA (852) 2268 0630 [email protected] • Consumer Discretionary & Auto
Mitchell KIM (852) 2268 0634 [email protected] • Internet & Telcos
Ning MA, CFA (852) 2268 0672 [email protected] • Insurance
Ricky NG, CFA (852) 2268 0689 [email protected] • Regional Renewables • HK & China Properties
Sonija LI, CFA, FRM (852) 2268 0641 [email protected] • Gaming
Stefan CHANG, CFA (852) 2268 0675 [email protected] • Technology – Regional
Bonny WENG (852) 2268 0644 [email protected] • Technology – Regional
Tony REN, CFA (852) 2268 0640 [email protected] • Healthcare & Pharmaceutical
INDIA
Jigar SHAH Head of Research
(91) 22 6623 2632 [email protected]
• Strategy • Oil & Gas • Automobile • Cement
Vishal MODI
(91) 22 6623 2607 [email protected]
• Banking & Financials
Neerav DALAL
(91) 22 6623 2606 [email protected]
• Software Technology • Telcos
Vishal PERIWAL
(91) 22 6623 2605 [email protected]
• Infrastructure
INDONESIA
Isnaputra ISKANDAR Head of Research (62) 21 8066 8680 [email protected] • Strategy • Metals & Mining • Cement
Rahmi MARINA (62) 21 8066 8689 [email protected] • Banking & Finance
Aurellia SETIABUDI (62) 21 8066 8691 [email protected] • Property
Janni ASMAN (62) 21 8066 8687 [email protected] • Cigarette • Healthcare • Retail
Adhi TASMIN (62) 21 8066 8694 [email protected] • Plantations
PHILIPPINES
Minda OLONAN Head of Research (63) 2 849 8840 [email protected] • Strategy
Katherine TAN (63) 2 849 8843 [email protected] • Banks • Construction
Luis HILADO (65) 6231 5848 [email protected] • Telcos
THAILAND
Maria LAPIZ Head of Institutional Research Dir (66) 2257 0250 | (66) 2658 6300 ext 1399 [email protected] • Strategy • Consumer • Materials • Ind. Estates • Oil & Gas • Telcos
Sittichai DUANGRATTANACHAYA (66) 2658 6300 ext 1393 [email protected] • Services Sector • Transport • Property • Telcos
Tanawat RUENBANTERNG (66) 2658 6300 ext 1394 [email protected] • Banks & Diversified Financials
Ornmongkol TANTITANATORN (66) 2658 6300 ext 1395 [email protected] • Oil & Gas
Sukit UDOMSIRIKUL Head of Retail Research (66) 2658 5000 ext 5090 [email protected]
Ekachai TARAPORNTIP Deputy Head 66) 2658 5000 ext 1530 [email protected]
Surachai PRAMUALCHAROENKIT (66) 2658 5000 ext 1470 [email protected] • Auto • Conmat • Contractor • Steel
Suttatip PEERASUB (66) 2658 5000 ext 1430 [email protected] • Media • Commerce
Sutthichai KUMWORACHAI (66) 2658 5000 ext 1400 [email protected] • Energy • Petrochem
Termporn TANTIVIVAT (66) 2658 5000 ext 1520 [email protected] • Property
Jaroonpan WATTANAWONG (66) 2658 5000 ext 1404 [email protected] • Transportation • Small cap
Poonpat CHAIKUMHAN, CFA (66) 2658 5000 ext 1511 [email protected] • Electronics • ICT
Sorrabhol VIRAMETEEKUL Head of Digital Research (66) 2658 5000 ext 1550 [email protected] • Food, Transportation
Wijit ARAYAPISIT (66) 2658 5000 ext 1450 [email protected] • Strategist
VIETNAM
LE Hong Lien, ACCA Head of Institutional Research (84) 8 44 555 888 x 8181 [email protected] • Strategy • Consumer • Diversified
THAI Quang Trung, CFA, Deputy Head, Institutional Research (84) 8 44 555 888 x 8180 [email protected] • Real Estate • Construction • Materials
LE Nguyen Nhat Chuyen (84) 8 44 555 888 x 8082 [email protected] • Oil & Gas
NGUYEN Thi Ngan Tuyen, Head of Retail Research (84) 8 44 555 888 x 8081 [email protected] • Food & Beverage • Oil&Gas • Banking
TRUONG Quang Binh, Deputy Head, Retail Research (84) 4 44 555 888 x 8087 [email protected] • Rubber Plantation • Tyres and Tubes • Oil&Gas
TRINH Thi Ngoc Diep (84) 4 44 555 888 x 8208 [email protected] • Technology • Utilities • Construction
NGUYEN Thi Sony Tra Mi (84) 8 44 555 888 x 8084 [email protected] • Port Operation • Pharmaceutical • Food & Beverage
NGUYEN Thanh Lam (84) 4 44 555 888 x 8086 [email protected] • Technical Analysis

December 7, 2017 40
Vakrangee
APPENDIX I: TERMS FOR PROVISION OF REPORT, DISCLAIMERS AND DISCLOSURES
DISCLAIMERS This research report is prepared for general circulation and for information purposes only and under no circumstances should it be considered or intended as an offer to sell or a solicitation of an offer to buy the securities referred to herein. Investors should note that values of such securities, if any, may fluctuate and that each security’s price or value may rise or fall. Opinions or recommendations contained herein are in form of technical ratings and fundamental ratings. Technical ratings may differ from fundamental ratings as technical valuations apply different methodologies and are purely based on price and volume-related information extracted from the relevant jurisdiction’s stock exchange in the equity analysis. Accordingly, investors’ returns may be less than the original sum invested. Past performance is not necessarily a guide to future performance. This report is not intended to provide personal investment advice and does not take into account the specific investment objectives, the financial situation and the particular needs of persons who may receive or read this report. Investors should therefore seek financial, legal and other advice regarding the appropriateness of investing in any securities or the investment strategies discussed or recommended in this report.
The information contained herein has been obtained from sources believed to be reliable but such sources have not been independently verified by Maybank Investment Bank Berhad, its subsidiary and affiliates (collectively, “MKE”) and consequently no representation is made as to the accuracy or completeness of this report by MKE and it should not be relied upon as such. Accordingly, MKE and its officers, directors, associates, connected parties and/or employees (collectively, “Representatives”) shall not be liable for any direct, indirect or consequential losses or damages that may arise from the use or reliance of this report. Any information, opinions or recommendations contained herein are subject to change at any time, without prior notice.
This report may contain forward looking statements which are often but not always identified by the use of words such as “anticipate”, “believe”, “estimate”, “intend”, “plan”, “expect”, “forecast”, “predict” and “project” and statements that an event or result “may”, “will”, “can”, “should”, “could” or “might” occur or be achieved and other similar expressions. Such forward looking statements are based on assumptions made and information currently available to us and are subject to certain risks and uncertainties that could cause the actual results to differ materially from those expressed in any forward looking statements. Readers are cautioned not to place undue relevance on these forward-looking statements. MKE expressly disclaims any obligation to update or revise any such forward looking statements to reflect new information, events or circumstances after the date of this publication or to reflect the occurrence of unanticipated events.
MKE and its officers, directors and employees, including persons involved in the preparation or issuance of this report, may, to the extent permitted by law, from time to time participate or invest in financing transactions with the issuer(s) of the securities mentioned in this report, perform services for or solicit business from such issuers, and/or have a position or holding, or other material interest, or effect transactions, in such securities or options thereon, or other investments related thereto. In addition, it may make markets in the securities mentioned in the material presented in this report. One or more directors, officers and/or employees of MKE may be a director of the issuers of the securities mentioned in this report to the extent permitted by law.
This report is prepared for the use of MKE’s clients and may not be reproduced, altered in any way, transmitted to, copied or distributed to any other party in whole or in part in any form or manner without the prior express written consent of MKE and MKE and its Representatives accepts no liability whatsoever for the actions of third parties in this respect.
This report is not directed to or intended for distribution to or use by any person or entity who is a citizen or resident of or located in any locality, state, country or other jurisdiction where such distribution, publication, availability or use would be contrary to law or regulation. This report is for distribution only under such circumstances as may be permitted by applicable law. The securities described herein may not be eligible for sale in all jurisdictions or to certain categories of investors. Without prejudice to the foregoing, the reader is to note that additional disclaimers, warnings or qualifications may apply based on geographical location of the person or entity receiving this report.
Malaysia Opinions or recommendations contained herein are in the form of technical ratings and fundamental ratings. Technical ratings may differ from fundamental ratings as technical valuations apply different methodologies and are purely based on price and volume-related information extracted from Bursa Malaysia Securities Berhad in the equity analysis.
Singapore This report has been produced as of the date hereof and the information herein may be subject to change. Maybank Kim Eng Research Pte. Ltd. (“Maybank KERPL”) in Singapore has no obligation to update such information for any recipient. For distribution in Singapore, recipients of this report are to contact Maybank KERPL in Singapore in respect of any matters arising from, or in connection with, this report. If the recipient of this report is not an accredited investor, expert investor or institutional investor (as defined under Section 4A of the Singapore Securities and Futures Act), Maybank KERPL shall be legally liable for the contents of this report, with such liability being limited to the extent (if any) as permitted by law.
Thailand Except as specifically permitted, no part of this presentation may be reproduced or distributed in any manner without the prior written permission of Maybank Kim Eng Securities (Thailand) Public Company Limited. Maybank Kim Eng Securities (Thailand) Public Company Limited (“MBKET”) accepts no liability whatsoever for the actions of third parties in this respect.
Due to different characteristics, objectives and strategies of institutional and retail investors, the research reports of MBKET Institutional and Retail Research Department may differ in either recommendation or target price, or both. MBKET Retail Research is intended for retail investors (http://kelive.maybank-ke.co.th) while Maybank Kim Eng Institutional Research is intended only for institutional investors based outside Thailand only.
The disclosure of the survey result of the Thai Institute of Directors Association (“IOD”) regarding corporate governance is made pursuant to the policy of the Office of the Securities and Exchange Commission. The survey of the IOD is based on the information of a company listed on the Stock Exchange of Thailand and the market for Alternative Investment disclosed to the public and able to be accessed by a general public investor. The result, therefore, is from the perspective of a third party. It is not an evaluation of operation and is not based on inside information. The survey result is as of the date appearing in the Corporate Governance Report of Thai Listed Companies. As a result, the survey may be changed after that date. MBKET does not confirm nor certify the accuracy of such survey result.
The disclosure of the Anti-Corruption Progress Indicators of a listed company on the Stock Exchange of Thailand, which is assessed by Thaipat Institute, is made in order to comply with the policy and sustainable development plan for the listed companies of the Office of the Securities and Exchange Commission. Thaipat Institute made this assessment based on the information received from the listed company, as stipulated in the form for the assessment of Anti-corruption which refers to the Annual Registration Statement (Form 56-1), Annual Report (Form 56-2), or other relevant documents or reports of such listed company. The assessment result is therefore made from the perspective of Thaipat Institute that is a third party. It is not an assessment of operation and is not based on any inside information. Since this assessment is only the assessment result as of the date appearing in the assessment result, it may be changed after that date or when there is any change to the relevant information. Nevertheless, MBKET does not confirm, verify, or certify the accuracy and completeness of the assessment result.
US This third-party research report is distributed in the United States (“US”) to Major US Institutional Investors (as defined in Rule 15a-6 under the Securities Exchange Act of 1934, as amended) only by Maybank Kim Eng Securities USA Inc (“Maybank KESUSA”), a broker-dealer registered in the US (registered under Section 15 of the Securities Exchange Act of 1934, as amended). All responsibility for the distribution of this report by Maybank KESUSA in the US shall be borne by Maybank KESUSA. This report is not directed at you if MKE is prohibited or restricted by any legislation or regulation in any jurisdiction from making it available to you. You should satisfy yourself before reading it that Maybank KESUSA is permitted to provide research material concerning investments to you under relevant legislation and regulations. All U.S. persons receiving and/or accessing this report and wishing to effect transactions in any security mentioned within must do so with: Maybank Kim Eng Securities USA Inc. 777 Third Avenue 21st Floor New York, New York 1- (212) 688-8886 and not with, the issuer of this report.

December 7, 2017 41
Vakrangee
Disclosure of Interest
Malaysia: MKE and its Representatives may from time to time have positions or be materially interested in the securities referred to herein and may further act as market maker or may have assumed an underwriting commitment or deal with such securities and may also perform or seek to perform investment banking services, advisory and other services for or relating to those companies.
Singapore: As of 7 December 2017, Maybank KERPL and the covering analyst do not have any interest in any companies recommended in this research report.
Thailand: MBKET may have a business relationship with or may possibly be an issuer of derivative warrants on the securities /companies mentioned in the research report. Therefore, Investors should exercise their own judgment before making any investment decisions. MBKET, its associates, directors, connected parties and/or employees may from time to time have interests and/or underwriting commitments in the securities mentioned in this report.
Hong Kong: As of 7 December 2017, KESHK and the authoring analyst do not have any interest in any companies recommended in this research report.
India: As of 7 December 2017, and at the end of the month immediately preceding the date of publication of the research report, KESI, authoring analyst or their associate / relative does not hold any financial interest or any actual or beneficial ownership in any shares or having any conflict of interest in the subject companies except as otherwise disclosed in the research report. In the past twelve months KESI and authoring analyst or their associate did not receive any compensation or other benefits from the subject companies or third party in connection with the research report on any account what so ever except as otherwise disclosed in the research report.
MKE may have, within the last three years, served as manager or co-manager of a public offering of securities for, or currently may make a primary market in issues of, any or all of the entities mentioned in this report or may be providing, or have provided within the previous 12 months, significant advice or investment services in relation to the investment concerned or a related investment and may receive compensation for the services provided from the companies covered in this report.
OTHERS
Analyst Certification of Independence
The views expressed in this research report accurately reflect the analyst’s personal views about any and all of the subject securities or issuers; and no part of the research analyst’s compensation was, is or will be, directly or indirectly, related to the specific recommendations or views expressed in the report.
Reminder
Structured securities are complex instruments, typically involve a high degree of risk and are intended for sale only to sophisticated investors who are capable of understanding and assuming the risks involved. The market value of any structured security may be affected by changes in economic, financial and political factors (including, but not limited to, spot and forward interest and exchange rates), time to maturity, market conditions and volatility and the credit quality of any issuer or reference issuer. Any investor interested in purchasing a structured product should conduct its own analysis of the product and consult with its own professional advisers as to the risks involved in making such a purchase.
No part of this material may be copied, photocopied or duplicated in any form by any means or redistributed without the prior consent of MKE.
Definition of Ratings
Maybank Kim Eng Research uses the following rating system
BUY Return is expected to be above 10% in the next 12 months (excluding dividends)
HOLD Return is expected to be between - 10% to +10% in the next 12 months (excluding dividends)
SELL Return is expected to be below -10% in the next 12 months (excluding dividends)
Applicability of Ratings
The respective analyst maintains a coverage universe of stocks, the list of which may be adjusted according to needs. Investment ratings are only applicable to the stocks which form part of the coverage universe. Reports on companies which are not part of the coverage do not carry investment ratings as we do not actively follow developments in these companies.
UK This document is being distributed by Maybank Kim Eng Securities (London) Ltd (“Maybank KESL”) which is authorized and regulated, by the Financial Conduct Authority and is for Informational Purposes only. This document is not intended for distribution to anyone defined as a Retail Client under the Financial Services and Markets Act 2000 within the UK. Any inclusion of a third party link is for the recipients convenience only, and that the firm does not take any responsibility for its comments or accuracy, and that access to such links is at the individuals own risk. Nothing in this report should be considered as constituting legal, accounting or tax advice, and that for accurate guidance recipients should consult with their own independent tax advisers.
DISCLOSURES Legal Entities Disclosures Malaysia: This report is issued and distributed in Malaysia by Maybank Investment Bank Berhad (15938- H) which is a Participating Organization of Bursa Malaysia Berhad and a holder of Capital Markets and Services License issued by the Securities Commission in Malaysia. Singapore: This report is distributed in Singapore by Maybank KERPL (Co. Reg No 198700034E) which is regulated by the Monetary Authority of Singapore. Indonesia: PT Maybank Kim Eng Securities (“PTMKES”) (Reg. No. KEP-251/PM/1992) is a member of the Indonesia Stock Exchange and is regulated by the Financial Services Authority (Indonesia). Thailand: MBKET (Reg. No.0107545000314) is a member of the Stock Exchange of Thailand and is regulated by the Ministry of Finance and the Securities and Exchange Commission. Philippines: Maybank ATRKES (Reg. No.01-2004-00019) is a member of the Philippines Stock Exchange and is regulated by the Securities and Exchange Commission. Vietnam: Maybank Kim Eng Securities Limited (License Number: 117/GP-UBCK) is licensed under the State Securities Commission of Vietnam. Hong Kong: KESHK (Central Entity No AAD284) is regulated by the Securities and Futures Commission. India: Kim Eng Securities India Private Limited (“KESI”) is a participant of the National Stock Exchange of India Limited and the Bombay Stock Exchange and is regulated by Securities and Exchange Board of India (“SEBI”) (Reg. No. INZ000010538). KESI is also registered with SEBI as Category 1 Merchant Banker (Reg. No. INM 000011708) and as Research Analyst (Reg No: INH000000057) US: Maybank KESUSA is a member of/ and is authorized and regulated by the FINRA – Broker ID 27861. UK: Maybank KESL (Reg No 2377538) is authorized and regulated by the Financial Conduct Authority.

December 7, 2017 42
Vakrangee
Malaysia Maybank Investment Bank Berhad
(A Participating Organisation of
Bursa Malaysia Securities Berhad)
33rd Floor, Menara Maybank,
100 Jalan Tun Perak,
50050 Kuala Lumpur
Tel: (603) 2059 1888;
Fax: (603) 2078 4194
Singapore Maybank Kim Eng Securities Pte Ltd
Maybank Kim Eng Research Pte Ltd
50 North Canal Road
Singapore 059304
Tel: (65) 6336 9090
London Maybank Kim Eng Securities
(London) Ltd
PNB House
77 Queen Victoria Street
London EC4V 4AY, UK
Tel: (44) 20 7332 0221
Fax: (44) 20 7332 0302
New York Maybank Kim Eng Securities USA
Inc
777 Third Avenue, 21st Floor
New York, NY 10017, U.S.A.
Tel: (212) 688 8886
Fax: (212) 688 3500
Stockbroking Business:
Level 8, Tower C, Dataran Maybank,
No.1, Jalan Maarof
59000 Kuala Lumpur
Tel: (603) 2297 8888
Fax: (603) 2282 5136
Hong Kong Kim Eng Securities (HK) Ltd
Level 30,
Three Pacific Place,
1 Queen’s Road East,
Hong Kong
Tel: (852) 2268 0800
Fax: (852) 2877 0104
Indonesia PT Maybank Kim Eng Securities
Sentral Senayan III, 22nd Floor
Jl. Asia Afrika No. 8
Gelora Bung Karno, Senayan
Jakarta 10270, Indonesia
Tel: (62) 21 2557 1188
Fax: (62) 21 2557 1189
India Kim Eng Securities India Pvt Ltd
2nd Floor, The International,
16, Maharishi Karve Road,
Churchgate Station,
Mumbai City - 400 020, India
Tel: (91) 22 6623 2600
Fax: (91) 22 6623 2604
Philippines Maybank ATR Kim Eng Securities Inc.
17/F, Tower One & Exchange Plaza
Ayala Triangle, Ayala Avenue
Makati City, Philippines 1200
Tel: (63) 2 849 8888
Fax: (63) 2 848 5738
Thailand Maybank Kim Eng Securities
(Thailand) Public Company Limited
999/9 The Offices at Central World,
20th - 21st Floor,
Rama 1 Road Pathumwan,
Bangkok 10330, Thailand
Tel: (66) 2 658 6817 (sales)
Tel: (66) 2 658 6801 (research)
Vietnam Maybank Kim Eng Securities Limited
4A-15+16 Floor Vincom Center Dong
Khoi, 72 Le Thanh Ton St. District 1
Ho Chi Minh City, Vietnam
Tel : (84) 844 555 888
Fax : (84) 8 38 271 030
Saudi Arabia In association with
Anfaal Capital
Villa 47, Tujjar Jeddah
Prince Mohammed bin Abdulaziz
Street P.O. Box 126575
Jeddah 21352
Tel: (966) 2 6068686
Fax: (966) 26068787
South Asia Sales Trading Kevin Foy
Regional Head Sales Trading
Tel: (65) 6636-3620
US Toll Free: 1-866-406-7447
North Asia Sales Trading Andrew Lee
Tel: (852) 2268 0283
US Toll Free: 1 877 837 7635
Malaysia Joann Lim [email protected] Tel: (603) 2717 5166
Thailand Tanasak Krishnasreni [email protected] Tel: (66)2 658 6820
Indonesia Harianto Liong [email protected] Tel: (62) 21 2557 1177
London Mark Howe [email protected] Tel: (44) 207-332-0221
New York James Lynch [email protected] Tel: (212) 688 8886
India Sanjay Makhija [email protected] Tel: (91)-22-6623-2629
Vietnam Patrick Mitchell
Tel: (84)-8-44-555-888 x8080
Philippines Keith Roy [email protected] Tel: (63) 2 848-5288
www.maybank-ke.com | www.maybank-keresearch.com


![v/;k; & 6scert.cg.gov.in/dedodldistance201213...gSaA ';ke dh cksyh lkQ ugha gS] igyh ckj vki mldh ckr ugha le> ldrs ysfdu tc vki ,d ckj mlls ckr djus yxs rks vki mldh cksyh le> ldrs](https://img.dokumen.tips/doc/110x75/5ff9cdb6270f0c2b9a0b73b1/vk-gsaa-ke-dh-cksyh-lkq-ugha-gs-igyh-ckj-vki-mldh-ckr-ugha-le.jpg)


![Ambition Academy Behal AMBITIO N ACADEMY BEHALpolicejobnews.in/wp-content/uploads/2018/08/TEST-14.pdf · ftl fnu vki [kqn ij gl ldks] le> tkvks vki lQy gksrs tk jgs gksA AMBITION](https://img.dokumen.tips/doc/110x75/5cad474b88c9932b7a8da787/ambition-academy-behal-ambitio-n-academy-ftl-fnu-vki-kqn-ij-gl-ldks-le-tkvks.jpg)