Embed Size (px)
Citation preview

www.parliament.uk/commons-library | intranet.parliament.uk/commons-library | [email protected] | @commonslibrary
BRIEFING PAPERNumber 7851, 11 January 2019
Statistics on UK-EU trade By Matthew Ward
Contents: 1. Trade in 20172. Recent trends3. Trade between EU &
Scotland, Wales, NorthernIreland & English regions
4. Tariffs5. Appendix, trade with
individual EU countries, 20176. Appendix: Trade with EU and
non-EU countries, 1999-2017
2 Statistics on UK-EU trade
Contents 1. Trade in 2017 4 1.1 Overview 4 1.2 Trade with individual EU countries 5 1.3 Trade in goods 6 1.4 Trade in services 7
2. Recent trends 8 2.1 The Rotterdam effect 9
3. Trade between EU & Scotland, Wales, Northern Ireland & English regions 113.1 Exports 11 3.2 Imports 12
4. Tariffs 13
5. Appendix, trade with individual EU countries, 2017 14
6. Appendix: Trade with EU and non-EU countries, 1999-2017 15
Cover page image copyright: Flagging support by Dave Kellam. Licensed under CC BY 2.0 / image cropped.

0%
10%
20%
30%
40%
50%
60%
EU USA
Exports Imports
UK trade in goods and services with EUand USA compared, 2017 (%)
-150-100
-500
50100150200250300350400
Goods Services All trade
Exports Imports Balance
UK trade with the EU, 2017 (£ billions)
0%
10%
20%
30%
40%
50%
60%
70%
1999 2002 2005 2008 2011 2014 2017
Taken as a bloc, the EU is the UK's largest trading partner.In 2017 the EU accounted for 44% of UK exports
and 53% imports.
Looking at individual countries, the the USA is
the UK largest trading partner, accounting for
just under a fifth of UK exports and just over
10% of imports in 2017.
In 2017, the UK recorded an overall trade deficit with the EU of -£67 billion.A surplus of £28 billion on trade in services was
outweighed by a deficit of -£95 billion on trade
in goods.
The UK recorded an overall trade surplus with
non-EU countries - a surplus in trade in services
outweighed a deficit in trade in goods.
The share of UK exports accounted for by the EU has generally fallen over time.In 2002, UK exports to the EU accounted for
55% of all exports; this had fallen to 43% in
2016.
The share of all UK imports accounted for by
the EU fell from a high of 58% in 2002 to a low
of 51% in 2011.
44%
18%
53%
11%0%
10%
20%
30%
40%
50%
60%
EU USA
Exports Imports
UK trade in goods and services with EUand USA compared, 2017 (%)
-150-100
-500
50100150200250300350400
Goods Services All trade
Exports Imports Balance
UK trade with the EU, 2017 (£ billions)
0%
10%
20%
30%
40%
50%
60%
70%
1999 2002 2005 2008 2011 2014 2017
Share of UK trade with the EU, 1999-2017 (% total trade)
Imports
Exports
UK trade with the European Union: a summary

4 Statistics on UK-EU trade
1. Trade in 2017
1.1 Overview In 2017:
• The UK exported £274 billion of goods and services to other EUmember states. This is equivalent to 44.5% of total UK exports.
• Goods and services imports from the EU were worth £342 billion(55.5% of the total) in 2017.
• The UK had a trade deficit of -£67 billion with the EU but asurplus of £41 billion with non-EU countries.
• The UK recorded a deficit in goods with both the EU and non-EUcountries, but a trade surplus in services with both the EU andnon-EU countries.
• The EU accounted for 48% of UK goods exports and 40% ofservices exports; 54% of imported goods and 49% of importedservices were imported from the EU.1
1 All data calculated from the ONS Pink Book 2018, section 9, Geographical breakdown of the current account, Table 9.3, July 2018
UK trade with EU and non-EU countries 2017Goods and services
Balance £ billion % £ billion % £ billion
EU 274.0 44.5% 341.0 53.1% -67.0Non-EU 341.9 55.5% 300.8 46.9% 41.1
Total 615.9 100% 641.8 100% -25.9Source: ONS, Pink Book
Exports Imports
UK trade in goods and services with EU and non-EU countries, 2017£ billions
Source: ONS, Pink Book
-200
-100
0
100
200
300
400
500
600
700
EU Non-EU World
Exports Imports Balance

5 Commons Library Briefing, 11 January 2019
1.2 Trade with individual EU countries The graph below shows UK trade with each of the other 27 EU member states.
In 2017:
• The UK had a trade deficit with 17 of these countries, a surpluswith 4 and was broadly in balance with 5.
• The UK’s largest EU trade surplus was with Ireland (£12 billion)while its largest deficit was with Germany (£21 billion).
The Appendix at the end of this note shows data on UK trade with individual EU member states in 2017.
UK trade surplus/deficit with EU member states, 2017 £ billions, goods and services
Source: ONS
-25 -15 -5 5 15 25
GermanySpain
BelgiumNetherlands
PolandItaly
PortugalCzech Republic
GreeceSlovak Republic
AustriaHungaryRomania
FranceCroatiaCyprusFinland
BulgariaLatvia
LithuaniaMalta
SloveniaEstonia
DenmarkLuxembourg
SwedenIreland

6 Statistics on UK-EU trade
1.3 Trade in goods In 2017, road vehicles were the UK’s single largest export to the EU, valued at £18 billion, 11% of all UK goods exports to the EU and 45% of all UK exports of road vehicles.
Other British goods exports to the EU included petroleum and petroleum products, valued at £15 billion (9% of goods exports to the EU) and medicinal and pharmaceutical products valued at £13 billion (8% of all goods exports to the EU).
In 2017, road vehicles were also the UK’s single largest import from the EU, valued at £47 billion, 18% of all UK goods imports from the EU and 83% of all UK imports of road vehicles.
Other British goods imports from the EU included medicinal and pharmaceutical products, valued at £20 billion (8% of goods imports from the EU) and electrical machinery and appliances valued at £20 billion (8% of all goods exports from the EU).
UK goods exports to the EU, 2017£ billions % of total
Road vehicles 18.3 11.2%Petroleum, petroleum products 15.0 9.2%Medicinal & pharmaceutical products 12.8 7.8%Other transport equipment 8.8 5.4%Miscellaneous manufactured articles 8.3 5.1%Electrical machinery & appliances 6.4 3.9%General industrial machinery 6.4 3.9%Power generating machinery 6.2 3.8%Articles of apparel & clothing accessories 5.3 3.2%Organic chemicals 4.6 2.8%Source: HMRC, UK Trade Info
UK goods imports from the EU, 2017£ billions % of total
Road vehicles 46.8 18.1%Medicinal & pharmaceutical products 20.3 7.9%Electrical machinery & appliances 11.5 4.4%Miscellaneous manufactured articles 10.5 4.1%Telecomms & sound recording equipment 9.9 3.8%General industrial machinery 9.8 3.8%Power generating machinery 7.8 3.0%Office machines & adp machines 7.4 2.9%Vegetables & fruit 6.9 2.7%Petroleum, petroleum products 6.8 2.6%Source: HMRC, UK Trade Info
7 Commons Library Briefing, 11 January 2019
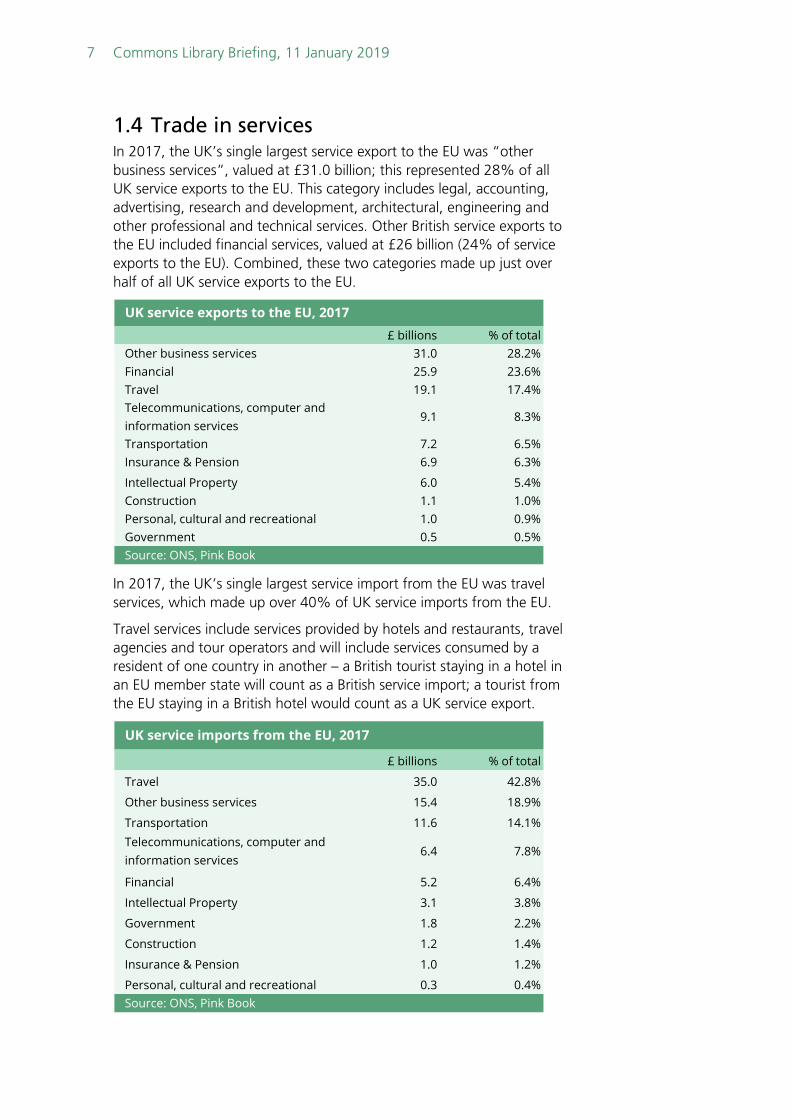
1.4 Trade in services In 2017, the UK’s single largest service export to the EU was “other business services”, valued at £31.0 billion; this represented 28% of all UK service exports to the EU. This category includes legal, accounting, advertising, research and development, architectural, engineering and other professional and technical services. Other British service exports to the EU included financial services, valued at £26 billion (24% of service exports to the EU). Combined, these two categories made up just over half of all UK service exports to the EU.
In 2017, the UK’s single largest service import from the EU was travel services, which made up over 40% of UK service imports from the EU.
Travel services include services provided by hotels and restaurants, travel agencies and tour operators and will include services consumed by a resident of one country in another – a British tourist staying in a hotel in an EU member state will count as a British service import; a tourist from the EU staying in a British hotel would count as a UK service export.
UK service exports to the EU, 2017£ billions % of total
Other business services 31.0 28.2%Financial 25.9 23.6%Travel 19.1 17.4%Telecommunications, computer and information services
9.1 8.3%
Transportation 7.2 6.5%Insurance & Pension 6.9 6.3%
Intellectual Property 6.0 5.4%Construction 1.1 1.0%Personal, cultural and recreational 1.0 0.9%Government 0.5 0.5%Source: ONS, Pink Book
UK service imports from the EU, 2017
£ billions % of total
Travel 35.0 42.8%
Other business services 15.4 18.9%
Transportation 11.6 14.1%Telecommunications, computer and information services
6.4 7.8%
Financial 5.2 6.4%
Intellectual Property 3.1 3.8%
Government 1.8 2.2%
Construction 1.2 1.4%
Insurance & Pension 1.0 1.2%
Personal, cultural and recreational 0.3 0.4%Source: ONS, Pink Book

8 Statistics on UK-EU trade
2. Recent trendsThe share of UK exports going to the EU has declined gradually in recent years:
• In 2006, the EU accounted for 55% of all UK exports. By 2016,this had fallen to 43%, before increasing slightly to 44% in 2017.
• The picture on imports is slightly less clear. In 2002, 58% of UKimports were from the EU. By 2010, this had fallen to 51% buthas increased slightly more recently, reaching 54% in 2016.
The fall in UK exports to the EU is more pronounced in goods than in services:
• In 1999, 61% of all UK goods exports were to the EU; by 2017this had fallen to 48%.
• The EU has accounted for a consistent share of UK service exports– this has remained at around 40% since 1999.
Trends in trade in imports have been mixed:
• The proportion of UK goods imports being sourced from the EUhas remained fairly consistent since 1999.
• In general, the proportion of service imports being sourced fromthe EU has fallen since 1999, from a high of 57% in 2003 to 49%in 2017.
Share of UK trade in goods and services with the EU, 1999-2017%
Source: ONS, Pink Book
Exports
Imports
0%
10%
20%
30%
40%
50%
60%
70%
1999 2001 2003 2005 2007 2009 2011 2013 2015 2017

9 Commons Library Briefing, 11 January 2019
Overall, the UK has had a trade deficit with the EU in every year since 1999. By contrast, the UK has had a surplus with non-EU countries since 2012.
The Appendix at the end of this note shows a time series of data on UK trade with the EU.
2.1 The Rotterdam effect All of these figures do not account for what is known as the Rotterdam effect – this is the theory that the UK’s trade with the Netherlands is artificially inflated owing to goods being dispatched to or arriving from the port of Rotterdam, even if the original source or eventual destination country is elsewhere.
This will also have a potential knock-on effect, as some trade recorded with the Netherlands, and thus the EU, may ultimately be with non-EU countries.
The scale of this effect is not known - a 2015 ONS article on the subject states:
There are legitimate, proven reasons as to why trade with the Netherlands is high, even relative to its population. It is also reasonable to assume that trade with the Netherlands suffers from an element of distortion. However, it is not possible to estimate, with any certainty, the impact that the Rotterdam effect has on UK Trade with the Netherlands and its subsequent impact on UK Trade with EU and non-EU countries.2
2 ONS, UK Trade in Goods estimates and the ‘Rotterdam Effect’, 6 February 2015
Balance of trade with EU and non-EU countries, 1999-2017% of GDP, goods and services
Source: ONS, Pink Book
EU
Non-EU
-5%
-4%
-3%
-2%
-1%
0%
1%
2%
3%
1999 2001 2003 2005 2007 2009 2011 2013 2015 2017

10 Statistics on UK-EU trade
Even if a high proportion of recorded UK trade with the Netherlands is with non-EU countries, the EU remains the UK’s largest trading partner by a considerable margin.

11 Commons Library Briefing, 11 January 2019
3. Trade between EU & Scotland,Wales, Northern Ireland &English regions
HMRC publish data on trade with the EU for Scotland, Wales, Northern Ireland and the English regions. These figures are for trade in goods only – they do not include services.3
3.1 Exports 60% of exports of goods from Wales go to the EU - this is the highest proportion of any country or region in the UK, followed by the North East at 59%.
Yorkshire and the Humber, Northern Ireland and the East of England also have relatively high shares of exports to the EU.
3 HMRC, Regional Trade Statistics
UK goods exports by country and region£ billion, 2017
EU Total % EU
North East 7.6 12.9 59%North West 14.2 28.7 49%Yorkshire and The Humber 9.7 16.8 58%East Midlands 10.7 20.5 52%West Midlands 14.7 33.5 44%East 15.2 29.0 53%London 15.2 36.2 42%South East 22.4 45.3 49%South West 9.3 20.4 45%
England 119.0 243.3 49%
Wales 10.0 16.5 60%Scotland 14.0 28.7 49%Northern Ireland 5.0 8.7 57%
Unallocated - Known 14.3 20.8 69%Unallocated - Unknown 0.1 10.4 0.5%
UK 162.3 328.4 49%Source: HMRC, UK Trade Info
12 Statistics on UK-EU trade
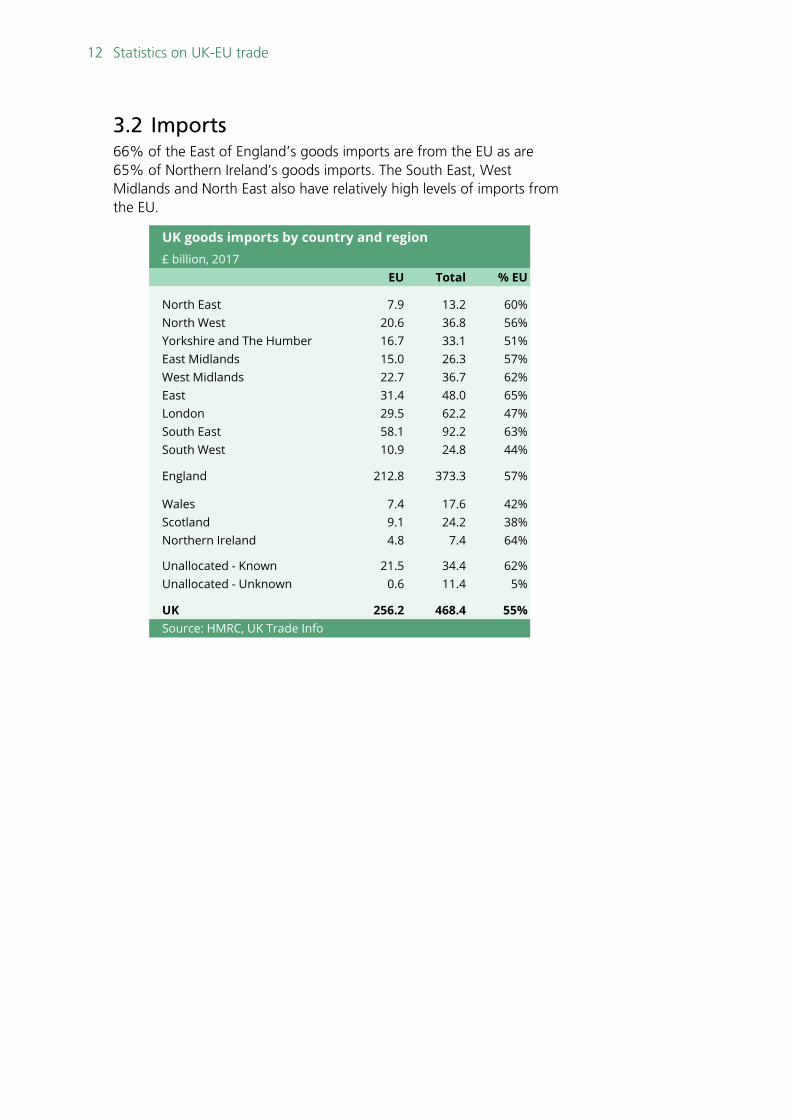
3.2 Imports 66% of the East of England’s goods imports are from the EU as are 65% of Northern Ireland’s goods imports. The South East, West Midlands and North East also have relatively high levels of imports from the EU.
UK goods imports by country and region£ billion, 2017
EU Total % EU
North East 7.9 13.2 60%North West 20.6 36.8 56%Yorkshire and The Humber 16.7 33.1 51%East Midlands 15.0 26.3 57%West Midlands 22.7 36.7 62%East 31.4 48.0 65%London 29.5 62.2 47%South East 58.1 92.2 63%South West 10.9 24.8 44%
England 212.8 373.3 57%
Wales 7.4 17.6 42%Scotland 9.1 24.2 38%Northern Ireland 4.8 7.4 64%
Unallocated - Known 21.5 34.4 62%Unallocated - Unknown 0.6 11.4 5%
UK 256.2 468.4 55%Source: HMRC, UK Trade Info
13 Commons Library Briefing, 11 January 2019
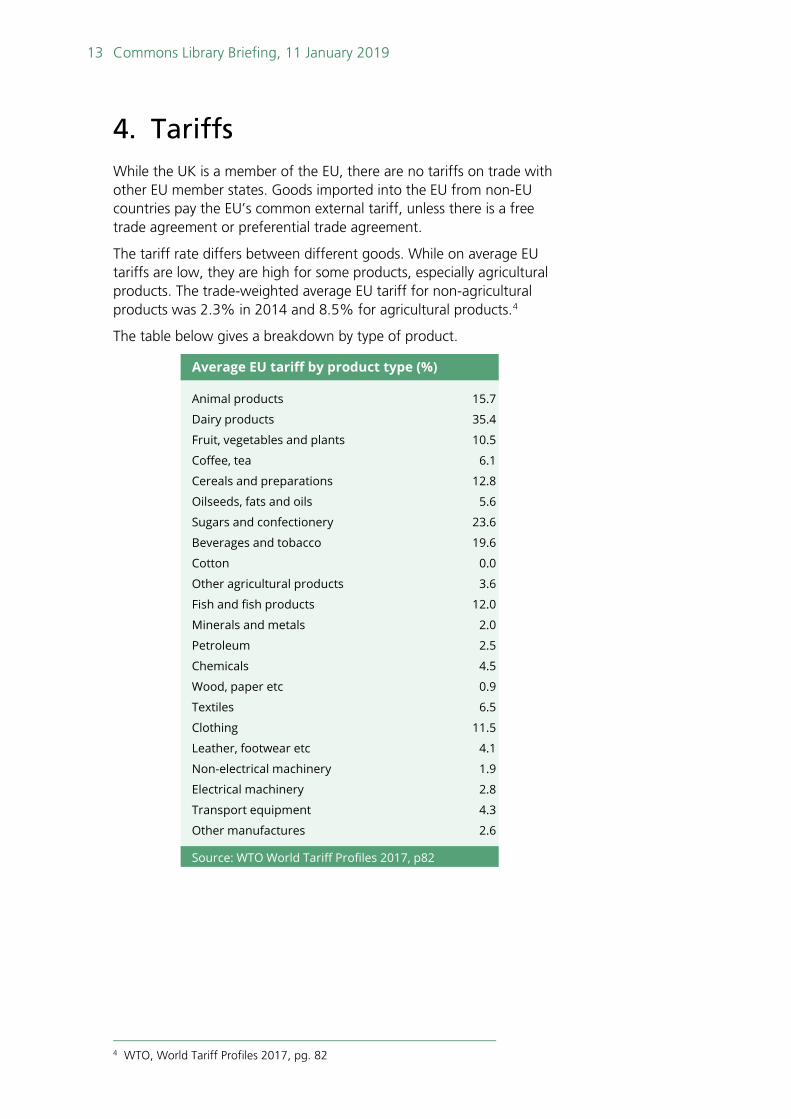
4. TariffsWhile the UK is a member of the EU, there are no tariffs on trade with other EU member states. Goods imported into the EU from non-EU countries pay the EU’s common external tariff, unless there is a free trade agreement or preferential trade agreement.
The tariff rate differs between different goods. While on average EU tariffs are low, they are high for some products, especially agricultural products. The trade-weighted average EU tariff for non-agricultural products was 2.3% in 2014 and 8.5% for agricultural products.4
The table below gives a breakdown by type of product.
4 WTO, World Tariff Profiles 2017, pg. 82
Average EU tariff by product type (%)
Animal products 15.7
Dairy products 35.4
Fruit, vegetables and plants 10.5
Coffee, tea 6.1
Cereals and preparations 12.8
Oilseeds, fats and oils 5.6
Sugars and confectionery 23.6
Beverages and tobacco 19.6
Cotton 0.0
Other agricultural products 3.6
Fish and fish products 12.0
Minerals and metals 2.0
Petroleum 2.5
Chemicals 4.5
Wood, paper etc 0.9
Textiles 6.5
Clothing 11.5
Leather, footwear etc 4.1
Non-electrical machinery 1.9
Electrical machinery 2.8
Transport equipment 4.3
Other manufactures 2.6
Source: WTO World Tariff Profiles 2017, p82
14 Statistics on UK-EU trade
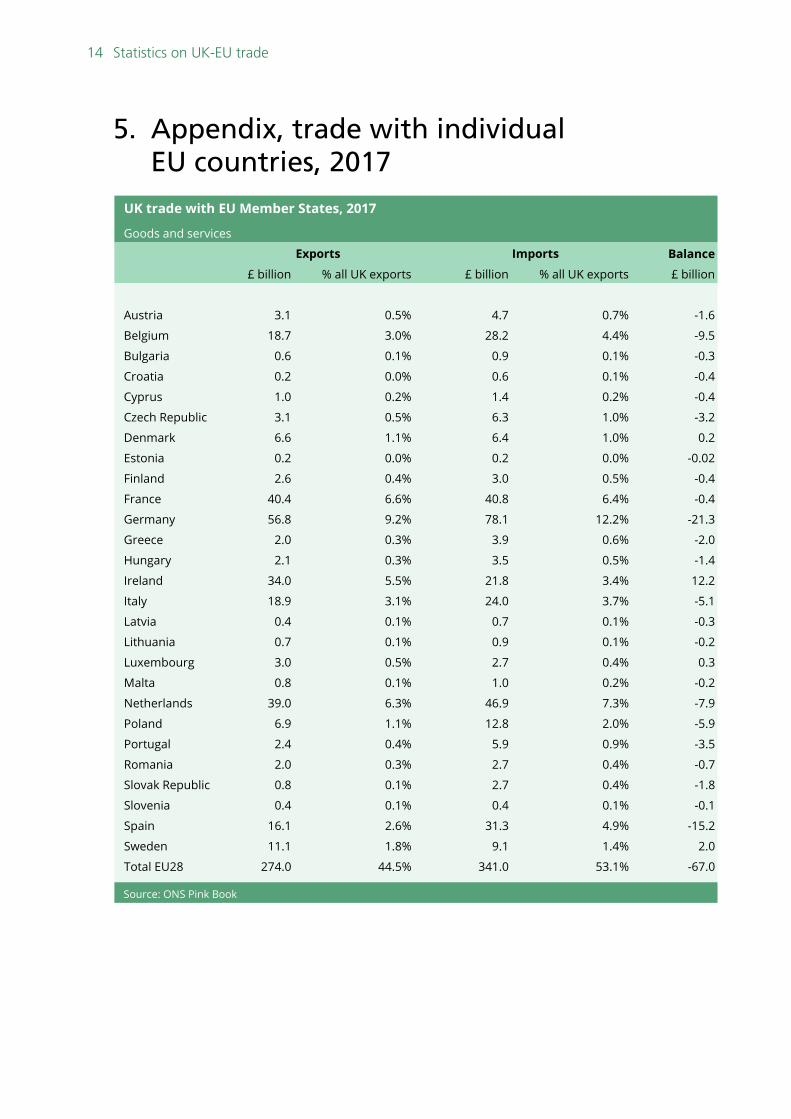
5. Appendix, trade with individualEU countries, 2017
UK trade with EU Member States, 2017
Goods and services
Balance
£ billion % all UK exports £ billion % all UK exports £ billion
Austria 3.1 0.5% 4.7 0.7% -1.6
Belgium 18.7 3.0% 28.2 4.4% -9.5
Bulgaria 0.6 0.1% 0.9 0.1% -0.3
Croatia 0.2 0.0% 0.6 0.1% -0.4
Cyprus 1.0 0.2% 1.4 0.2% -0.4
Czech Republic 3.1 0.5% 6.3 1.0% -3.2
Denmark 6.6 1.1% 6.4 1.0% 0.2
Estonia 0.2 0.0% 0.2 0.0% -0.02
Finland 2.6 0.4% 3.0 0.5% -0.4
France 40.4 6.6% 40.8 6.4% -0.4
Germany 56.8 9.2% 78.1 12.2% -21.3
Greece 2.0 0.3% 3.9 0.6% -2.0
Hungary 2.1 0.3% 3.5 0.5% -1.4
Ireland 34.0 5.5% 21.8 3.4% 12.2
Italy 18.9 3.1% 24.0 3.7% -5.1
Latvia 0.4 0.1% 0.7 0.1% -0.3
Lithuania 0.7 0.1% 0.9 0.1% -0.2
Luxembourg 3.0 0.5% 2.7 0.4% 0.3
Malta 0.8 0.1% 1.0 0.2% -0.2
Netherlands 39.0 6.3% 46.9 7.3% -7.9
Poland 6.9 1.1% 12.8 2.0% -5.9
Portugal 2.4 0.4% 5.9 0.9% -3.5
Romania 2.0 0.3% 2.7 0.4% -0.7
Slovak Republic 0.8 0.1% 2.7 0.4% -1.8
Slovenia 0.4 0.1% 0.4 0.1% -0.1
Spain 16.1 2.6% 31.3 4.9% -15.2
Sweden 11.1 1.8% 9.1 1.4% 2.0
Total EU28 274.0 44.5% 341.0 53.1% -67.0
Source: ONS Pink Book
Exports Imports

15 Commons Library Briefing, 11 January 2019
6. Appendix: Trade with EU andnon-EU countries, 1999-2017
UK trade with the EU, 1999 - 2017Goods and services
Balance£ billion % of total £ billion % of total £ billion
1999 133.3 54.6% 145.2 56.0% -11.82000 146.6 54.0% 156.2 53.5% -9.62001 151.1 54.3% 168.8 55.2% -17.72002 153.1 54.6% 182.7 58.2% -29.62003 154.8 52.7% 187.3 57.8% -32.52004 159.2 51.8% 193.4 56.7% -34.22005 176.9 51.6% 212.7 56.3% -35.82006 213.4 54.5% 242.0 56.8% -28.62007 194.5 50.7% 227.6 54.4% -33.12008 212.4 50.3% 243.8 52.8% -31.42009 196.2 48.8% 224.7 52.2% -28.52010 218.5 48.9% 246.8 51.2% -28.32011 243.4 48.6% 263.5 50.8% -20.12012 235.4 46.6% 271.4 51.2% -36.02013 232.2 44.3% 284.3 51.4% -52.12014 237.5 45.6% 290.8 52.9% -53.32015 225.1 43.3% 289.2 52.9% -64.12016 240.4 43.2% 315.1 53.6% -74.62017 274.0 44.5% 341.0 53.1% -67.0Source: ONS series L84Y, L864, IKBH, IKBI, L86I
Exports Imports
UK trade with non-EU countries, 1999 - 2017Goods and services
Balance£ billion % of total £ billion % of total £ billion
1999 110.9 45.4% 113.9 44.0% -3.02000 124.8 46.0% 135.9 46.5% -11.12001 127.4 45.7% 136.9 44.8% -9.42002 127.5 45.4% 131.2 41.8% -3.72003 139.1 47.3% 136.6 42.2% 2.52004 148.2 48.2% 147.7 43.3% 0.52005 166.2 48.4% 165.4 43.7% 0.82006 178.3 45.5% 184.1 43.2% -5.82007 188.9 49.3% 190.8 45.6% -1.92008 210.1 49.7% 217.7 47.2% -7.62009 205.9 51.2% 205.7 47.8% 0.22010 228.6 51.1% 235.4 48.8% -6.82011 257.3 51.4% 255.6 49.2% 1.62012 269.3 53.4% 258.9 48.8% 10.42013 291.4 55.7% 268.3 48.6% 23.12014 282.8 54.4% 259.2 47.1% 23.62015 294.5 56.7% 257.4 47.1% 37.12016 316.5 56.8% 272.8 46.4% 43.72017 341.9 55.5% 300.8 46.9% 41.1Source: ONS series L84Z, L865, IKBH, IKBI, L86J
Exports Imports

BRIEFING PAPER Number 7851 11 January 2019
About the Library The House of Commons Library research service provides MPs and their staff with the impartial briefing and evidence base they need to do their work in scrutinising Government, proposing legislation, and supporting constituents.
As well as providing MPs with a confidential service we publish open briefing papers, which are available on the Parliament website.
Every effort is made to ensure that the information contained in these publicly available research briefings is correct at the time of publication. Readers should be aware however that briefings are not necessarily updated or otherwise amended to reflect subsequent changes.
If you have any comments on our briefings please email [email protected]. Authors are available to discuss the content of this briefing only with Members and their staff.
If you have any general questions about the work of the House of Commons you can email [email protected].
Disclaimer This information is provided to Members of Parliament in support of their parliamentary duties. It is a general briefing only and should not be relied on as a substitute for specific advice. The House of Commons or the author(s) shall not be liable for any errors or omissions, or for any loss or damage of any kind arising from its use, and may remove, vary or amend any information at any time without prior notice.
The House of Commons accepts no responsibility for any references or links to, or the content of, information maintained by third parties. This information is provided subject to the conditions of the Open Parliament Licence.