Embed Size (px)
Citation preview

STATISTICS ON SCHEDULED BANKS IN PAKISTAN
June 2018
STATE BANK OF PAKISTAN
STATISTICS & DATA WAREHOUSE DEPARTMENT
www.sbp.org.pk

Our Mission To promote monetary and financial stability and foster a sound and dynamic financial system, so as to achieve sustained and equitable economic growth and prosperity in Pakistan.
Our Vision To be an independent and credible central bank that achieves monetary and financial stability and inclusive financial sector development for the long-term benefit of the people of Pakistan.

Preface
Statistics & DWH Department of the State Bank of Pakistan makes all out efforts
to publish quality statistics with minimum possible time lag. The publication
“Statistics on Scheduled Banks in Pakistan” is a reflection of the one such efforts
in this regard. The publication has significant importance and provides information
on multiple aspects of the financial sector which is widely used by users working
in various disciplines.
The Statistics on Scheduled Banks in Pakistan is based on the half-yearly branch
wise data reported by the scheduled banks operating in Pakistan. The data is
collected on various dimensions of bank’s assets and liabilities i.e. deposits,
advances, investments and bills purchased & discounted etc. This publication is
divided into different parts, each part possesses its own significance. The data tables
are supported by easy-to-understand graphs and charts which help to provide the
insight of the complicated numbers in a glance. The quality and reliability of data
has been improved significantly over the years. I appreciate the efforts of the team
in compiling this valuable publication. Comments and suggestion for further
improvements in the publication are welcome.
Dr. Azizullah Khattak Director Statistics & DWH Department

Acknowledgement
The team is greatly thankful to Dr. Azizullah Khattak, Director and Mr. Naseer
Ahmed, Additional Director of Statistics & DWH Department for their invaluable
feedback and continuous guidance in preparation of this publication. We are
grateful to members of Monetary & Financial Statistics Unit of Statistics & DWH
Department, Infrastructure Housing & SME Finance Department of the State Bank
of Pakistan and all commercial banks for their valuable contribution in providing
data for the publication.
Team

The Team
Team Leader
• Syed Nadeem Adil Senior Joint Director [email protected]
Team Members
• Tanveer Akhtar Joint Director [email protected]
• Ijlal Ahmad Haqqani Assistant Director [email protected] • Haider Ali Assistant Director
• Sidra Jabeen Assistant Director [email protected] • Saadia Bilal Assistant Director

CCoonntteennttss
I. Introduction v-viii II. Explanatory Notes ix-xiii III. Review
xiv-xxvi
IV Statistical Tables 1 Scheduled Banks’ Liabilities and Assets 1.1 Liabilities and Assets 2-5 2 Scheduled Banks’ Deposits 2.1 Deposits Distributed by Type of Accounts 8-11 2.2 Deposits Distributed by Category of Deposit Holders & Type of Accounts 12-29 2.3 Deposits Distributed by Rate of Interest & Type of Accounts 30-37 2.4 Deposits Distributed by Rate of Return & Type of Accounts (PLS) 38-45 2.5 Deposits Distributed by Size of Accounts & Category of Deposits Holders 46-47 2.6 Deposits Distributed by Size of Accounts 48-51 2.7 Debits to Deposit Accounts & Turnover 52 3 Scheduled Banks’ Advances 3.1 Advances Classified by Securities 54-63 3.2 Advances Classified by Borrowers 64-73 3.3 Advances Classified by Rate of Interest/Return & Securities 74-77 3.4 Advances Classified by Rate of Interest/Return & Borrowers 78-81 3.5 Advances Classified by Size of Accounts & Borrowers 82-83 3.6 Advances Classified by Size of Accounts 84-87 3.7 Advances Classified by Rate of Margin 88-91 3.8 Advances Classified by Rate of Interest/Return & Rate of Margin 92-93 3.9 Advances Classified by Securities & Rate of Margin 94-99 4 Scheduled Banks’ Bills 4.1 Classification of Bills Purchased & Discounted 102-105 5 Scheduled Banks’ Investments 5.1 Classification of Investments in Securities & Shares 108-111
6 Regional Advances and Deposits 6.1 Province/Region wise Deposits by Categories 114-115 6.2 Province/Region wise Advances by Borrowers 116-117
V. Appendices I Number of Reporting Scheduled banks &their Branches 120 II Reporting Scheduled Banks, their website, Branches and ATMs by Groups 121 III (a) Distribution of Islamic Banks(Full Fledged Islamic) Branches by Cities 122-127 III.
(a) Distribution of Islamic Banks(Full Fledged Islamic) Branches by Cities
(b) Distribution of Stand-alone Islamic Banks Branches by Cities 128-134

Introduction June – 2018
Statistics on Scheduled Banks in Pakistan v
I. Introduction
Background
Banking sector plays a pivotal role in the economic development of a country. State Bank being a central bank and regulator of the banking system has to compile and disseminate statistics on the scheduled banks operating in Pakistan.
Statistics & DWH Department of State Bank of Pakistan compiles and disseminates data through different publications. Keeping up the pace with the increased use of IT, the data is also placed on the State Bank’s website (www.sbp.org.pk) for the easy access by the users. The publication is based on the revised reporting system effective from June 1982. It was based on quarterly reporting of the banks that was subsequently changed to biannual from December 1992.
Standards and Classifications
Effective from December 2001, the category of deposit holders and advances classified by borrower for domestic constituents has been reclassified as Government, Non-Financial Public Sector Enterprises (NFPSE’s), Non-Bank Financial Companies (NBFC’s), Private Sector (Business), Trust Funds & Non-Profit Institutions (NPI’s), Personal, and Others.
Major changes are carried out in the classification of banking sector attributes. The classification of economic groups under private sector has been enhanced in the light of International Standard Industrial Classification (ISIC)-Rev.3.1 of the United Nation’s Statistics Division.
Composition of Banking Groups
The publication is based on data of all scheduled banks operating in Pakistan which are classified into three main groups namely public sector banks, domestic private banks and foreign banks. Public sector banks are further divided into public sector commercial banks and specialized banks.
Scheduled Banks
In terms of Section 13 of Companies Ordinance 1962, the scheduled banks maintain minimum required capital and reserve balance which is determined by SBP from time to time. Currently as per BSD circular No. 7 of 2009 an aggregate value not less than Rs. 10 billion by December 31, 2013&

Introduction June – 2018
Statistics on Scheduled Banks in Pakistan vi
onwards and conducting their affairs in a manner not detrimental to the interest of their depositors have been declared as scheduled banks.
As per State Bank of Pakistan Act, 1956 (clause (a) of Sub-Section (2) of Section 37) “scheduled
bank” is defined as: 37-2. The Bank shall, by notification, in the official Gazette—
(a) Declare any bank to be scheduled bank which is carrying on the business of banking in Pakistan and which—
(i) is a banking company as defined in section 227F of the Companies Act, 1913, or a co-operative bank, or a corporation or a company incorporated by or established under any law in force in any place in or outside Pakistan;
(ii) has a paid-up capital and reserves of an aggregate value of not less than five lakhs of rupees: Provided that in the case of a co-operative bank, an exception may be made by the Bank;
(iii) satisfies the Bank that its affairs are not being conducted in a manner detrimental to the interest of its depositors;
(b) direct the de scheduling of any scheduled bank which ceases to fulfill the requirements mentioned in clause (a) or goes into liquidation or otherwise wholly or partly ceases to carry on banking business; Provided that the Bank may, on application of the scheduled bank concerned and subject to such conditions, if any, as it may impose, defer the making of a direction under clause (b) for such period as the Bank considers reasonable to give the scheduled bank an opportunity of fulfilling the requirements mentioned in sub-clauses (ii) and (iii) of clause (a); (c) alter the description in the list of scheduled banks whenever any scheduled bank changes its name.
Explanation:- In sub-Section (2) the expression “value” means the real or exchangeable and not
the nominal value of the capital and reserves and the valuation made by the Bank shall be final.

Introduction June – 2018
Statistics on Scheduled Banks in Pakistan vii
Public Sector Banks
The banks incorporated in Pakistan and their shares& capital controlled by the Government units is referred to Public sector banks (Appendix II).
Public Sector Commercial Banks
These are the scheduled banks mainly involved in the activities of deposits mobilization and extending credit through a branch network. These banks deal in short term collateralized lending such as trade financing, overdraft and provide a range of financial services to the clients. With the liberalization of banking rules and laws, commercial banks are now allowed to undertake other related activities such as underwriting, portfolio investment, securities market operations, specialized financing and related services.
Specialized Banks
Specialized banks are established to provide credit facilities, assistance and advice to clients in a designated sector or in a designated line of credit; for example agriculture sector, industrial sector, housing sector, SME sector. These institutions perform lending function, but may not engage in routine commercial banking activities. These are established, organized, and chartered under special legislative acts instead of being chartered as a bank under the banking law.
Domestic Private Banks
The banks incorporated in Pakistan and controlled by the private sector are termed as domestic private banks.
Foreign Banks
Bank branches with head offices outside Pakistan are called foreign banks.
Islamic Banking
For the promotion of Islamic Banking in Pakistan, SBP issued policies/guidelines as per BPD circular No.1 of January 2003. Wherein a three-pronged strategy was adopted as under:
a) Establishment of full-fledged Islamic Bank(s) in the private sector. b) Setting up subsidiaries for Islamic banking by existing commercial banks. c) Allowing Stand-alone branches for Islamic banking in the existing commercial banks.
All Islamic banks, subsidiaries and stand-alone branches offer Sharia compliant products and services only.
“Sharia compliant products and services” means banking products and services offered by

Introduction June – 2018
Statistics on Scheduled Banks in Pakistan viii
banks to their clients which are duly approved by their Sharia advisers/ Sharia Supervisory Committee.
Scope
This publication contains statistical tables prepared from the data supplied on half-yearly basis by the operating branches of the scheduled banks in Pakistan.
The publication starts with introduction followed by explanatory notes and review which includes summary tables on major statistics related to scheduled banks. The main variables are discussed in details aided by suitable graphs.
Some of the other major features include:
1. Key Statistics of Scheduled Banks at a Glance. 2. Distribution of Deposits, Advances, Bills Purchased & Discounted and Investments of
Scheduled Banks by Groups. 3. Distribution of Type of Deposits of Scheduled Banks by Groups. 4. Maturity Breakup of Term Deposits of Scheduled Banks by Groups. 5. Advances Classified by Securities & Borrowers. 6. Advances by Modes of Financing. 7. Province/Region Wise Deposits and Advances.

Explanatory Notes on Statistical Tables June - 2018
Statistics on Scheduled Banks in Pakistan ix
II. Explanatory Notes
The scheduled banks statistics are based on branch-wise actual data (as on end position) reported on half-yearly basis by the scheduled banks in Pakistan. The data is collected on various dimensions of major sources (deposits) and resources (advances, investments and bills purchased & discounted) along with liabilities and assets statement. The data dimensions and terminology that need some explanation is discussed for information of the users.
Liabilities and Assets
The items of Capital and Reserves on the liability side pertain to the principal or head office of the bank.
Capital comprises paid-up capital of Pakistani Banks. In case of Foreign Banks, it is the equivalent Pakistani rupee amount kept with the State Bank of Pakistan as reserve capital required to be maintained under the rules.
Reserves include all types of reserves maintained by the scheduled banks.
Balances with other Scheduled Banks: This includes the balances of all Scheduled Banks with any other bank and excludes the balances with National Bank of Pakistan working as an agent of State Bank of Pakistan, which are included in ‘Balances with State Bank of Pakistan’.
As per established accounting procedure, the reporting branches of Scheduled Banks adjust certain entries with their Principal/Head (inter-bank) offices to balance their positions. The gross amounts of credits and debits of these adjustments tend to be large compared with other heads of accounts. These adjustments of ‘Head office / inter-banks are netted out to consolidate bank-wise position that have been added to arrive at overall position. It is significant to mention that the data on liabilities and assets in this publication may differ slightly from the data in Weekly Press Communiqué of Off-site Supervision & Enforcement Department of SBP due to difference in timing and coverage of the two sets of data.
Deposits
Outstanding Deposits: This shows the position of deposits held by banks at the end of the period (30th June or 31st December). Deposits are the amount held in various types of deposit accounts by bank, such as demand deposits, time and saving deposits. Deposits include all types of deposits

Explanatory Notes on Statistical Tables June - 2018
Statistics on Scheduled Banks in Pakistan x
excluding interbank deposits, placements and margin deposits (deposits held by banks as collateral against letters of credits, letters of guarantees).
The data on Deposits is collected and compiled on various dimensions explained as under:
Types of Accounts: Deposits accounts are classified under five main type’s namely current, call, saving, fixed and other deposits.
Category of Deposit Holders: This describes the main business or profession of the deposit account holders. They are broadly classified as non-resident and domestic constituents, which is cascaded down to Government, Non- financial public sector enterprises (NFPSEs), Non-bank financial Companies (NBFCs), Private sector(Business), Trust Fund and Non-Profit Institutions, Personal and Others. The Private sector has been further distributed in sub-heads such as Agriculture, Fishing, Mining & Quarrying, Manufacturing, Ship breaking, Electricity and Construction according to the ISIC classification of United Nations.
Rate of Interest: It is the rate offered by Scheduled Banks on various types of deposits such as foreign currency accounts scheme, over five years maturity and unclaimed, overdue or matured fixed deposits maintained under conventional banking.
Rate of Return on PLS Deposits: It is the rate of profit given by the Scheduled Banks on various types of deposits such as call, saving and fixed deposits maintained under the scheme “Elimination of Riba from the Banking System”. The rates are announced after the completion of the period of investment usually a half year based on June and December end in July and January.
Size of Deposits Accounts: The deposits accounts are classified under various classes on the basis of the balances in the respective accounts. As the number of accounts is considerably large, for reporting ease, the banks have option to club the accounts and amounts in cases where, the “Nature”, “Type of Accounts”, “Category of Deposit Holders” and “Rate of Interest/Return” is the same. For such grouped accounts it is the average size of the group instead of actual size of the component that determines the class to which it belongs. It is believed that the estimates would not differ significantly from the actual position.
Debits to Deposit and Turnover: The deposits are reported on net basis at the end of half-year. The debits on these accounts help in analyzing the turnover in the respective accounts during the period. The co-efficient of turnover are calculated by dividing the debits with the averages amounts on deposits as reported by the banks.

Explanatory Notes on Statistical Tables June - 2018
Statistics on Scheduled Banks in Pakistan xi
Advances
Outstanding Advances: The total amount of advances/loans recoverable at the end of the period (30th June or 31st December), are termed as outstanding. Advances includes all type of advances except interbank placements and is the amount of money borrowed from banks for a period of time at a rate of interest and at terms of repayments as agreed between the borrower and the banks backed by a collateral.
The main attributes of advances are as under:
Type of Securities: In banking business, the security, or collateral, consists of assets, property, deposits or valuables held as guarantee against a credit or a loan. Type of security helps in the analysis of the quality of advances of the banking system. A list of classification of securities has been prepared as per international classification that can be seen under the tables of advances classified by securities in the statistical tables.
Category of Borrowers: Borrowers are first classified on the basis of non-resident and domestic constituents. The latter is then further classified into government, non- financial public sector enterprises, non- bank financial companies, private sector (business), trust funds & non-profit institutions, personal and others.
Non-Resident: This covers the transactions with the non-residents working in our economy. This includes Officials (Embassies consulates, foreign missions), Business (Corporations working in Pakistan for short periods such as construction companies) and Personals (Students, travelers).
Government: This includes Federal Government, Provincial & Local Governments advances. Further, disbursements to Government (Federal, Provincial & Local) are made by bank branches located in various regions/provinces, while in case of deposits, the bank branches located in the various regions/provinces have mobilized the deposits from the Government (Federal, Provincial & Local). Similarly, disbursements to eight main borrowers (Non-resident, Govt., NFPSEs, NBFCs, Private Sector, Trust Fund, Personal and Others) are made by bank branches located in various regions/provinces, while in case of deposits, the bank branches located in the various regions/provinces have mobilized the deposits from these eight categories.
NFPSE’s (Non-Financial Public Sector Enterprises): These are the non-financial resident corporations which are controlled by government, through ownership of more than half the voting shares, legislation, decree, or regulations that establish specific corporate policy or allow the government to appoint the directors.
Explanatory Notes on Statistical Tables June - 2018
Statistics on Scheduled Banks in Pakistan xii
NBFC’s (Nonbank Financial Companies)& Financial Auxiliaries: Non-banking financial companies, or NBFCs, are financial institutions that provide banking services, but do not hold a banking license while Financial Auxiliaries are all resident corporations and quasi corporations primarily engaged in activities closely related to financial intermediation but which do not themselves perform an intermediation role. NBFCs & Financial Auxiliaries are categorized into groups of development finance institutions, leasing companies, investment banks, modaraba companies, housing finance companies, mutual funds, venture capital companies, discount houses, stock exchange, exchange companies and insurance companies etc.
Private Sector: This is that part of the economy which is run for private business profit and is not controlled by the state. This includes the majors sectors like Agriculture, Manufacturing etc.
Trust Fund: This includes the Private Trusts and Non-profit Institutions, Non-government Organizations (NGOs)/Community Based and Organizations (CBOs).
Personal: This includes Bank Employees and Consumer Financing which are classified under advances, while in case of deposits, Salaried Persons, Self-employed and Other Persons (House-wives, students etc.) are included.
Others: This includes all those which are not classified elsewhere.
Rate of Interest/Return: This is the cost of using borrowed money expressed as a rate, or a %age of the principal amount for a period of time usually a year. In case of Islamic modes of financing it is referred as rate of mark-up.
Size of Accounts for Advances: The classification and system for size of accounts for advances is identical to the size of accounts for deposit as explained above.
Rate of Margin: Margin for collateral is the excess of the market/assessed value of the collateral over the amount of loan. Banks typically prefer to provide loan amount less than the assessed value of collateral, because in the event of default, there are costs in loan recovery and substantial losses with performing collateral; hence a margin of collateral is maintained.
Bills Purchased & Discounted
Classification of Bills Purchased and Discounted provides the economic group wise claims of scheduled banks. Type of bills includes Export Bills, Import Bills, Inland Bills, Foreign Bills and Others. The nature of bills purchased and discounted may be interest based or Financing under Islamic modes which includes Purchase of Trade Bills on Exchange Rate

Explanatory Notes on Statistical Tables June - 2018
Statistics on Scheduled Banks in Pakistan xiii
Differential or Purchase of Trade Bills on Commission.
Investments
The banks report their investment in domestic and foreign securities/shares with details of holdings of each type of securities/shares and classify them as free or encumbered according to disposability. The holdings are classified by issuing institutions of securities/shares such as Federal and Provincial Governments’ securities, foreign securities and other securities/shares (including shares, debentures, NIT units, participation term certificates, Sukuk, term finance certificate, certificate of investment, mutual fund and modaraba certificates, shares of other public and private sector enterprises). The purchase price (book value), original value (face value) and market value (market price) in case of tradable securities/shares are also reported.
Regional Data
The regional/province wise data on Advances & Deposits by Borrowers/Categories is disseminated due to the increasing demand from the users. Regional distribution of data on “Outstanding Advances” is based on disbursements by the bank branches located in the
respective regions and place of actual utilization for these advances may be different from the place of disbursements. The regional position therefore may not reflect the true picture since offices of large companies/firms operating in different regions might have used banking facilities located in different regions. Therefore, there comes a huge responsibility on the part of users to keep these limitations of data in mind while drawing any conclusion on the basis of these data.
Review June – 2018
Statistics on Scheduled Banks in Pakistan xiv
III. Review
Overview
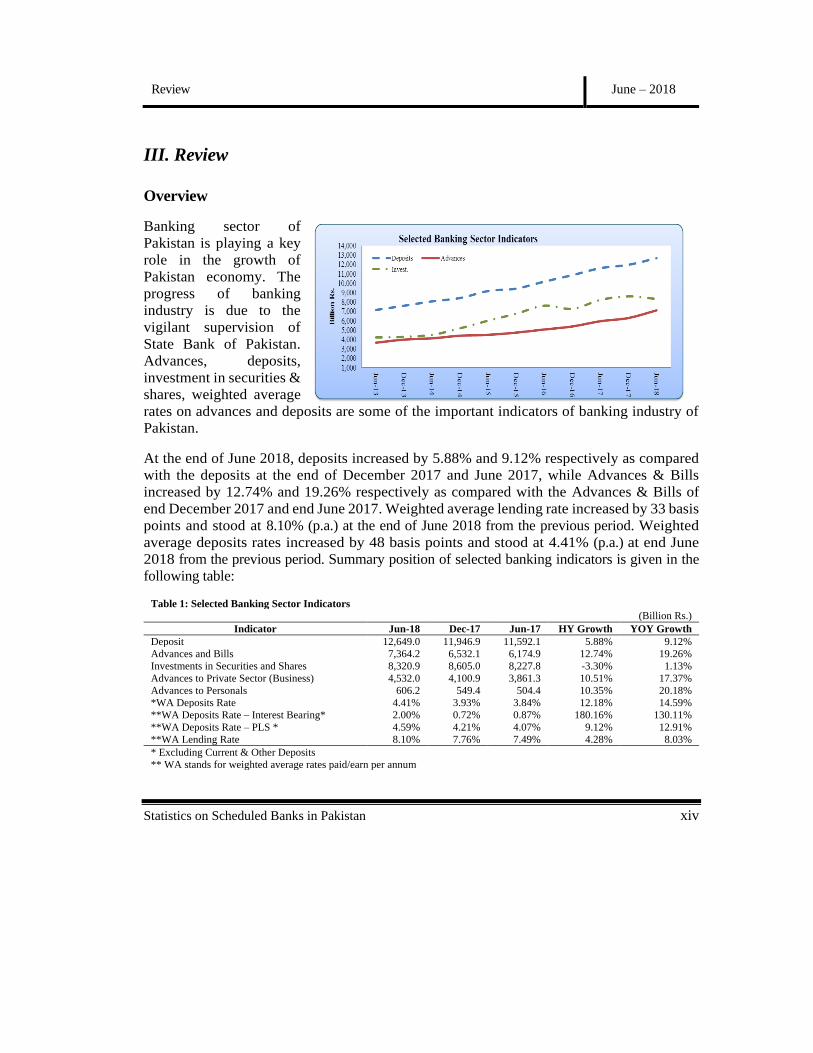
Banking sector of Pakistan is playing a key role in the growth of Pakistan economy. The progress of banking industry is due to the vigilant supervision of State Bank of Pakistan. Advances, deposits, investment in securities & shares, weighted average rates on advances and deposits are some of the important indicators of banking industry of Pakistan.
At the end of June 2018, deposits increased by 5.88% and 9.12% respectively as compared with the deposits at the end of December 2017 and June 2017, while Advances & Bills increased by 12.74% and 19.26% respectively as compared with the Advances & Bills of end December 2017 and end June 2017. Weighted average lending rate increased by 33 basis points and stood at 8.10% (p.a.) at the end of June 2018 from the previous period. Weighted average deposits rates increased by 48 basis points and stood at 4.41% (p.a.) at end June 2018 from the previous period. Summary position of selected banking indicators is given in the following table:
Table 1: Selected Banking Sector Indicators (Billion Rs.)
Indicator Jun-18 Dec-17 Jun-17 HY Growth YOY Growth Deposit 12,649.0 11,946.9 11,592.1 5.88% 9.12% Advances and Bills 7,364.2 6,532.1 6,174.9 12.74% 19.26% Investments in Securities and Shares 8,320.9 8,605.0 8,227.8 -3.30% 1.13% Advances to Private Sector (Business) 4,532.0 4,100.9 3,861.3 10.51% 17.37% Advances to Personals 606.2 549.4 504.4 10.35% 20.18% *WA Deposits Rate 4.41% 3.93% 3.84% 12.18% 14.59% **WA Deposits Rate – Interest Bearing* 2.00% 0.72% 0.87% 180.16% 130.11% **WA Deposits Rate – PLS * 4.59% 4.21% 4.07% 9.12% 12.91% **WA Lending Rate 8.10% 7.76% 7.49% 4.28% 8.03% * Excluding Current & Other Deposits ** WA stands for weighted average rates paid/earn per annum

Review June – 2018
Statistics on Scheduled Banks in Pakistan xv
The following sections highlight movements in branch network, liabilities/assets, deposits, advances, bills and investments, trends and banking activities concentration in various economic groups/sectors of the economy:
Banking Network
The numbers of scheduled banks operating in Pakistan were 33 at end June 2018. The branch network position of Scheduled Banks operating in Pakistan is as under:
Table 2: Comparative Position of Number of Banks and Branches in the Country (Numbers)
Group or Type of Bank Jun-18 Dec-17 Jun-17 Banks Branches Banks Branches Banks Branches
1. Pakistani Banks 29 13,683 29 13,618 30 13,029 i. Public Sector 9 3,198 9 3,188 9 2,986 a. Commercial 5 2,543 5 2,534 5 2,360 b. Specialized 4 655 4 654 4 626 ii. Domestic Private 20 10,485 20 10,430 21 10,043
2. Foreign Banks 4 9 4 10 4 10 Total 33 13,692 33 13,628 34 13,039

Review June – 2018
Statistics on Scheduled Banks in Pakistan xvi
Liabilities and Assets
Total liabilities/assets of all Scheduled Banks (see Table-3) stood at Rs. 28,815.0 billion at end June 2018, increased by Rs. 1,261.6 billion (4.58%) and Rs. 4,196.4 billion (17.05%) over end December 2017 and end June 2017 respectively. The assets/liabilities position of Public Sector Banks has shown a decrease of Rs. 190.2 billion (3.42%) over end December 2017. The Domestic Private Banks assets/liabilities increased by Rs. 1,485.2 billion (7.00%) over end December 2017. While the assets/liabilities of foreign banks decreased by Rs. 33.5 billion (4.28%) over the previous half year position.
Table 3: Composition of Overall Liabilities / Assets of Scheduled Banks (Billion Rs.)
Group or Type of Banks Jun-18 Dec-17 Jun-17 HY Growth YOY Growth 1. Pakistani Banks 28,067.0 26,772.0 24,074.5 4.84% 16.58%
i. Public Sector Banks 5,370.92 5,561.1 5,464.9 -3.42% -1.72% ii Domestic Private Banks 22,696.12 21,210.9 18,609.6 7.00% 21.96%
2. Foreign Banks 747.93 781.4 544.0 -4.28% 37.48% Overall (1+2) 28,815.0 27,553.4 24,618.6 4.58% 17.05% Total may differ due to rounding off.
Deposits
Total of demand and time deposits (excluding Inter-bank) at the end of the period under review (see Table-4) amounting to Rs. 12,649.0 billion, registered increases of Rs. 702.2 billion (5.88%) and Rs. 1,056.9 billion (9.12%) over end of December 2017 and June 2017 respectively. Of this, demand deposits for the period end June 2018 stood at Rs. 4,740.7 billion and increased by Rs. 554.1 billion from end December 2017. Saving deposits stood at Rs. 5,415.4 billion and increased by Rs. 286.1 billion when compared with end December-2017. Term deposits stood at Rs. 2,492.9 billion decreased by Rs. 138.0 billion as compared with end December 2017 (see Table-4.1).
Table 4: Scheduled Banks’ Deposits by Type of Banks (Billion Rs.)
Group or Type of Banks Jun-18 Dec-17 Jun-17 HY Growth%
YOY Growth%
1. Pakistani Banks 12,494.4 11,787.7 11,438.4 6.00 9.23 i. Public Sector Banks 2412.6 2267.0 2290.5 6.42 5.33 ii Domestic Private Banks 10081.9 9520.7 9148.0 5.89 10.21
2. Foreign Banks 154.6 159.2 153.7 -2.87 0.63 Overall (1+2) 12,649.0 11,946.9 11,592.1 5.88 9.12 * Total may differ due to rounding off.
Review June – 2018
Statistics on Scheduled Banks in Pakistan xvii
Table 4.1: Distribution of Type of Deposits of Scheduled Banks by Group (Billion Rs)
Group Demand Savings Term Jun-18 Dec-17 Jun-18 Dec-17 Jun-18 Dec-17
All Banks 4,740.7 4,186.6 5,415.4 5,129.3 2,492.9 2,631.0 1. Public Sector Commercial Banks 815.5 648.7 978.9 956.4 545.8 580.6 2. Domestic Private Banks 3,847.9 3,476.9 4,375.2 4,088.3 1,858.7 1,955.5 3. Foreign Banks 64.6 47.6 44.6 63.7 45.4 47.9 4. Specialized Banks 12.7 13.4 16.7 20.9 42.9 47.0 Commercial Banks (1+2+3) 4,728.0 4,173.2 5,398.7 5,108.4 2,450.0 2,584.0 * Total may not match due to rounding
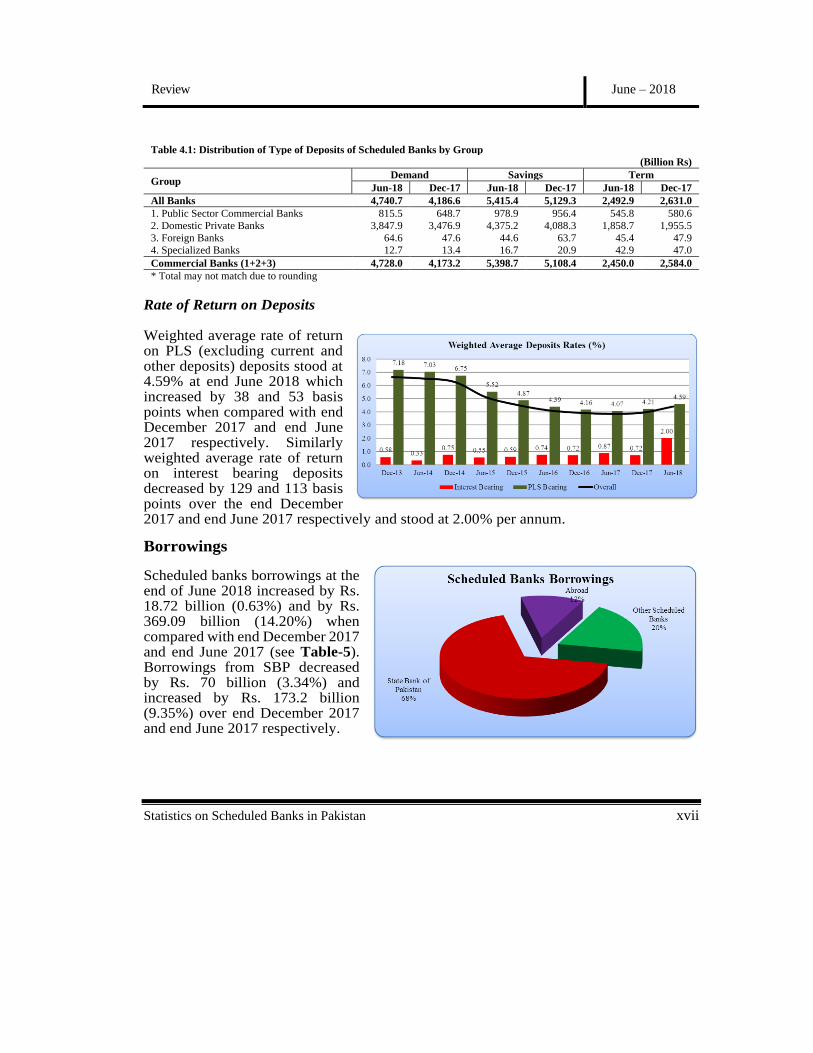
Rate of Return on Deposits Weighted average rate of return on PLS (excluding current and other deposits) deposits stood at 4.59% at end June 2018 which increased by 38 and 53 basis points when compared with end December 2017 and end June 2017 respectively. Similarly weighted average rate of return on interest bearing deposits decreased by 129 and 113 basis points over the end December 2017 and end June 2017 respectively and stood at 2.00% per annum.
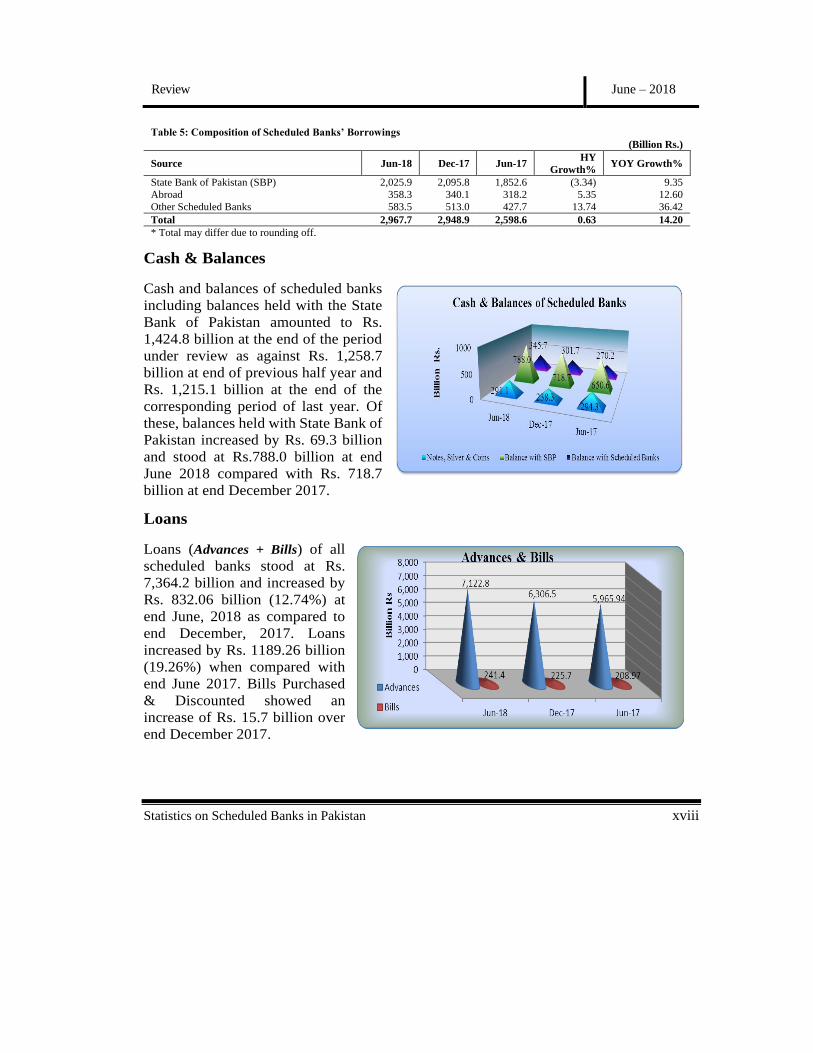
Borrowings
Scheduled banks borrowings at the end of June 2018 increased by Rs. 18.72 billion (0.63%) and by Rs. 369.09 billion (14.20%) when compared with end December 2017 and end June 2017 (see Table-5). Borrowings from SBP decreased by Rs. 70 billion (3.34%) and increased by Rs. 173.2 billion (9.35%) over end December 2017 and end June 2017 respectively.
Review June – 2018
Statistics on Scheduled Banks in Pakistan xviii
Cash & Balances
Cash and balances of scheduled banks including balances held with the State Bank of Pakistan amounted to Rs. 1,424.8 billion at the end of the period under review as against Rs. 1,258.7 billion at end of previous half year and Rs. 1,215.1 billion at the end of the corresponding period of last year. Of these, balances held with State Bank of Pakistan increased by Rs. 69.3 billion and stood at Rs.788.0 billion at end June 2018 compared with Rs. 718.7 billion at end December 2017.
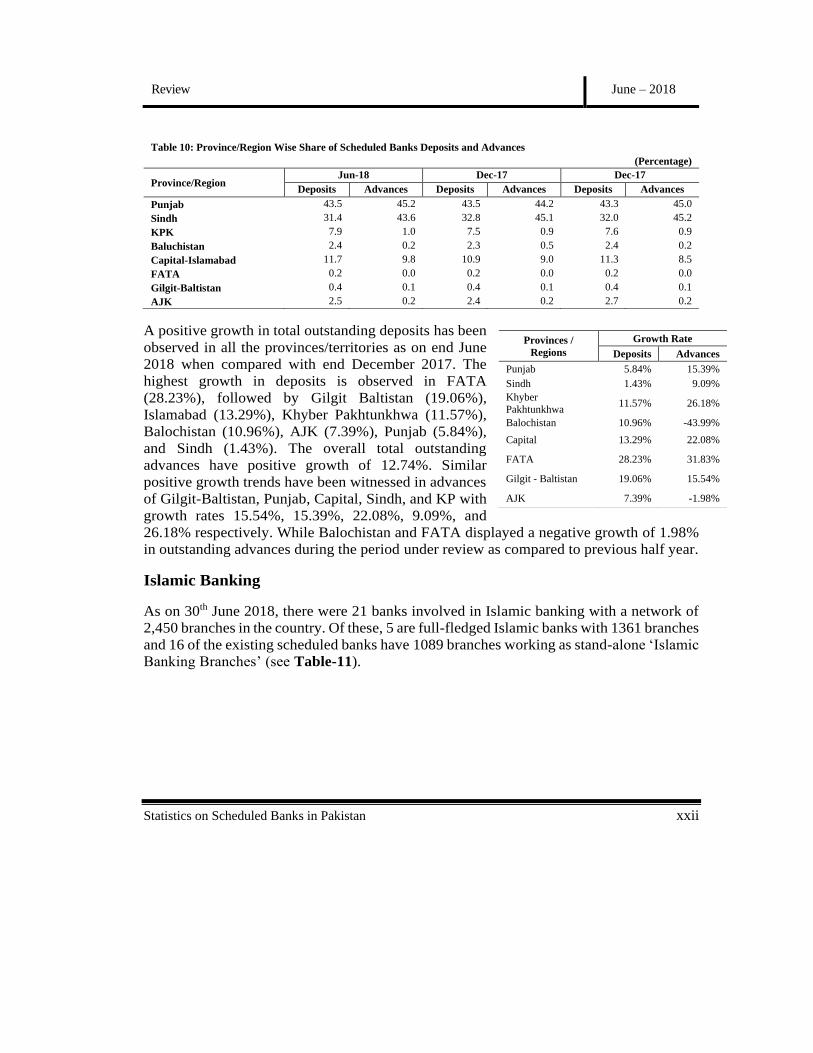
Loans
Loans (Advances + Bills) of all scheduled banks stood at Rs. 7,364.2 billion and increased by Rs. 832.06 billion (12.74%) at end June, 2018 as compared to end December, 2017. Loans increased by Rs. 1189.26 billion (19.26%) when compared with end June 2017. Bills Purchased & Discounted showed an increase of Rs. 15.7 billion over end December 2017.
Table 5: Composition of Scheduled Banks’ Borrowings (Billion Rs.)
Source Jun-18 Dec-17 Jun-17 HY Growth% YOY Growth%
State Bank of Pakistan (SBP) 2,025.9 2,095.8 1,852.6 (3.34) 9.35 Abroad 358.3 340.1 318.2 5.35 12.60 Other Scheduled Banks 583.5 513.0 427.7 13.74 36.42 Total 2,967.7 2,948.9 2,598.6 0.63 14.20 * Total may differ due to rounding off.

Review June – 2018
Statistics on Scheduled Banks in Pakistan xix
Table 6: Advances and Bills (Billion Rs.)
Source Jun-18 Dec-17 Jun-17 HY Growth%
YOY Growth%
Advances 7,122.8 6,306.5 5,965.9 12.94 19.39 Bills 241.4 225.7 209.0 6.96 15.50 Total 7,364.2 6,532.1 6,174.9 12.74 19.26 * Total may differ due to rounding off.
Weighted Average Rate of Return on Advances
The weighted average rate of return on financing under Islamic modes and interest bearing modes at end June, 2018 worked out at 8.00% and 9.71% respectively.
Advances by Securities
Classification of scheduled banks’
advances by securities (see Table-7) indicates that the residual group which includes Precious Metals, Securities/Shares and fixed deposits and insurance policies accounted for Rs. 439.78 billion and increased by Rs. 167.31 billion when compared with end December 2017. An amount of Rs. 2075.0 billion (29.13%) of the total was advanced against “Merchandise” which increased by
Rs. 223.02 billion when compared with previous half year. “Fixed Assets Including Machinery” amounted to Rs. 1231.2 billion which increased by Rs. 98.01 billion when compared with December 2017. Advances against “Real Estate” accounted for Rs. 808.1 billion at end June 2018 and increased by Rs. 15.07 billion when compared with end December 2017. Apart from all these, Other Secured (Guarantees, etc) and Unsecured advances accounted for Rs. 2,568.8 billion (36.06%).

Review June – 2018
Statistics on Scheduled Banks in Pakistan xx
Table 7: Scheduled Banks’ Advances by Major Securities and their % Share (Billion Rs.)
Type of Security Jun-18 % Share Gold, Bullion, Gold and Silver Ornaments, Precious Metals 85.8 1.20 Securities, Shares, and Other Financial Instruments 318.3 4.47 Merchandise 2,075.0 29.13 Fixed Assets Including Machinery 1,231.2 17.28 Real Estate 808.1 11.35 Fixed Deposits and Insurance Policies 35.7 0.50 Others 2,568.8 36.06 Total 7,122.8 100.00
Advances by Borrowers
Classification of advances by borrowers can be viewed in table given below showing the position as at the end of June 2018 compared with previous period and the corresponding period of last year.
Table 8: Scheduled Banks’ Advances by Borrowers (Billion Rs.)
Borrowers Jun-18 Dec-17 Jun-17 HY Growth%
YOY Growth%
Government 833.7 676.7 691.4 23.20 20.58 Non-financial Public Sector Enterprises 1,046.8 880.8 804.4 18.85 30.14 Non-bank Financial Companies 80.7 79.2 81.4 1.88 -0.87 Private Sector (Business) 4,532.0 4,100.9 3,861.3 10.51 17.37 Trust Funds & Non- Profit Institutions 19.3 16.7 16.8 15.81 14.87 Personal 606.2 549.4 504.4 10.35 20.18 Others 4.1 2.9 6.2 43.95 -33.84 Total 7,122.8 6,306.5 5,965.9 12.94 19.39 * Total may differ due to rounding off.
Investments
Scheduled banks total investments (see Table-9) stood at Rs. 8,320.9 billion as on end June 2018 forming 28.9% of their total assets. Investment decreased by Rs. 284.1 billion (3.30%) and increased by Rs. 93.1 billion (1.13%) when compared with previous and corresponding half years respectively. The investments in Federal Government Bonds stood at Rs. 2,454.5 billion were 29.5% of the total investments. Investment in Treasury Bills formed

Review June – 2018
Statistics on Scheduled Banks in Pakistan xxi
57.37% of total investment followed by ‘Sukuks’ which contributed 5.82%. Foreign securities & shares and term finance certificate (TFC’s) form 1.94% and 1.00% of the total investment respectively. Total investment under ‘Others’ was Rs. 364.0 billion which includes Shares, Debentures, Mutual Funds, Modaraba Certificate, Participant Term Certificate, NIT, Certificate of Investment and Other Items.
Table 9: Scheduled Banks’ Investments
(Billion Rs.) Securities / Shares Jun-18 Dec-17 Jun-17 HY Growth% YOY Growth% Federal Government Bonds 2,454.5 2,965.9 3,374.8 -17.24 -27.27 Treasury Bills 4,773.5 4,588.5 3,783.6 4.03 26.16 Term Finance Certificate 83.3 75.2 101.9 10.65 -18.26 Sukuk Bonds 484.6 361.0 349.5 34.24 38.64 Foreign Securities & Shares 161.1 257.4 236.7 -37.40 -31.93 Others 364.0 357.0 381.3 1.95 -4.55 Total 8,320.9 8,605.0 8,227.8 -3.30 1.13 * Total may differ due to rounding off.
Province/Region Wise Deposits and Advances
A graphical display of the position of Province/Region wise share of outstanding deposits and advances for the current, previous and corresponding period is given below:
Review June – 2018
Statistics on Scheduled Banks in Pakistan xxii
A positive growth in total outstanding deposits has been observed in all the provinces/territories as on end June 2018 when compared with end December 2017. The highest growth in deposits is observed in FATA (28.23%), followed by Gilgit Baltistan (19.06%), Islamabad (13.29%), Khyber Pakhtunkhwa (11.57%), Balochistan (10.96%), AJK (7.39%), Punjab (5.84%), and Sindh (1.43%). The overall total outstanding advances have positive growth of 12.74%. Similar positive growth trends have been witnessed in advances of Gilgit-Baltistan, Punjab, Capital, Sindh, and KP with growth rates 15.54%, 15.39%, 22.08%, 9.09%, and 26.18% respectively. While Balochistan and FATA displayed a negative growth of 1.98% in outstanding advances during the period under review as compared to previous half year.
Islamic Banking
As on 30th June 2018, there were 21 banks involved in Islamic banking with a network of 2,450 branches in the country. Of these, 5 are full-fledged Islamic banks with 1361 branches and 16 of the existing scheduled banks have 1089 branches working as stand-alone ‘Islamic
Banking Branches’ (see Table-11).
Table 10: Province/Region Wise Share of Scheduled Banks Deposits and Advances (Percentage)
Province/Region Jun-18 Dec-17 Dec-17
Deposits Advances Deposits Advances Deposits Advances Punjab 43.5 45.2 43.5 44.2 43.3 45.0 Sindh 31.4 43.6 32.8 45.1 32.0 45.2 KPK 7.9 1.0 7.5 0.9 7.6 0.9 Baluchistan 2.4 0.2 2.3 0.5 2.4 0.2 Capital-Islamabad 11.7 9.8 10.9 9.0 11.3 8.5 FATA 0.2 0.0 0.2 0.0 0.2 0.0 Gilgit-Baltistan 0.4 0.1 0.4 0.1 0.4 0.1 AJK 2.5 0.2 2.4 0.2 2.7 0.2
Provinces / Regions
Growth Rate Deposits Advances
Punjab 5.84% 15.39% Sindh 1.43% 9.09% Khyber Pakhtunkhwa 11.57% 26.18%
Balochistan 10.96% -43.99% Capital 13.29% 22.08%
FATA 28.23% 31.83%
Gilgit - Baltistan 19.06% 15.54%
AJK 7.39% -1.98%

Review June – 2018
Statistics on Scheduled Banks in Pakistan xxiii
The activities of Islamic bank’s branches have shown improvement at end June 2018 compared with end December 2017. Outstanding deposits in these branches increased by Rs. 113.8 billion. Whereas, number of accounts (see Table 12) increased by 539,786. Financing shows increase in number of accounts by 23,441 and an increase in amount of Rs. 95.7 billion when compared with previous half year. Investments at book-value increased by Rs. 6.5 billion at the end of half-year under review compared with previous half-year (see Table-12).
Table 11: Summary of Islamic Banking Network (Numbers) Name of Banks Jun-18 Dec-17 Jun-17 A. Full-fledged Islamic Scheduled Banks’ Branches 1,361 1,270 1,214 Al Baraka Bank (Pakistan) Ltd. 175 175 173 Bankislami Pakistan Ltd. 218 218 204 Dubai Islamic Bank Ltd. 200 200 200 MCB Islamic Bank 166 76 66 Meezan Bank Ltd. 602 601 571 B. Stand-alone Islamic Branches of Existing Scheduled Banks 1089 1075 919 Allied Bank Limited 117 117 83 Askari Bank Ltd. 91 91 91 Bank Al Habib Ltd. 57 53 42 Bank Alfalah Ltd. 152 152 151 Faysal Bank Ltd 198 196 156 Habib Bank Ltd. 47 47 46 Habib Metropolitan Bank Ltd. 29 29 25 National Bank of Pakistan 115 113 90 SilkBank Ltd. 30 30 10 Sindh Bank Limited 14 14 14 Soneri Bank Ltd 18 17 17 Standard Chartered Bank (Pakistan) Ltd 9 9 9 Summit Bank Limited 11 11 11 The Bank of Khyber 84 83 79 The Bank of Punjab 68 64 48 United Bank Ltd. 49 49 47 Total 2,450 2,345 2,133

Review June – 2018
Statistics on Scheduled Banks in Pakistan xxiv
Table 12: Deposits, Financing and Investments of Islamic Banks on Gross Basis (Billion Rs.)
Items Jun-18 Dec-17 Jun-17 HY Growth (%) YOY Growth (%)
Deposits No. of Accounts 5,279,365 4,739,579 3,976,159 11.39 32.78 Amount 1843.7 1729.9 1594.7 6.58 15.62
Financing* No. of Accounts 177,592 154,151 199,611 15.21 -11.03 Amount 1303.4 1207.7 990.7 7.92 31.56
Investment Book-value 509.0 502.5 489.7 1.28 3.93 *Includes advances & bills
Table 13: Key Statistics of Scheduled Banks at a Glance (Billion Rs.)
Item Jun-18 Dec-17 Jun-17 Number of All Banks 33 33 34
Public Sector Commercial Banks 5 5 5 Domestic Private Banks 20 20 21 Foreign Banks 4 4 4 Specialized Banks 4 4 4
Number of (Reporting) Branches 13,692 13,628 13,039 Total Liabilities/Assets 28,815.0 27,553.4 24,618.6 Cash 1,424.8 1,258.7 1,215.1 Total Deposits (Excluding Inter-bank) 12,649.0 11,946.9 11,592.1
Demand 4,740.7 4,186.6 4,209.4 Savings 5,415.4 5,129.3 4,940.5 Time 2,492.9 2,631.0 2,442.2
Number of Accounts of Deposit Holders 53,111,547 50,565,334 49,006,112 Average Deposits per Account (Thousand Rs.) 238.2 236.3 236.5 Total Advances (Excluding Inter-bank) 7,122.8 6,306.5 5,965.9 Number of Accounts of Borrowers 3,298,472 3,555,512 3,327,343 Average Advances per Account (Thousand Rs) 2,159.4 1,773.7 1,793.0 Bills Purchased and Discounted 241.4 225.7 209.0 Investments in Securities & Shares 8,320.9 8,605.0 8,227.8 Bank Loan (Advances + Bills) 7,364.2 6,532.1 6,174.9 Percentages:
Deposits to Total Liabilities 43.90% 43.36% 47.09% Cash to Deposits 11.26% 10.54% 10.48% Advances to Total Assets 24.72% 22.89% 24.23% Time Deposits to Total Deposits 19.71% 22.02% 21.07% Advances to Deposits 56.31% 52.79% 51.47% Investments to Deposits 65.78% 72.03% 70.98% Bank Loan to Deposits 58.22% 54.68% 53.27% (Loan + Investments) to Deposits 124.00% 126.70% 124.25%
Weighted Average:
Deposits Rates (Excluding Zero Rate)
• Overall 4.41% 3.93% 3.84% • Interest Bearing 2.00% 0.72% 0.87% • Profit & Loss Sharing 4.59% 4.21% 4.07%
Advances Rates 8.10% 7.76% 7.49%

Review June – 2018
Statistics on Scheduled Banks in Pakistan xxv
Table 14: Distribution of Deposits, Advances, Bills Purchased & Discounted and Investments of Scheduled Banks by Group
(Billion Rs)
Group Deposits Advances Bills Investments Jun-18 Dec-17 Jun-18 Dec-17 Jun-18 Dec-17 Jun-18 Dec-17
All Banks 12,649.0 11,946.9 7,122.8 6,306.5 241.4 225.7 8,320.9 8,605.0 1. Public Sector Commercial Banks 2,340.2 2,185.7 1,353.7 1,216.5 39.0 32.0 1,766.4 1,776.0 2. Domestic Private Banks 10,081.9 9,520.7 5,545.2 4,881.0 194.8 186.6 6,245.2 6,460.7 3. Foreign Banks 154.6 159.2 52.3 36.5 7.5 7.0 258.0 293.2 4. Specialized Banks 72.4 81.3 171.7 172.5 0.0 0.0 51.4 75.2 Commercial Banks (1+2+3) 12,576.7 11,865.6 6,951.1 6,133.9 241.4 225.7 8,269.5 8,529.9 * Total may differ due to rounding off.
Table 15: Maturity Breakup of Term Deposits of Scheduled Banks by Group
(Billion Rs.)
Period of Maturity All Banks
Public Sector Commercial
Banks
Domestic Private Banks Foreign Banks Specialized
Banks
Jun-18 Dec-17 Jun-18 Dec-17 Jun-18 Dec-17 Jun-18 Dec-17 Jun-18 Dec-17
For Less Than 3 Months 438.1 451.9 45.6 48.1 366.5 374.1 17.9 22.8 8.1 6.9
For 3 Months and Over but Less Than 6 Months 482.2 510.6 63.2 63.9 388.9 407.1 26.5 19.1 3.6 20.5
For 6 Months and Over but Less Than 1 Years. 398.1 413.3 42.0 36.4 326.7 353.8 0.7 5.6 28.7 17.5
For 1 Year and Over but Less Than 2 Years. 916.2 990.9 307.5 338.8 606.4 650.3 0.3 0.3 2.0 1.5
For 2 Years and Over but Less Than 3 Years. 29.1 29.6 3.5 3.9 25.2 25.4 0.0 0.0 0.3 0.3
For 3 Years and Over but Less Than 4 Years. 58.9 56.0 11.8 12.4 47.1 43.7 0.0 0.0 0.0
For 4 Years and Over but Less Than 5 Years. 9.8 10.4 0.3 0.7 9.4 9.7 0.1 0.1
For 5 Years and Over 160.6 168.3 71.9 76.5 88.6 91.5 0.0 0.0 0.2 0.2
Total 2492.9 2631.0 545.8 580.6 1858.7 1955.5 45.4 47.9 42.9 47.0
Total may differ due to rounding off

Review June – 2018
Statistics on Scheduled Banks in Pakistan xxvi
Table 16: Advances by Modes of Financing (Billion Rs.)
Modes of Financing Jun-18 Dec-17 Jun-17
No. of Accounts Amount No. of
Accounts Amount No. of Accounts Amount
I. Interest Based 330,519 385.3 265,642 350.2 292,722 329.1 II. Islamic Modes 2,967,953 6,737.5 3,289,870 5,956.3 3,034,621 5,636.9
a) Mark-Up in Price on Deferred Payment Basis
2,498,750 5,308.0 2,632,952 4,608.0 2,464,848 4,445.2
b) Rent-Sharing - - - -
c) Qarz-e-Hasna 19,020 0.3 18,797 0.3 21,519 0.3
d) Musharaka or Profit and Loss 33,145 116.8 1,776 90.9 34,230 68.4
e) Leasing 55,531 108.6 74,812 137.4 71,961 102.9
f) Hire Purchase 36,114 24.1 34,726 22.1 32,986 18.6
g) Buy Back 50,428 170.6 61,647 139.8 72,263 134.0
h) Mark Down in Prices - - - -
i) Service Charges 43,994 2.2 43,922 2.2 42,485 2.1
j) Concessional Service Charges - - - -
k) Other Islamic Modes 230,971 1,007.0 421,238 955.6 294,329 865.4
Total (I+II) 3,298,472 7,122.8 3,555,512 6,306.5 3,327,343 5,965.9
* Total may differ due to rounding off
Table 17: Province/Region Wise Deposits and Advances ( Billion Rupees )
Provinces / Regions Jun-18 Dec-17 Jun-17 Deposits Advances Deposits Advances Deposits Advances
Overall 12,649.0 7,122.8 11,946.9 6,306.5 11,592.1 5,965.9 Punjab 5,505.8 3,219.2 5,202.1 2,789.9 5,023.0 2,683.3 Sindh 3,976.9 3,102.7 3,920.8 2,844.2 3,709.2 2,695.0 Khyber Pakhtunkhwa 1,000.3 71.6 896.6 56.8 878.8 54.9 Balochistan 300.2 16.1 270.5 28.8 278.3 11.6 Capital 1,474.1 695.9 1,301.2 570.0 1,306.4 505.4 FATA 27.9 0.7 21.8 0.5 26.7 0.7 Gilgit - Baltistan 53.5 5.1 44.9 4.4 51.0 4.1 AJK 310.4 11.6 289.0 11.8 318.7 11.0