Embed Size (px)
Citation preview
Statistics on Private Housing Supply in
Primary Market (As at 31 December 2020)

(1) Potential private housing land supply – including Government residential sites which are yet to be sold, Railway
& Urban Renewal Authority (URA) sites which are yet to be awarded to joint venture developers, and privately-
owned sites with planning approval for residential use but for which requisite lease modifications/land exchanges
have yet to be agreed with the Government.
(2) Disposed sites for which construction has yet to start – including sold Government residential sites, and
Railway/URA/privately owned sites with planning approval for residential use and for which requisite lease
modifications/land exchanges have been executed with the Government. Construction for these sites may start at
any time.
(3) Projects under construction – including sites coming from (2) above and private housing redevelopment sites
(for which lease modifications are not required) for which foundation works have commenced (superstructure
works in the case of railway property projects) (Figures 1 & 3 refer).
(4) Completed projects – Projects for which construction has been completed and issued with occupation permit
(Figures 2 & 3 refer).
Stages of Private Housing Development
Comparing with the data released by other departments, press here

13,400
10,300
18,600
14,100
17,300
14,200
25,500
17,000
18,400 18,500
11,800
0
5,000
10,000
15,000
20,000
25,000
30,000
2010 2011 2012 2013 2014 2015 2016 2017 2018 2019 2020
(1) Excluding village housing.
(2) Construction refers to commencement of (i) foundation works & (ii) superstructure works for railway property
projects. This figure is based on the development information at the first notification of commencement of
construction, and may be subject to change during the construction stage.
(3) Figures rounded to the nearest hundred.
No
. o
f U
nit
s
Private Residential Units commenced construction (As at 31.12.2020)(1)
Number of units for which construction commenced during the year
Figure 1
For details on 2020, press here
(2)(3)

Figure 1 shows the number of private residential units of which
construction commenced each year, from 2010 to 2020.
Figure 1 Cont’d
Commencement of Construction of Private Residential Units
The figures are based on Notification of Commencement of Foundation
Works filed with the Buildings Department by contractors. For
residential developments atop railway stations or depots, the figures are
based on Notification of Commencement of General Building and
Superstructure Works filed with the Buildings Department as the
foundation works have been completed at the time of railway
construction.

13,400
9,400 10,100
8,300
15,700
11,300
14,600
17,800
21,000
13,600
20,900
0
5,000
10,000
15,000
20,000
25,000
30,000
35,000
2010 2011 2012 2013 2014 2015 2016 2017 2018 2019 2020
No
. o
f U
nit
s
Private Residential Units completed (As at 31.12.2020)(1)
Number of units completed during the year
Figure 2
For details on 2020, press here(1) Excluding village housing.
(2) Figures rounded to the nearest hundred.
(2)
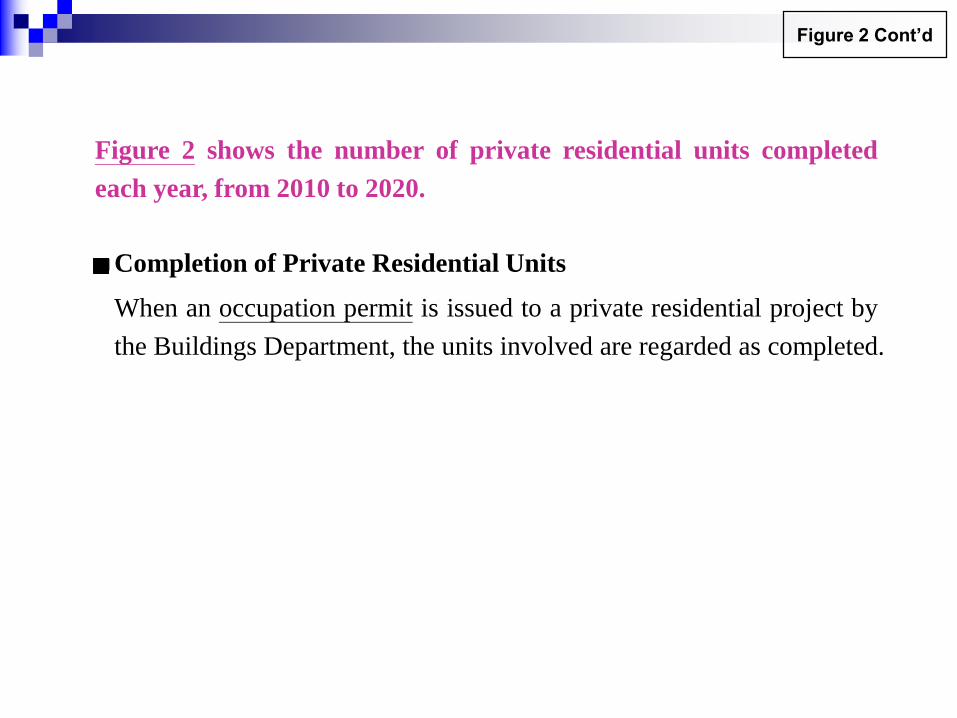
Figure 2 shows the number of private residential units completed
each year, from 2010 to 2020.
Figure 2 Cont’d
Completion of Private Residential Units
When an occupation permit is issued to a private residential project by
the Buildings Department, the units involved are regarded as completed.

Figure 3 shows the number of unsold units in completed projects, units under construction not
yet sold by presale, and units from disposed sites where construction may start anytime in the
private housing primary market(1)(2).
Figure 3
The figures refer to the number of first-hand private residential units that may be available in
the coming three to four years, comprising:
Some 92,000 units may be available in the coming three to four years.
The figures only represent a snapshot as seen on 31.12.2020, and WILL CHANGE over time. The time
taken to complete new private residential projects may vary, depending on the circumstances of each project.
Footnotes:
(1) Excluding village housing.
(2) Figures rounded to the nearest thousand.
(3) Projects cover those completed since 2013.
(A) unsold units in completed projects(3) ;
(B) units under construction
less : units sold by presale;
(C) units from disposed sites where construction
may start anytime
12,000 units
+ 70,000 units
− 13,000 units
+ 23,000 units
Total: 92,000 units
EndFor details on (A), press here For details on (B), press hereFor details on (A), press here For details on (B), press here

Annexes

Comparison of private housing supply data released on this website with those released by other departments
Data released on this website Related data released by other departments
(1)
Commencement
of construction
Commencement of Construction of Private Residential
Units (Figure 1). The figures are based on Notification of
Commencement of Foundation Works filed with the
Buildings Department by contractors. For residential
developments atop railway stations or depots, the figures are
based on Notification of Commencement of General
Building and Superstructure Works filed with the Buildings
Department because the foundation works have been
completed at the time of railway construction.
Buildings Department - Consent to Commence General
Building and Superstructure Works (listed in its Monthly
Digest). “Consent to Commence General Building and
Superstructure Works” is sometimes adopted in some
private-sector analyses as the basis for estimating the number
of units under construction. It should be noted that “Consent
to Commence General Building and Superstructure Works” is
different from “Notification of Commencement of Works”.
Construction of units for which “Consent to Commence
General Building and Superstructure Works” has been issued
may not commence work immediately. Before construction
commences, “Notification of Commencement of Works” has
to be filed with Buildings Department.
(2)
Completion
Completion of Private Residential Units (Figure 2).
When an occupation permit is issued to a private residential
project by the Buildings Department, the units involved are
regarded as completed. This figure includes private
housing units converted from subsidised sale housing units.
Buildings Departments - Completion of New Domestic
Buildings (listed in its Monthly Digest). This figure
includes not only private housing but also various subsidised
housing schemes.
Rating and Valuation Department - Completion of private
domestic units. This figure refers to the private domestic
units for which occupation permits have been issued by the
Buildings Department.
To be Continued
Annex to flow chart

Back to flow chart
Continued
Comparison of private housing supply data released on this website with those released by other departments
Data released on this website Related data released by other departments
(3)
Unsold units in
completed
projects
Unsold units in completed projects (Figure 3). This figure
refers to those private residential units completed since 2013
which remain unsold.
Rating and Valuation Department - Vacancy (listed in its
Annual Hong Kong Property Review). This figure refers
to vacant units known to Rating & Valuation Department at
the time of its survey of private housing units conducted at the
end of the year. These vacant units may include units under
decoration or being let, hence remaining unoccupied. This
figure is not the same as the number of unsold units of
completed projects (held by developers) in the private housing
primary market.
(4)
Units under
construction less
units sold by
presale
Units under construction less units sold by presale
(Figure 3). This figure refers to those units under
construction but not yet sold. They are potential supply in
the primary market.
Not applicable.
(5)
Units from
disposed sites
where
construction may
start anytime
Units from disposed sites where construction may start
anytime (Figure 3). This figure refers to Government sites
sold by land sale, projects awarded by the MTR Corporation
Ltd., redevelopment projects awarded by the Urban Renewal
Authority and new cases of executed land exchange / lease
modifications for residential development.
Lands Department :
Land Sale Records – Sold residential sites, some of which
may have commenced construction.
Land Exchanges or Lease Modifications - This figure
comprises new cases of executed land exchange or lease
modification, further modification of an existing lease or
land exchange, and lease modification cases which do not
involve private housing production.
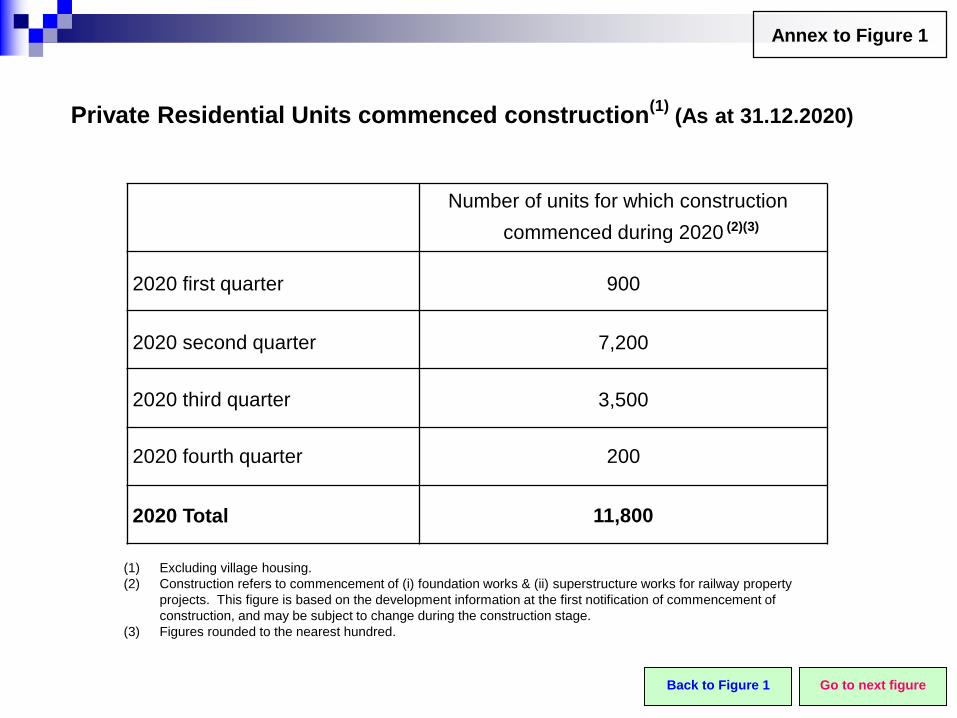
Private Residential Units commenced construction(1)
(As at 31.12.2020)
Go to next figure
Annex to Figure 1
Back to Figure 1
Number of units for which construction
commenced during 2020 (2)(3)
2020 first quarter
2020 second quarter
900
2020 third quarter
2020 fourth quarter
2020 Total 11,800
(1) Excluding village housing.
(2) Construction refers to commencement of (i) foundation works & (ii) superstructure works for railway property
projects. This figure is based on the development information at the first notification of commencement of
construction, and may be subject to change during the construction stage.
(3) Figures rounded to the nearest hundred.
200
3,500
7,200
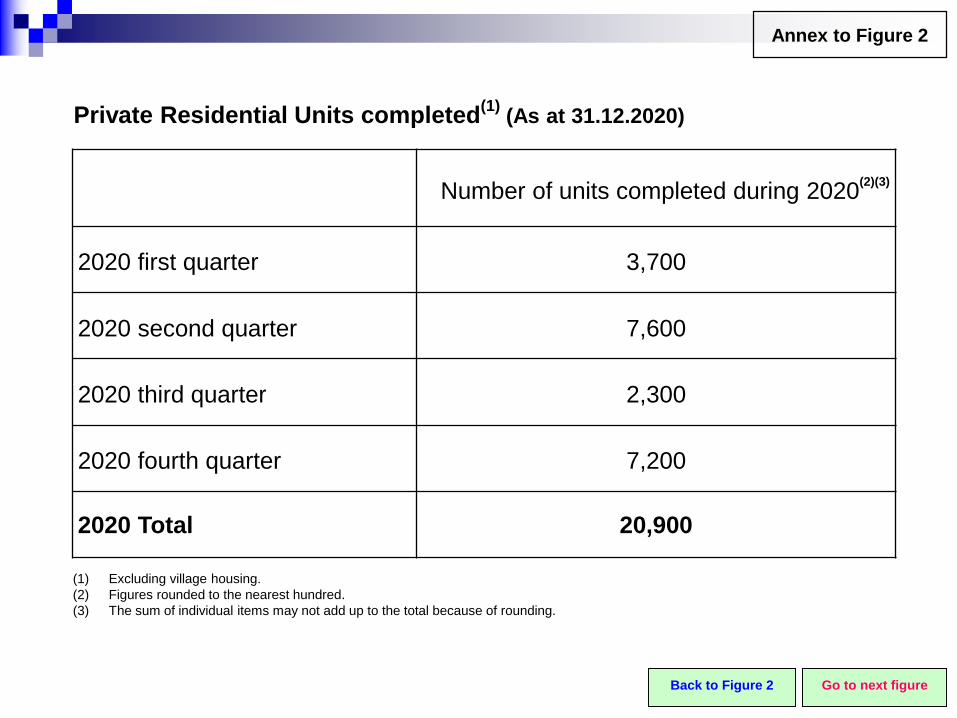
Private Residential Units completed(1)
(As at 31.12.2020)
Go to next figure
Annex to Figure 2
Back to Figure 2
Number of units completed during 2020(2)(3)
2020 first quarter 3,700
2020 second quarter
2020 third quarter
2020 fourth quarter
2020 Total 20,900
(1) Excluding village housing.
(2) Figures rounded to the nearest hundred.
(3) The sum of individual items may not add up to the total because of rounding.
7,200
2,300
7,600

(A) Unsold units of completed projects (As at 31.12.2020)
Back to Figure 3
Annex 1 to Figure 3
Year of completion Unsold units of completed projects
Pre 2018 3,900
2018
2019 2,200
2020
Total
12,300
4,400
1,800
Rounded to the
nearest hundred
Rounded to the
nearest thousand 12,000
(1) Among the 12,300 unsold first-hand units in completed projects, it is estimated that about 3,400 units (28%) are for self-use or are
let out (e.g. as serviced apartments) by the developers.
(1)
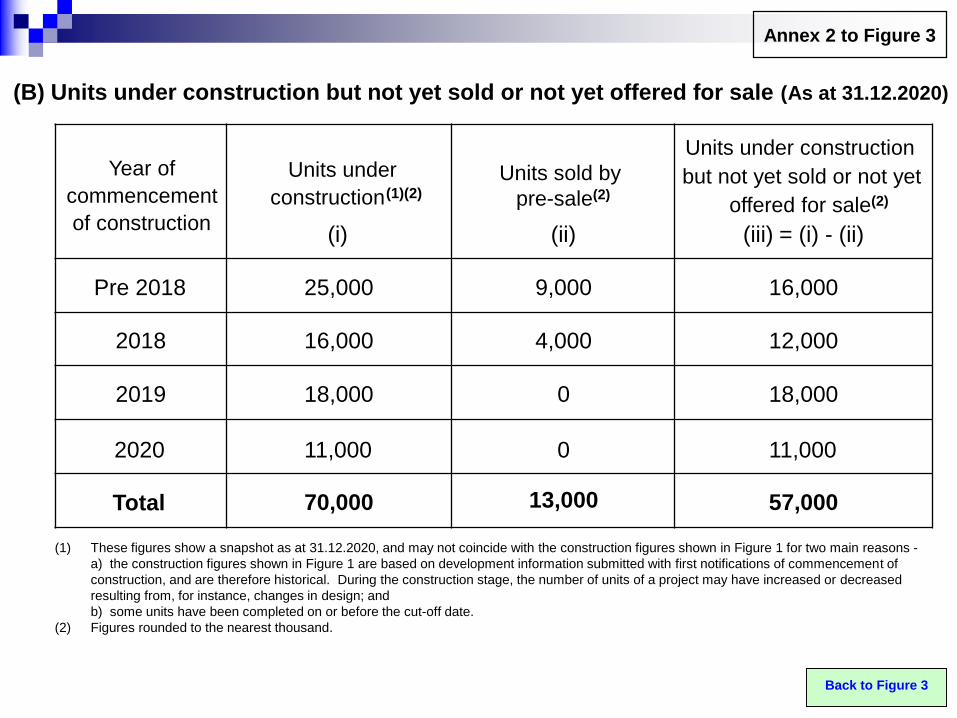
(B) Units under construction but not yet sold or not yet offered for sale (As at 31.12.2020)
Annex 2 to Figure 3
Back to Figure 3
Year of
commencement
of construction
Units under
construction(1)(2)
Units sold by
pre-sale(2)
Units under construction
but not yet sold or not yet
offered for sale(2)
(i) (ii) (iii) = (i) - (ii)
Pre 2018 25,000 9,000 16,000
2018 16,000 4,000 12,000
2019 18,000 0 18,000
0
Total 70,000 13,000 57,000
(1) These figures show a snapshot as at 31.12.2020, and may not coincide with the construction figures shown in Figure 1 for two main reasons -
a) the construction figures shown in Figure 1 are based on development information submitted with first notifications of commencement of
construction, and are therefore historical. During the construction stage, the number of units of a project may have increased or decreased
resulting from, for instance, changes in design; and
b) some units have been completed on or before the cut-off date.
(2) Figures rounded to the nearest thousand.
11,0002020 11,000

End
Back to first page