Embed Size (px)
Citation preview

2016 Minerals Yearbook
U.S. Department of the Interior U.S. Geological Survey
STATISTICAL SUMMARY [ADVANCE RELEASE]
January 2021[Revised September 2021]

StatiStical Summary—2016 [aDVaNcE rElEaSE] 2.1
Statistical SummaryBy Joseph m. Krisanda
this annual report summarizes data on nonfuel mineral production1 for the united States including the commonwealth of Puerto rico.
although nonfuel mineral production quantity may be measured at any stage of extraction and processing, the stage of measurement used most commonly in this report is “mine output.” this term refers to minerals or ores in the form in which they are first extracted from the ground and customarily may include the output from auxiliary processing at or near the mines. mine output as measured as material sold or used by producers in a given year is what is primarily shown in the
1the terms “nonfuel mineral production” and related “values” encompass variations in meaning, depending upon the mineral products. Production may be measured by mine shipments, mineral commodity sales, or marketable production (including consumption by producers) as is applicable to the individual mineral commodity.
all 2016 u.S. Geological Survey (uSGS) mineral production data published in this chapter are as of march 2019. For some mineral commodities, such as construction sand and gravel, crushed stone, and portland cement, estimates are updated periodically. to obtain the most current information, please check the most recent publications posted on the commodity pages of the uSGS National minerals information center (Nmic) at https://www.usgs.gov/centers/nmic/commodity-statistics-and-information. contact information for uSGS mineral commodity specialists is also found on those pages. alternatively, specialists’ names and telephone numbers may be obtained by calling the main Switchboard for the uSGS National center at 1–703–648–4000 or by calling uSGS Science information Services at 1–888–aSK–uSGS (1–888–275–8747). minerals yearbook chapters for countries and u.S. States are also available on the Nmic website at https://www.usgs.gov/centers/nmic.
tables, because values can be assigned. Where sold or used data are not available, mine output is used as the production measurement and value is estimated based on the average price of the mineral commodity for that year.
For copper, gold, lead, palladium, platinum, silver, and zinc, the production quantities listed are recorded on a mine basis (as the recoverable content of ore sold or treated). the values assigned to the quantities, however, are based on the average selling price of refined metal, not the value of the mined material.
the total value of all nonfuel mineral production in the united States in 2016 decreased slightly to $70.9 billion compared with $73.0 billion for 2015; metals decreased by 3.7% to $23.5 billion, and industrial minerals decreased slightly to $47.4 billion (table 1).
in 2016, 12 mineral commodities had production values greater than $1 billion. they were, in descending order of value, crushed stone, portland cement, gold, construction sand and gravel, copper, iron ore, industrial sand and gravel, lime, salt, marketable phosphate rock, soda ash, and zinc. the production of these mineral commodities accounted for 89.3% of the u.S. total production value (table 1).
in 2016, the top 10 States, in descending order of value of nonfuel mineral production, were Nevada, arizona, texas, california, Florida, alaska, minnesota, michigan, missouri, and Wyoming. the mineral production of these States accounted for 54.7% of the u.S. total production value (table 3).

2.2 [aDVaNcE rElEaSE] u.S. GEOlOGical SurVEy miNEralS yEarBOOK—2016
Quantity Value Quantity Value Quantity ValueMetals:
Beryllium4 metric tons 270 W 205 W 155 WCobalte, 5 do. 120 W 760 W 690 WCopper6 1,360 9,510,000 1,380 7,810,000 1,430 7,090,000Gold6 kilograms 210,000 8,570,000 214,000 8,000,000 222,000 8,950,000Iron ore7 56,100 4,730,000 46,100 3,750,000 41,800 3,050,000Lead6 metric tons 367,000 860,000 360,000 724,000 336,000 699,000Molybdenum mineral concentrates8 do. 68,200 1,610,000 47,400 700,000 36,200 481,000Nickel9 do. 4,300 W 27,200 W 24,100 WPalladium6 kilograms 12,400 324,000 12,500 280,000 13,100 259,000Platinum6 do. 3,660 163,000 3,670 125,000 3,890 124,000Rare earthse, 10 metric tons 5,400 W 5,900 W -- --Rheniume, 11 kilograms 8,510 NA 7,900 NA 8,440 NASilver6 do. 1,180,000 727,000 r 1,090,000 551,000 1,150,000 633,000Titanium mineral concentrates, metric tons 200,000 12 W 300,000 12 W 100,000 12 W
ilmeniteZinc6 do. 803,000 1,900,000 797,000 1,680,000 778,000 1,740,000Zirconium mineral concentrates do. (13) W 80,000 12 W (13) WCombined values of cadmium (byproduct of zinc XX 496,000 XX 802,000 XX 486,000
production), magnesium metal, titanium mineralconcentrates (rutile), and values indicated bysymbol WTotal XX 28,900,000 XX 24,400,000 XX 23,500,000
Industrial minerals, excluding fuels:14
Barite 663 74,500 r, e 439 r 51,800 r, e 240 23,400 e
Cement:7
Masonry 2,220 15 323,000 e 2,311 15 350,000 e 2,514 15 396,000 e
Portland 80,315 15 7,980,000 e 82,094 15 8,640,000 e 82,181 15 9,040,000 e
Clay:Ball claye 1,030 45,200 1,030 47,500 975 44,000Bentonite 4,830 r 326,000 r 4,050 r 299,000 r 3,600 270,000Common clay and shale 10,200 r 127,000 r 11,300 r 167,000 r 11,700 173,000Fire clay 394 r 4,180 r 393 r 5,000 r 528 7,090Fullerʼs earth, montmorillonite 2,040 r 176,000 r 1,960 r 169,000 r 1,860 166,000Kaoline 6,020 r 867,000 r 5,810 r 877,000 r 5,320 833,000
Diatomite 901 269,000 832 242,000 686 195,000Feldspare, 7 metric tons 530,000 16 34,800 520,000 16 37,300 470,000 16 33,100Garnet, industrial7, 17 do. 42,100 r 9,350 r 55,200 r 12,700 r 56,400 12,800Gemstones, naturale, 7 NA 9,490 NA 8,540 NA 11,700Gypsum, crude7 16,200 r 129,000 r 16,600 r 129,000 r 17,000 136,000Helium:
Crude million cubic meters 27.2 93,100 25.0 85,900 22.9 82,600Grade-A do. 102 904,000 90.7 654,000 89.3 614,000
Kyanite18 metric tons 88,600 r 29,000 r, e 109,000 r 38,000 r, e 79,700 28,000 e
Lime19 19,500 2,390,000 18,300 2,290,000 17,700 2,210,000Mica, crude do. 48,200 5,640 32,600 4,640 30,900 3,310Peat do. 479,000 12,000 460,000 r 13,000 r 443,000 14,200Perlite, crude do. 462,000 25,500 444,000 r 26,900 r 437,000 28,400Phosphate rock, marketable7 25,300 1,990,000 27,400 1,980,000 27,100 2,090,000Potash16 2,000 680,000 1,500 550,000 1,400 410,000Pumice and pumicite metric tons 269,000 10,400 310,000 10,100 374,000 14,300Salt 46,000 2,180,000 42,800 2,360,000 40,200 2,190,000
Commodity
See footnotes at end of table.
2014 2015 2016
TABLE 1NONFUEL MINERAL PRODUCTION IN THE UNITED STATES1, 2, 3
(Thousand metric tons and thousand dollars unless otherwise specified)

StatiStical Summary—2016 [aDVaNcE rElEaSE] 2.3
Quantity Value Quantity Value Quantity ValueIndustrial minerals, excluding fuels:14—Continued
Sand and gravel:Construction 830,000 r 6,670,000 881,000 r 7,290,000 r 888,000 7,460,000Industrial 110,000 8,240,000 102,000 r 4,840,000 r 77,700 2,630,000
Silica stone, special7 metric tons 146 e 36 e 205 49 300 e 72 e
Silica, tripoli7 do. 93,100 19,500 70,500 19,400 56,600 17,300Soda ash7 11,700 1,730,000 11,600 1,800,000 11,800 1,770,000Stone:
Crushed 1,250,000 12,700,000 r 1,340,000 r 14,200,000 r 1,360,000 15,100,000Dimension 2,470 470,000 2,630 461,000 2,790 445,000
Talc, crude7 metric tons 608,000 16,700 615,000 r 18,100 r 536,000 16,300Vermiculite, concentratese 100 20 W 106 20 W 100 20 WZeolites7 metric tons 62,800 W 75,100 W 73,400 WCombined values of andalusite, bauxite, boron XX 907,000 r XX 935,000 r XX 948,000
minerals, bromine, clay (attapulgite), emery(2014), iodine (crude), iron oxide pigments(crude), lithium carbonate, magnesite,magnesium compounds, pyrophyllite (crude),staurolite, wollastonite, and values indicatedby symbol WTotal XX 49,500,000 r XX 48,600,000 r XX 47,400,000
Grand total XX 78,400,000 r XX 73,000,000 r XX 70,900,000
8Recoverable content of molybdenum mineral concentrates. Value is based on the metal oxide content.9Recoverable content of nickel sulfide concentrates.10Rare-earth-oxide (REO) basis.11Based on 80% recovery of estimated rhenium contained in molybdenum mineral concentrates.
19Includes Puerto Rico.20Rounded to the nearest 100,000 metric tons.
13Withheld to avoid disclosing company proprietary data.14Sold or used, unless otherwise specified.15Data are not rounded. Refer to the Minerals Yearbook cement chapter.16Data are rounded to no more than two significant digits.17Crude garnet production. Refer to the Minerals Yearbook garnet chapter for refined garnet production.18Production based on publicly available data; refer to the Minerals Yearbook kyanite chapter. Value data are rounded to no more than two significant digits.
2016Commodity
12Data rounded to no more than one significant digit to avoid disclosing company proprietary data.
1Table includes data from the commodity chapters published in the U.S. Geological Survey 2016 Minerals Yearbook as they were completed and released through March 2019.2Production as measured by mine output, mine shipments, sales, or marketable production (including consumption by producers). Mine output measured as sold or used by producers is primarily shown in the tables, because values can be assigned. Where sold or used data are not available, actual mine output is used as the production measurement and value is estimated average price of the mineral commodity for that year. Data are reported in gross weight unless otherwise specified.3Data are rounded to no more than three significant digits, unless otherwise specified; may not add to totals shown.4Beryllium content of mine shipments of beryllium-containing ores. Calculated based on 4% metal content. Data are rounded to the nearest 5 metric tons.5Cobalt content of concentrates.6Recoverable content of ores and concentrates. The values assigned to the quantities, however, are based on the average selling price of refined metal, not the value of the mined material.7Production, mine output.
eEstimated. rRevised. do. Ditto. NA Not available. W Withheld to avoid disclosing company proprietary data; value included with “Combined values.” XX Not applicable. -- Zero.
TABLE 1—ContinuedNONFUEL MINERAL PRODUCTION IN THE UNITED STATES1, 2, 3
(Thousand metric tons and thousand dollars unless otherwise specified)
2014 2015

2.4 [aDVaNcE rElEaSE] u.S. GEOlOGical SurVEy miNEralS yEarBOOK—2016
Commodity2 Principal States3 Other States3
Andalusite NCBarite GA and NVBeryllium UTBoron minerals CABromine ARCement:
Masonry AL, CA, FL, IN, TX AR, AZ, CO, GA, KS, KY, MD, ME, MI, MO, MT, NM, NY, OH, OK, PA, SC, SD, TN, VA, WV.Portland AL, CA, FL, MO, TX All other States, except AK, CT, DE, HI, ID, LA, MA, MN, MS, NC, ND, NH, NJ, RI, VT, WI.
Clay:Ball clay IN, KY, MS, TN, TXBentonite AL, AZ, MS, UT, WY CA, MT, NV, OR, TX.Common clay and (or) shale AL, NC, NY, OK, TX All other States, except AK, DE, FL, HI, ID, MN, NH, NJ, NV, RI, VT, WI.Fire clay CO, MO, OH, TXFullerʼs earth:
Attapulgite FL, GA, NVMontmorillonite CA, GA, MO, MS, VA IL, KS, TN, TX.
Kaolin AL, AR, GA, NV, SC CA, FL, TX.Cobalt MICopper4 AZ, MT, NM, NV, UT MI, MO.Diatomite CA, NV, OR, WAFeldspar CA, ID, NC, OK, VA SD.Garnet, industrial ID, MT, NYGemstones, natural5 AZ, CA, CO, ID, OR All other States.Gold4 AK, CA, CO, NV, UT AZ, MI, MT, NM, SD, WA.Gypsum, crude IA, KS, NV, OK, TX AR, AZ, CA, CO, IN, LA, MI, NM, SD, UT, WY.Helium:
Crude KS and TXGrade-A AZ, CO, KS, OK, WY UT.
Iodine, crude OKIron ore MI and MNIron oxide pigments, crude AL, GA, UTKyanite VALead4 AK, ID, MO, WALime AL, KY, MO, OH, TX All other States, except AK, CT, DE, HI, IL, KS, MD, ME, MS, NC, NH, NJ, NM, NY, RI, SC, VT.Lithium carbonate NVMagnesite NVMagnesium compounds CA, DE, MI, UTMagnesium metal UTMica, crude GA, NC, SDMolybdenum mineral AZ, CO, MT, NV, UT
concentratesNickel4 MIOlivine WAPalladium4 MTPeat FL, IL, ME, MI, MN IA, IN, NJ, NY, OH, PA, WA.Perlite, crude AZ, ID, NM, NV, ORPhosphate rock FL, ID, NC, UTPlatinum4 MTPotash NM and UTPumice and pumicite CA, ID, KS, NM, ORPyrophyllite, crude NCSalt KS, LA, NY, OH, TX AL, AZ, CA, MI, NM, NV, OK, TN, UT, VA, WV.Sand and gravel:
Construction AZ, CA, MI, MN, TX All other States.Industrial IL, MO, NC, TX, WI All other States, except AK, CT, DE, HI, ID, KS, MA, MD, ME, MT, NH, NM, UT, VT, WY.
Silica stone, special6 ARSilica, tripoli AR, IL, MO
TABLE 2NONFUEL MINERALS PRODUCED IN THE UNITED STATES, BY COMMODITY AND STATES IN 20161
(Principal States based on quantity unless otherwise noted)
See footnotes at end of table.

StatiStical Summary—2016 [aDVaNcE rElEaSE] 2.5
Commodity2 Principal States3 Other States3
Silver4 AK, AZ, ID, NV, UT CA, CO, MO, MT, NM, SD.Soda ash CA and WYStaurolite FLStone:
Crushed FL, MO, OH, PA, TX All other States.Dimension GA, IN, MA, TX, WI All other States, except AK, DE, FL, HI, IA, KY, LA, MS, ND, NE, NJ, OR, RI, SC, WV, WY.
Talc, crude MT, TX, VTTitanium mineral concentrates:
Ilmenite FL and GARutile GA
Vermiculite, crude SC and VAWollastonite NYZeolites CA, ID, NM, OR, TX MT.Zinc4 AK, ID, MO, TN, WAZirconium mineral concentrates FL and GA
6Grindstones, pulpstones, and sharpening stones; does not include mill liners and grinding pebbles.
(Principal States based on quantity unless otherwise noted)
2In addition to the commodities listed, bauxite was produced in Alabama, Arkansas, and Georgia; cadmium was recovered as a byproduct from zinc mineral concentrates in Tennessee; small quantities of fluorspar were intermittently produced in Kentucky; and rhenium was recovered as a byproduct from molybdenum mineral concentrates in Arizona, Montana, and Utah.3Listed in alphabetical order by abbreviation.4Recoverable content of ores and concentrates.5Principal States according to value.
1Table includes data from the commodity chapters published in the U.S. Geological Survey 2016 Minerals Yearbook as they were completed and released through March 2019.
TABLE 2—ContinuedNONFUEL MINERALS PRODUCED IN THE UNITED STATES, BY COMMODITY AND STATES IN 20161

2.6 [aDVaNcE rElEaSE] u.S. GEOlOGical SurVEy miNEralS yEarBOOK—2016
Value2 PercentState (thousands) Rank3 of U.S. total4 Principal commodities5
Alabama $1,310,000 19 1.84 Cement (masonry and portland), lime, sand and gravel (construction), stone (crushed). Alaska 3,300,000 6 4.65 Gold, lead, sand and gravel (construction), silver, zinc.Arizona 5,870,000 2 8.27 Cement (portland), copper, molybdenum mineral concentrates, sand and gravel (construction),
stone (crushed).Arkansas 762,000 31 1.07 Bromine, cement (portland), sand and gravel (construction), sand and gravel (industrial),
stone (crushed).California 3,450,000 4 4.86 Boron minerals, cement (portland), sand and gravel (construction), soda ash, stone (crushed).Colorado 1,460,000 16 2.06 Cement (portland), gold, molybdenum mineral concentrates, sand and gravel (construction),
stone (crushed).Connecticut6 206,000 42 0.29 Clay [common clay and (or) shale], sand and gravel (construction), stone (crushed),
stone (dimension).Delaware6 23,500 50 0.03 Magnesium compounds, sand and gravel (construction), stone (crushed).Florida 3,420,000 5 4.83 Cement (masonry and portland), phosphate rock, sand and gravel (construction),
stone (crushed).Georgia 1,830,000 13 2.57 Cement (portland), clay (kaolin and montmorillonite), sand and gravel (construction),
stone (crushed).Hawaii 118,000 46 0.17 Gemstones (natural), sand and gravel (construction), stone (crushed).Idaho 594,000 35 0.84 Lead, phosphate rock, sand and gravel (construction), silver, stone (crushed).Illinois6 1,230,000 20 1.73 Cement (portland), sand and gravel (construction), sand and gravel (industrial), silica (tripoli),
stone (crushed).Indiana 1,000,000 25 1.42 Cement (portland), lime, sand and gravel (construction), stone (crushed), stone (dimension).Iowa6 575,000 28 0.81 Cement (portland), lime, sand and gravel (construction), sand and gravel (industrial),
stone (crushed).Kansas6 650,000 23 0.92 Cement (portland), helium (crude and Grade-A), salt, stone (crushed).Kentucky6 506,000 29 0.71 Cement (portland), lime, sand and gravel (construction), sand and gravel (industrial),
stone (crushed).Louisiana6 548,000 33 0.77 Clay [common clay and (or) shale], salt, sand and gravel (construction), sand and gravel
(industrial), stone (crushed).Maine6 110,000 44 0.16 Cement (portland), peat, sand and gravel (construction), stone (crushed), stone (dimension).Maryland6 352,000 34 0.50 Cement (masonry and portland), clay [common clay and (or) shale], sand and gravel
(construction), stone (crushed).Massachusetts6 296,000 40 0.42 Clay [common clay and (or) shale], lime, sand and gravel (construction), stone (crushed),
stone (dimension).Michigan 2,620,000 8 3.70 Cement (portland), iron ore, nickel, salt, sand and gravel (construction).Minnesota6 2,740,000 7 3.86 Iron ore, sand and gravel (construction), sand and gravel (industrial), stone (crushed),
stone (dimension).Mississippi6 200,000 43 0.28 Clay (ball clay and montmorillonite), sand and gravel (construction), sand and gravel (industrial),
stone (crushed).Missouri 2,500,000 9 3.52 Cement (portland), lead, lime, sand and gravel (industrial), stone (crushed).Montana 905,000 26 1.28 Cement (portland), copper, palladium, platinum, sand and gravel (construction).Nebraska6 193,000 39 0.27 Cement (portland), lime, sand and gravel (construction), sand and gravel (industrial),
stone (crushed). Nevada 7,780,000 1 10.96 Copper, gold, lime, sand and gravel (construction), silver.New Hampshire6 113,000 47 0.16 Sand and gravel (construction), stone (crushed), stone (dimension).New Jersey 275,000 41 0.39 Peat, sand and gravel (construction), sand and gravel (industrial), stone (crushed).New Mexico 1,370,000 18 1.93 Cement (portland), copper, potash, sand and gravel (construction), stone (crushed).New York6 1,390,000 15 1.97 Cement (portland), clay [common clay and (or) shale], salt, sand and gravel (construction),
stone (crushed).North Carolina6 1,100,000 17 1.54 Clay [common clay and (or) shale], phosphate rock, sand and gravel (construction), sand and
gravel (industrial), stone (crushed).North Dakota6 97,300 48 0.14 Clay [common clay and (or) shale], lime, sand and gravel (construction), sand and gravel
(industrial), stone (crushed).Ohio6 1,130,000 14 1.59 Cement (portland), lime, salt, sand and gravel (construction), stone (crushed).Oklahoma 758,000 32 1.07 Cement (portland), helium (Grade-A), sand and gravel (construction), sand and gravel (industrial),
stone (crushed).Oregon 391,000 36 0.55 Cement (portland), diatomite, perlite (crude), sand and gravel (construction), stone (crushed).
TABLE 3VALUE OF NONFUEL MINERAL PRODUCTION IN THE UNITED STATES AND PRINCIPAL NONFUEL MINERALS PRODUCED IN 20161
See footnotes at end of table.

StatiStical Summary—2016 [aDVaNcE rElEaSE] 2.7
Value2 PercentState (thousands) Rank3 of U.S. total4 Principal commodities5
Pennsylvania6 $1,810,000 12 2.55 Cement (masonry and portland), lime, sand and gravel (construction), stone (crushed).Rhode Island6 51,300 49 0.07 Sand and gravel (construction), sand and gravel (industrial), stone (crushed).South Carolina6 771,000 30 1.09 Cement (masonry and portland), clay (kaolin), sand and gravel (construction), stone (crushed).South Dakota 367,000 38 0.52 Cement (portland), gold, lime, sand and gravel (construction), stone (crushed). Tennessee 1,030,000 24 1.45 Cement (portland), sand and gravel (construction), sand and gravel (industrial), stone
(crushed), zinc.Texas 4,830,000 3 6.80 Cement (portland), lime, sand and gravel (construction), sand and gravel (industrial),
stone (crushed).Utah 2,250,000 11 3.17 Cement (portland), copper, gold, salt, sand and gravel (construction).Vermont6 118,000 45 0.17 Sand and gravel (construction), stone (crushed), stone (dimension), talc (crude).Virginia 1,230,000 21 1.74 Cement (portland), kyanite, lime, sand and gravel (construction), stone (crushed).Washington 869,000 27 1.23 Cement (portland), gold, sand and gravel (construction), stone (crushed), zinc.West Virginia6 197,000 37 0.28 Cement (masonry and portland), lime, sand and gravel (industrial), stone (crushed).Wisconsin6 1,040,000 22 1.46 Lime, sand and gravel (construction), sand and gravel (industrial), stone (crushed),
stone (dimension).Wyoming 2,290,000 10 3.23 Cement (portland), clay (bentonite), helium (Grade-A), sand and gravel (construction), soda ash.Undistributed 2,950,000 XX 4.16 XX
Total 70,900,000 XX 100.00 XX
5Principal commodities based on value. Listed in alphabetical order. 6Partial total; excludes values that must be withheld to avoid disclosing company proprietary data, which are included with “Undistributed.”
XX Not applicable.1Table includes data from the commodity chapters published in the U.S. Geological Survey 2016 Minerals Yearbook as they were completed and released through March 2019.2Data are rounded to no more than three significant digits; may not add to totals shown.3Rank based on total, unadjusted, State values.4Reported to two decimal places. Calculated using partial totals.
VALUE OF NONFUEL MINERAL PRODUCTION IN THE UNITED STATES AND PRINCIPAL NONFUEL MINERALS PRODUCED IN 20161TABLE 3—Continued

2.8 [aDVaNcE rElEaSE] u.S. GEOlOGical SurVEy miNEralS yEarBOOK—2016
Land area2
(square Population2 TotalState kilometers) (thousands) (thousands) Dollars Rank4 Dollars Rank4
Alabama 131,171 4,865 $1,310,000 269 13 9,960 21Alaska 1,477,953 742 3,300,000 4,450 1 2,230 44Arizona 294,207 6,945 5,870,000 845 5 19,900 5Arkansas 134,771 2,990 762,000 255 17 5,650 34California 403,466 39,209 3,450,000 88 42 8,540 26Colorado 268,431 5,541 1,460,000 263 15 5,440 35Connecticut 12,542 3,579 206,000 5 58 46 16,500 7Delaware 5,047 949 23,500 5 25 48 4,660 24Florida 138,887 20,630 3,420,000 166 26 24,700 3Georgia 148,959 10,305 1,830,000 177 24 12,300 15Hawaii 16,635 1,428 118,000 83 43 7,110 30Idaho 214,045 1,683 594,000 353 12 2,770 42Illinois 143,793 12,827 1,230,000 5 96 39 8,540 25Indiana 92,789 6,633 1,000,000 151 29 10,800 18Iowa 144,669 3,132 575,000 5 184 16 3,970 33Kansas 211,754 2,911 650,000 5 223 11 3,070 39Kentucky 102,269 4,438 506,000 5 114 22 4,950 28Louisiana 111,898 4,678 548,000 5 117 33 4,900 32Maine 79,883 1,331 110,000 5 83 37 1,380 45Maryland 25,142 6,005 352,000 5 59 38 14,000 2Massachusetts 20,202 6,826 296,000 5 43 49 14,700 9Michigan 146,435 9,952 2,620,000 264 14 17,900 6Minnesota 206,232 5,523 2,740,000 5 495 8 13,300 13Mississippi 121,531 2,988 200,000 5 67 45 1,640 48Missouri 178,040 6,087 2,500,000 410 10 14,000 12Montana 376,962 1,041 905,000 869 4 2,400 43Nebraska 198,974 1,906 193,000 5 101 23 968 47Nevada 284,332 2,920 7,780,000 2,660 3 27,300 1New Hampshire 23,187 1,342 113,000 5 84 41 4,870 36New Jersey 19,047 8,875 275,000 31 50 14,400 11New Mexico 314,161 2,093 1,370,000 654 7 4,350 40New York 122,057 19,642 1,390,000 5 71 44 11,400 14North Carolina 125,920 10,157 1,100,000 5 108 35 8,700 17North Dakota 178,711 754 97,300 5 129 30 545 50Ohio 105,829 11,635 1,130,000 5 97 34 10,600 10Oklahoma 177,660 3,927 758,000 193 20 4,270 41Oregon 248,608 4,091 391,000 96 40 1,580 49Pennsylvania 115,883 12,784 1,810,000 5 141 32 15,600 8Rhode Island 2,678 1,057 51,300 5 49 47 19,200 4South Carolina 77,857 4,958 771,000 5 155 27 9,900 20South Dakota 196,350 863 367,000 425 9 1,870 46Tennessee 106,798 6,645 1,030,000 155 28 9,650 22Texas 676,587 27,937 4,830,000 173 25 7,130 29Utah 212,818 3,043 2,250,000 739 6 10,600 19Vermont 23,871 624 118,000 5 189 21 4,940 38Virginia 102,279 8,411 1,230,000 147 31 12,100 16Washington 172,119 7,295 869,000 119 36 5,050 37West Virginia 62,259 1,831 197,000 5 108 18 3,170 31Wisconsin 140,268 5,773 1,040,000 5 180 19 7,410 27Wyoming 251,470 584 2,290,000 3,920 2 9,110 23Undistributed XX XX 2,950,000 XX XX XX XX
Total or average 9,147,436 6 322,385 6 70,900,000 220 XX 7,760 XXSee footnotes at end of table.
TABLE 4VALUE OF NONFUEL MINERAL PRODUCTION PER CAPITA AND PER SQUARE KILOMETER IN 2016, BY STATE1
Value of nonfuel mineral production3
Per capita Per square kilometer

StatiStical Summary—2016 [aDVaNcE rElEaSE] 2.9
6Excludes Washington, DC (which has no mineral production), with an area of 158 square kilometers and a population of 686,575.
XX Not applicable.
2Source: U.S. Census Bureau State and national total values.3Data are rounded to no more than three significant digits; may not add to totals shown.4Rank based on total, unadjusted, State values.5Partial total; excludes values that must be withheld to avoid disclosing company proprietary data, which are included with “Undistributed.”
1Table includes data from the commodity chapters published in the U.S. Geological Survey 2016 Minerals Yearbook as they were completed and released through March 2019.
TABLE 4—ContinuedVALUE OF NONFUEL MINERAL PRODUCTION PER CAPITA AND PER SQUARE KILOMETER IN 2016, BY STATE1

2.10 [aDVaNcE rElEaSE] u.S. GEOlOGical SurVEy miNEralS yEarBOOK—2016
Quantity Value Quantity Value Quantity ValueAlabama:
Clay:Bentonite (4) W (4) W 76 9,370Common clay and (or) shale 1,190 r 5,690 r 1,180 r 4,600 r 1,260 4,900
Gemstones, naturale NA 7 NA 92 NA 82Lime 2,280 294,000 2,340 302,000 2,290 296,000Sand and gravel:
Construction 8,850 61,000 9,630 r 67,400 r 11,500 77,200Industrial 1,150 33,800 972 23,700 664 16,700
Stone, crushed 36,500 r 362,000 r 34,900 r 363,000 r 36,400 405,000Combined values of bauxite, cement, clay (kaolin), iron XX 446,000 XX 534,000 XX 497,000
oxide pigments (crude), salt, stone (dimension), andvalues indicated by symbol WTotal XX 1,200,000 r XX 1,290,000 r XX 1,310,000
Alaska:Gemstones, naturale NA 60 NA 73 NA 17Gold5 kilograms 31,400 1,280,000 28,000 1,050,000 27,600 1,110,000Lead5 metric tons 166,000 388,000 161,000 324,000 164,000 341,000Sand and gravel, construction 8,360 63,200 9,020 r 79,000 r 8,670 74,300Silver5 kilograms 481,000 295,000 r 490,000 248,000 520,000 287,000Stone, crushed 959 12,400 1,040 12,100 r 749 15,300Zinc5 metric tons 660,000 1,560,000 629,000 1,330,000 658,000 1,470,000
Total XX 3,600,000 XX 3,040,000 r XX 3,300,000Arizona:
Copper5 893 6,260,000 961 5,430,000 969 4,800,000Gemstones, naturale NA 2,370 NA 1,420 NA 2,090Sand and gravel, construction 35,900 r 310,000 r 39,500 r 363,000 r 40,300 370,000Silver kilograms 91,400 56,100 r 99,200 50,100 86,700 47,800Stone:
Crushed 8,520 67,900 10,200 r 94,300 r 10,500 102,000Dimension 55 6,080 62 6,660 70 5,850
Combined values of cement, clay [bentonite (2015–16) and XX 738,000 XX 558,000 r XX 537,000common clay and (or) shale (2014–16)], gold, gypsum(crude), helium [Grade-A (2016)], lime, molybdenummineral concentrates, perlite (crude), rhenium, salt,sand and gravel (industrial), zeolitesTotal XX 7,440,000 XX 6,500,000 r XX 5,870,000
Arkansas:Gemstones, naturale NA 429 NA 441 NA 406Sand and gravel:
Construction 8,080 69,800 7,510 66,000 7,510 66,800Industrial 3,180 248,000 1,990 146,000 1,330 60,700
Silica stone, special metric tons 146 e 36 e 205 49 300 e 72 e
Stone:Crushed 26,000 212,000 27,800 r 236,000 r 29,800 263,000Dimension 10 1,290 10 1,290 8 1,110
Combined values of bauxite, bromine, cement, clay XX 383,000 r XX 379,000 r XX 370,000
[common clay and (or) shale and kaolin], gypsum(crude), lime, silica (tripoli)Total XX 915,000 XX 829,000 r XX 762,000
California:Cement:
Masonry 186 20,100 e 188 20,800 e 220 25,800 e
Portland 9,810 829,000 e 9,770 887,000 e 9,600 907,000 e
Gemstones, naturale NA 1,210 NA 882 NA 769Gypsum, crude 689 5,510 r 690 5,380 r 814 6,510
Commodity
See footnotes at end of table.
TABLE 5NONFUEL MINERAL PRODUCTION IN THE UNITED STATES, BY STATE1, 2, 3
(Thousand metric tons and thousand dollars unless otherwise specified)
2014 2015 2016

StatiStical Summary—2016 [aDVaNcE rElEaSE] 2.11
Quantity Value Quantity Value Quantity ValueCalifornia:—Continued
Rare earthse, 6 metric tons 5,400 W 5,900 W -- --Sand and gravel:
Construction 85,900 r 1,000,000 95,400 r 1,070,000 r 95,400 1,120,000Industrial 1,520 52,500 1,860 66,100 1,620 54,200
Stone:Crushed 37,200 r 318,000 r 41,100 r 360,000 r 41,600 370,000Dimension 23 9,170 21 7,780 17 6,750
Combined values of boron minerals, clay [bentonite, XX 917,000 r XX 969,000 r XX 955,000common clay and (or) shale, montmorillonite, kaolin],diatomite, feldspar, gold, lime, magnesium compounds,pumice and pumicite, salt, silver, soda ash, zeolites, and values indicated by symbol WTotal XX 3,160,000 XX 3,390,000 r XX 3,450,000
Colorado:Gemstones, naturale NA 451 NA 326 NA 1,070Sand and gravel, construction 34,200 242,000 33,600 r 260,000 34,900 283,000Stone:
Crushed 12,700 108,000 13,100 r 121,000 r 13,800 133,000Dimension 17 6,230 20 9,570 20 10,200
Combined values of cement, clay [bentonite (2014), XX 1,230,000 XX 898,000 r XX 1,030,000common clay and (or) shale (2014–16), fire clay(2014–16)], gold, gypsum (crude), helium [crude (2015)and Grade-A (2014–16)], lime, molybdenum mineralconcentrates, sand and gravel (industrial), silverTotal XX 1,590,000 XX 1,290,000 r XX 1,460,000
Connecticut:Clay, common clay and (or) shale (4) (7) (4) (7) (4) (7)
Gemstones, naturale NA 7 NA 8 NA 13Sand and gravel, construction 5,360 55,300 5,120 48,600 r 5,330 r 51,800Stone:
Crushed 9,220 144,000 9,360 142,000 9,900 155,000Dimension (4) (7) (4) (7) (4) (7)
Total XX 200,000 XX 191,000 r XX 206,000Delaware:
Gemstones, naturale NA 1 NA 2 NA 2Magnesium compounds (4) (7) (4) (7) (4) (7)
Sand and gravel, construction 1,500 15,100 2,370 19,800 2,810 23,500Stone, crushed (4) (7) (4) (7) (4) (7)
Total XX 15,100 XX 19,800 XX 23,500Florida:
Cement:Masonry 365 47,700 e 400 51,900 e 509 70,700 e
Portland 4,990 453,000 e 5,500 551,000 e 5,860 600,000 e
Gemstones, naturale NA 2 NA 2 NA 4Peat metric tons 370,000 7,340 317,000 7,110 292,000 6,810Sand and gravel:
Construction 16,000 152,000 17,200 175,000 r 19,100 204,000Industrial 219 12,100 485 32,100 392 12,900
Stone, crushed 57,700 681,000 67,400 r 802,000 r 73,000 929,000Combined values of clay (attapulgite and kaolin), lime, XX 1,550,000 r XX 1,510,000 r XX 1,600,000
phosphate rock, staurolite, titanium mineral concentrates(ilmenite), zirconium mineral concentratesTotal XX 2,900,000 r XX 3,130,000 r XX 3,420,000
TABLE 5—ContinuedNONFUEL MINERAL PRODUCTION IN THE UNITED STATES, BY STATE1, 2, 3
(Thousand metric tons and thousand dollars unless otherwise specified)
2014 2015 2016Commodity
See footnotes at end of table.

2.12 [aDVaNcE rElEaSE] u.S. GEOlOGical SurVEy miNEralS yEarBOOK—2016
Quantity Value Quantity Value Quantity ValueGeorgia:
Clay, kaoline 5,410 r 819,000 r 5,190 r 827,000 r 4,720 r 788,000Gemstones, naturale NA 103 NA 24 NA 11Sand and gravel:
Construction 5,490 37,000 6,110 r 42,400 r 6,360 43,800Industrial 520 18,000 (4) W (4) W
Stone:Crushed 43,400 r 541,000 r 48,200 r 643,000 r 53,900 782,000Dimension 152 15,500 140 13,000 139 13,100
Combined values of barite, bauxite, cement, clay [common XX 152,000 r XX 212,000 r XX 200,000clay and (or) shale and montmorillonite], feldspar (2014),lime, mica (crude), titanium mineral concentrates[ilmenite (2015–16) and rutile (2016)], zirconiummineral concentrates (2015–16), and values indicatedby symbol WTotal XX 1,580,000 r XX 1,740,000 r XX 1,830,000
Hawaii:Gemstones, naturale NA 136 NA 103 NA 69Sand and gravel, construction 492 7,830 459 10,300 357 7,720Stone, crushed 4,900 r 95,700 r 5,150 r 101,000 r 5,200 110,000
Total XX 104,000 r XX 112,000 r XX 118,000Idaho:
Gemstones, naturale NA 399 NA 1,630 NA 1,680Sand and gravel, construction 13,800 82,300 14,100 r 83,000 r 14,900 86,100Stone:
Crushed 4,410 r 28,600 r 5,200 r 34,800 r 4,660 32,600Dimension 64 8,640 45 7,050 46 7,970
Combined values of copper (2014–15), feldspar, garnet XX 585,000 XX 413,000 r XX 466,000(industrial), gold (2015), lead, lime, molybdenummineral concentrates (2014), perlite (crude),phosphate rock, pumice and pumicite, silver,zeolites, zincTotal XX 705,000 XX 539,000 r XX 594,000
Illinois:Cement, portland 1,220 126,000 e 1,410 153,000 e 1,550 178,000 e
Gemstones, naturale NA 10 NA 11 NA 11Sand and gravel:
Construction 18,400 r 126,000 22,000 r 152,000 r 20,600 139,000Industrial 13,500 1,290,000 14,100 867,000 10,600 350,000
Stone, crushed 52,400 r 522,000 r 54,600 r 571,000 r 52,200 560,000Combined values of clay [common clay and (or) shale and XX (7) XX (7) XX (7)
montmorillonite], peat, silica (tripoli), stone (dimension)Total XX 2,060,000 XX 1,740,000 XX 1,230,000
Indiana:Cement, portland 2,400 208,000 e 2,560 254,000 (4) WGemstones, naturale NA 4 NA 5 NA 5Sand and gravel, construction 17,600 132,000 17,300 132,000 r 17,500 133,000Stone:
Crushed 44,400 342,000 49,500 384,000 r 47,100 390,000Dimension 200 34,400 211 39,700 236 42,800
Combined values of cement (masonry), clay [ball clay and XX 169,000 r XX 161,000 XX 439,000common clay and (or) shale], gypsum (crude), lime, peat,sand and gravel (industrial), and value indicated bysymbol WTotal XX 886,000 XX 972,000 r XX 1,000,000
TABLE 5—ContinuedNONFUEL MINERAL PRODUCTION IN THE UNITED STATES, BY STATE1, 2, 3
(Thousand metric tons and thousand dollars unless otherwise specified)
2014 2015 2016Commodity
See footnotes at end of table.

StatiStical Summary—2016 [aDVaNcE rElEaSE] 2.13
Quantity Value Quantity Value Quantity ValueIowa:
Gemstones, naturale NA 3 NA 3 NA 3Sand and gravel:
Construction 13,500 92,700 14,900 r 118,000 14,900 117,000Industrial (4) W 1,790 133,000 1,340 53,600
Stone, crushed 33,400 r 320,000 r 36,000 r 380,000 r 37,700 404,000Combined values of cement, clay [common clay and (or) shale], XX (7) XX (7) XX (7)
gypsum (crude), lime, peat, and value indicated by symbol WTotal XX 413,000 r XX 632,000 r XX 575,000
Kansas:Cement, portland 2,010 202,000 e 2,140 207,000 e 2,230 223,000 e
Gemstones, naturale NA 1 NA 2 NA 2Salt 2,930 194,000 2,830 207,000 2,560 209,000Sand and gravel, construction 8,570 r 48,600 9,080 r 55,500 r 10,100 59,800Stone:
Crushed 16,300 r 138,000 r 17,700 r 162,000 r 17,300 158,000Dimension 14 1,330 11 1,090 13 1,270
Combined values of cement (masonry), clay [common clay XX (7) XX (7) XX (7)
and (or) shale and montmorillonite], gypsum (crude),helium (crude and Grade-A), pumice and pumiciteTotal XX 585,000 r XX 632,000 r XX 650,000
Kentucky:Gemstones, naturale NA 11 NA 16 NA 13Sand and gravel, construction 8,510 41,500 9,040 45,500 8,540 40,300Stone, crushed 51,100 r 461,000 r 54,000 r 503,000 r 49,100 466,000Combined values of cement, clay [ball clay and common XX (7) XX (7) XX (7)
clay and (or) shale], lime, sand and gravel (industrial)Total XX 502,000 XX 549,000 r XX 506,000
Louisiana:Gemstones, naturale NA 7 NA 8 NA 34Salt 14,800 344,000 12,700 325,000 12,200 306,000Sand and gravel:
Construction 17,800 220,000 16,300 r 185,000 17,200 198,000Industrial 2,120 147,000 1,530 r 62,000 r 1,330 44,200
Combined values of clay [common clay and (or) shale], XX (7) XX (7) XX (7)
gypsum (crude), lime, stone (crushed)Total XX 711,000 XX 572,000 r XX 548,000
Maine:Gemstones, naturale NA 370 NA 376 NA 378Sand and gravel, construction 7,250 54,100 7,810 r 61,400 r 9,040 74,400Stone:
Crushed 3,840 r 31,500 4,240 r 33,200 r 4,200 33,500Dimension 5 2,820 3 1,840 3 1,880
Combined values of cement, clay [common clay and (or) XX (7) XX (7) XX (7)
shale], peatTotal XX 88,800 r XX 96,900 r XX 110,000
Maryland:Gemstones, naturale NA 1 NA 2 NA 2Sand and gravel, construction 7,110 91,600 7,380 r 92,600 r 7,380 92,800Stone:
Crushed 21,700 222,000 22,700 r 246,000 r 22,100 258,000Dimension 3 723 4 728 6 1,380
Combined values of cement and clay [common clay XX (7) XX (7) XX (7)
and (or) shale]Total XX 315,000 XX 339,000 r XX 352,000
2014 2015 2016Commodity
See footnotes at end of table.
TABLE 5—ContinuedNONFUEL MINERAL PRODUCTION IN THE UNITED STATES, BY STATE1, 2, 3
(Thousand metric tons and thousand dollars unless otherwise specified)

2.14 [aDVaNcE rElEaSE] u.S. GEOlOGical SurVEy miNEralS yEarBOOK—2016
Quantity Value Quantity Value Quantity ValueMassachusetts:
Clay, common clay and (or) shale (4) (7) (4) (7) (4) (7)
Gemstones, naturale NA 1 NA 2 NA 2Lime (4) (7) (4) (7) (4) (7)
Sand and gravel, construction 11,000 88,200 10,100 92,200 r 9,830 89,600Stone:
Crushed 10,600 147,000 r 12,100 r 159,000 r 12,600 167,000Dimension 165 43,100 160 41,900 159 40,200Total XX 278,000 XX 293,000 r XX 296,000
Michigan:Cement:
Masonry 43 6,100 e 92 14,000 e 83 13,900 e
Portland 3,950 399,000 e 4,190 470,000 e 4,100 510,000 e
Cobalte, 8 metric tons 120 W 760 W 690 WCopper9 do. 3,910 W 24,300 W 23,400 WGemstones, naturale NA 2 NA 15 NA 22Gypsum, crude 233 1,860 r (4) W (4) WIron ore10 12,100 1,240,000 10,800 852,000 11,000 844,000Lime 526 65,400 474 60,200 519 66,400Nickel9, 11 metric tons 4,300 W 27,200 W 24,100 WSand and gravel:
Construction 36,300 r 204,000 39,100 r 237,000 r 41,300 249,000Industrial 1,590 112,000 3,370 77,300 3,410 54,000
Stone, crushed 26,300 195,000 r 27,700 199,000 r 27,700 199,000Combined values of clay [common clay and (or) shale], XX 427,000 XX 836,000 XX 687,000
gold (2016), magnesium compounds, peat, salt, stone(dimension), and values indicated by symbol WTotal XX 2,650,000 XX 2,750,000 XX 2,620,000
Minnesota:Clay, common clay and (or) shale (4) (7) -- -- -- --Gemstones, naturale NA 7 NA 8 NA 8Iron ore 43,000 3,410,000 35,400 2,890,000 30,800 2,210,000Lime (4) (7) (4) (7) (4) (7)
Peat metric tons 47,700 2,740 58,300 2,860 71,000 4,900Sand and gravel:
Construction 41,800 r 188,000 r 49,300 r 239,000 r 46,700 227,000Industrial 7,220 574,000 5,170 335,000 3,110 180,000
Stone:Crushed 9,020 r 106,000 r 7,780 r 97,800 r 7,490 94,200Dimension 51 21,000 51 20,800 51 20,500Total XX 4,300,000 XX 3,590,000 XX 2,740,000
Mississippi:Gemstones, naturale NA 1 NA 2 NA 2Sand and gravel:
Construction 10,700 82,100 9,950 78,900 10,300 85,000Industrial 373 5,520 451 5,260 1,100 6,500
Stone, crushed 2,180 r 61,500 r 1,900 r 55,200 r 2,170 64,100Combined values of clay [ball clay, bentonite, common XX 41,800 XX 42,800 XX 43,900
clay and (or) shale, montmorillonite]Total XX 191,000 r XX 182,000 r XX 200,000
Missouri:Cement, portland 8,780 844,000 e 8,540 849,000 e 8,340 909,000 e
Sand and gravel:Construction 10,600 67,500 9,890 r 67,700 r 10,300 73,500Industrial 4,290 289,000 6,290 385,000 8,050 268,000
Commodity
See footnotes at end of table.
TABLE 5—ContinuedNONFUEL MINERAL PRODUCTION IN THE UNITED STATES, BY STATE1, 2, 3
(Thousand metric tons and thousand dollars unless otherwise specified)
2014 2015 2016

StatiStical Summary—2016 [aDVaNcE rElEaSE] 2.15
Quantity Value Quantity Value Quantity ValueMissouri:—Continued
Stone, crushed 69,800 r 557,000 r 70,900 r 532,000 r 69,900 550,000Combined values of cement (masonry), clay [common clay XX 903,000 XX 781,000 r XX 698,000
and (or) shale, fire clay, montmorillonite], copper,gemstones (natural), lead, lime, silica (tripoli), silver,stone (dimension), zincTotal XX 2,660,000 XX 2,610,000 r XX 2,500,000
Montana:Gemstones, naturale NA 544 NA 583 NA 600Palladium5 kilograms 12,400 324,000 12,500 280,000 13,100 259,000Platinum5 do. 3,660 163,000 3,670 125,000 3,890 124,000Sand and gravel, construction 10,900 89,600 12,100 r 92,300 r 11,400 91,600Stone:
Crushed 2,910 26,100 r 2,820 r 28,200 r 2,800 25,700Dimension 28 1,970 24 1,000 (4) W
Combined values of cement, clay [bentonite and common XX 566,000 XX 484,000 XX 404,000clay and (or) shale], copper, garnet (industrial), gold,iodine (2014), lime, molybdenum mineral concentrates,rhenium, silver, talc (crude), and value indicated by symbol WTotal XX 1,170,000 XX 1,010,000 XX 905,000
Nebraska:Gemstones, naturale NA 4 NA 5 NA 5Sand and gravel, construction 12,100 86,800 r 12,700 r 91,000 r 12,700 94,200Stone, crushed 7,470 r 90,800 r 7,680 r 95,300 r 7,670 98,300Combined values of cement, clay [common clay and (or) XX (7) XX (7) XX (7)
shale], lime, sand and gravel (industrial)Total XX 178,000 r XX 186,000 r XX 193,000
Nevada:Copper5 (4) W (4) W 74 367,000Gold5 kilograms 151,000 6,160,000 162,000 6,050,000 165,000 6,630,000Sand and gravel, construction 13,600 87,900 15,400 89,700 17,500 109,000Silver5 kilograms 326,000 200,000 r 290,000 147,000 278,000 153,000Stone, crushed 8,710 r 77,500 r 9,010 r 83,900 r 9,960 84,800Combined values of barite, cement, clay [attapulgite XX 985,000 r XX 897,000 r XX 436,000
(2014, 2016), bentonite, kaolin], diatomite, gemstones(natural), gypsum (crude), lime, lithium carbonate, magnesite,molybdenum mineral concentrates, perlite (crude), salt,sand and gravel (industrial), stone (dimension),and values indicated by symbol WTotal XX 7,510,000 r XX 7,260,000 r XX 7,780,000
New Hampshire:Gemstones, naturale NA 7 NA 8 NA 8Sand and gravel, construction 6,360 53,600 6,230 r 52,200 r 6,910 57,500Stone:
Crushed 5,180 44,800 5,550 51,500 5,660 55,300Dimension 28 3,460 (4) (7) (4) (7)
Total XX 102,000 XX 104,000 XX 113,000New Jersey:
Gemstones, naturale NA 1 NA 2 NA 2Peat (4) (12) (4) (12) (4) (12)
Sand and gravel:Construction 12,100 93,300 11,800 r 94,600 r 12,500 103,000Industrial 961 37,200 950 35,500 879 35,900
Stone, crushed 16,900 154,000 17,800 r 161,000 r 16,600 136,000Total XX 284,000 XX 291,000 r XX 275,000
TABLE 5—ContinuedNONFUEL MINERAL PRODUCTION IN THE UNITED STATES, BY STATE1, 2, 3
(Thousand metric tons and thousand dollars unless otherwise specified)
2014 2015 2016Commodity
See footnotes at end of table.

2.16 [aDVaNcE rElEaSE] u.S. GEOlOGical SurVEy miNEralS yEarBOOK—2016
Quantity Value Quantity Value Quantity ValueNew Mexico:
Copper5, 13 156 1,090,000 181 1,020,000 174 864,000Gemstones, naturale NA 18 NA 47 NA 35Sand and gravel, construction 8,230 r 83,900 r 8,720 r 78,600 r 9,510 85,200Stone, crushed 4,890 r 44,500 r 5,120 r 45,700 r 4,760 43,800Combined values of cement, clay [common clay and (or) XX 537,000 XX 472,000 XX 375,000
shale], gold, gypsum (crude), molybdenum mineralconcentrates (2014), perlite (crude), potash pumice and pumicite, rhenium (2014), salt, silver,stone (dimension), zeolitesTotal XX 1,760,000 XX 1,620,000 r XX 1,370,000
New York:Clay, common clay and (or) shale 512 24,000 525 r 25,300 r 668 28,400Gemstones, naturale NA 104 NA 94 NA 104Salt 7,740 577,000 7,320 615,000 6,710 566,000Sand and gravel, construction 27,600 252,000 30,600 r 297,000 r 30,500 315,000Stone:
Crushed 36,900 r 415,000 r 40,600 r 482,000 r 38,600 473,000Dimension 126 17,600 126 17,200 93 13,200
Combined values of cement, garnet (industrial), peat, sand XX (7) XX (7) XX (7)
and gravel (industrial), wollastoniteTotal XX 1,290,000 XX 1,440,000 r XX 1,390,000
North Carolina:Clay, common clay and (or) shale 654 r 16,700 r 771 r 25,800 r 936 (7)
Gemstones, naturale NA 235 NA 299 NA 574Sand and gravel:
Construction 7,350 48,600 7,940 52,200 r 8,120 52,900Industrial 2,640 41,500 4,050 55,100 4,180 58,900
Stone:Crushed 46,200 727,000 49,700 r 782,000 r 57,800 965,000Dimension 44 20,700 91 18,600 92 18,000
Combined values of andalusite, clay [kaolin (2014)], feldspar, XX (7) XX (7) XX (7)
mica (crude), phosphate rock, pyrophyllite (crude)Total XX 855,000 r XX 934,000 r XX 1,100,000
North Dakota:Gemstones, naturale NA 4 NA 5 NA 5Sand and gravel, construction 20,600 147,000 18,400 r 118,000 r 13,000 90,500Stone, crushed 1,130 12,000 788 r 6,650 r 728 6,840Combined values of clay [common clay and (or) shale], XX (7) XX (7) XX (7)
lime, sand and gravel (industrial)Total XX 159,000 XX 125,000 r XX 97,300
Ohio:Cement, portland 864 90,000 e 916 104,000 e (4) (7)
Clay, common clay and (or) shale 670 r 10,500 r 662 r 12,300 r 652 12,200Gemstones, naturale NA 4 NA 5 NA 5Lime 1,800 234,000 1,500 201,000 1,530 205,000Sand and gravel:
Construction 30,500 228,000 32,900 r 271,000 r 32,600 266,000Industrial 2,850 211,000 1,440 79,400 1,310 51,800
Stone:Crushed 53,500 477,000 58,400 r 523,000 r 59,600 585,000Dimension 21 5,150 22 6,070 17 6,810
Combined values of cement (masonry), clay [fire clay XX (7) XX (7) XX (7)
(2015–16)], peat, saltTotal XX 1,250,000 XX 1,200,000 XX 1,130,000
TABLE 5—ContinuedNONFUEL MINERAL PRODUCTION IN THE UNITED STATES, BY STATE1, 2, 3
(Thousand metric tons and thousand dollars unless otherwise specified)
2014 2015 2016Commodity
See footnotes at end of table.

StatiStical Summary—2016 [aDVaNcE rElEaSE] 2.17
Quantity Value Quantity Value Quantity ValueOklahoma:
Clay, common clay and (or) shale 660 r 2,050 r 741 r 2,310 r 862 2,800Gemstones, naturale NA 4 NA 5 NA 5Sand and gravel:
Construction 11,300 r 86,300 r 10,800 r 88,300 r 10,200 84,200Industrial 3,340 122,000 2,980 r 70,700 r 3,420 72,800
Stone:Crushed 39,500 321,000 38,400 r 340,000 r 36,800 334,000Dimension 62 5,240 67 5,920 67 5,790
Combined values of cement, feldspar, gypsum (crude), XX 282,000 r XX 273,000 r XX 258,000helium [crude (2015) and Grade-A (2014–16)], iodine(crude), lime, pumice and pumicite (2014), saltTotal XX 818,000 r XX 780,000 XX 758,000
Oregon:Gemstones, naturale NA 1,090 NA 1,180 NA 2,330Sand and gravel, construction 11,000 94,000 12,200 r 108,000 r 12,400 111,000Stone, crushed 17,700 r 136,000 r 18,300 r 132,000 r 20,700 151,000Combined values of cement, clay [bentonite and common XX 132,000 r XX 153,000 r XX 127,000
clay and (or) shale], diatomite, emery [crude (2014)],lime, perlite (crude), pumice and pumicite,sand and gravel (industrial), zeolitesTotal XX 363,000 r XX 395,000 r XX 391,000
Pennsylvania:Cement:
Masonry 152 22,100 e 179 26,600 e 170 26,300 e
Portland 3,830 352,000 e 3,920 396,000 e 3,820 405,000 e
Clay, common clay and (or) shale 270 r 2,710 r 406 r 2,930 r 350 2,640Gemstones, naturale NA 1 NA 2 NA 2Lime 1,080 148,000 968 132,000 915 116,000Peat (4) (7) (4) (7) (4) (7)
Sand and gravel:Construction 9,730 95,100 9,310 r 101,000 r 8,710 92,500Industrial (4) (7) (4) (7) (4) (7)
Stone:Crushed 81,900 r 1,010,000 87,500 r 1,100,000 r 87,300 1,160,000Dimension 51 5,720 42 6,410 41 6,600Total XX 1,630,000 XX 1,760,000 r XX 1,810,000
Rhode Island:Gemstones, naturale NA 1 NA 2 NA 2Sand and gravel:
Construction 2,830 32,800 2,130 r 27,000 r 2,140 26,900Industrial (4) (7) (4) (7) (4) (7)
Stone, crushed 1,990 r 21,500 r 2,360 r 25,300 r 2,280 24,500Total XX 54,400 r XX 52,300 r XX 51,300
South Carolina:Cement:
Masonry 160 23,700 e 168 26,000 e 185 28,500 e
Portland 2,890 273,000 e 3,070 318,000 e 2,860 300,000 e
Clay, kaoline 338 r 29,200 r 346 r 30,600 r 347 31,200Gemstones, naturale NA 1 NA 2 NA 2Sand and gravel:
Construction 8,080 42,000 8,350 r 44,300 r 8,650 49,600Industrial 589 26,800 551 24,400 495 21,000
2014 2015 2016Commodity
See footnotes at end of table.
TABLE 5—ContinuedNONFUEL MINERAL PRODUCTION IN THE UNITED STATES, BY STATE1, 2, 3
(Thousand metric tons and thousand dollars unless otherwise specified)

2.18 [aDVaNcE rElEaSE] u.S. GEOlOGical SurVEy miNEralS yEarBOOK—2016
Quantity Value Quantity Value Quantity ValueSouth Carolina:—Continued
Stone, crushed 20,300 219,000 23,900 r 275,000 r 28,200 341,000Combined values of clay [common clay and (or) shale], stone XX (7) XX (7) XX (7)
[dimension (2014–15)], vermiculiteTotal XX 613,000 r XX 719,000 r XX 771,000
South Dakota:Sand and gravel, construction 11,900 59,100 11,200 r 55,000 r 10,200 50,000Stone, crushed 6,900 52,000 6,580 47,600 6,850 51,200Combined values of cement, clay [common clay and (or) XX 221,000 XX 226,000 XX 266,000
shale], feldspar, gemstones (natural), gold, gypsum(crude), lime, mica (crude), sand and gravel (industrial),
silver, stone (dimension)Total XX 332,000 r XX 329,000 r XX 367,000
Tennessee:Clay, ball claye 648 27,400 601 27,900 568 25,300Sand and gravel:
Construction 5,790 41,000 6,620 r 52,900 r 7,450 57,500Industrial 1,490 60,500 1,540 49,100 1,570 48,500
Stone:Crushed 38,200 483,000 40,300 r 486,000 r 43,300 549,000Dimension 51 11,000 52 10,200 57 9,840
Combined values of cadmium (byproduct of zinc production), XX 423,000 r XX 413,000 r XX 341,000cement, clay [common clay and (or) shale and montmorillonite],gemstones (natural), lime, salt, zincTotal XX 1,050,000 r XX 1,040,000 r XX 1,030,000
Texas:Cement:
Masonry 277 43,300 e 268 46,200 e 287 48,700 e
Portland 11,000 1,170,000 e 10,400 1,200,000 e 10,900 1,260,000 e
Clay:Bentonite 59 10,400 51 8,570 43 8,170Common clay and (or) shale 1,630 r 14,100 r 1,910 r 39,000 r 1,950 24,500
Gemstones, naturale NA 170 NA 180 NA 33Lime 1,490 171,000 1,460 170,000 1,530 176,000Salt 8,010 182,000 7,570 173,000 7,420 169,000Sand and gravel:
Construction 77,100 693,000 82,900 r 787,000 r 85,800 818,000Industrial 16,500 1,300,000 14,200 706,000 10,900 417,000
Stone:Crushed 155,000 r 1,340,000 163,000 r 1,630,000 r 166,000 1,720,000Dimension 922 159,000 1,060 142,000 1,180 130,000
Combined values of clay (ball clay, fire clay, kaolin, XX 56,700 r XX 65,400 r XX 54,100montmorillonite), gypsum (crude), helium (crude),iodine [crude (2015)], talc (crude), zeolitesTotal XX 5,150,000 XX 4,960,000 r XX 4,830,000
Utah:Beryllium metric tons 270 W 205 W 155 WGemstones, naturale NA 860 NA 174 NA 417Iron ore 998 83,000 -- -- -- --Salt 2,360 157,000 2,010 226,000 r 2,080 212,000Sand and gravel, construction 25,200 r 188,000 r 28,800 r 214,000 r 31,600 235,000
Commodity
See footnotes at end of table.
TABLE 5—ContinuedNONFUEL MINERAL PRODUCTION IN THE UNITED STATES, BY STATE1, 2, 3
(Thousand metric tons and thousand dollars unless otherwise specified)
2014 2015 2016

StatiStical Summary—2016 [aDVaNcE rElEaSE] 2.19
Quantity Value Quantity Value Quantity ValueUtah:—Continued
Stone:Crushed 8,290 65,300 8,200 59,500 r 7,950 58,900Dimension (4) W 6 620 7 996
Combined values of cement, clay [bentonite and common XX 3,000,000 XX 1,690,000 XX 1,740,000clay and (or) shale], copper, gold, gypsum (crude), helium[crude (2015) and Grade-A (2015–16)], iron oxidepigments, lime, magnesium compounds, magnesium metal,molybdenum mineral concentrates, phosphate rock,potash, rhenium, silver, and values indicated by symbol WTotal XX 3,490,000 XX 2,190,000 r XX 2,250,000
Vermont:Gemstones, naturale NA 1 NA 2 NA 2Sand and gravel, construction 4,790 32,800 4,970 r 36,100 r 5,390 39,300Stone:
Crushed 5,080 r 51,300 r 4,890 r 49,700 r 4,800 49,500Dimension 92 24,100 87 27,900 99 29,100
Talc, crude (4) (7) (4) (7) (4) (7)
Total XX 108,000 r XX 114,000 r XX 118,000Virginia:
Kyanite metric tons 88,600 r 29,000 r, e 109,000 r 38,000 r, e 79,700 28,000 e
Sand and gravel, construction 7,110 80,400 7,660 82,500 r 7,420 84,100Stone:
Crushed 44,200 686,000 52,300 r 817,000 r 54,400 868,000Dimension 13 7,730 12 7,690 13 8,360
Combined values of cement, clay [common clay and (or) XX 275,000 r XX 283,000 r XX 245,000
shale and montmorillonite], feldspar, gemstones(natural), lime, mica [crude 2014–15)], salt, sand andgravel (industrial), staurolite (2015), talc (2014), titaniummineral concentrates [ilmenite (2014–15)], vermiculite(crude), zirconium mineral concentrates (2014–15)Total XX 1,080,000 r XX 1,230,000 r XX 1,230,000
Washington:Gemstones, naturale NA 59 NA 99 NA 61Sand and gravel, construction 32,000 238,000 33,400 r 274,000 r 35,400 284,000Stone, crushed 13,700 180,000 r 14,400 r 212,000 15,800 234,000Combined values of cement (portland), clay [common clay XX 284,000 XX 319,000 XX 351,000
and (or) shale (2015–16) and fire clay (2014)], diatomite,gold, lead, lime, olivine (2016), peat, sand and gravel(industrial), stone [dimension (2015–16)], zincTotal XX 702,000 XX 805,000 r XX 869,000
West Virginia:Gemstones, naturale NA 1 NA 2 NA 2Sand and gravel:
Construction 618 5,240 583 4,950 556 4,720Industrial 536 29,500 681 37,500 588 32,400
Stone, crushed 14,900 168,000 15,000 166,000 r 14,300 160,000Combined values of cement, clay [common clay and (or) XX (7) XX (7) XX (7)
shale], lime, saltTotal XX 202,000 XX 208,000 XX 197,000
Wisconsin:Gemstones, naturale NA 7 NA 8 NA 8Lime (4) (7) (4) (7) (4) (7)
Sand and gravel:Construction 26,100 r 154,000 r 28,000 208,000 r 27,100 183,000Industrial 38,300 3,150,000 32,200 1,390,000 16,800 637,000
TABLE 5—ContinuedNONFUEL MINERAL PRODUCTION IN THE UNITED STATES, BY STATE1, 2, 3
(Thousand metric tons and thousand dollars unless otherwise specified)
2014 2015 2016Commodity
See footnotes at end of table.

2.20 [aDVaNcE rElEaSE] u.S. GEOlOGical SurVEy miNEralS yEarBOOK—2016
Quantity Value Quantity Value Quantity ValueWisconsin:—Continued
Stone:Crushed 21,700 r 149,000 22,700 r 171,000 r 22,300 181,000Dimension 190 40,200 199 41,200 225 38,500Total XX 3,490,000 XX 1,810,000 r XX 1,040,000
Wyoming:Clay, bentonite 4,340 289,000 3,580 r 254,000 r 3,200 229,000Gemstones, naturale NA 18 NA 18 NA 18Sand and gravel, construction 13,700 118,000 15,000 134,000 9,860 91,700Stone, crushed 11,300 48,700 r 18,400 52,800 9,950 46,000Combined values of cement, clay [common clay and (or) shale], XX 2,050,000 XX 2,040,000 XX 1,920,000
gypsum (crude), helium (Grade-A), lime, soda ashTotal XX 2,510,000 XX 2,480,000 XX 2,290,000
Undistributed:Combined values of Connecticut, Delaware, Illinois, Iowa, XX 3,170,000 r XX 2,910,000 r XX 2,950,000
Kansas, Kentucky, Louisiana, Maine, Maryland, Massachusetts, Minnesota, Mississippi, Nebraska, New Hampshire (2015–16), New York, North Carolina, North Dakota, Ohio, Pennsylvania, Rhode Island, South Carolina, Vermont, West Virginia, Wisconsin
11Recoverable content of nickel sulfide concentrates.12Withheld to avoid disclosing company proprietary data; included in “Total.”13Source: Freeport-McMoRan Copper & Gold Inc., 2017, Form 10–K—2016: U.S. Securities and Exchange Commission, 222 p. (Accessed March 25, 2019, at https://s22.q4cdn.com/529358580/files/doc_financials/10-K/10_k2016.pdf.)
5Recoverable content of ores and concentrates. Also refers to lode mine (copper, gold, lead, silver, zinc) in “Combined values” individual State categories.6Rare-earth-oxide (REO) basis.7Withheld to avoid disclosing company proprietary data; value included in “Undistributed.”8Content of mineral concentrates.9Source: Lundin Mining Corp., 2017, Managementʼs Discussion and Analysis for the year ended December 31, 2016: Toronto, Ontario, Canada, Lundin Mining Corp., 96 p. (Accessed March 25, 2019, at https://www.lundinmining.com/site/assets/files/3747/2016ye.pdf.)10Production based on publicly available data; refer to the Minerals Yearbook iron ore chapter.
TABLE 5—ContinuedNONFUEL MINERAL PRODUCTION IN THE UNITED STATES, BY STATE1, 2, 3
(Thousand metric tons and thousand dollars unless otherwise specified)
2014 2015 2016Commodity
eEstimated. rRevised. do. Ditto. NA Not available. W Withheld to avoid disclosing company proprietary data; included in “Combined values” data for each State. XX Not applicable. -- Zero.1Table includes data from the commodity chapters published in the U.S. Geological Survey 2016 Minerals Yearbook as they were completed and released through March 2019.2Production as measured by mine shipments, sales, or marketable production (including consumption by producers). Mine output measured as sold or used by producers is primarily shown in the tables, because values can be assigned. Where sold or used data are not available, actual mine output is used as the production measurement and value is estimated average price of the mineral commodity for that year. Data are reported in gross weight unless otherwise specified.3Data are rounded to no more than three significant digits; may not add to totals shown.4Withheld to avoid disclosing company proprietary data.

StatiStical Summary—2016 [aDVaNcE rElEaSE] 2.21
Commodity Quantity Value Quantity Value Quantity ValueCement, portland 588 W 536 W 458 WClay, common clay and (or) shalee 58 320 61 335 61 335Lime (4) W (4) W (4) WSalte 45 1,720 46 1,790 46 1,790Sand and gravel, construction NA NA NA NA NA NAStone, crushed 6,070 56,600 5,210 r 47,400 r 4,470 42,400
Total XX 58,600 XX 49,500 r XX 44,500
1Table includes data from the commodity chapters published in the U.S. Geological Survey 2016 Minerals Yearbook as they were completed and released through March 2019.2Production as measured by mine shipments, sales, or marketable production (including consumption by producers). Mine output measured as sold or used by the producers is primarily shown in the tables, because values can be assigned. Where sold or used data are not available, actual mine output is used as the production measurement and value is estimated average price of the mineral commodity for that year. Data are reported in gross weight.3Data are rounded to no more than three significant digits; may not add to totals shown.4Withheld to avoid disclosing company proprietary data.
2014 2015 2016
TABLE 6NONFUEL RAW MINERAL PRODUCTION IN THE COMMONWEALTH OF PUERTO RICO1, 2, 3
(Thousand metric tons and thousand dollars)
eEstimated. rRevised. NA Not available. W Withheld to avoid disclosing company proprietary data; excluded from “Total.” XX Not applicable.

2.22 [aDVaNcE rElEaSE] u.S. GEOlOGical SurVEy miNEralS yEarBOOK—2016
Quantity Value Quantity ValueMetals:
Aluminum:Crude, semicrude, and scrap metric tons 3,010,000 8,450,000 2,820,000 7,660,000Manufactures do. 105,000 454,000 98,600 406,000
Antimony:Metal, alloys, waste and scrap do. 1,440 5,740 623 3,090Oxide, Sb content do. 1,760 12,000 1,330 7,690
Arsenic metal, As content3 do. 1,670 NA 1,760 NABauxite and alumina:
Alumina, calcined equivalent 2,240 r 912,000 r 1,370 570,000Bauxite:
Calcined, refractory and other grade 10 1,480 r 20 6,230Crude and dried 4 NA 5 NA
Beryllium, unwrought including powders, waste and scrap, other, kilograms 28,900 15,300 34,400 20,900Be content
Bismuth, metal, alloys, waste and scrap, Bi content do. 519,000 5,350 421,000 4,820Cadmium:
Pigments do. 3,310,000 20,500 2,190,000 41,300Sulfide, gross weight do. 3,740 829 625 125Unwrought metal and powders do. 350,000 783 157,000 228Waste and scrap do. 147 3 11,900 53
Chromium:Ores and concentrate metric tons 7,210 5,680 2,760 1,650Metals and alloys:
Metal, unwrought powders, waste and scrap, other do. 801 15,700 506 14,300Ferroalloys, high-carbon, low-carbon, ferrochromium-silicon do. 1,080 1,820 1,540 2,400
Chemicals:Oxides, trioxide, other do. 5,260 r 26,900 r -- --Sulfates do. 244 r 1,210 r 165 815Salts of oxometallic or peroxometallic acids, zinc and lead chromate, do. 411 r 2,770 r 338 2,680
sodium dichromate, potassium dichromate, otherPigments and preparations do. 757 r 4,860 r 499 3,700
Cobalt:Acetates do. 180 1,390 314 1,580Chlorides do. (4) 7 1 17Oxides and hydroxides do. 192 2,690 134 1,380Metal, unwrought, powders, waste and scrap, mattes, other intermediate do. 3,640 87,000 3,990 78,100
products of metallurgyCopper:
Ore and concentrate do. 392,000 2,870,000 331,000 2,210,000Unmanufactured, does not include unalloyed scrap, Cu content do. 113,000 r 556,000 r 163,000 722,000Semimanufactures, excludes sulfate do. 245,000 1,770,000 250,000 1,520,000Sulfate do. 6,160 32,000 5,840 34,900Scrap, unalloyed do. 426,000 1,610,000 411,000 1,310,000
Ferroalloys not listed elsewhere:Ferrophosphorus do. 976 1,760 463 855Other do. 3,380 9,530 6,300 11,600
Gold:Ores and concentrates kilograms 5,280 193,000 4,220 157,000Dore and precipitates do. 121,000 r 4,640,000 r 147,000 5,730,000Bullion, refined do. 352,000 r 13,300,000 r 241,000 9,650,000Waste and scrap do. 348,000 r 1,360,000 r 321,000 2,260,000Metal powder do. 504 r 9,250 r 438 11,100Compounds do. 171,000 r 93,600 r 1,060,000 106,000
Commodity
See footnotes at end of table.
2015 2016
TABLE 7U.S. EXPORTS OF PRINCIPAL MINERALS AND PRODUCTS, EXCLUDING MINERAL FUELS1, 2
(Thousand metric tons and thousand dollars unless otherwise specified)

StatiStical Summary—2016 [aDVaNcE rElEaSE] 2.23
Quantity Value Quantity ValueMetals:—Continued
Iron and steel:Steel mill products 9,050 NA 8,450 NAFabricated steel products 1,870 NA 1,800 NACast iron and steel products 221 NA 188 NA
Iron and steel scrap:Ferrous, includes tinplate and terneplate, excludes used rails for rerolling 12,800 4,010,000 12,600 3,550,000
and other uses and ships, boats, and other vessels for scrappingPig iron, all grades metric tons 17,300 5,450 16,700 4,200Direct-reduced iron, steelmaking grade do. 20,200 548 r 178,000 21,600Ships, boats, and other vessels for scrapping 4 641 3 435Used rails for rerolling and other uses, includes mixed (used plus new) rails 35 45,300 16 18,600
Iron ore 8,030 r 652,000 r 8,770 581,000Lead:
Base bullion, gross weight metric tons 596 1,470 1,310 3,230Ore and concentrates, Pb content do. 350,000 r 469,000 r 341,000 480,000Refined lead and alloys, unwrought, gross weight do. 50,100 r 49,400 r 36,400 32,300Wrought and other products, gross weight do. 2,850 r 10,000 r 2,590 8,130Scrap, gross weight do. 29,100 r 31,100 r 16,700 16,200
Magnesium, gross weight:Waste and scrap do. 432 r 895 996 2,040Metal do. 5,220 18,300 5,270 23,000Alloys do. 7,490 27,200 10,700 37,000Powder, sheets, tubing, ribbons, wire, other forms do. 2,060 71,800 r 2,080 48,800
Manganese, gross weight:Ores and concentrates with 20% or more manganese do. 700 1,550 630 1,440Ferromanganese, all grades do. 5,140 5,630 6,580 6,850Silicomanganese do. 1,220 1,340 2,410 2,290Metal, including alloys and waste and scrap do. 5,390 7,660 6,460 9,300Dioxide do. 3,270 7,940 4,130 7,240
Mercury:Metal kilograms 30 3 -- --Amalgams of precious metals whether or not chemically defined do. 94,600 r 375,000 107,000 297,000
Molybdenum:Ore and concentrates, including roasted and other, Mo content metric tons 36,800 587,000 27,700 343,000Chemicals, gross weight:
Oxides and hydroxides do. 1,300 19,400 r 853 11,600Molybdates, all do. 2,020 22,300 1,440 17,200
Ferromolybdenum, Mo content do. 565 r 15,000 r 455 13,300Other, includes powders, unwrought, bars and rods, waste and scrap, do. 1,180 77,700 r 1,030 62,700
wire, other, gross weightNickel:
Primary, unwrought and chemicals, Ni content do. 9,610 r 416,000 r 10,300 334,000Secondary, stainless steel scrap and waste and scrap, Ni content do. 51,900 746,000 r 63,700 541,000Wrought, not alloyed, bars, rods, profiles, wire, sheets, strip, do. 526 21,400 746 23,100
foil, tubes, pipes, Ni contentAlloyed, unwrought ingot, bars, rods, profiles, wire, sheets, strip, do. 46,500 1,810,000 41,300 1,520,000
foil, tubes, pipes, other alloyed articles, gross weightNiobium (columbium) and tantalum, gross quantity:
Synthetic concentrates, tantalum-niobium kilograms 138,000 3,260 379,000 6,030Niobium:
Ores and concentrates do. 73,400 557 14,300 103Ferroniobium do. 2,140,000 26,300 2,180,000 25,500
2016Commodity
See footnotes at end of table.
TABLE 7—ContinuedU.S. EXPORTS OF PRINCIPAL MINERALS AND PRODUCTS, EXCLUDING MINERAL FUELS1, 2
(Thousand metric tons and thousand dollars unless otherwise specified)
2015

2.24 [aDVaNcE rElEaSE] u.S. GEOlOGical SurVEy miNEralS yEarBOOK—2016
Quantity Value Quantity ValueMetals:—Continued
Niobium (columbium) and tantalum, gross quantity:—ContinuedTantalum:
Ores and concentrates kilograms 98,200 4,860 162,000 7,300Unwrought powders do. 230,000 84,600 192,000 73,800Unwrought, other do. 5,300 2,140 31,100 9,000Waste and scrap do. 280,000 42,700 171,000 23,200Wrought do. 57,300 36,200 58,000 34,300
Platinum-group metals:Palladium, Pd content do. 23,000 458,000 17,500 272,000Platinum, includes waste and scrap and metal, Pt content do. 261,000 1,360,000 287,000 1,130,000Iridium, osmium, ruthenium, gross weight do. 781 r 13,800 736 11,300Rhodium, Rh content do. 759 25,800 794 19,600
Rare earths, estimated rare-earth-oxide (REO) content:Compounds:
Cerium compounds do. 440,000 10,700 309,000 4,840Scandium or yttrium oxides do. 38,700 588,000 2,060 453,000Other do. 4,500,000 43,800 245,000 11,800
Metals:Ferrocerium and other pyrophoric alloys do. 1,220,000 15,800 943,000 8,270Other, metals and alloys do. 60,100 r 3,750 103,000 3,120
Selenium and tellurium:Selenium, Se content do. 468,000 8,160 150,000 1,770Tellurium, Te content do. 40,800 2,530 4,150 660
Silicon, Si content:Ferrosilicon metric tons 8,780 31,300 7,110 23,400Metal do. 36,800 1,280,000 59,600 1,620,000
Silver:Ores and concentrates, Ag content kilograms 2,500 8,480 15,900 27,500Bullion, Ag content do. 781,000 557,000 237,000 139,000Dore, Ag content do. 34,400 18,300 35,800 21,300Metal powder, gross weight do. 617,000 375,000 772,000 468,000Nitrate, gross weight do. 28,900 3,170 43,600 4,040Semimanufactured forms containing 99.5% or more by weight of silver, do. 265,000 140,000 702,000 427,000
gross weightWaste and scrap, gross weight do. 14,700,000 1,430,000 13,400,000 1,460,000Unwrought, other, gross weight do. 126,000 118,000 231,000 166,000
Thorium and thorium-bearing materials, compounds do. 2,160 779 r 63,900 1,790Tin:
Unwrought:Refined metric tons 807 14,900 1,150 21,600Alloys do. 2,540 19,400 1,040 17,400
Wrought:Bars, rods, profiles, wire do. 5,180 40,700 4,620 39,700Foil do. 33 563 41 622Plates, sheet, strip do. 300 2,280 725 2,950Tubes, pipes, tube and pipe fittings do. 114 1,630 141 2,120
Waste and scrap do. 2,530 7,360 r 4,570 11,200Flakes and powders do. 110 2,470 124 2,290Tinplate and terneplate do. 110,000 r 84,300 r 110,000 72,500
Titanium:Metal, scrap, unwrought, wrought products and castings, ferrotitanium do. 35,400 1,470,000 39,000 1,530,000
and ferrosilicon titaniumOres and concentrates do. 2,040 3,490 r 7,330 9,830Pigment, dioxide and oxide do. 649,000 r 1,460,000 651,000 1,430,000
2016Commodity
See footnotes at end of table.
TABLE 7—ContinuedU.S. EXPORTS OF PRINCIPAL MINERALS AND PRODUCTS, EXCLUDING MINERAL FUELS1, 2
(Thousand metric tons and thousand dollars unless otherwise specified)
2015

StatiStical Summary—2016 [aDVaNcE rElEaSE] 2.25
Quantity Value Quantity ValueMetals:—Continued
Tungsten, W content:Ammonium paratungstate metric tons 310 3,280 108 1,800Carbide powder do. 901 46,600 763 34,600Metal powders do. 312 23,000 308 17,900Miscellaneous tungsten-bearing materials, ferrotungsten, do. 1,840 40,300 2,020 61,200
ferrosilicon tungsten, unwrought, waste and scrap, wrought, compounds
Ores and concentrates do. 398 6,890 183 2,080Vanadium:
Aluminum-vanadium master alloy, gross weight kilograms 229,000 6,450 95,200 2,210Ferrovanadium, V content do. 122,000 3,190 400,000 7,280Metal, including waste and scrap, gross weight do. 5,200 354 18,700 641Pentoxide, anhydride, V content do. 356,000 3,430 5,150 108Other oxides and hydroxides, V content do. 99,800 841 81,300 681
Zinc:Compounds, gross weight:
Oxide metric tons 21,800 28,900 55,300 56,300Sulfate do. 726 751 558 850Chromates of zinc or of lead, lithopone, chloride, sulfide do. XX 22,700 XX 23,400
Ores and concentrates, Zn content do. 708,000 r 986,000 r 597,000 938,000Refined do. 12,700 NA 46,900 NA
Zirconium:Ferrozirconium do. 973 r 2,330 r 476 839Ores and concentrates do. 4,920 r 13,600 r 5,050 12,200Oxide, includes germanium oxide and zirconium dioxide do. 5,700 r NA 5,420 NAUnwrought, including powders do. 213 r 7,320 r 203 7,350Waste and scrap and other zirconium do. 1,320 116,000 948 95,500Total, metals XX 60,000,000 r XX 53,600,000
Industrial minerals:Abrasives, manufactured:
Aluminum oxide, crude metric tons 15,000 51,900 14,200 46,700Metallic abrasives do. 35,900 45,600 28,600 35,700Silicon carbide, crude, ground and refined do. 19,700 38,300 6,820 20,300
Asbestos, includes reexports:Manufactured do. 1,720 26,100 r 2,710 35,400Unmanufactured do. 517 116 587 116
Barite, natural barium sulfate do. 147,000 r 54,800 r 78,500 30,100Boron minerals and compounds:
Boric acid, includes orthoboric and anhydrous do. 195,000 r 149,000 r 241,000 150,000Sodium borates do. 504,000 r 264,000 552,000 284,000
Bromine, Br equivalent:Compounds, inorganic and organic do. 21,000 r 70,800 r 19,800 67,500Elemental do. 3,960 8,850 5,330 13,400
Cement, hydraulic and clinker5 1,540 r 236,000 r 1,280 192,000Clay:
Artificially activated clay and earth 173 91,300 143 80,100Ball clay 48 10,200 41 9,320Bentonite 938 199,000 801 174,000Fire clay 217 40,600 184 36,400Fullerʼs earth 77 31,700 86 34,400Kaolin 2,420 557,000 2,290 527,000Other, n.e.c.6 268 73,600 256 72,700
2015 2016Commodity
See footnotes at end of table.
TABLE 7—ContinuedU.S. EXPORTS OF PRINCIPAL MINERALS AND PRODUCTS, EXCLUDING MINERAL FUELS1, 2
(Thousand metric tons and thousand dollars unless otherwise specified)

2.26 [aDVaNcE rElEaSE] u.S. GEOlOGical SurVEy miNEralS yEarBOOK—2016
Quantity Value Quantity ValueIndustrial minerals:—Continued
Diamond:Exclusive of industrial diamond, including reexports thousand carats 12,200 18,500,000 11,500 19,400,000Industrial including exports and reexports:
Unworked, reexports do. 569 21,500 526 15,400Powder, dust and grit, natural and synthetic do. 157,000 74,500 152,000 71,500
Diatomite 74 r 40,800 r 66 37,300Feldspar metric tons 15,100 4,920 5,890 1,520Fluorspar do. 13,700 2,210 11,900 1,900Garnet, industrial do. 14,700 11,000 13,400 10,800Graphite, natural and synthetic do. 43,700 198,000 44,400 166,000Gypsum and gypsum products:
Crude 63 28,000 42 18,600Plasters 95 41,700 r 93 36,800Boards 767 137,000 725 131,000Other XX 79,100 XX 75,900
Helium, Grade-A million cubic meters 64.0 r NA 62.3 NAIodine:
Crude, resublimed metric tons 1,210 r 29,400 r 1,050 23,300Potassium iodide do. 282 5,640 r 246 4,020
Iron oxide pigments and hydroxides:Pigment grade do. 8,930 17,200 15,800 45,600Other grade do. 58,100 r 32,700 47,800 26,100
Kyanite and related materials do. 39,900 13,900 37,100 13,000Lime 346 62,600 r 329 64,500Lithium chemicals, Li content:
Carbonate metric tons 255 7,880 195 6,150Carbonate, U.S.P.7 do. 16 1,960 20 2,720Hydroxide do. 1,520 74,800 r 1,300 70,600
Magnesium compounds:Chloride, hydroxide and peroxide, sulfate XX 35,100 XX 29,800Magnesite, crude and processed:
Caustic-calcined magnesia metric tons 5,680 3,810 8,060 5,490Dead-burned and fused magnesia do. 24,800 16,700 48,400 30,300Other magnesia do. 13,100 13,500 9,370 9,820Crude do. 520 764 523 620
Mica:Scrap and flake:
Powder do. 7,100 9,570 r 6,020 8,440Waste do. 279 89 207 82
Sheet:Unworked do. 57 253 116 423Worked do. 911 r 20,500 687 16,400
Nitrogen, major compounds, N content 1,260 NA 1,230 NAPeat 28 NA 30 NAPerlite, crudee 30 r 4,260 21 3,290Phosphate rock:
Diammonium phosphate 2,110 943,000 r 1,710 588,000Elemental phosphorus metric tons 18,600 r 61,200 r 16,500 59,000Monoammonium phosphate 2,280 r 1,090,000 r 2,580 947,000Phosphoric acid 415 r 152,000 r 663 204,000
Potash, gross weight:Potassium chloride metrics tons 27,700 NA 22,300 NAPotassium sulfates, all grades do. 350,000 NA 320,000 NAPotassium nitrate do. 8,870 r NA 8,040 NA
Pumice and pumicite 11 NA 9 NA
U.S. EXPORTS OF PRINCIPAL MINERALS AND PRODUCTS, EXCLUDING MINERAL FUELS1, 2
(Thousand metric tons and thousand dollars unless otherwise specified)
Commodity
See footnotes at end of table.
2015 2016
TABLE 7—Continued

StatiStical Summary—2016 [aDVaNcE rElEaSE] 2.27
Quantity Value Quantity ValueIndustrial minerals:—Continued
Salt 830 r 141,000 r 716 146,000Sand and gravel:
Construction:Sand 60 16,900 22 8,020Gravel 11 4,790 12 5,860
Industrial 3,910 r 382,000 r 2,780 316,000Soda ash 6,400 r 1,320,000 6,780 1,320,000Stone:
Crushed 427 r 44,200 r 530 47,100Dimension XX 74,900 r XX 65,500
Strontium carbonate, precipitated kilograms 145,000 147 154,000 147Sulfur:
Elemental 1,840 r 284,000 r 2,050 213,000Sulfuric acid, 100% H2SO4 metric tons 177,000 r 30,700 177,000 30,000
Talc, excludes powders-talcum (in package), face, compact, or cut do. 206,000 59,400 239,000 82,800and sawed talc
Vermiculite 2 NA 2 NAWollastonitee metric tons <10,000 NA <10,000 NAZeolitese do. <1,000 r NA <1,000 NA
Total, industrial minerals XX 26,100,000 XX 26,200,000Grand total XX 86,000,000 r XX 79,800,000
7United States pharmaceutical-grade lithium carbonate.
1Table includes data from the commodity chapters published in the U.S. Geological Survey 2016 Minerals Yearbook as they were completed and released through March 2019.2Data are rounded to no more than three significant digits; may not add to totals shown.3Listed as metal only, but may include alloys, waste, and compounds.4Less than ½ unit.5Excludes Puerto Rico.6Not elsewhere classified.
(Thousand metric tons and thousand dollars unless otherwise specified)
2015 2016Commodity
eEstimated. rRevised. do. Ditto. NA Not available. XX Not applicable. -- Zero.
TABLE 7—ContinuedU.S. EXPORTS OF PRINCIPAL MINERALS AND PRODUCTS, EXCLUDING MINERAL FUELS1, 2
2.28 [aDVaNcE rElEaSE] u.S. GEOlOGical SurVEy miNEralS yEarBOOK—2016
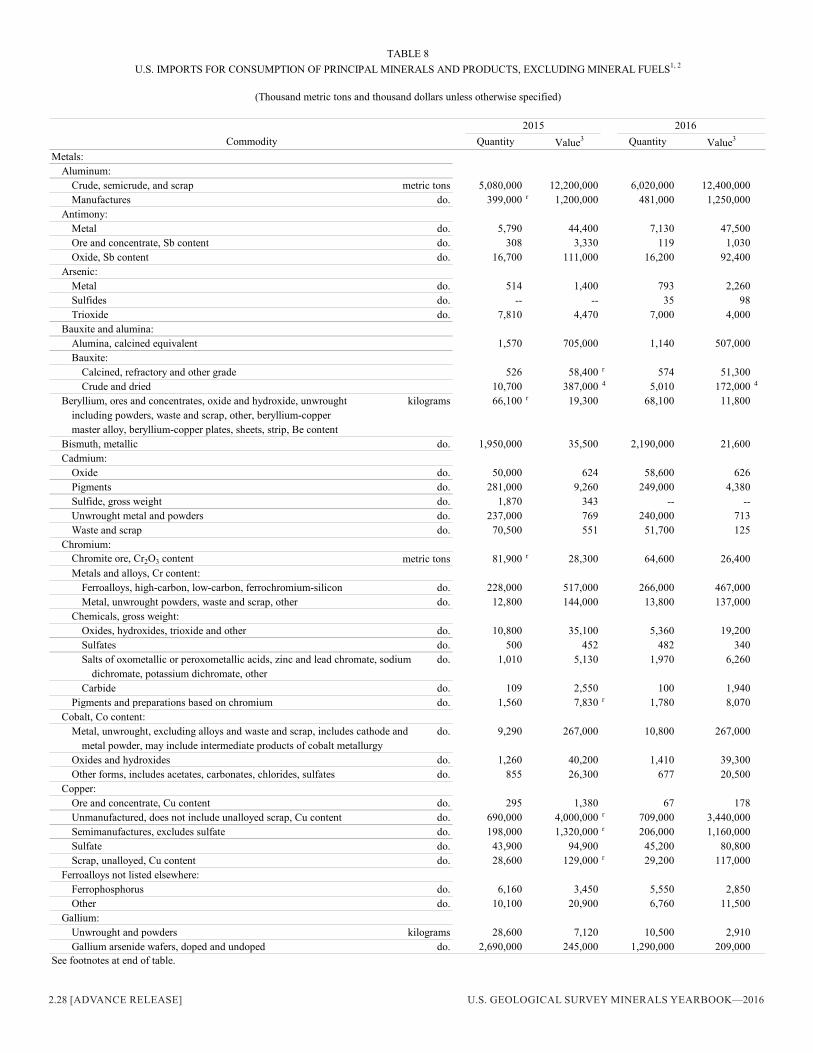
Commodity Quantity Value3 Quantity Value3
Metals:Aluminum:
Crude, semicrude, and scrap metric tons 5,080,000 12,200,000 6,020,000 12,400,000Manufactures do. 399,000 r 1,200,000 481,000 1,250,000
Antimony:Metal do. 5,790 44,400 7,130 47,500Ore and concentrate, Sb content do. 308 3,330 119 1,030Oxide, Sb content do. 16,700 111,000 16,200 92,400
Arsenic:Metal do. 514 1,400 793 2,260Sulfides do. -- -- 35 98Trioxide do. 7,810 4,470 7,000 4,000
Bauxite and alumina:Alumina, calcined equivalent 1,570 705,000 1,140 507,000Bauxite:
Calcined, refractory and other grade 526 58,400 r 574 51,300Crude and dried 10,700 387,000 4 5,010 172,000 4
Beryllium, ores and concentrates, oxide and hydroxide, unwrought kilograms 66,100 r 19,300 68,100 11,800including powders, waste and scrap, other, beryllium-coppermaster alloy, beryllium-copper plates, sheets, strip, Be content
Bismuth, metallic do. 1,950,000 35,500 2,190,000 21,600Cadmium:
Oxide do. 50,000 624 58,600 626Pigments do. 281,000 9,260 249,000 4,380Sulfide, gross weight do. 1,870 343 -- --Unwrought metal and powders do. 237,000 769 240,000 713Waste and scrap do. 70,500 551 51,700 125
Chromium:Chromite ore, Cr2O3 content metric tons 81,900 r 28,300 64,600 26,400Metals and alloys, Cr content:
Ferroalloys, high-carbon, low-carbon, ferrochromium-silicon do. 228,000 517,000 266,000 467,000Metal, unwrought powders, waste and scrap, other do. 12,800 144,000 13,800 137,000
Chemicals, gross weight:Oxides, hydroxides, trioxide and other do. 10,800 35,100 5,360 19,200Sulfates do. 500 452 482 340Salts of oxometallic or peroxometallic acids, zinc and lead chromate, sodium do. 1,010 5,130 1,970 6,260
dichromate, potassium dichromate, otherCarbide do. 109 2,550 100 1,940
Pigments and preparations based on chromium do. 1,560 7,830 r 1,780 8,070Cobalt, Co content:
Metal, unwrought, excluding alloys and waste and scrap, includes cathode and do. 9,290 267,000 10,800 267,000metal powder, may include intermediate products of cobalt metallurgy
Oxides and hydroxides do. 1,260 40,200 1,410 39,300Other forms, includes acetates, carbonates, chlorides, sulfates do. 855 26,300 677 20,500
Copper:Ore and concentrate, Cu content do. 295 1,380 67 178Unmanufactured, does not include unalloyed scrap, Cu content do. 690,000 4,000,000 r 709,000 3,440,000Semimanufactures, excludes sulfate do. 198,000 1,320,000 r 206,000 1,160,000Sulfate do. 43,900 94,900 45,200 80,800Scrap, unalloyed, Cu content do. 28,600 129,000 r 29,200 117,000
Ferroalloys not listed elsewhere:Ferrophosphorus do. 6,160 3,450 5,550 2,850Other do. 10,100 20,900 6,760 11,500
Gallium:Unwrought and powders kilograms 28,600 7,120 10,500 2,910Gallium arsenide wafers, doped and undoped do. 2,690,000 245,000 1,290,000 209,000
2015 2016
See footnotes at end of table.
TABLE 8U.S. IMPORTS FOR CONSUMPTION OF PRINCIPAL MINERALS AND PRODUCTS, EXCLUDING MINERAL FUELS1, 2
(Thousand metric tons and thousand dollars unless otherwise specified)

StatiStical Summary—2016 [aDVaNcE rElEaSE] 2.29
Commodity Quantity Value3 Quantity Value3
Metals:—ContinuedGermanium, metal kilograms 20,100 31,300 r 11,000 12,700Gold:
Ores and concentrates do. 447 18,400 258 8,330Dore and precipitates do. 174,000 6,710,000 196,000 7,940,000Bullion, refined do. 89,800 3,380,000 177,000 7,190,000Waste and scrap do. 60,900 618,000 23,000 464,000Metal powder do. 373 10,100 260 8,970Compounds do. 57,300 r 5,950 r 44,400 6,210
Indium, unwrought metal and powders do. 140,000 55,500 160,000 35,100Iron and steel:
Steel mill products 35,200 NA 30,000 NAFabricated steel products 5,740 NA 5,600 NACast iron and steel products 540 NA 504 NAStainless steel metric tons 1,290,000 NA 896,000 NA
Iron and steel scrap:Ferrous, includes tinplate and terneplate, excludes used rails for rerolling 3,510 955,000 3,860 949,000
and other uses and ships, boats, and other vessels for scrappingPig iron, all grades metric tons 4,530,000 1,290,000 3,870,000 948,000Direct-reduced iron, steelmaking grade do. 1,860,000 483,000 1,600,000 334,000Ships, boats, and other vessels for scrapping (5) 256 (5) 509Used rails for rerolling and other uses, includes mixed (used plus new) rails metric tons 103,000 29,900 95,400 22,800
Iron ore 4,550 455,000 3,010 241,000Lead, gross weight:
Base bullion metric tons 342 r 492 r 237 396Refined lead, unwrought do. 417,000 762,000 416,000 809,000Wrought and other products do. 1,660 6,420 2,840 7,130Scrap do. 3,530 2,310 1,980 1,090
Magnesium:Waste and scrap, gross weight do. 21,300 44,300 r 21,900 50,300Metal, gross weight do. 13,800 r 54,000 r 13,300 46,000Alloys, Mg content do. 7,870 r 43,600 r 7,040 38,100Powder, sheets, tubing, ribbons, wire, other forms, Mg content do. 6,270 r 28,800 r 3,260 20,800
Manganese:Ores and concentrates with 20% or more Mn, all grades, Mn content do. 216,000 92,500 140,000 42,000Ferromanganese, all grades, Mn content do. 228,000 343,000 172,000 213,000Silicomanganese, Mn content do. 203,000 r 304,000 r 178,000 195,000Metal, unwrought, other wrought, waste and scrap, gross weight do. 30,000 r 70,000 r 22,900 47,700Chemicals, gross weight:
Manganese dioxide do. 6,800 r 15,100 5,510 11,700Potassium permanganate do. 908 2,370 736 1,840
Mercury:Metal kilograms 25,800 602 24,300 276Amalgams of precious metals whether or not chemically defined do. 21,400 r 45,200 r 20,200 34,300
Molybdenum:Ores and concentrates, including roasted and other, Mo content metric tons 12,900 206,000 14,900 215,000Chemicals:
Oxides and hydroxides, gross weight do. 756 10,100 3,280 41,400Molybdates, all, Mo content do. 578 12,000 1,580 32,700Orange, gross weight do. 609 2,580 737 2,420
Ferromolybdenum, Mo content do. 1,610 36,300 1,900 46,900Other, includes powders, unwrought, bars and rods, waste and scrap, wire, do. 1,650 r 55,800 1,920 50,800
other, gross weightNickel:
Primary, unwrought and chemicals, Ni content metric tons 130,000 1,770,000 111,000 1,230,000Secondary, stainless steel scrap and waste and scrap, Ni content do. 27,100 337,000 32,300 325,000
(Thousand metric tons and thousand dollars unless otherwise specified)
See footnotes at end of table.
TABLE 8—ContinuedU.S. IMPORTS FOR CONSUMPTION OF PRINCIPAL MINERALS AND PRODUCTS, EXCLUDING MINERAL FUELS1, 2
2015 2016

2.30 [aDVaNcE rElEaSE] u.S. GEOlOGical SurVEy miNEralS yEarBOOK—2016
Commodity Quantity Value3 Quantity Value3
Metals:—ContinuedNickel:—Continued
Wrought, not alloyed, bars, rods, profiles, wire, sheets, strip, foil, tubes, metric tons 790 19,800 774 19,900pipes, Ni content
Alloyed, unwrought ingot, bars, rods, profiles, wire, sheets, strip, foil, tubes, do. 32,200 887,000 r 26,700 718,000pipes, other alloyed articles, gross weight*
Niobium (columbium) and tantalum, gross quantity:Synthetic concentrates, tantalum-niobium kilograms -- -- 9,150 46Niobium:
Ores and concentrates do. -- -- 1,160 18Oxide do. 1,410,000 50,900 1,220,000 41,200Ferroniobium do. 10,100,000 271,000 10,900,000 244,000Unwrought powders do. 886,000 45,300 r 1,230,000 58,700
Tantalum:Ores and concentrates do. 730,000 49,300 675,000 37,300Unwrought, powders do. 150,000 58,400 156,000 52,200Unwrought, other do. 266,000 r 91,200 r 164,000 45,400Waste and scrap do. 565,000 r 55,400 r 489,000 41,900Wrought do. 41,300 21,500 47,900 20,600
Platinum-group metals:Platinum, grains and nuggets, sponge, other unwrought, other, waste and do. XX 2,370,000 XX 2,180,000
scrap, coins, Pt contentPalladium, unwrought, Pd content do. 75,700 r 1,650,000 r 68,100 1,340,000Palladium, other, Pd content do. 9,600 228,000 12,300 275,000Iridium, unwrought and other forms, Ir content do. 1,010 17,400 1,300 23,000Osmium, unwrought, Os content do. 8 59 27 159Ruthenium, unwrought, Ru content do. 8,230 14,600 8,410 14,500Rhodium, unwrought and other forms, Rh content do. 10,600 336,000 10,700 230,000
Rare earths, estimated equivalent rare-earth-oxide (REO) content:Cerium compounds, including oxides do. 1,440,000 24,300 r 1,830,000 21,600Other rare-earth compounds:
Carbonates, lanthanum and other do. 540,000 2,540 1,600,000 4,520Chlorides, includes mixtures of oxides or chlorides do. 176,000 3,550 256,000 2,480Oxides, except cerium oxide do. 3,120,000 19,000 3,420,000 11,500Unspecified do. 3,830,000 92,300 r 4,310,000 64,900Yttrium materials and compounds content by weight greater than 19% but do. 50,400 11,400 71,000 4,620
less than 85% oxide equivalentMetals and alloys:
Ferrocerium and other pyrophoric alloys do. 356,000 6,310 268,000 4,360Cesium, unalloyed do. 144,000 r 1,040 104,000 467Lanthanum, unalloyed do. 72,600 r 464 50,900 396Neodymium, unalloyed do. 5,520 r 417 8,360 327Other, unalloyed do. 73,700 1,050 52,100 1,360Other, alloys do. 89,100 1,380 188,000 1,310
Rhenium:Metal do. 25,400 63,600 25,900 65,500Ammonium perrhenate do. 9,130 13,900 8,570 14,000
Selenium and tellurium:Selenium, Se content:
Selenium do. 444,000 19,300 411,000 12,500Dioxide do. 19,200 629 29,600 537
Tellurium, Te content do. 76,000 5,990 72,700 4,880Silicon, Si content:
Ferrosilicon metric tons 162,000 322,000 155,000 246,000Metal do. 139,000 464,000 122,000 379,000
2016
U.S. IMPORTS FOR CONSUMPTION OF PRINCIPAL MINERALS AND PRODUCTS, EXCLUDING MINERAL FUELS1, 2
See footnotes at end of table.
TABLE 8—Continued
(Thousand metric tons and thousand dollars unless otherwise specified)
2015

StatiStical Summary—2016 [aDVaNcE rElEaSE] 2.31
Commodity Quantity Value3 Quantity Value3
Metals:—ContinuedSilver:
Ash and residues, ores and concentrates, Ag content kilograms 2,700 r 814 r 4,630 1,530Bullion, Ag content do. 4,660,000 2,410,000 4,870,000 2,680,000Dore, Ag content do. 1,270,000 993,000 1,290,000 1,090,000Metal powder, gross weight do. 514,000 113,000 356,000 52,500Nitrate, gross weight do. 2,550 352 r 3,390 731Semimanufactured forms containing 99.5% or more by weight of silver, do. 441,000 199,000 692,000 357,000
gross weightWaste and scrap, gross weight do. 5,400,000 293,000 6,650,000 260,000Unwrought, other, gross weight do. 237,000 98,200 343,000 164,000
Thorium:Thorium ore, monazite concentrate do. -- -- 16,000 3Thorium and thorium-bearing materials, compounds do. 2,740 r 216 r 3,130 284
Tin, gross weight:Unwrought:
Refined metric tons 33,600 546,000 32,200 540,000Alloys do. 2,720 43,400 1,910 30,000
Wrought:Bars, rods, profiles, wire do. 1,220 63,800 r 1,200 63,800Foil do. 96 3,400 86 2,150Plates, sheet, strip do. 90 502 94 500Tubes, pipes, tube and pipe fittings do. 12 149 1 32
Waste and scrap do. 32,700 12,300 27,200 5,460Flakes and powders do. 238 5,400 219 5,160Oxides do. 417 7,340 383 6,270Tinplate and terneplate do. 700,000 729,000 805,000 726,000
Titanium:Concentrate:
Ilmenite do. 649,000 139,000 r 592,000 84,200Rutile, natural and synthetic do. 393,000 282,000 349,000 230,000
Metal:Waste and scrap do. 22,100 r 124,000 r 18,500 93,600Unwrought:
Sponge do. 20,700 203,000 16,200 148,000Ingots do. 404 r 10,700 r 689 15,100Powder do. 129 r 8,260 r 161 12,000Other do. 1,490 r 33,400 r 1,230 31,900
Wrought products and castings, includes bar, castings, foil, pipe, plate, do. 6,260 r 317,000 r 7,190 351,000profile, rod, sheet, strip, tube, wire, other
Ferrotitanium and ferrosilicon titanium do. 1,730 6,260 3,140 7,840Pigment, dioxide and oxide do. 221,000 r 547,000 r 247,000 535,000Titaniferous iron ore do. 64,700 32,400 15,200 1,430Titaniferous slag do. 399,000 248,000 402,000 254,000
Tungsten, W content: Ammonium paratungstate do. 1,270 35,500 1,020 20,700 Ferrotungsten and ferrosilicon tungsten do. 269 9,060 236 6,130 Miscellaneous tungsten-bearing materials, metal powders, carbide powder, do. 4,740 r 190,000 r 5,040 164,000
unwrought, waste and scrap, wrought, oxides, calcium tungstate, other
tungstates, other compounds Ores and concentrates do. 3,970 98,700 3,580 65,100
Vanadium:Aluminum-vanadium master alloy, gross weight kilograms 204,000 4,520 235,000 4,120Ferrovanadium, V content do. 1,980,000 r 64,100 r 1,590,000 47,800Metal, including waste and scrap, gross weight do. 182,000 3,450 45,300 1,040Miscellaneous chemicals, sulfates and vanadates, V content do. 186,000 2,460 r 325,000 4,520
2015
See footnotes at end of table.
TABLE 8—ContinuedU.S. IMPORTS FOR CONSUMPTION OF PRINCIPAL MINERALS AND PRODUCTS, EXCLUDING MINERAL FUELS1, 2
(Thousand metric tons and thousand dollars unless otherwise specified)
2016

2.32 [aDVaNcE rElEaSE] u.S. GEOlOGical SurVEy miNEralS yEarBOOK—2016
Commodity Quantity Value3 Quantity Value3
Metals:—ContinuedVanadium:—Continued
Pentoxide, anhydride, V content kilograms 2,870,000 r 32,800 2,460,000 25,400Vanadium-bearing ash and residues from the manufacture of iron and steel, do. 8,210,000 r 36,000 r 5,030,000 10,000
V contentOther oxides and hydroxides, V content do. 93,700 1,840 660,000 10,000
Zinc:Compounds, gross weight:
Oxide metric tons 116,000 250,000 123,000 239,000Sulfate do. 89,000 68,100 79,900 60,400Chloride, chromates of zinc or of lead, lithopone, sulfide do. XX 13,000 XX 9,740
Ores and concentrates, Zn content do. 22 NA 60 NARefined do. 771,000 NA 713,000 NA
Zirconium and hafnium:Hafnium, unwrought, including powders do. 72 19,400 180 32,600Zirconium:
Ferrozirconium do. 158 669 r 59 240Ores and concentrates do. 32,000 r 37,300 r 38,400 38,100Oxide do. 4,140 r NA 2,620 NAUnwrought, including powder do. 953 r 17,400 841 27,700Waste and scrap, and other do. 361 r 27,900 r 399 29,300
Total, metals XX 55,600,000 r XX 57,000,000Industrial minerals:
Abrasives, manufactured:Aluminum oxide, crude, ground and refined metric tons 164,000 136,000 155,000 106,000Metallic abrasives do. 52,800 30,900 54,100 29,300Silicon carbide, crude, ground and refined do. 139,000 114,000 116,000 87,200
Asbestos:Chrysotile and other unspecified type do. 386 r 808 r 702 1,430Products with basis of asbestos, cellulose, or other minerals NA 5,240 NA 7,660
Barite:Chloride, oxide, hydroxide, peroxide, precipitated carbonate XX 8,550 XX 9,430Crude metric tons 521,000 76,100 270,000 44,100Ground do. 1,120,000 146,000 966,000 117,000Other sulfates do. 25,400 r 24,400 r 20,900 30,500
Boron minerals and compounds:Borax 136 49,200 173 60,400Boric acid metric tons 39,700 r 25,700 r 46,300 27,800Colemanite 35 11,900 35 11,400Ulexite 70 4,620 43 4,790
Bromine:Compounds, Br content metric tons 55,500 117,000 55,400 114,000Elemental do. 2,530 7,270 2,690 8,090
Cement, hydraulic and clinker6 11,300 r 803,000 r 13,200 884,000Clay:
Artificially activated clay and earth 24 13,600 26 14,400Ball clay 2 457 (5) 103Bentonite 16 9,350 22 8,190Chamotte or Dinas Earth (5) 163 1 115Kaolin 426 43,700 389 43,600Fire clay 40 6,900 22 6,400Fullerʼs earth 2 101 (5) 217Other, n.e.c.7 9 5,300 11 5,460
2015
See footnotes at end of table.
TABLE 8—Continued
(Thousand metric tons and thousand dollars unless otherwise specified)
2016
U.S. IMPORTS FOR CONSUMPTION OF PRINCIPAL MINERALS AND PRODUCTS, EXCLUDING MINERAL FUELS1, 2

StatiStical Summary—2016 [aDVaNcE rElEaSE] 2.33
Commodity Quantity Value3 Quantity Value3
Industrial minerals:—ContinuedDiamond, industrial:
Diamond stones, natural industrial and minersʼ, natural and thousand carats 1,310 22,900 1,370 18,700synthetic
Powder, dust and grit, natural and synthetic do. 275,000 54,600 216,000 49,200Feldspar and nepheline syenite:
Feldspar metric tons 120,000 7,090 36,900 3,430Nepheline syenite do. 449,000 67,600 572,000 73,000
Fluorspar:Aluminum fluoride do. 32,400 41,600 20,500 23,100Cryolite do. 18,900 14,700 15,700 12,800Fluorspar do. 376,000 107,000 383,000 102,000Hydrofluoric acid do. 120,000 196,000 126,000 190,000
Garnet, industrial do. 240,000 r 54,000 r 150,000 30,000Gemstones thousand carats 2,600,000 25,100,000 1,890,000 25,200,000Graphite:
Natural metric tons 46,700 58,600 r 38,900 47,600Synthetic do. 80,600 128,000 75,000 127,000Electric furnace electrodes do. 71,200 231,000 58,900 143,000
Gypsum:Crude 4,030 54,100 4,340 63,200Plasters 21 7,210 41 15,300Boards 348 86,100 399 94,800Other XX 37,000 XX 35,600
Helium, Grade-A million cubic meters 15.9 r NA 23.4 NAIodine:
Crude metric tons 5,630 156,000 4,320 98,000Potassium iodide do. 262 4,720 202 3,730
Iron oxide pigments:Natural do. 3,600 2,660 7,110 3,480Synthetic do. 172,000 206,000 172,000 193,000
Kyanite and related materials do. 11,500 3,680 2,510 710Lime 391 64,600 4 376 59,700 4
Lithium chemicals, Li content:Carbonate metric tons 2,420 57,800 r 2,920 76,100Carbonate, U.S.P.8 do. 6 774 3 508Hydroxide do. 324 13,600 211 11,700
Magnesium compounds:Compounds, chlorides, hydroxide, peroxide, sulfates do. XX 59,300 r XX 60,300Magnesite, crude and processed:
Caustic-calcined magnesia do. 183,000 53,800 r 158,000 43,600Dead-burned and fused magnesia do. 259,000 138,000 r 149,000 88,600Other magnesia do. 51,000 29,900 r 39,800 23,600Crude do. 77,900 10,400 1,270 1,980
Mica:Scrap and flake:
Powder do. 28,000 r 17,600 27,200 17,800Waste do. 5,170 2,860 4,320 2,630
Sheet:Unworked do. 112 437 61 155Worked do. 2,010 r 16,400 r 2,000 17,300
Nitrogen, major compounds, N content 9,060 6,750,000 8,170 4,550,000Peat 1,150 312,000 1,130 314,000Perlite, processed crude 143 r 14,800 188 18,000
(Thousand metric tons and thousand dollars unless otherwise specified)
See footnotes at end of table.
TABLE 8—ContinuedU.S. IMPORTS FOR CONSUMPTION OF PRINCIPAL MINERALS AND PRODUCTS, EXCLUDING MINERAL FUELS1, 2
2015 2016

2.34 [aDVaNcE rElEaSE] u.S. GEOlOGical SurVEy miNEralS yEarBOOK—2016
Commodity Quantity Value3 Quantity Value3
Industrial minerals:—ContinuedPhosphate rock and phosphatic materials:
Phosphate rock:Unground 1,520 150,000 4 1,320 118,000 4
Ground 442 r 75,600 r, 4 267 42,100 4
Dicalcium phosphate 11 13,000 r, 4 28 21,200 4
Elemental phosphorus 14 52,500 r, 4 5 18,000 4
Triple superphosphate 201 r 81,000 r, 4 295 89,400 4
Diammonium phosphate 599 r 290,000 r, 4 586 213,000 4
Monoammonium phosphate 582 300,000 r, 4 853 334,000 4
Fertilizer containing nitrates and phosphates 87 43,300 r, 4 32 12,600 4
Phosphoric acid 1 197 r, 4 2 401 4
Potash, gross weight:Potassium chloride metric tons 7,990,000 2,570,000 7,310,000 2,030,000Potassium sulfate do. 134,000 62,900 113,000 40,700Potassium nitrate do. 122,000 88,400 66,000 43,900Potassium sodium nitrate mixture do. 1,830 534 4,130 1,910
Pumice: Crude or unmanufactured do. 64,000 1,860 170,000 4,260 Wholly or partially manufactured do. 216 600 190 516
Salt 21,600 578,000 12,100 390,000Sand and gravel:
Construction 3,890 61,400 4 3,490 45,500 4
Industrial 289 r 16,400 r, 4 281 15,400 4
Soda ash 40 6,780 r, 4 35 6,670 4
Stone: Crushed, chips, calcium carbonate fines, excludes precipitated carbonates 19,900 r 200,000 r, 4 19,700 184,000 4
Dimension XX 2,380,000 r XX 2,170,000Strontium:
Carbonate kilograms 9,710,000 8,030 8,960,000 7,260Celestite do. 55,800,000 2,850 10,100,000 787Metal do. 141,000 1,080 83,900 521Nitrate do. 2,720,000 3,540 2,430,000 3,020Oxide, hydroxide, peroxide do. 103,000 172 36,800 82
Sulfur:Elemental9 2,240 e 136,000 1,820 e 79,800Sulfuric acid, 100% H2SO4 metric tons 3,540,000 208,000 3,220,000 139,000
Talc, unmanufactured do. 322,000 109,000 378,000 130,000Vermiculite 21 NA 46 NAWollastonitee metric tons ≤4,000 NA ≤4,000 NAZeolitese do. <1,000 r NA <1,000 NA
Total, industrial minerals XX 43,300,000 XX 39,600,000Grand total XX 98,900,000 r XX 96,600,000
7Not elsewhere classified.8United States pharmaceutical-grade lithium carbonate.9General imports.
eEstimated. rRevised. do. Ditto. NA Not available. XX Not applicable. -- Zero.1Table includes data from the commodity chapters published in the U.S. Geological Survey 2016 Minerals Yearbook as they were completed and released through March 2019.2Data are rounded to no more than three significant digits; may not add to totals shown.3Customs value unless otherwise specified.4Cost, insurance, and freight value.5Less than ½ unit.
2015 2016
U.S. IMPORTS FOR CONSUMPTION OF PRINCIPAL MINERALS AND PRODUCTS, EXCLUDING MINERAL FUELS1, 2
6Excludes Puerto Rico. Data adjusted by the U.S. Geological Survey.
TABLE 8—Continued
(Thousand metric tons and thousand dollars unless otherwise specified)
*Correction posted on September 29, 2021.

StatiStical Summary—2016 [aDVaNcE rElEaSE] 2.35
2012 2013 2014 2015 2016 2016Metals:
Alumina, calcined equivalent2 97,100 r 106,000 r 111,000 r 119,000 r 121,000 2,360 1.95Aluminum, primary3 49,600 r 52,200 r 54,200 58,000 r 58,900 818 1.39Antimony, Sb content metric tons 174,000 r 193,000 r 157,000 r 143,000 r 144,000 -- --Arsenic trioxide4 do. 39,200 r 38,300 r 36,500 r 37,100 r 37,100 -- --Bauxite 255,000 r 295,000 r 258,000 r 299,000 270,000 W 5 WBeryl, gross weight6 metric tons 7,410 r 7,400 r 8,430 r 6,730 r 5,500 3,870 70.4Bismuth, refinery do. 16,700 r 17,000 r 19,800 r 19,500 r 17,100 p -- --Cadmium, refinery7, 8 do. 22,500 r 22,600 r 23,700 r 22,800 r 23,900 W WChromite, gross quantity 26,900 r 30,000 r 30,500 r 31,200 r 30,400 -- --Cobalt, Co content:
Mine9 metric tons 96,800 r 106,000 r 115,000 r 121,000 r 113,000 690 e 0.61Refinery10 do. 77,900 r 86,700 92,700 99,800 r 96,600 -- --
Copper:Mine, recoverable, Cu content11 16,700 r 18,300 18,500 r 19,200 r 20,100 1,430 7.10Smelter, gross weight12 15,900 r 16,600 r 18,000 r 18,500 18,900 563 2.98Refinery13 20,400 r 21,300 r 22,800 r 23,200 r 23,400 1,220 5.22
Gold, mine metric tons 2,750 2,930 r 3,030 r 3,090 r 3,120 222 7.13Indium, refinery kilograms 784,000 816,000 r 881,000 731,000 r 682,000 p, e -- --Iron ore14 2,070,000 r 2,200,000 r 2,340,000 r 2,320,000 r 2,350,000 41,800 1.78Iron and steel:
Direct-reduced iron15 70,800 r 71,100 r 75,800 r 69,700 r 72,700 1,800 2.48Pig iron16 1,120,000 1,170,000 r 1,190,000 r 1,160,000 r 1,160,000 22,300 1.92Raw steel16, 17 1,560,000 r 1,610,000 r 1,670,000 1,620,000 1,630,000 78,500 4.82
Lead:Mine, concentrates, Pb content 5,050 r 5,250 r 5,260 r 4,970 r 4,700 346 18 7.36Refinery19 10,700 r 11,100 r 10,700 r 10,800 r 10,200 986 9.69
Magnesium, primary7 metric tons 840,000 910,000 r 1,000,000 979,000 r 998,000 p W WManganese ore, Mn content20 16,200 17,200 16,400 17,000 15,700 -- --Mercury, mine7 metric tons 1,830 2,330 r 2,770 r 2,330 r 2,480 p -- --Molybdenum, mine, Mo content do. 272,000 r 281,000 r 306,000 r 288,000 r 279,000 e 36,200 13.0Nickel, Ni content:
Mine, recoverable do. 2,420,000 r 2,660,000 r 2,170,000 r 2,180,000 r 2,040,000 24,100 21 1.18Plant do. 1,810,000 1,980,000 2,000,000 2,000,000 r 1,930,000 -- --
Niobium (columbium) mineral concentrates, do. 62,700 59,300 r 68,600 63,300 r 64,100 -- --Nb content
Platinum-group metals:Palladium kilograms 203,000 r 204,000 193,000 218,000 r 212,000 13,100 22 6.18Platinum do. 181,000 193,000 r 150,000 r 195,000 r 191,000 3,890 22 2.04Othere do. 447,000 r 461,000 r 390,000 r 478,000 r 473,000 -- --
Rare earths, rare-earth-oxide (REO) metric tons 106,000 107,000 125,000 130,000 129,000 -- --equivalente
Rheniume kilograms 50,900 46,600 47,100 r 49,700 r 51,600 8,440 23 16.4Selenium, refinery, Se contente, 7 metric tons 2,260 r 2,170 2,250 2,190 r 2,250 p W WSilver, mine24 do. 24,900 r 25,900 r 26,700 r 27,000 r 26,600 1,150 4.31Tantalum mineral concentrates, Ta content do. 1,020 r 1,290 1,430 r 1,200 r 1,220 -- --Tellurium, Te content kilograms 93,700 104,000 115,000 119,000 133,000 p W WTin, Sn content:
Mine24 metric tons 226,000 r 254,000 r 288,000 r 341,000 r 288,000 -- --Smelter25 do. 341,000 r, * 346,000 r 393,000 r, * 353,000 r, * 330,000 * 11,100 * 3.37 *
Titanium mineral concentrates:Ilmenite and leucoxene 7,250 r 8,270 r 7,640 r 6,980 r 7,000 100 26 1.43Rutile7 metric tons 811,000 r 640,000 r 660,000 r 760,000 r 889,000 W W
world totalPercent of
United StatesWorld total
Commodity
WORLD AND U.S. PRODUCTION OF SELECTED NONFUEL MINERAL COMMODITIES1TABLE 9
(Thousand metric tons unless otherwise specified)
See footnotes at end of table.

2.36 [aDVaNcE rElEaSE] u.S. GEOlOGical SurVEy miNEralS yEarBOOK—2016
2012 2013 2014 2015 2016 2016Metals:—Continued
Tungsten, W content metric tons 77,700 r 85,400 r 88,500 r 89,700 r 88,100 -- --Vanadium, V content27 do. 74,900 81,400 r 85,700 r 84,600 r 79,000 p -- --Zinc:
Mine, Zn content of mineral concentrates and 13,300 r 13,700 r 13,600 r 13,500 r 12,600 805 18 6.41direct shipping ore
Smelter 12,600 13,000 13,400 r 13,900 13,800 126 0.91Zirconium mineral concentrates, gross weight 1,420 7 1,080 r, 7 1,680 r, 7 1,520 1,330 p, 7 W W
Industrial minerals:Asbestos, marketable fiber 1,900 r 1,630 r 1,510 r 1,310 r 1,280 -- --Barite 9,790 r 9,000 r 9,870 r 8,390 r 7,320 240 28 3.28Brominee, 7 metric tons 422,000 r 389,000 375,000 r 301,000 r 345,000 W WCelestitee do. 282,000 r 240,000 r 249,000 r 264,000 r 202,000 -- --Cement, hydraulic 3,820,000 e 4,070,000 e 4,190,000 e 4,100,000 e 4,140,000 e 85,153 29, 30, 31 2.06Clay:
Bentonite 16,800 r 16,300 r 18,000 r 19,500 r 19,000 3,600 18.9Fullerʼs earth 3,280 r 3,500 r 3,450 r 3,460 3,370 1,860 32 55.2Kaolin 33,300 r 34,700 r 37,500 r 37,800 r 37,500 5,320 e 14.2
Diamond, natural33 thousand carats 128,000 130,000 125,000 127,000 134,000 -- --Diatomite 2,890 r 2,920 r 3,230 r 3,140 r 2,990 p 686 28 23.0Feldspar 22,100 r 22,400 r 24,000 r 23,100 r 23,400 470 e, 34, 35 2.01Fluorspar36 7,930 r 7,110 r 6,780 r 6,090 r 5,930 NA NAGraphite, naturale 1,030 r 1,100 r 987 r 1,180 r 1,150 -- --Gypsum 250,000 r 259,000 r 265,000 r 260,000 r 261,000 17,000 37 6.52Iodine, crude7 metric tons 27,800 30,800 29,600 32,600 r 32,500 W WKyanite and related minerals do. 327,000 r 377,000 r 364,000 r 408,000 393,000 79,700 38 20.3Lime39 330,000 r, 35 340,000 r, 35 350,000 35 340,000 r, 35 350,000 r, 35 17,700 30 5.05Magnesite7, 40 24,400 r 25,500 r 24,400 r 27,100 r 27,300 W WMica metric tons 340,000 r 310,000 r 272,000 r 275,000 r 294,000 30,900 41 10.5Monazite mineral concentrates, gross weight do. 6,380 r 4,250 6,570 6,860 9,430 -- --Nitrogen, N content of ammonia 139,000 r 144,000 141,000 r 147,000 r 144,000 10,200 42 7.04Peat 26,600 r 30,000 r 27,800 r 26,600 r 26,100 441 43 1.69Perlite, processed ore 4,540 r 4,430 r 4,410 r 4,300 r 4,390 513 11.7Phosphate rock, gross weight 216,000 232,000 237,000 263,000 r 255,000 27,100 28 10.6Potash, marketable, K2O equivalent 32,800 36,100 r 41,200 r 40,700 39,300 500 35 1.28Pumice and related materials 15,500 r 15,100 16,900 17,100 r 17,100 p, e 374 28 2.18Salt, all forms 261,000 280,000 r 275,000 r 277,000 r 274,000 41,700 30, 44 15.2Sand and gravel, industrial, silica 146,000 r 159,000 r 206,000 r 203,000 r 179,000 77,700 28 43.4Soda ash, natural and manufactured 51,700 e 51,400 r, e 52,800 r, e 53,500 r, e 53,600 p, e 11,800 45 22.0Sulfur, all forms46 71,400 r 69,800 r 71,300 r 73,800 r 73,500 9,740 13.3Talc and pyrophyllite 7,620 r 8,130 r 8,240 r 7,830 r 7,700 e 536 47 6.96Vermiculite 363 r 359 r 384 r 379 r 404 p 100 e, 28, 48 24.8
world total
United StatesPercent of
4Includes calculated arsenic trioxide equivalent of output of elemental arsenic compounds other than arsenic trioxide; inclusion of such materials would not duplicate reported arsenic trioxide production.
3Primary aluminum is defined as “The weight of liquid aluminum as tapped from pots, excluding the weight of any alloying materials as well as that of any metal produced from either returned scrap or remelted material.”
7“World totals” do not include U.S. production.
6Beryl ore for the production of beryllium and excludes gem-quality beryl. U.S. production is mine shipments; includes bertrandite ore, calculated as equivalent to beryl containing 11% beryllium oxide.
5U.S. production is nonmetallurgical grade.
2Calcined alumina or the total of calcined alumina plus the calcined equivalent of hydrate.
1Data are rounded to no more than three significant digits, unless otherwise specified.
eEstimated. pPreliminary. rRevised. do. Ditto. NA Not available. W Withheld to avoid disclosing company proprietary data; not included in “World total.” -- Zero.
9Recoverable cobalt content of ores, mineral concentrates, or intermediate products from cobalt, copper, nickel, platinum, or zinc operations. U.S. production is cobalt content of concentrates.
8Includes unwrought production from ores, concentrates, flue dusts, and other materials of both domestic and imported origin.
World totalCommodity
(Thousand metric tons unless otherwise specified)
WORLD AND U.S. PRODUCTION OF SELECTED NONFUEL MINERAL COMMODITIES1TABLE 9—Continued

StatiStical Summary—2016 [aDVaNcE rElEaSE] 2.37
46Includes byproduct of metallurgy, natural gas, oil sands and petroleum. Frasch, native, and pyrites.47Does not include pyrophyllite.48Rounded to the nearest 100,000 metric tons.*Correction posted on August 31, 2021.
34Includes hand-cobbed feldspar, flotation-concentrate feldspar, feldspar in feldspar-quartz mixtures, and aplite.
33Includes gem and industrial. Source: Kimberley Process Certification Scheme.
32Does not include attapulgite.
12Includes total production of smelted copper metal, including low-grade cathode produced by electrowinning methods. The smelter feed may be derived from ore, concentrates, copper precipitate or matte (primary), and (or) scrap (secondary). U.S. production is primary only.
11Copper content of concentrates produced (includes cement copper). U.S. production includes mineral concentrates and electrowon leaching.
10Cobalt refined from ores, concentrates, or intermediate products and does not include production of downstream products from refined cobalt.
(Thousand metric tons unless otherwise specified)
39Quicklime, hydrated lime, and dead-burned dolomite.40Crude salable magnesite. 41Includes scrap and flake. Does not include, if any, U.S. production of low-quality sericite and sheet mica.
17Raw steel is defined by AISI as steel formed in solid state after melting, suitable for further processing or sale.
14Production of usable ore represents total for all iron ore products used in steelmaking.
13Includes total production of refined copper whether produced by pyrometallurgical or electrolytic refining methods and whether derived from primary unrefined copper or from scrap. Copper cathode derived from electrowinning processing is also included. U.S. production is secondary only.
25Includes primary production (from ores and concentrates) and secondary production (recovered from scrap). U.S. production is secondary only.
24Recoverable content of ores and mineral concentrates.
23Based on 80% recovery of estimated rhenium contained in molybdenum mineral concentrates.
35Rounded to no more than two significant digits.
28Sold or used by producers and (or) marketable production.
27Production from ores, concentrates, and slag.
WORLD AND U.S. PRODUCTION OF SELECTED NONFUEL MINERAL COMMODITIES1TABLE 9—Continued
42Synthetic anhydrous ammonia; does not include coke oven byproduct ammonia.43Production. Table 1 reports sales by producers.44Includes brine, rock, solar, and vacuum and open pans. 45U.S. production is natural only.
16Source: American Iron and Steel Institute (AISI).
22Excludes that produced as a byproduct from gold-copper ores.
21Recoverable content of nickel sulfide mineral concentrates.
20Mostly concentrates or comparable shipping product.
19Total output of refined lead whether derived from ores and concentrates (primary) or scrap (secondary); includes the lead content of antimonial lead but does not include, to the extent possible, simple remelting of scrap.
18Total content of ores and mineral concentrates. Table 1 reports recoverable content.
15Sources: Midrex Technologies, Inc., governments, and companies.
31Portland and masonry cements only. Includes a small (less than 0.3% per year) component of double-counting where portland cement (not clinker) is consumed to make masonry cement; the precise amount of double-counting cannot be determined because of the involvement of portland cement stockpiles.
30Includes Puerto Rico.
29Datum is not rounded. Refer to the Minerals Yearbook cement chapter.
38Does not include synthetic mullite. Estimated using several prior-yearsʼ output as reported to the Virginia Department of Mines.
26Includes U.S. production, rounded to one significant digit, of ilmenite, leucoxene, and rutile to avoid disclosing company proprietary data.
37Does not include byproduct gypsum.
36Includes production by grade (acid, ceramic, and metallurgical).