Embed Size (px)
Citation preview
US Department of Health and Human Services Food and Drug Administration Center for Drug Evaluation and Research Office of Translational Sciences Office of Biostatistics
Statistical Review and Evaluation Biologics License Application
Clinical Studies
BLA: 125-544
Drug Name: CT-P13
Indication: Crohn’s disease, pediatric Crohn’s disease, ulcerative colitis,
pediatric ulcerative colitis 1, rheumatoid arthritis in
combination with methotrexate, ankylosing spondylitis,
psoriatic arthritis, plaque psoriasis
Applicant: Celltrion
Dates: Received August 8, 2014
BsUFA due date: June 8, 2014
Review Priority: Standard
Biometrics Division: Division of Biometrics II
Statistical Reviewer: Gregory Levin, PhD
Concurring Reviewers: Ruthanna Davi, PhD
Thomas Permutt, PhD
Medical Division: Division of Pulmonary, Allergy, and Rheumatology Products
Clinical Team: Juwaria Waheed, MD, Medical Reviewer
Nikolay Nikolov, MD, Medical Team Leader
Pro ject Manager: Nina Ton
Keywords: BLA review, clinical studies, missing data, biosimilar, non-inferiority
1This reflects information for Inflectra that Celltrion submitted on August 8, 2014. We
note that the indication for pediatric ulcerative colitis is protected by orphan drug exclusivity
expiring on September 23, 2018. See the Orphan Drug Designations and Approvals database at
http://www.accessdata.fda.gov/scripts/opdlisting/oopd/index.cfm.
Reference ID: 3747036

Contents
1 Executive Summary 6
2 Introduction 7
2.1 Background . . . . . . . . . . . . . . . . . . . . . . . . . . . . . . . . . . . . . . 7
2.2 History of Product Development . . . . . . . . . . . . . . . . . . . . . . . . . . . 8
2.3 Specific Studies Reviewed . . . . . . . . . . . . . . . . . . . . . . . . . . . . . . 9
2.4 Data Sources . . . . . . . . . . . . . . . . . . . . . . . . . . . . . . . . . . . . . 9
3 Statistical Evaluation 10
3.1 Data and Analysis Quality . . . . . . . . . . . . . . . . . . . . . . . . . . . . . . 10
3.2 Study Design . . . . . . . . . . . . . . . . . . . . . . . . . . . . . . . . . . . . . 10
3.2.1 Study 3.1 . . . . . . . . . . . . . . . . . . . . . . . . . . . . . . . . . . . 10
3.2.2 Study 1.1 . . . . . . . . . . . . . . . . . . . . . . . . . . . . . . . . . . . 12
3.2.3 Additional Studies . . . . . . . . . . . . . . . . . . . . . . . . . . . . . . 13
3.3 Statistical Methodologies . . . . . . . . . . . . . . . . . . . . . . . . . . . . . . . 13
3.3.1 Planned Analyses . . . . . . . . . . . . . . . . . . . . . . . . . . . . . . . 13
3.3.2 Additional Reviewer Analyses . . . . . . . . . . . . . . . . . . . . . . . . 14
3.3.3 Similarity Margin for Study 3.1 . . . . . . . . . . . . . . . . . . . . . . . 16
3.4 Evaluation of Efficacy . . . . . . . . . . . . . . . . . . . . . . . . . . . . . . . . 18
3.4.1 Patient Disposition, Demographic, and Baseline Characteristics . . . . . 18
3.4.2 Key Results in Study 3.1 . . . . . . . . . . . . . . . . . . . . . . . . . . . 23
3.4.3 Key Results in Study 1.1 . . . . . . . . . . . . . . . . . . . . . . . . . . . 28
3.4.4 Assay Sensitivity and the Constancy Assumption . . . . . . . . . . . . . 30
3.4.5 Potential Effect of Missing Data . . . . . . . . . . . . . . . . . . . . . . . 33
3.5 Evaluation of Safety . . . . . . . . . . . . . . . . . . . . . . . . . . . . . . . . . 36
4 Findings in Special/Subgroup Populations 40
5 Summary and Conclusions 43
5.1 Statistical Issues . . . . . . . . . . . . . . . . . . . . . . . . . . . . . . . . . . . 43
5.2 Collective Evidence . . . . . . . . . . . . . . . . . . . . . . . . . . . . . . . . . . 45
Appendix 46
A.1 Additional Tables and Figures . . . . . . . . . . . . . . . . . . . . . . . . . . . . 46
A.2 Tipping Point Analysis Methodology . . . . . . . . . . . . . . . . . . . . . . . . 54
References 55
Reference ID: 3747036

List of Tables
1 Overview of Key Clinical Studies . . . . . . . . . . . . . . . . . . . . . . . . . . 10
2 Historical Effect of Infliximab on ACR20 Response in Randomized Clinical Trials
of Patients with Active RA Despite Treatment with Methotrexate (MTX) . . . . 17
3 Baseline Characteristics in RA Patients in Study 3.1 . . . . . . . . . . . . . . . 19
4 Baseline Characteristics in AS Patients in Study 1.1 . . . . . . . . . . . . . . . . 20
5 Patient Dropout, by Reason for Withdrawal, in Study 3.1 . . . . . . . . . . . . . 22
6 Patient Dropout, by Reason for Withdrawal, in Study 1.1 . . . . . . . . . . . . . 22
7 Proportions of Responders, and Distributions of Reasons for Non-Response, with
Respect to Composite ACR20-Based Primary Endpoint at Week 30 in Study 3.1 25
8 Mean Changes from Baseline in the ACR Components and DAS28 at Week 30 in
Study 3.1 Completers . . . . . . . . . . . . . . . . . . . . . . . . . . . . . . . . . 26
9 Mean Changes from Baseline in Radiographic Score1 at Week 54 in Study 3.1
Completers Based on Original Assessment and Post Hoc Re-Assessment . . . . . 27
10 Mean Changes from Baseline in Continuous Secondary Efficacy Endpoints at
Week 30 in Study 1.1 Completers . . . . . . . . . . . . . . . . . . . . . . . . . . 29
11 Comparison of Key Characteristics of Historical Randomized, Placebo-Controlled
Clinical Trials1 of Infliximab in RA and Comparative Clinical Study 3.1 . . . . . 32
12 Tipping Point Analysis in Study 3.1: Inference on the Difference Between CT-P13
and EU-Remicade in the Probability of Week 30 ACR20 Response under Varying
Assumptions About the Differences on Each Treatment Arm Between Responses
in Patients who Withdrew from the Study Early and Responses in Patients who
Completed the Study . . . . . . . . . . . . . . . . . . . . . . . . . . . . . . . . . 34
13 Tipping Point Analysis in Study 3.1: Inference on the Difference Between CT
P13 and EU-Remicade in the Mean Change from Baseline in DAS28 (CRP) at
Week 30 under Varying Assumptions About the Differences on Each Treatment
Arm Between Mean Changes in Patients who Withdrew from the Study Early
and Mean Changes in Patients who Completed the Study . . . . . . . . . . . . . 35
14 Evaluation of the Incidence of Adverse Events of Special Interest During the
54-Week Controlled Treatment Periods of Studies 1.1 and 3.1 . . . . . . . . . . . 38
15 Evaluation of the Incidence of Adverse Events of Special Interest During the
54-Week Transition Periods of Extension Studies 1.3 and 3.2 . . . . . . . . . . . 39
16 Baseline Characteristics in RA Patients who Withdrew from the Study Early in
Study 3.1 . . . . . . . . . . . . . . . . . . . . . . . . . . . . . . . . . . . . . . . 53
17 Relevant Parameters and Notation for Setting with Missing Data . . . . . . . . 54
Reference ID: 3747036

List of Figures
1 Patient Withdrawal over Time in Study 3.1 (Source: Reviewer) . . . . . . . . . 21
2 Patient Withdrawal over Time in Study 1.1 (Source: Reviewer) . . . . . . . . . 21
3 ACR Response Probabilities over Time in Study 3.1 (Source: Reviewer) . . . . . 24
4 ASAS Response Probabilities over Time in Study 1.1 (Source: Reviewer) . . . . 28
5 Estimated Differences Between CT-P13 and EU-Remicade in the Probability
of Remaining in the Study and Achieving an ACR20 Response at Week 30,
Stratified by Selected Subgroups, in Study 3.1. Solid Vertical Line Represents
Estimated Difference in Overall Population, and Dashed Vertical Line Represents
No Difference. (Source: Reviewer) . . . . . . . . . . . . . . . . . . . . . . . . . . 41
6 Estimated Differences Between CT-P13 and EU-Remicade in the Probability
of Remaining in the Study and Achieving an ASAS20 Response at Week 30,
Stratified by Selected Subgroups, in Study 1.1. Solid Vertical Line Represents
Estimated Difference in Overall Population, and Dashed Vertical Line Represents
No Difference. (Source: Reviewer) . . . . . . . . . . . . . . . . . . . . . . . . . . 42
7 Mean Disease Activity Score (DAS28 [CRP]) among Patients Remaining in Study
over Time in Study 3.1 (Source: Reviewer) . . . . . . . . . . . . . . . . . . . . . 46
8 Mean Swollen Joint Count among Patients Remaining in Study over Time in
Study 3.1 (Source: Reviewer) . . . . . . . . . . . . . . . . . . . . . . . . . . . . 47
9 Mean Tender Joint Count among Patients Remaining in Study over Time in
Study 3.1 (Source: Reviewer) . . . . . . . . . . . . . . . . . . . . . . . . . . . . 47
10 Mean Health Assessment Questionnaire (HAQ) Physical Ability Score among
Patients Remaining in Study over Time in Study 3.1 (Source: Reviewer) . . . . 48
11 Mean Patient Pain Score among Patients Remaining in Study over Time in Study
3.1 (Source: Reviewer) . . . . . . . . . . . . . . . . . . . . . . . . . . . . . . . . 48
12 Mean Patient Global Assessment Score among Patients Remaining in Study over
Time in Study 3.1 (Source: Reviewer) . . . . . . . . . . . . . . . . . . . . . . . . 49
13 Mean Physician Global Assessment Score among Patients Remaining in Study
over Time in Study 3.1 (Source: Reviewer) . . . . . . . . . . . . . . . . . . . . . 49
14 Empirical Distribution Function for Change from Baseline in Disease Activity
Score (DAS28 [CRP]) at Week 30 in Study 3.1 (Source: Reviewer) . . . . . . . . 50
15 Mean BASDAI Score among Patients Remaining in Study over Time in Study
1.1 (Source: Reviewer) . . . . . . . . . . . . . . . . . . . . . . . . . . . . . . . . 50
16 Mean BASFI Score among Patients Remaining in Study over Time in Study 1.1
(Source: Reviewer) . . . . . . . . . . . . . . . . . . . . . . . . . . . . . . . . . . 51
Reference ID: 3747036

17 Mean BASMI Score among Patients Remaining in Study over Time in Study 1.1
(Source: Reviewer) . . . . . . . . . . . . . . . . . . . . . . . . . . . . . . . . . . 51
18 Mean Patient Spinal Pain Score among Patients Remaining in Study over Time
in Study 1.1 (Source: Reviewer) . . . . . . . . . . . . . . . . . . . . . . . . . . . 52
19 Mean Physician Disease Status Score among Patients Remaining in Study over
Time in Study 1.1 (Source: Reviewer) . . . . . . . . . . . . . . . . . . . . . . . . 52
Reference ID: 3747036
6 BLA: 125-544 (CT-P13)
1 Executive Summary
This review considers the therapeutic protein product CT-P13 as a potential biosimilar to US-
licensed Remicade (infliximab). We focus on two 54-week, randomized, double-blind, parallel-
group clinical trials that compared the efficacy and safety of CT-P13 and EU-approved Rem
icade. Study 3.1 was the primary comparative clinical study in 606 patients with active
rheumatoid arthritis who had an inadequate response to methotrexate. Study 1.1 was a clinical
study in 250 patients with ankylosing spondylitis designed to compare pharmacokinetic profiles,
with safety and efficacy comparisons as secondary ob jectives.
In Study 3.1, the primary endpoint was the proportion of patients who remained in the study
and achieved an American College of Rheumatology 20% (ACR20) response at Week 30. Ap
proximately 60.9% of patients randomized to CT-P13 and 58.9% of patients randomized to
EU-Remicade were ACR20 responders, for an estimated absolute difference between treatments
of 2.0% (90% confidence interval [CI]: -4.6%, +8.7%). The 90% CI successfully ruled out the
similarity margin of ±12% that the Agency has determined reasonable. ACR20, ACR50, and
ACR70 responses over time, in addition to mean changes from baseline in the components of
the ACR composite endpoint, the disease activity score (DAS28), and the radiographic damage
score, were also similar between the treatment arms.
In Study 1.1, among the subset of randomized patients remaining in the study at Week 30,
70.5% of patients randomized to CT-P13 and 72.4% of patients randomized to EU-Remicade
achieved an Assessment of SpondyloArthritis International Society 20% (ASAS20) response, for
an estimated odds ratio comparing treatments of 0.91 (95% CI: 0.51, 1.62). In a supportive FDA
analysis in all randomized patients, 63.2% of patients on CT-P13 and 67.2% on EU-Remicade
remained in the study and achieved an ASAS20 response at Week 30, for an estimated difference
of -4.0% (95% CI: -15.9%, 8.0%). Mean changes from baseline in important patient-reported
outcome assessments, including the ASAS components, were also similar between the arms.
Patients who discontinued treatment early were also withdrawn from the clinical studies, leading
to substantial dropout: 25% and 16% failed to complete the 54-week double-blind periods in
Studies 3.1 and 1.1, respectively. The high dropout rates led to substantial missing data in
important analyses, such as the evaluations of ACR20 and DAS28 at Week 30 in all randomized
patients regardless of adherence in Study 3.1. Therefore, we conducted tipping point analyses to
explore the sensitivity of results to violations in assumptions about the missing data. Confidence
intervals for the differences between CT-P13 and EU-Remicade failed to rule out concerning
losses in efficacy only under the assumption that patients who dropped out on CT-P13 had
much worse outcomes than dropouts on EU-Remicade. Given the similar proportions of patients
Reference ID: 3747036

7 BLA: 125-544 (CT-P13)
and distributions of reasons for early withdrawal on the two treatment arms, in addition to the
similar baseline characteristics between dropouts on the two arms, an assumption of such large
differences between the outcomes in dropouts on the two treatments seems implausible. That
is, the finding of similar efficacy is highly credible notwithstanding the number of dropouts.
To reliably evaluate whether there are clinically meaningful differences between two products,
a comparative clinical study must have assay sensitivity, or the ability to detect meaningful
differences between the products, if such differences exist. Historical evidence of sensitivity
to drug effects and appropriate trial conduct may be used to support the presence of assay
sensitivity and a conclusion that the treatments are similarly effective rather than similarly
ineffective. Based on an evaluation of five historical, randomized, placebo-controlled clinical
trials of infliximab, we concluded that (1) the design of the historical trials were largely similar
to that of comparative clinical Study 3.1; and (2) there were relatively large and consistent
treatment effects across the five historical studies. We did not identify any issues with the
quality of study conduct, with the exception of the high rate of study withdrawal. The totality
of available information largely supports the assay sensitivity of Study 3.1.
2 Introduction
2.1 Background
The applicant has submitted a Biologics License Application (BLA) under section 351(k) of
the Public Health Service (PHS) Act to support marketing of CT-P13 as a biosimilar to
US-licensed Remicade (infliximab). Section 351(i) of the PHS Act defines biosimilarity to
mean “that the biological product is highly similar to the reference product notwithstanding
minor differences in clinically inactive components” and that “there are no clinically meaningful
differences between the biological product and the reference product in terms of the safety,
purity, and potency of the product.” As noted in the FDA draft guidance for industry Scientific
Considerations in Demonstrating Biosimilarity to a Reference Product [1], protein products are
typically more complex than small molecule drugs and analytical methods may not be able
to identify all relevant structural differences between the proposed biosimilar and the reference
product. Because even minor differences in structure (e.g., higher order structure such as protein
folding) may significantly affect safety, purity, or potency, comparative data from clinical studies
designed to rule out important differences in safety and efficacy will often need to be part of the
evaluation of biosimilarity.
Infliximab is a monoclonal antibody that inhibits the activity of tumor necrosis factor α (TNFα),
Reference ID: 3747036

8 BLA: 125-544 (CT-P13)
an inflammatory cytokine thought to play a role in many disease processes. Infliximab was
first approved in the United States in 1998 and is currently indicated for the treatment of
Crohn’s disease (CD), pediatric Crohn’s disease, ulcerative colitis, pediatric ulcerative colitis 1, rheumatoid arthritis (RA) in combination with methotrexate, ankylosing spondylitis (AS),
psoriatic arthritis, and plaque psoriasis. The approved dose for treatment of RA is 3 mg/kg at
0, 2, and 6 weeks, and then every 8 weeks thereafter, with the possibility of increasing the dose
up to 10 mg/kg or increasing the frequency up to every 4 weeks in some patients. The approved
dose for AS is 5 mg/kg at 0, 2, and 6 weeks, and then every 6 weeks thereafter. The approved
dose for all other indications is 5 mg/kg at 0, 2, and 6 weeks, followed by every 8 weeks, with
the possibility of increasing the dose to 10 mg/kg in adult CD patients.
The applicant has submitted results from several nonclinical, analytical, and clinical studies to
support the claim of no clinically meaningful differences between CT-P13 and US-Remicade.
The proposed indications for CT-P13 sought by Celltrion are identical to those of the reference
product1 . This review primarily considers the safety and efficacy evaluation of CT-P13 in clinical
studies.
2.2 History of Product Development
The clinical development program for CT-P13 was introduced to the Division of Pulmonary,
Allergy, and Rheumatology Products under IND 118,135. The comparative clinical studies
were already complete at the time of the first correspondence between FDA and the applicant.
However, there were several interactions with the applicant during product development that
are potentially relevant to this review.
At a Biosimilar Biological Product Development (BPD) Type 3 meeting in July 2013, FDA
noted that an adequately justified, prespecified similarity margin for the comparative clinical
study was recommended, and that a randomized, controlled transition study was preferred.
Because the studies were already complete, FDA acknowledged that the applicant would need
to provide a post hoc justification of the margin, and that more than one analysis, each with
important limitations, would be needed to explore the uncontrolled transition data. At a BPD
Type 4 meeting in April 2014, the Agency stated that analyses of adverse events of special
interest based on integrated data from multiple studies should use a statistical approach that
appropriately accounts for the potential differences between studies. The Agency also reiterated
1This reflects information for Inflectra that Celltrion submitted on August 8, 2014. We
note that the indication for pediatric ulcerative colitis is protected by orphan drug exclusivity
expiring on September 23, 2018. See the Orphan Drug Designations and Approvals database at
http://www.accessdata.fda.gov/scripts/opdlisting/oopd/index.cfm.
Reference ID: 3747036

9 BLA: 125-544 (CT-P13)
a request from the BPD Type 3 meeting for additional analyses of the transition from EU
infliximab to CT-P13 based on comparisons of safety and immunogenicity rates within the same
patients before and after the transition. In addition, FDA requested sensitivity analyses to
explore the potential effect of violations in assumptions about the missing data in important
analyses of continuous secondary efficacy endpoints. The applicant also agreed to further justify
that the confidence interval for the difference in the primary endpoint in the comparative clinical
study in RA was able to rule out an appropriately selected similarity margin.
2.3 Specific Studies Reviewed
The applicant has submitted results from seven completed clinical studies. Study 1.4 was a
randomized, double-blind, parallel-group, single-dose clinical trial in 213 healthy volunteers
to compare the pharmacokinetic (PK) profiles of CT-P13, EU-Remicade, and US-Remicade.
Study 3.1 was a randomized, double-blind, parallel-group clinical trial to compare the safety and
efficacy of CT-P13 and EU-Remicade in 606 patients with active RA who had an inadequate
response to methotrexate (MTX). Study 3.2 was an open-label, single-arm extension study in 302
RA patients who had completed Study 3.1. Study 1.2 was a randomized, double-blind, parallel-
group pilot trial to compare CT-P13 and EU-Remicade in 19 RA patients in the Philippines.
Study B1P13101 was a randomized, double-blind, parallel-group clinical trial to compare the
PK profiles of CT-P13 and EU-Remicade in 108 Japanese patients with active RA who had an
inadequate response to MTX. Study 1.1 was a randomized, double-blind, parallel-group clinical
trial to perform PK, safety, and efficacy comparisons of CT-P13 and EU-Remicade in 250
patients with AS. Study 1.3 was an open-label, single-arm extension study in 174 AS patients
who had completed Study 1.1. There are also a number of ongoing studies.
Our evaluation of the similarity of CT-P13 and US-Remicade centers on Studies 3.1 and 1.1,
the randomized, double-blind comparative studies in RA and AS, respectively. Our ma jor focus
is on Study 3.1, the comparative clinical study in which a comparison of efficacy and safety
was the primary ob jective. We also briefly discuss safety results from the long-term extension
Studies 3.2 and 1.3. Table 1 provides a summary of the two comparative clinical studies that
are the focus of this review.
2.4 Data Sources
Data were submitted by the applicant to the CDER electronic data room in SAS transport
format. Protocols, correspondence, data listings, program code, and study reports were accessed
under the network path \\cdsesub1\evsprod\bla125544\125544.enx.
Reference ID: 3747036

10 BLA: 125-544 (CT-P13)
Table 1: Overview of Key Clinical Studies 1
Study Population Design Treatment Arms Number Sub jects Date
54-week, R, CT-P13 302 12/2010 – CT-P13 3.1 RA
DB, PG EU-Remicade 304 07/2012
54-week, R, CT-P13 125 12/2010 – CT-P13 1.1 AS
DB, PG EU-Remicade 125 07/2012
Source: Reviewer 1 Dates correspond to the start and end of the study.
Abbreviations: RA = rheumatoid arthritis; AS = ankylosing spondylitis; R = randomized;
DB = double-blind; PG = parallel-group
3 Statistical Evaluation
3.1 Data and Analysis Quality
The submitted datasets were of acceptable quality and were adequately documented. We were
able to reproduce the results of all important primary and secondary analyses. In key analyses,
the applicant excluded 11 randomized patients from Study 3.1 and 7 randomized patients from
Study 1.1 who were enrolled at potentially fraudulent study centers. Results were similar when
including data from patients treated at these centers. The FDA Office of Scientific Investigations
(OSI) identified issues with one clinical site during an inspection, but results did not change in
a sensitivity analysis removing data from this site.
3.2 Study Design
3.2.1 Study 3.1
Study 3.1 was a 54-week, randomized, double-blind, parallel-group clinical trial to compare
the safety and efficacy of CT-P13 and EU-Remicade in 606 patients with active rheumatoid
arthritis despite treatment with methotrexate. The study consisted of patients ages 18 to 75
years who had been diagnosed with RA according to the revised 1987 American College of
Rheumatology (ACR) classification criteria for at least 1 year prior to screening. Active disease
was defined by the presence of six or more swollen joints, six or more tender joints, and at least
two of the following: morning stiffness lasting at least 45 minutes, an erythrocyte sedimentation
rate (ESR) greater than 28 mm/h, and a serum C-reactive protein (CRP) concentration greater
than 2.0 mg/dL. Patients had been on methotrexate (12.5 to 25 mg/week) for at least 3 months,
Reference ID: 3747036

11 BLA: 125-544 (CT-P13)
with a stable dose for at least 4 weeks, and they also received ≥ 5 mg/week folic acid during
the study. Patients previously treated with a biological agent at any time for RA or who
had received disease-modifying antirheumatic drugs (DMARDs) other than methotrexate (e.g.,
hydroxychloroquine, chloroquine, or sulfasalazine) in the past 4 weeks were excluded. Subjects
were randomized 1:1 to CT-P13 or EU-Remicade administered via single 2-hour intravenous
(IV) infusion at a dose of 3 mg/kg at Weeks 0, 2, and 6, and then every 8 weeks thereafter.
Dose increases were not permitted. Randomization was stratified by region (European versus
non-European) and CRP (≤ 2 versus > 2 mg/dL).
Withdrawal from the treatment was equivalent to withdrawal from the study because patients
who stopped taking the therapy early were not followed up for safety and efficacy assessment
for the remainder of the 54-week treatment period. Possible protocol-specified reasons for
withdrawal included adverse event, loss to follow-up, significant protocol violation, and signs
of disease progression. If possible, an early withdrawal visit was conducted 8 weeks after the
last dose of study medication. The many potential reasons for stopping treatment, combined
with the fact that the applicant did not continue to collect information on patients who stopped
therapy early, led to substantial missing data in intention-to-treat safety and efficacy analyses
(see 5.1 for further discussion).
The prespecified primary efficacy endpoint was the proportion of patients achieving an ACR20
response at Week 30. An ACR20 response was defined as at least 20% improvement from
baseline in both the tender and swollen joint counts, in addition to at least 20% improvement
in at least three of the following: patient assessment of pain on a visual analog scale (VAS),
patient global assessment of disease status (VAS), physician global assessment of disease status
(VAS), Health Assessment Questionnaire (HAQ) physical ability score, and either serum CRP
concentration or ESR. Patients who discontinued treatment early (and therefore the study, as
well), had a protocol-prohibited change in medication, required a surgical joint procedure, or
had missing or incomplete data for the evaluation of ACR20 at Week 30 were considered non-
responders. Therefore, the primary efficacy endpoint was in fact a composite endpoint consisting
of the following components: (1) remaining on treatment and in the study; (2) not receiving
a protocol-prohibited medication or a surgical joint procedure; and (3) achieving an ACR20
response at Week 30. Secondary efficacy endpoints included the components used to define
ACR20 response, time to onset of ACR20 response, the Disease Activity Score in 28 joints
(DAS28), EULAR response, ACR50 response, ACR70 response, Simplified Disease Activity
Index (SDAI), Clinical Disease Activity Index (CDAI), total van der Heijde radiographic joint
score, SF-36 total score, fatigue (SF-36 vitality subscale score), and the number of patients
requiring salvage treatments. Most were evaluated at Weeks 14, 30, and 54.
The study was unblinded at Week 30 for reporting, although patients and investigators remained
Reference ID: 3747036
12 BLA: 125-544 (CT-P13)
blinded to treatment assignment until the end of the study. Patients and investigators may have
been exposed to summary-level interim results that were announced publicly, and it is possible
that unblinding to interim results could have altered study conduct and biased Week 54 results.
However, unblinding would not have affected Week 30 results, which are the primary focus of
this review.
3.2.2 Study 1.1
Study 1.1 was a 54-week, randomized, double-blind, parallel-group clinical trial to compare the
PK, safety, and efficacy of CT-P13 and EU-Remicade in 250 patients with active ankylosing
spondylitis. The study consisted of patients ages 18 to 75 years who had been diagnosed with
AS according to the 1984 modified New York classification criteria for at least 3 months prior to
screening. Active disease was defined by a Bath Ankylosing Spondylitis Disease Activity Index
(BASDAI) score ≥ 4 (range 0 to 10) despite conventional treatment for AS for at least 3 months.
Subjects also had a VAS score for spinal pain of ≥ 4 (range 0 to 10). Patients previously treated
with a biological agent at any time for AS or who had received DMARDs (e.g., methotrexate)
in the past 4 weeks were excluded. Subjects were randomized 1:1 to CT-P13 or EU-Remicade
administered via 2-hour IV infusion at 5 mg/kg at Weeks 0, 2, and 6, and then every 8 weeks
thereafter. Randomization was stratified by region and baseline BASDAI score (< 8 versus
≥ 8). As in Study 3.1, there were many reasons for treatment discontinuation, and patients who
stopped treatment early were withdrawn from the study. This led to substantial missing data
in intention-to-treat safety and efficacy analyses (see 5.1 for further discussion).
The primary ob jective was to demonstrate comparable PK at steady state between CT-P13
and EU-Remicade. Secondary objectives were to compare CT-P13 and EU-Remicade with
respect to long-term safety and efficacy endpoints. Efficacy endpoints included the Assess
ment of SpondyloArthritis International Society 20% improvement scale (ASAS20), ASAS40,
BASDAI score, Bath Ankylosing Spondylitis Functional Index (BASFI) score, Bath Ankylosing
Spondylitis Metrology Index (BASMI) score, chest expansion, and SF-36 total score, assessed
at Weeks 14, 30, and 54 (or an end-of-study visit for patients who stopped treatment early).
The ASAS20 response is defined as improvement of at least 20% and an absolute improvement
of at least 1 unit on a 0 to 10 scale in at least 3 of the following domains: patient global
assessment of disease status, patient assessment of spinal pain, function according to BASFI
score, and morning stiffness determined using the last 2 questions of BASDAI. Additionally,
ASAS20 responders could not show worsening of at least 20% and 1 unit on any of the domains.
As with Study 3.1, Study 1.1 was unblinded at Week 30 for reporting, although patients and
investigators remained blinded to treatment assignment until the end of the study.
Reference ID: 3747036

13 BLA: 125-544 (CT-P13)
3.2.3 Additional Studies
Studies 1.3 and 3.2 were open-label, single-arm, long-term extensions of Studies 1.1 and 3.1,
respectively. Patients who had completed all scheduled visits and had no ma jor protocol
violations during Study 1.1 or 3.1 were eligible. Patients who had previously received CT-P13
during the double-blind, controlled treatment period of Study 1.1 or 3.1 continued to receive
CT-P13 during the long-term extension. Those who had previously received EU-Remicade
transitioned to CT-P13. The last dosing of double-blind study therapy in Studies 1.1 and 3.1
occurred at Week 54; patients who entered the extension studies were unblinded and dosed
with CT-P13 every 8 weeks through Week 102 (i.e., at Weeks 62, 70, 78, 86, 94, and 102). An
end-of-study visit occurred 8 weeks after the last dose of study treatment. Efficacy and safety
assessments, as well as withdrawal criteria, were similar to those of Studies 1.1 and 3.1.
3.3 Statistical Methodologies
3.3.1 Planned Analyses
The applicant completed the comparative clinical studies before corresponding with FDA, so the
Agency was not able to review the statistical analysis plan prior to data unblinding. However,
the applicant did have statistical analysis plans for the clinical studies finalized and documented
prior to the completion of the studies. In Study 3.1, a sample size of 584 patients was planned
to rule out a similarity margin of ±15% at the 2.5% overall significance level with 80% power
under the alternative hypothesis of no difference, assuming a response rate of 50% in both
groups. This allowed for approximately 20% of patients to be excluded from the per-protocol
population. The primary analysis was based on an exact binomial approach in which the null
hypothesis would be rejected if the 95% confidence interval (CI) for the difference in ACR20
response proportions was contained within the similarity margin. The applicant modified the
proposed similarity margin to ±13% after discussions with the Agency (see 3.3.3 for additional
discussion).
The applicant also carried out a supportive logistic regression analysis of ACR20 response,
adjusting for region and CRP category. Analyses of ACR20, ACR50, and ACR70 responses over
time were also based on the exact binomial approach, and linear regression models (analyses of
covariance) adjusting for baseline value, region, and CRP category were used to evaluate mean
changes from baseline in DAS28 (CRP) and DAS28 (ESR).
All analyses were carried out in both the all-randomized population and the per-protocol
population. The per-protocol population was defined as patients who received all doses of
Reference ID: 3747036

14 BLA: 125-544 (CT-P13)
study treatment, had an ACR assessment, did not discontinue or reduce their methotrexate
dose below 12.5 mg/week for more than two consecutive weeks because of toxicity or noncom
pliance, and did not have any ma jor protocol deviations. The following were considered ma jor
protocol deviations: misrandomizations, potentially fraudulent study centers, noncompliance of
inclusion/exclusion criteria, changes in joint assessor where the data were questionable, a Week
30 assessment out of window by more than 2 weeks, and receipt of certain protocol-prohibited
medications. Sensitivity analyses were carried out including data on patients from potentially
fraudulent study centers. The applicant provided only descriptive statistics for several additional
important secondary endpoints, such as the ACR components and the total van der Heijde
radiographic joint damage score.
For the evaluation of key continuous secondary efficacy endpoints (e.g., HAQ score and DAS28),
the applicant performed post hoc sensitivity analyses based on single and multiple imputation
to explore the potential effect of missing data. However, all of the sensitivity analyses performed
by the applicant were based on the strong and unverifiable assumption that unobserved data in
dropouts were missing at random.
In Study 1.1, a sample size of 246 was planned to provide 90% power to show PK similarity.
Analyses of ASAS20 and ASAS40 response were based on logistic regression models adjusting
for region and baseline BASDAI score. Patients who withdrew from the study prior to the time
point of assessment were excluded from analyses rather than considered non-responders (the
latter was the approach in Study 3.1). There were no similarity margins prespecified and no
hypothesis tests carried out. The applicant presented only descriptive statistics for additional
efficacy endpoints.
3.3.2 Additional Reviewer Analyses
We conducted several additional analyses to support those carried out by the applicant. Because
FDA generally expects the type I error rate of a test of similarity to be controlled at 5%, we
calculated a 90% rather than 95% CI as part of the primary analysis for Study 3.1. We used
95% CIs for all additional analyses in this review in order to match the applicant’s results.
The applicant presented only descriptive statistics for the components of the composite primary
endpoint and other important secondary efficacy endpoints, and performed limited analyses to
explore the sensitivity of the findings to possible violations in key assumptions. Therefore, we
carried out several additional supportive analyses that we considered important.
In Studies 3.1 and 1.1, we compared mean changes from baseline in important continuous
secondary efficacy endpoints using linear regression models adjusting for the baseline value
Reference ID: 3747036

15 BLA: 125-544 (CT-P13)
of the endpoint and the stratification factors, with robust Huber-White standard errors. These
endpoints included the ACR components, DAS28, and the total van der Heijde radiographic joint
score in Study 3.1, and the ASAS components, BASDAI score, and BASMI score in Study 1.1.
Such continuous endpoints may be more sensitive to small but important differences between
treatments in efficacy than the primary binary ACR and ASAS response endpoints. In addition,
we gave importance to endpoints that directly measure how patients function or feel in daily
life, such as the tender and swollen joint counts and HAQ physical ability score in RA and the
BASDAI, BASFI, and BASMI scores in AS. Although the primary ACR20 endpoint in Study
3.1 is largely composed of such direct measures, it is also based on the changes in ESR and CRP,
which are both surrogate endpoints.
We also compared the utility of the two treatments by presenting empirical distribution function
plots for these continuous endpoints in which patients who discontinued the assigned treatment
were assigned the worst outcomes. In Study 1.1, we carried out additional supportive analyses
of the binary ASAS20 and ASAS40 endpoints in all randomized patients to calculate exact
confidence intervals for the difference in response probabilities between the arms. In these
analyses, patients who withdrew from the study prior to the time point of assessment were
considered non-responders.
We carried out all key analyses in all randomized patients to evaluate mean differences between
treatment groups at key time points in all randomized patients regardless of adherence to the
treatment or to the protocol (i.e., the intention-to-treat or de facto estimand). We also carried
out analyses in the per-protocol population to evaluate mean differences between treatment
groups at key time points in the subset of patients who tolerate and adhere. Draft FDA
Guidance [2] and ICH guidelines [3] indicate that the evaluation of both estimands is important
in the context of a study designed to establish similarity between treatments. The de facto
evaluation is critical because, unlike the per-protocol evaluation, it preserves the integrity of
randomization and therefore guarantees reliable inference regarding possible differences in effects
of the treatment strategies (if there are no missing data). However, in the presence of true
differences between treatments, the per-protocol effect may be larger and easier to detect than
the de facto effect because of the restriction to the subsets of patients who adhere.
Because patients were not followed after treatment discontinuation, there were substantial
missing outcome data at Weeks 30 and 54 in the comparative clinical studies. Therefore,
evaluations of de facto estimands based on data in completers rely on untestable assumptions
about the unobserved missing values at the follow-up time of interest (e.g., 30 weeks). In
particular, these analyses, in addition to the sensitivity analyses carried out by the applicant,
assume that patients who discontinued treatment went on to have similar outcomes to those
patients on that treatment arm who remained in the study through the time point of endpoint
Reference ID: 3747036

16 BLA: 125-544 (CT-P13)
ascertainment (and who had similar values of baseline characteristics included in the model).
This assumption may not be plausible given the known efficacy of infliximab and the fact that
early symptomatic improvement on treatment within a patient who does not tolerate or adhere
to the treatment regimen might go away within a few weeks of treatment discontinuation. In
addition, the subsets of patients who withdrew from the study on the two treatment arms may
have been inherently different with respect to important, unmeasured prognostic characteristics,
thus leading to different future (unobserved) outcomes.
Therefore, we carried out additional analyses to explore the sensitivity of results to violations
in the assumptions about the missing data. We used simple tipping point analyses to determine
how much worse outcomes in patients who discontinue early on CT-P13 (relative to CT-P13
completers) would have to be than outcomes in dropouts on EU-Remicade (relative to EU-
Remicade completers) such that there would be a concerning difference in efficacy (see Appendix
for methodology details). This allows for a follow-up discussion of the plausibility of those
assumptions under which the conclusions change.
Dr. Juwaria Waheed, the Medical Reviewer, conducted the complete safety evaluation, but
we conducted supplementary analyses to compare CT-P13 and EU-Remicade with respect to
the incidence of adverse events of special interest. Selected safety endpoints included active
tuberculosis (TB), latent TB, infection, serious infection, pneumonia, malignancy and lym
phoma, infusion-related reaction, drug-induced liver injury in accordance with Hy’s law, vascular
disorder, cardiac disorder, and opportunistic infection. Detailed methods and results for these
safety analyses can be found in 3.5.
3.3.3 Similarity Margin for Study 3.1
The determination of an equivalence margin is a critical aspect of the design of the comparative
clinical study because it determines the null hypothesis being tested in the primary analysis,
i.e., the differences in efficacy that the study will need to rule out at an acceptable significance
level. The term equivalence margin is a misnomer because it is not possible to statistically
demonstrate that two products are equivalent with respect to a particular endpoint. Instead,
we describe the margin as a similarity margin to better reflect the goal of the efficacy evaluation:
to determine whether the two products are similar, in that a certain magnitude of difference
(the margin) in efficacy can be ruled out.
The applicant prespecified a similarity margin of ±15%, but did not seek Agency feedback on
the margin until the study was complete and the data unblinded. In response to comments from
FDA indicating that the margin was not acceptable, the applicant provided justification for a
Reference ID: 3747036

17 BLA: 125-544 (CT-P13)
revised margin of ±13% based on a meta-analysis of historical data from randomized clinical
trials of infliximab and the goal of preserving at least 50% of the effect size of the reference
product. We do not agree with the applicant’s selection of historical studies, as one important
study [4] is not included in the meta-analysis, and we do not agree with the proposed ±13%
margin. We believe that a margin of ±12% is more appropriate.
Our selection of a ±12% similarity margin was based on discussions with clinicians aimed at
weighing the clinical importance of different losses in effect against the feasibility of different
study sizes. In a comparative clinical study designed with 90% power to reject absolute differ
ences greater than 12% in magnitude, observed differences larger than approximately 6% will
result in failure to establish similarity, as the 90% confidence interval for the estimated difference
will not rule out the 12% margin. Therefore, the comparative clinical study will be able to
rule out differences in ACR20 response greater than 12% with high (at least 95%) statistical
confidence, and will be able to rule out differences greater than around 6% with moderate (at
least 50%) statistical confidence. The lower bound of the proposed similarity margin (-12%)
also corresponds to the retention of approximately 50% of conservative estimates of treatment
effect sizes relative to placebo for infliximab (Table 2).
Table 2: Historical Effect of Infliximab on ACR20 Response in Randomized Clinical
Trials of Patients with Active RA Despite Treatment with Methotrexate (MTX)
MTX + Placebo MTX + Infliximab Study Week
N ACR Response N ACR20 Response Difference in Response
Maini [5] 30 88 20% 86 50% 30%
Westhovens [6] 22 361 24% 360 55% 31%
Schiff [4] 28 110 42% 165 59% 18%
Zhang [7] 18 86 49% 87 76% 27%
Abe [8] 14 47 23% 49 61% 38%
Meta-Analysis (Fixed Effects1): Difference (95% CI) 28.4% (23.6%, 33.3%)
Meta-Analysis (Random Effects2): Difference (95% CI) 28.3% (22.6%, 34.1%)
Source: Reviewer 1 Based on Mantel-Haenszel weights 1 Based on DerSimonian-Laird approach
Reference ID: 3747036
18 BLA: 125-544 (CT-P13)
3.4 Evaluation of Efficacy
3.4.1 Patient Disposition, Demographic, and Baseline Characteristics
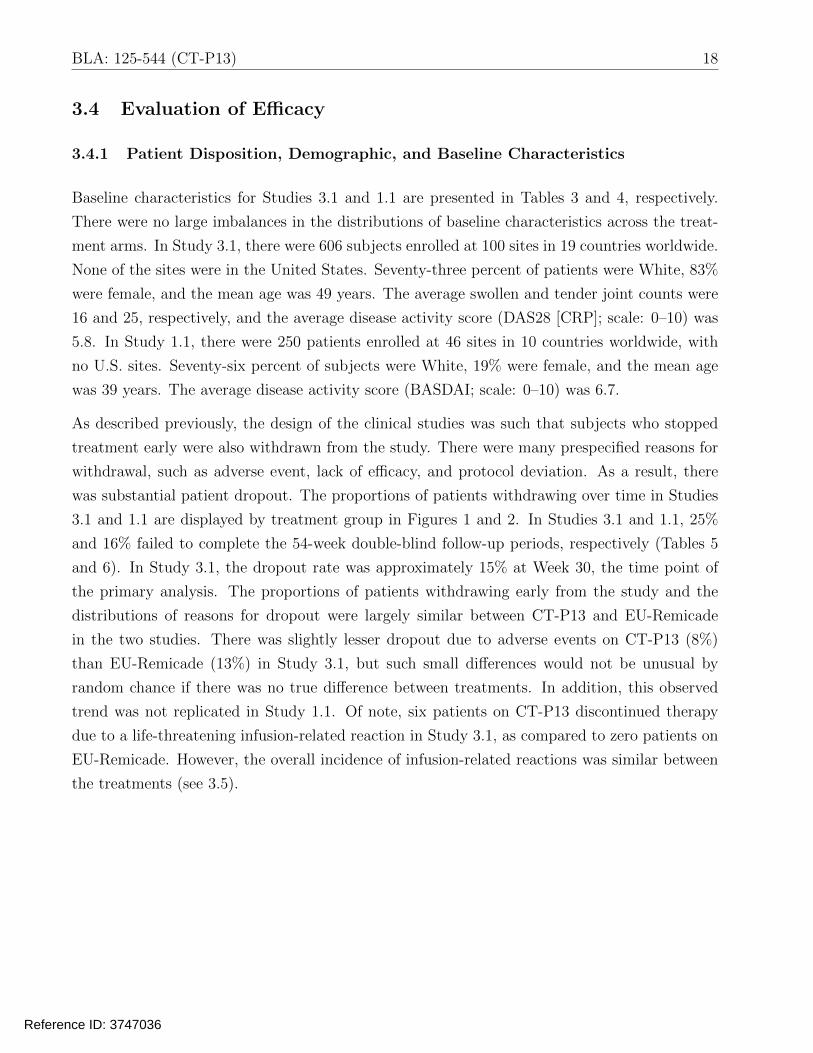
Baseline characteristics for Studies 3.1 and 1.1 are presented in Tables 3 and 4, respectively.
There were no large imbalances in the distributions of baseline characteristics across the treat
ment arms. In Study 3.1, there were 606 subjects enrolled at 100 sites in 19 countries worldwide.
None of the sites were in the United States. Seventy-three percent of patients were White, 83%
were female, and the mean age was 49 years. The average swollen and tender joint counts were
16 and 25, respectively, and the average disease activity score (DAS28 [CRP]; scale: 0–10) was
5.8. In Study 1.1, there were 250 patients enrolled at 46 sites in 10 countries worldwide, with
no U.S. sites. Seventy-six percent of subjects were White, 19% were female, and the mean age
was 39 years. The average disease activity score (BASDAI; scale: 0–10) was 6.7.
As described previously, the design of the clinical studies was such that sub jects who stopped
treatment early were also withdrawn from the study. There were many prespecified reasons for
withdrawal, such as adverse event, lack of efficacy, and protocol deviation. As a result, there
was substantial patient dropout. The proportions of patients withdrawing over time in Studies
3.1 and 1.1 are displayed by treatment group in Figures 1 and 2. In Studies 3.1 and 1.1, 25%
and 16% failed to complete the 54-week double-blind follow-up periods, respectively (Tables 5
and 6). In Study 3.1, the dropout rate was approximately 15% at Week 30, the time point of
the primary analysis. The proportions of patients withdrawing early from the study and the
distributions of reasons for dropout were largely similar between CT-P13 and EU-Remicade
in the two studies. There was slightly lesser dropout due to adverse events on CT-P13 (8%)
than EU-Remicade (13%) in Study 3.1, but such small differences would not be unusual by
random chance if there was no true difference between treatments. In addition, this observed
trend was not replicated in Study 1.1. Of note, six patients on CT-P13 discontinued therapy
due to a life-threatening infusion-related reaction in Study 3.1, as compared to zero patients on
EU-Remicade. However, the overall incidence of infusion-related reactions was similar between
the treatments (see 3.5).
Reference ID: 3747036

19 BLA: 125-544 (CT-P13)
Table 3: Baseline Characteristics in RA Patients in Study 3.1
CT-P13 EU-Remicade Overall
N 302 304 606
Female 245 (81%) 256 (84%) 501 (83%)
Age (years) 49.0 (12.2) 48.6 (11.5) 48.8 (11.8)
Age Group (years)
< 35 40 (13%) 43 (14%) 83 (14%)
35-50 100 (33%) 107 (35%) 207 (34%)
50-65 138 (46%) 136 (45%) 274 (45%)
≥ 65 24 (8%) 18 (6%) 42 (7%)
Race
White 220 (73%) 222 (73%) 442 (73%)
Black 2 (1%) 1 (0%) 3 (0%)
Asian 34 (11%) 37 (12%) 71 (12%)
Other 46 (15%) 44 (14%) 90 (15%)
Weight (kg) 70.7 (16.3) 69.9 (15.8) 70.3 (16.0)
Height (cm) 163.2 (8.7) 162.9 (9.0) 163.0 (8.9)
BMI (kg/m2) 26.5 (5.3) 26.3 (5.3) 26.4 (5.3)
Region
Eastern Europe 180 (60%) 182 (60%) 362 (60%)
Western Europe 16 (5%) 17 (6%) 33 (5%)
Latin America 71 (24%) 67 (22%) 138 (23%)
Asia 34 (11%) 38 (12%) 72 (12%)
Swollen Joint Count 16.2 (8.7) 15.2 (8.3) 15.7 (8.5)
Tender Joint Count 25.6 (13.8) 24.0 (12.9) 24.8 (13.4)
HAQ Score 1.6 (0.6) 1.6 (0.6) 1.6 (0.6)
Patient Pain Score 65.9 (17.5) 65.5 (17.2) 65.7 (17.3)
Patient Global Assessment 65.7 (17.2) 65.4 (17.0) 65.5 (17.1)
Physician Global Assessment 64.8 (14.2) 65.0 (13.5) 64.9 (13.8)
CRP (mg/dL) 1.9 (2.5) 1.9 (2.2) 1.9 (2.4)
ESR (mm/h) 46.6 (22.4) 48.5 (22.6) 47.5 (22.5)
DAS28 (ESR) 6.7 (0.8) 6.6 (0.8) 6.6 (0.8)
DAS28 (CRP) 5.9 (0.8) 5.8 (0.9) 5.8 (0.9)
Source: Reviewer
Cell contents are mean (standard deviation) or frequency (percent)
Reference ID: 3747036

20 BLA: 125-544 (CT-P13)
Table 4: Baseline Characteristics in AS Patients in Study 1.1
CT-P13 EU-Remicade Overall
N 125 125 250
Female 26 (21%) 22 (18%) 48 (19%)
Age (years) 39.2 (12.1) 38.7 (10.5) 38.9 (11.3)
Age Group (years)
< 35 52 (42%) 45 (36%) 97 (39%)
35-50 45 (36%) 58 (46%) 103 (41%)
50-65 26 (21%) 20 (16%) 46 (18%)
≥ 65 2 (2%) 2 (2%) 4 (2%)
Race
White 97 (78%) 92 (74%) 189 (76%)
Asian 16 (13%) 13 (10%) 29 (12%)
Other 12 (10%) 20 (16%) 32 (13%)
Weight (kg) 74.3 (15.7) 76.7 (14.3) 75.5 (15.0)
Height (cm) 171.7 (9.6) 171.4 (8.6) 171.5 (9.1)
BMI (kg/m2) 25.1 (4.2) 26.1 (4.3) 25.6 (4.2)
Region
Eastern Europe 80 (64%) 83 (66%) 163 (65%)
Asia 16 (13%) 12 (10%) 28 (11%)
Latin America 22 (18%) 27 (22%) 49 (20%)
Western Europe 7 (6%) 3 (2%) 10 (4%)
BASDAI Score 6.7 (1.4) 6.6 (1.6) 6.7 (1.5)
BASDAI Score ≥ 8 33 (26%) 30 (24%) 63 (25%)
BASFI Score 6.2 (1.9) 6.2 (2.2) 6.2 (2.1)
BASMI Score 4.0 (2.1) 4.1 (2.1) 4.0 (2.1)
Patient Spinal Pain Score 68.7 (15.4) 69.2 (17.0) 68.9 (16.2)
Physician Disease Status Score 65.9 (16.9) 65.8 (19.7) 65.8 (18.3)
Source: Reviewer
Cell contents are mean (standard deviation) or frequency (percent)
Reference ID: 3747036


22 BLA: 125-544 (CT-P13)
Table 5: Patient Dropout, by Reason for Withdrawal, in Study 3.1
CT-P13 EU-Remicade Overall
Completed Study 233 (77%) 222 (73%) 455 (75%)
Withdrew from Study 69 (23%) 82 (27%) 151 (25%)
Adverse Event 25 (8%) 41 (13%) 66 (11%)
Any malignancy diagnosed 0 (0%) 2 (1%) 2 (0%)
Investigator Decision 1 (0%) 0 (0%) 1 (0%)
Lack of Efficacy 10 (3%) 6 (2%) 16 (3%)
Life-threatening infusion-related reaction 6 (2%) 0 (0%) 6 (1%)
Other 1 (0%) 2 (1%) 3 (0%)
Patient consent withdrawn 16 (5%) 21 (7%) 37 (6%)
Patient died 0 (0%) 1 (0%) 1 (0%)
Patient lost to follow-up 3 (1%) 2 (1%) 5 (1%)
Pregnancy 0 (0%) 1 (0%) 1 (0%)
Significant protocol violation 2 (1%) 2 (1%) 4 (1%)
Sponsor decision 5 (2%) 4 (1%) 9 (1%)
Source: Reviewer
Table 6: Patient Dropout, by Reason for Withdrawal, in Study 1.1
CT-P13 EU-Remicade Overall
Completed Study 106 (85%) 104 (83%) 210 (84%)
Withdrew from Study 19 (15%) 21 (17%) 40 (16%)
Adverse Event 10 (8%) 8 (6%) 18 (7%)
Any malignancy diagnosed 1 (1%) 0 (0%) 1 (0%)
Investigator Decision 1 (1%) 1 (1%) 2 (1%)
Lack of Efficacy 2 (2%) 0 (0%) 2 (1%)
Other 0 (0%) 1 (1%) 1 (0%)
Patient consent withdrawn 3 (2%) 6 (5%) 9 (4%)
Patient died 0 (0%) 2 (2%) 2 (1%)
Patient lost to follow-up 0 (0%) 2 (2%) 2 (1%)
Significant protocol violation 0 (0%) 1 (1%) 1 (0%)
Sponsor decision 2 (2%) 0 (0%) 2 (1%)
Source: Reviewer
Reference ID: 3747036

23 BLA: 125-544 (CT-P13)
3.4.2 Key Results in Study 3.1
Table 7 displays results from the primary efficacy analysis in Study 3.1. Approximately 60.9%
of patients randomized to CT-P13 and 58.9% of patients randomized to EU-Remicade remained
in the study and achieved an ACR20 response at Week 30, for an estimated absolute difference
between treatments of 2.0% (90% CI: -4.6%, +8.7%; 95% CI: -5.8%, +9.9%). The 90% CI
ruled out the margin of ±13% proposed by the applicant, in addition to the margin of ±12%
that the Agency has determined reasonable. The lower CI bound of -4.6% also corresponds
to the preservation of approximately 80% of conservative estimates of the effect of infliximab
from historical trials (Table 2). A little more than half of the non-responders were patients
who completed the study and did not satisfy the ACR20 response criteria. The majority of
the remaining non-responders were patients who withdrew from the study prior to Week 30.
There were no large differences between the treatment arms in the distributions of reasons for
non-response (Table 7).
In a supportive analysis of ACR20 response in the subset of patients who completed the study
and adhered to the protocol (per-protocol population), 73.4% and 70.1% responded on CT-P13
and EU-Remicade, respectively, for an estimated difference of 3.3% (90%: -3.4%, +10.0%). The
proportions of patients remaining in the study and achieving ACR20 responses at Weeks 14 and
54, in addition to ACR50 and ACR70 response probabilities over time, were similar between
the treatment arms (Figure 3). Mean changes from baseline in the components of the ACR
composite endpoint and the disease activity score (DAS28) were also similar between the arms
in all randomized patients who completed the study (Table 8), as well as in the per-protocol
population (results not shown). In particular, the 95% CI (-0.28, 0.16) for the mean difference in
DAS28 (CRP) ruled out relatively large increases on CT-P13 as compared to EU-Remicade. The
upper CI bound of 0.16 is considerably less than 0.6, which has been used as a non-inferiority
margin in a European study and has been specified by EULAR as the threshold for a moderate
within-patient response. See 3.4.5 for additional discussion on the potential effect of missing data
on these comparisons. On both treatment arms, improvements in these continuous secondary
endpoints were evident as early as Week 14, and trends over time were similar (see Appendix:
Figures 7 – 13). Empirical distribution functions were also comparable between the treatment
arms for key continuous efficacy endpoints (e.g., see DAS28 comparison in Figure 14).
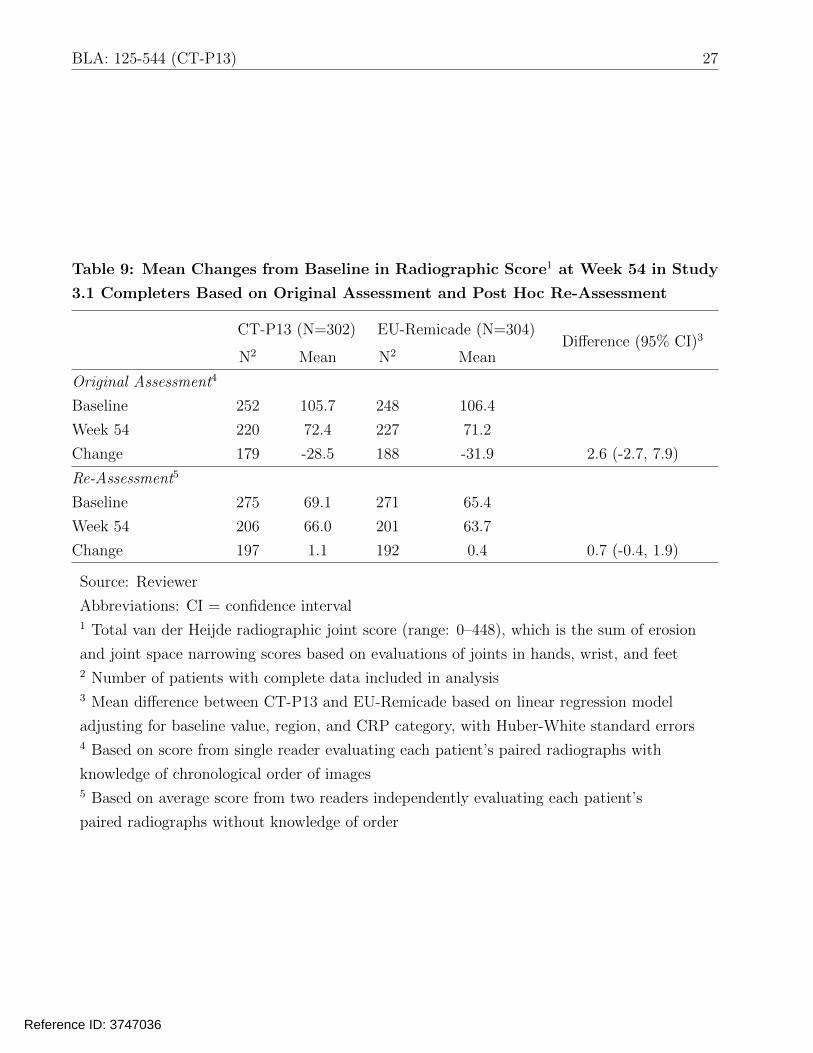
Table 9 presents results for the radiographic evaluation at Week 54. Based on the original
assessment, although mean changes from baseline were similar between the arms (difference:
2.6; 95% CI: -2.7, 7.9), the within-group mean changes on the two arms (-28.5 and -31.9) were
noticeably different than those observed in historical clinical trials (typically closer to zero).
Therefore, the applicant performed a post hoc reassessment of the radiographs. In the original
Reference ID: 3747036


25 BLA: 125-544 (CT-P13)
Table 7: Proportions of Responders, and Distributions of Reasons for Non-
Response, with Respect to Composite ACR20-Based Primary Endpoint at Week
30 in Study 3.1
CT-P13 (N=302) EU-Remicade (N=304)
Responder1 184 (60.9%) 179 (58.9%)
Difference: 2.0% (90% CI: -4.6%, 8.7%)2
Non-Responder 118 (39.1%) 125 (41.1%)
ACR20 Criteria Not Met
Withdrew from Study
Lack of Efficacy
Adverse Event
Malignancy
Withdrawal of Consent
Protocol Violation
Sponsor Decision
Other
Prohibited Medication Change
Surgical Joint Procedure
Incomplete ACR Assessment
63 (20.9%)
46 (15.2%)
4 (1.3%)
24 (7.9%)
0 (0%)
11 (3.6%)
2 (0.7%)
5 (1.7%)
0 (0%)
7 (2.3%)
1 (0.3%)
1 (0.3%)
73 (24.0%)
44 (14.5%)
0 (0%)
20 (6.6%)
2 (0.7%)
14 (4.6%)
2 (0.7%)
4 (1.3%)
2 (0.7%)
5 (1.6%)
1 (0.3%)
2 (0.7%)
Source: Reviewer
Cell contents are frequency (percent of column total)
Abbreviations: CI = confidence interval 1 Defined by remaining in the study and without a protocol-prohibited medication change or
surgical joint procedure through Week 30, and meeting ACR20 response criteria at Week 30 2 Difference between CT-P13 and EU-Remicade, with exact confidence interval
Reference ID: 3747036

26 BLA: 125-544 (CT-P13)
Table 8: Mean Changes from Baseline in the ACR Components and DAS28 at Week
30 in Study 3.1 Completers
CT-P13 (N=302)
N1 Mean
EU-Remicade (N=304)
N1 Mean Difference (95% CI)2
Swollen Joint Count 260 -12.2 257 -11.5 -0.1 (-1.0, 0.7)
Tender Joint Count 260 -16.3 257 -15.6 0.2 (-1.2, 1.7)
HAQ Score 261 -0.60 256 -0.51 -0.06 (-0.15, 0.04)
Patient Pain 260 -29.3 256 -27.7 -1.5 (-5.4, 2.4)
Patient Global 260 -27.7 255 -26.8 -1.1 (-5.0, 2.8)
Physician Global 260 -35.8 256 -35.4 -0.6 (-3.9, 2.6)
ESR 261 -15.1 255 -15.7 -0.4 (-3.8, 2.9)
CRP 261 -0.68 256 -0.74 0.03 (-0.25, 0.30)
DAS28 (ESR) 259 -2.42 253 -2.31 -0.10 (-0.32, 0.13)
DAS28 (CRP) 259 -2.14 254 -2.22 -0.06 (-0.28, 0.16)
Source: Reviewer
Abbreviations: CI = confidence interval 1 Number of patients with complete data included in analysis 2 Mean difference between CT-P13 and EU-Remicade based on linear regression model
adjusting for baseline value, region, and CRP category, with Huber-White standard errors
Reference ID: 3747036
27 BLA: 125-544 (CT-P13)
Table 9: Mean Changes from Baseline in Radiographic Score1 at Week 54 in Study
3.1 Completers Based on Original Assessment and Post Hoc Re-Assessment
CT-P13 (N=302)
N2 Mean
EU-Remicade (N=304)
N2 Mean Difference (95% CI)3
Original Assessment4
Baseline 252 105.7 248 106.4
Week 54 220 72.4 227 71.2
Change 179 -28.5 188 -31.9 2.6 (-2.7, 7.9)
Re-Assessment5
Baseline 275 69.1 271 65.4
Week 54 206 66.0 201 63.7
Change 197 1.1 192 0.4 0.7 (-0.4, 1.9)
Source: Reviewer
Abbreviations: CI = confidence interval 1 Total van der Heijde radiographic joint score (range: 0–448), which is the sum of erosion
and joint space narrowing scores based on evaluations of joints in hands, wrist, and feet 2 Number of patients with complete data included in analysis 3 Mean difference between CT-P13 and EU-Remicade based on linear regression model
adjusting for baseline value, region, and CRP category, with Huber-White standard errors 4 Based on score from single reader evaluating each patient’s paired radiographs with
knowledge of chronological order of images 5 Based on average score from two readers independently evaluating each patient’s
paired radiographs without knowledge of order
Reference ID: 3747036


29 BLA: 125-544 (CT-P13)
Table 10: Mean Changes from Baseline in Continuous Secondary Efficacy Endpoints
at Week 30 in Study 1.1 Completers
CT-P13 (N=125)
N1 Mean
EU-Remicade (N=125)
N1 Mean Difference (95% CI)2
BASDAI Score
BASFI Score
BASMI Score
Spinal Pain Score
Disease Status Score
114
112
111
114
114
-3.0
-2.6
-1.0
-34.8
-30.4
116
116
115
116
116
-2.7
-2.5
-0.9
-36.0
-27.5
-0.3 (-0.8, 0.3)
-0.0 (-0.6, 0.5)
-0.1 (-0.4, 0.3)
1.6 (-4.5, 7.7)
-2.5 (-8.4, 3.3)
Source: Reviewer
Abbreviations: CI = confidence interval 1 Number of patients with complete data included in analysis 2 Mean difference between CT-P13 and EU-Remicade based on linear regression model
adjusting for baseline value, region, and CRP category, with Huber-White standard errors
Reference ID: 3747036

30 BLA: 125-544 (CT-P13)
3.4.4 Assay Sensitivity and the Constancy Assumption
In order to reliably evaluate whether there are clinically meaningful differences between two
products, a comparative clinical study must have assay sensitivity, or the ability to detect
meaningful differences between the products, if such differences exist. In addition, to reliably
evaluate whether the experimental treatment retains a certain proportion of the effect of the
reference product versus placebo, the constancy assumption must be reasonable. This is the as
sumption that estimates of the effect of the reference product from historical, placebo-controlled
trials are unbiased for the setting of the comparative clinical study. The absence of a placebo
arm in an active-controlled study makes it difficult to determine whether evidence of similarity
between the experimental and control arms implies that the two products were similarly effective
or similarly ineffective. As discussed in the ICH E10 guidelines [9] and in the literature [10],
historical evidence of sensitivity to drug effects and appropriate trial conduct may be used to
support the presence of assay sensitivity and a conclusion that the treatments are similarly
effective.
Table 11 describes key characteristics of five historical randomized, double-blind, parallel-group,
placebo-controlled clinical trials of infliximab in patients with active RA despite treatment with
methotrexate, alongside key characteristics of Study 3.1. Important aspects of the design of the
historical studies, including key inclusion/exclusion criteria, permitted concomitant medications,
and baseline disease severity, were largely similar if not identical across the six studies. One
notable difference was the timing of the ACR20 assessment, which ranged from Week 14 to
Week 30. However, the ATTRACT study demonstrated large treatment effects as early as
Week 6 [5], and there was no apparent trend in effect size as a function of the timing of endpoint
assessment across the historical studies. Estimated treatment effects with respect to ACR20 for
the five historical trials were displayed earlier in Table 2. The estimated effects ranged from
18% to 38% on the absolute difference scale, with an overall estimated effect size of 28%. Thus,
the information in Tables 2 and 11 indicates that (1) the design of the five historical placebo-
controlled clinical trials were largely similar to that of comparative clinical Study 3.1; and (2)
there were relatively large and consistent treatment effects across the five historical studies.
This evidence of historical sensitivity to effects of infliximab in similarly designed clinical trials
provides some support for a conclusion that Study 3.1 had assay sensitivity.
It is also important that a study designed to evaluate similarity has quality conduct, because
conduct issues such as violations in eligibility criteria, poor adherence, cross-over between
arms, or missing data tend to bias results toward the alternative hypothesis of equivalence.
In Study 3.1, there were only 5 (0.8%) patients with failed eligibility criteria and only 1 patient
received the wrong treatment prior to Week 30. In addition, examination of minutes from Data
Reference ID: 3747036

31 BLA: 125-544 (CT-P13)
Monitoring Committee meetings did not identify any clear concerns with the quality of study
conduct. However, approximately 15% of patients discontinued treatment prior to Week 30
– this proportion is greater than the historical discontinuation rates, which ranged from 5%
to 11% (Table 11). This is concerning because adherence at a level lower than that which
is best achievable in real clinical practice will tend to bias comparisons between treatments
toward equivalence and therefore decrease the sensitivity of the comparative study. Decreased
adherence on the active control may also result in decreased efficacy and therefore violations
in the constancy assumption. In addition, because patients who discontinued treatment were
not retained for safety and efficacy assessments through the double-blind period, this led to
substantial missing data in important analyses. The need for a post hoc reassessment of
radiographic data, as well as the large number of patients with radiograph assessments weeks
after treatment initiation, were additional study conduct issues that we identified.
We also examined whether the within-group responses in the comparative clinical study were
similar to those observed in previous placebo-controlled trials. The 59% ACR20 response rate
on EU-Remicade in Study 3.1 is in line with the historical rates, which ranged from 50% to
76%. The definition of ACR20 in Study 3.1 was slightly different than in historical studies, in
that a 20% improvement in either ESR or CRP could contribute to a determination of response.
However, when we modified the ACR20 criteria to match that of historical studies (with only a
20% improvement in CRP contributing to a determination of response), the response probability
declined only slightly to 58%, remaining similar to the response rates of the historical trials.
In summary, there are some concerns about study conduct, including the high rates of treatment
discontinuation and missing data in Study 3.1, an issue that will be discussed in greater detail in
3.4.5. However, the design, conduct, and within-group responses rates of Study 3.1 were largely
similar to those characteristics in five historical clinical trials that demonstrated relatively large
and consistent treatment effects of infliximab over placebo. Therefore, the totality of available
information largely supports the assay sensitivity of Study 3.1, in addition to the constancy
assumption.
Reference ID: 3747036

32 BLA: 125-544 (CT-P13)
Table 11: Comparison of Key Characteristics of Historical Randomized, Placebo-
Controlled Clinical Trials1 of Infliximab in RA and Comparative Clinical Study
3.1
Maini [5] Westhovens [6]
Study
Schiff [4] Zhang [7] Abe [8] Study 3.1
≥6 SJ, ≥6 ≥3 SJ, ≥8 ≥6 SJ, ≥6 ≥6 SJ, ≥6
TJ, 2 of: Disease TJ, 2 of: TJ, 2 of: TJ, 2 of:
Selected
Inclusion /
Exclusion
morning
stiffness ≥45
min, ESR
≥6 SJ, ≥6
TJ
duration ≥1
year, ≥10
SJ, ≥12 TJ,
morning
stiffness ≥45
min, ESR
morning
stiffness ≥45
min, ESR
morning
stiffness ≥45
min, ESR
Criteria >28 mm/h,
CRP >2
mg/dL
CRP ≥1
mg/dL
>28 mm/h,
CRP >1.5 X
ULN
>28 mm/h,
CRP >2
mg/dL
>28 mm/h,
CRP >2
mg/dL
Anti-TNF
experience No No No Yes No No
allowed?
Concomitant
DMARDs stable MTX
stable MTX
+ additional
DMARDs
allowed
stable MTX
stable MTX
+ additional
DMARDs
allowed?
stable
(low-dose)
MTX
stable MTX
Region /
Country NA, EU
NA, EU, AU,
SA
NA, EU, AU,
AF, SA China Japan
EU, SA,
NA, AS
Baseline Char
acteristics of
Study
Population2
SJ: 19; TJ:
32; Disease
Duration: 8
yrs; HAQ: 1.8
SJ: 15; TJ:
22 Disease
Duration: 8
yrs; HAQ: 1.5
SJ: 20; TJ:
32; Disease
Duration: 7
yrs; HAQ: 1.7
Disease
Duration: 7
yrs
SJ: 15; TJ:
19; Disease
Duration: 9
yrs
SJ: 15; TJ:
24; HAQ:
1.6
Time of
ACR20 Week 30 Week 22 Week 28 Week 18 Week 14 Week 30
Evaluation
ACR20
Response on 50% 55% 59% 76% 61% 59%
Infliximab
Withdrawal
on Infliximab 11% 7% 8% 10% 5% 15%
Source: Reviewer
Abbreviations: SJ=swollen joint count; TJ=tender joint count; ULN = upper limit of normal;
DMARD=disease-modifying anti-rheumatic drug; NA=North America; EU=Europe; AU=Australia;
SA=South America; AF=Africa; AS=Asia 1 Based on best attempts to identify/estimate characteristics from literature review 2 Means or medians, depending on what was reported in publication
Reference ID: 3747036

33 BLA: 125-544 (CT-P13)
3.4.5 Potential Effect of Missing Data
As described in detail in 3.4.1, there was substantial early patient withdrawal in Studies 3.1 and
1.1. Our missing data sensitivity analyses focused on comparative clinical Study 3.1, in which the
efficacy comparison was a primary objective. In Study 3.1, the primary endpoint was a composite
measure of treatment success defined by remaining in the study and on treatment through Week
30 and achieving an ACR20 response at Week 30. Therefore, outcomes in patients who withdrew
early were not missing – these patients were non-responders according to the composite endpoint
definition. However, comparing treatments with respect to this composite measure of treatment
success may confound differences between treatments in efficacy with differences in tolerability.
The composite measure could fail to identify clinically meaningful differences in efficacy, for
example, if the proposed biosimilar was better tolerated than the reference product but had
lesser efficacy in the subset of patients who adhere. Therefore, it is important to evaluate
differences in the components of the composite primary endpoint. This includes an evaluation
of ACR20 at Week 30 in all randomized patients regardless of adherence (an evaluation of the
de facto or intention-to-treat estimand), in addition to de facto evaluations of the components of
ACR20 (and other important endpoints such as DAS28). However, such evaluations are subject
to substantial missing data and rely on the strong and unverifiable assumption that outcomes
in patients who withdrew early are missing at random. Therefore, we conducted tipping point
analyses to explore the sensitivity of results to violations in assumptions about the missing data
(i.e., to various missing-not-at-random assumptions).
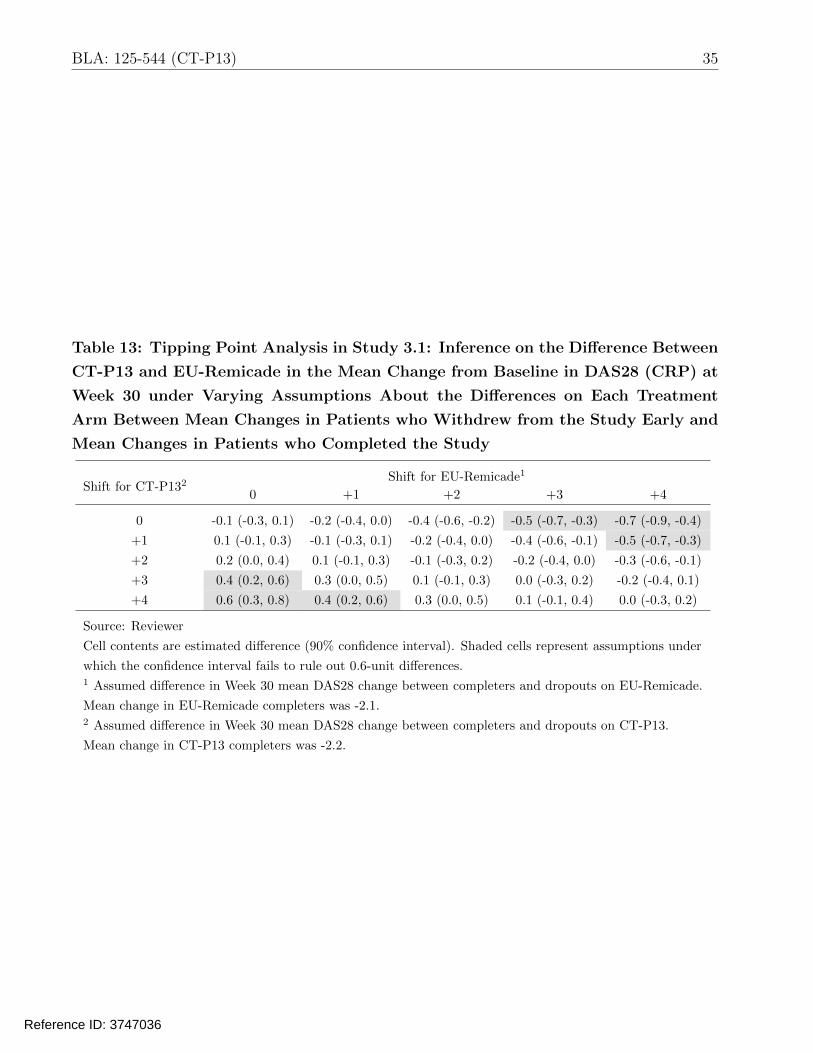
Tables 12 and 13 display estimated de facto differences between CT-P13 and EU-Remicade in
the ACR20 response and mean DAS28 change at Week 30, with varying assumptions about the
differences on each treatment arm between outcomes in patients who withdrew from the study
early and outcomes in patients who completed the study. In order for the 90% CI to fail to
rule out a 12% absolute loss in the probability of ACR20 response, the response among CT-P13
dropouts would need to be around 70 percentage points lower than the response in CT-P13
completers, while the response among EU-Remicade dropouts would need to be only slightly
worse (e.g., 17.5 percentage points less) than the response among EU-Remicade completers. As
a point of reference, the response probabilities among completers on CT-P13 and EU-Remicade
were 75% and 72%, respectively. Similarly, inference on DAS28 rules out large mean increases
(e.g., 0.6 units) on CT-P13 as compared to EU-Remicade unless there is an assumption of much
worse outcomes (3–4 unit increases) in CT-P13 dropouts than CT-P13 completers, along with
only slight worse outcomes (0–2 unit increases) in EU-Remicade dropouts than EU-Remicade
completers. As a point of reference, mean changes among completers on CT-P13 and EU-
Remicade were -2.2 and -2.1, respectively. The tipping points for ruling out large increases in
Reference ID: 3747036

34 BLA: 125-544 (CT-P13)
efficacy, while not as extreme as those for ruling out efficacy losses, still require the assumption of
relatively large differences between responses in CT-P13 dropouts and responses in EU-Remicade
dropouts (relative to completers on the two arms). Given the similar proportions of patients and
distributions of reasons for early withdrawal on the two treatment arms (see Figure 1 and Table
5), in addition to the similar baseline characteristics between dropouts on the two arms (see
Appendix: Table 16), an assumption of such large differences between the outcomes in dropouts
on the two arms seems implausible. Therefore, these tipping point sensitivity analyses largely
support the findings of the key efficacy analyses in Study 3.1.
Table 12: Tipping Point Analysis in Study 3.1: Inference on the Difference Between
CT-P13 and EU-Remicade in the Probability of Week 30 ACR20 Response under
Varying Assumptions About the Differences on Each Treatment Arm Between
Responses in Patients who Withdrew from the Study Early and Responses in
Patients who Completed the Study
Shift for
CT-P132 -0.700 Shift for EU-Remicade1
-0.525 -0.350 -0.175 0.00
-0.700
-0.525
-0.350
-0.175
0.000
0.03 (-0.04, 0.10)
0.06 (-0.01, 0.13)
0.08 (0.01, 0.15)
0.11 (0.04, 0.18)
0.14 (0.07, 0.21)
0.00 (-0.07, 0.07) -0.02 (-0.09, 0.05) -0.05 (-0.12, 0.02)
0.03 (-0.04, 0.10) 0.00 (-0.06, 0.07) -0.02 (-0.09, 0.05)
0.06 (-0.01, 0.13) 0.03 (-0.03, 0.10) 0.01 (-0.06, 0.07)
0.09 (0.02, 0.15) 0.06 (-0.01, 0.12) 0.03 (-0.03, 0.10)
0.11 (0.05, 0.18) 0.09 (0.02, 0.15) 0.06 (0.00, 0.13)
-0.07 (-0.14, -0.01)
-0.05 (-0.11, 0.02)
-0.02 (-0.08, 0.05)
0.01 (-0.06, 0.07)
0.03 (-0.03, 0.10)
Source: Reviewer
Cell contents are estimated difference (90% confidence interval). Shaded cells represent assumptions under
which the confidence interval fails to rule out the ±12% margin. 1 Assumed difference in Week 30 ACR20 response between completers and dropouts on EU-Remicade.
Response in EU-Remicade completers was 0.72. 2 Assumed difference in Week 30 ACR20 response between completers and dropouts on CT-P13.
Response in CT-P13 completers was 0.75.
Reference ID: 3747036
35 BLA: 125-544 (CT-P13)
Table 13: Tipping Point Analysis in Study 3.1: Inference on the Difference Between
CT-P13 and EU-Remicade in the Mean Change from Baseline in DAS28 (CRP) at
Week 30 under Varying Assumptions About the Differences on Each Treatment
Arm Between Mean Changes in Patients who Withdrew from the Study Early and
Mean Changes in Patients who Completed the Study
Shift for CT-P132 0 +1
Shift for EU-Remicade1
+2 +3 +4
0
+1
-0.1 (-0.3, 0.1)
0.1 (-0.1, 0.3)
-0.2 (-0.4, 0.0)
-0.1 (-0.3, 0.1)
-0.4 (-0.6, -0.2)
-0.2 (-0.4, 0.0)
-0.5 (-0.7, -0.3)
-0.4 (-0.6, -0.1)
-0.7 (-0.9, -0.4)
-0.5 (-0.7, -0.3)
+2
+3
0.2 (0.0, 0.4)
0.4 (0.2, 0.6)
0.1 (-0.1, 0.3)
0.3 (0.0, 0.5)
-0.1 (-0.3, 0.2)
0.1 (-0.1, 0.3)
-0.2 (-0.4, 0.0)
0.0 (-0.3, 0.2)
-0.3 (-0.6, -0.1)
-0.2 (-0.4, 0.1)
+4 0.6 (0.3, 0.8) 0.4 (0.2, 0.6) 0.3 (0.0, 0.5) 0.1 (-0.1, 0.4) 0.0 (-0.3, 0.2)
Source: Reviewer
Cell contents are estimated difference (90% confidence interval). Shaded cells represent assumptions under
which the confidence interval fails to rule out 0.6-unit differences. 1 Assumed difference in Week 30 mean DAS28 change between completers and dropouts on EU-Remicade.
Mean change in EU-Remicade completers was -2.1. 2 Assumed difference in Week 30 mean DAS28 change between completers and dropouts on CT-P13.
Mean change in CT-P13 completers was -2.2.
Reference ID: 3747036

36 BLA: 125-544 (CT-P13)
3.5 Evaluation of Safety
Dr. Juwaria Waheed, the Medical Reviewer, conducted the complete safety evaluation, and
the reader is referred to Dr. Waheed’s review for more detailed information on safety. We
conducted supplementary analyses to compare CT-P13 and EU-Remicade with respect to the
incidence of adverse events of special interest (AESIs) in the double-blind clinical Studies 1.1
and 3.1, in addition to the transition Studies 1.3 and 3.2. The applicant analyzed the following
adverse events of special interest based on the known safety profile of infliximab: active TB,
latent TB, infection, serious infection, pneumonia, malignancy and lymphoma, infusion-related
reaction, drug-induced liver injury in accordance with Hy’s law, and vascular disorder. In
addition to these events, we evaluated two additional AESIs: cardiac disorder and opportunistic
infection. The captions under Tables 14 and 15 provide definitions for these safety endpoints.
The applicant reported no occurrences of drug-induced liver injury, so this event is not included
in the tables.
Within each study, we calculated the cumulative incidence of each event, i.e., the proportion of
patients who remained in the study, on treatment, and experienced an event during the 54-week
treatment period. We also calculated on-treatment incidence rates per 100 person-years. It
was not possible to calculate the 54-week cumulative incidence or incidence rate regardless of
adherence to treatment because patients who discontinued treatment were withdrawn from the
study. We also integrated results from the studies in RA and AS to compare treatment groups
with respect to the relative risk (RR) of each AESI, i.e., the ratio of cumulative incidences.
Following the applicant’s approach, we performed as-treated rather than as-randomized analy
ses and calculated integrated relative risks based on DerSimonian-Laird random effects meta
analyses. Many of the statistics presented here differ from those in the applicant’s summaries
because: (1) we applied slightly different definitions of pneumonia (additionally including lower
respiratory tract infection) and malignancy and lymphoma (additionally including neoplasm and
Myeloprofilerative disorder) than the applicant; (2) we calculated the incidence rate of the first
event per person, whereas the applicant appears to have counted only incident (first) events in
the numerator but included all time at risk (including follow-up time after an incident event) in
the denominator; and (3) we only evaluated Studies 3.1 and 1.1 in integrated analyses, whereas
the applicant also included results from two additional small studies.
Table 14 describes the incidence of AESIs during the 54-week, double-blind, controlled treatment
periods of Studies 1.1 and 3.1. There was a trend toward a greater incidence of active TB on CT
P13 (5 total events) than EU-Remicade (1 total event), with an estimated integrated relative risk
of 3.2 (95% CI: 0.5, 20.4). There were also slight trends toward greater incidences of pneumonia
(RR: 1.8; 95% CI: 0.6, 5.1) and vascular disorder (RR: 1.7; 95% CI: 0.9, 3.0) on CT-P13 than
Reference ID: 3747036
37 BLA: 125-544 (CT-P13)
EU-Remicade. Given the multiple statistical comparisons being carried out here, and because
the confidence intervals do not exclude equality (RR=1), these observed differences may have
been due to chance alone. That being said, the upper bounds of the confidence intervals also
include the possibility of very large relative risks. Therefore, these clinical data alone cannot rule
out the possibility of meaningful increases in the risk of important adverse events on CT-P13.
Table 15 describes the incidence of AESIs during the 54-week, open-label, extension Studies 1.3
and 3.2, in which patients previously treated with CT-P13 (in the double-blind, randomized,
controlled Studies 1.1 and 3.1, respectively) continued on CT-P13 and patients previously treated
with EU-Remicade transitioned to CT-P13. There were no striking differences between the
groups. However, the interpretability of these data is limited. A more appropriate design
to reliably evaluate the potential effect of transitioning from a reference product to a proposed
biosimilar would randomize patients on the reference product to either continue on the reference
or transition to the proposed biosimilar. The applicant’s evaluation of the transition was based
on a non-randomized comparison of patients transitioning from EU-Remicade to CT-P13 to the
wrong control group: patients continuing on CT-P13. Therefore, this evaluation relies on the
strong assumptions that (1) the subsets of patients on EU-Remicade and CT-P13 entering the
transition studies were comparable; and (2) rates of events in patients continuing on CT-P13
are similar to rates of events in patients continuing on the reference product. Alternatively, one
can compare the incidence of adverse events after transition to the incidence prior to transition
in those same patients. The interpretability of this alternative analysis is also limited because
differences (or lack therefore) observed before and after transition could be due to the effect
of the transition or to effects of age or time on treatment. Results presented by the applicant
based on this alternative approach also did not identify any striking differences.
Reference ID: 3747036

BLA: 125-544 (CT-P13) 38
Table 14: Evaluation of the Incidence of Adverse Events of Special Interest During
the 54-Week Controlled Treatment Periods of Studies 1.1 and 3.1
Study 1.1 Study 3.1
CT-P13 EU-Remicade CT-P13 EU-Remicade Integrated RR
(N=128) (N=122) (N=302) (N=300) (95% CI)
n (%) Rate n (%) Rate n (%) Rate n (%) Rate
Latent TB 10 (7.8%) 7.3 6 (4.9%) 4.6 28 (9.3%) 9.3 26 (8.7%) 8.6 1.2 (0.7, 1.8)
Active TB 2 (1.6%) 1.4 1 (0.8%) 0.7 3 (1.0%) 0.9 0 (0.0%) 0.0 3.2 (0.5, 20.4)
Infection 55 (43.0%) 52.5 49 (40.2%) 48.4 127 (42.1%) 53.8 137 (45.7%) 60.4 1.0 (0.8, 1.1)
Serious Infection 2 (1.6%) 1.4 3 (2.5%) 2.2 13 (4.3%) 4.2 7 (2.3%) 2.2 1.4 (0.6, 3.5)
Pneumonia 2 (1.6%) 1.4 0 (0.0%) 0.0 8 (2.6%) 2.5 5 (1.7%) 1.6 1.8 (0.6, 5.1)
Malignancy and
Lymphoma 2 (1.6%) 1.4 0 (0.0%) 0.0 3 (1.0%) 0.9 4 (1.3%) 1.3 1.2 (0.2, 5.7)
Infusion-related
Reaction 11 (8.6%) 8.2 15 (12.3%) 11.8 30 (9.9%) 9.8 43 (14.3%) 14.8 0.7 (0.5, 1.0)
Vascular Disorder 4 (3.1%) 2.9 1 (0.8%) 0.7 25 (8.3%) 8.3 16 (5.3%) 5.3 1.7 (0.9, 3.0)
Cardiac Disorder 5 (3.9%) 3.6 6 (4.9%) 4.6 5 (1.7%) 1.6 12 (4.0%) 3.9 0.6 (0.3, 1.2)
Opportunistic
Infection 0 (0.0%) 0.0 2 (1.6%) 1.5 4 (1.3%) 1.3 6 (2.0%) 1.9 0.6 (0.2, 1.8)
Source: Reviewer 1 n (%) is number (percent) of patients having at least one on-treatment event 2 Rate is incidence rate of first on-treatment event per 100 person-years 3 Relative risk (RR) of event (95% confidence interval [CI]) compares CT-P13 with EU-Remicade based on
DerSimonian-Laird random effects meta-analysis of results from Studies 1.1 and 3.1 4 Definitions of Adverse Events of Special Interest:
Latent TB: All preferred terms with latent tuberculosis or Mycobacterium tuberculosis complex test
Active TB: All preferred terms with tuberculosis not classified as latent TB
Infection: All events in infections and infestations system organ class
Serious Infection: All events in infections and infestations system organ class classified as serious
Pneumonia: All preferred terms with pneumonia, bronchopneumonia, lobar pneumonia,
or lower respiratory tract infection
Malignancy and Lymphoma: All preferred terms with cancer, carcinoma, lymphoma, neoplasm,
or Myeloproliferative disorder
Infusion-related Reaction: See applicants ISS SAP Appendix 2 for definition
Vascular Disorder: All events in vascular disorders system organ class
Cardiac Disorder: All events in cardiac disorders system organ class
Opportunistic Infection: All preferred terms with Herpes zoster, Oesophageal candidiasis, Oral candidiasis, or Varicella
Reference ID: 3747036
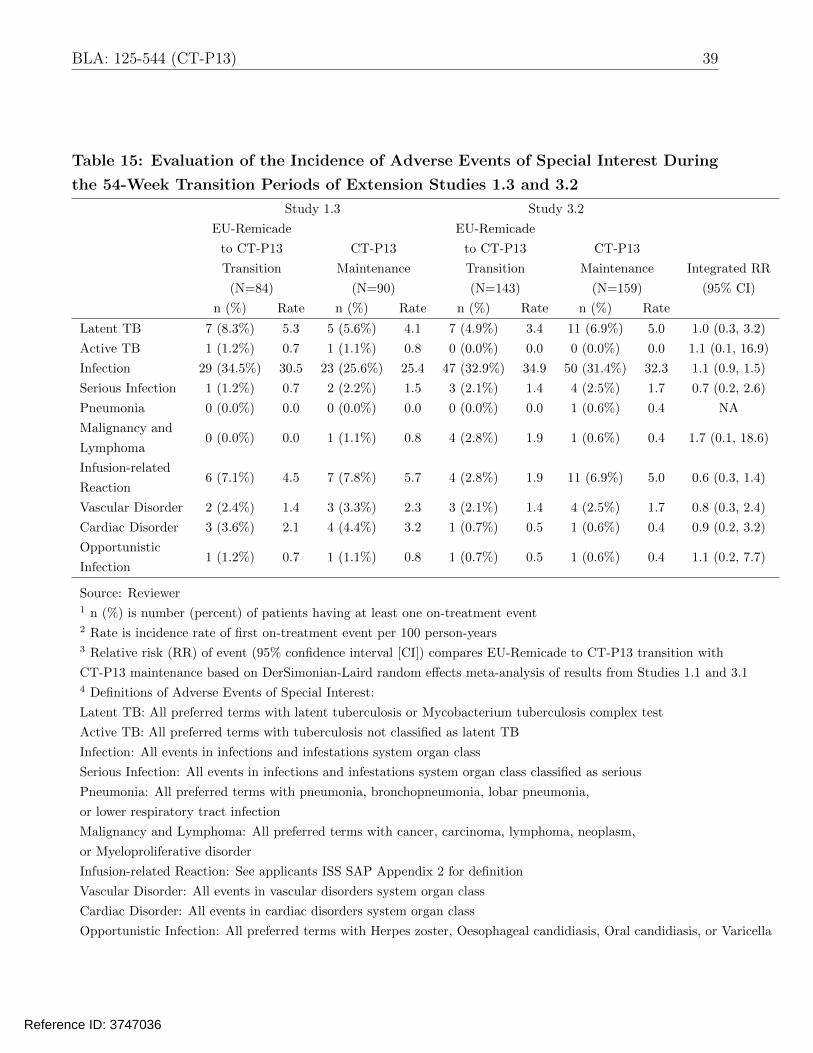
BLA: 125-544 (CT-P13) 39
Table 15: Evaluation of the Incidence of Adverse Events of Special Interest During
the 54-Week Transition Periods of Extension Studies 1.3 and 3.2
Study 1.3 Study 3.2
EU-Remicade EU-Remicade
to CT-P13 CT-P13 to CT-P13 CT-P13
Transition Maintenance Transition Maintenance Integrated RR
(N=84) (N=90) (N=143) (N=159) (95% CI)
n (%) Rate n (%) Rate n (%) Rate n (%) Rate
Latent TB 7 (8.3%) 5.3 5 (5.6%) 4.1 7 (4.9%) 3.4 11 (6.9%) 5.0 1.0 (0.3, 3.2)
Active TB 1 (1.2%) 0.7 1 (1.1%) 0.8 0 (0.0%) 0.0 0 (0.0%) 0.0 1.1 (0.1, 16.9)
Infection 29 (34.5%) 30.5 23 (25.6%) 25.4 47 (32.9%) 34.9 50 (31.4%) 32.3 1.1 (0.9, 1.5)
Serious Infection 1 (1.2%) 0.7 2 (2.2%) 1.5 3 (2.1%) 1.4 4 (2.5%) 1.7 0.7 (0.2, 2.6)
Pneumonia 0 (0.0%) 0.0 0 (0.0%) 0.0 0 (0.0%) 0.0 1 (0.6%) 0.4 NA
Malignancy and
Lymphoma 0 (0.0%) 0.0 1 (1.1%) 0.8 4 (2.8%) 1.9 1 (0.6%) 0.4 1.7 (0.1, 18.6)
Infusion-related
Reaction 6 (7.1%) 4.5 7 (7.8%) 5.7 4 (2.8%) 1.9 11 (6.9%) 5.0 0.6 (0.3, 1.4)
Vascular Disorder 2 (2.4%) 1.4 3 (3.3%) 2.3 3 (2.1%) 1.4 4 (2.5%) 1.7 0.8 (0.3, 2.4)
Cardiac Disorder 3 (3.6%) 2.1 4 (4.4%) 3.2 1 (0.7%) 0.5 1 (0.6%) 0.4 0.9 (0.2, 3.2)
Opportunistic
Infection 1 (1.2%) 0.7 1 (1.1%) 0.8 1 (0.7%) 0.5 1 (0.6%) 0.4 1.1 (0.2, 7.7)
Source: Reviewer 1 n (%) is number (percent) of patients having at least one on-treatment event 2 Rate is incidence rate of first on-treatment event per 100 person-years 3 Relative risk (RR) of event (95% confidence interval [CI]) compares EU-Remicade to CT-P13 transition with
CT-P13 maintenance based on DerSimonian-Laird random effects meta-analysis of results from Studies 1.1 and 3.1 4 Definitions of Adverse Events of Special Interest:
Latent TB: All preferred terms with latent tuberculosis or Mycobacterium tuberculosis complex test
Active TB: All preferred terms with tuberculosis not classified as latent TB
Infection: All events in infections and infestations system organ class
Serious Infection: All events in infections and infestations system organ class classified as serious
Pneumonia: All preferred terms with pneumonia, bronchopneumonia, lobar pneumonia,
or lower respiratory tract infection
Malignancy and Lymphoma: All preferred terms with cancer, carcinoma, lymphoma, neoplasm,
or Myeloproliferative disorder
Infusion-related Reaction: See applicants ISS SAP Appendix 2 for definition
Vascular Disorder: All events in vascular disorders system organ class
Cardiac Disorder: All events in cardiac disorders system organ class
Opportunistic Infection: All preferred terms with Herpes zoster, Oesophageal candidiasis, Oral candidiasis, or Varicella
Reference ID: 3747036
40 BLA: 125-544 (CT-P13)
4 Findings in Special/Subgroup Populations
Figures 5 and 6 present the results of subgroup analyses by sex, race (White, Asian, or Other),
age (≤35, 35–50, 50–65, ≥65), and geographic region (non-European versus European) in Studies
3.1 and 1.1, respectively. As would be expected, there was considerable heterogeneity in the
estimated differences in response probabilities comparing CT-P13 and EU-Remicade across the
many subgroups (some very small in size). However, estimated differences were largely centered
around similarity, and there were no striking trends across the two studies. The numbers of
Black patients in both studies, and the number of patients ages ≥ 65 years in Study 1.1, were
too small to calculate sufficiently reliable estimated differences to report. There were no U.S.
sites in either study so subgroup analyses in the United States are not possible.
Reference ID: 3747036

41 BLA: 125-544 (CT-P13)
Figure 5: Estimated Differences Between CT-P13 and EU-Remicade in the
Probability of Remaining in the Study and Achieving an ACR20 Response at Week
30, Stratified by Selected Subgroups, in Study 3.1. Solid Vertical Line Represents
Estimated Difference in Overall Population, and Dashed Vertical Line Represents
No Difference. (Source: Reviewer)
−0.4 −0.3 −0.2 −0.1 0.0 0.1 0.2 0.3
Difference from EU−Remicade in Week 30 ACR20 Response (95% CI)
Sex
●Male (N=105)
●Female (N=501)
Race
●White (N=442)
●Asian (N=71)
●Other (N=90)
Age, years
●<35 (N=83)
●35−50 (N=207)
●50−65 (N=274)
●>=65 (N=42)
Region
●European (N=396)
●Non−European (N=210)
CRP
●<=2 mg/dL (N=330)
●>2 mg/dL (N=276)
Reference ID: 3747036

42 BLA: 125-544 (CT-P13)
Figure 6: Estimated Differences Between CT-P13 and EU-Remicade in the
Probability of Remaining in the Study and Achieving an ASAS20 Response at Week
30, Stratified by Selected Subgroups, in Study 1.1. Solid Vertical Line Represents
Estimated Difference in Overall Population, and Dashed Vertical Line Represents
No Difference. (Source: Reviewer)
−0.6 −0.4 −0.2 0.0 0.2 0.4
Difference from EU−Remicade in Week 30 ASAS20 Response (95% CI)
Sex
●Male (N=202)
●Female (N=48)
Race
●White (N=189)
●Asian (N=29)
●Other (N=32)
Age, years
●<35 (N=97)
●35−50 (N=103)
●50−65 (N=46)
Region
●European (N=173)
●Non−European (N=77)
BASDI Score
●<8 (N=187)
●>=8 (N=63)
Reference ID: 3747036

43 BLA: 125-544 (CT-P13)
5 Summary and Conclusions
5.1 Statistical Issues
During this statistical review, we identified the following important issues:
• Margin selection and evidence of similarity
The determination of a similarity margin is a critical aspect of the design of a comparative
clinical study because it determines the null hypothesis being tested in the primary analysis,
i.e., the differences in efficacy that need to be ruled out at an acceptable significance level.
The applicant prespecified a similarity margin of ±15% and later modified the margin to
±13% in response to feedback from FDA. We do not agree with the applicant’s justification
for the proposed margins. We selected a margin of ±12% based on meta-analyses of historical
effects of infliximab and discussions with clinicians aimed at weighing the clinical importance
of different losses in effect against the feasibility of different study sizes. Despite the lack of
agreement on an appropriate similarity margin, results from the primary analysis of Study
3.1 (90% CI: -4.6%, +8.7%) successfully ruled out the ±12% margin we consider to be
reasonable. In addition, there were similar improvements from baseline in the components
of the composite primary endpoint, as well as additional important secondary endpoints, on
the two treatment arms. Results in Study 1.1 in AS also suggested similar efficacy on CT
P13 and EU-Remicade. Therefore, the totality of the evidence from the comparative clinical
studies supports a demonstration of no clinically meaningful differences between CT-P13 and
US-Remicade.
• Potential effect of missing data on the reliability of efficacy results
This issue was discussed in detail in 3.3.2 and 3.4.5. Our missing data sensitivity analyses
focused on comparative clinical Study 3.1, in which the efficacy comparison was a primary
objective. In Study 3.1, 25% of patients failed to complete the 54-week double-blind period.
This led to substantial missing data in important analyses, such as the evaluations of ACR20
and DAS28 at Week 30 in all randomized patients regardless of adherence. Because such
evaluations rely on the strong and unverifiable assumption that outcomes in patients who
withdraw early are missing at random, we conducted tipping point analyses to explore the
sensitivity of results to violations in this assumption. Confidence intervals for the differences
between CT-P13 and EU-Remicade failed to rule out concerning losses in efficacy only under
the assumption that patients who dropped out on CT-P13 had much worse outcomes than
dropouts on EU-Remicade. Given the similar proportions of patients and distributions of
reasons for early withdrawal on the two treatment arms, in addition to the similar baseline
Reference ID: 3747036

44 BLA: 125-544 (CT-P13)
characteristics between dropouts on the two arms, an assumption of such large differences
between the outcomes in dropouts on the two treatments seems implausible. Therefore, these
tipping point sensitivity analyses largely support the findings of the key efficacy analyses in
Study 3.1.
The substantial missing data in important analyses of endpoints at specific follow-up times was
largely due to the design of the study, in particular, the fact that patients who discontinued
treatment early were also withdrawn from the study. Future studies should clearly differentiate
treatment discontinuation from study withdrawal, and the only reason for study withdrawal
should be a patient’s withdrawal of consent for additional follow-up. This will help prevent
missing data and improve the reliability of key results.
• Assay sensitivity and the constancy assumption
This issue was discussed in detail in 3.4.4. It is critical that a comparative clinical study
has assay sensitivity, or the ability to detect meaningful differences between products, if such
differences exist. In addition, the constancy assumption should be reasonable. This is the
assumption that estimates of the reference product effect from historical, placebo-controlled
trials are unbiased for the setting of the comparative study. Our evaluation of the literature
indicated historical sensitivity to effects of infliximab over placebo in five clinical trials with
similar designs to that of comparative clinical Study 3.1. Within-group responses in Study
3.1 were also similar to those of historical trials. It is also important that a study designed
to evaluate similarity has appropriate conduct because conduct issues tend to bias results
toward the alternative hypothesis of equivalence. Despite some concerns about the high rates
of treatment discontinuation and missing data, the totality of available information largely
supports the assay sensitivity of Study 3.1, in addition to the constancy assumption.
• Extrapolation to other indications
The collective evidence from the comparative clinical studies supports a demonstration of no
clinically meaningful differences between CT-P13 and US-Remicade in the studied indications
(RA and AS). However, these studies would not be sensitive to clinically meaningful differences
in another approved indication if those differences were caused by changes in function unique
to the mechanism of action of infliximab in that additional indication. In addition, because
the approved dose of infliximab is near the plateau of the dose-response curve in RA, potential
differences in potency between the products may not translate into meaningful differences in
efficacy. But such differences could translate into clinically meaningful differences in other
indications. Therefore, extrapolation of findings of no clinically meaningful differences to
other indications needs to additionally rely on data from other studies, such as results from
analytical and PK comparisons.
Reference ID: 3747036

45 BLA: 125-544 (CT-P13)
5.2 Collective Evidence
The collective evidence from the comparative clinical studies supports a demonstration of no
clinically meaningful differences between CT-P13 and US-Remicade. In Study 3.1 in RA,
60.9% of CT-P13 patients and 58.9% of EU-Remicade patients were ACR20 responders, for
an estimated absolute difference between treatments of 2.0% (90% CI: -4.6%, +8.7%). The
confidence interval successfully ruled out the similarity margin of ±12% that the Agency has
determined reasonable. ACR20, ACR50, and ACR70 responses over time, in addition to mean
changes from baseline in the components of the ACR composite endpoint, the disease activity
score (DAS28), and the radiographic damage score, were also similar between the treatment
arms. Results in Study 1.1 in AS also suggested similar efficacy on CT-P13 and EU-Remicade.
There was substantial missing data in important analyses, but tipping point analyses largely
support the findings of key efficacy results in Study 3.1. In addition, the totality of available
information largely supports the assay sensitivity of Study 3.1, in addition to the constancy
assumption.
Reference ID: 3747036


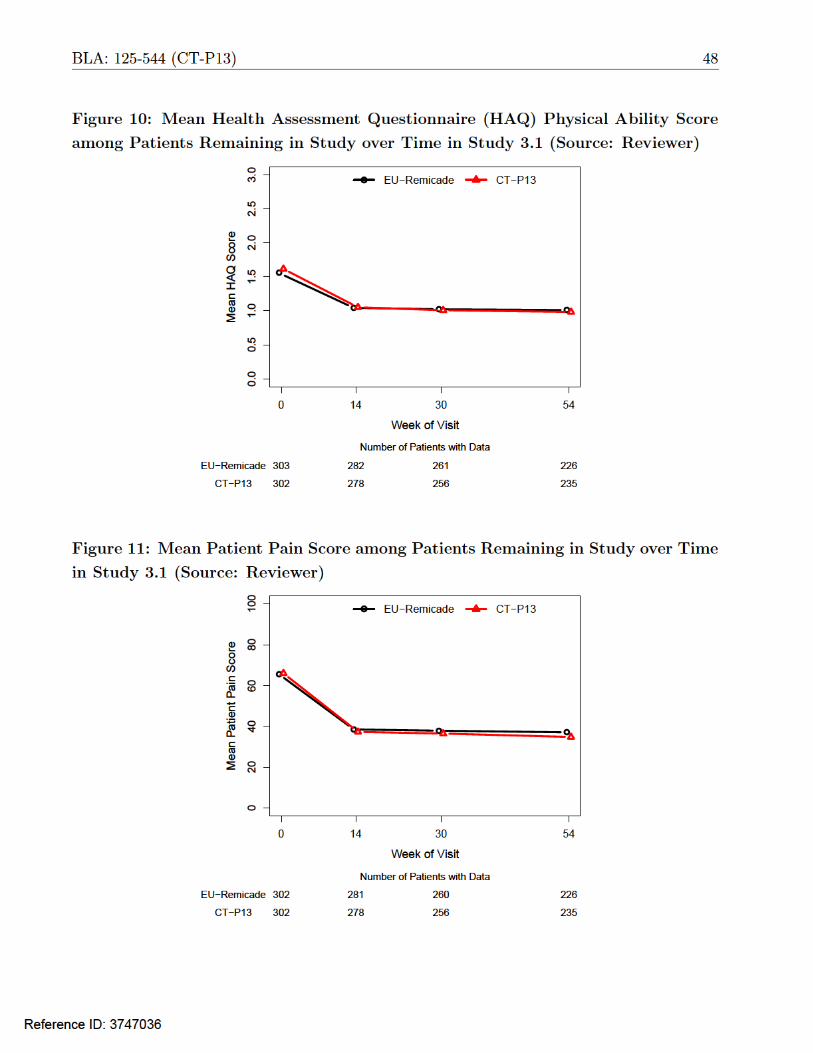


53 BLA: 125-544 (CT-P13)
Table 16: Baseline Characteristics in RA Patients who Withdrew from the Study
Early in Study 3.1
CT-P13 EU-Remicade Overall
N 69 82 151
Female 57 (83%) 72 (88%) 129 (85%)
Age (years) 51.7 (13.1) 48.5 (12.0) 50.0 (12.6)
Age Group (years)
< 35 9 (13%) 13 (16%) 22 (15%)
35-50 20 (29%) 28 (34%) 48 (32%)
50-65 30 (43%) 34 (41%) 64 (42%)
≥ 65 10 (14%) 7 (9%) 17 (11%)
Race
White 46 (67%) 59 (72%) 105 (70%)
Asian 7 (10%) 11 (13%) 18 (12%)
Other 16 (23%) 12 (15%) 28 (19%)
Weight (kg) 69.2 (15.8) 68.1 (16.4) 68.6 (16.1)
Height (cm) 161.1 (9.5) 162.3 (8.3) 161.7 (8.9)
BMI (kg/m2) 26.5 (5.0) 25.8 (5.6) 26.1 (5.4)
Region
Eastern Europe 34 (49%) 41 (50%) 75 (50%)
Western Europe 4 (6%) 6 (7%) 10 (7%)
Latin America 24 (35%) 23 (28%) 47 (31%)
Asia 7 (10%) 12 (15%) 19 (13%)
Swollen Joint Count 16.3 (8.4) 13.8 (6.9) 15.0 (7.7)
Tender Joint Count 27.0 (15.9) 25.0 (12.5) 25.9 (14.2)
HAQ Score 1.7 (0.6) 1.6 (0.6) 1.6 (0.6)
Patient Pain Score 67.9 (15.2) 65.1 (16.4) 66.4 (15.9)
Patient Global Assessment 67.2 (16.5) 65.5 (16.1) 66.2 (16.2)
Physician Global Assessment 66.9 (13.1) 65.4 (13.1) 66.1 (13.1)
CRP 2.7 (3.8) 2.0 (2.2) 2.3 (3.0)
ESR 50.0 (27.7) 51.2 (27.0) 50.6 (27.2)
DAS28 (ESR) 6.8 (0.9) 6.7 (0.8) 6.7 (0.8)
DAS28 (CRP) 6.0 (0.8) 5.8 (0.8) 5.9 (0.8)
Source: Reviewer
Cell contents are mean (standard deviation) or frequency (percent)
Reference ID: 3747036

54 BLA: 125-544 (CT-P13)
A.2 Tipping Point Analysis Methodology
The goal is to evaluate the potential effect of violations in assumptions about missing data on
the reliability of conclusions. Suppose that outcomes Y are independently distributed on the
control and test drug arms. The parameter of interest is the difference in means θ. Consider the
following parameterization and notation to describe the probabilities of completing the study
(non-missingness), the true means in completers and dropouts, and the numbers of completers
and total patients on the two treatment arms:
Table 17: Relevant Parameters and Notation for Setting with Missing Data
Treatment
Arm
Probability
Non-Missing
Mean in
Completers
Mean in
Dropouts
Number of
Completers
Total
Sample Size
Control
Test
πc
πt
µc
µt
µc + δc
µt + δt
Nc
Nt
nc
nt
Given this parameterization, the paramter of interest is θ = [πt µt + (1 − πt) (µt + δt)] − [πc µc +
(1 − πc) (µc + δc)] ≡ [µt + (1 − πt) δt] − [µc + (1 − πc) δc]. An analysis in completers will only
provide reliable inference on θ if the strong and unverifiable missing-at-random assumption, i.e.,
the assumption that δc = δt = 0, is valid. We will perform sensitivity analyses that allow for the
possibility that outcomes among dropouts are not missing at random by performing inference
under different assumed values of the parameters δc and δt.
Let Mj,i be an indicator that patient i on treatment group j is a completer, i.e., his or her outcome
is observed (i = 1, ..., nj ; j = c, t). Assuming specific values of the sensitivity parameters δc and
δt, we consider the following estimator of θ:
θ̂ = [ ̂µt + (1 − π̂t) δt] − [ µ̂c + (1 − π̂c) δc] 1 nj Njwhere µ̂j = i=1 Yj,i |Mj,i = 1 is the sample mean in the completers and π̂j = ≡Nj nj
n1 j
nj Mj,i is the observed proportion of completers on treatment arm j, with j = c, t.i=1
One can show that: ˆθ − θ d_ → N [ 0, 1 ]
s2/Nt + s2/Nc + δ2π̂t(1 − π̂t)/nt + δ2π̂c(1 − π̂c)/nct c t c
where s2 j is the sample variance of the outcomes in completers on treatment j, with j = c, t.
Thus, we can compute a Wald-type (1 − α) ∗ 100% confidence interval for θ of the form θ̂ ± zα/2 s2
t /Nt + s2 c /Nc + δt
2π̂t(1 − π̂t)/nt + δc 2π̂c(1 − π̂c)/nc
where zα/2 is the upper (1 − α/2) quantile of the standard normal distribution.
Reference ID: 3747036

55 BLA: 125-544 (CT-P13)
References
[1] Food and Drug Administration. Draft guidance for industry: Scientific considerations in
demonstrating biosimilarity to a reference product, 2012.
[2] Food and Drug Administration. Draft guidance for industry: Non-inferiority clinical trials, 2010.
[3] International Conference on Harmonisation of Technical Requirements for Registration of
Pharmaceuticals for Human Use. E9: Statistical principles for clinical trials, 1998.
[4] M Schiff, M Keiserman, C Codding, S Songcharoen, A Berman, S Nayiager, C Saldate, T Li,
R Aranda, JC Becker, C Lin, PLN Cornet, and M Dougados. Efficacy and safety of abatacept or
infliximab vs placebo in ATTEST: a phase III, multi-centre, randomised, double-blind, placebo-
controlled study in patients with rheumatoid arthritis and an inadequate response to methotrexate.
Annals of the Rheumatic Diseases, 67:1096–1103, 2008.
[5] R Maini, EW St Clair, F Breedveld, D Furst, J Kalden, J Smolen, R Emery, G Harriman,
M Feldmann, and P Lipsky. Infliximab (chimeric anti-tumour necrosis factor alpha monoclonal
antibody) versus placebo in rheumatoid arthritis patients receiving concomitant methotrexate: a
randomised phase III trial. The Lancet, 354:1932–1939, 1999.
[6] R Westhovens, D Yocum, J Han, A Berman, I Strusberg, P Geusens, and M Rahman. The safety
of infliximab, combined with background treatments, among patients with rheumatoid arthritis
and various comorbidities. Arthritis and Rheumatology, 54(4):1075–1086, 2006.
[7] FC Zhang, Y Hou, F Huang, DH Wu, CD Bao, LQ Ni, and C Yao. Infliximab versus placebo
in rheumatoid arthritis patients receiving concomitant methotrexate: a preliminary study from
China. APLAR Journal of Rheumatology, 69:127–130, 2006.
[8] T Abe, T Takeuchi, N Miyasaka, H Hashimoto, H Kondo, Y Ichikawa, and I Nagaya. A
multicenter, double-blind, randomized, placebo controlled trial of infliximab combined with low
dose methotrexate in Japanese patients with rheumatoid arthritis. The Journal of Rheumatology,
33:37–44, 2006.
[9] International Conference on Harmonisation of Technical Requirements for Registration of
Pharmaceuticals for Human Use. E10: Choice of control group and related issues in clinical
trials, 2000.
[10] Mark Rothmann, Brian Wiens, and Ivan Chan. Design and Analysis of Non-Inferiority Trials.
Boca Raton, FL: Chapman and Hall/CRC.
Reference ID: 3747036

---------------------------------------------------------------------------------------------------------
---------------------------------------------------------------------------------------------------------
----------------------------------------------------
This is a representation of an electronic record that was signed electronically and this page is the manifestation of the electronic signature.
/s/
GREGORY P LEVIN 05/04/2015
RUTHANNA C DAVI 05/04/2015
THOMAS J PERMUTT 05/04/2015 I concur
Reference ID: 3747036