Embed Size (px)
Citation preview
12/10/2017
1
Statistical methods to estimate the assigned value in presence of multiple censored results
Eurachem: Portoroz, 12 October 2017
Marzia Mancin, Lisa Barco, Antonia Ricci
Marzia MancinStatistician
Food Safety Department- Risk Analysis and Public Health Surveillance Istituto Zooprofilattico Sperimentale delle [email protected]
Multiple censored data Eurachem: Portoroz, 12 October 2017
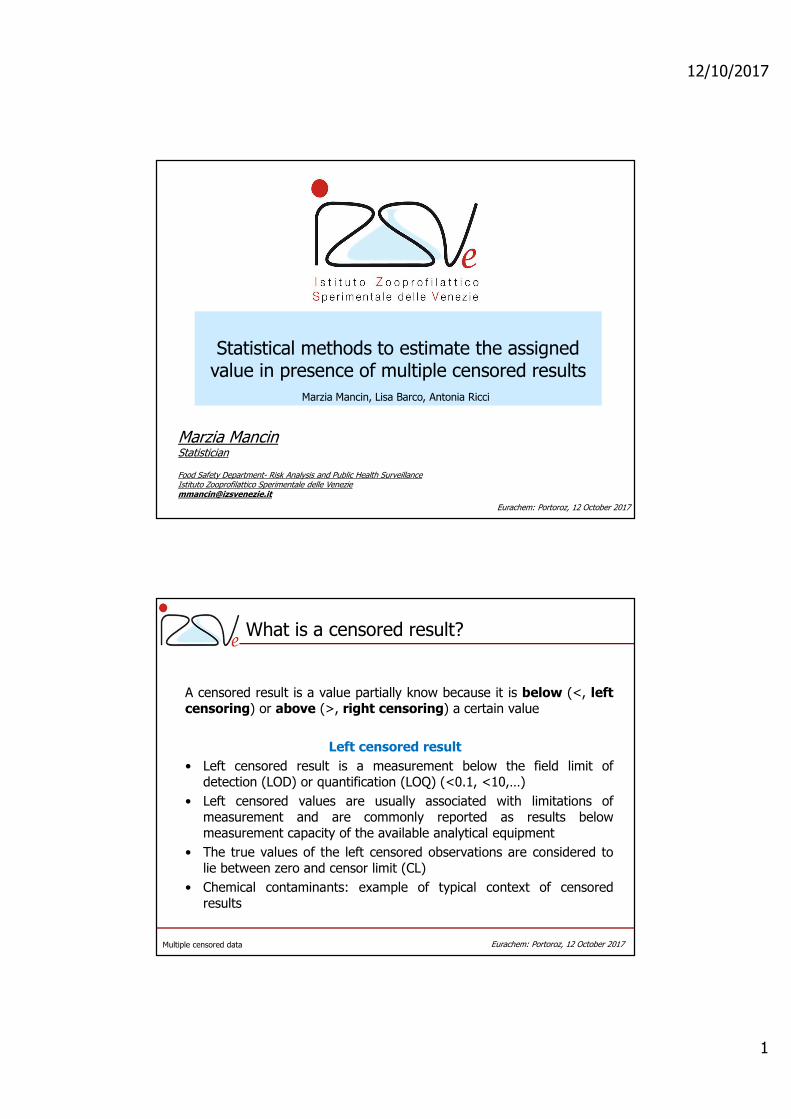
What is a censored result?
A censored result is a value partially know because it is below (<, leftcensoring) or above (>, right censoring) a certain value
Left censored result
• Left censored result is a measurement below the field limit ofdetection (LOD) or quantification (LOQ) (<0.1, <10,…)
• Left censored values are usually associated with limitations ofmeasurement and are commonly reported as results belowmeasurement capacity of the available analytical equipment
• The true values of the left censored observations are considered tolie between zero and censor limit (CL)
• Chemical contaminants: example of typical context of censoredresults
12/10/2017
2
Multiple censored data Eurachem: Portoroz, 12 October 2017
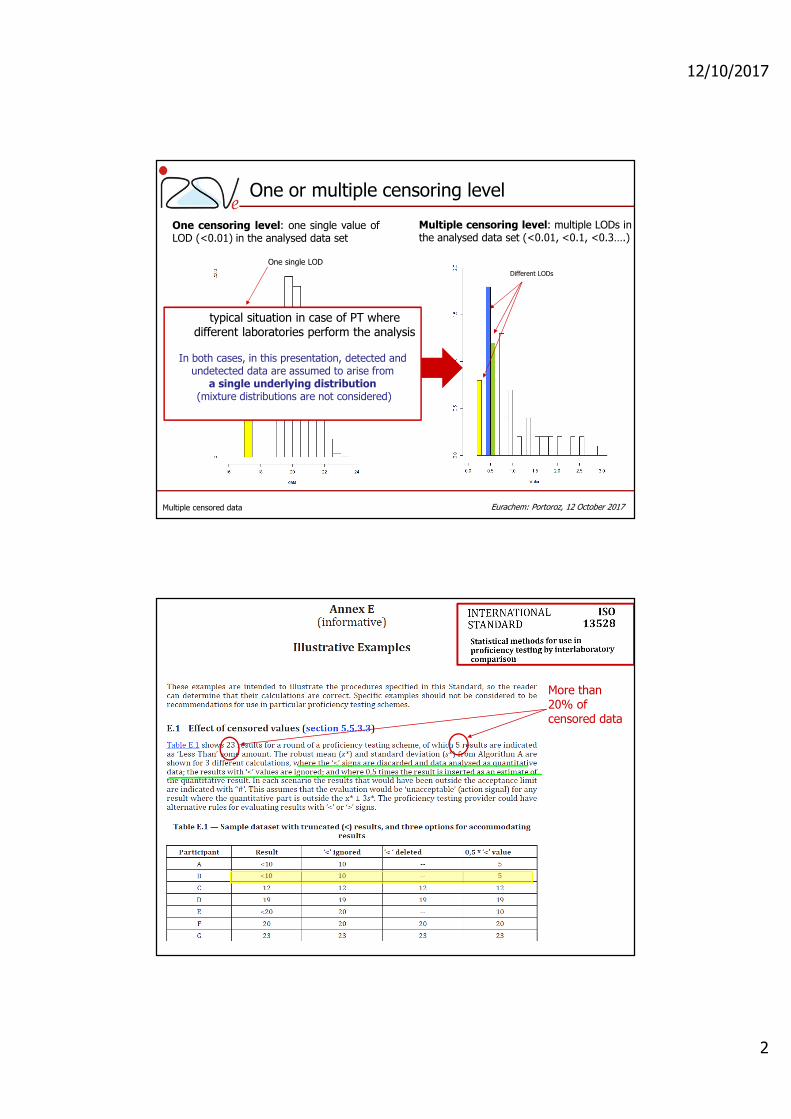
One or multiple censoring level
One censoring level: one single value ofLOD (<0.01) in the analysed data set
Different LODs
Multiple censoring level: multiple LODs inthe analysed data set (<0.01, <0.1, <0.3….)
One single LOD
typical situation in case of PT where different laboratories perform the analysis
In both cases, in this presentation, detected and undetected data are assumed to arise from
a single underlying distribution(mixture distributions are not considered)
ISO 13528: 2015
More than 20% of censored data

12/10/2017
3
1.884449 1.558581 2.24153
ISO 13528:2015
Multiple censored data Eurachem: Portoroz, 12 October 2017
Most popular statistical methods for censored results
• Substitution
• Kaplan Meier (KM): Non parametric method
• Robust regression on order statistics (ROS):
semi-parametric method
• Maximum likelihood estimation (MLE):
parametric method

12/10/2017
4
Multiple censored data Eurachem: Portoroz, 12 October 2017
Preliminary analysis of ISO 13528 data
values
10 20 30 50
4 different points of censoring(multicensored)
• Identification of distinct LOD values
• Calculation of the proportion of undetected data in the dataset
• Graphical display of the data (histogram, density plot, qqplot, cumulative
distribution)
n n.cen pct.cen min max 23.00 5.00 21.74 10.00 50.00
Multiple censored data Eurachem: Portoroz, 12 October 2017
Kaplan Meier method (KM)
KM• KM is the historical standard non parametric technique for censored data
• KM assumes that all detected and undetected data arise from the same
population but it does not require the assumption of a specific distribution to
estimate summary statistics for multiple censored dataset
• KM was originally developed for estimating the mean of right-censored (>)
survival data (S) in medical research
• KM estimates the cumulative distribution function (CDF) by accounting for
the left-censored (<) observations at each concentration
S CDF
S=1-CDF

12/10/2017
5
Multiple censored data Eurachem: Portoroz, 12 October 2017
KM: Empirical cumulative distribution function of ISO 13528 data
KM estimates the approximate proportion of concentrations below each observed level bysorting the distinct sample values, although the exact concentration of undetected data isunknown. The Kaplan Meier CDF allows to estimate the population mean and standard deviation
��� � � � Pr � �
� 1 � Pr � � � 1 � ����
�
���
CDF from KM method
Multiple censored data Eurachem: Portoroz, 12 October 2017
Kaplan Meier method (KM)
KM• KM tends to be insensitive to outliers
• KM is recommended for smaller data sets (n<50) with less than 50%
censoring and multiple censoring level
• KM IS NOT recommended for data sets with only one censoring level
(smaller than the all uncensored values)
12/10/2017
6
Multiple censored data Eurachem: Portoroz, 12 October 2017
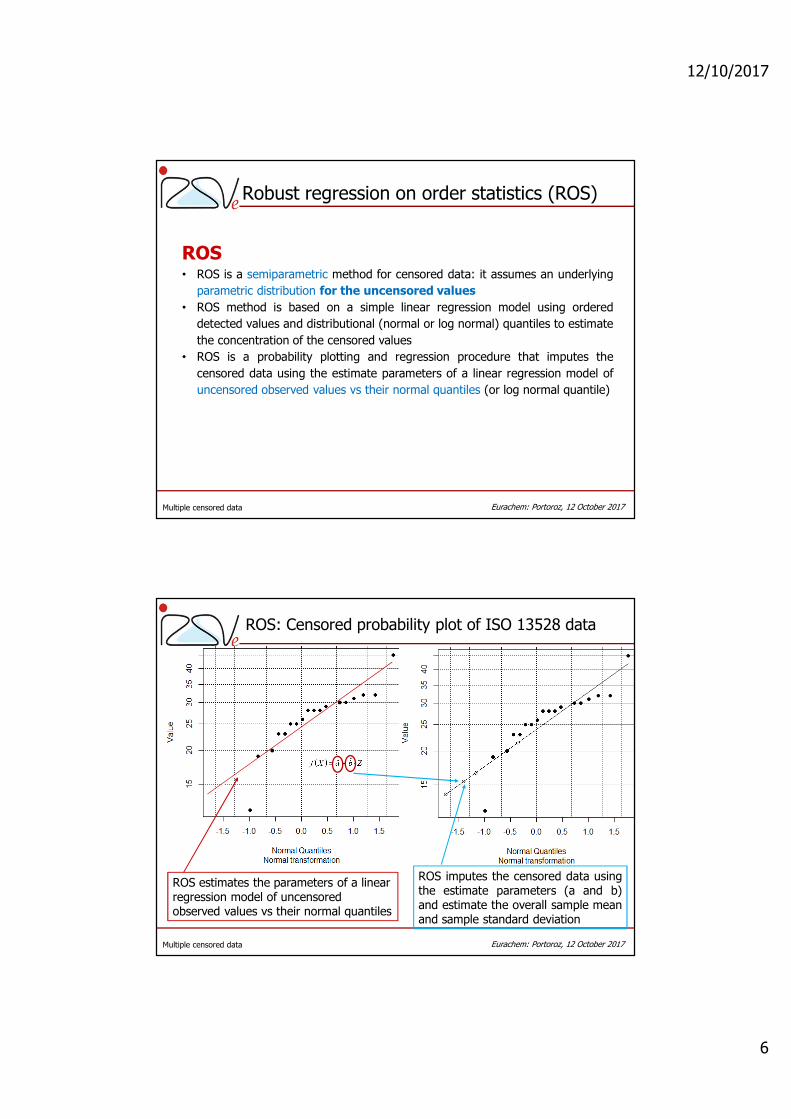
Robust regression on order statistics (ROS)
ROS• ROS is a semiparametric method for censored data: it assumes an underlying
parametric distribution for the uncensored values
• ROS method is based on a simple linear regression model using ordered
detected values and distributional (normal or log normal) quantiles to estimate
the concentration of the censored values
• ROS is a probability plotting and regression procedure that imputes the
censored data using the estimate parameters of a linear regression model of
uncensored observed values vs their normal quantiles (or log normal quantile)
Multiple censored data Eurachem: Portoroz, 12 October 2017
ROS: Censored probability plot of ISO 13528 data
ROS estimates the parameters of a linear regression model of uncensored observed values vs their normal quantiles
ROS imputes the censored data usingthe estimate parameters (a and b)and estimate the overall sample meanand sample standard deviation

12/10/2017
7
Multiple censored data Eurachem: Portoroz, 12 October 2017
Robust regression on order statistics (ROS)
ROS• The required assumption is that the response variable is a linear function
of the normal (lognormal) quantiles
• The imputated values are only used collectively to estimate summary
statistics and they are not considered estimates for specific samples
• ROS is recommended for large (n>50) data sets with less than 50%
censoring and multiple censoring level
• ROS is recommended for small (n<50) data sets with less than 80%
censoring and multiple censoring level
• ROS can be used for data sets with only one censoring level
Multiple censored data Eurachem: Portoroz, 12 October 2017
Maximum likelihood estimation (MLE)
MLE• MLE is a parametric technique and the best approach from a methodological
perspective
• Uncensored and censored data are assumed to follow a given (known)
statistical distribution such as Normal, Log-normal, Weibull, Gamma…
• The sample parameters are those estimates that maximise the likelihood
function after the definition of a parametric distribution for the data
• MLE uses uncesored observations, the proportion of censored
observations and a distributional assumption to compute estimates of
summary statistics
� � � ∏ �������� ; �)
���� ; �)= Density function
� � � ∏ ����; � ������ ����; � ����
F��� ; �)= Cumulative distribution function
Standard Likelihood function Likelihood function with left censored data
!� � Censoringindicator

12/10/2017
8
Multiple censored data Eurachem: Portoroz, 12 October 2017
Density plot comparison of parametric distributions considering the ISO 13528 data
Multiple censored data Eurachem: Portoroz, 12 October 2017
Maximum likelihood estimation (MLE)
MLE• If the assumption regarding the data distribution is realistic, this method is
accurate
• MLE is recommended for large (n>50) data sets with less than 80%
censoring and multiple censoring level
• For some authors, MLE is suggested also for small (n<50) data sets with
less than 50% censoring and multiple censoring level
• MLE can be used for data sets with only one censoring level

12/10/2017
9
Which are the resultsobtained applying thesedifferent methods to ISO
13528 data?
Multiple censored data Eurachem: Portoroz, 12 October 2017
Summary results: Mean, standard deviation, uncertainty
Sub. with CL
Sub. with 0.5*CL
KM ROS Lognormal Weibull Gaussian
mean 26.3478 23.7391 24.7878 24.88 24.7487 24.3015 24.2091
um 1.9627 1.9653 1.7770 1.8813 1.8910 1.8868 1.9838
sd 9.4128 9.4254 8.52 7.8949 10.9744 8.5676 9.0233
usd 1.6219 1.5122 1.8214 1.9141 2.4632 1.7868 2.0439
• Number of results<50• % of censored results:21.74
All statistical methods can be used: KM, ROS and MLE
Which is the best statistical method?
*Uncertainty values are obtained using bootstrap method with N=100,000 bootstrap replicates (pakage boot of R software)*Pakage NADA of R software provides KM, ROS and MLE method (MLE only for normal and log-normal distribution)*Packages Survreg of R software provides MLE methos for censored data for every distribution (weibull, gamma, normal…)

12/10/2017
10
Multiple censored data Eurachem: Portoroz, 12 October 2017
rMSE: root mean square error
rMSE is considered a measure of overall imprecision or overall accuracyrMSE is obtained from the combination of bias and precision
Bias= difference between the mean of 100,000 parameter estimates and the true value
Precision=variance of the 100,000 parameter estimates
-./0 � ��1 � ϑ3
4567.0.8� � 19 � 1 : �; � �̅ =
>
;��
5?@A � ��1 � ϑ3 =B 19 � 1 : �; � �̅ =
>
;��
Multiple censored data Eurachem: Portoroz, 12 October 2017
Precision of methods: rMSE%
KM ROS Lognormal Weibull Gaussian
mean 24.787 24.88 24.748 24.301 24.209
um 1.823 1.975 1.857 1.910 2.117
sd 8.522 7.894 10.974 8.567 9.023
usd 1.778 1.884 2.398 1.726 1.885
rMSE% 7.655 7.756 7.525 7.848 8.708
5?@A% � 5?A@� % IF rMSE is not available?
• Are information or assumptions about the data distribution available? MLE
• Aren’t? KM or ROS
Use common sense

12/10/2017
11
Multiple censored data Eurachem: Portoroz, 12 October 2017
Representation of participants’ results
Assigned value
Multiple censored data Eurachem: Portoroz, 12 October 2017
Conclusions
• The aim of statistical methods for censored data is to estimate theassigned value, standard deviation and uncertaity of the assignedvalue, taking into account that a percentage of data is not detected
• No method MUST BE used to estimate the values of censored databut only to obtain summary statistics
• No single method is unequivocally more suitable across differentscenarios (one or multiple censoring, % of censored data,knowledge about the data distribution)
• No method is recommended for data sets with more than 80%censoring (independently of the sample size)
• Statistical competence has to be integrated with qualifiedknowledge of the type of data to analyse.

12/10/2017
12
Multiple censored data Eurachem: Portoroz, 12 October 2017
Remark of a statistician
Statistic science provides mathematicalsolutions, as in the critical case of a highnumber of censored data (50-80%).
However, I believe that in the context ofPTs, the PT provider must evaluate if hewants to obtain an assigned value fromparticipants results to evaluate them, whenthe majority of the participants havenot a value to evaluate!!
THANK YOU FOR YOUR ATTENTION
‘’All models are wrong, but some models aregood approximations of the truth’’

12/10/2017
13
Multiple censored data Eurachem: Portoroz, 12 October 2017
– Method widely used in different disciplines because it is easy to implement
– Replacement of censored observation with a value between 0 and censorlimit
– Common values for substitution are 0, 0.5, square root of the censoringlimit and the censoring limit itself
– Any single value between 0 and censoring limit is arguably as good asanother (it is not a rule or a preferable value or real theoreticaljustification): to use the uniform distribution with range [0; CL] to replacethe censored data
BUT
– The simple substitution produces biased estimates of summary statisticsthat are dependent on the value being substituted especially when thenumber of censored data is not negligible (>15%)
– When the censored limit is chosen as value of substitution, an over-estimation of the mean and an under estimation of the variabilitywill occur
Substitution methods
Multiple censored data Eurachem: Portoroz, 12 October 2017
Why to have an interest in censored results?
• Statistician at the Food Safety Department- Risk Analysis and PublicHealth Unit
• Involved in risk assessment related to the consumption of foodmatrices contaminated by a given chemical substance
• A high number of left censored data at different levels of censoring
• To investigate the statistical methods to treat the left censored data
To share the knowledge, applicable in the context of PTs, where different laboratories with different LOD take part
(Example E1 Annex E, ISO 13528:2015)

12/10/2017
14
Multiple censored data Eurachem: Portoroz, 12 October 2017
Data from ISO 13528:2015 (Example E1)
1 2 3 4 5 6 7 …. 16 17 18 19 20 21 22 23
results <10 <10 12 19 20 <20 23 …. <30 30 30 31 32 32 45 <50
results 10 10 12 19 20 20 23 ….. 30 30 30 31 32 32 45 50
censored TRUE TRUE FALSE FALSE FALSE TRUE FALSE ……. TRUE FALSE FALSE FALSE FALSE FALSE FALSE TRUE
• Kaplan Meier (KM)
• Robust regression on order statistics (ROS)
• Maximum likelihood estimation (MLE):
Indicator variable for censored data
Multiple censored data Eurachem: Portoroz, 12 October 2017
Data from ISO 13528:2015
1 2 3 4 5 6 7 8 9 10 11 12 13 14 15 16 17 18 19 20 21 22 23
results <10 <10 12 19 20 <20 23 23 25 25 26 28 28 28 29 <30 30 30 31 32 32 45 <50
results 10 10 12 19 20 20 23 23 25 25 26 28 28 28 29 30 30 30 31 32 32 45 50
censored TRUE TRUE FALSE FALSE FALSE TRUE FALSE FALSE FALSE FALSE FALSE FALSE FALSE FALSE FALSE TRUE FALSE FALSE FALSE FALSE FALSE FALSE TRUE
value observed N censored
10 0 2
20 1 1
30 2 1
50 0 1
5
4 different points of censura (multicensored)
5 censored results

12/10/2017
15
Multiple censored data Eurachem: Portoroz, 12 October 2017
0.36, 0.43, 0.44, 0.51, 0.73
Simulated distribution
Non detect values
Multiple censored data Eurachem: Portoroz, 12 October 2017
One or multiple censoring levels
• One censoring level: one single value of LOD (<0.01) in the analysed data set
• Multiple censoring level: multiple LOD in the analysed data set (<0.01, <0.1, <0.3….)

12/10/2017
16
Multiple censored data Eurachem: Portoroz, 12 October 2017
One or multiple censoring level
• One censoring level: one single value of LOD (<0.01) in the analysed data set
• Multiple censoring level: multiple LODs in the analysed data set (<0.01, <0.1, <0.3….)
Censored lognormaldistribution
Lognormaldistribution
Different LODs
typical situation in case of PT where different laboratories perform the analysis
In both cases, in this presentation, detected and undetected data are assumed to arise from a single underlying population (mixture distributions are not considered)
Multiple censored data Eurachem: Portoroz, 12 October 2017
Histogram of data distribution

12/10/2017
17
Multiple censored data Eurachem: Portoroz, 12 October 2017
Statistical methods for censored results
Kaplan Meier method (KM):• KM is the historic standard non parametric technique for censored data
• KM assumes that all detect and non-detect data arise from the same
population but it does not required the assumption of a specific distribution
to estimate summary statistics for multiple censored dataset
• KM was originally developed for estimating the mean of right-censored
survival data in medical research
• KM estimates the cumulative distribution function (CDF) by accounting for
the censored observations at each concentration
Multiple censored data Eurachem: Portoroz, 12 October 2017
Statistical methods
• Parametric method: – the data follow some known distribution, such as the Normal, Log-normal, Weibull,
Gamma…
– This assumption includes data both above and below the censor limit
– Estimates are obtained using maximum likelihood methods (MLE), where theuncesored observations, the proportion of censored observations and a distributionare considered
– If the assumption regarding the data distribution is realistic, this method is accurated
• Non parametric method: – Non parametric methods are a good alternative analysis method when the assumption
about the distribution for parametric methods are not meet
– These methods focus on the ordering of the data rather than on its distribution
– The assumptions for this method are fewer, and it handles very etreme values betterthan parametric method
• Semi parametric method– They combine some of the best features of parametric estimation with some of the
best features of non parametric estimation
12/10/2017
18
Multiple censored data Eurachem: Portoroz, 12 October 2017
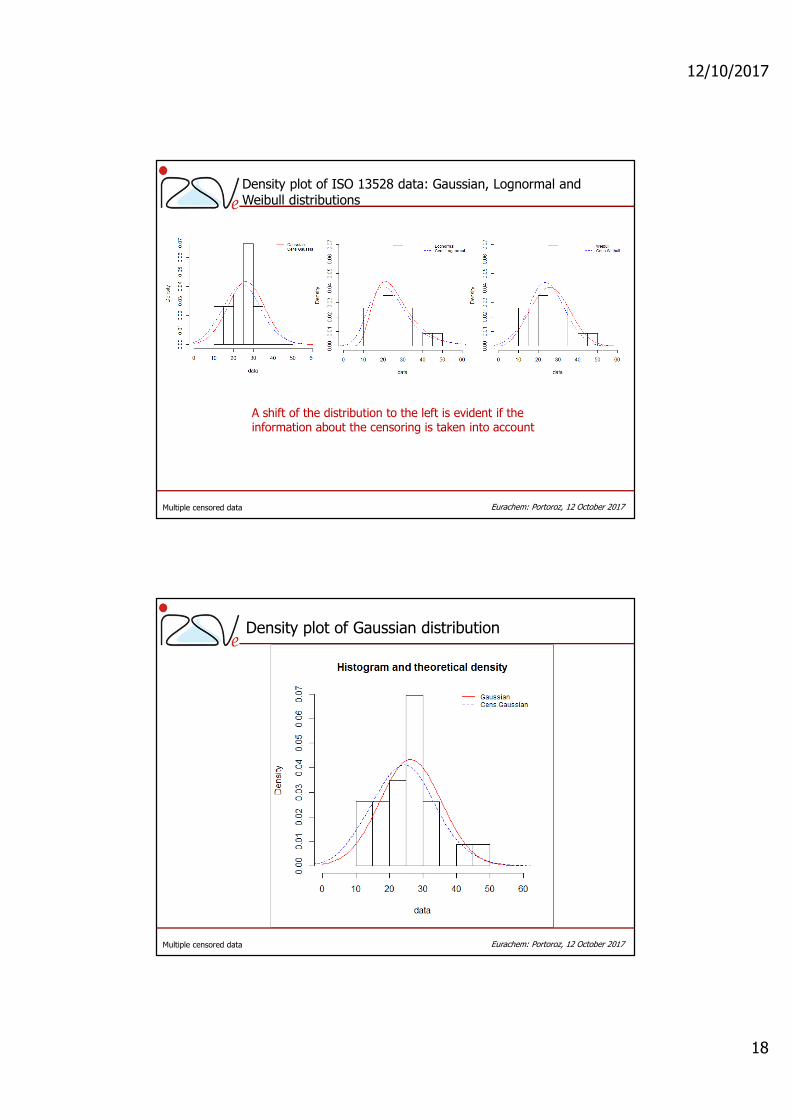
Density plot of ISO 13528 data: Gaussian, Lognormal and Weibull distributions
A shift of the distribution to the left is evident if the information about the censoring is taken into account
Multiple censored data Eurachem: Portoroz, 12 October 2017
Density plot of Gaussian distribution

12/10/2017
19
Multiple censored data Eurachem: Portoroz, 12 October 2017
Density plot of Lognormal distribution
Multiple censored data Eurachem: Portoroz, 12 October 2017
Density plot of Weibull distribution

12/10/2017
20
Multiple censored data Eurachem: Portoroz, 12 October 2017
0.36, 0.43, 0.44, 0.51, 0.73
Simulated distribution
Multiple censored data Eurachem: Portoroz, 12 October 2017
MLE: Density plot of parametric distributions

12/10/2017
21
Multiple censored data Eurachem: Portoroz, 12 October 2017
MLE: Density plot of parametric distributions
Multiple censored data Eurachem: Portoroz, 12 October 2017
0.30442290.2802350.35855240.4005104

12/10/2017
22
Multiple censored data Eurachem: Portoroz, 12 October 2017
Multiple censored data Eurachem: Portoroz, 12 October 2017
Robust regression on order statistics (ROS) is a semi-parametric method that can be used to estimate means and other statistics with censored data. Unlike Kaplan-Meier, ROS internally assumes that the underlying population is approximately normal or lognormalA dataset that is not normally distributed (symmetric bell-shaped curve) but that can be transformed using a natural logarithm so that the data set can be evaluated using a normal-theory test (Unified Guidance).. However, the assumption is directly applied to only the censored measurements and not to the full data set (hence the term ‘semi-parametric’). In particular, ROS plots the detected values on a probability plot (with a regular or log-transformed axis) and calculates a linear regression line in order to approximate the parameters of the underlying (assumed) distribution. This fitted distribution is then utilized to generate imputed estimates for each of the censored measurements, which are then combined with the known (detected) values to summary statistics of interest (e.g., mean, variance). The method is labeled ‘robust’ because the detected measurements are used ‘as is’ to make estimates, rather than simply using the fitted distributional parameters from the probability plothttp://www.itrcweb.org/gsmc-1/Content/GW%20Stats/5%20Methods%20in%20indiv%20Topics/5%207%20Nondetects.htm