Embed Size (px)
Citation preview

Purdue UniversityPurdue e-Pubs
IMPACT Publications Instruction Matters: Purdue Academic CourseTransformation (IMPACT)
2015
Statistical Literacy Social Media Project for theMassesEllen GundlachPurdue University, [email protected]
Clarence MaybeePurdue University, [email protected]
Kevin O'SheaPurdue University, [email protected]
Follow this and additional works at: http://docs.lib.purdue.edu/impactpubs
Part of the Scholarship of Teaching and Learning Commons
This document has been made available through Purdue e-Pubs, a service of the Purdue University Libraries. Please contact [email protected] foradditional information.
Recommended CitationGundlach, Ellen; Maybee, Clarence; and O'Shea, Kevin, "Statistical Literacy Social Media Project for the Masses" (2015). IMPACTPublications. Paper 2.http://docs.lib.purdue.edu/impactpubs/2
Statistical Literacy Social Media Project for the Masses
Ellen Gundlach, Purdue University
Clarence Maybee, Purdue University
Kevin O’Shea, Purdue University
Abstract
This article examines a social media assignment used to teach and practice statistical literacy with over
400 students each semester in large-lecture traditional, fully online, and flipped sections of an introductory-level statistics course. Following the social media assignment, students completed a survey
on how they approached the assignment. Drawing from the authors’ experiences with the project and the
survey results, this article offers recommendations for developing social media assignments in large
courses that focus on the interplay between the social media tool and the implications of assignment prompts.
Overview and purpose of the project
With the rise of mobile computing, learners are coming to campus equipped with powerful devices that
are capable of farther-reaching engagement and interaction than prior generations. Harnessing those
devices through the use of social media in a curriculum can be a challenge for any instructor, requiring thoughtful planning of purposeful activities, facilitation of discussion, and technical considerations for the
scope and scale of the course. In this article, we describe a social media statistical literacy project used in
a large, introductory-level course. We then analyze the results of a survey conducted to examine student work habits and attitudes on this project. Finally, we discuss the benefits and drawbacks of using social
media, assignment writing and grading challenges for large classes with various delivery methods, and
our university’s solution for using social media for academic purposes.
The Goal: Statistical Literacy
Statistics and Society is an introductory-level statistical literacy course primarily for liberal arts majors
but taken by other students to meet information literacy and science, technology and society core curriculum criteria. The goal of this class is to teach the students to become informed consumers of
statistics and to understand how statistics are used in their daily lives. Statistical literacy does not involve
lengthy calculations but is defined as “being able to take information and explain it, judge it, evaluate it, and make decisions based on that information” (Rumsey, 2002). Best practices for statistical education
include using active learning and real-life situations (Aliaga et al., 2005). In this class, the students learn
how to discuss mixed media (articles, videos, websites, and podcasts, for example) that use statistical
results, determining whether the data were collected correctly, what lurking variables should be considered, the appropriateness of the analysis techniques and graphs used, and whether the author
correctly interpreted the research conclusions (e.g., causation vs. correlation). Students learn how to use
logical, critical thinking and to be confident and empowered when asking questions to authority figures (including physicians, politicians, reporters, and corporate leaders) about the detailed evidence for their
claims. If statistical literacy is important, then effective assessments which give students opportunities to
learn and practice statistical literacy skills are needed (Garfield, 1994).
The Challenges: Large Course and Multiple Delivery Formats

2
The statistical literacy course has over 400 students each semester, and these students are split between
large-lecture traditional sections (over 300 students), fully online sections (approximately 80 students), and flipped sections (approximately 60 students). The traditional section students attend the large lecture
class twice per week and smaller-group recitation once per week. The fully online section students only
see their instructor for proctored exams—all lecture material and coursework are done online. The flipped
section students have online lectures and some online work, but they meet with their classmates and instructor one day per week for group work and hands-on activities to reinforce the concepts taught in the
online lectures. All sections are closely coordinated with the same lead instructor, lectures (whether
online or in person), assignments, and exams.
Effective assessments should be well-integrated into the course and provide constructive feedback
(including peer and self-review), opportunities for higher-order thinking, and clear guidelines with
consistent and fair grading (Chance, 1997). The challenge lies in how to incorporate effective assessments involving writing and creativity into classes with hundreds of students. Equal opportunity for peer
discussion for students in the traditional, online, and flipped sections was also an important consideration.
For this course, graduate student teaching assistants, many of whom are new to teaching and to this type
of assignment, are responsible for the grading. A clear rubric needed to be presented to students and the teaching assistants.
Social Media: Benefits and Concerns
Social cognitive theory suggests that peer review is important because it allows students to see other
students doing the same work and allows discussion with those peers and introspection into the students’
own work (Hall & Vance, 2010). Hall and Vance also commented on how the online environment is ideal for peer and self-review because even shy students will feel more comfortable participating fully. In our
case, using social media to promote discussion would also provide equal access for students in the
traditional, online, and flipped sections of the course.
Since the students are learning how to become statistically literate, informed consumers who will feel comfortable asking about the statistics they will see in their daily lives, it is important to give them an
opportunity to practice conversations with their peers about these concepts in ways that feel natural to
them. Social media is a part of the daily lives of the Millennial generation of students (Everson, Gundlach, & Miller, 2013). Typically, these Millennial students share interesting links and have
discussions about those stories and videos on social media with friends and family already. We want them
to develop habits of sharing and discussing the statistical concepts they encounter in the media, too.
Privacy is a major component to consider when employing social media in an academic setting. Teaching with social media requires a balance between the ease of use of technology and ensuring the protection of
student information. Faculty should also consider the “creepy tree house” phenomena, an idiom that
describes the unwelcome blending of academic and personal social media activities (Jones, 2010). Another concern about using commercial social media such as Facebook is that the students would be
inundated with advertisements not endorsed by the university or the instructor while doing their academic
assignment.
When incorporating social media into the classroom, faculty should consider how they can ensure that
student information (intentionally or unintentionally) is not available and readable to anyone not enrolled
in the course. The Family Education Rights and Privacy Act (FERPA) (20 U.S.C. § 1232g; 34 CFR Part
99), requires institutions to protect and safeguard student education records. Instructors interested in utilizing social media externally hosted from the institution should note that content created through those
digital tools do not, typically, fall under protected FERPA guidelines. Due to the varying interpretation of
3
FERPA, it is important to review your institution’s specific policy and guidelines related to social media
use.
Mixable: One University’s Solution to Social Media Concerns
Mixable is an online discussion tool that uses a social feed for user interaction and collaboration. Developed in 2010 at Purdue University, the idea for Mixable emerged from faculty and student
feedback. Collaborative partners and instructors were dissatisfied with the limiting features and aspects of
the traditional forum structure of learning management systems (LMS). Most LMS solutions allowed for
class discussion, but with very limited mobile or multimedia functionality, making usage cumbersome for instructors and students.
Members of the central information technology organization, ITaP, conducted a focus group with students
at Purdue. The team wanted to learn more about their mobile technology habits and the tools that they were using on their own time. Facebook was overwhelmingly the most used application and considered
an essential part of their social contact (Bowen, Brown, Sparrow, & Young, 2011). However, when asked
about the social connection, the same panel of students had no desire to connect with their instructors or
their peers as friends or followers on Facebook. This feedback confirmed to our team that something in the flow and structure of Facebook was intuitive to users; however, it was very clear that students wanted
to avoid the “creepy tree house.”
Mixable uses Facebook’s feed structure for social discussion for individual courses, but avoids the concept of “friends” altogether. Users can quickly write text, share links, or upload files through the status
update box at the top of the feed. The feed is structured to sort by the latest post or comment. Each post in
the feed can be commented or liked by all users of the group. Mixable automatically populates groups by a student or instructor’s enrollment in courses through synched information from the Office of the
Registrar. Each student or instructor will see the current courses for that specific semester in which they
are enrolled, which provides a social connection for each student to their peers without the forced
connection on personal applications or networks. Mixable also allows users to create their own custom study sessions, learning communities, or co-curricular groups as needed. Since Mixable is a purely
academic tool, no ads appear on the screen while the students are working on the assignment.
To connect to a course, users have to agree to a FERPA privacy agreement, which ensures that users are aware that by creating posts, comments or likes, other users in the group will know that they are enrolled.
This is meant to be a transparent method of privacy settings for our users.
The Mixable Statistical Literacy Assignment
To give students more experience researching and discussing statistical claims with their peers, an
assignment was created (Appendix A) which had the students find an online article, video, or podcast that
reported on either an observational study (similar to a survey) or an experiment (where a treatment is applied to the individuals). A goal of this assignment is to show students that both good and bad uses of
statistics are present in their everyday lives in a wide variety of subjects. The students had to discuss eight
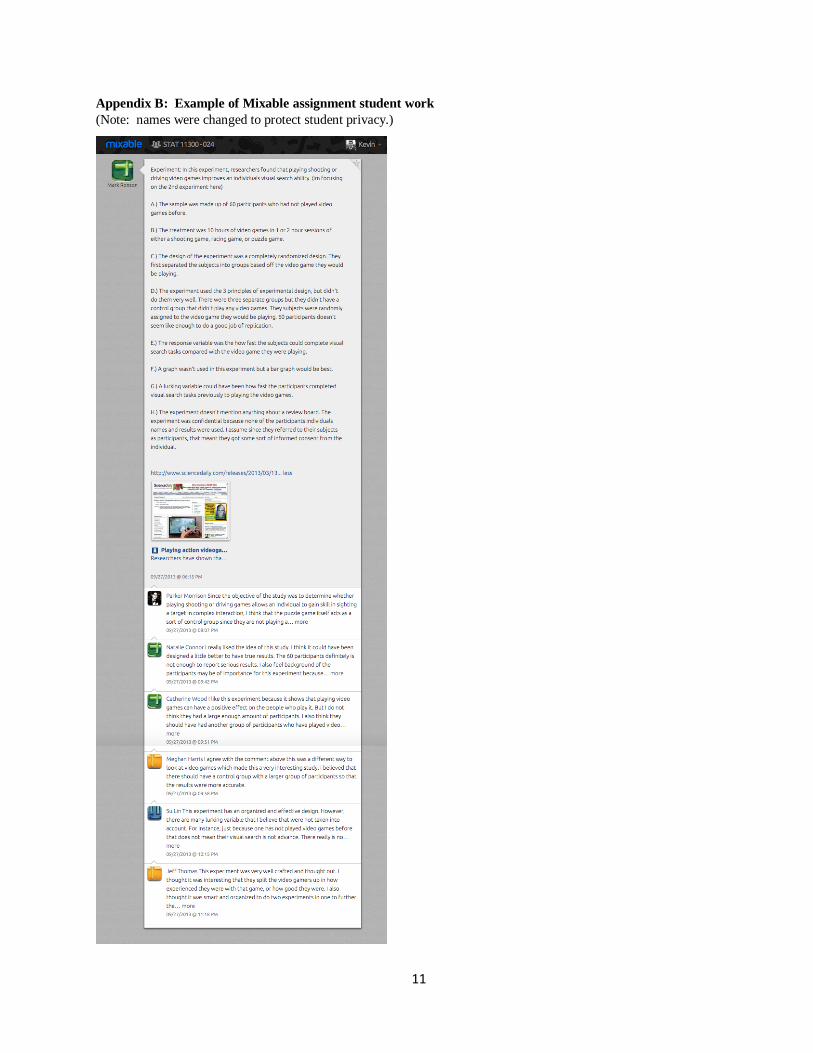
key features of their link and make four “statistically intelligent” comments on their peers’ posts to further the discussion (Appendix B). The key features included determining how the data was collected, if any
lurking variables might be important even though they weren’t considered by the researcher, whether a
cause-and-effect relationship is present, what specific variables were measured, what the sample design
was, and if there are any potential ethical or bias issues. Students are shown examples of “statistically intelligent” comments and unacceptable comments. A rubric for grading is included in the assignment
instructions. A rule about no duplicate links allowed within a section is included so that there will not be
4
twenty copies of the first person’s post. This rule encourages students who post early to serve as examples
to their more timid peers because the early posters do not have as much concern about finding a link another student has previously found. The teaching assistants are required to make model posts at the
beginning of the semester to show the students what to do and to start the online class discussion.
Statistics educators value students being able to read about science in the media, but learning which topics
students find compelling and engaging is also valuable. As Rumsey (2002) pointed out, the students may not be interested in the same topics as their instructors. The instructor can even use what the students post
as future lecture and exam stories.
Student Feedback on the Assignment
After completing the Mixable statistical literacy assignment in the Fall 2013 semester, students were sent
a link to a Qualtrics online survey, which asked them questions about their thought processes at different stages of the assignment. Students who completed the Mixable assignment were given class participation
points for doing the survey, which counted for less than 0.5% of their overall course grade. The purpose
of the survey was to understand how students approach the Mixable assignment. Out of the 421 total
students taking the course that semester, 405 students (96.2%) completed the survey.
The survey included yes/no, Likert-scale type, and open-ended questions about the students’ experience
of the Mixable assignment. The answers to the open-ended questions were examined using thematic
analysis. This procedure involved familiarization with data, generating initial codes, and searching for and reviewing the themes among codes. For the open-ended questions, multiple answers were allowed.
Question: When did you start working on the Mixable assignment?
Students generally (90.2%) waited until at least the third week of the semester to start the assignment. The statistics concepts necessary for the assignment were taught in the first three weeks of the semester.
“Starting the assignment” might mean the first time they read over the assignment instructions, when they
started looking for a suitable online story, when they did their writing, or when they made their post in
Mixable. Only 7.6% of the students admitted to starting the assignment the day it was due. When asked why they chose their starting time for this assignment, students were generally most concerned (69.6%)
with managing their time for this project and their other coursework.
Question: What search terms did you use to search for articles for the assignment?
Over half (53.2%) of the students searched generally for “research studies,” “observational study,” or
“experiment,” while 33.2% of the students chose a specific topic (like breast cancer or chocolate). Only
2.2% of students casually browsed news or other sites.
Question: What did you learn or find interesting from reading other people’s posts?
Many of the students (40.4%) mentioned learning more about statistics, either conceptually or simply due
to prevalence in many applications. In other words, they learned about the many ways that they will see
statistics used every day in the world around them. A quarter (25.1%) of the students were interested in the article topics posted by their classmates, and 19.5% of the students were impressed with the variety of
comments given by their classmates.
Question: Did you feel comfortable correcting other people’s conclusions?
5
Almost half (49.6%) said that they felt comfortable or very comfortable making comments. A third of the
class (33.7%) was neutral. Only 16.1% of the students expressed that they felt uncomfortable or very uncomfortable correcting the posts of their fellow students. Of the students who were uncomfortable, their
reasons included worry about offending others (18.8%), not liking to criticize others (17.2%), not having
enough confidence (17.2%) or feeling unqualified to judge the work of their peers (14.1%).
Question: Did you go back and read the comments others made on your posts?
While all students were required to make four “statistically intelligent” comments on each other’s posts,
the students were not required to read or respond to what other students wrote on their own posts.
However, the majority of students (75.9%) did read what their peers wrote. To some degree, this may be related to the students’ timing on doing the assignment.
For the students who did read the comments that other students wrote about their posts, many of them
(28.9%) found others’ perspectives on their posts interesting, and 23.4% of them said that others found errors in the original post. While 17.2% of the students learned new information from what their
classmates commented, 21.1% found that their classmates agreed that they had done well. While each
student was required to make four comments on other students’ posts, 4.9% of students found no
comments on their post.
For the 24.1% of students who did not look at what other students had commented on their posts, almost
half (48.4%) either forgot or did not have time to check due to other time constraints. Only 18.7% of
students said they weren’t interested, but 11.0% said that since the assignment was done there was no reason to look at the comments. Interestingly, 7.7% were afraid of reading any criticism of their work.
The students who did not check their fellow students’ comments are missing out on the opportunity to
learn from their peers’ perspectives.
Recommendations for Developing Social Media Assignments in Large
Courses
Biggs (1990) outlines the difference between surface and deep learning. The motive for surface learning
is extrinsic with a strategy of doing what is necessary to get a good grade on an assignment. The motive
for deep learning is intrinsic with a strategy of learning for greater understanding and wanting to discuss and reflect on what has been learned. Biggs discusses intrinsic motivation as an “ownership” of an idea by
the student so that the student has an urge to share this idea with others. This deep, intrinsic learning is the
goal of this assignment. The instructor wanted students to not only understand the basic concepts but to seek out their use in the general media and want to discuss what they have learned with their peers. Social
media provides an environment that may afford this kind of learning. While some of the same
considerations may come into play in small courses, we recognize that making use of the benefits of
social media may be challenging in courses with a large number of students. Drawing from our experiences of the project and the student feedback from the survey, in this section we will discuss
aspects to consider when designing a social media assignment, particularly focusing on the implications
of implementing this type of assignment in a large course.
As outlined in Table 1, developing an effective social media assignment for use with large classes
requires consideration of the interplay between the social media tool and the assignment prompts. Of
particular importance is the selection of the social media tool, which we argue needs to allow the
discussion to be limited to those involved in the course, such as the students, teaching assistants, and instructor. However, the tool also needs to provide a structure that allows for the communication to take
place in a similar way to social media tools the students may be familiar with in their everyday lives. The
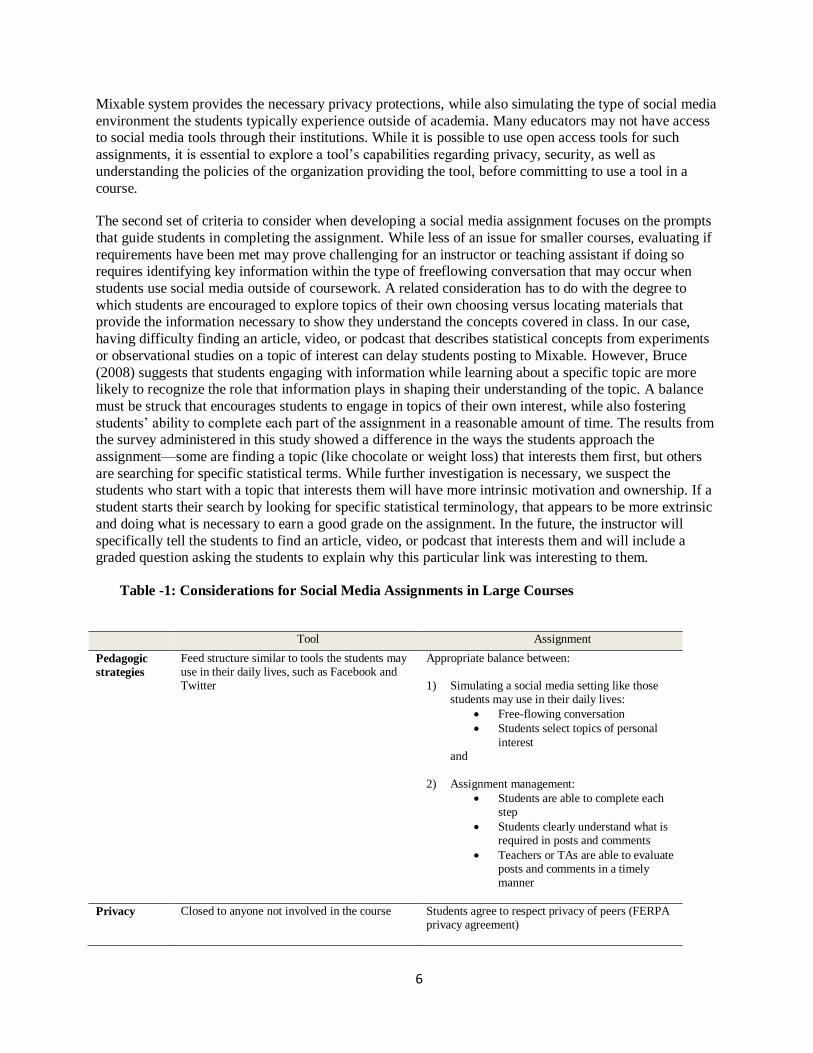
6
Mixable system provides the necessary privacy protections, while also simulating the type of social media
environment the students typically experience outside of academia. Many educators may not have access to social media tools through their institutions. While it is possible to use open access tools for such
assignments, it is essential to explore a tool’s capabilities regarding privacy, security, as well as
understanding the policies of the organization providing the tool, before committing to use a tool in a
course.
The second set of criteria to consider when developing a social media assignment focuses on the prompts
that guide students in completing the assignment. While less of an issue for smaller courses, evaluating if
requirements have been met may prove challenging for an instructor or teaching assistant if doing so requires identifying key information within the type of freeflowing conversation that may occur when
students use social media outside of coursework. A related consideration has to do with the degree to
which students are encouraged to explore topics of their own choosing versus locating materials that provide the information necessary to show they understand the concepts covered in class. In our case,
having difficulty finding an article, video, or podcast that describes statistical concepts from experiments
or observational studies on a topic of interest can delay students posting to Mixable. However, Bruce
(2008) suggests that students engaging with information while learning about a specific topic are more likely to recognize the role that information plays in shaping their understanding of the topic. A balance
must be struck that encourages students to engage in topics of their own interest, while also fostering
students’ ability to complete each part of the assignment in a reasonable amount of time. The results from the survey administered in this study showed a difference in the ways the students approach the
assignment—some are finding a topic (like chocolate or weight loss) that interests them first, but others
are searching for specific statistical terms. While further investigation is necessary, we suspect the students who start with a topic that interests them will have more intrinsic motivation and ownership. If a
student starts their search by looking for specific statistical terminology, that appears to be more extrinsic
and doing what is necessary to earn a good grade on the assignment. In the future, the instructor will
specifically tell the students to find an article, video, or podcast that interests them and will include a graded question asking the students to explain why this particular link was interesting to them.
Table -1: Considerations for Social Media Assignments in Large Courses
Tool Assignment
Pedagogic
strategies
Feed structure similar to tools the students may use in their daily lives, such as Facebook and Twitter
Appropriate balance between:
1) Simulating a social media setting like those students may use in their daily lives:
Free-flowing conversation
Students select topics of personal
interest and
2) Assignment management:
Students are able to complete each step
Students clearly understand what is required in posts and comments
Teachers or TAs are able to evaluate posts and comments in a timely manner
Privacy Closed to anyone not involved in the course Students agree to respect privacy of peers (FERPA privacy agreement)
7
The survey suggests that most students in this class found the assignment to be a positive experience
where they learn about uses of statistics in the world and constructively discuss statistical concepts with each other. With careful consideration, it is certainly feasible to design successful social media
assignments for large courses.
References
Aliaga, M., Cobb, G., Cuff, C., Garfield, J., Gould, R., Lock, R., …Witmer, J. (2005). Guidelines for
assessment and instruction in statistics education: College report. Alexandria, VA: American
Statistical Association. Retrieved from http://www.amstat.org/education/gaise/
Biggs, J.B. (1990), Teaching: Design for learning. In B. Ross (Ed.), Teaching for Effective
Learning: Papers presented at the sixteenth annual conference of the Higher Education Research
and Development Society of Australasia (HERDSA). Campbelltown, N.S.W.: HERDSA
Bowen, K., Brown, J., Sparrow, J., & Young, L. (2011, April). Teaching and learning: Four perspectives.
Panel presentation given at Mobile Computing: A 5 Day Sprint webinar hosted by Educause.
Retrieved from http://www.educause.edu/library/resources/teaching-and-learning-four-
perspectives
Bruce, C. S. (2008). Informed Learning. Chicago, IL: American Library Association.
Chance, B. (1997). Experiences with authentic assessment techniques in an introductory statistics
course. Journal of Statistics Education, 5(3). Retrieved from www.amstat.org/publications/jse/v5n3/chance.html
Everson, M., Gundlach, E., & Miller, J. (2013). Social media and the introductory statistics course.
Computers in Human Behavior, 29(5), A69-A81. Retrieved from http://www.sciencedirect.com/science/article/pii/S07475632120037555
Family Educational Rights and Privacy Act of 1974, 20 U.S.C. § 1232g; 34 CFR Part 99.
Garfield, J. (1994). Beyond testing and grading: Using assessment to improve student learning.
Journal of Statistics Education, 2(1). Retrieved from www.amstat.org/publications/jse/v2n1/garfield.html
Hall, S. & Vance, E. (2010). Improving self-efficacy in statistics: Role of self-explanation &
feedback. Journal of Statistics Education, 18(3). Retrieved from http://www.amstat.org/publications/jse/v18n3/hall.pdf
Jones, J. B. (2010, March 9). The Creepy Treehouse Problem. Chronicles of Higher Education.
Retrieved from http://chronicle.com/blogs/profhacker/the-creepy-treehouse-problem/23027
Rumsey, D. J. (2002). Statistical literacy as a goal for introductory statistics courses. Journal of Statistics Education, 10(3). Retrieved from
www.amstat.org/publications/jse/v10n3/rumsey2.html
8
Appendix A: Fall 2013 Mixable Assignment
Big picture: You will need to post 1 unique article/explanation about an experiment OR 1
unique article/explanation about an observational study. You also must make 4 statistically
intelligent and valid comments on other people’s posts. These comments should be split between
observational studies and experiments. Read over the entire document to get the details of
exactly what is required. Each article/explanation is worth up to 25 points, and each statistically
intelligent comment that helps the discussion move forward is worth 5 points. The whole
assignment is worth 45 points.
Statistics are everywhere in the media. Some are used well, and some are not. As part of the goal
of this course, you will become a savvy media statistics consumer. This project is not meant to
be completed in one night. You are expected to be keeping your eyes open for statistics in the
media over the whole semester.
Please note that the articles must be news stories—they cannot be course materials designed to
teach statistical methods. The stories do not have to be recent. Your posting has to be UNIQUE.
It won’t count if another student has posted a link to the same story or if Ellen has used it in her
lecture notes. This means a Washington Post story about a research project will count as exactly
the same as an MSNBC story about the same research. You will have to read what the other
students have posted and written to make sure that your posting is unique. We will check
postings across sections, too, to make sure you aren’t sharing posts with students in other
sections.
For your topic below, post the following on Mixable in the appropriate “Observational
Study” or “Experiment” breakout group:
1. A link to the website or an upload of a relevant file.
2. The requested explanation or calculation. (See page 3.)
3. Format your post like this: “Observational study: In this article, Gallup polled 200
people about…” so that it is clear to everybody which topic you have chosen from the
list.”
4. Use the Tag feature on Mixable to tag your post (very important!). Tag with either
“Observational study” or “Experiment” in the topic title (no quotation marks necessary).
Then we can search for all the observational studies at one time and then all the
experiments. This will help you check that nobody else has posted the same link that you
have.
Commenting on other people’s posts: You are also required to make at least 4 comments on
posts from other people. (Note: Only 1 comment per person per post will receive credit, so don’t
try to do 4 comments on just 1 post. The goal is to get you reading and commenting on lots of
different posts.) These comments must be thoughtful, indicate that you have thoroughly read the
article and any previous comments on that article, and must add to the level of discussion on the
statistical concepts. Balance your comments between the experiment articles and the
observational study articles. The instructor may post articles also, and comments on those
articles are acceptable for earning your discussion points. Just as with everything we do in this

9
course, please keep in mind that it’s important to be respectful of each other and to engage in
professional dialogue.
Examples of bad comments on posts which did not receive credit:
“This was an interesting article. It reminded me of junior high days.”
“I love everything that has to do with monkeys and I find the way they act to be
fascinating. It is so crazy to me that they are such an intelligent species, and act SO
similarly to humans.”
“This was a great experiment.” (This is an especially bad comment if the article was
actually about an observational study, and you didn’t catch it! Not all the students who
post articles will label them correctly, and you should be on the lookout for that.)
Examples of good comments on posts which did receive credit:
“You didn't label this post, but I'm pretty sure you meant to label it “Experiment” based
on your discussion. Anyway, this is definitely not an experiment. It is an observational
study. No treatments were applied. It's true that they gave everyone a hearing test, but
that was simply a method of collecting data since you can't just ask everyone if they have
hearing problems and get reliable feedback. They didn't divide the people tested into
groups and give them any sort of different treatment to see if there was an effect on the
outcome. In other words, they were just looking for the data for a single variable as it
was, as opposed to changing another variable to see what it's affect on the measured
variable would be.”
“This graph is interesting, but pretty hard to read. I had to look very closely to see if red
was used in more than one place. I like that it is interactive, but it is difficult to put your
cursor over the extremely thin red lines. I wonder why it raised back up in the 1940's? I
do find it interesting how drastically the name popularity has declined over the years. It
hasn't become popular again. The graph shows that for the majority, the name has been
on a decline.”
You should check back on your original posts periodically to see if your instructor or fellow
students had questions/comments for you to answer.
See the course schedule for due dates. It is strongly recommended that you do not wait until
the last minute to try to find these links to articles. Since your article needs to be unique (stories
not posted by any other student) and your comments on other students’ postings need to be
thoughtful, it is to your advantage to work steadily all semester on these. With the uniqueness
requirement, this assignment will be much easier for the people who get an earlier start!
Here are the details on the articles/discussions you need to post (choose only ONE):
1. Observational study:
a. How was the sample collected? Use the appropriate statistics terminology
(simple random sample, stratified random sample, voluntary
response/convenience sample, etc.).
b. What is the sample size?

10
c. What was the response rate?
d. What variables were measured? Are these variables categorical or quantitative?
e. Were the results displayed in a graph? If so, what type of graph was used? If not,
what type of graph would be appropriate for displaying this data?
f. What are potential sources of bias? Use appropriate statistics terminology
(nonresponse, response bias, undercoverage) and explain your reasoning.
g. What could be done to improve this study?
h. How could you turn this observational study into an experiment? Would it be
appropriate?
2. Experiment:
a. Who or what is in the sample? What is the sample size?
b. What is/are the treatment(s)?
c. What is the design of the experiment? Is it one we learned (completely
randomized design, randomized block design, matched pairs) or something else?
Explain your answer.
d. Were the 3 principles of good experimental design (randomization, replication,
comparison/control group) used? Give examples to explain your answer.
e. What are the response variables? Are these variables categorical or quantitative?
f. Were the results shown with a graph? If so, what type of graph was used? If not,
what type of graph would be appropriate for displaying this data?
g. What are some potential lurking variables? Explain your reasoning.
h. Is there any indication that the researchers used the 3 principles of ethical
experiments with humans (informed consent, confidentiality, review board) or the
3 principles of ethical experiments with animals (reduction, refinement,
replacement)? Explain your answer.
(CHOOSE ONE TOPIC OR THE OTHER, NOT BOTH. An appropriate, unique article is worth
9 points, each question for that topic is worth 2 points, for a total of 25 points for your article
post. Each statistically intelligent comment you make that furthers the discussion is worth 5
points, for a total of 20 points for your 4 comments.)
11
Appendix B: Example of Mixable assignment student work
(Note: names were changed to protect student privacy.)