Embed Size (px)
Citation preview
Statistical Inference: Which Statistical Test To Use?
Pınar Ay, MD, MPH
Marmara University School of Medicine
Department of Public Health

At the end of the session the participants will be able to:define bias and random errorexplain how statistical inference is determinedlist the steps of hypothesis testingdifferentiate parametric and non-parametric testschoose the appropriate statistical test
Learning Objectives

There was an economic crisis with nearly 9 million unemployed people…
The candidates for the elections were
Franklin Delano Roosevelt and Alfred Mossman Landon
Presidential Elections in USA,1936

The Literary Digest made one of the largest polls ever conducted.
Approximately 2 300 000 prospective voters filled in the questionnaires.
Findings of the poll
Roosevelt: %43 Landon:%57
Findings of the poll
Roosevelt: %43 Landon:%57

Literary Digest was not accurate in predicting the winner
BUT
George Gallup was able to predict a victory
for Roosevelt using a much smaller sample
of about 50 000 people.
Actual Results: Roosevelt:62%, Landon: 38%!!!

Selection bias
Literary Digest chose the prospective voters from the subscription list of the magazine, from automobile registration lists, from phone lists, and from club membership lists.
BIASAny systematic error in the design, conduct or analysis of a study that
results in a distorted estimate
BIASAny systematic error in the design, conduct or analysis of a study that
results in a distorted estimate

What is the proportion of red colored candies in the jar?
Take a sample of 25 candies:
1st sample: 40%2nd sample: 60%3rd sample: 20%
Take a sample of 25 candies:
1st sample: 40%2nd sample: 60%3rd sample: 20%
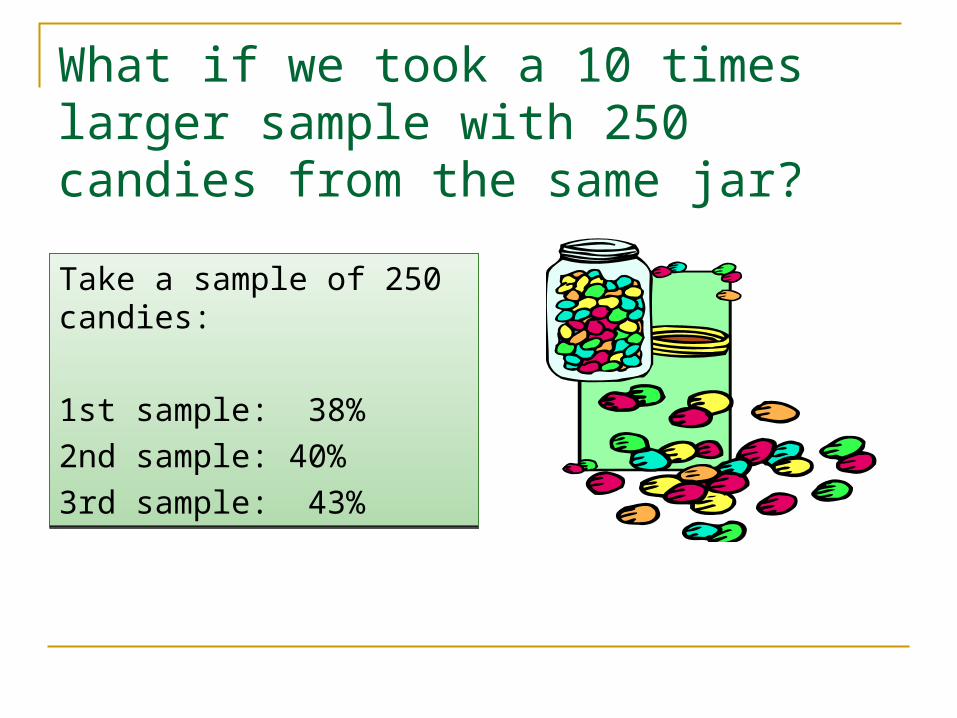
What if we took a 10 times larger sample with 250 candies from the same jar?
Take a sample of 250 candies:
1st sample: 38%
2nd sample: 40%
3rd sample: 43%
Take a sample of 250 candies:
1st sample: 38%
2nd sample: 40%
3rd sample: 43%

Errors in Epidemiology:
1. Bias: any trend in the collection, analysis, interpretation, publication or review of data that can lead to conclusions that are systematicly different from the truth 2. Random error: the variation in a sample that can be expected to occur by chance

Estimating Random Error
The sample of 25 candies:
1st sample: 38% (95%CI: 21%-61%)
2nd sample: 40% (95%CI: 29%-79%)
3rd sample: 43% (95%CI: 7%-41)
The sample of 250 candies provides a better precision
40% (95%CI: 34%-46%)40% (99%CI: 32%-48%)
The sample of 250 candies provides a better precision
40% (95%CI: 34%-46%)40% (99%CI: 32%-48%)

Estimating random error
We need to indicate the variability the estimate would have in other samples.
Confidence Intervals (CI):CIs define an upper and a lower limit with an associated probability.The ends of the CI are called confidence limits.

Statistical Inference
There are two approaches for statistical inference:1.Estimating parameters
2.Testing hypothesis
Make certain assumptions about the population and then use probabilities to estimate the likelihood of the results obtained in the sample.
Make certain assumptions about the population and then use probabilities to estimate the likelihood of the results obtained in the sample.
assume a random sample has been
properly selected.

Hypothesis Testing
Steps:
1.State the hypothesis
2.Decide on the appropriate statistical test and select the level of significance
3.Perform the test and draw a conclusion
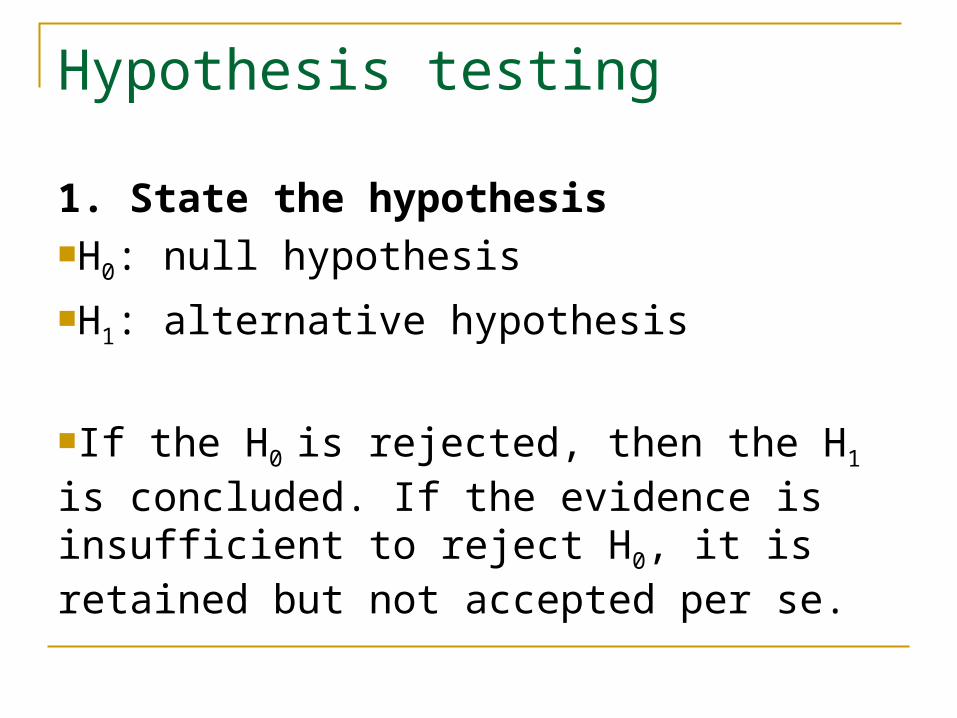
Hypothesis testing
1. State the hypothesisH0: null hypothesis
H1: alternative hypothesis
If the H0 is rejected, then the H1 is concluded. If the evidence is insufficient to reject H0, it is retained but not accepted per se.

Hypothesis testing
2. Decide on the appropriate statistical test and select the level of significanceThe level of significance when chosen before the statistical test is performed is called the alpha level.
Alpha level: The probability of incorrectly rejecting the null hypothesis when it is actually true. (0.05, 0.01, 0.001)
Alpha level: The probability of incorrectly rejecting the null hypothesis when it is actually true. (0.05, 0.01, 0.001)

Hypothesis testing
True Situation
Conclusion from the hypothesis test
Difference exists H1 No difference H0
Difference exits Power, 1- β α error, type 1 error
No difference β error, type 2 error

Hypothesis testing
3. Perform the test and draw a conclusion
p valueProbability of obtaining a result as extreme as (or more extreme than) the one observed, if the H0 is true
The p value is calculated after the statistical test is performed and if the p value is less than alpha the H0 is rejected.

Which statistical test to use?
Evaluate the following:
If the variables are qualitative or quantitative?If the groups are dependent or independent?How many groups are there?If the data are normally distributed?If the variances are homogeneous?

Measuring variables
Categorical (nominal): has two or more categories, but there is no intrinsic ordering to the categories (gender, blood type)
Ordinal: similar to categorical but there is a clear ordering of the variables (SES, satisfaction scales).
Interval: an interval variable is similar to an ordinal variable, except that the intervals between the values of the interval variable are equally spaced .
Continuous: numeric values that can be ordered sequentially, and that do not naturally fall into discrete ranges (weight)

Dependent and Independent GroupsIndependent groups
The researcher chooses two groups; participants who engage in regular physical activity and who are sedentary. The two groups are compared for their HDL levels
Dependent (paired) groups
The researcher chooses sedentary participants and determines their HDL level. Then the participants are asked to engage in regular physical activity and their HDL levels are determined again.

Normal and skewed distributions

Parametric vs Non-parametric tests
Parametric testsCan be used when data are approximately normally distributed and variances are homogeneousMore powerfulEasy to do, easy to interpret
Non-parametric testsDoes not have assumptions about the dataLess powerfulHarder to do, harder to interpretIf If sample sizes as small as n=6 are used we need to use non-parametric tests

Independent groups t test (Student’s t test) It is used to compare the means of two independent
samples. The researcher chooses two groups; participants who
engage in regular physical activity and who are sedentary. The two groups are compared for their HDL levels

Paired groups t test
It is used to compare the means of two dependent groups.
The researcher chooses sedentary participants and determines their HDL level. Then the participants are asked to engage in regular physical activity and their HDL levels are determined again.

ANOVA – Analysis of Variance It is used to compare the means of more than
two independent samples. The researcher chooses three groups;
participants who engage in vigorous physical activity, moderate physical activity and who are sedentary. The three groups are compared for their HDL levels.
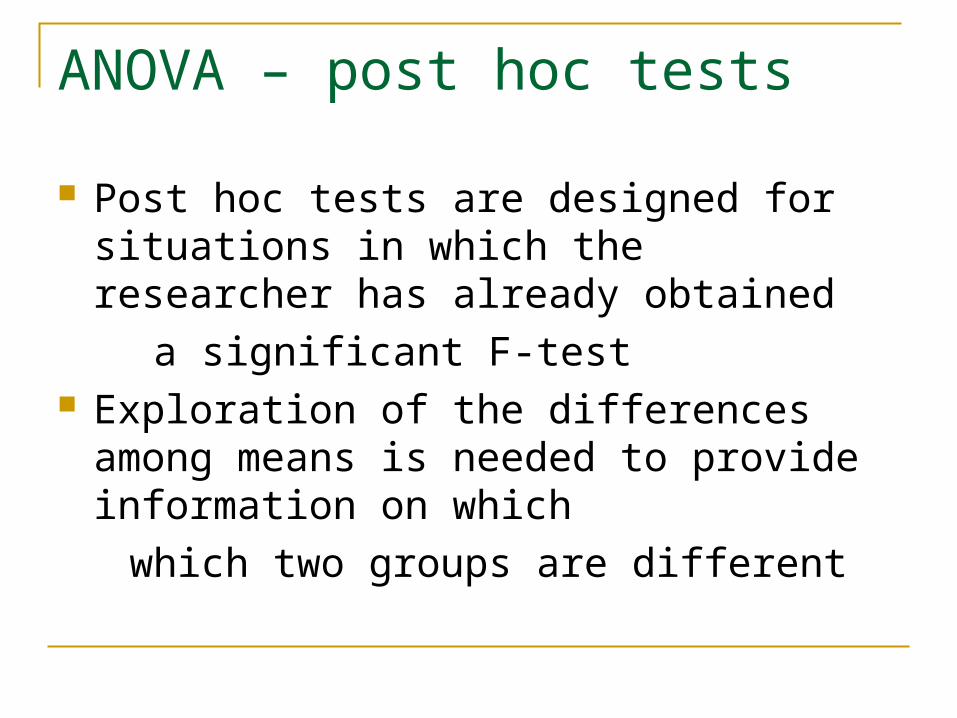
ANOVA – post hoc tests
Post hoc tests are designed for situations in which the researcher has already obtained
a significant F-test Exploration of the differences among means
is needed to provide information on which
which two groups are different

ANOVA – post hoc tests
Tukey’s HSD test LSD test Scheffe’s test

ANOVA – post hoc tests
Bonferroni correction
We need to adjust the alpha to account for inflated error when several post hoc tests are conducted. Divide the alpha by number of tests to get the new alpha level.

Repeated Measures ANOVA
It is used to compare the means of more than two dependent groups.
The researcher chooses sedentary participants and determines their HDL level. Then the participants are asked to engage in mild physical activity and their HDL levels are determined again. Lastly the participants are asked to engage in vigorous physical activity and their HDL levels are determined again.