Embed Size (px)
Citation preview

echT PressScienceComputers, Materials & ContinuaDOI:10.32604/cmc.2021.014677
Article
Statistical Histogram Decision Based Contrast Categorizationof Skin Lesion Datasets Dermoscopic Images
Rabia Javed1,2, Mohd Shafry Mohd Rahim1, Tanzila Saba3, Suliman Mohamed Fati3,Amjad Rehman3,* and Usman Tariq4
1School of Computing, Faculty of Engineering, Universiti Teknologi Malaysia Johor Bahru, 81310, Malaysia2Department of Computer Science, Lahore College for Women University, Lahore, 54000, Pakistan
3College of Computer and Information Sciences, Prince Sultan University, Riyadh, 11589, Saudi Arabia4College of Computer Engineering and Science, Prince Sattam bin Abdulaziz University, Alkharj, Saudi Arabia
*Corresponding Author: Amjad Rehman. Email: [email protected]: 08 October 2020; Accepted: 22 December 2020
Abstract: Most of the melanoma cases of skin cancer are the life-threateningform of cancer. It is prevalent among the Caucasian group of people due totheir light skin tone. Melanoma is the second most common cancer that hitsthe age group of 15–29 years. The high number of cases has increased theimportance of automated systems for diagnosing. The diagnosis should befast and accurate for the early treatment of melanoma. It should remove theneed for biopsies and provide stable diagnostic results. Automation requireslarge quantities of images. Skin lesion datasets contain various kinds of der-moscopic images for the detection of melanoma. Three publicly availablebenchmark skin lesion datasets, ISIC 2017, ISBI 2016, and PH2, are usedfor the experiments. Currently, the ISIC archive and PH2 are the most chal-lenging and demanding dermoscopic datasets. These datasets’ pre-analysis isnecessary to overcome contrast variations, under or over segmented imagesboundary extraction, and accurate skin lesion classification. In this paper, weproposed the statistical histogram-based method for the pre-categorizationof skin lesion datasets. The image histogram properties are utilized to checkthe image contrast variations and categorized these images into high andlow contrast images. The two performance measures, processing time andefficiency, are computed for evaluation of the proposed method. Our resultsshowed that the proposed methodology improves the pre-processing efficiencyof 77% of ISIC 2017, 67% of ISBI 2016, and 92.5% of PH2 datasets.
Keywords: Cancer; healthcare; contrast enhancement; dermoscopic images;skin lesion; low contrast images; WHO
1 Introduction
Skin cancer is the most-known type of cancer. It is usually categorized into two classes:melanoma and non-melanoma. However, melanoma is one of the dangerous forms of skin cancerthat can cause patient death. Melanoma is considered a lethal disease among the other common
This work is licensed under a Creative Commons Attribution 4.0 International License,which permits unrestricted use, distribution, and reproduction in any medium, providedthe original work is properly cited.
2338 CMC, 2021, vol.67, no.2
skin cancer diseases like basal cell carcinoma and squamous cell carcinoma. This skin cancer isgenerally associated with overexposure to ultraviolet light. According to the statistics of the year2020 [1], the estimated new cases of invasive melanoma are around 100,350 (about 60,190 in malesand 40,160 in females) in the United States. The report also estimated that 6,850 people woulddie due to melanoma (nearly 4,610 in males and 2,240 in females). Early detection thus givesmore significant chances of treatment. Hence the importance of melanoma detection is analyzed.The dermatologist has utilized several noninvasive imaging techniques like dermoscopy, confocalmicroscopy, and optical coherence tomography for skin lesion detection and classification [2,3].
Dermoscopy is one of the standards and effective imaging techniques used in the diagnosisof skin cancer. The dermoscopy captures the 20× magnified lesion image, but sometimes dueto the lighting effects, the image contrast is varying. These variations in image contrast createdifficulty for skin lesion classification methods and reduce these method’s accuracy. Computer-aided diagnosis (CAD) systems for skin lesion classification mostly have these fundamental steps,including image pre-processing, lesion segmentation, feature extraction, and lesion classification.Many researchers used the contrast enhancement technique to solve the contrast variation issuein the image pre-processing step before moving on to the segmentation and classification steps [4].However, due to pre-processing on large un-categorized datasets [5], the computational time isincreased, and also it reduces the efficiency of the method.
Moreover, some of the high contrast images already have high contrast pixel values. Afterapplying the contrast enhancement techniques on these high contrast images, the segmentationmethod’s accuracy will also be affected. Consequently, it is not necessary to use the imagecontrast enhancement on high contrast images. In this article, we proposed a novel statisticalhistogram-based decision method to address this problem. Our contributions are two-fold. Firstly,a statistical histogram decision method is implemented for the automated categorization of skinlesion datasets. The histogram upper bin and lower bin properties are used to separate thehigh and low contrast images. Secondly, the pre-processing histogram-based contrast stretchingtechnique is only applied to the low contrast images. The significant contributions of this articleare as follows:
• A novel approach proposed using image histogram properties to accomplish skin lesiondatasets analysis before the pre-processing step.
• Formulate the statistical equations for separating the dermoscopic images into high/normaland low contrast images.
• The pre-processing step’s efficiency is improved by gathering the histogram of images’metadata and enhancing only the contrast of low contrast images.
The rest of the paper is planned as follows. Section 2 contains some of the earlier workfocused on dataset analysis and improvements in the pre-processing step. The details of theproposed method for skin lesion datasets categorization using the histogram-based formulation areexplained in Section 3. The experimental results are discussed in Section 4. Finally, the conclusionwith future work in Section 5.
2 Related Work
Every dataset plays a vital part in developing and validating every CAD system [6,7].Understanding raw datasets are necessary for further processing like image segmentation, featureextraction, and classification. The skin lesion images comprise labeled images with metadatainformation, e.g., lesion type, personage, gender, etc. Many researchers used different augmentation

CMC, 2021, vol.67, no.2 2339
techniques like geometric transformation, color space transformation [8], cropping, rotation,translation, flipping, zooming, mixing image, blurring, and kernel filter [9] for dataset analysis.The outcome of the research performed in existing literature states that it is highly dependenton the number of images and their quality [10,11]. There is no established standard for capturingthe skin lesion images. That is the reason the results of automated skin lesion diagnosis areobserved to affect accuracy severely.
In the pre-processing step, some researchers solve the issue of artifacts and hair removal.Furthermore, some of the authors focus on increasing the contrast of images through contrastenhancement techniques [12,13]. Also, the reflection issue is solved by illumination correctionand color space transformation [14]. It was discussed by Rahman et al. [15] that when imagesare acquired from different datasets using the different image capturing devices under changingenvironments such as lighting, lens, textures, backgrounds, and others made the identification andthe classification tasks of lesions very difficult. The image histogram is used for many differentpurposes like pre-processing, image segmentation, feature extraction [16]. Different devices appearin the image due to the various devices, which makes the identification process more challeng-ing [17]. The difficulty of isolating the lesion segment in the images increases if captured imagescontrast is low [18]. Abbas et al. [19] proposed enhancing lesion image contrast by adjusting andmapping the lesion pixels’ intensity values in the specified range in CIE L ∗ a ∗ b color space.The color histogram properties are utilized for the discrimination between benign and melanomalesions [20]. The image histogram is used in the region growing method to segmentation pigmentedskin lesions [21]. The authors [22] used the histogram for thresholding value for clustering seg-mentation of low contrast or different tone images. The histogram’s luminance level is calculatedto create a binary image that feeds to the segmentation stage.
The histogram is also utilized to extract global and local features [23,24]. The color histogramshave been applied to classify the lesion into melanoma and benign [25]. The color histogramanalysis is performed to extract the color characteristics of melanoma, and these acquired char-acteristics are used to differentiate between melanoma and benign lesions [26]. Moreover, thehistogram techniques like histogram equalization, histogram stretching and histogram matching,etc., are also used for image normalization. These approaches’ significant side effect is the over-exaggeration of the noise in the area, which has a comparatively low-intensity range. ContrastLimited Adaptive Histogram Equalization (CLAHE) is one proposed technique that might beapplied to mitigate noise’s above-mentioned side effects [27,28]. Many pre-processing procedures,like image augmentation and normalization, are used to balance and filter skin lesion dataset’simages. The different types of contrast enhancement techniques are used for improving the qualityof dermoscopic images [29,30]. Contrast stretching is one of the methods for image enhancementby stretching intensity values. Different contrast stretching types exist, such as local contrast,global contrast, partial contrast, bright contrast, and dark contrast stretching techniques. Thelocal contrast stretching technique is specially used for low contrast. The global stretching is alsoused to enhance the image quality by taking global contrast of the image.
The most crucial problem in lesion detection and classification is the low contrast dermoscopicimages. The low contrast images affect the segmentation performance due to the similarity betweenhealthy skin and infected lesion areas. The second major issue is lesion boundary extractiondue to lesions irregular and different shapes. The third issue is the accurate classification of thelesion into benign and melanoma because a wide range of color similarity exists among lesiontypes. Currently, in existing work, all of these issues are present because of un-categorized skin
2340 CMC, 2021, vol.67, no.2
lesion datasets. Before using the skin lesion datasets for lesion detection and classification ofdermoscopic images, there should be methods to analyze these datasets.
3 Proposed Method
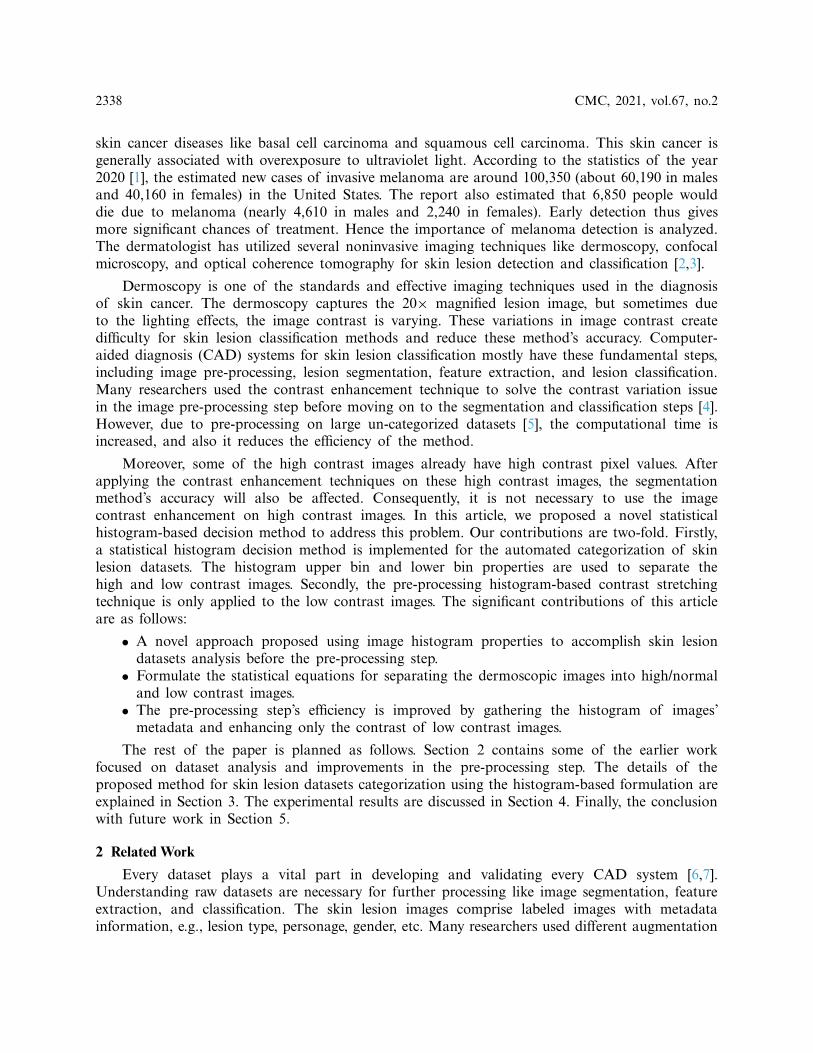
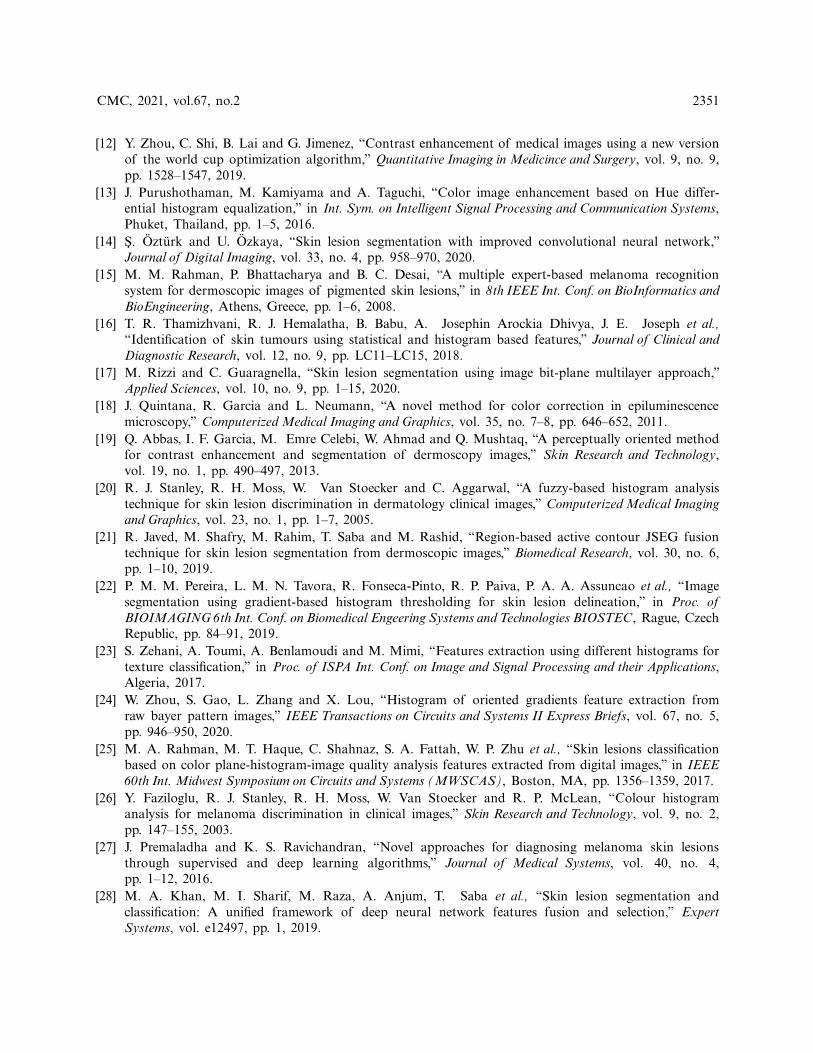
The proposed methodology is divided into two phases. In phase 1, the analysis of skin lesiondatasets is performed, then an automated intelligent histogram-based method is implementedthat categorized the dermoscopic images into high and low contrast images. In phase 2, thepre-processing is performed only on identified low contrast images. The proposed method isgraphically represented in Fig. 1. The detail of each phase is explained below:
Figure 1: A proposed method for categorization into high and low contrast images
3.1 Skin Lesion Dataset AnalysisThe skin lesion datasets ISBI (International Symposium on Biomedical Imaging) 2016, ISCI
(International Skin Imaging Collaboration) 2017, and PH2 contain various dermoscopic images.Huge variations and challenges exist in these datasets. For this research, the skin lesion datasetsimages are categorized into three classes: (1) artifacts images, (2) variations in image contrast,and (3) variations in lesion properties. The first class (artifacts images) contains different types of

CMC, 2021, vol.67, no.2 2341
artifacts in images like (a) dark corner, (b) maker ink, (c) gel bubbles, (d) circle chart, (e) rulermarks, and (f) skin hairs. An artifact is anything rather than the lesion that is detected whilecapturing the lesion from dermoscopy. These artifacts are naturally not present in the skin. Someof them create a problem during the digital image processing steps that will be performed forlesion classification. These artifacts reduced the performance of the pre-processing step and alsocreated problems in lesion boundary extraction. The second class (variations in image contrast)has two types of images: (a) high contrast images and (b) low contrast images.
The low contrast or quality of images shows that human eyes cannot easily differentiatebetween healthy/normal skin and cancerous/lesion skin. The third class (variations in lesion prop-erties) is divided into (a) under segmented images and (b) over segmented images. The undersegmented images mean that the lesion size is too small and difficult to analyze. The oversegmented images are like pigmented skin where a lesion is spread all over the skin area. Thecontrast is defined as uniquely different in terms of shade or glows representing an object (in realor captured digitally). The same view’s objects should have distinguishable features such as coloror brightness labeled as high contrast images or objects. Some contrast enhancing techniques suchas contrast stretching or normalization work by expanding or stretching the intensity values tothe desired intensity values. The contrast of the image can be high or low. It depends on thetone range of the image. In a high contrast image, the full range of tone appears from bright todark. The high contrast images contain normal images that are high in contrast. A high or well-contrasted image has gray levels (histogram) spread out over much of the range. A low contrastedimage has gray levels (histogram) cluttered in the center.
3.2 Skin Lesion Datasets CategorizationThe first phase of the proposed method is the categorization of images into high and low
contrast. The purpose of categorizing images is to minimize the time consumed during the pre-processing step performed on the large datasets. The researched method is achieved in five steps,as illustrated in Fig. 2. Step 1 is to create the histogram for all images, followed by step 2 thatcalculates the histogram properties, while step 3 is to select the two histogram properties BinLowand BinHigh. The lower (L) and upper (U) limits of an image are calculated in step 4, followedby step 5 that decides whether an image is a high or low contrast based upon the formula.
3.2.1 Create a Histogram for All ImagesA histogram is a visual representation of an image that presents the intensity values of pixels.
These intensity values are plotted on the x-axis (vertical) by different intervals, also known as barsor bins. The histogram gives a detailed view of all pixel values of an image that helps inspectan image.
Also, the brightness and contrast of an image are easily identified by analyzing the distributedintensity values. The histogram decision creates the histogram for all the dermoscopic imagespresents in benchmark datasets ISIC 2017, ISBI 2016, and PH2. The histogram of the skinlesion image is generated and each bar defines a range of values between the minimum andmaximum values.
3.2.2 Calculate Histogram PropertiesHistogram properties, as define in MathWorks, control the appearance and behavior of the
histogram. Some of the properties of the histogram are: (i) the number of bins (BinCounts),(ii) width of bins (BinWidth), (iii) edges of bins (BinEdges), and (iv) bin limits (BinLimits). Thebin limits are further comprised of two values, which are bin low and bin high limit. For the

2342 CMC, 2021, vol.67, no.2
analysis of skin lesion images, the histogram properties/features such as bin count, bin edges, binlow value, bin high value, and bin width are calculated. Here, the first ten images detail resultsare shown in Tab. 1.
Figure 2: Process of histogram-based decision method
The same procedure is followed for the datasets ISBI 2016 and PH2. Firstly, the histogramis created for all the images; then, the histogram properties are calculated. The detailed results ofthe first ten images are shown in Tab. 2.
The complete histogram properties are also calculated for the PH2 dataset, as shown inTab. 3.

CMC, 2021, vol.67, no.2 2343
Table 1: Histogram properties for ISIC 2017 dataset images
Image name Histogram properties
BinCounts BinEdges BinLow BinHigh BinWidth
ISIC_0000000 47 48 20 255 5ISIC_0000001 109 110 10 228 2ISIC_0000002 85 86 0 255 3ISIC_0000004 51 52 0 255 5ISIC_0000006 118 119 0 236 2ISIC_0000007 83 84 0 249 3ISIC_0000008 79 80 12 249 3ISIC_0000009 112 113 0 224 2ISIC_0000010 203 204 6 209 1ISIC_0000011 74 75 0 222 3
Table 2: Histogram properties for ISBI 2016 dataset images
Image name Histogram properties
BinCounts BinEdges BinLow BinHigh BinWidth
1002 160 161 55 215 2151003 85 86 0 255 2551004 132 133 50 182 1821005 73 74 9 228 2281007 92 93 72 255 2551008 134 135 78 212 2121009 166 167 11 177 1771010 157 158 10 167 1671011 124 125 61 185 1851012 59 60 36 213 213
Table 3: Histogram properties for PH2 dataset images
Image name Histogram properties
BinCounts BinEdges BinLow BinHigh BinWidth
IMD002 128 129 0 255 255IMD003 128 129 0 255 255IMD004 128 129 0 255 255IMD006 255 255 0 255 255IMD008 255 255 0 255 255IMD009 255 255 0 255 255IMD010 128 129 0 255 255IMD014 249 250 6 255 255IMD015 128 129 0 255 255IMD016 128 129 0 255 255

2344 CMC, 2021, vol.67, no.2
Here, Tabs. 1–3 show that the BinLow and BinHigh values are varied mostly except for otherhistogram properties. In this research, the BinLow and BinHigh values are selected for makingthe decision. Select the BinLow and BinHigh values for decision. After comparing the histogramsof high and low contrast images, we concluded that image contrast variation depends on BinLowand BinHigh values. These two properties are selected for the histogram decision formula. Tab. 4,presents the images with the BinLow and BinHigh values for high and low contrast dermoscopicimages. In this research, the BinLow and BinHigh values are selected for calculating the lower (L)and upper (U) limits of the dataset’s images.
Table 4: BinLow and BinHigh Values Images
BinLow Value =0
BinHigh Value =210
BinLow Value=30
BinHigh Value=255
BinLow Value =0
BinHigh Value =255
BinLow Value =5
BinHigh Value =255
BinLow Value =38
BinHigh Value =194
BinLow Value =55
BinHigh Value =180
BinLow Value =18
BinHigh Value =220
BinLow Value =15
BinHigh Value =234
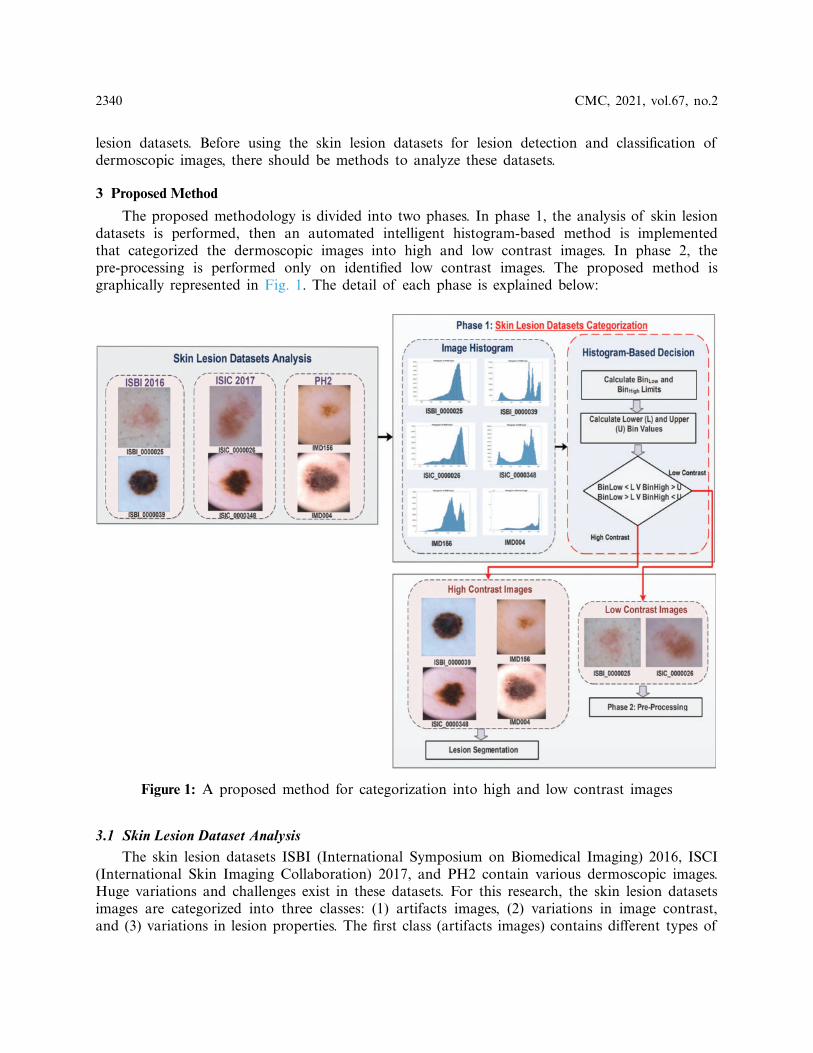
Now, the lower limit and upper limit is calculated for all images presents in three datasets.The low and high interval is estimated for analyzing the threshold value of the lower and upperlimit. Linear transformation mapping is utilized to calculate the low and high interval. In Fig. 3,the low interval of an image is shown by the histogram. Here, the low interval of an image isbetween 0 to 60. The design formula computes the low limit for all the images present in datasetsexplained in step 4.
Like the lower (L) limit, the upper (U) limit is calculated with the help of the BinHigh valueof an image in the histogram. The estimated high interval for the upper limit is highlighted inFig. 3. For this image, the high interval is between 200 to 255. The upper (U) limit is calculatedfor all dataset images. The upper limit (U) formulation is explained in step 4.
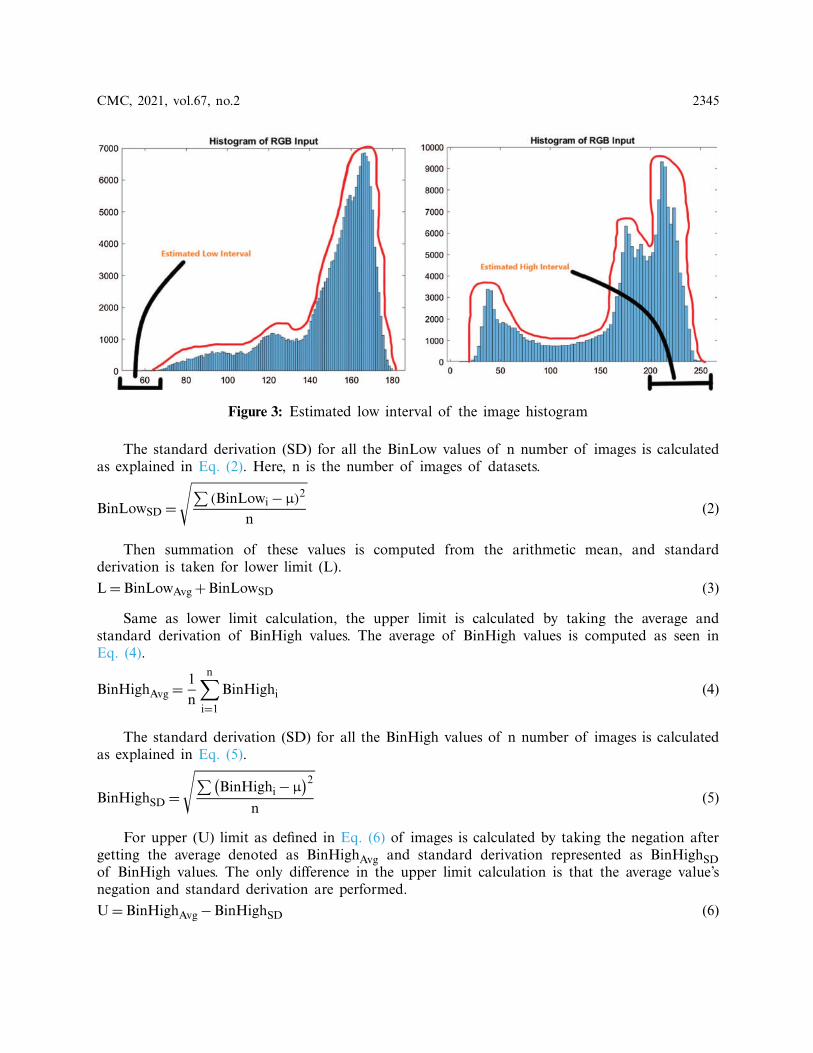
3.2.3 Calculate the Lower (L) and Upper (U) Limits of an ImageThe BinLow property of the histogram is used for calculating the lower limit, and the
BinHigh property is utilized for upper limit calculation. The lower limit for all the images iscalculated by summarizing the average and standard derivation of BinLow values. The average(Avg) denoted as BinLowAvg, is calculated by adding all BinLow values and then divided by thetotal number of images (n), as shown in Eq. (1).
BinLowAvg =1n
n∑i=1
BinLowi (1)
CMC, 2021, vol.67, no.2 2345
Figure 3: Estimated low interval of the image histogram
The standard derivation (SD) for all the BinLow values of n number of images is calculatedas explained in Eq. (2). Here, n is the number of images of datasets.
BinLowSD =√∑
(BinLowi −µ)2
n(2)
Then summation of these values is computed from the arithmetic mean, and standardderivation is taken for lower limit (L).
L=BinLowAvg+BinLowSD (3)
Same as lower limit calculation, the upper limit is calculated by taking the average andstandard derivation of BinHigh values. The average of BinHigh values is computed as seen inEq. (4).
BinHighAvg =1n
n∑i=1
BinHighi (4)
The standard derivation (SD) for all the BinHigh values of n number of images is calculatedas explained in Eq. (5).
BinHighSD =√∑(
BinHighi−µ)2
n(5)
For upper (U) limit as defined in Eq. (6) of images is calculated by taking the negation aftergetting the average denoted as BinHighAvg and standard derivation represented as BinHighSDof BinHigh values. The only difference in the upper limit calculation is that the average value’snegation and standard derivation are performed.
U=BinHighAvg−BinHighSD (6)

2346 CMC, 2021, vol.67, no.2
The contrast evaluation process starts with the computation of histogram decision denotedas HD that measures the lower (L) and Upper (U) limits of images. The HD is formulated asexplain in Eq. (7).
HD=n∑i=0
f (imagei)={high contrast if BinLow<L∨BinHigh>Ulow contrast if BinLow>L∨BinHigh<U
(7)
where imagei is the number of images present in the dataset, the calculated values for the lower (L)and upper (U) limits are applied in the HD formulation. The lower (L) and upper (U) limits arecompared with BinLow and BinHigh values of the input image. After the experiments, the analysisshows that if the BinLow value of an image is less than the lower (L) limit or the BinHigh valueof this image is greater than the upper (U) limit. Then it is considering a high contrast image. Inthe low contrast case, if the BinLow value of an image is greater than the lower (L) limit or theBinHigh value is less than the upper (U) limit, then it is a low contrast image. For dataset ISIC2017, the high contrast images had the BinLow value less than 34.1 (L), and the Binhigh value isgreater than 201.9 (U). While the low contrast images had the BinLow value is greater than 34.1(L), and the BinHigh value is below 201.9 (U). For dataset ISBI 2016, the high contrast imageshad the BinLow value less than 30.1 (L), and the BinHigh value is greater than 191.9 (U). Thelow contrast images had the BinLow value greater than 30.1 (L), and the BinHigh value is below191.9 (U). For dataset PH2, the high contrast images had the BinLow value less than 6.2 (L), andthe BinHigh Value is greater than 246.4 (U). Although the BinLow value is greater than 6.2 (L)for the low contrast images, the BinHigh value is less than 246.4 (U). The proposed histogramdecision formulation is based on the BinLow and BinHigh values of an image histogram. Afterthis decision, the skin images are categorized into two contrast variations: (i) high and (ii) low, asdescribed in Tab. 5.
Table 5: Image categorization of dataset ISCI 2017, ISBI 2016, and PH2
ISIC 2017 ISBI 2016 PH2
Image name Status Image name Status Image name Status
ISIC_0000000 High 1002 Low IMD002 HighISIC_0000001 High 1003 High IMD003 HighISIC_0000002 High 1004 Low IMD004 HighISIC_0000004 High 1005 High IMD006 HighISIC_0000006 High 1007 Low IMD008 HighISIC_0000007 High 1008 Low IMD009 HighISIC_0000008 High 1009 Low IMD010 HighISIC_0000009 High 1010 Low IMD014 HighISIC_0000010 High 1011 Low IMD015 HighISIC_0000011 High 1012 High IMD016 High
Now, the images of the three datasets are separated into two types of images. After makingthe histogram-based decision, the contrast enhancement or stretching technique is applied only onthe low contrast images.

CMC, 2021, vol.67, no.2 2347
3.3 Pre-Processing for Low Contrast ImagesThe acquisition of images from three datasets does not suitable for the segmentation process.
So, before the lesion segmentation phase, it is necessary to pre-process the input image. The pre-processing phase is an essential step to obtain high accuracy in the next phases. The pre-processingsteps for low contrast images are explained in detail. Image contrast stretching enhancementtechnique is performed on dermoscopic images to improve the contrast of low-quality images. Inthis technique, the normalization of the image is changed by defining the range for intensity value.From the histogram, change or stretch out the old gray values or levels to the new gray valuesusing the piecewise linear stretching function. The mapping function is used to stretch the valuesand then create the histogram for the new image. In contrast, stretching technique, the minimumand maximum values that define the image’s intensity are increased. After that, the mappingfunction is implemented to map the histogram’s values then the contrast of the image is enhanced.The difference between the low contrast image and contrast stretch image is easily visualized.Now, the skin lesion in the low contrast image is more apparent. Moreover, the similarity problembetween background and lesion is also resolved after contrast stretching.
4 Experimental Results
Some fundamental prerequisites are needed to lead this research. Keeping in mind the endgoal to diminish processing time, a Graphical Processing Unit (GPU) with higher handling powerand more significant memory is best. Be that as it may, constraints to limited hardware accesscould limit CPU utilization alone. The minimum requirements are the 2.7 GHz processor and10 GB Random Access Memory (RAM). Moreover, for the software side, this research utilizesMATLAB version R2019a. The operating system used is Windows 10. MATLAB is pickedbecause it employs high-level language and helps programming libraries for numerical calculation,graphics, and programming.
This section encompasses two subsections where Section 4.1 analyses the histogram deci-sion method’s performance while Section 4.2 evaluates the performance of image contrastcategorization.
4.1 Analysis of Histogram Decision FormulationThe histogram lower (L) and upper (U) limits values are utilized for checking the image
contrast. The lower (L) and upper (U) limits are compared with the input image’s BinLow andBinHigh values. After experimenting with different values, it was observed that if the BinLowvalue of an image is less than the lower (L) limit or the BinHigh value of this image is greaterthan the upper (U) limit, then the input image is considered a high contrast image. In the lowcontrast case, if the BinLow value of an image is greater than the lower (L) limit or the BinHighvalue is less than the upper (U) limit then the input image is a low contrast image. These rulesare then applied to all three datasets. For the validation of the research method, the statisticsperformance measures are used in three datasets. After comparing skin lesion datasets, the stats ofhigh and low contrast images are shown in Tab. 6. The quantity of high contrast images is morethan low contrast images. The ISCI 2017 dataset has 900 total images containing 698 high contrastimages and 202 low contrast images. The dataset ISBI 2016 includes 910 number of images inwhich 608 images are high contrast, and 302 number of images are low contrast. Moreover, afterthe histogram decision, the dataset PH2 contains the 15 number of low contrast images based on

2348 CMC, 2021, vol.67, no.2
observation. So, the contrast enhancement technique will only be applied to low contrast images.The detailed results of the experiments are discussed below:
Table 6: Comparison of ISIC 2017 and PH2 on high and low contrast images
Phase 1: skin lesion datasets categorization Dataset
ISIC 2017 ISBI 2016 PH2
High contrast images 698 608 185Low contrast images 202 302 15Total images 900 910 200
4.2 Performance Measures ResultsTwo performance measures, the processing time and efficiency, are calculated to evaluate
the statistical HD method. The MATLAB time function technique is utilized to measure theprocessing time of an image in per-processing. This function returns the total time by taking twotimestamps, one at the starting and one at the processing image’s ending. The processing time isgiven for, before the HD method and after the HD method as represented in Tab. 7.
Table 7: Processing time before and after statistical histogram decision method
Dataset Processing time
Before the statistical HD method applied After the statistical HD method applied
ISIC 2017 One image pre-processing time= 10 s One image pre-processing time= 10 s900 images pre-processing time= 900∗10 s 202 image pre-processing time= 202∗10 s
= 9,000 s= 2.5 h≈ 3 h = 2,020 s= 1/2 hISBI 2016 One image pre-processing time= 10 s One image pre-processing time= 10 s
910 images pre-processing time= 910∗10 s 302 image pre-processing time= 302∗10 s= 91,00 s= 2.5 h = 3,020 s= 1/2 h
PH2 One image pre-processing time= 10 s One image pre-processing time= 10 s200 images pre-processing time= 200∗10 s 15 image pre-processing time= 15∗10 s
= 2,000 s= 1/2 h = 150 s= 2.5 min
The graphical representation is also shown in Fig. 4, which shows the processing timeimproved after the proposed method. The blue color indicates the processing time before theproposed method, and the red color shows the processing time after the proposed method. Thelow contrast ratio (LCR) is computed from the equation. Here, in the equation, a low contrastimage is represented as LCI, and N is the total number of images in the dataset, as seen inEq. (8). LCI is determined after the categorization of skin lesion datasets using the proposedstatistical histogram decision-based method.
LCR= LCIN
× 100 (8)

CMC, 2021, vol.67, no.2 2349
The efficiency of the pre-processing step is also calculated for the evaluation of the proposedmethod. The efficiency is intended by the equation, as can be seen in Tab. 8. The efficiency inEq. (9) is denoted as E.
E= 100−LCR (9)
3
2.5
10.5 0.5 0.25
0
1
2
3
4
ISIC 2017 ISBI 2016 PH2
Processing Time
Before Proposed Method After Proposed Method
Figure 4: Graphical representation of processing time
Table 8: Efficiency evaluation for pre-processing step
Efficiency
ISIC 2017 ISBI 2016 PH2
LCR= 202900 × 100= 22.4% LCR= 302
910 × 100= 33% LCR= 15200 × 100= 7.5%
E= 100− 22.4= 77% E= 100− 33= 67% E= 100− 7.5= 92.5%
Before the proposed statistical HD method, the processing time and efficiency are notimproved. After the proposed method, the efficiency is improved by 77% for ISIC 2017 dataset.The ISBI 2016 dataset displayed 67%. The PH2 dataset showed a 92.5% increase the efficiency.
5 Conclusion
This study proposes a unique perspective to categorize images into low and high by checkingthe image contrasted through the histogram properties. It is an innovative endeavor to exploreimage histogram properties to solve pre-processing issues on a vast and diverse dataset. In skinlesion classification, the histogram bin limits values were never utilized before to categorize imagesinto high and low contrast. We have also come up with a statistical formula approach to make thedistinction between the images. This has isolated the pre-processing to be done only on a subset ofdatasets. Due to image categorization, the overall performance is increased by avoiding the extraprocessing on high contrast images. Through the histogram decision method, the performanceof existing skin lesion classification methods is improved. The skin lesion categorization methodcan be enhanced by incorporating the depth analysis of skin lesion datasets. The histogram’s

2350 CMC, 2021, vol.67, no.2
other properties can be explored like bin width, bin count, and bin height to further researchpre-processing on skin lesion datasets.
Acknowledgement: This work is supported by the School of Computing, Faculty of Engineering,Universiti Teknologi Malaysia, Johor Bahru, 81310 Skudai, Malaysia. Moreover, the authors arealso grateful for the Department of Computer Science’s support, Lahore College for WomenUniversity, Jail Road, Lahore 54000, Pakistan. This work is also supported by Artificial Intelli-gence and Data Analytics (AIDA) Lab CCIS Prince Sultan University Riyadh, Saudi Arabia andauthors would also like to acknowledge the support of Prince Sultan University for paying theArticle Processing Charges (APC) of this publication.
Funding Statement: The authors received no specific funding for this study.
Conflicts of Interest: The authors declare that they have no interest in reporting regarding thepresent study.
References[1] NIH National Cancer Institute, “Cancer facts & figures 2020,” CA. A Cancer Journal for Clinicians,
vol. 31, pp. 1–76, 2020.[2] F. Afza, M. A. Khan, M. Sharif and A. Rehman, “Microscopic skin laceration segmentation and
classification: A framework of statistical normal distribution and optimal feature selection,” MicroscopyResearch and Technique, vol. 82, no. 9, pp. 1471–1488, 2019.
[3] R. Javed, M. Shafry, M. Rahim, T. Saba and A. Rehman, “A comparative study of features selectionfor skin lesion detection from dermoscopic images,” NetworkModeling and Analysis in Health Informaticsand Bioinformatics, vol. 1, pp. 1–13, 2020.
[4] A. N. Hoshyar, A. Al-Jumaily and A. N. Hoshyar, “The beneficial techniques in pre-processing step ofskin cancer detection system comparing,” Procedia Computer Science, vol. 42, no. C, pp. 25–31, 2014.
[5] M. Y. Javed, M.A. Khan, M.T. Sharif, T. Saba and A. Rehman, “Multi-model deep neural networkbased features extraction and optimal selection approach for skin lesion classification,” in 2019 Int.Conf. on Computer and Information Sciences (ICCIS), Sakaka, Saudi Arabia, IEEE, pp. 1–7, 2019.
[6] A. E. Rad, M. S. M. Rahim, H. Kolivand and M. Amin, “Morphological region-based initial contouralgorithm for level set methods in image segmentation,” Multimedia Tools and Applications, vol. 76,no. 2, pp. 2185–2201, 2017.
[7] A. Rakhmadi, N. Z. S. Othman, A. Bade, M. S. M. Rahim and I. M. Amin, “Connected componentlabeling using components neighbors-scan labeling approach,” Journal of Computer Science, vol. 6,pp. 1070–1078, 2010.
[8] R. Javed, Mohd Rahim and S Tanzila, “An improved framework by mapping salient features for skinlesion detection and classification using the optimized hybrid features,” International Journal of AdvancedTrends in Computer Science and Engineering, vol. 8, no. 1.6, pp. 95–101, 2019.
[9] C. Shorten and T. M. Khoshgoftaar, “A survey on image data augmentation for deep learning,” Journalof Big Data, vol. 6, no. 1, pp. 60–71, 2019.
[10] T. Saba, “Recent advancement in cancer detection using machine learning: Systematic survey ofdecades, comparisons and challenges,” Journal of Infection and Public Health, vol. 13, no. 9, pp. 1274–1289, 2020.
[11] T. Saba, M. A. Khan, A. Rehman and S. L. Marie-Sainte, “Region extraction and classification of skincancer: A heterogeneous framework of deep CNN features fusion and reduction,” Journal of MedicalSystems, vol. 43, no. 9, pp. 289–311, 2019.
CMC, 2021, vol.67, no.2 2351
[12] Y. Zhou, C. Shi, B. Lai and G. Jimenez, “Contrast enhancement of medical images using a new versionof the world cup optimization algorithm,” Quantitative Imaging in Medicince and Surgery, vol. 9, no. 9,pp. 1528–1547, 2019.
[13] J. Purushothaman, M. Kamiyama and A. Taguchi, “Color image enhancement based on Hue differ-ential histogram equalization,” in Int. Sym. on Intelligent Signal Processing and Communication Systems,Phuket, Thailand, pp. 1–5, 2016.
[14] S. Öztürk and U. Özkaya, “Skin lesion segmentation with improved convolutional neural network,”Journal of Digital Imaging, vol. 33, no. 4, pp. 958–970, 2020.
[15] M. M. Rahman, P. Bhattacharya and B. C. Desai, “A multiple expert-based melanoma recognitionsystem for dermoscopic images of pigmented skin lesions,” in 8th IEEE Int. Conf. on BioInformatics andBioEngineering, Athens, Greece, pp. 1–6, 2008.
[16] T. R. Thamizhvani, R. J. Hemalatha, B. Babu, A. Josephin Arockia Dhivya, J. E. Joseph et al.,“Identification of skin tumours using statistical and histogram based features,” Journal of Clinical andDiagnostic Research, vol. 12, no. 9, pp. LC11–LC15, 2018.
[17] M. Rizzi and C. Guaragnella, “Skin lesion segmentation using image bit-plane multilayer approach,”Applied Sciences, vol. 10, no. 9, pp. 1–15, 2020.
[18] J. Quintana, R. Garcia and L. Neumann, “A novel method for color correction in epiluminescencemicroscopy,” Computerized Medical Imaging and Graphics, vol. 35, no. 7–8, pp. 646–652, 2011.
[19] Q. Abbas, I. F. Garcia, M. Emre Celebi, W. Ahmad and Q. Mushtaq, “A perceptually oriented methodfor contrast enhancement and segmentation of dermoscopy images,” Skin Research and Technology,vol. 19, no. 1, pp. 490–497, 2013.
[20] R. J. Stanley, R. H. Moss, W. Van Stoecker and C. Aggarwal, “A fuzzy-based histogram analysistechnique for skin lesion discrimination in dermatology clinical images,” ComputerizedMedical Imagingand Graphics, vol. 23, no. 1, pp. 1–7, 2005.
[21] R. Javed, M. Shafry, M. Rahim, T. Saba and M. Rashid, “Region-based active contour JSEG fusiontechnique for skin lesion segmentation from dermoscopic images,” Biomedical Research, vol. 30, no. 6,pp. 1–10, 2019.
[22] P. M. M. Pereira, L. M. N. Tavora, R. Fonseca-Pinto, R. P. Paiva, P. A. A. Assuncao et al., “Imagesegmentation using gradient-based histogram thresholding for skin lesion delineation,” in Proc. ofBIOIMAGING 6th Int. Conf. on Biomedical Engeering Systems and Technologies BIOSTEC, Rague, CzechRepublic, pp. 84–91, 2019.
[23] S. Zehani, A. Toumi, A. Benlamoudi and M. Mimi, “Features extraction using different histograms fortexture classification,” in Proc. of ISPA Int. Conf. on Image and Signal Processing and their Applications,Algeria, 2017.
[24] W. Zhou, S. Gao, L. Zhang and X. Lou, “Histogram of oriented gradients feature extraction fromraw bayer pattern images,” IEEE Transactions on Circuits and Systems II Express Briefs, vol. 67, no. 5,pp. 946–950, 2020.
[25] M. A. Rahman, M. T. Haque, C. Shahnaz, S. A. Fattah, W. P. Zhu et al., “Skin lesions classificationbased on color plane-histogram-image quality analysis features extracted from digital images,” in IEEE60th Int. Midwest Symposium on Circuits and Systems (MWSCAS), Boston, MA, pp. 1356–1359, 2017.
[26] Y. Faziloglu, R. J. Stanley, R. H. Moss, W. Van Stoecker and R. P. McLean, “Colour histogramanalysis for melanoma discrimination in clinical images,” Skin Research and Technology, vol. 9, no. 2,pp. 147–155, 2003.
[27] J. Premaladha and K. S. Ravichandran, “Novel approaches for diagnosing melanoma skin lesionsthrough supervised and deep learning algorithms,” Journal of Medical Systems, vol. 40, no. 4,pp. 1–12, 2016.
[28] M. A. Khan, M. I. Sharif, M. Raza, A. Anjum, T. Saba et al., “Skin lesion segmentation andclassification: A unified framework of deep neural network features fusion and selection,” ExpertSystems, vol. e12497, pp. 1, 2019.
2352 CMC, 2021, vol.67, no.2
[29] R. Javed, T. Saba, M. Shafry and M. Rahim, “An intelligent saliency segmentation technique andclassification of low contrast skin lesion dermoscopic images based on histogram decision,” in 201912th Int. Conf. on Developments in eSystems Engineering (DeSE), Kazan, Russia, pp. 164–169, 2020.
[30] T. Saba, K. Haseeb, I. Ahmed and A. Rehman, “Secure and energy-efficient framework using Internetof Medical Things for e-healthcare,” Journal of Infection and Public Health, vol. 13, no. 10, pp. 1567–1575, 2020.


![Image Contrast Enhancement Techniques: A Comparative Study ...€¦ · 2. HISTOGRAM EQUALIZATION (HE) each gray level in a digital image. Histogram Equalization (HE) [2] is a very](https://img.dokumen.tips/doc/110x75/5f6a9bbb5a373176561cdcc6/image-contrast-enhancement-techniques-a-comparative-study-2-histogram-equalization.jpg)
![Efficient Contrast Enhancement Using Histogram Specificationjkais99.org/journal/v11n12/57/45ej/45ej.pdf · 2014-07-29 · proposed to improve the quality of an image [1-9]. Histogram](https://img.dokumen.tips/doc/110x75/5e671083f832f31e136376b0/efficient-contrast-enhancement-using-histogram-2014-07-29-proposed-to-improve.jpg)