Embed Size (px)
Citation preview
STATISTICAL HAND BOOKASSAM
2020
DIRECTORATE OF ECONOMICS AND STATISTICSGOVERNMENT OF ASSAM
GUWAHATI-28(Website : des.assam.gov.in)

.
ά0 ø˝√√˜ôL ø¬ıù´ ̇ ˜«± ≈̃‡…˜Laœ, ’¸˜
Dr. Himanta Biswa Sarma Chief Minister, Assam
(Dr. Himanta Biswa Sarma)
MESSAGE
I am happy to know that the Directorate of Economics andStatistics, Assam is bringing out its annual publication ‘StatisticalHandbook Assam 2020’.
The publication has immense significance in preparing budgetand making development plans for the state as it provides data ofsocio-economic parameters. I hope ‘Statistical Handbook Assam 2020’would go a long way in enabling the planners and policy makers toprepare the future developmental roadmap for the state which wouldusher in a period of rapid development in all spheres.
I wish the Directorate of Economics and Statistics, Assam allthe very best on this occasion of bringing out the ‘Statistical HandbookAssam 2020’ and hope that its efforts in collecting, compiling andanalysing data would be able to achieve the desired results.
Dispur21.06.2021
Jishnu Barua, IAS GOVERNMENT OF ASSAMJanata Bhawan, Block-C,Dispur, Guwahati-781006Phone : 0361-2261120 (O),
0361-2261403 (O)Fax : 0361-2237200E-mail : [email protected]
Chief Secretary
MESSAGE
Documentation of economical statistics is a reflection of theeconomic status of the State, besides being an effective tool for properformulation of Policies. Indeed, data generated by surveys enables thegovernment to formulate short term and long term plans for acceleratingsocio-economic development of the State and for mid course corrections,wherever necessary.
It is, therefore, hearting to note that Directorate of Economics &Statistics is publishing its annual “Statistical Handbook, Assam” 2020.
My congratulations to the entire team involved in the process andmy best wishes to them in all their future endeavour.
Dated the 29th June, 2020.
Paban Kumar Borthakur, IASAdditional Chief SecretaryT & D, Cultural Affairs &Tourism Department
Government of Assam‘D’ Block, Ground Floor
Janata BhawanDispur, Guwahati-781006
Tel. : +91-361-2237032 (O)Fax : +91-361-2237405e-mail : [email protected]
Ref No. Ref No. ........................
The Government of Assam decided to set-up the Directorate ofEconomics and Statistics Assam in 1948 to work as a nodal agency tocollect, collate and publish socio-economic data. In the process, theDirectorate is being engaged in collection, compilation, analysis andpublication of data related to the socio-economic sectors of the State.The data collected are published in the form of publications, namely,‘Statistical Handbook Assam’, ‘Economic Survey Assam’ and ‘Assamat a Glance’ annually. The Directorate has also published various reportson employment-unemployment, backward classes, industry, etc. on thebasis of its Sample Survey.
The ‘Statistical Handbook Assam’ is one of the popularpublications of the Directorate. It covers the updated information onalmost all the sectors of the State economy. I am happy to learn that the‘Statistical Handbook Assam, 2020’ is ready for publication.
I congratulate the officers and staff of the Directorate ofEconomics and Statistics, Assam for bringing out this publication.
Date : 08/07/2021 (P.K. Borthakur)
MESSAGE

FOREWORD
The Directorate of Economics and Statistics, Assam, is oneof the oldest Directorate of Assam and it has been functioningsince 1948 with the mandate of collection, compilation andanalysis of statistical data pertaining to various development andwelfare schemes of the state economy for formulation of plansand policies for enhancement of state economy.
Statistical Hand Book, Assam, is a regular annualpublication which seeks to provide a concise factual account ofsocial and economic trends in Assam based on latest availabledata furnished by relevant Departments and Organizations. Thepresent edition of Statistical Hand Book, Assam, 2020, is the 53rdedition in the series. All efforts have been made to incorporatethe latest information of all socio-economic aspects of the state.However due to existing situation of Covid-19 Pandemic,collection of information from some fields relevant forpreparation of this report have been hampered. Therefore dueto non-availability of latest data in few cases, last year publisheddata have been repeated.
The continued and generous co-operation extended byvarious Departments and Organizations in bringing out thispublication is acknowledged with gratitude.
I extend sincere appreciation for the efforts made by theofficers and staff associated directly and indirectly in compilingand designing this publication.
Any suggestion for improvement of future editions ofStatistical Handbook, Assam is most welcome.
May, 2021 (Nirupama Talukdar)
Director of Economics and Statistics Assam. Guwahati-28

.
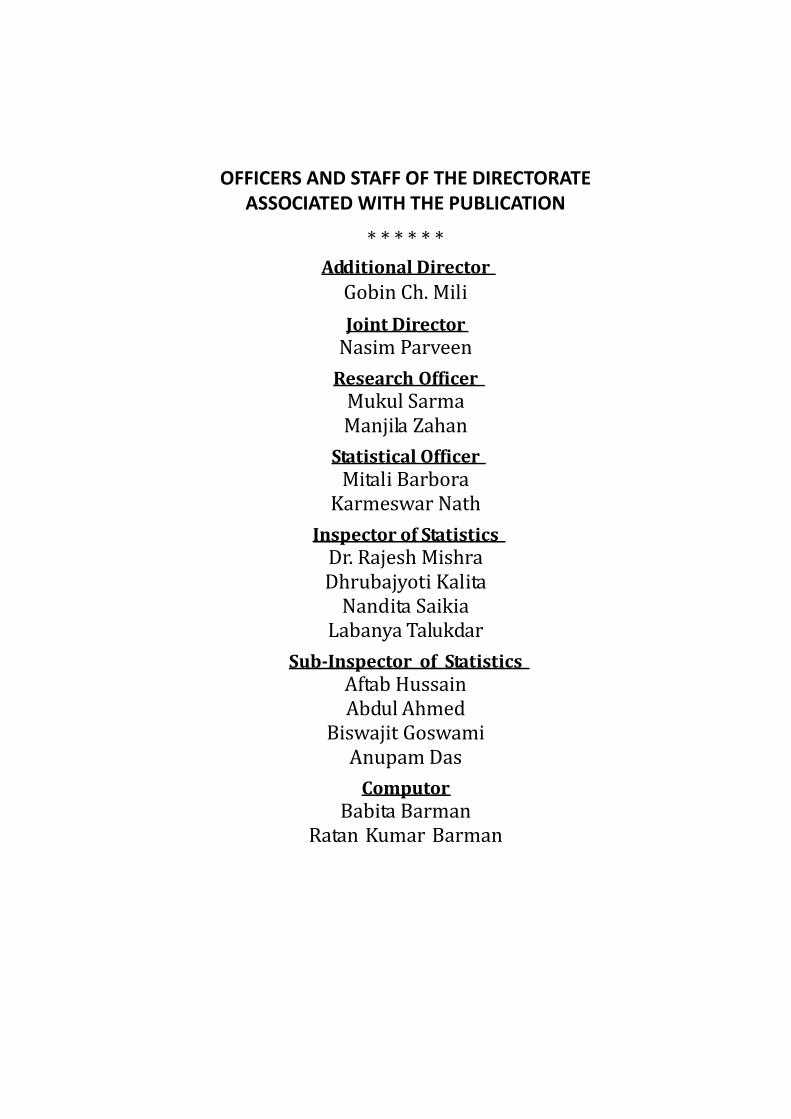
OFFICERS AND STAFF OF THE DIRECTORATEASSOCIATED WITH THE PUBLICATION* * * * * *
Additional DirectorGobin Ch. MiliJoint DirectorNasim Parveen
Research OfficerMukul SarmaManjila ZahanStatistical OfficerMitali BarboraKarmeswar Nath
Inspector of StatisticsDr. Rajesh MishraDhrubajyoti KalitaNandita SaikiaLabanya TalukdarSub-Inspector of StatisticsAftab HussainAbdul AhmedBiswajit GoswamiAnupam Das
ComputorBabita BarmanRatan Kumar Barman

.
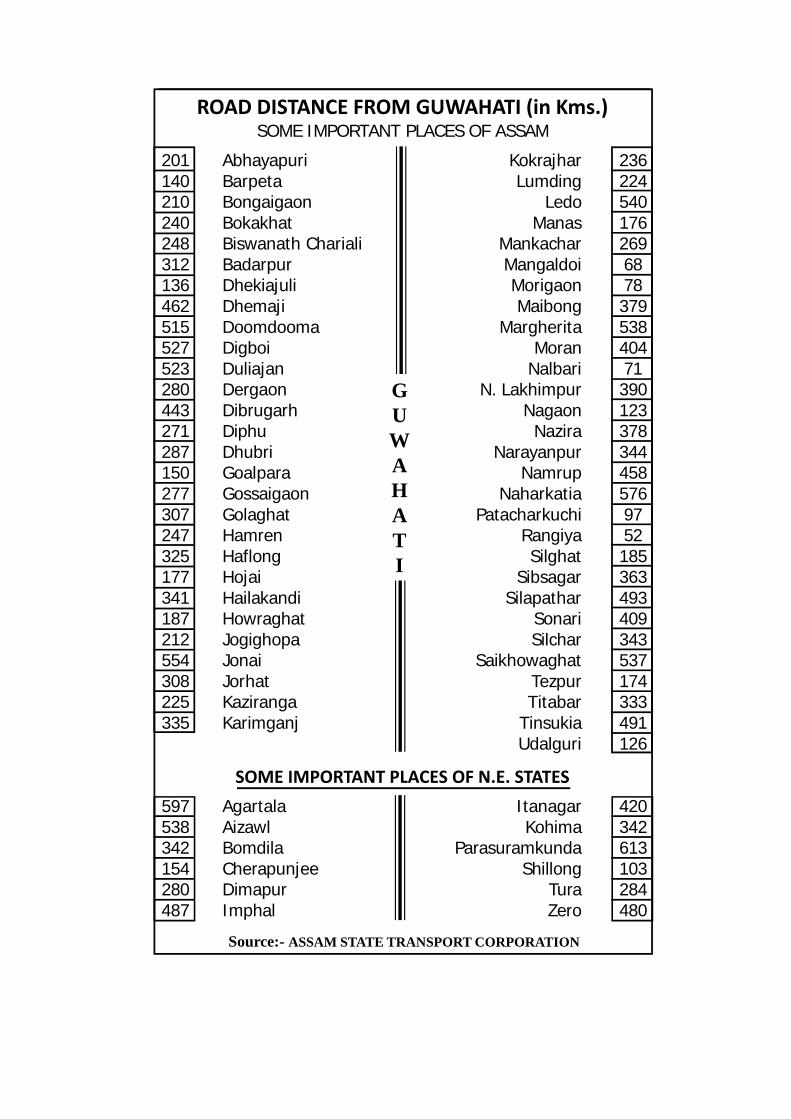
ROAD DISTANCE FROM GUWAHATI (in Kms.)SOME IMPORTANT PLACES OF ASSAM
AbhayapuriBarpetaBongaigaonBokakhatBiswanath CharialiBadarpurDhekiajuliDhemajiDoomdoomaDigboiDuliajanDergaonDibrugarhDiphuDhubriGoalparaGossaigaonGolaghatHamrenHaflongHojaiHailakandiHowraghatJogighopaJonaiJorhatKazirangaKarimganj
AgartalaAizawlBomdilaCherapunjeeDimapurImphal
KokrajharLumding
LedoManas
MankacharMangaldoiMorigaonMaibong
MargheritaMoran
NalbariN. Lakhimpur
NagaonNazira
NarayanpurNamrup
NaharkatiaPatacharkuchi
RangiyaSilghat
SibsagarSilapathar
SonariSilchar
SaikhowaghatTezpurTitabar
TinsukiaUdalguri
ItanagarKohima
ParasuramkundaShillong
TuraZero
SOME IMPORTANT PLACES OF N.E. STATES
Source:- ASSAM STATE TRANSPORT CORPORATION
GUWAHATI
201140210240248312136462515527523280443271287150277307247325177341187212554308225335
597538342154280487
2362245401762696878379538404713901233783444585769752185363493409343537174333491126
420342613103284480

.
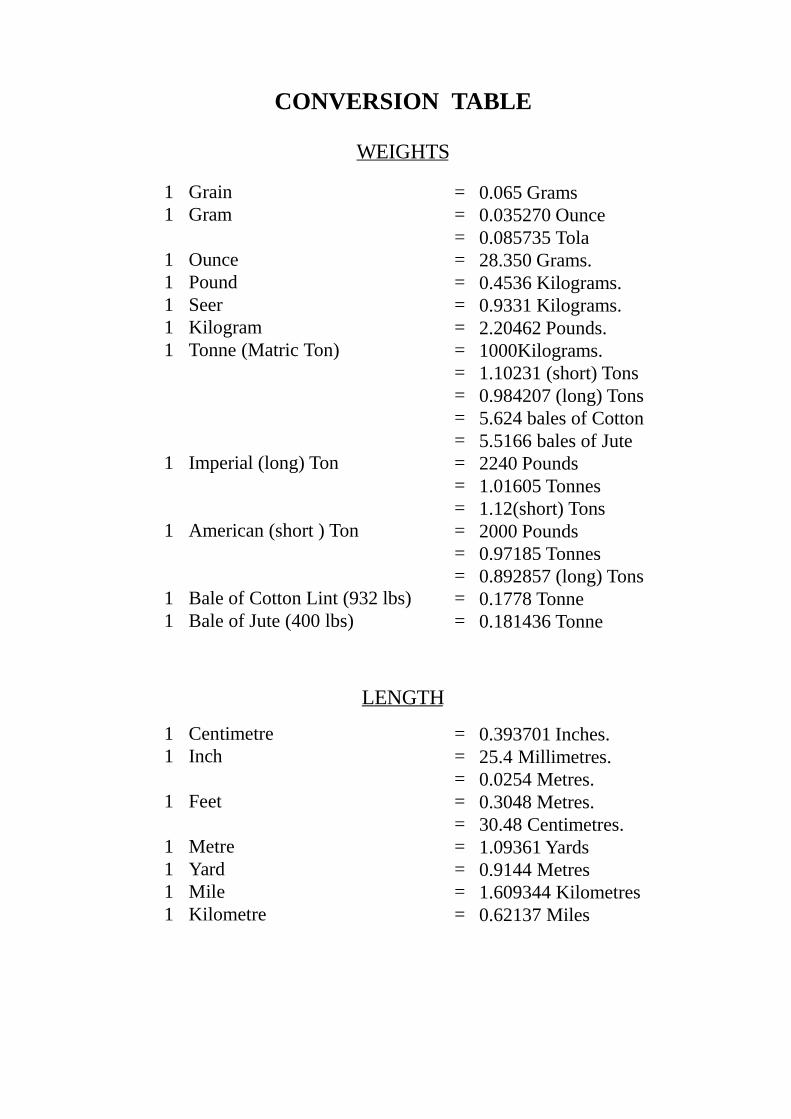
CONVERSION TABLE
GrainGram
OuncePoundSeerKilogramTonne (Matric Ton)
Imperial (long) Ton
American (short ) Ton
Bale of Cotton Lint (932 lbs)Bale of Jute (400 lbs)
CentimetreInch
Feet
MetreYardMileKilometre
11
11111
1
1
11
11
1
1111
====================
=========
0.065 Grams0.035270 Ounce0.085735 Tola28.350 Grams.0.4536 Kilograms.0.9331 Kilograms.2.20462 Pounds.1000Kilograms.1.10231 (short) Tons0.984207 (long) Tons5.624 bales of Cotton5.5166 bales of Jute2240 Pounds1.01605 Tonnes1.12(short) Tons2000 Pounds0.97185 Tonnes0.892857 (long) Tons0.1778 Tonne0.181436 Tonne
0.393701 Inches.25.4 Millimetres.0.0254 Metres.0.3048 Metres.30.48 Centimetres.1.09361 Yards0.9144 Metres1.609344 Kilometres0.62137 Miles
WEIGHTS
LENGTH

1 Gallon (Imperial)1 Gallon (U.S)
1 Litre1 Cubic feet
1 Cubic metre1 Cubic yard
1 Square inch1 Square feet1 Square yard1 Square metre
1 Acre
.1 Square mile
1 Square kilometre
1 Hectare
1 Bigha
========
==================
4.546 Litres3.78533 Litres0.83268 Gallons (Imperial)0.219967 Gallons (Imperial)28.3168 Cubic Decimetres0.028 Cubic metres1.30795 Cubic yards0.76455 Cubic metres
6.4516 Square centimetres0.092903 Sq. Metres0.836131 Sq. Metres1.19599 Square Yards10.7639 Squre feet0.404686 Hectares.3.025 Bighas4840 Sq. Yards.2.58999 Sq. Kilometres.640 Acres.100 Hectares.247 Acres.0.386101 Square Miles.10000 Square Metres7.45993 Bighas.2.47105 Acres.0.13387 Hectres.0.33058 Acres.
CAPACITY AND VOLUME
AREA
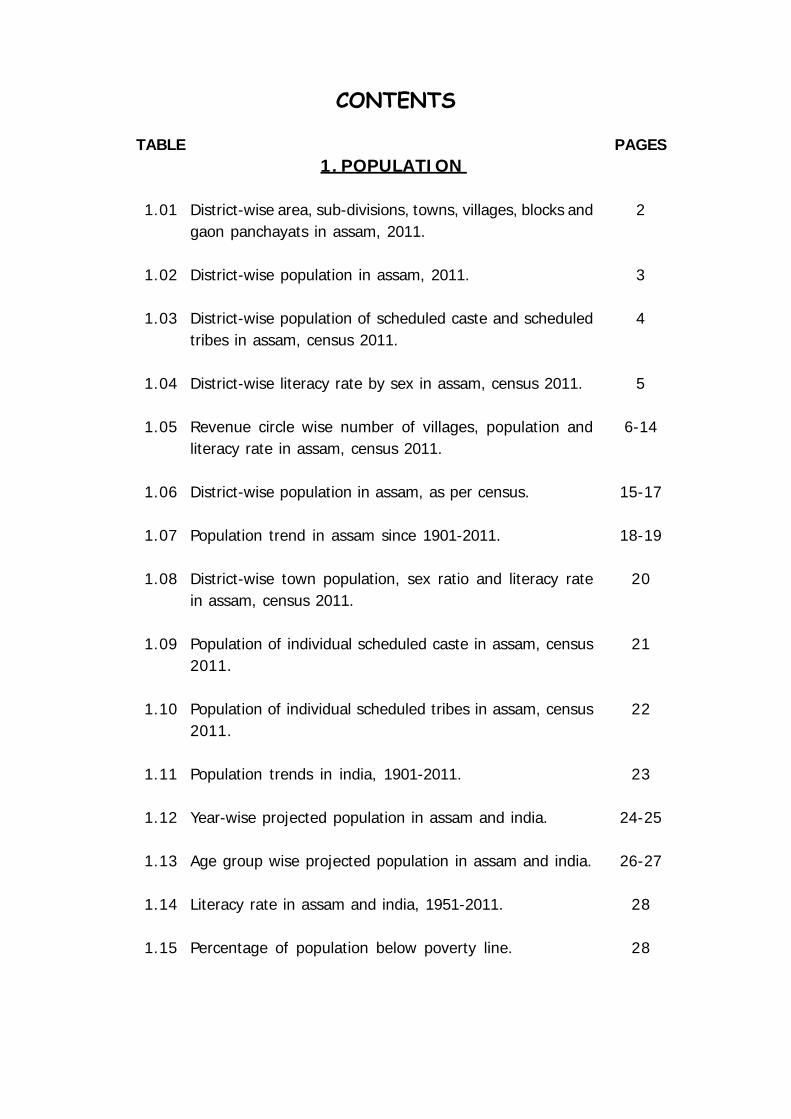
CONTENTS
PAGES
2
3
4
5
6-14
15-17
18-19
20
21
22
23
24-25
26-27
28
28
1. POPULATION
District-wise area, sub-divisions, towns, villages, blocks andgaon panchayats in assam, 2011.
District-wise population in assam, 2011.
District-wise population of scheduled caste and scheduledtribes in assam, census 2011.
District-wise literacy rate by sex in assam, census 2011.
Revenue circle wise number of villages, population andliteracy rate in assam, census 2011.
District-wise population in assam, as per census.
Population trend in assam since 1901-2011.
District-wise town population, sex ratio and literacy ratein assam, census 2011.
Population of individual scheduled caste in assam, census2011.
Population of individual scheduled tribes in assam, census2011.
Population trends in india, 1901-2011.
Year-wise projected population in assam and india.
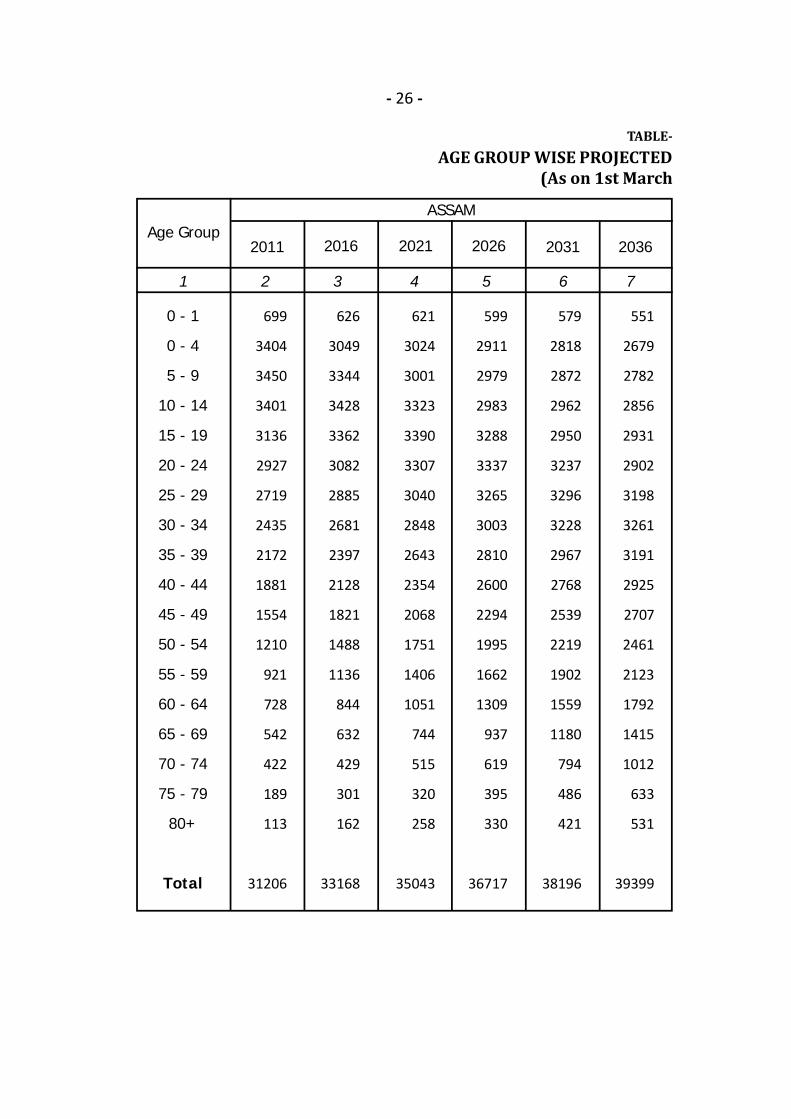
Age group wise projected population in assam and india.
Literacy rate in assam and india, 1951-2011.
Percentage of population below poverty line.
TABLE
1.01
1.02
1.03
1.04
1.05
1.06
1.07
1.08
1.09
1.10
1.11
1.12
1.13
1.14
1.15
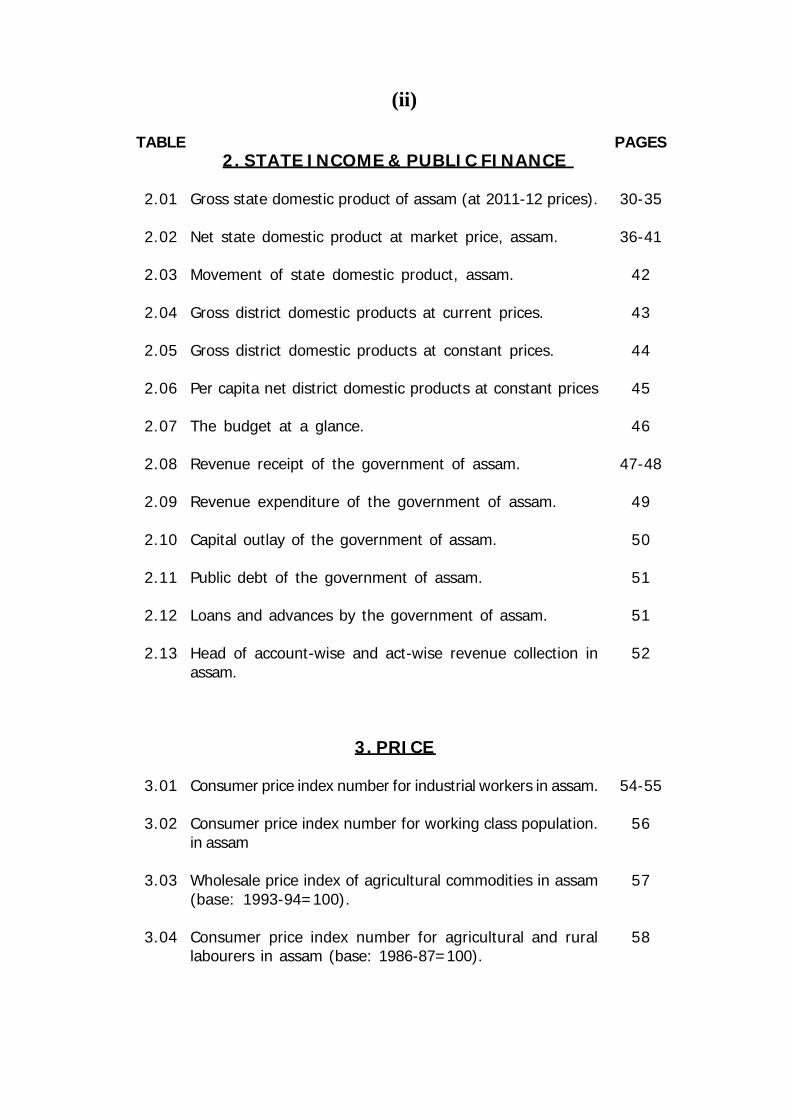
(ii)
TABLE
2.01
2.02
2.03
2.04
2.05
2.06
2.07
2.08
2.09
2.10
2.11
2.12
2.13
3.01
3.02
3.03
3.04
PAGES
30-35
36-41
42
43
44
45
46
47-48
49
50
51
51
52
54-55
56
57
58
2. STATE INCOME & PUBLIC FINANCE
Gross state domestic product of assam (at 2011-12 prices).
Net state domestic product at market price, assam.
Movement of state domestic product, assam.
Gross district domestic products at current prices.
Gross district domestic products at constant prices.
Per capita net district domestic products at constant prices
The budget at a glance.
Revenue receipt of the government of assam.
Revenue expenditure of the government of assam.
Capital outlay of the government of assam.
Public debt of the government of assam.
Loans and advances by the government of assam.
Head of account-wise and act-wise revenue collection inassam.
3. PRICE
Consumer price index number for industrial workers in assam.
Consumer price index number for working class population.in assam
Wholesale price index of agricultural commodities in assam(base: 1993-94=100).
Consumer price index number for agricultural and rurallabourers in assam (base: 1986-87=100).
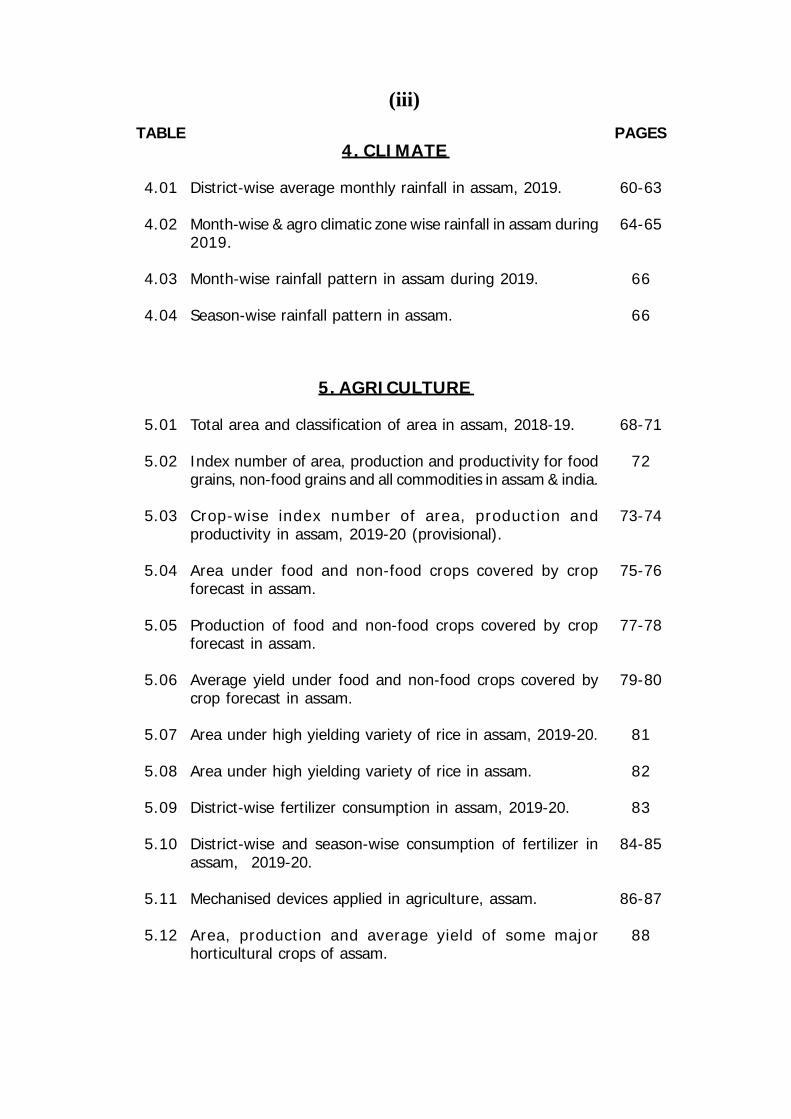
4. CLIMATE
District-wise average monthly rainfall in assam, 2019.
Month-wise & agro climatic zone wise rainfall in assam during2019.
Month-wise rainfall pattern in assam during 2019.
Season-wise rainfall pattern in assam.
5. AGRICULTURE
Total area and classification of area in assam, 2018-19.
Index number of area, production and productivity for foodgrains, non-food grains and all commodities in assam & india.
Crop-wise index number of area, production andproductivity in assam, 2019-20 (provisional).
Area under food and non-food crops covered by cropforecast in assam.
Production of food and non-food crops covered by cropforecast in assam.
Average yield under food and non-food crops covered bycrop forecast in assam.
Area under high yielding variety of rice in assam, 2019-20.
Area under high yielding variety of rice in assam.
District-wise fertilizer consumption in assam, 2019-20.
District-wise and season-wise consumption of fertilizer inassam, 2019-20.
Mechanised devices applied in agriculture, assam.
Area, production and average yield of some majorhorticultural crops of assam.
TABLE
4.01
4.02
4.03
4.04
5.01
5.02
5.03
5.04
5.05
5.06
5.07
5.08
5.09
5.10
5.11
5.12
PAGES
60-63
64-65
66
66
68-71
72
73-74
75-76
77-78
79-80
81
82
83
84-85
86-87
88
(iii)

6. IRRIGATION & WATER RESOURCES
District-wise & category-wise irrigation potential createdthrough govt. irrigation schemes in assam, 2019-20.
District-wise information on area actually utilised by major/medium projects & minor irrigation schemes.
District-wise & season-wise information on area irrigated inassam through burge.
District-wise gross area irrigated under govt. irrigationfacilities in assam.
District-wise number of irrigation schemes in assam.
Sector-wise irrigation potential created in assam 2019-20(cumulative).
Achievement of additional irrigation potential created inassam, 2019-20.
District-wise net area irrigated in assam.
District-wise damage of flood management structures(embankments and others) in assam during the flood of2019.
Achievement of water resource department in assam.
7. LIVESTOCK AND VETERINARY
Total livestock and poultry population of assam as per 20thlive stock census, 2019.
Production of milk, egg and meat in assam.
Total livestock and poultry population of assam as per livestock census.
District-wise veterinary facilities in assam, 2019-20.
Performance of veterinary hospitals and dispensaries inassam, 2019-20.
TABLE
6.01
6.02
6.03
6.04
6.05
6.06
6.07
6.08
6.09
6.10
7.01
7.02
7.03
7.04
7.05
PAGES
90-91
92
93
94-95
96
97
98
99
100-101
102
104-105
106
106
107
108
(iv)
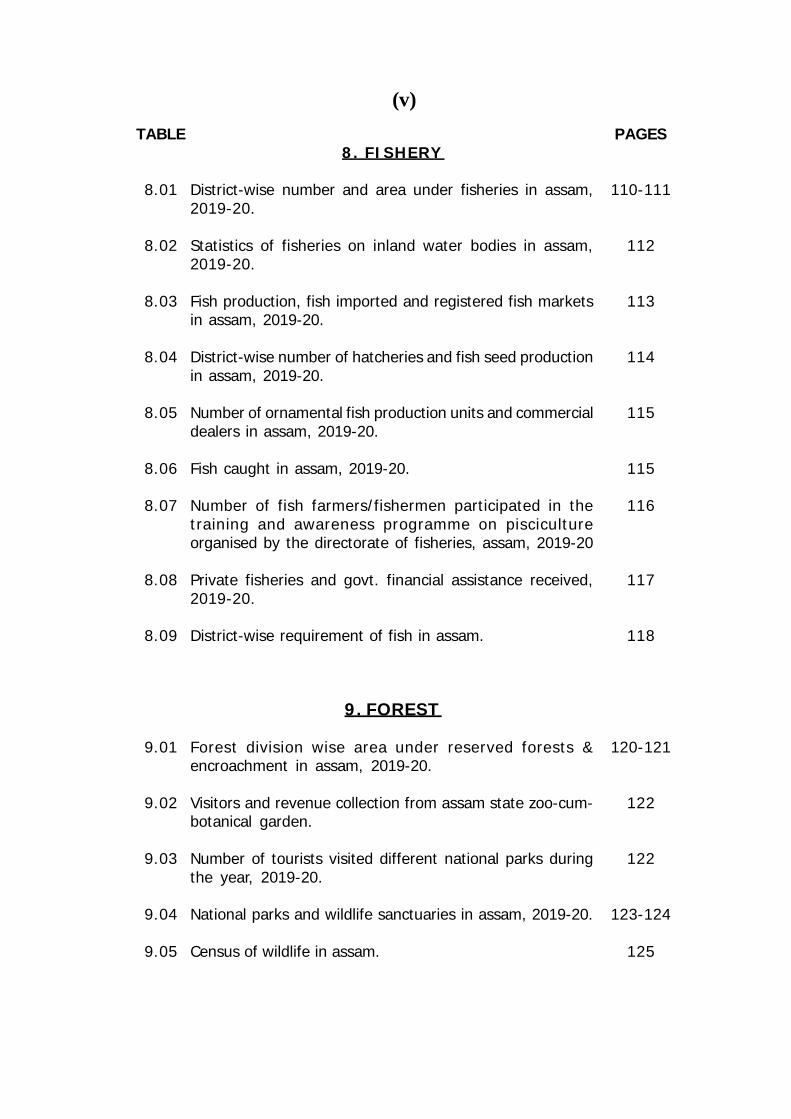
(v)
TABLE
8.01
8.02
8.03
8.04
8.05
8.06
8.07
8.08
8.09
9.01
9.02
9.03
9.04
9.05
PAGES
110-111
112
113
114
115
115
116
117
118
120-121
122
122
123-124
125
8. FISHERY
District-wise number and area under fisheries in assam,2019-20.
Statistics of fisheries on inland water bodies in assam,2019-20.
Fish production, fish imported and registered fish marketsin assam, 2019-20.
District-wise number of hatcheries and fish seed productionin assam, 2019-20.
Number of ornamental fish production units and commercialdealers in assam, 2019-20.
Fish caught in assam, 2019-20.
Number of fish farmers/fishermen participated in thetraining and awareness programme on piscicultureorganised by the directorate of fisheries, assam, 2019-20
Private fisheries and govt. financial assistance received,2019-20.
District-wise requirement of fish in assam.
9. FOREST
Forest division wise area under reserved forests &encroachment in assam, 2019-20.
Visitors and revenue collection from assam state zoo-cum-botanical garden.
Number of tourists visited different national parks duringthe year, 2019-20.
National parks and wildlife sanctuaries in assam, 2019-20.
Census of wildlife in assam.
(vi)
TABLE
9.06
9.07
9.08
9.09
9.10
9.11
10.01
10.02
10.03
10.04
10.05
10.06
10.07
10.08
10.09
10.10
PAGES
126
126
127
128-130
131
132
134-135
136-137
138
139-143
144-145
146-148
149
150-157
158
159
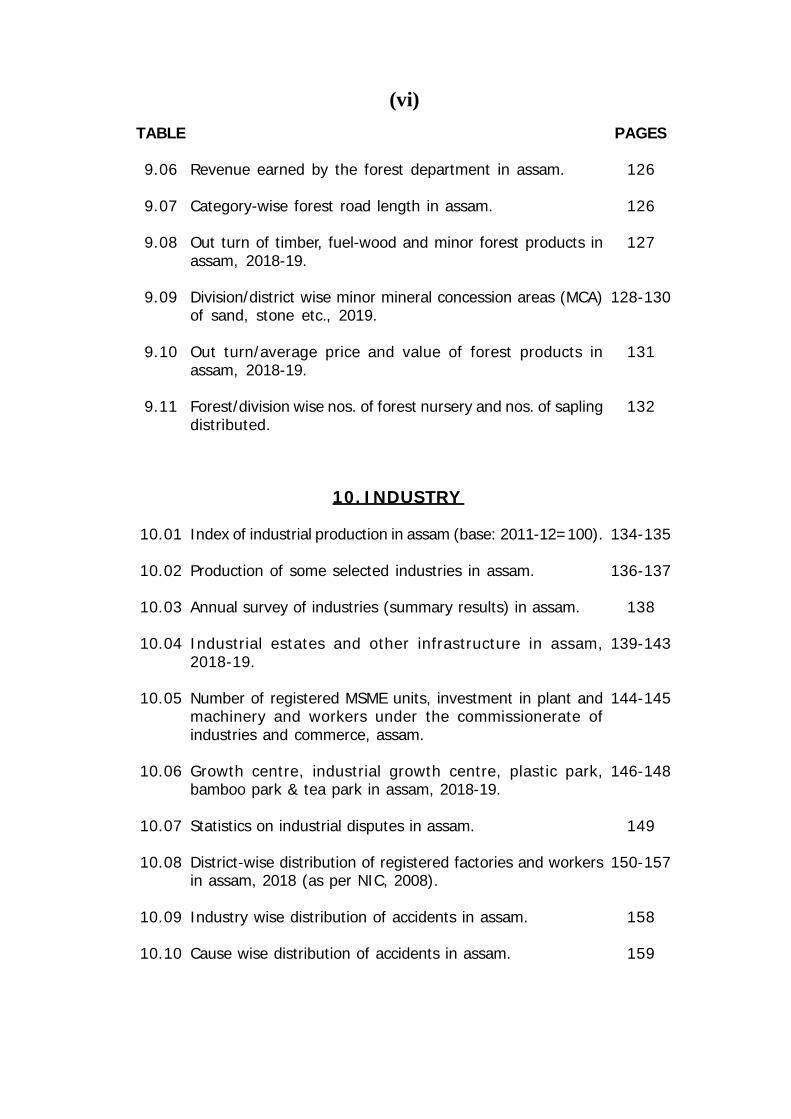
Revenue earned by the forest department in assam.
Category-wise forest road length in assam.
Out turn of timber, fuel-wood and minor forest products inassam, 2018-19.
Division/district wise minor mineral concession areas (MCA)of sand, stone etc., 2019.
Out turn/average price and value of forest products inassam, 2018-19.
Forest/division wise nos. of forest nursery and nos. of saplingdistributed.
10. INDUSTRY
Index of industrial production in assam (base: 2011-12=100).
Production of some selected industries in assam.
Annual survey of industries (summary results) in assam.
Industrial estates and other infrastructure in assam,2018-19.
Number of registered MSME units, investment in plant andmachinery and workers under the commissionerate ofindustries and commerce, assam.
Growth centre, industrial growth centre, plastic park,bamboo park & tea park in assam, 2018-19.
Statistics on industrial disputes in assam.
District-wise distribution of registered factories and workersin assam, 2018 (as per NIC, 2008).
Industry wise distribution of accidents in assam.
Cause wise distribution of accidents in assam.
(vii)
TABLE
11.01
11.02
11.03
12.01
12.02
12.03
12.04
13.01
13.02
13.03
PAGES
162-163
164
165
168
169
170
170
172
173
174
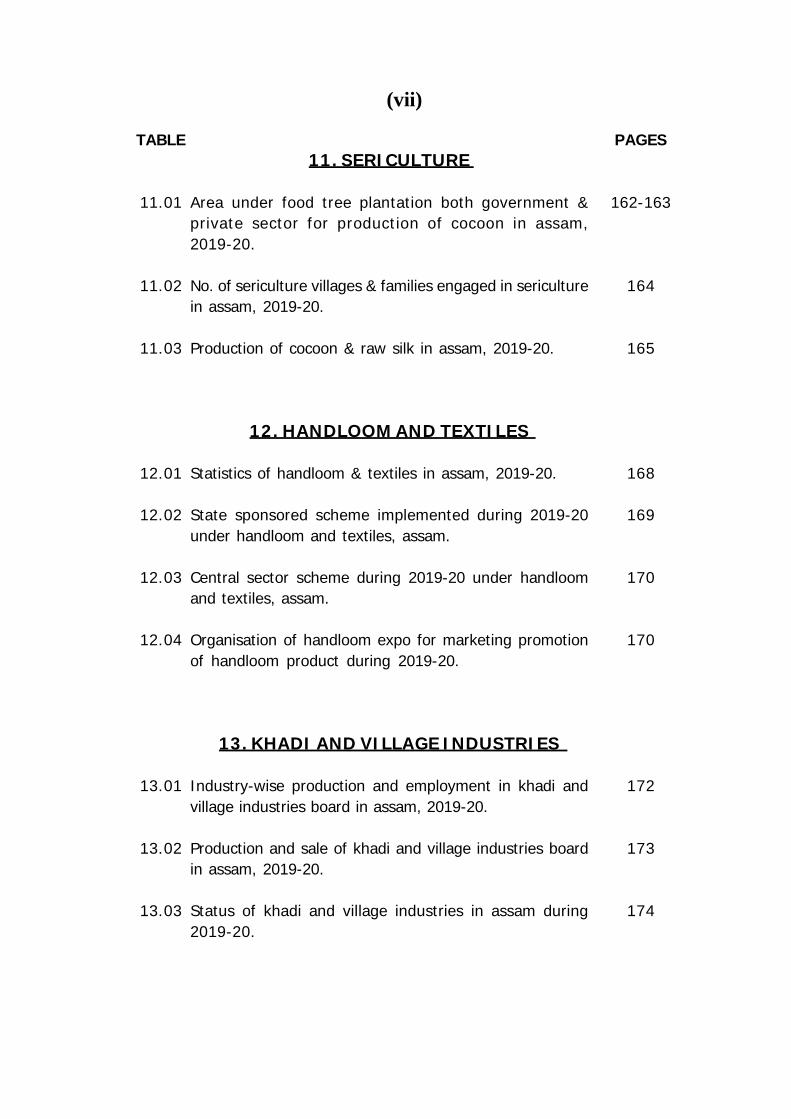
11. SERICULTURE
Area under food tree plantation both government &private sector for production of cocoon in assam,2019-20.
No. of sericulture villages & families engaged in sericulturein assam, 2019-20.
Production of cocoon & raw silk in assam, 2019-20.
12. HANDLOOM AND TEXTILES
Statistics of handloom & textiles in assam, 2019-20.
State sponsored scheme implemented during 2019-20under handloom and textiles, assam.
Central sector scheme during 2019-20 under handloomand textiles, assam.
Organisation of handloom expo for marketing promotionof handloom product during 2019-20.
13. KHADI AND VILLAGE INDUSTRIES
Industry-wise production and employment in khadi andvillage industries board in assam, 2019-20.
Production and sale of khadi and village industries boardin assam, 2019-20.
Status of khadi and village industries in assam during2019-20.
TABLE
14.01
14.02
14.03
14.04
14.05
14.06
14.07
14.08
15.01
15.02
15.03
15.04
15.05
PAGES
176
177
178
178
179-180
181
181
182
184
184
185
186
187
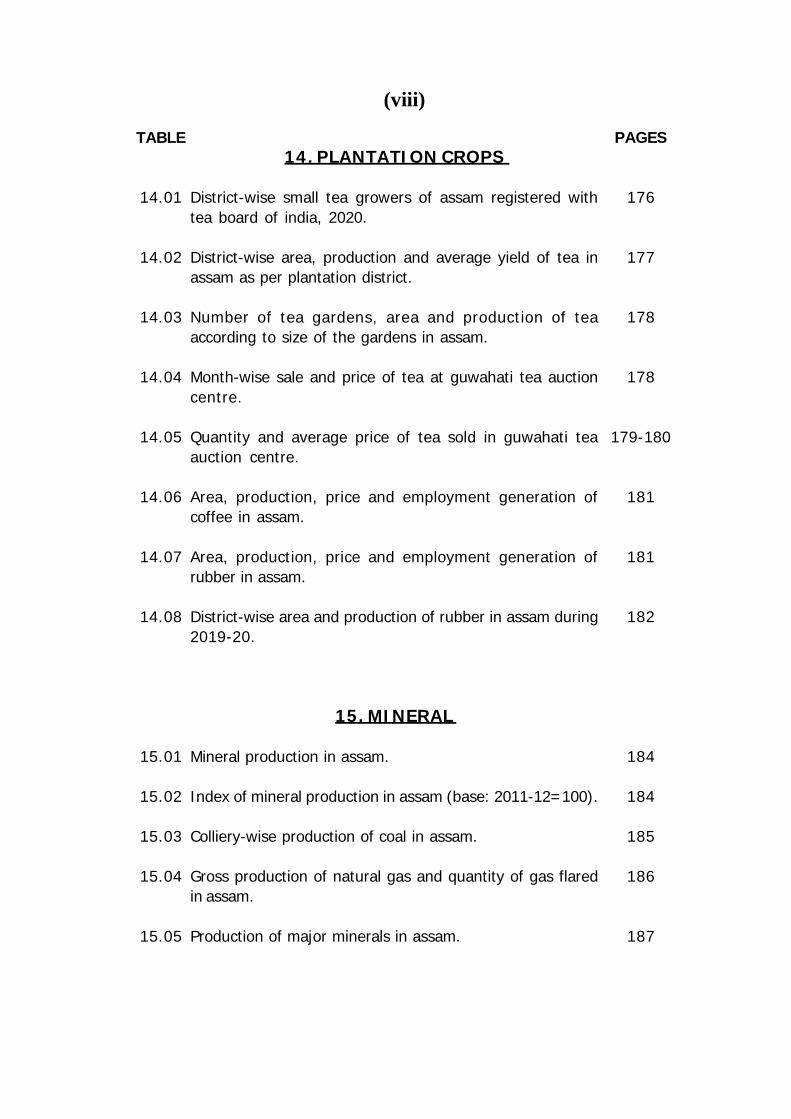
14. PLANTATION CROPS
District-wise small tea growers of assam registered withtea board of india, 2020.
District-wise area, production and average yield of tea inassam as per plantation district.
Number of tea gardens, area and production of teaaccording to size of the gardens in assam.
Month-wise sale and price of tea at guwahati tea auctioncentre.
Quantity and average price of tea sold in guwahati teaauction centre.
Area, production, price and employment generation ofcoffee in assam.
Area, production, price and employment generation ofrubber in assam.
District-wise area and production of rubber in assam during2019-20.
15. MINERAL
Mineral production in assam.
Index of mineral production in assam (base: 2011-12=100).
Colliery-wise production of coal in assam.
Gross production of natural gas and quantity of gas flaredin assam.
Production of major minerals in assam.
(viii)

TABLE
16.01
16.02
16.03
16.04
16.05
16.06
16.07
16.08
16.09
16.10
16.11
16.12
17.01
17.02
17.03
17.04
17.05
PAGES
190
190
191
192
192
193
194
194
195
196-197
198
199
202
203
204
205
206
16. POWER
Requirement and shortage of electricity in assam.
Transmission, distribution and commercial losses in assam.
Circle-wise number of consumers in assam.
Sector-wise electricity consumption in assam.
Electricity purchased in assam.
Installed capacity and generation of electricity in assam.
Source-wise electricity in assam generated by APGCL.
Voltage level-wise existing transmission lines.
Renewable energy related district-wise physical performanceof agriculture department.
Physical performance of APDCL during 2019-20.
Nos. of solar photovoltaic power plant (off grid) installedunder jawaharlal nehru national solar mission (JNNSM) &other demonstration project/programme.
District-wise performance related to renewable energy, gridconnected rooftop solar.
17. ROADS
Road lengths of public works department (PWD) in assam,as on 2020.
District-wise and category-wise lengths of roads under PWDin assam, as on 31-03-2020.
Length of roads per lakh of population & per 100 sq. km.of geographical area in assam, as on 31-03-2020.
District-wise habitation connectivity status from phase-I andworks in progress under PMGSY as on 31-03-2020.
District-wise length of roads according to type undernational highways in assam, 2019-20.
(ix)
TABLE
18.01
18.02
18.03
18.04
18.05
18.06
18.07
18.08
18.09
18.10
18.11
19.01
19.02
19.03
19.04
19.05
19.06
PAGES
208
209
210-213
214-217
218-221
222
223
224
225
226-227
228
230
231
231
232
233
234
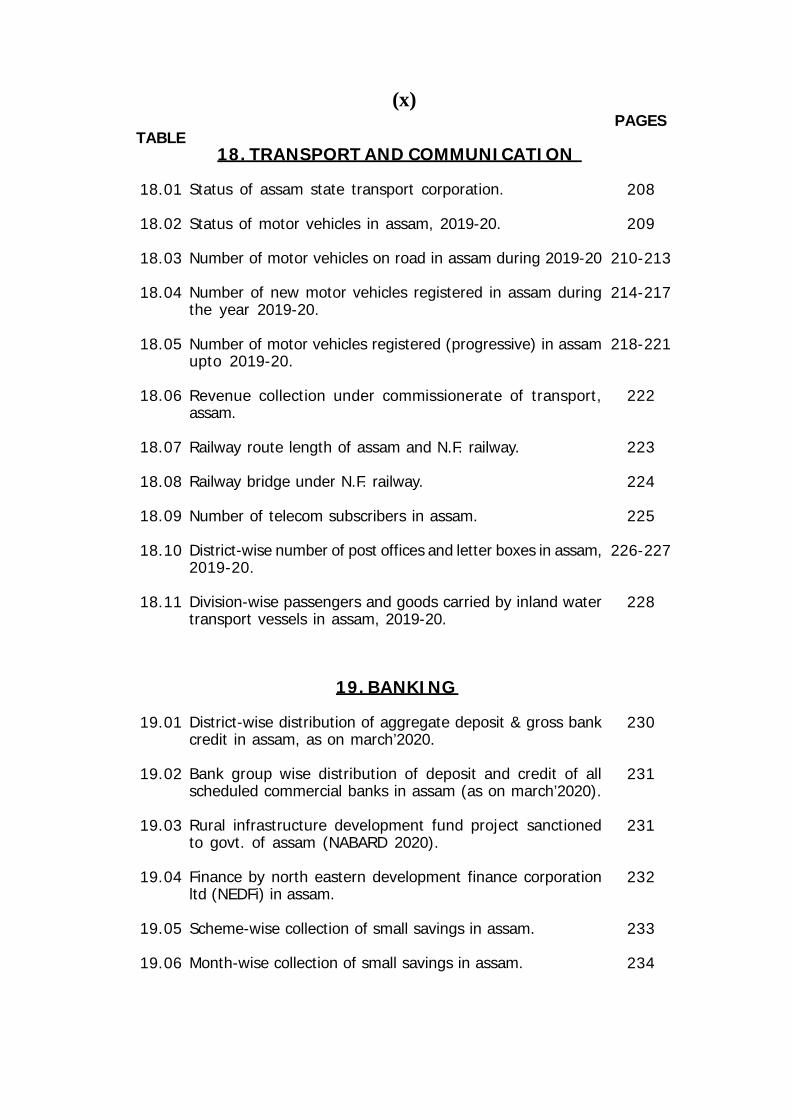
18. TRANSPORT AND COMMUNICATION
Status of assam state transport corporation.
Status of motor vehicles in assam, 2019-20.
Number of motor vehicles on road in assam during 2019-20
Number of new motor vehicles registered in assam duringthe year 2019-20.
Number of motor vehicles registered (progressive) in assamupto 2019-20.
Revenue collection under commissionerate of transport,assam.
Railway route length of assam and N.F. railway.
Railway bridge under N.F. railway.
Number of telecom subscribers in assam.
District-wise number of post offices and letter boxes in assam,2019-20.
Division-wise passengers and goods carried by inland watertransport vessels in assam, 2019-20.
19. BANKING
District-wise distribution of aggregate deposit & gross bankcredit in assam, as on march’2020.
Bank group wise distribution of deposit and credit of allscheduled commercial banks in assam (as on march’2020).
Rural infrastructure development fund project sanctionedto govt. of assam (NABARD 2020).
Finance by north eastern development finance corporationltd (NEDFi) in assam.
Scheme-wise collection of small savings in assam.
Month-wise collection of small savings in assam.
(x)
PAGES
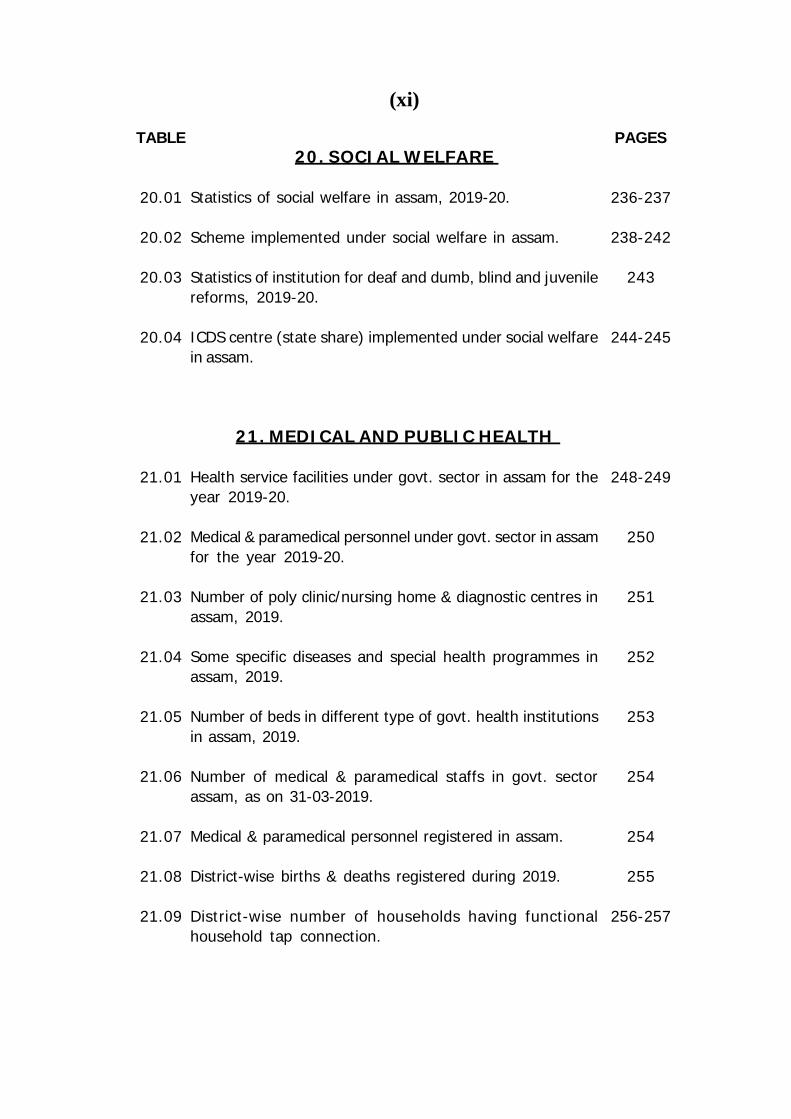
236-237
238-242
243
244-245
248-249
250
251
252
253
254
254
255
256-257
20. SOCIAL WELFARE
Statistics of social welfare in assam, 2019-20.
Scheme implemented under social welfare in assam.
Statistics of institution for deaf and dumb, blind and juvenilereforms, 2019-20.
ICDS centre (state share) implemented under social welfarein assam.
21. MEDICAL AND PUBLIC HEALTH
Health service facilities under govt. sector in assam for theyear 2019-20.
Medical & paramedical personnel under govt. sector in assamfor the year 2019-20.
Number of poly clinic/nursing home & diagnostic centres inassam, 2019.
Some specific diseases and special health programmes inassam, 2019.
Number of beds in different type of govt. health institutionsin assam, 2019.
Number of medical & paramedical staffs in govt. sectorassam, as on 31-03-2019.
Medical & paramedical personnel registered in assam.
District-wise births & deaths registered during 2019.
District-wise number of households having functionalhousehold tap connection.
TABLE
20.01
20.02
20.03
20.04
21.01
21.02
21.03
21.04
21.05
21.06
21.07
21.08
21.09
(xi)

TABLE
21.10
21.11
21.12
21.13
21.14
21.15
21.16
21.17
21.18
21.19
21.20
21.21
21.22
21.23
PAGES
258
259
260
260
261
262
263
264
265
266
267
268
270
271
Physical achievement under jal jeevan mission (JJM),2019-20.
Estimated birth rate, death rate & infant mortality rate inassam.
Child (0-4 years) and infant mortality indicators in assam.
Fertility indicators in assam.
Number of family welfare centres in assam for the year2018-19.
Universal immunization programme performance in assam,2019-20.
District-wise number of habitations/villages having drinkingwater facilities in assam.
Physical target and achievement under national ruraldrinking water supply programme (NRDWP).
Physical target and achievement under swachh bharatmission (gramin) in assam.
Financial performance under swachh bharat mission (urban)in assam.
Financial performance under swachh bharat mission (gramin)in assam.
Physical target & achievement under swachh bharat mission(urban) in assam, 2018-19.
District-wise nos. of rapid test done, total nos. of functionalhospitals, total nos. of ccc and total nos. of screeningcentres as on 31st dec 2020.
District-wise nos. of covid-19 test done, covid-19 positivecases, discharge and death as on 31/12/ 2020.
(xii)
PAGES
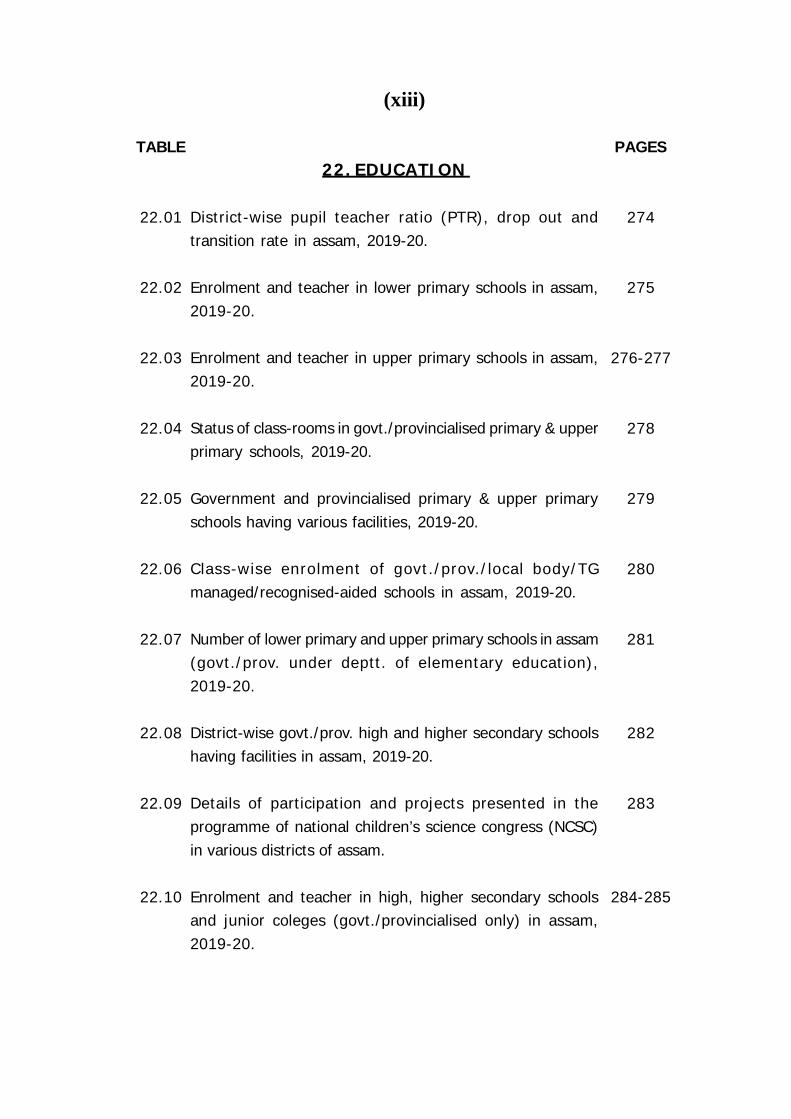
274
275
276-277
278
279
280
281
282
283
284-285
22. EDUCATION
District-wise pupil teacher ratio (PTR), drop out andtransition rate in assam, 2019-20.
Enrolment and teacher in lower primary schools in assam,2019-20.
Enrolment and teacher in upper primary schools in assam,2019-20.
Status of class-rooms in govt./provincialised primary & upperprimary schools, 2019-20.
Government and provincialised primary & upper primaryschools having various facilities, 2019-20.
Class-wise enrolment of govt./prov./local body/TGmanaged/recognised-aided schools in assam, 2019-20.
Number of lower primary and upper primary schools in assam(govt./prov. under deptt. of elementary education),2019-20.
District-wise govt./prov. high and higher secondary schoolshaving facilities in assam, 2019-20.
Details of participation and projects presented in theprogramme of national children’s science congress (NCSC)in various districts of assam.
Enrolment and teacher in high, higher secondary schoolsand junior coleges (govt./provincialised only) in assam,2019-20.
TABLE
22.01
22.02
22.03
22.04
22.05
22.06
22.07
22.08
22.09
22.10
(xiii)
PAGES
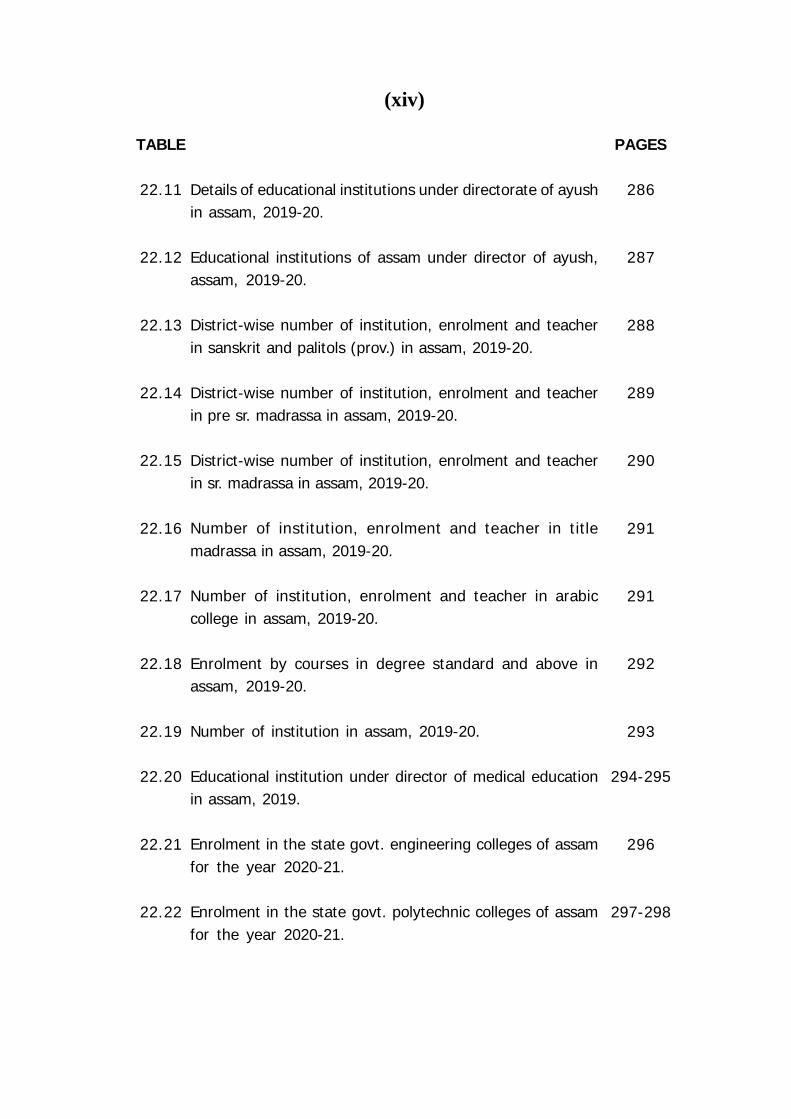
286
287
288
289
290
291
291
292
293
294-295
296
297-298
Details of educational institutions under directorate of ayushin assam, 2019-20.
Educational institutions of assam under director of ayush,assam, 2019-20.
District-wise number of institution, enrolment and teacherin sanskrit and palitols (prov.) in assam, 2019-20.
District-wise number of institution, enrolment and teacherin pre sr. madrassa in assam, 2019-20.
District-wise number of institution, enrolment and teacherin sr. madrassa in assam, 2019-20.
Number of institution, enrolment and teacher in titlemadrassa in assam, 2019-20.
Number of institution, enrolment and teacher in arabiccollege in assam, 2019-20.
Enrolment by courses in degree standard and above inassam, 2019-20.
Number of institution in assam, 2019-20.
Educational institution under director of medical educationin assam, 2019.
Enrolment in the state govt. engineering colleges of assamfor the year 2020-21.
Enrolment in the state govt. polytechnic colleges of assamfor the year 2020-21.
TABLE
22.11
22.12
22.13
22.14
22.15
22.16
22.17
22.18
22.19
22.20
22.21
22.22
(xiv)
TABLE
23.01
23.02
23.03
23.04
23.05
23.06
23.07
23.08
23.09
23.10
23.11
23.12
23.13
23.14
PAGES
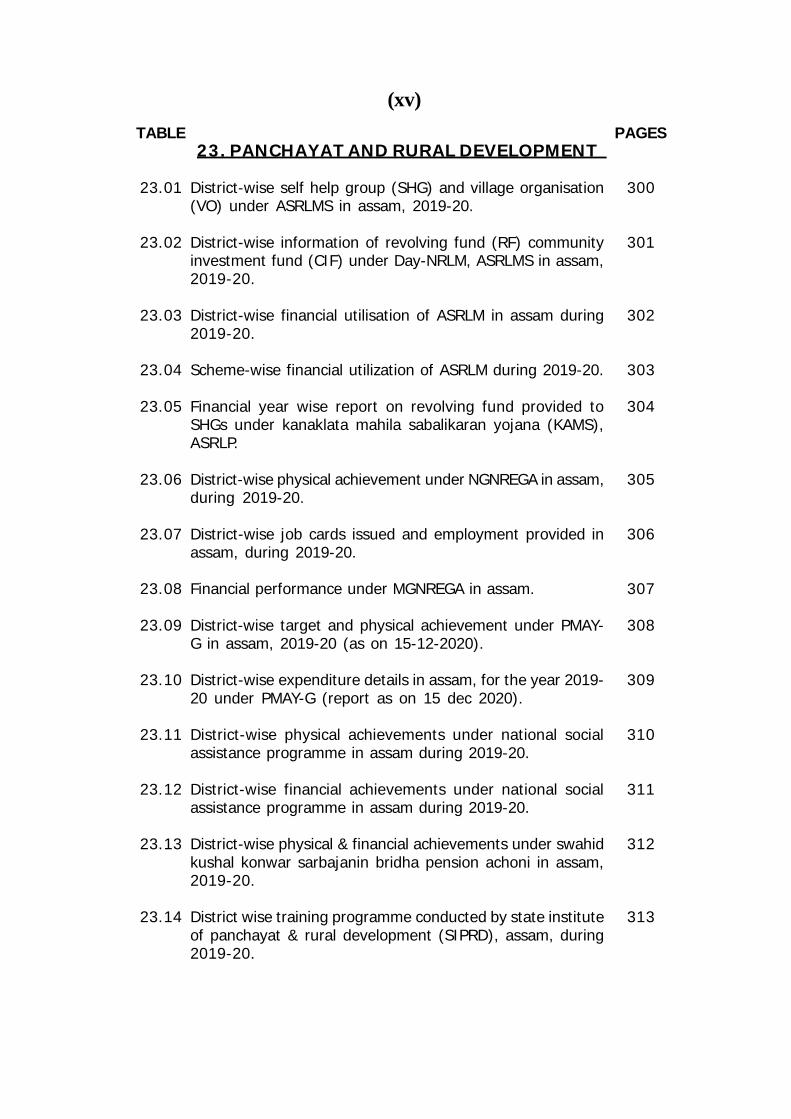
300
301
302
303
304
305
306
307
308
309
310
311
312
313
23. PANCHAYAT AND RURAL DEVELOPMENT
District-wise self help group (SHG) and village organisation(VO) under ASRLMS in assam, 2019-20.
District-wise information of revolving fund (RF) communityinvestment fund (CIF) under Day-NRLM, ASRLMS in assam,2019-20.
District-wise financial utilisation of ASRLM in assam during2019-20.
Scheme-wise financial utilization of ASRLM during 2019-20.
Financial year wise report on revolving fund provided toSHGs under kanaklata mahila sabalikaran yojana (KAMS),ASRLP.
District-wise physical achievement under NGNREGA in assam,during 2019-20.
District-wise job cards issued and employment provided inassam, during 2019-20.
Financial performance under MGNREGA in assam.
District-wise target and physical achievement under PMAY-G in assam, 2019-20 (as on 15-12-2020).
District-wise expenditure details in assam, for the year 2019-20 under PMAY-G (report as on 15 dec 2020).
District-wise physical achievements under national socialassistance programme in assam during 2019-20.
District-wise financial achievements under national socialassistance programme in assam during 2019-20.
District-wise physical & financial achievements under swahidkushal konwar sarbajanin bridha pension achoni in assam,2019-20.
District wise training programme conducted by state instituteof panchayat & rural development (SIPRD), assam, during2019-20.
(xv)
TABLE
24.01
24.02
24.03
24.04
24.05
24.06
24.07
24.08
24.09
24.10
24.11
24.12
24.13
24.14
24.15
PAGES
316
317-318
319
320-321
322
323
324-326
327
328
328
329
330
331
332
333
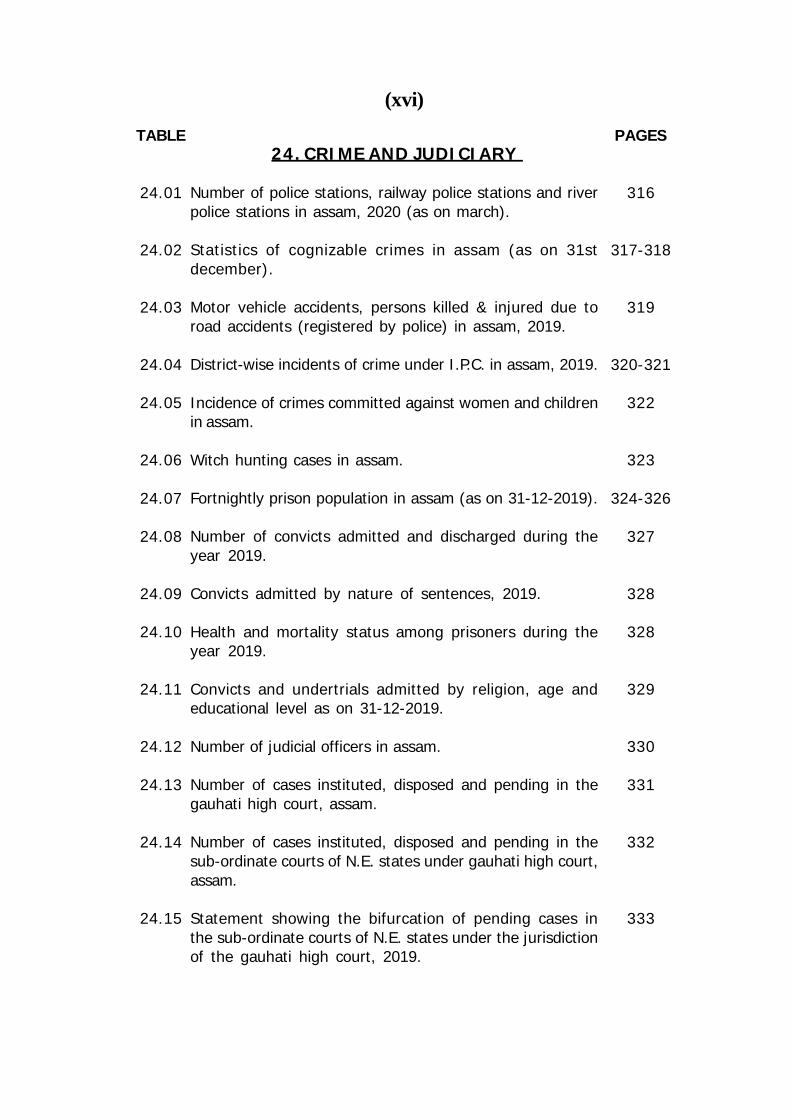
24. CRIME AND JUDICIARY
Number of police stations, railway police stations and riverpolice stations in assam, 2020 (as on march).
Statistics of cognizable crimes in assam (as on 31stdecember).
Motor vehicle accidents, persons killed & injured due toroad accidents (registered by police) in assam, 2019.
District-wise incidents of crime under I.P.C. in assam, 2019.
Incidence of crimes committed against women and childrenin assam.
Witch hunting cases in assam.
Fortnightly prison population in assam (as on 31-12-2019).
Number of convicts admitted and discharged during theyear 2019.
Convicts admitted by nature of sentences, 2019.
Health and mortality status among prisoners during theyear 2019.
Convicts and undertrials admitted by religion, age andeducational level as on 31-12-2019.
Number of judicial officers in assam.
Number of cases instituted, disposed and pending in thegauhati high court, assam.
Number of cases instituted, disposed and pending in thesub-ordinate courts of N.E. states under gauhati high court,assam.
Statement showing the bifurcation of pending cases inthe sub-ordinate courts of N.E. states under the jurisdictionof the gauhati high court, 2019.
(xvi)
PAGES
336-337
338-339
340
341
342
343
346
347
348
349
350
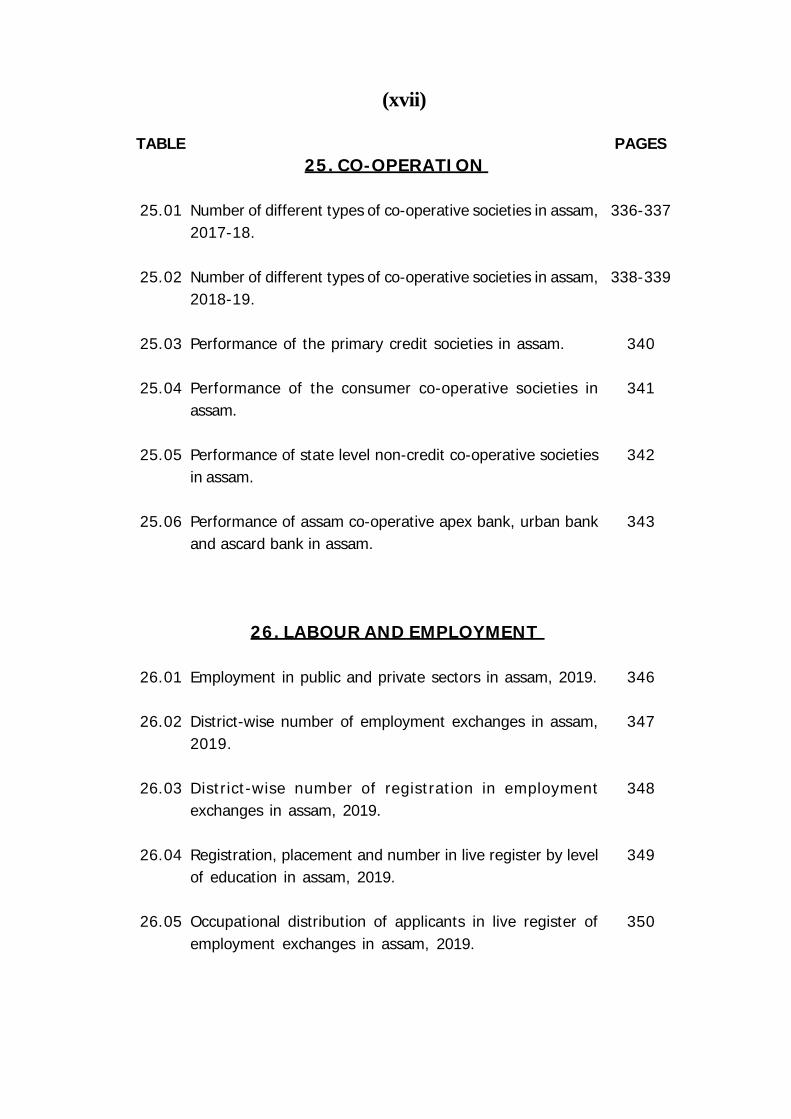
25. CO-OPERATION
Number of different types of co-operative societies in assam,2017-18.
Number of different types of co-operative societies in assam,2018-19.
Performance of the primary credit societies in assam.
Performance of the consumer co-operative societies inassam.
Performance of state level non-credit co-operative societiesin assam.
Performance of assam co-operative apex bank, urban bankand ascard bank in assam.
26. LABOUR AND EMPLOYMENT
Employment in public and private sectors in assam, 2019.
District-wise number of employment exchanges in assam,2019.
District-wise number of registration in employmentexchanges in assam, 2019.
Registration, placement and number in live register by levelof education in assam, 2019.
Occupational distribution of applicants in live register ofemployment exchanges in assam, 2019.
TABLE
25.01
25.02
25.03
25.04
25.05
25.06
26.01
26.02
26.03
26.04
26.05
(xvii)
PAGES
352
353
354
355
356
357
357
360-361
362-363
364
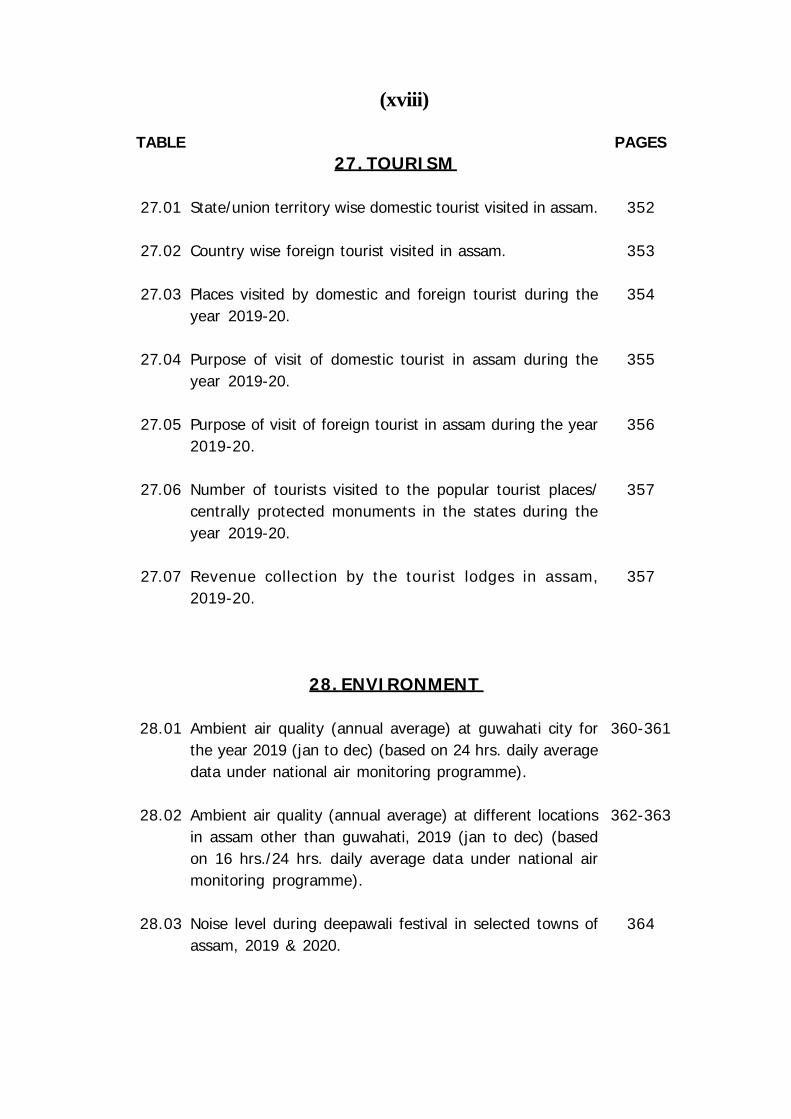
27. TOURISM
State/union territory wise domestic tourist visited in assam.
Country wise foreign tourist visited in assam.
Places visited by domestic and foreign tourist during theyear 2019-20.
Purpose of visit of domestic tourist in assam during theyear 2019-20.
Purpose of visit of foreign tourist in assam during the year2019-20.
Number of tourists visited to the popular tourist places/centrally protected monuments in the states during theyear 2019-20.
Revenue collection by the tourist lodges in assam,2019-20.
28. ENVIRONMENT
Ambient air quality (annual average) at guwahati city forthe year 2019 (jan to dec) (based on 24 hrs. daily averagedata under national air monitoring programme).
Ambient air quality (annual average) at different locationsin assam other than guwahati, 2019 (jan to dec) (basedon 16 hrs./24 hrs. daily average data under national airmonitoring programme).
Noise level during deepawali festival in selected towns ofassam, 2019 & 2020.
TABLE
27.01
27.02
27.03
27.04
27.05
27.06
27.07
28.01
28.02
28.03
(xviii)
PAGES
366
366
367
368
369
370
371-372
373
374
376-387
390-396
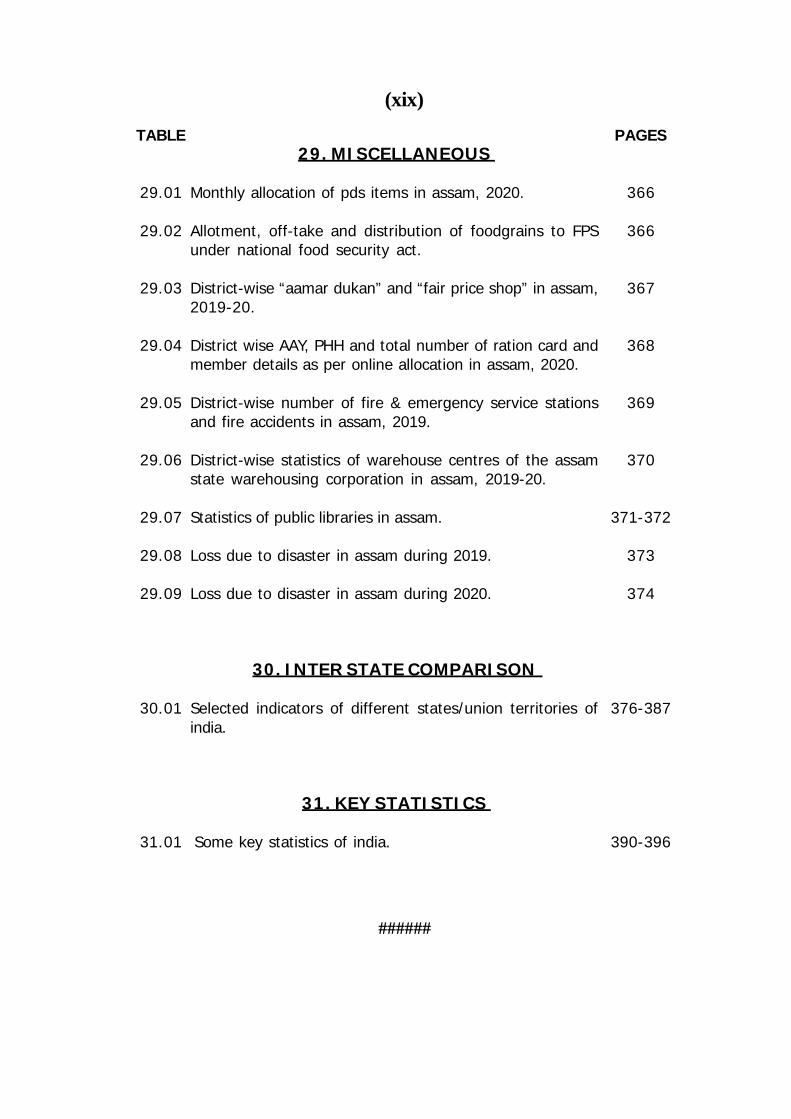
29. MISCELLANEOUS
Monthly allocation of pds items in assam, 2020.
Allotment, off-take and distribution of foodgrains to FPSunder national food security act.
District-wise “aamar dukan” and “fair price shop” in assam,2019-20.
District wise AAY, PHH and total number of ration card andmember details as per online allocation in assam, 2020.
District-wise number of fire & emergency service stationsand fire accidents in assam, 2019.
District-wise statistics of warehouse centres of the assamstate warehousing corporation in assam, 2019-20.
Statistics of public libraries in assam.
Loss due to disaster in assam during 2019.
Loss due to disaster in assam during 2020.
30. INTER STATE COMPARISON
Selected indicators of different states/union territories ofindia.
31. KEY STATISTICS
Some key statistics of india.
TABLE
29.01
29.02
29.03
29.04
29.05
29.06
29.07
29.08
29.09
30.01
31.01
(xix)
######

.
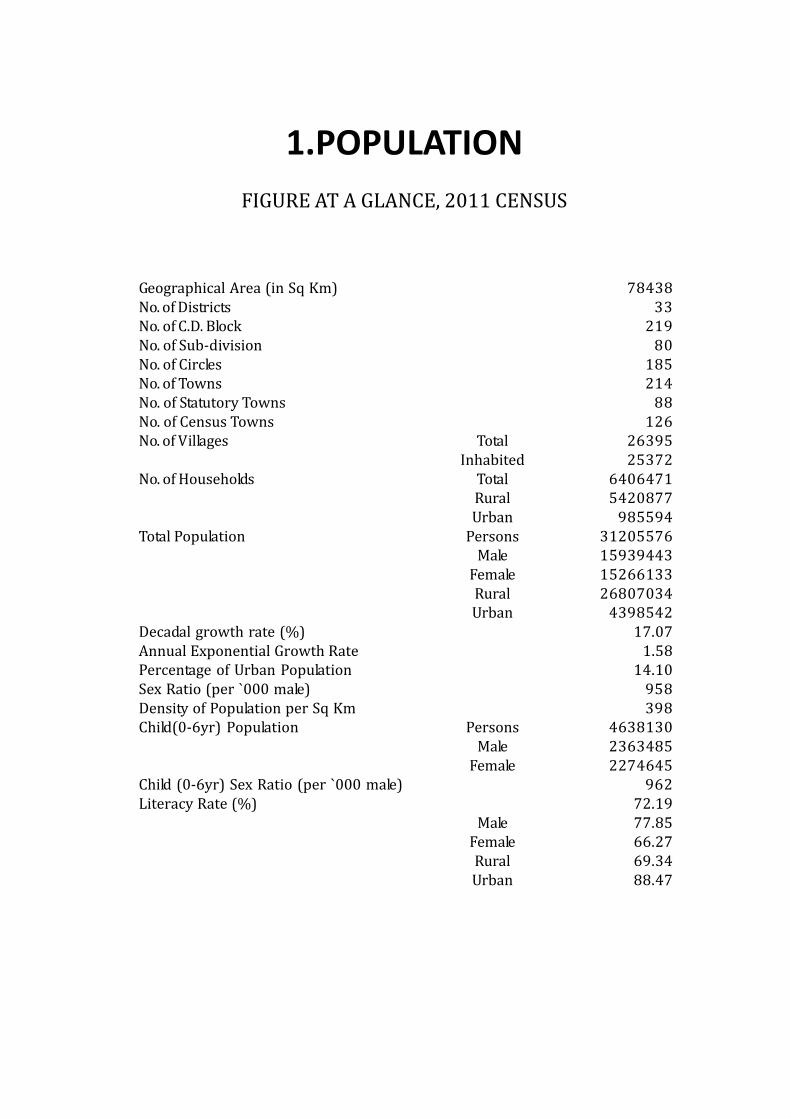
1.POPULATIONFIGURE AT A GLANCE, 2011 CENSUSGeographical Area (in Sq Km)No. of DistrictsNo. of C.D. BlockNo. of Sub-divisionNo. of CirclesNo. of TownsNo. of Statutory TownsNo. of Census TownsNo. of VillagesNo. of HouseholdsTotal PopulationDecadal growth rate (%)Annual Exponential Growth RatePercentage of Urban PopulationSex Ratio (per `000 male)Density of Population per Sq KmChild(0-6yr) PopulationChild (0-6yr) Sex Ratio (per `000 male)Literacy Rate (%)
TotalInhabitedTotalRuralUrbanPersonsMaleFemaleRuralUrban
PersonsMaleFemaleMaleFemaleRuralUrban
7843833219801852148812626395253726406471542087798559431205576159394431526613326807034439854217.071.5814.1095839846381302363485227464596272.1977.8566.2769.3488.47* including 28 States and 8 Union Territories.

- 2 -
TABLE-1.01DISTRICT-WISE AREA, SUB-DIVISIONS, TOWNS, VILLAGES, BLOCKS
AND GAON PANCHAYATS IN ASSAM, 2011
1 2 3 4 5 6 7 8 9 10
KokrajharDhubriGoalparaBarpetaMorigaonNagaonSonitpurLakhimpurDhemajiTinsukiaDibrugarhSivasagarJorhatGolaghatKarbi AnglongDima HasaoCacharKarimganjHailakandiBongaigaonChirangKamrupKamrup MetroNalbariBaksaDarrangUdalguriBiswanathCharaideoHojaiMajuliSouth SalmaraWest K.AnglongAssam
District
Tota
l
Sub-
Div
isio
n
Tow
ns(S
tatu
tory
+Ce
nsus
) No. of Villages
Inha
bite
d
CD B
lock
s
Gao
nPa
ncha
yat
Reve
nue
Circ
le
3296151118242282155125503409227732373790338115811758350273664888378618091327109319233105
95510522457158520121796108714221093
6653068
78438
422412232332243343122364312211111
80
49
11968644
1394
11754
197353
161211
233239002
214
1068777829835632
101210441184131911681348
531600
11252353
6951040
936331563508
1068216456690561800832344400248314568
26395
1053773779825598963
10081145126411361318
518571
10322165
676998915330535501
1037204455679552791790344398192280547
25372
511
812
513
7957746875
157552
1437556755234
219
0133
81129
85172102
816585937991
10200
163966265
0139
2165
075
05639671935
02200
975957476474563455456
1269
1369323221
185
Tota
l
Area(in Sq. Km)
Rura
l3280148317602246152525183368224132213728333615511666346673434866372117901316106119113031
693997
2451157320021778107413741093
6613054
77178
- 3 -
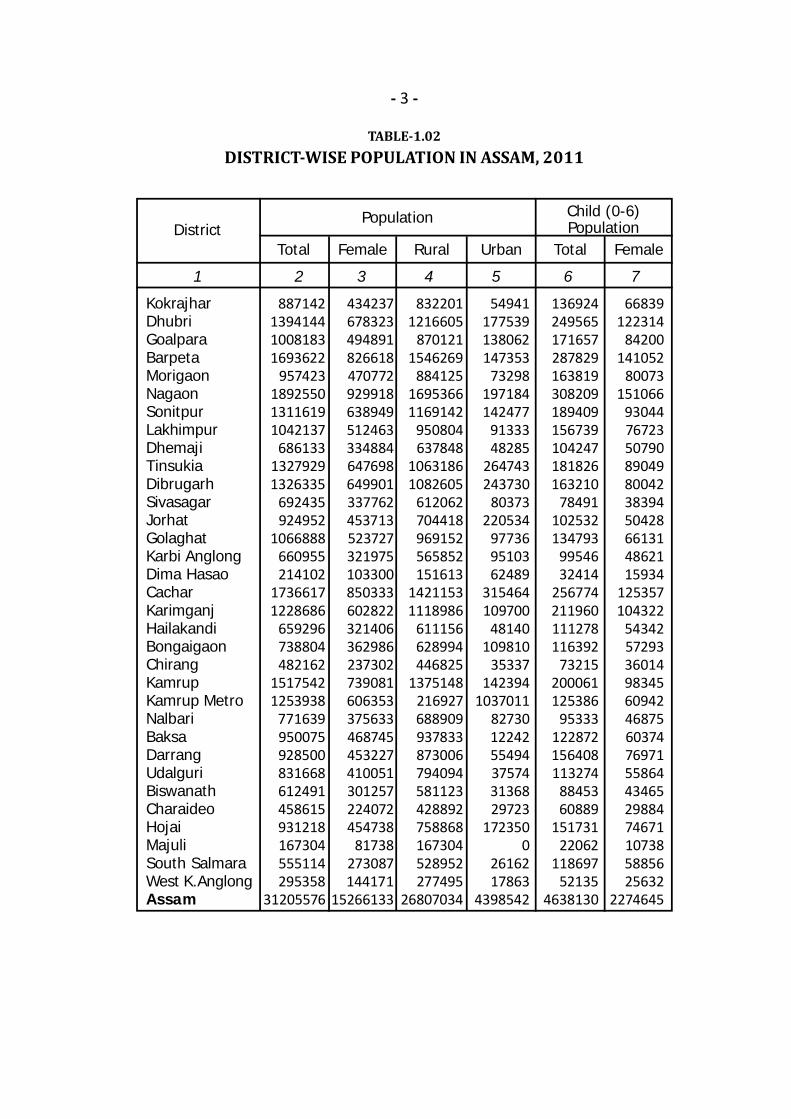
TABLE-1.02DISTRICT-WISE POPULATION IN ASSAM, 2011
1 2 3 4 5 6 7
KokrajharDhubriGoalparaBarpetaMorigaonNagaonSonitpurLakhimpurDhemajiTinsukiaDibrugarhSivasagarJorhatGolaghatKarbi AnglongDima HasaoCacharKarimganjHailakandiBongaigaonChirangKamrupKamrup MetroNalbariBaksaDarrangUdalguriBiswanathCharaideoHojaiMajuliSouth SalmaraWest K.AnglongAssam
DistrictTotal Urban
887142139414410081831693622
957423189255013116191042137
68613313279291326335
692435924952
1066888660955214102
17366171228686
659296738804482162
15175421253938
771639950075928500831668612491458615931218167304555114295358
31205576
434237678323494891826618470772929918638949512463334884647698649901337762453713523727321975103300850333602822321406362986237302739081606353375633468745453227410051301257224072454738
81738273087144171
15266133
54941177539138062147353
73298197184142477
9133348285
264743243730
80373220534
977369510362489
315464109700
48140109810
35337142394
1037011827301224255494375743136829723
1723500
2616217863
4398542
66839122314
84200141052
80073151066
93044767235079089049800423839450428661314862115934
125357104322
543425729336014983456094246875603747697155864434652988474671107385885625632
2274645
Population Child (0-6)Population
Female Total
136924249565171657287829163819308209189409156739104247181826163210
78491102532134793
9954632414
256774211960111278116392
73215200061125386
95333122872156408113274
8845360889
15173122062
11869752135
4638130
8322011216605
8701211546269
88412516953661169142
950804637848
10631861082605
612062704418969152565852151613
14211531118986
611156628994446825
1375148216927688909937833873006794094581123428892758868167304528952277495
26807034
Rural Female
- 4 -
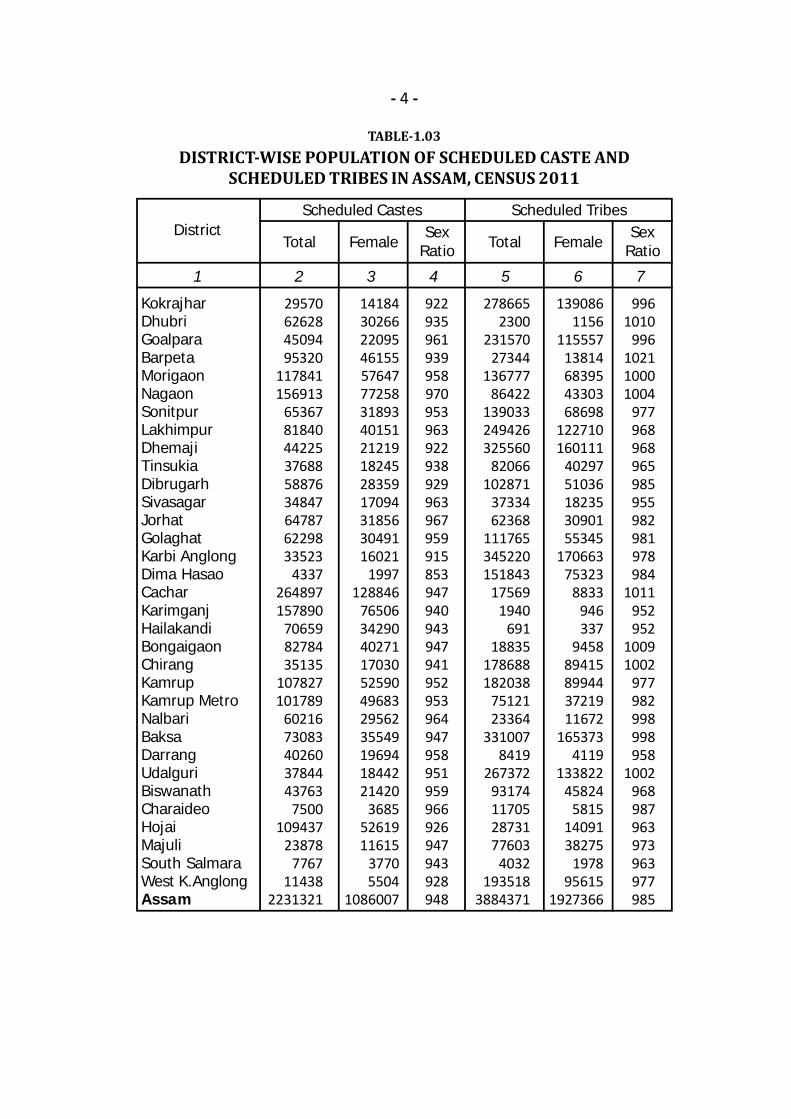
TABLE-1.03DISTRICT-WISE POPULATION OF SCHEDULED CASTE AND
SCHEDULED TRIBES IN ASSAM, CENSUS 2011
1 2 3 4 5 6 7
KokrajharDhubriGoalparaBarpetaMorigaonNagaonSonitpurLakhimpurDhemajiTinsukiaDibrugarhSivasagarJorhatGolaghatKarbi AnglongDima HasaoCacharKarimganjHailakandiBongaigaonChirangKamrupKamrup MetroNalbariBaksaDarrangUdalguriBiswanathCharaideoHojaiMajuliSouth SalmaraWest K.AnglongAssam
DistrictTotal
SexRatio Total
SexRatio
29570626284509495320
117841156913
653678184044225376885887634847647876229833523
4337264897157890
706598278435135
107827101789
6021673083402603784443763
7500109437
238787767
114382231321
141843026622095461555764777258318934015121219182452835917094318563049116021
1997128846
7650634290402711703052590496832956235549196941844221420
36855261911615
37705504
1086007
2786652300
23157027344
13677786422
139033249426325560
82066102871
3733462368
111765345220151843
175691940
69118835
178688182038
7512123364
3310078419
26737293174117052873177603
4032193518
3884371
9961010
996102110001004
977968968965985955982981978984
1011952952
10091002
977982998998958
1002968987963973963977985
Scheduled Castes Scheduled Tribes
Female Female
1390861156
11555713814683954330368698
122710160111
4029751036182353090155345
17066375323
8833946337
945889415899443721911672
1653734119
13382245824
58151409138275
197895615
1927366
922935961939958970953963922938929963967959915853947940943947941952953964947958951959966926947943928948
- 5 -
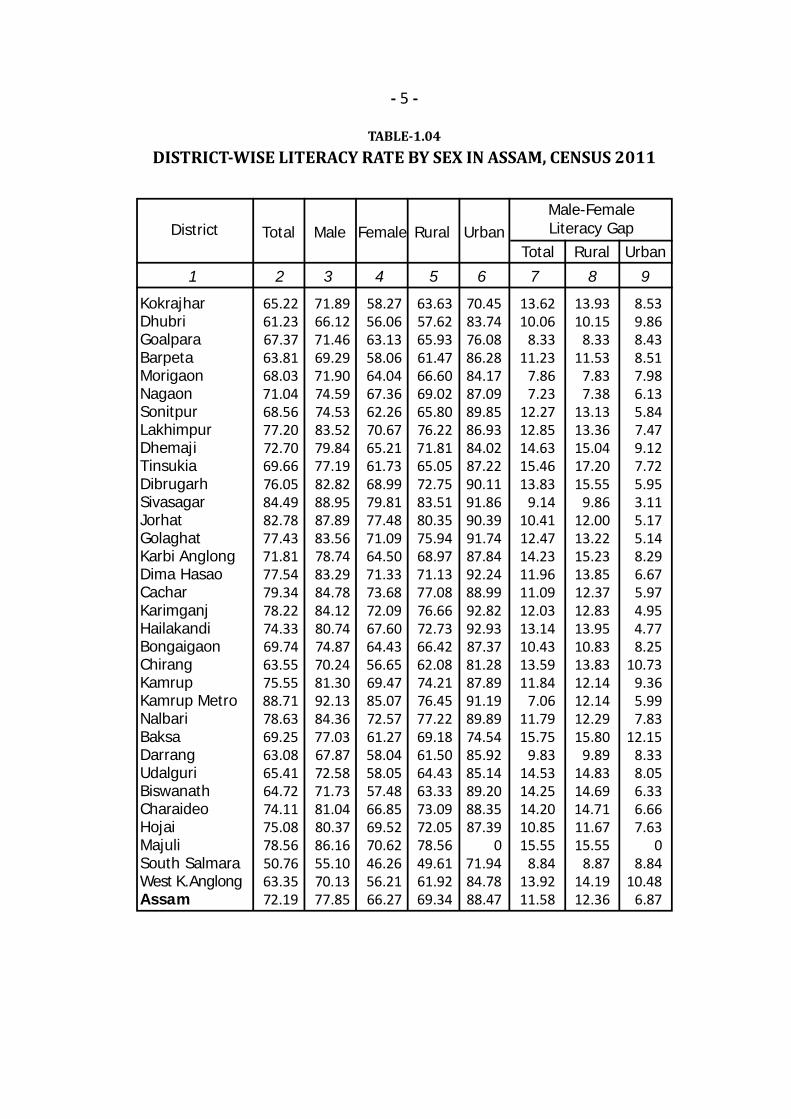
TABLE-1.04DISTRICT-WISE LITERACY RATE BY SEX IN ASSAM, CENSUS 2011
1 2 3 4 5 6 7 8 9
KokrajharDhubriGoalparaBarpetaMorigaonNagaonSonitpurLakhimpurDhemajiTinsukiaDibrugarhSivasagarJorhatGolaghatKarbi AnglongDima HasaoCacharKarimganjHailakandiBongaigaonChirangKamrupKamrup MetroNalbariBaksaDarrangUdalguriBiswanathCharaideoHojaiMajuliSouth SalmaraWest K.AnglongAssam
District Total Male Female Rural UrbanTotal Rural Urban
65.2261.2367.3763.8168.0371.0468.5677.2072.7069.6676.0584.4982.7877.4371.8177.5479.3478.2274.3369.7463.5575.5588.7178.6369.2563.0865.4164.7274.1175.0878.5650.7663.3572.19
71.8966.1271.4669.2971.9074.5974.5383.5279.8477.1982.8288.9587.8983.5678.7483.2984.7884.1280.7474.8770.2481.3092.1384.3677.0367.8772.5871.7381.0480.3786.1655.1070.1377.85
58.2756.0663.1358.0664.0467.3662.2670.6765.2161.7368.9979.8177.4871.0964.5071.3373.6872.0967.6064.4356.6569.4785.0772.5761.2758.0458.0557.4866.8569.5270.6246.2656.2166.27
63.6357.6265.9361.4766.6069.0265.8076.2271.8165.0572.7583.5180.3575.9468.9771.1377.0876.6672.7366.4262.0874.2176.4577.2269.1861.5064.4363.3373.0972.0578.5649.6161.9269.34
70.4583.7476.0886.2884.1787.0989.8586.9384.0287.2290.1191.8690.3991.7487.8492.2488.9992.8292.9387.3781.2887.8991.1989.8974.5485.9285.1489.2088.3587.39
071.9484.7888.47
13.6210.06
8.3311.23
7.867.23
12.2712.8514.6315.4613.83
9.1410.4112.4714.2311.9611.0912.0313.1410.4313.5911.84
7.0611.7915.75
9.8314.5314.2514.2010.8515.55
8.8413.9211.58
13.9310.15
8.3311.53
7.837.38
13.1313.3615.0417.2015.55
9.8612.0013.2215.2313.8512.3712.8313.9510.8313.8312.1412.1412.2915.80
9.8914.8314.6914.7111.6715.55
8.8714.1912.36
8.539.868.438.517.986.135.847.479.127.725.953.115.175.148.296.675.974.954.778.25
10.739.365.997.83
12.158.338.056.336.667.63
08.84
10.486.87
Male-FemaleLiteracy Gap
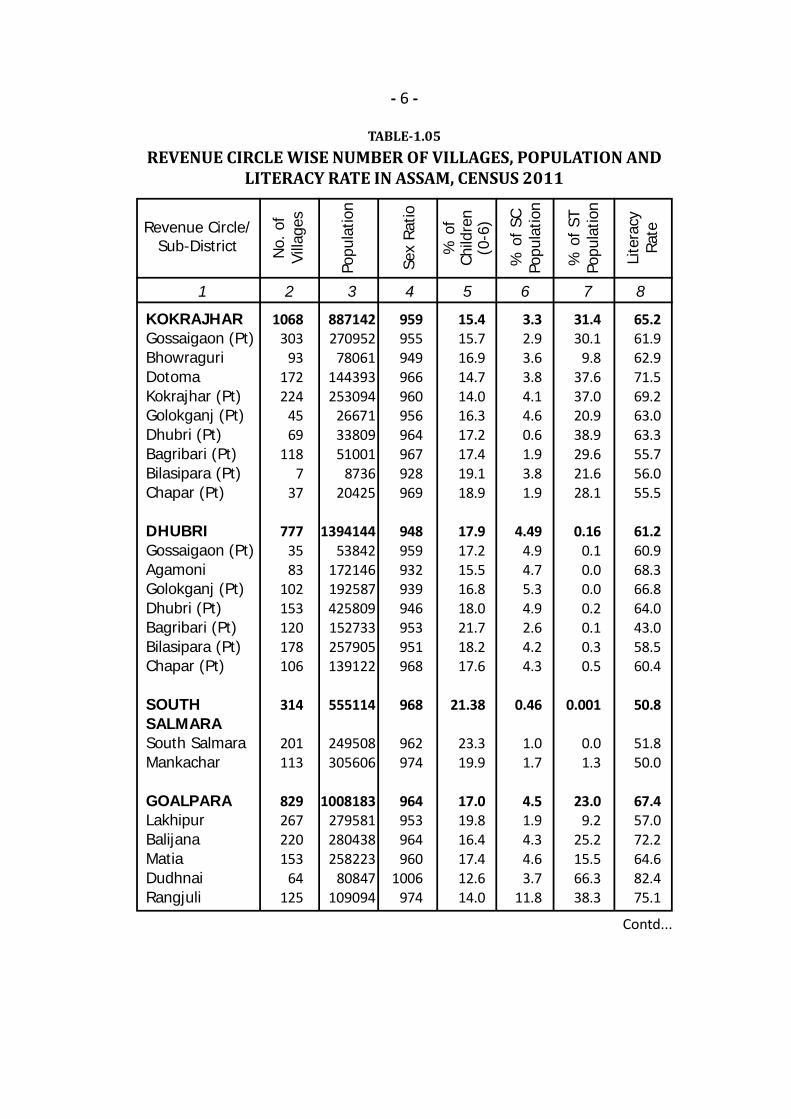
- 6 -
TABLE-1.05REVENUE CIRCLE WISE NUMBER OF VILLAGES, POPULATION AND
LITERACY RATE IN ASSAM, CENSUS 2011
1 2 3 4 5 6 7 8
KOKRAJHARGossaigaon (Pt)BhowraguriDotomaKokrajhar (Pt)Golokganj (Pt)Dhubri (Pt)Bagribari (Pt)Bilasipara (Pt)Chapar (Pt)
DHUBRIGossaigaon (Pt)AgamoniGolokganj (Pt)Dhubri (Pt)Bagribari (Pt)Bilasipara (Pt)Chapar (Pt)
SOUTHSALMARASouth SalmaraMankachar
GOALPARALakhipurBalijanaMatiaDudhnaiRangjuli
Revenue Circle/Sub-District N
o. o
fVi
llage
s
% o
fCh
ildre
n(0
-6)
1068303
93172224
4569
1187
37
7773583
102153120178106
314
201113
829267220153
64125
887142270952
78061144393253094
266713380951001
873620425
139414453842
172146192587425809152733257905139122
555114
249508305606
1008183279581280438258223
80847109094
959955949966960956964967928969
948959932939946953951968
968
962974
964953964960
1006974
15.415.716.914.714.016.317.217.419.118.9
17.917.215.516.818.021.718.217.6
21.38
23.319.9
17.019.816.417.412.614.0
3.32.93.63.84.14.60.61.93.81.9
4.494.94.75.34.92.64.24.3
0.46
1.01.7
4.51.94.34.63.7
11.8
31.430.1
9.837.637.020.938.929.621.628.1
0.160.10.00.00.20.10.30.5
0.001
0.01.3
23.09.2
25.215.566.338.3
65.261.962.971.569.263.063.355.756.055.5
61.260.968.366.864.043.058.560.4
50.8
51.850.0
67.457.072.264.682.475.1
Popu
latio
n
% o
f SC
Popu
latio
n
% o
f ST
Popu
latio
n
Lite
racy
Rate
Contd...
Sex
Ratio
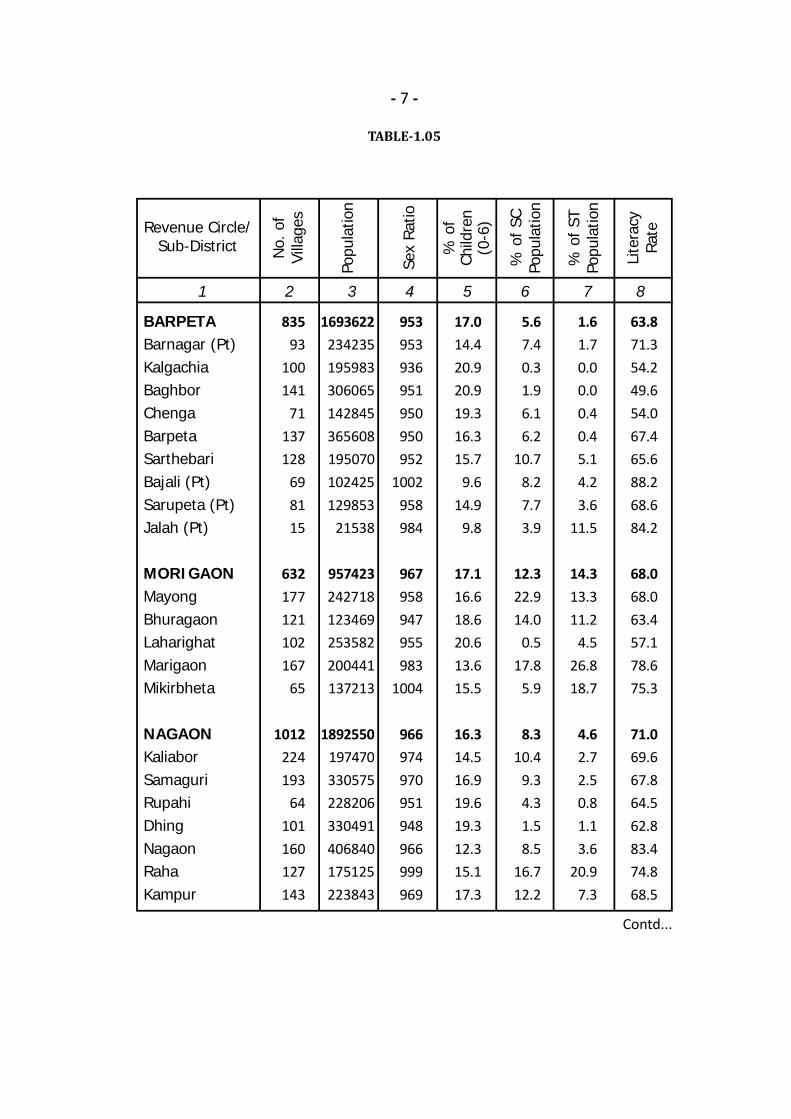
- 7 -
TABLE-1.05
1 2 3 4 5 6 7 8
BARPETABarnagar (Pt)KalgachiaBaghborChengaBarpetaSarthebariBajali (Pt)Sarupeta (Pt)Jalah (Pt)
MORIGAONMayongBhuragaonLaharighatMarigaonMikirbheta
NAGAONKaliaborSamaguriRupahiDhingNagaonRahaKampur
Revenue Circle/Sub-District N
o. o
fVi
llage
s
83593
100141
71137128
698115
632177121102167
65
1012224193
64101160127143
1693622234235195983306065142845365608195070102425129853
21538
957423242718123469253582200441137213
1892550197470330575228206330491406840175125223843
953953936951950950952
1002958984
967958947955983
1004
966974970951948966999969
17.014.420.920.919.316.315.7
9.614.9
9.8
17.116.618.620.613.615.5
16.314.516.919.619.312.315.117.3
5.67.40.31.96.16.2
10.78.27.73.9
12.322.914.0
0.517.8
5.9
8.310.4
9.34.31.58.5
16.712.2
1.61.70.00.00.40.45.14.23.6
11.5
14.313.311.2
4.526.818.7
4.62.72.50.81.13.6
20.97.3
63.871.354.249.654.067.465.688.268.684.2
68.068.063.457.178.675.3
71.069.667.864.562.883.474.868.5
Contd...
Popu
latio
n
Sex
Ratio
% o
fCh
ildre
n(0
-6)
% o
f SC
Popu
latio
n
% o
f ST
Popu
latio
n
Lite
racy
Rate
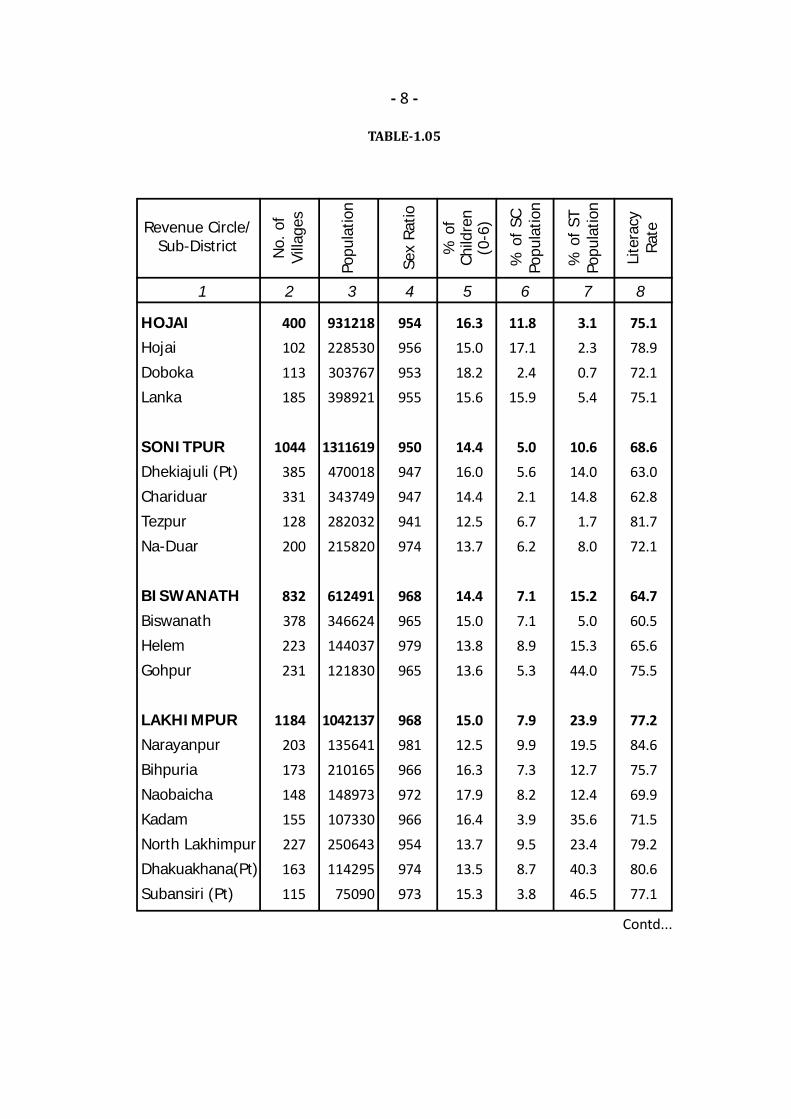
- 8 -
TABLE-1.05
1 2 3 4 5 6 7 8
HOJAIHojai
Doboka
Lanka
SONITPURDhekiajuli (Pt)
Chariduar
Tezpur
Na-Duar
BISWANATHBiswanath
Helem
Gohpur
LAKHIMPURNarayanpur
Bihpuria
Naobaicha
Kadam
North Lakhimpur
Dhakuakhana(Pt)
Subansiri (Pt)
Revenue Circle/Sub-District N
o. o
fVi
llage
s
400102
113185
1044385
331128
200
832378223
231
1184203
173
148155
227163
115
931218228530
303767398921
1311619470018
343749282032
215820
612491346624144037
121830
1042137135641
210165
148973107330
250643114295
75090
954956
953955
950947
947941
974
968965979
965
968981
966
972966
954974
973
16.315.0
18.215.6
14.416.0
14.412.5
13.7
14.415.013.8
13.6
15.012.5
16.3
17.916.4
13.713.5
15.3
11.817.1
2.415.9
5.05.6
2.16.7
6.2
7.17.18.9
5.3
7.99.9
7.3
8.23.9
9.58.7
3.8
3.12.3
0.75.4
10.614.0
14.81.7
8.0
15.25.0
15.3
44.0
23.919.5
12.7
12.435.6
23.440.3
46.5
75.178.9
72.175.1
68.663.0
62.881.7
72.1
64.760.565.6
75.5
77.284.6
75.7
69.971.5
79.280.6
77.1
Contd...
Popu
latio
n
Sex
Ratio
% o
fCh
ildre
n(0
-6)
% o
f SC
Popu
latio
n
% o
f ST
Popu
latio
n
Lite
racy
Rate
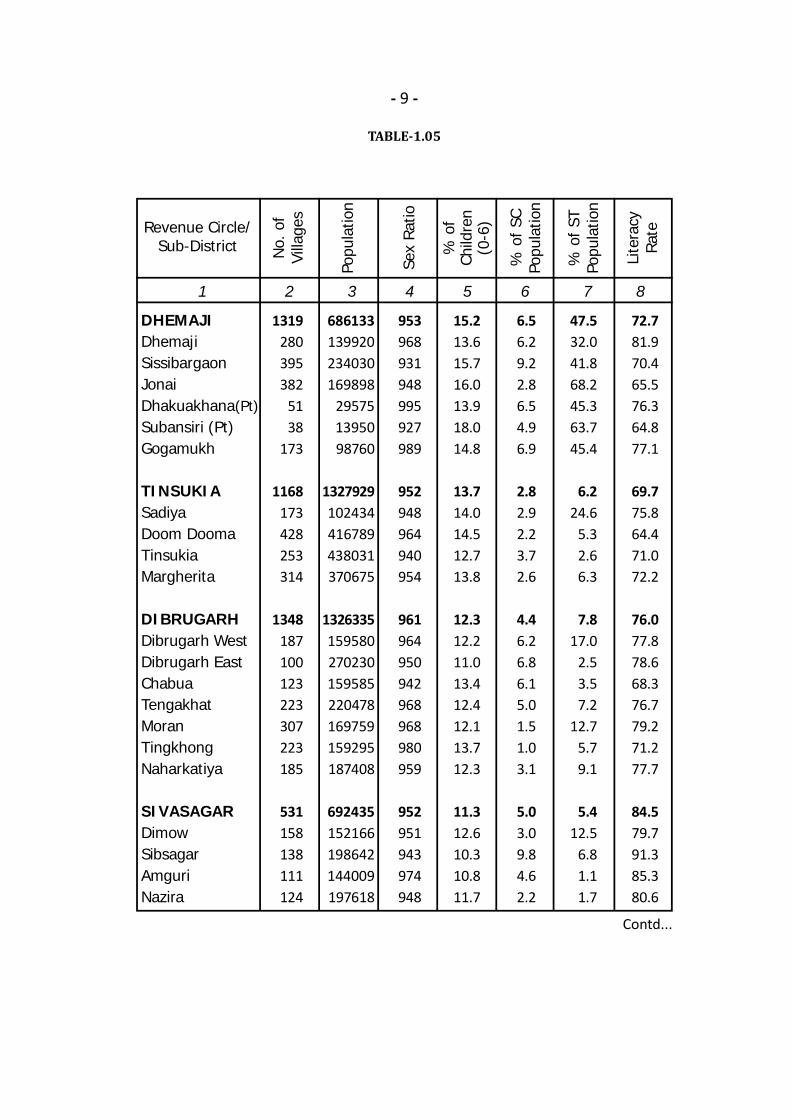
- 9 -
TABLE-1.05
1 2 3 4 5 6 7 8
DHEMAJIDhemajiSissibargaonJonaiDhakuakhana(Pt)Subansiri (Pt)Gogamukh
TINSUKIASadiyaDoom DoomaTinsukiaMargherita
DIBRUGARHDibrugarh WestDibrugarh EastChabuaTengakhatMoranTingkhongNaharkatiya
SIVASAGARDimowSibsagarAmguriNazira
Revenue Circle/Sub-District N
o. o
fVi
llage
s
1319280395382
5138
173
1168173428253314
1348187100123223307223185
531158138111124
686133139920234030169898
295751395098760
1327929102434416789438031370675
1326335159580270230159585220478169759159295187408
692435152166198642144009197618
953968931948995927989
952948964940954
961964950942968968980959
952951943974948
15.213.615.716.013.918.014.8
13.714.014.512.713.8
12.312.211.013.412.412.113.712.3
11.312.610.310.811.7
6.56.29.22.86.54.96.9
2.82.92.23.72.6
4.46.26.86.15.01.51.03.1
5.03.09.84.62.2
47.532.041.868.245.363.745.4
6.224.6
5.32.66.3
7.817.0
2.53.57.2
12.75.79.1
5.412.5
6.81.11.7
72.781.970.465.576.364.877.1
69.775.864.471.072.2
76.077.878.668.376.779.271.277.7
84.579.791.385.380.6
Contd...
Popu
latio
n
Sex
Ratio
% o
fCh
ildre
n(0
-6)
% o
f SC
Popu
latio
n
% o
f ST
Popu
latio
n
Lite
racy
Rate
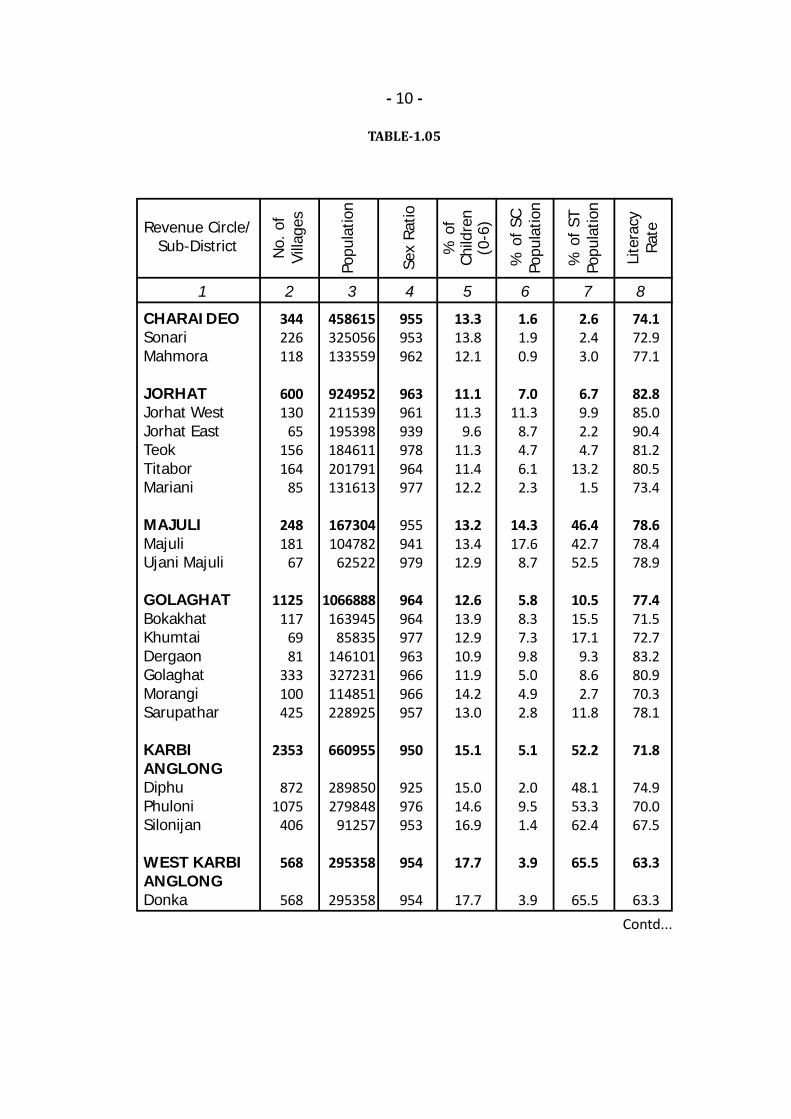
- 10 -
TABLE-1.05
1 2 3 4 5 6 7 8
CHARAIDEOSonariMahmora
JORHATJorhat WestJorhat EastTeokTitaborMariani
MAJULIMajuliUjani Majuli
GOLAGHATBokakhatKhumtaiDergaonGolaghatMorangiSarupathar
KARBIANGLONGDiphuPhuloniSilonijan
WEST KARBIANGLONGDonka
Revenue Circle/Sub-District N
o. o
fVi
llage
s344226118
600130
65156164
85
248181
67
1125117
6981
333100425
2353
8721075
406
568
568
458615325056133559
924952211539195398184611201791131613
167304104782
62522
1066888163945
85835146101327231114851228925
660955
289850279848
91257
295358
295358
955953962
963961939978964977
955941979
964964977963966966957
950
925976953
954
954
13.313.812.1
11.111.3
9.611.311.412.2
13.213.412.9
12.613.912.910.911.914.213.0
15.1
15.014.616.9
17.7
17.7
1.61.90.9
7.011.3
8.74.76.12.3
14.317.6
8.7
5.88.37.39.85.04.92.8
5.1
2.09.51.4
3.9
3.9
2.62.43.0
6.79.92.24.7
13.21.5
46.442.752.5
10.515.517.1
9.38.62.7
11.8
52.2
48.153.362.4
65.5
65.5
74.172.977.1
82.885.090.481.280.573.4
78.678.478.9
77.471.572.783.280.970.378.1
71.8
74.970.067.5
63.3
63.3Contd...
Popu
latio
n
Sex
Ratio
% o
fCh
ildre
n(0
-6)
% o
f SC
Popu
latio
n
% o
f ST
Popu
latio
n
Lite
racy
Rate
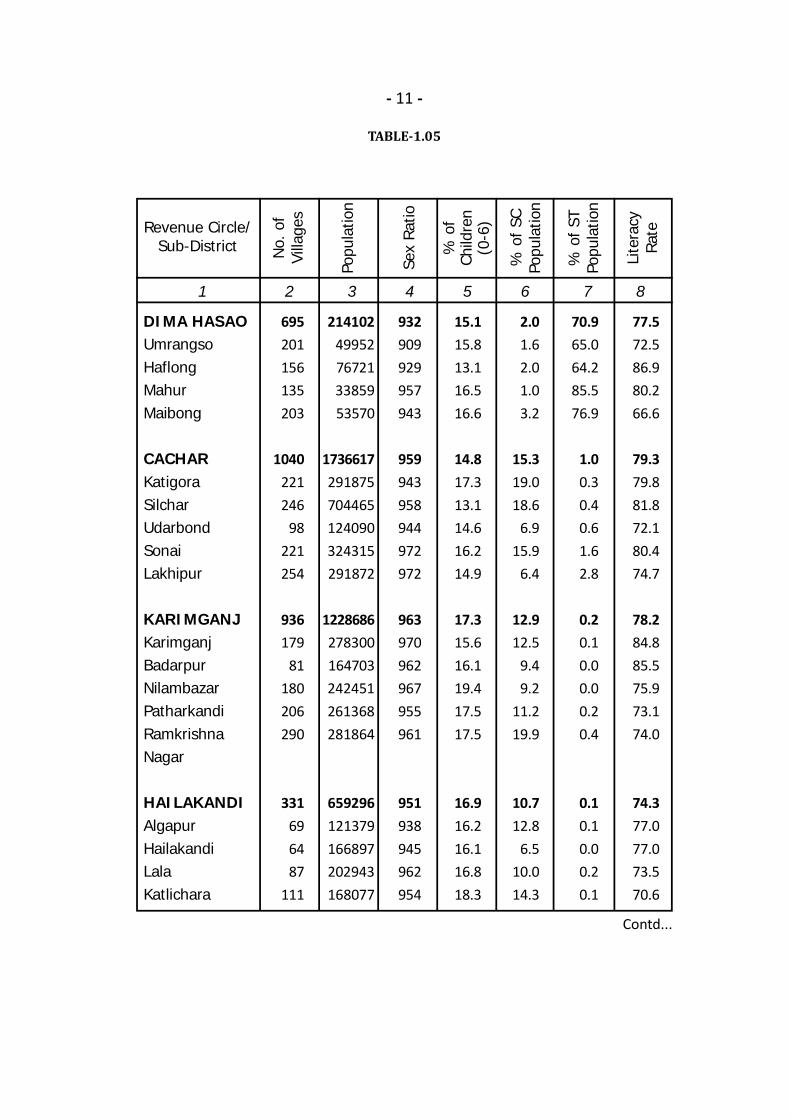
- 11 -
TABLE-1.05
1 2 3 4 5 6 7 8
DIMA HASAOUmrangsoHaflongMahurMaibong
CACHARKatigoraSilcharUdarbondSonaiLakhipur
KARIMGANJKarimganjBadarpurNilambazarPatharkandiRamkrishnaNagar
HAILAKANDIAlgapurHailakandiLalaKatlichara
Revenue Circle/Sub-District N
o. o
fVi
llage
s
695201156135203
1040221246
98221254
936179
81180206290
331696487
111
21410249952767213385953570
1736617291875704465124090324315291872
1228686278300164703242451261368281864
659296121379166897202943168077
932909929957943
959943958944972972
963970962967955961
951938945962954
15.115.813.116.516.6
14.817.313.114.616.214.9
17.315.616.119.417.517.5
16.916.216.116.818.3
2.01.62.01.03.2
15.319.018.6
6.915.9
6.4
12.912.5
9.49.2
11.219.9
10.712.8
6.510.014.3
70.965.064.285.576.9
1.00.30.40.61.62.8
0.20.10.00.00.20.4
0.10.10.00.20.1
77.572.586.980.266.6
79.379.881.872.180.474.7
78.284.885.575.973.174.0
74.377.077.073.570.6
Contd...
Popu
latio
n
Sex
Ratio
% o
fCh
ildre
n(0
-6)
% o
f SC
Popu
latio
n
% o
f ST
Popu
latio
n
Lite
racy
Rate
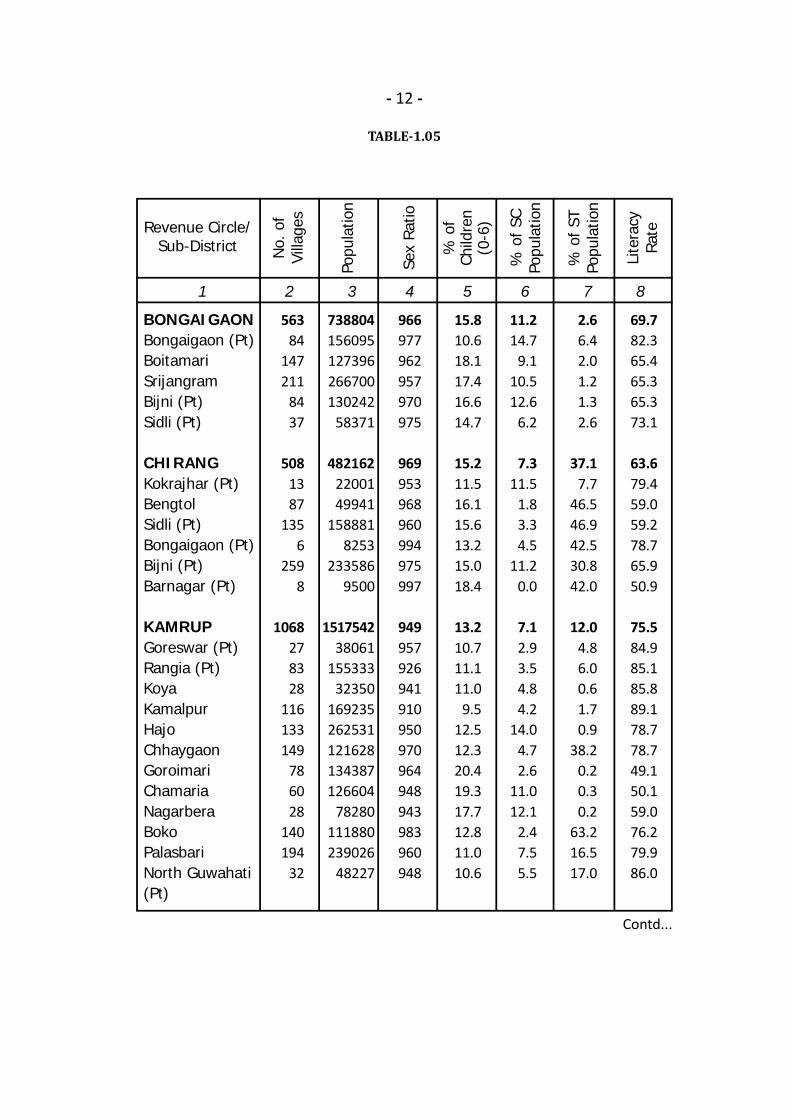
- 12 -
TABLE-1.05
1 2 3 4 5 6 7 8
BONGAIGAONBongaigaon (Pt)BoitamariSrijangramBijni (Pt)Sidli (Pt)
CHIRANGKokrajhar (Pt)BengtolSidli (Pt)Bongaigaon (Pt)Bijni (Pt)Barnagar (Pt)
KAMRUPGoreswar (Pt)Rangia (Pt)KoyaKamalpurHajoChhaygaonGoroimariChamariaNagarberaBokoPalasbariNorth Guwahati(Pt)
Revenue Circle/Sub-District N
o. o
fVi
llage
s563
84147211
8437
5081387
1356
2598
1068278328
116133149
786028
140194
32
738804156095127396266700130242
58371
4821622200149941
1588818253
2335869500
151754238061
15533332350
169235262531121628134387126604
78280111880239026
48227
966977962957970975
969953968960994975997
949957926941910950970964948943983960948
15.810.618.117.416.614.7
15.211.516.115.613.215.018.4
13.210.711.111.0
9.512.512.320.419.317.712.811.010.6
11.214.7
9.110.512.6
6.2
7.311.5
1.83.34.5
11.20.0
7.12.93.54.84.2
14.04.72.6
11.012.1
2.47.55.5
2.66.42.01.21.32.6
37.17.7
46.546.942.530.842.0
12.04.86.00.61.70.9
38.20.20.30.2
63.216.517.0
69.782.365.465.365.373.1
63.679.459.059.278.765.950.9
75.584.985.185.889.178.778.749.150.159.076.279.986.0
Contd...
Popu
latio
n
Sex
Ratio
% o
fCh
ildre
n(0
-6)
% o
f SC
Popu
latio
n
% o
f ST
Popu
latio
n
Lite
racy
Rate
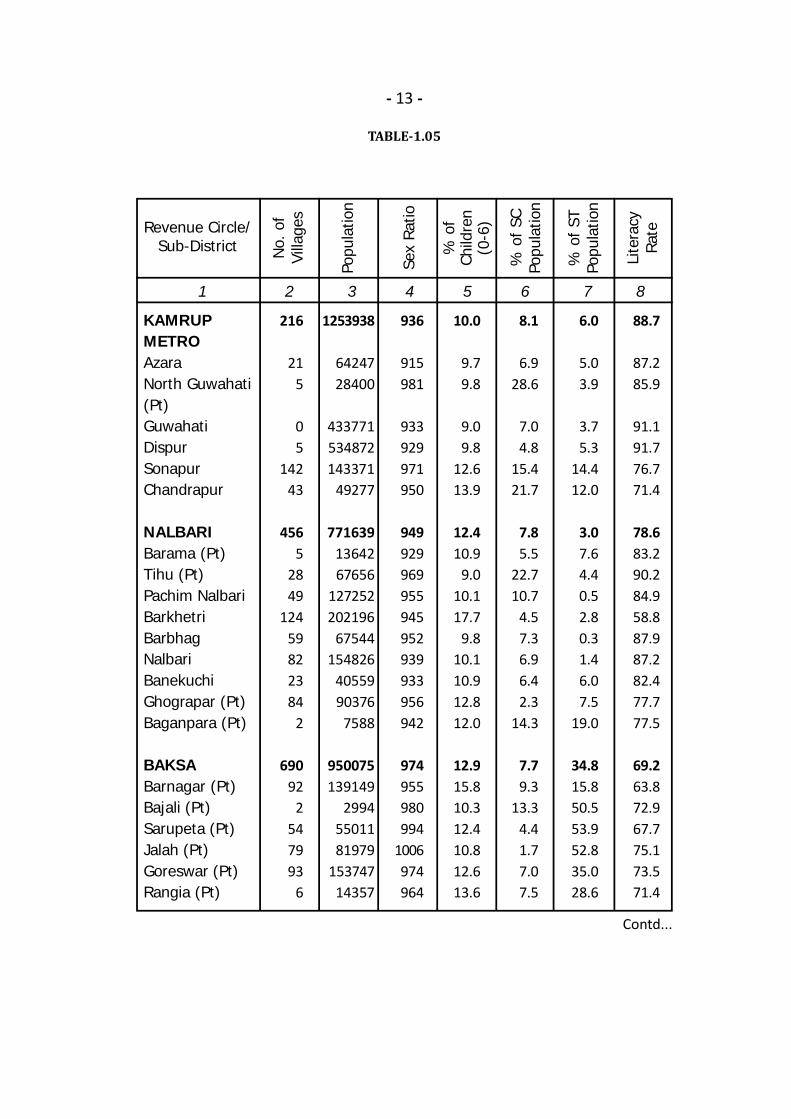
- 13 -
TABLE-1.05
1 2 3 4 5 6 7 8
KAMRUPMETROAzaraNorth Guwahati(Pt)GuwahatiDispurSonapurChandrapur
NALBARIBarama (Pt)Tihu (Pt)Pachim NalbariBarkhetriBarbhagNalbariBanekuchiGhograpar (Pt)Baganpara (Pt)
BAKSABarnagar (Pt)Bajali (Pt)Sarupeta (Pt)Jalah (Pt)Goreswar (Pt)Rangia (Pt)
Revenue Circle/Sub-District N
o. o
fVi
llage
s
216
215
05
14243
4565
2849
12459822384
2
69092
2547993
6
1253938
6424728400
433771534872143371
49277
7716391364267656
127252202196
67544154826
4055990376
7588
950075139149
29945501181979
15374714357
936
915981
933929971950
949929969955945952939933956942
974955980994
1006974964
10.0
9.79.8
9.09.8
12.613.9
12.410.9
9.010.117.7
9.810.110.912.812.0
12.915.810.312.410.812.613.6
8.1
6.928.6
7.04.8
15.421.7
7.85.5
22.710.7
4.57.36.96.42.3
14.3
7.79.3
13.34.41.77.07.5
6.0
5.03.9
3.75.3
14.412.0
3.07.64.40.52.80.31.46.07.5
19.0
34.815.850.553.952.835.028.6
88.7
87.285.9
91.191.776.771.4
78.683.290.284.958.887.987.282.477.777.5
69.263.872.967.775.173.571.4
Contd...
Popu
latio
n
Sex
Ratio
% o
fCh
ildre
n(0
-6)
% o
f SC
Popu
latio
n
% o
f ST
Popu
latio
n
Lite
racy
Rate

- 14 -
TABLE-1.05
1 2 3 4 5 6 7 8
BAKSA (Contd..)
Barama (Pt)Tihu (Pt)Ghograpar (Pt)BaskaBaganpara (Pt)TamulpurPathorighat (Pt)
DARRANGKhoirabari (Pt)Pathorighat (Pt)SipajharMangaldoi (Pt)Kalaigaon (Pt)Dalgaon (Pt)
UDALGURIKhoirabari (Pt)Pathorighat (Pt)Mangaldoi (Pt)Kalaigaon (Pt)Dalgaon (Pt)HarisingaUdalguriMazbatDhekiajuli (Pt)
Revenue Circle/Sub-District N
o. o
fVi
llage
s
3611
38644
1831
5617
8493
13825
214
80084
16
7746
203226138
19
4971517508
3652124585
69741235403
2234
9285008398
95338123498202435
25246473585
83166881209
10084799
8561652627
242676212360132773
18600
973978985983968967939
954976949966935984958
973982
1012947965963979970966991
10.810.610.712.012.113.812.0
16.911.210.513.914.4
9.720.5
13.611.010.013.211.514.813.214.415.117.8
2.815.9
2.44.34.3
13.40.0
4.35.82.74.3
10.82.92.0
4.65.10.00.0
13.63.15.41.92.31.4
44.541.538.439.441.228.720.5
0.97.60.40.71.38.20.4
32.252.726.246.928.843.626.436.820.029.7
78.577.875.471.268.763.981.1
63.178.985.772.770.884.550.1
65.474.379.169.475.763.262.765.658.960.9
Popu
latio
n
Sex
Ratio
% o
fCh
ildre
n(0
-6)
% o
f SC
Popu
latio
n
% o
f ST
Popu
latio
n
Lite
racy
Rate
N.B.: Figures of Table 1.01 to 1.05 are provisionaly estimated for 33 districtsfrom Census of India, 2011 by Directorate of Economics and Statistics, Assam.
- 15 -
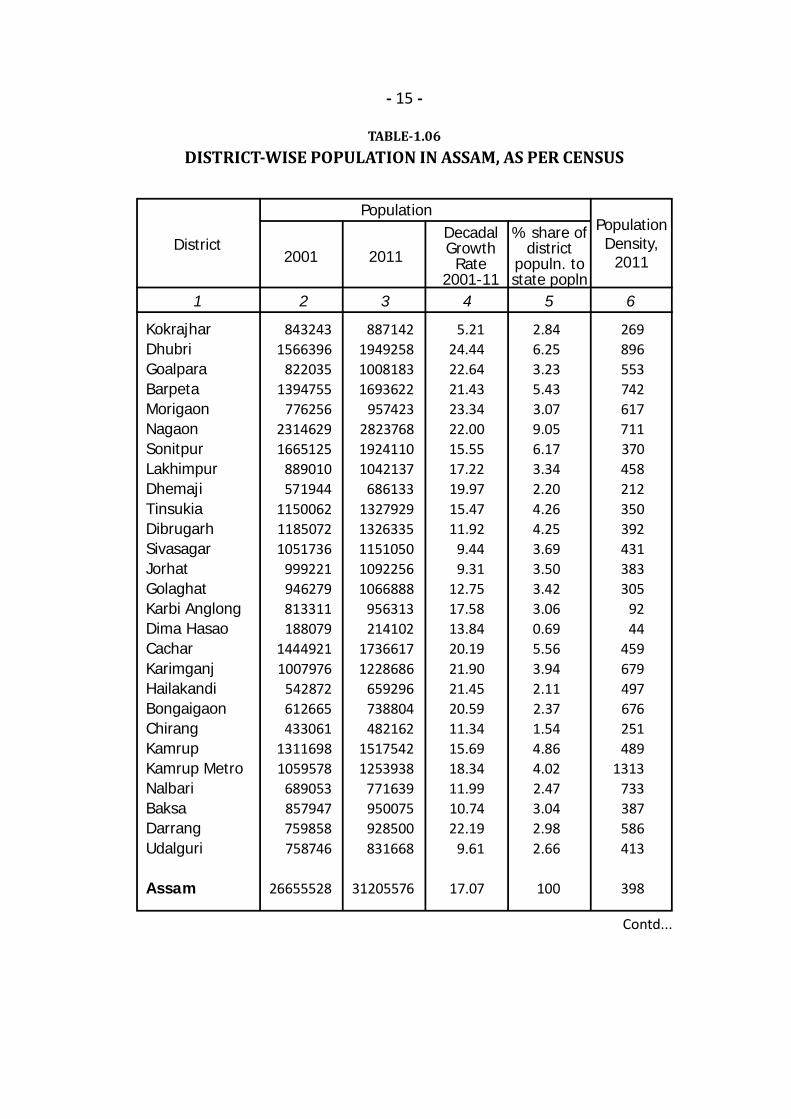
TABLE-1.06DISTRICT-WISE POPULATION IN ASSAM, AS PER CENSUS
Contd...
1 2 3 4 5 6
KokrajharDhubriGoalparaBarpetaMorigaonNagaonSonitpurLakhimpurDhemajiTinsukiaDibrugarhSivasagarJorhatGolaghatKarbi AnglongDima HasaoCacharKarimganjHailakandiBongaigaonChirangKamrupKamrup MetroNalbariBaksaDarrangUdalguri
Assam
District2001 2011
% share ofdistrict
populn. tostate popln
DecadalGrowthRate
2001-11
8432431566396
8220351394755
77625623146291665125
889010571944
115006211850721051736
999221946279813311188079
14449211007976
542872612665433061
13116981059578
689053857947759858758746
26655528
887142194925810081831693622
957423282376819241101042137
68613313279291326335115105010922561066888
956313214102
17366171228686
659296738804482162
15175421253938
771639950075928500831668
31205576
2.846.253.235.433.079.056.173.342.204.264.253.693.503.423.060.695.563.942.112.371.544.864.022.473.042.982.66
100
5.2124.4422.6421.4323.3422.0015.5517.2219.9715.4711.92
9.449.31
12.7517.5813.8420.1921.9021.4520.5911.3415.6918.3411.9910.7422.19
9.61
17.07
269896553742617711370458212350392431383305
9244
459679497676251489
1313733387586413
398
PopulationPopulationDensity,
2011
- 16 -
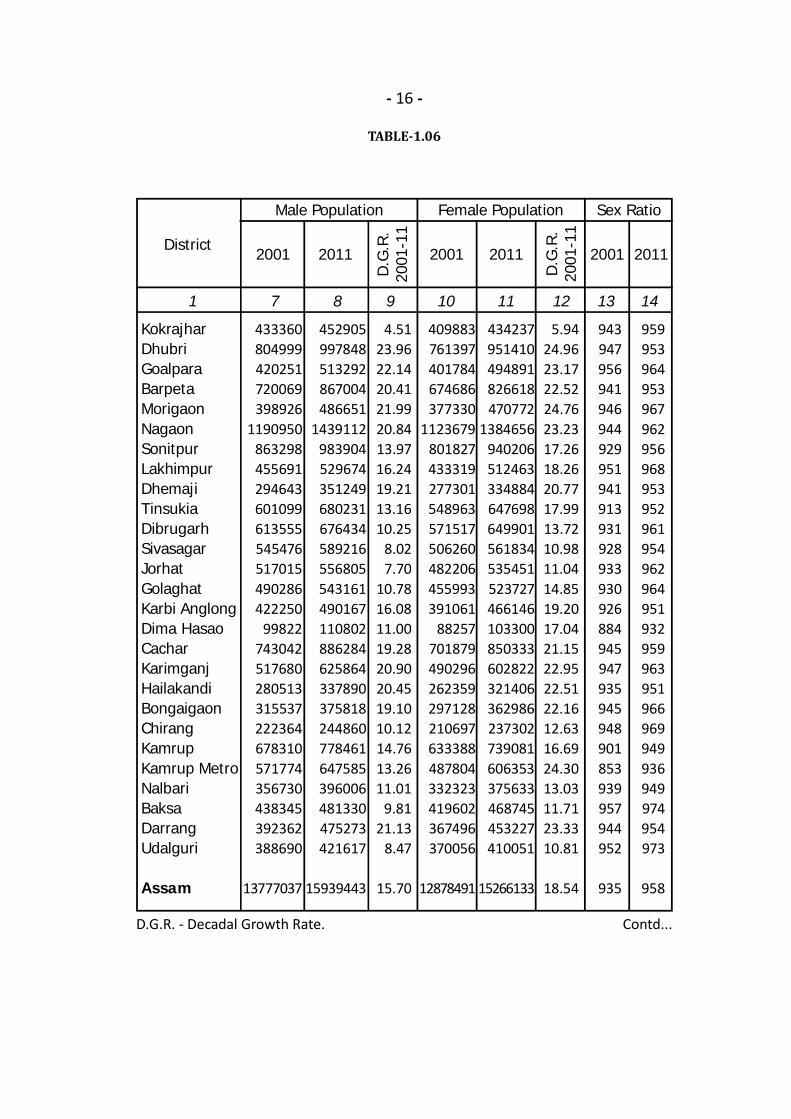
TABLE-1.06
D.G.R. - Decadal Growth Rate.
1 7 8 9 10 11 12 13 14
KokrajharDhubriGoalparaBarpetaMorigaonNagaonSonitpurLakhimpurDhemajiTinsukiaDibrugarhSivasagarJorhatGolaghatKarbi AnglongDima HasaoCacharKarimganjHailakandiBongaigaonChirangKamrupKamrup MetroNalbariBaksaDarrangUdalguri
Assam
District2001 2011
D.G
.R.
2001
-11
2001 2011
D.G
.R.
2001
-11
2001 2011
433360804999420251720069398926
1190950863298455691294643601099613555545476517015490286422250
99822743042517680280513315537222364678310571774356730438345392362388690
13777037
452905997848513292867004486651
1439112983904529674351249680231676434589216556805543161490167110802886284625864337890375818244860778461647585396006481330475273421617
15939443
4.5123.9622.1420.4121.9920.8413.9716.2419.2113.1610.25
8.027.70
10.7816.0811.0019.2820.9020.4519.1010.1214.7613.2611.01
9.8121.13
8.47
15.70
409883761397401784674686377330
1123679801827433319277301548963571517506260482206455993391061
88257701879490296262359297128210697633388487804332323419602367496370056
12878491
434237951410494891826618470772
1384656940206512463334884647698649901561834535451523727466146103300850333602822321406362986237302739081606353375633468745453227410051
15266133
5.9424.9623.1722.5224.7623.2317.2618.2620.7717.9913.7210.9811.0414.8519.2017.0421.1522.9522.5122.1612.6316.6924.3013.0311.7123.3310.81
18.54
943947956941946944929951941913931928933930926884945947935945948901853939957944952
935
959953964953967962956968953952961954962964951932959963951966969949936949974954973
958
Male Population Female Population Sex Ratio
Contd...

- 17 -
TABLE-1.06
KokrajharDhubriGoalparaBarpetaMorigaonNagaonSonitpurLakhimpurDhemajiTinsukiaDibrugarhSivasagarJorhatGolaghatKarbi AnglongDima HasaoCacharKarimganjHailakandiBongaigaonChirangKamrupKamrup MetroNalbariBaksaDarrangUdalguri
Assam
8322011745557
8701211546269
88412524542341750265
950804637848
106318610826051040954
871722969152843347151613
14211531118986
611156628994446825
1375148216927688909937833873006794094
26807034
5.1127.0515.2321.9619.7620.5217.5215.4119.6514.8013.17
9.055.29
12.0216.9117.8514.2819.7922.5322.03
9.509.693.574.139.31
21.569.44
15.47
54941203701138062147353
73298369534173845
9133348285
264743243730110096220534
97736112966
62489315464109700
48140109810
35337142394
103701182730122425549437574
4398542
6.685.85
106.3616.1592.9532.79- 1.1140.1824.3418.21
6.6913.2928.7320.4622.88
5.1456.6548.54
9.2012.9641.30
145.1621.98
200.99--
33.0713.43
27.89
1 15 16 17 18 19 20 21
District
2011
Rural Population Urban Population
D.G
.R.
2001
-11
2011
D.G
.R.
2001
-11
Child
(0-
6)Po
pula
tion
2011
2011
ChildSex Ratio
136924368262171657287829163819459940277862156739104247181826163210139380124594134793151681
32414256774211960111278116392
73215200061125386
95333122872156408113274
4638130
947965974960965975973966970957962967967963973955960965926972
957
958
975
965
954968963961956964966959950960962960964963959967954969954969968967946967966969973
962
2001

- 18 -
TABLE-POPULATION TREND IN
* The 1981 Census could not be conducted in Assam. The population figures for 1981 for Assam have been worked out by Interpolation.
1 2 3 4 5 6
TotalMale
Population(in Nos.)
FemalePopulation(in Nos.)
Sex RatioDecadalGrowth
Rate (%)
Year
1901
1911
1921
1931
1941
1951
1961
1971
1981*
1991
2001
2011
3289680
3848617
4636980
5560371
6694790
8028856
10837329
14625152
18041248
22414322
26655528
31205576
--
16.99
20.48
19.91
20.40
19.93
34.98
34.95
23.36
24.24
18.92
17.07
1714316
2010211
2445300
2966568
3569762
4298773
5798376
7714240
9444037
11657989
13777037
15939443
1575364
1838406
2191680
2593803
3125028
3730083
5038953
6910912
8597211
10756333
12878491
15266133
919
915
896
874
875
868
869
896
910
923
935
958
Population
- 19 -
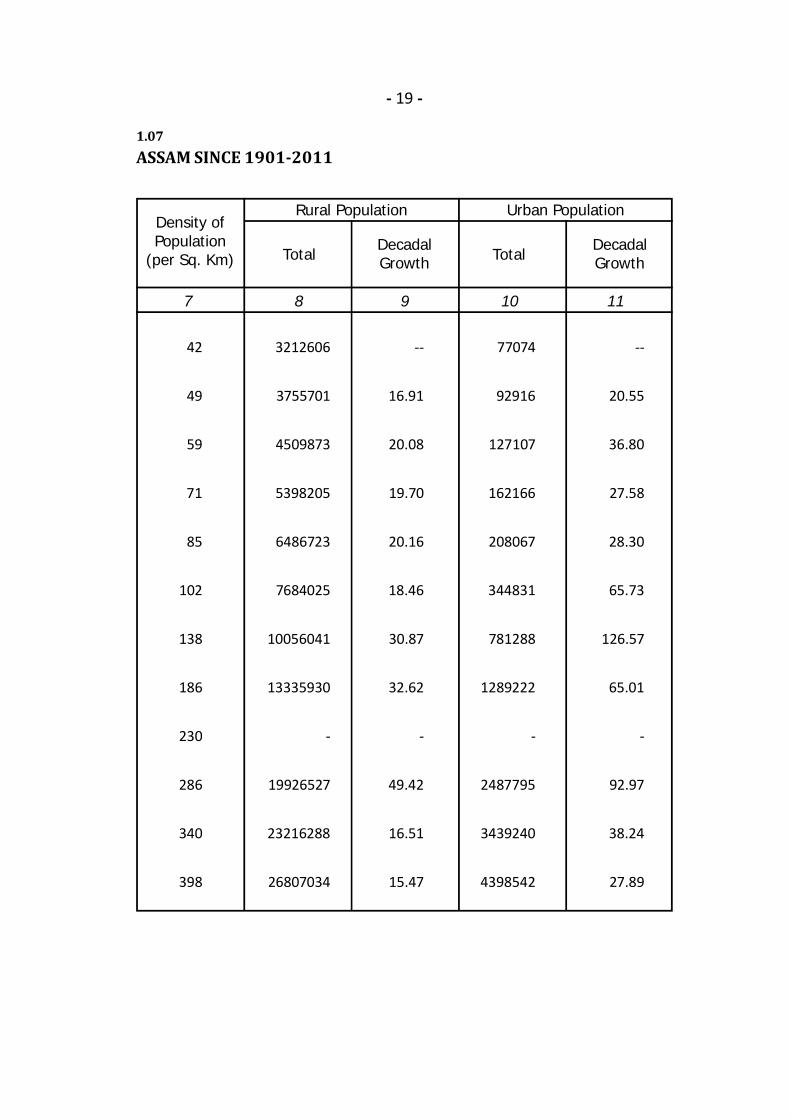
1.07ASSAM SINCE 1901-2011
7 8 9 10 11
DecadalGrowth Total
DecadalGrowthTotal
Density ofPopulation
(per Sq. Km)
42
49
59
71
85
102
138
186
230
286
340
398
3212606
3755701
4509873
5398205
6486723
7684025
10056041
13335930
-
19926527
23216288
26807034
--
16.91
20.08
19.70
20.16
18.46
30.87
32.62
-
49.42
16.51
15.47
77074
92916
127107
162166
208067
344831
781288
1289222
-
2487795
3439240
4398542
--
20.55
36.80
27.58
28.30
65.73
126.57
65.01
-
92.97
38.24
27.89
Rural Population Urban Population
- 20 -
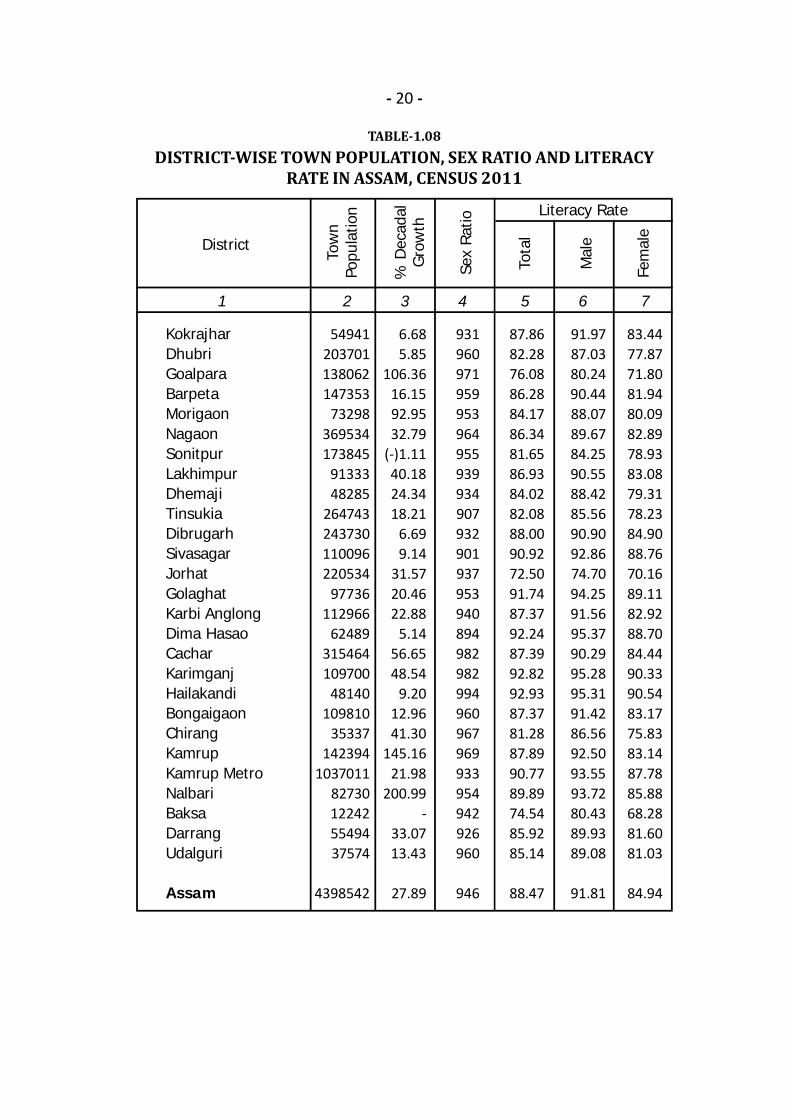
1 2 3 4 5 6 7
% D
ecad
alG
row
th
Literacy Rate
Tow
nPo
pula
tion
District
KokrajharDhubriGoalparaBarpetaMorigaonNagaonSonitpurLakhimpurDhemajiTinsukiaDibrugarhSivasagarJorhatGolaghatKarbi AnglongDima HasaoCacharKarimganjHailakandiBongaigaonChirangKamrupKamrup MetroNalbariBaksaDarrangUdalguri
Assam
54941203701138062147353
73298369534173845
9133348285
264743243730110096220534
97736112966
62489315464109700
48140109810
35337142394
103701182730122425549437574
4398542
931960971959953964955939934907932901937953940894982982994960967969933954942926960
946
6.685.85
106.3616.1592.9532.79
(-)1.11 40.1824.3418.21
6.699.14
31.5720.4622.88
5.1456.6548.54
9.2012.9641.30
145.1621.98
200.99-
33.0713.43
27.89
87.8682.2876.0886.2884.1786.3481.6586.9384.0282.0888.0090.9272.5091.7487.3792.2487.3992.8292.9387.3781.2887.8990.7789.8974.5485.9285.14
88.47
91.9787.0380.2490.4488.0789.6784.2590.5588.4285.5690.9092.8674.7094.2591.5695.3790.2995.2895.3191.4286.5692.5093.5593.7280.4389.9389.08
91.81
83.4477.8771.8081.9480.0982.8978.9383.0879.3178.2384.9088.7670.1689.1182.9288.7084.4490.3390.5483.1775.8383.1487.7885.8868.2881.6081.03
84.94
Sex
Ratio
Tota
l
Mal
e
Fem
ale
TABLE-1.08DISTRICT-WISE TOWN POPULATION, SEX RATIO AND LITERACY
RATE IN ASSAM, CENSUS 2011
- 21 -
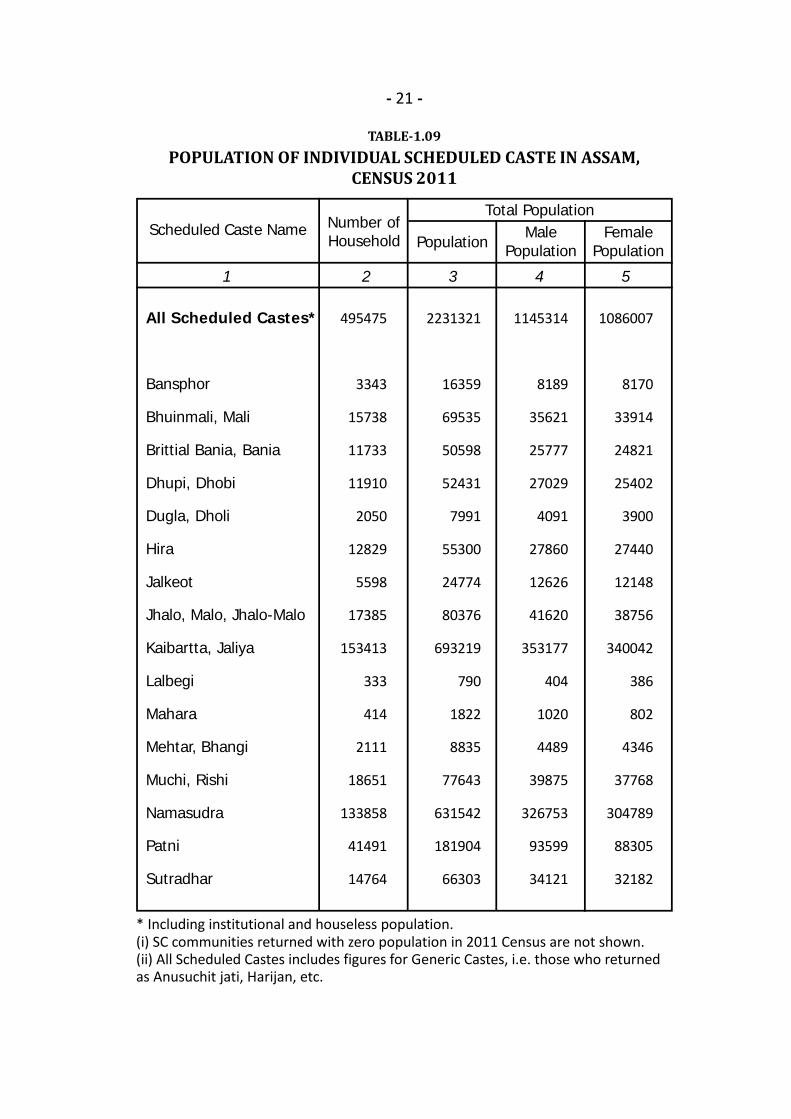
TABLE-1.09POPULATION OF INDIVIDUAL SCHEDULED CASTE IN ASSAM,
CENSUS 2011
1 2 3 4 5
All Scheduled Castes*
Bansphor
Bhuinmali, Mali
Brittial Bania, Bania
Dhupi, Dhobi
Dugla, Dholi
Hira
Jalkeot
Jhalo, Malo, Jhalo-Malo
Kaibartta, Jaliya
Lalbegi
Mahara
Mehtar, Bhangi
Muchi, Rishi
Namasudra
Patni
Sutradhar
Scheduled Caste Name Number ofHousehold Male
Population
495475
3343
15738
11733
11910
2050
12829
5598
17385
153413
333
414
2111
18651
133858
41491
14764
2231321
16359
69535
50598
52431
7991
55300
24774
80376
693219
790
1822
8835
77643
631542
181904
66303
Total Population
PopulationFemale
Population
1145314
8189
35621
25777
27029
4091
27860
12626
41620
353177
404
1020
4489
39875
326753
93599
34121
1086007
8170
33914
24821
25402
3900
27440
12148
38756
340042
386
802
4346
37768
304789
88305
32182
* Including institutional and houseless population.(i) SC communities returned with zero population in 2011 Census are not shown.(ii) All Scheduled Castes includes figures for Generic Castes, i.e. those who returnedas Anusuchit jati, Harijan, etc.

- 22 -
TABLE-1.10POPULATION OF INDIVIDUAL SCHEDULED TRIBES IN ASSAM,
CENSUS 2011
1 2 3 4 5
All Scheduled Tribes*In the autonomous districtChakmaDimasa, KachariGaroHajongHmarKhasi, Jaintia, Synteng, Pnar,War, Bhoi, LyngngamAny Kuki Tribes, including**LakherMan (Tai speaking)Any Mizo (Lushai) tribesKarbiAny Naga tribesPawiSynthengLalungIn the state of Assam excludingthe autonomous districtBarmans in CacharBoro, BorokachariDeoriHojaiKachari, SonwalLalungMechMiriRabhaDimasaHajongSinghphoKhamptiGaro
Scheduled Tribes Name Number ofHousehold Male
Population
794768
43023689
4674152
27943426
622336
324222
785885390
35
3604
2405290517
8612134
6000237694
2380117825
6561145227716
533251
25870
3884371
2032102961
25315436
1574515936
3339937
1269880
43045229767
35
18252
67161361735
43750642
253344182663
9883680424296189
1970234253
23421106
136077
Total Population
PopulationFemale
Population
1957005
10435183212684
22379647916
1722020
644419
21775814905
12
9128
3398682931
21938327
12769291340
4968345786148887
973817385
1175566
68594
1927366
9895112912631
21377818020
1617917
625461
21269414862
23
9124
3318678804
21812315
12565291323
4915334638147302
996416868
1167540
67483* Including institutional and houseless population.** including Biate, Biete, Changsan, Chongloi, Doungel, Gamalhou, Gangte, Guite, Hanneng, Haokip, Haupit,Haolai, Hengna, Hongsungh, Hrangkhwal, Rangkhol, Jongbe, Khawchung, Khawathlang, Khothalong, Khelma,Kholhou, Kipgen, Kuki, Lengthang, Lhangum, Lhaujem, Lhouvun, Lupheng, Mangjel, Misao, Riang, Sairhem,Selnam, Singson, Sitlhou, Sukte, Thado, Thangngeu, Uibuh, Vaiphei.(i) ST communities returned with zero population in 2011 Census are not shown.(ii) All Scheduled Tribes includes figures for Generic Tribes, i.e. those who returned asAnusuchit jan-jati, Girijan, Adivasi, etc.
- 23 -
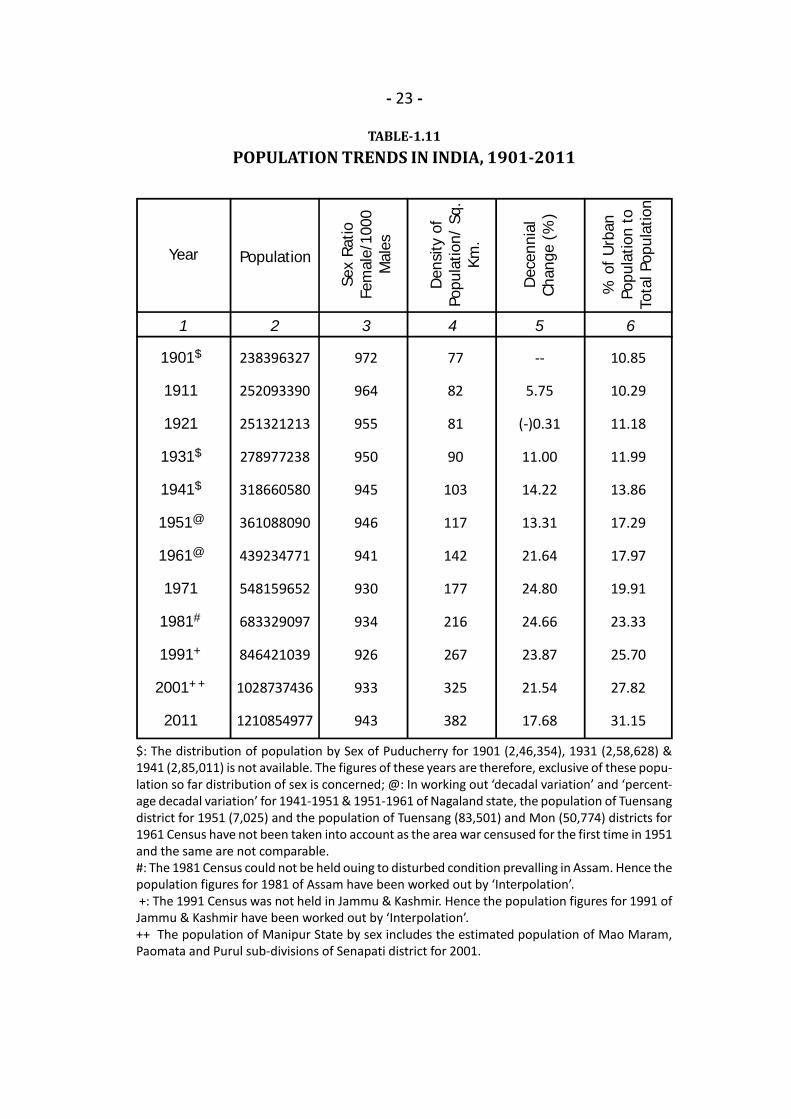
TABLE-1.11POPULATION TRENDS IN INDIA, 1901-2011
$: The distribution of population by Sex of Puducherry for 1901 (2,46,354), 1931 (2,58,628) &1941 (2,85,011) is not available. The figures of these years are therefore, exclusive of these popu-lation so far distribution of sex is concerned; @: In working out ‘decadal variation’ and ‘percent-age decadal variation’ for 1941-1951 & 1951-1961 of Nagaland state, the population of Tuensangdistrict for 1951 (7,025) and the population of Tuensang (83,501) and Mon (50,774) districts for1961 Census have not been taken into account as the area war censused for the first time in 1951and the same are not comparable.#: The 1981 Census could not be held ouing to disturbed condition prevalling in Assam. Hence thepopulation figures for 1981 of Assam have been worked out by ‘Interpolation’. +: The 1991 Census was not held in Jammu & Kashmir. Hence the population figures for 1991 ofJammu & Kashmir have been worked out by ‘Interpolation’.++ The population of Manipur State by sex includes the estimated population of Mao Maram,Paomata and Purul sub-divisions of Senapati district for 2001.
1 2 3 4 5 6Se
x Ra
tioFe
mal
e/10
00M
ales
PopulationYear
1901$
1911
1921
1931$
1941$
1951@
1961@
1971
1981#
1991+
2001++
2011
238396327
252093390
251321213
278977238
318660580
361088090
439234771
548159652
683329097
846421039
1028737436
1210854977
972
964
955
950
945
946
941
930
934
926
933
943
77
82
81
90
103
117
142
177
216
267
325
382
--
5.75
(-)0.31
11.00
14.22
13.31
21.64
24.80
24.66
23.87
21.54
17.68
Den
sity
of
Popu
latio
n/ S
q.Km
.
Dec
enni
alCh
ange
(%
)
10.85
10.29
11.18
11.99
13.86
17.29
17.97
19.91
23.33
25.70
27.82
31.15
% o
f Urb
anPo
pula
tion
toTo
tal P
opul
atio
n
- 24 -
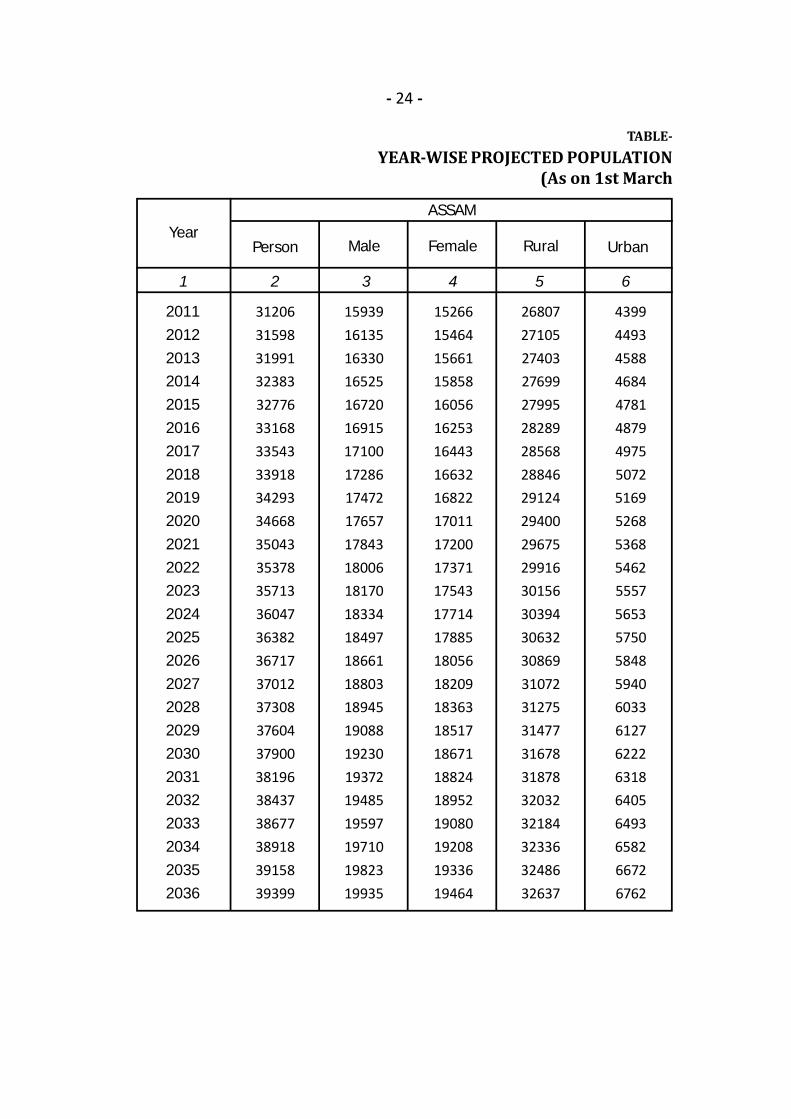
TABLE-YEAR-WISE PROJECTED POPULATION
(As on 1st March
1 2 3 4 5 6
Person Female Rural UrbanMaleYear
20112012201320142015201620172018201920202021202220232024202520262027202820292030203120322033203420352036
3120631598319913238332776331683354333918342933466835043353783571336047363823671737012373083760437900381963843738677389183915839399
1593916135163301652516720169151710017286174721765717843180061817018334184971866118803189451908819230193721948519597197101982319935
1526615464156611585816056162531644316632168221701117200173711754317714178851805618209183631851718671188241895219080192081933619464
2680727105274032769927995282892856828846291242940029675299163015630394306323086931072312753147731678318783203232184323363248632637
43994493458846844781487949755072516952685368546255575653575058485940603361276222631864056493658266726762
ASSAM
- 25 -
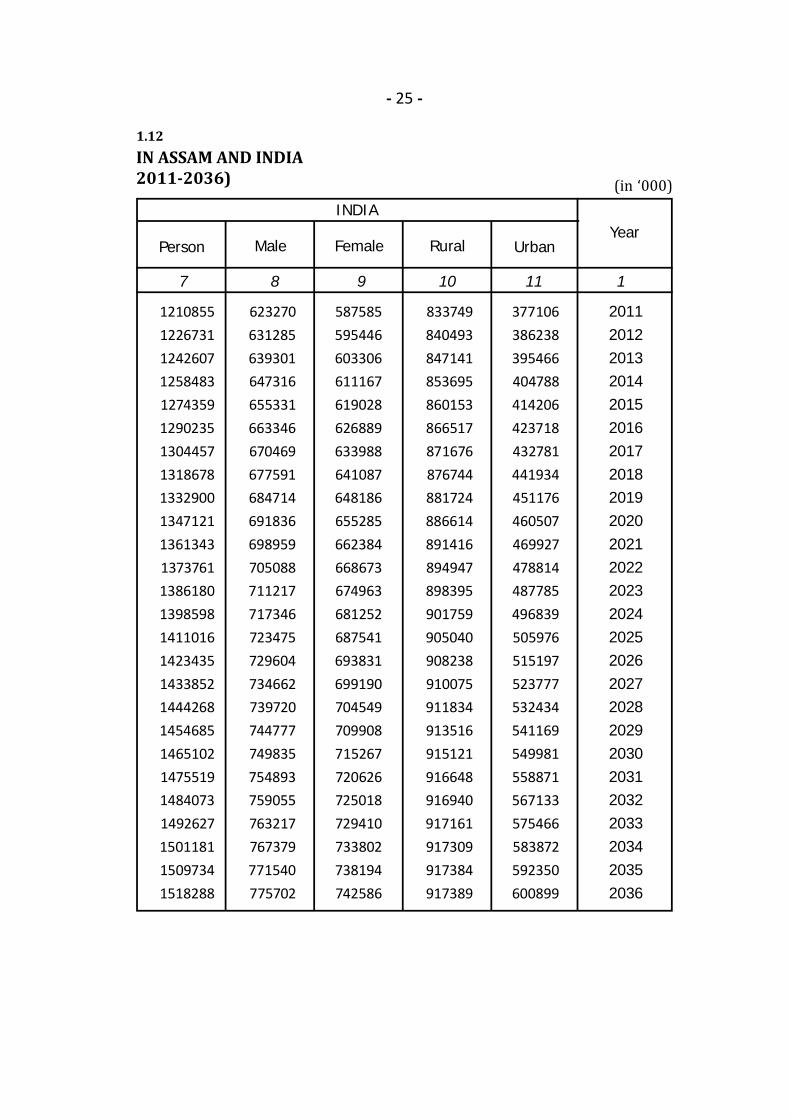
1.12IN ASSAM AND INDIA2011-2036)
7 8 9 10 11 1
Person Female Rural UrbanMaleYear
20112012201320142015201620172018201920202021202220232024202520262027202820292030203120322033203420352036
12108551226731124260712584831274359129023513044571318678133290013471211361343137376113861801398598141101614234351433852144426814546851465102147551914840731492627150118115097341518288
623270631285639301647316655331663346670469677591684714691836698959705088711217717346723475729604734662739720744777749835754893759055763217767379771540775702
587585595446603306611167619028626889633988641087648186655285662384668673674963681252687541693831699190704549709908715267720626725018729410733802738194742586
833749840493847141853695860153866517871676876744881724886614891416894947898395901759905040908238910075911834913516915121916648916940917161917309917384917389
377106386238395466404788414206423718432781441934451176460507469927478814487785496839505976515197523777532434541169549981558871567133575466583872592350600899
INDIA
(in ‘000)
- 26 -
TABLE-AGE GROUP WISE PROJECTED
(As on 1st March
1 2 3 4 5 6 7
2011 2021 2026 20362016Age Group
0 - 1
0 - 4
5 - 9
10 - 14
15 - 19
20 - 24
25 - 29
30 - 34
35 - 39
40 - 44
45 - 49
50 - 54
55 - 59
60 - 64
65 - 69
70 - 74
75 - 79
80+
Total
699
3404
3450
3401
3136
2927
2719
2435
2172
1881
1554
1210
921
728
542
422
189
113
31206
626
3049
3344
3428
3362
3082
2885
2681
2397
2128
1821
1488
1136
844
632
429
301
162
33168
621
3024
3001
3323
3390
3307
3040
2848
2643
2354
2068
1751
1406
1051
744
515
320
258
35043
599
2911
2979
2983
3288
3337
3265
3003
2810
2600
2294
1995
1662
1309
937
619
395
330
36717
551
2679
2782
2856
2931
2902
3198
3261
3191
2925
2707
2461
2123
1792
1415
1012
633
531
39399
ASSAM
2031
579
2818
2872
2962
2950
3237
3296
3228
2967
2768
2539
2219
1902
1559
1180
794
486
421
38196
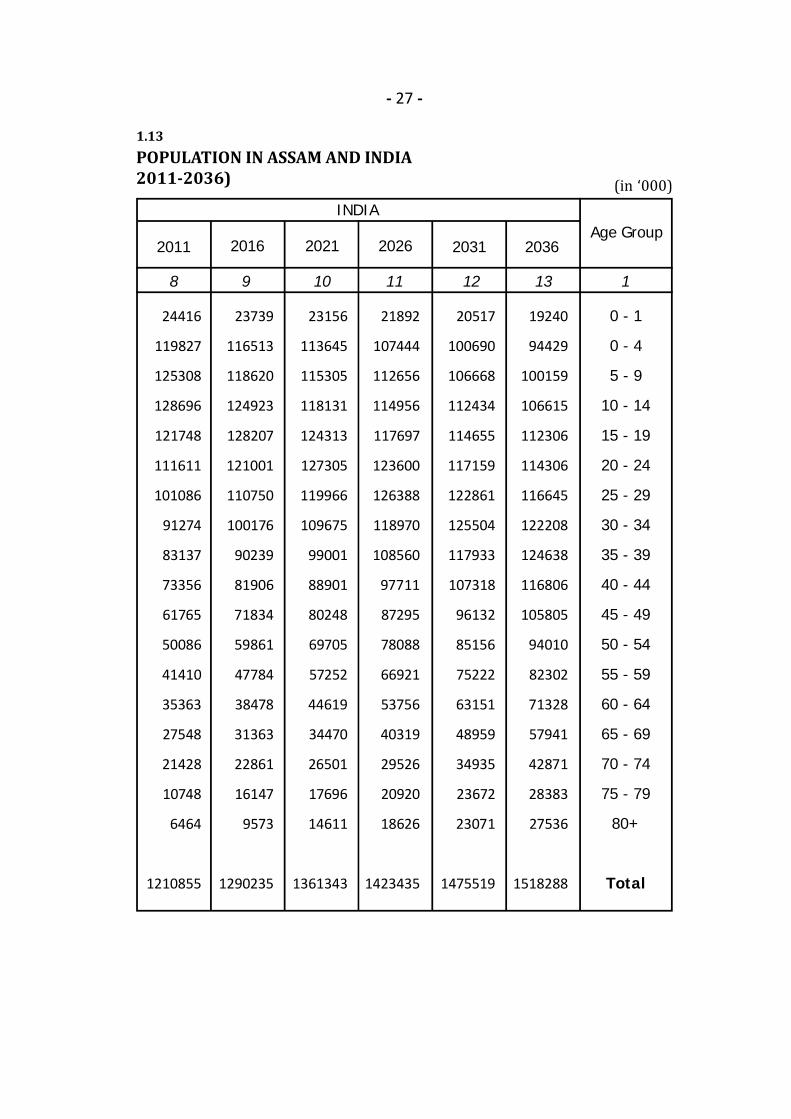
- 27 -
1.13POPULATION IN ASSAM AND INDIA2011-2036)
8 9 10 11 12 13 1
2011 2021 2026 20362016Age Group
0 - 1
0 - 4
5 - 9
10 - 14
15 - 19
20 - 24
25 - 29
30 - 34
35 - 39
40 - 44
45 - 49
50 - 54
55 - 59
60 - 64
65 - 69
70 - 74
75 - 79
80+
Total
24416
119827
125308
128696
121748
111611
101086
91274
83137
73356
61765
50086
41410
35363
27548
21428
10748
6464
1210855
23739
116513
118620
124923
128207
121001
110750
100176
90239
81906
71834
59861
47784
38478
31363
22861
16147
9573
1290235
23156
113645
115305
118131
124313
127305
119966
109675
99001
88901
80248
69705
57252
44619
34470
26501
17696
14611
1361343
21892
107444
112656
114956
117697
123600
126388
118970
108560
97711
87295
78088
66921
53756
40319
29526
20920
18626
1423435
19240
94429
100159
106615
112306
114306
116645
122208
124638
116806
105805
94010
82302
71328
57941
42871
28383
27536
1518288
INDIA
(in ‘000)2031
20517
100690
106668
112434
114655
117159
122861
125504
117933
107318
96132
85156
75222
63151
48959
34935
23672
23071
1475519
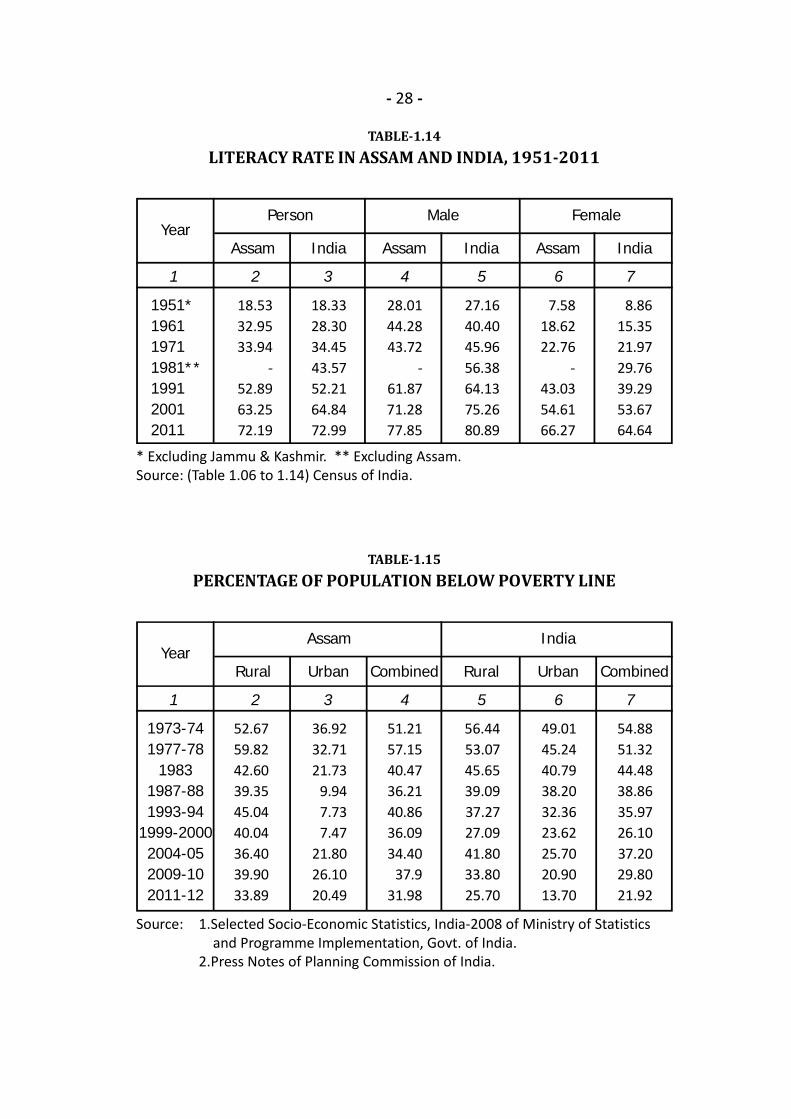
- 28 -
TABLE-1.14LITERACY RATE IN ASSAM AND INDIA, 1951-2011
* Excluding Jammu & Kashmir. ** Excluding Assam.Source: (Table 1.06 to 1.14) Census of India.
1 2 3 4 5 6 7
Assam Assam India Assam IndiaIndiaYear
1951*196119711981**199120012011
18.5332.9533.94
-52.8963.2572.19
18.3328.3034.4543.5752.2164.8472.99
28.0144.2843.72
-61.8771.2877.85
27.1640.4045.9656.3864.1375.2680.89
7.5818.6222.76
-43.0354.6166.27
8.8615.3521.9729.7639.2953.6764.64
Person Male Female
TABLE-1.15PERCENTAGE OF POPULATION BELOW POVERTY LINE
Source: 1.Selected Socio-Economic Statistics, India-2008 of Ministry of Statistics and Programme Implementation, Govt. of India.2.Press Notes of Planning Commission of India.
1 2 3 4 5 6 7
Rural Combined Rural Urban CombinedUrbanYear
1973-741977-78
19831987-881993-94
1999-20002004-052009-102011-12
52.6759.8242.6039.3545.0440.0436.4039.9033.89
36.9232.7121.73
9.947.737.47
21.8026.1020.49
51.2157.1540.4736.2140.8636.0934.40
37.931.98
56.4453.0745.6539.0937.2727.0941.8033.8025.70
49.0145.2440.7938.2032.3623.6225.7020.9013.70
54.8851.3244.4838.8635.9726.1037.2029.8021.92
Assam India
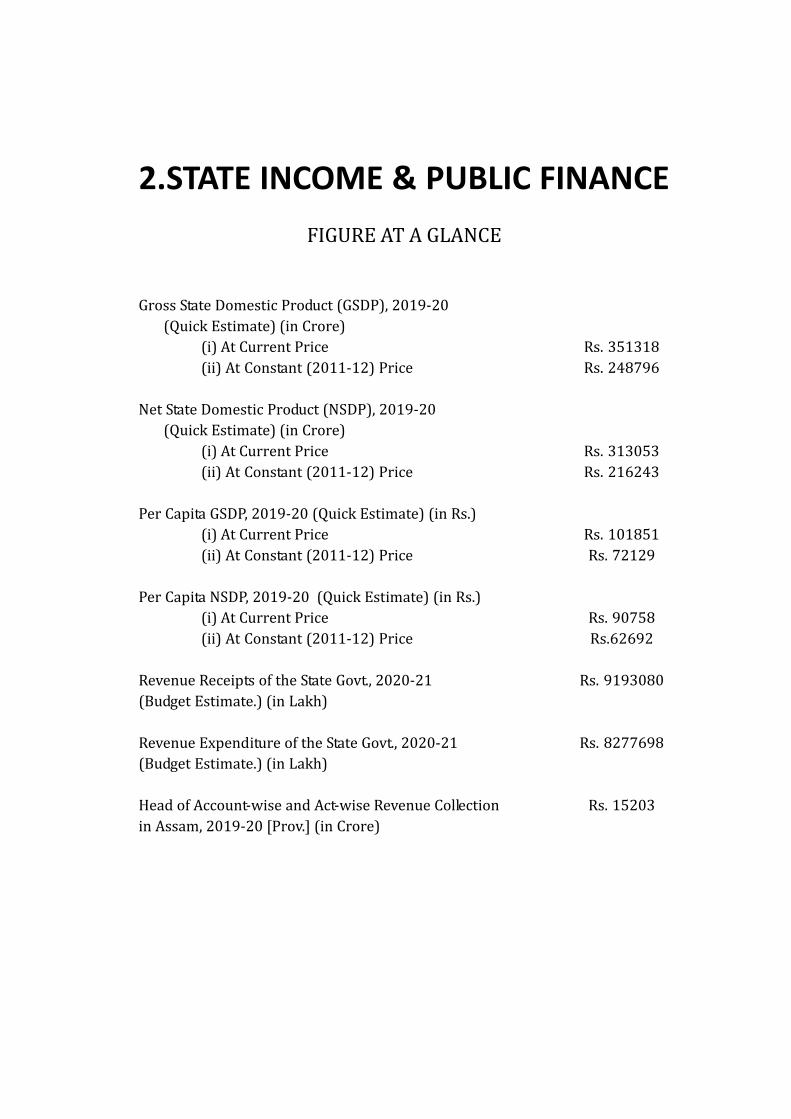
2.STATE INCOME & PUBLIC FINANCEFIGURE AT A GLANCEGross State Domestic Product (GSDP), 2019-20 (Quick Estimate) (in Crore)(i) At Current Price(ii) At Constant (2011-12) PriceNet State Domestic Product (NSDP), 2019-20 (Quick Estimate) (in Crore)(i) At Current Price(ii) At Constant (2011-12) PricePer Capita GSDP, 2019-20 (Quick Estimate) (in Rs.)(i) At Current Price(ii) At Constant (2011-12) PricePer Capita NSDP, 2019-20 (Quick Estimate) (in Rs.)(i) At Current Price(ii) At Constant (2011-12) PriceRevenue Receipts of the State Govt., 2020-21(Budget Estimate.) (in Lakh)Revenue Expenditure of the State Govt., 2020-21(Budget Estimate.) (in Lakh)Head of Account-wise and Act-wise Revenue Collectionin Assam, 2019-20 [Prov.] (in Crore)
Rs. 351318Rs. 248796Rs. 313053Rs. 216243Rs. 101851Rs. 72129Rs. 90758Rs.62692Rs. 9193080
Rs. 8277698Rs. 15203
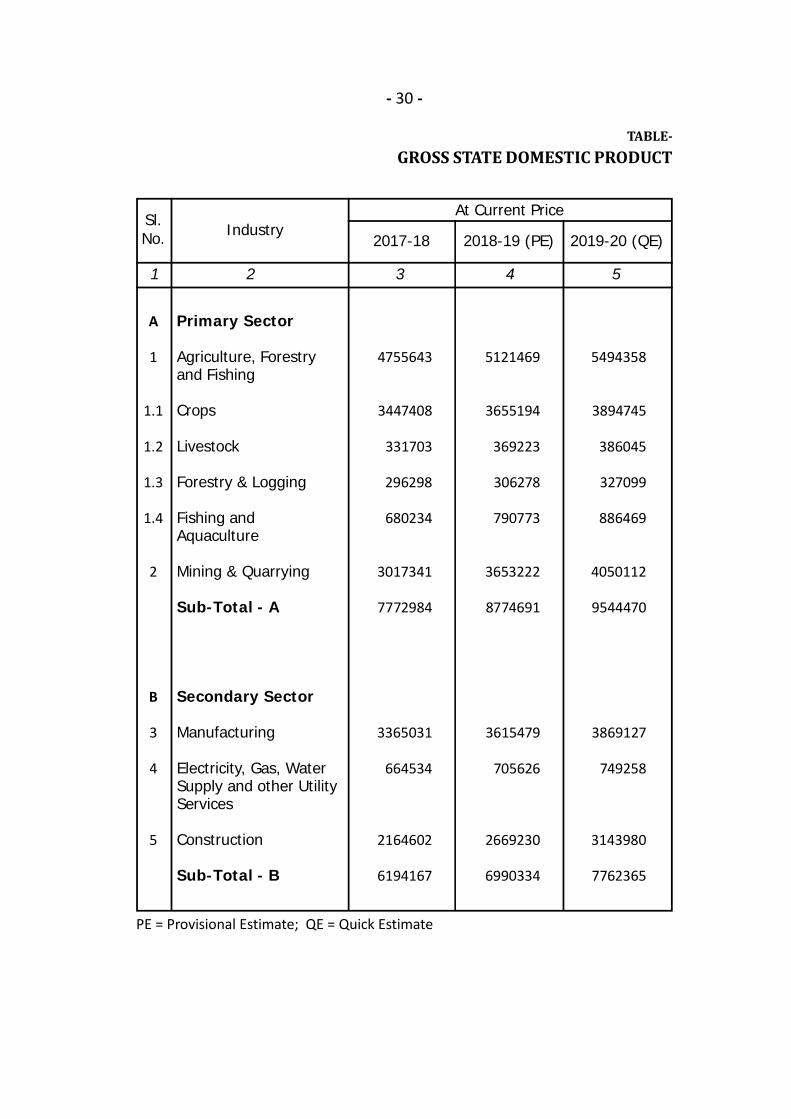
- 30 -
TABLE-GROSS STATE DOMESTIC PRODUCT
1 2 3 4 5
Sl.No. Industry
2018-19 (PE)
Primary Sector
Agriculture, Forestryand Fishing
Crops
Livestock
Forestry & Logging
Fishing andAquaculture
Mining & Quarrying
Sub-Total - A
Secondary Sector
Manufacturing
Electricity, Gas, WaterSupply and other UtilityServices
Construction
Sub-Total - B
A
1
1.1
1.2
1.3
1.4
2
B
3
4
5
5121469
3655194
369223
306278
790773
3653222
8774691
3615479
705626
2669230
6990334
At Current Price
2017-18 2019-20 (QE)
4755643
3447408
331703
296298
680234
3017341
7772984
3365031
664534
2164602
6194167
5494358
3894745
386045
327099
886469
4050112
9544470
3869127
749258
3143980
7762365
PE = Provisional Estimate; QE = Quick Estimate
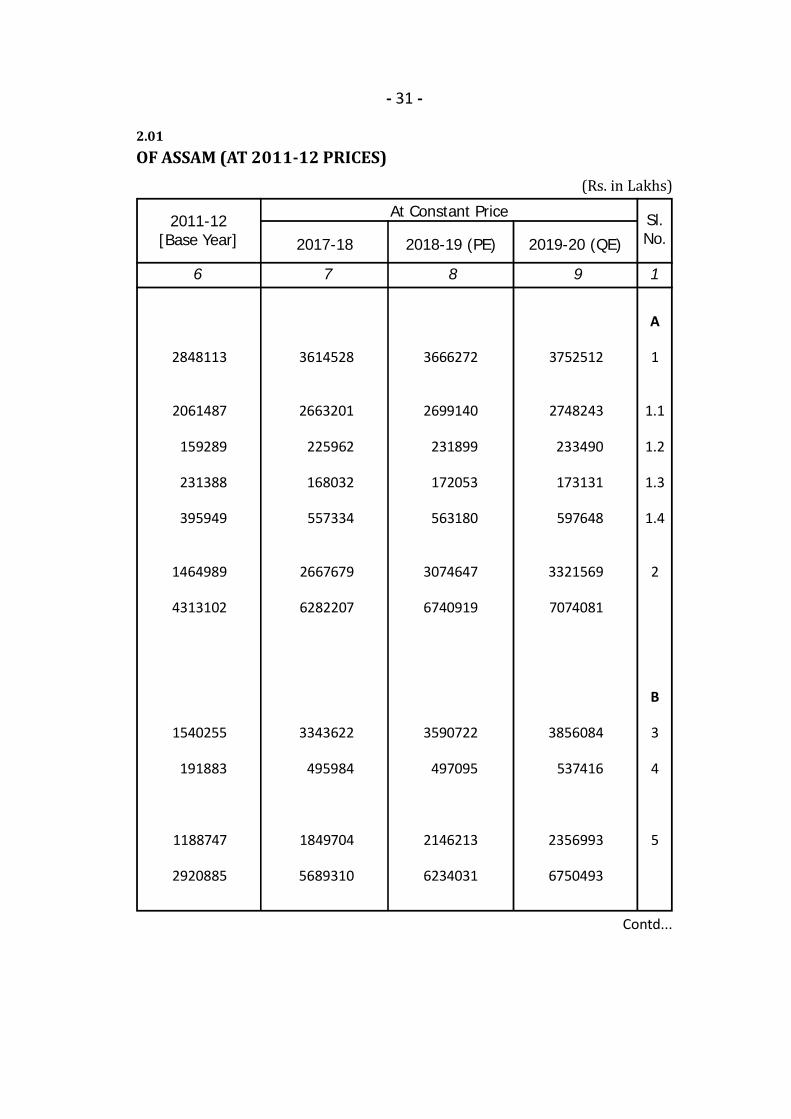
- 31 -
2.01OF ASSAM (AT 2011-12 PRICES) (Rs. in Lakhs)
Contd...
6 7 8 9 1
Sl.No.
At Constant Price
3614528
2663201
225962
168032
557334
2667679
6282207
3343622
495984
1849704
5689310
3666272
2699140
231899
172053
563180
3074647
6740919
3590722
497095
2146213
6234031
A
1
1.1
1.2
1.3
1.4
2
B
3
4
5
3752512
2748243
233490
173131
597648
3321569
7074081
3856084
537416
2356993
6750493
2017-18 2018-19 (PE) 2019-20 (QE)2011-12
[Base Year]
2848113
2061487
159289
231388
395949
1464989
4313102
1540255
191883
1188747
2920885
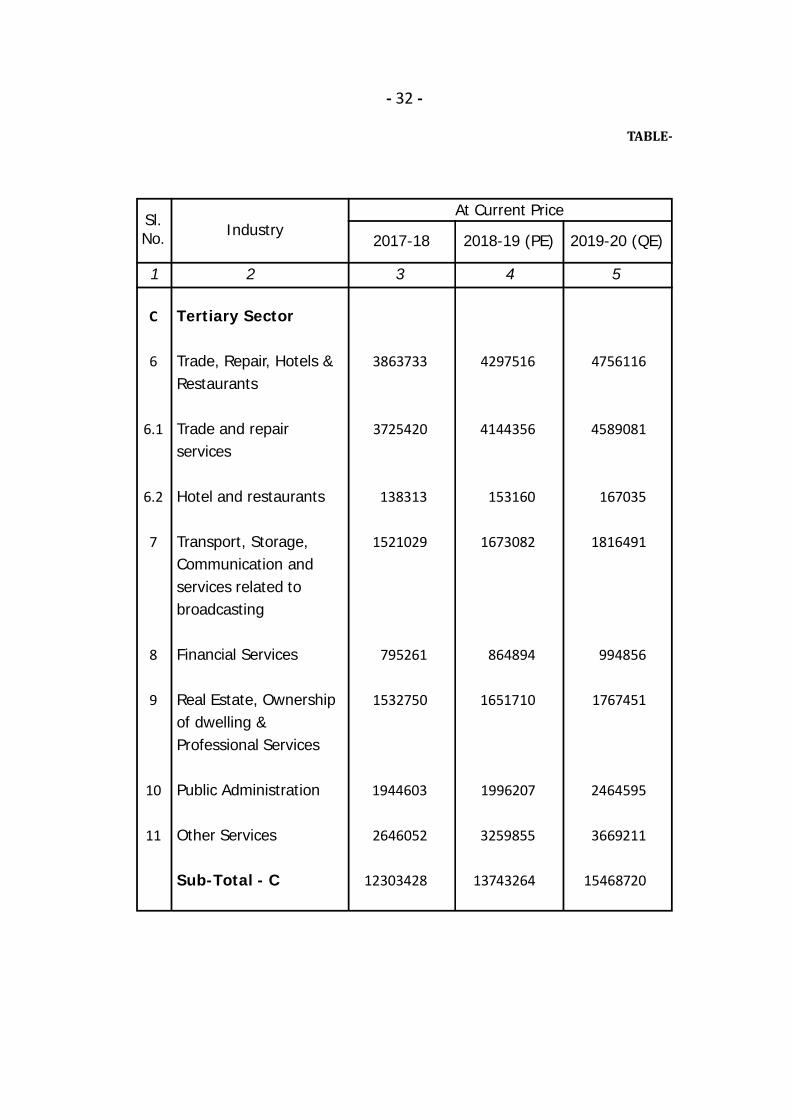
- 32 -
TABLE-
1 2 3 4 5
Sl.No. Industry
2018-19 (PE)
Tertiary Sector
Trade, Repair, Hotels &Restaurants
Trade and repairservices
Hotel and restaurants
Transport, Storage,Communication andservices related tobroadcasting
Financial Services
Real Estate, Ownershipof dwelling &Professional Services
Public Administration
Other Services
Sub-Total - C
C
6
6.1
6.2
7
8
9
10
11
4297516
4144356
153160
1673082
864894
1651710
1996207
3259855
13743264
At Current Price
2017-18 2019-20 (QE)
3863733
3725420
138313
1521029
795261
1532750
1944603
2646052
12303428
4756116
4589081
167035
1816491
994856
1767451
2464595
3669211
15468720

- 33 -
2.01
(Rs. in Lakhs)
Contd...
6 7 8 9 1
Sl.No.
At Constant Price
2372154
2286085
86069
1212499
687214
1115335
1428880
1893074
8709157
2387499
2299865
87634
1237346
693487
1142460
1387103
2202475
9050370
C
6
6.1
6.2
7
8
9
10
11
2446062
2354135
91927
1245327
737134
1167342
1402407
2457866
9456138
2017-18 2018-19 (PE) 2019-20 (QE)2011-12
[Base Year]
2045676
1961211
84465
810091
427077
1112543
821723
1077923
6295033
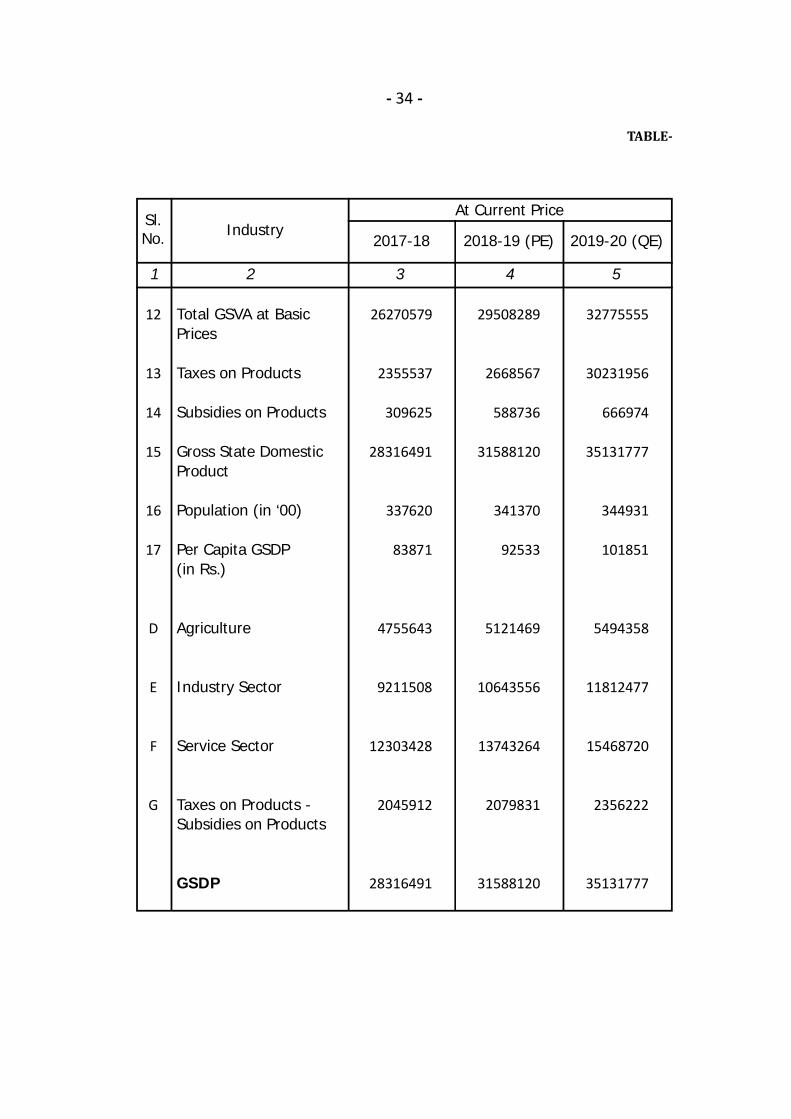
- 34 -
TABLE-
1 2 3 4 5
Sl.No. Industry
Total GSVA at BasicPrices
Taxes on Products
Subsidies on Products
Gross State DomesticProduct
Population (in ‘00)
Per Capita GSDP(in Rs.)
Agriculture
Industry Sector
Service Sector
Taxes on Products -Subsidies on Products
GSDP
12
13
14
15
16
17
D
E
F
G
2018-19 (PE)
29508289
2668567
588736
31588120
341370
92533
5121469
10643556
13743264
2079831
31588120
At Current Price
2017-18 2019-20 (QE)
26270579
2355537
309625
28316491
337620
83871
4755643
9211508
12303428
2045912
28316491
32775555
30231956
666974
35131777
344931
101851
5494358
11812477
15468720
2356222
35131777

- 35 -
2.01
(Rs. in Lakhs) 6 7 8 9 1
Sl.No.
12
13
14
15
16
17
D
E
F
G
At Constant Price
20680673
1561486
250222
21991937
337620
65138
3614528
8356989
8709157
1311264
21991937
22025320
1769273
389803
23404790
341370
68561
3666272
9308678
9050370
1379470
23404790
23280712
2120253
521350
24879615
344931
72129
3752512
10072062
9456138
1598903
24879615
2017-18 2018-19 (PE) 2019-20 (QE)2011-12
[Base Year]
13529020
1203476
415005
14317491
314410
45538
2848113
4385874
6295033
788471
14317491

- 36 -
TABLE-NET STATE DOMESTIC PRODUCT AT
1 2 3 4 5
Sl.No. Industry
2018-19 (PE)
Primary Sector
Agriculture, Forestryand Fishing
Crops
Livestock
Forestry & Logging
Fishing andAquaculture
Mining & Quarrying
Sub-Total - A
Secondary Sector
Manufacturing
Electricity, Gas, WaterSupply and other UtilityServices
Construction
Sub-Total - B
A
1
1.1
1.2
1.3
1.4
2
B
3
4
5
4690243
3292615
360156
303080
734392
3093371
7783614
3157330
484451
2497537
6139319
At Current Price
2017-18 2019-20 (QE)
4359715
3112293
323360
293481
630581
2550486
6910201
2945235
461037
2042907
5449179
4950923
3432489
376926
306126
835382
3449950
8400873
3220126
493743
2647031
6360900
PE = Provisional Estimate; QE = Quick Estimate
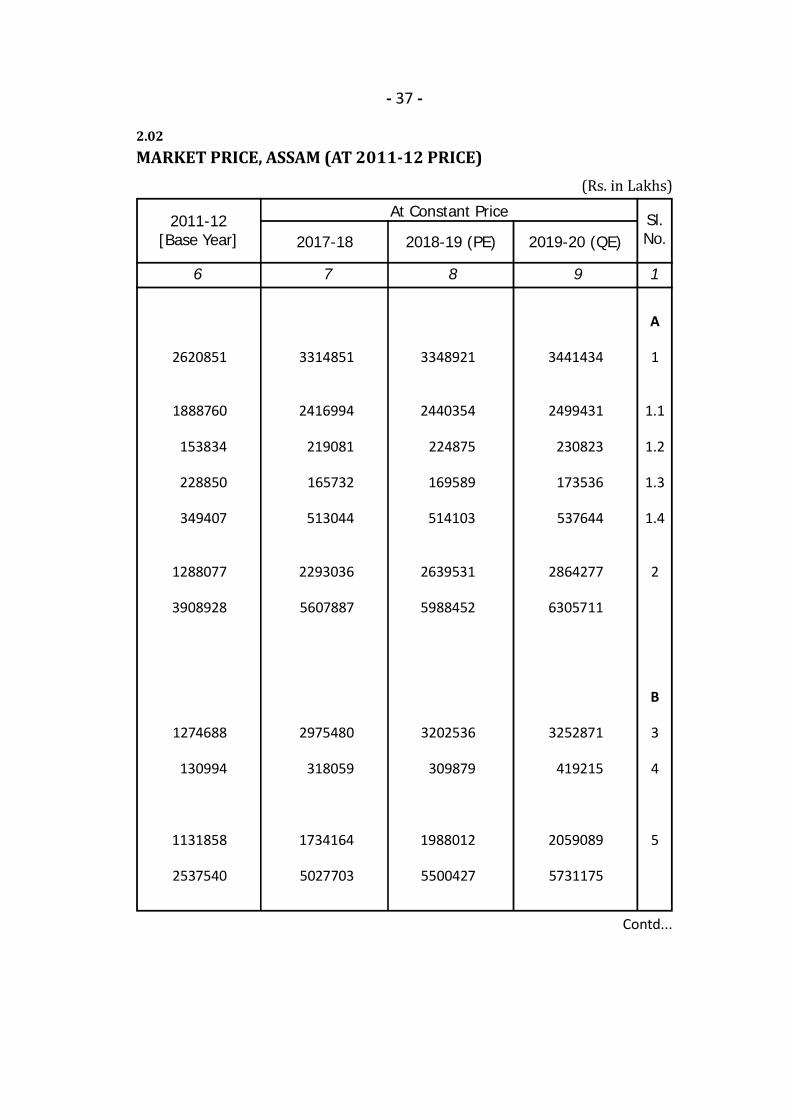
- 37 -
2.02MARKET PRICE, ASSAM (AT 2011-12 PRICE) (Rs. in Lakhs)
Contd...
6 7 8 9 1
Sl.No.
At Constant Price
3314851
2416994
219081
165732
513044
2293036
5607887
2975480
318059
1734164
5027703
3348921
2440354
224875
169589
514103
2639531
5988452
3202536
309879
1988012
5500427
A
1
1.1
1.2
1.3
1.4
2
B
3
4
5
3441434
2499431
230823
173536
537644
2864277
6305711
3252871
419215
2059089
5731175
2017-18 2018-19 (PE) 2019-20 (QE)2011-12
[Base Year]
2620851
1888760
153834
228850
349407
1288077
3908928
1274688
130994
1131858
2537540
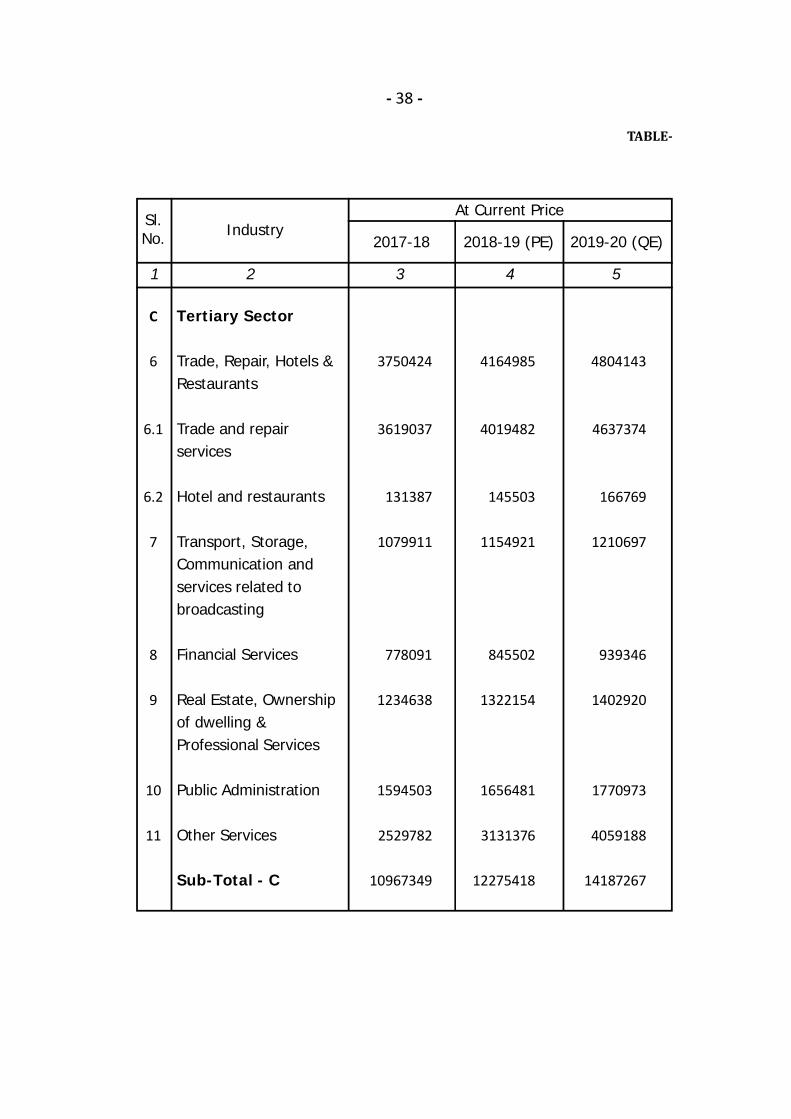
- 38 -
TABLE-
1 2 3 4 5
Sl.No. Industry
2018-19 (PE)
Tertiary Sector
Trade, Repair, Hotels &Restaurants
Trade and repairservices
Hotel and restaurants
Transport, Storage,Communication andservices related tobroadcasting
Financial Services
Real Estate, Ownershipof dwelling &Professional Services
Public Administration
Other Services
Sub-Total - C
C
6
6.1
6.2
7
8
9
10
11
4164985
4019482
145503
1154921
845502
1322154
1656481
3131376
12275418
At Current Price
2017-18 2019-20 (QE)
3750424
3619037
131387
1079911
778091
1234638
1594503
2529782
10967349
4804143
4637374
166769
1210697
939346
1402920
1770973
4059188
14187267
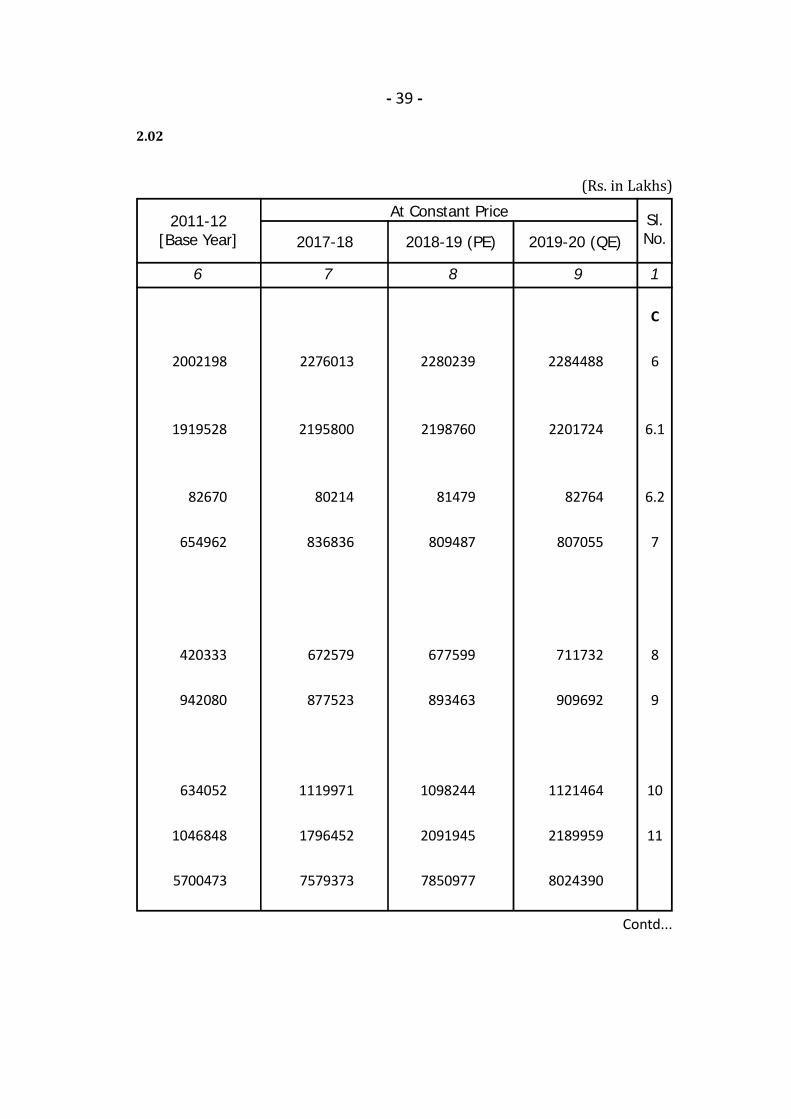
- 39 -
2.02
(Rs. in Lakhs)
Contd...
6 7 8 9 1
Sl.No.
At Constant Price
2276013
2195800
80214
836836
672579
877523
1119971
1796452
7579373
2280239
2198760
81479
809487
677599
893463
1098244
2091945
7850977
C
6
6.1
6.2
7
8
9
10
11
2284488
2201724
82764
807055
711732
909692
1121464
2189959
8024390
2017-18 2018-19 (PE) 2019-20 (QE)2011-12
[Base Year]
2002198
1919528
82670
654962
420333
942080
634052
1046848
5700473
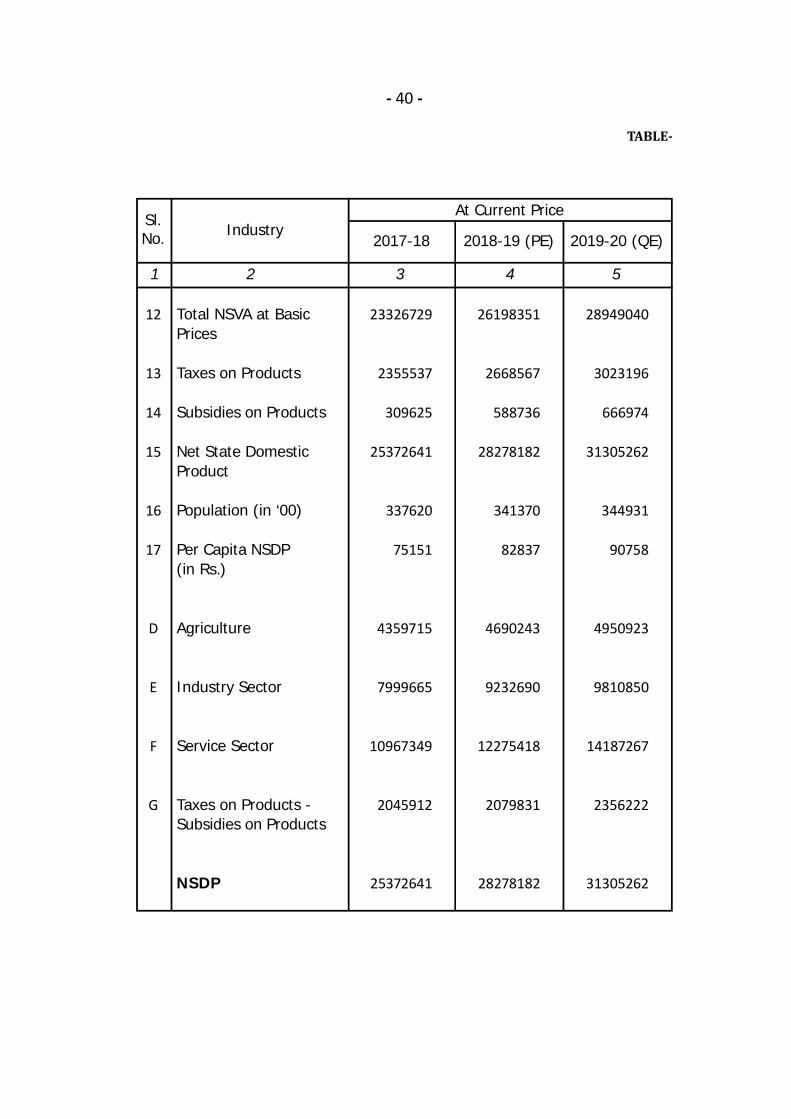
- 40 -
TABLE-
1 2 3 4 5
Sl.No. Industry
Total NSVA at BasicPrices
Taxes on Products
Subsidies on Products
Net State DomesticProduct
Population (in ‘00)
Per Capita NSDP(in Rs.)
Agriculture
Industry Sector
Service Sector
Taxes on Products -Subsidies on Products
NSDP
12
13
14
15
16
17
D
E
F
G
2018-19 (PE)
26198351
2668567
588736
28278182
341370
82837
4690243
9232690
12275418
2079831
28278182
At Current Price
2017-18 2019-20 (QE)
23326729
2355537
309625
25372641
337620
75151
4359715
7999665
10967349
2045912
25372641
28949040
3023196
666974
31305262
344931
90758
4950923
9810850
14187267
2356222
31305262
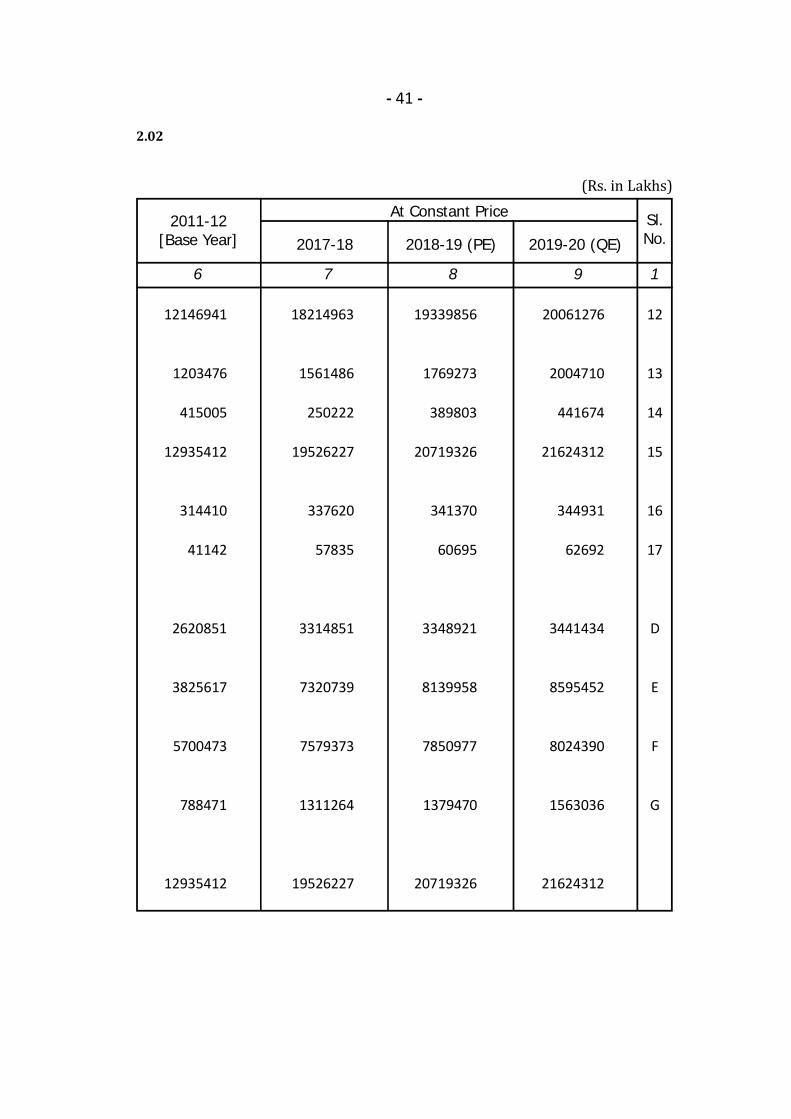
- 41 -
2.02
(Rs. in Lakhs) 6 7 8 9 1
Sl.No.
12
13
14
15
16
17
D
E
F
G
At Constant Price
18214963
1561486
250222
19526227
337620
57835
3314851
7320739
7579373
1311264
19526227
19339856
1769273
389803
20719326
341370
60695
3348921
8139958
7850977
1379470
20719326
20061276
2004710
441674
21624312
344931
62692
3441434
8595452
8024390
1563036
21624312
2017-18 2018-19 (PE) 2019-20 (QE)2011-12
[Base Year]
12146941
1203476
415005
12935412
314410
41142
2620851
3825617
5700473
788471
12935412
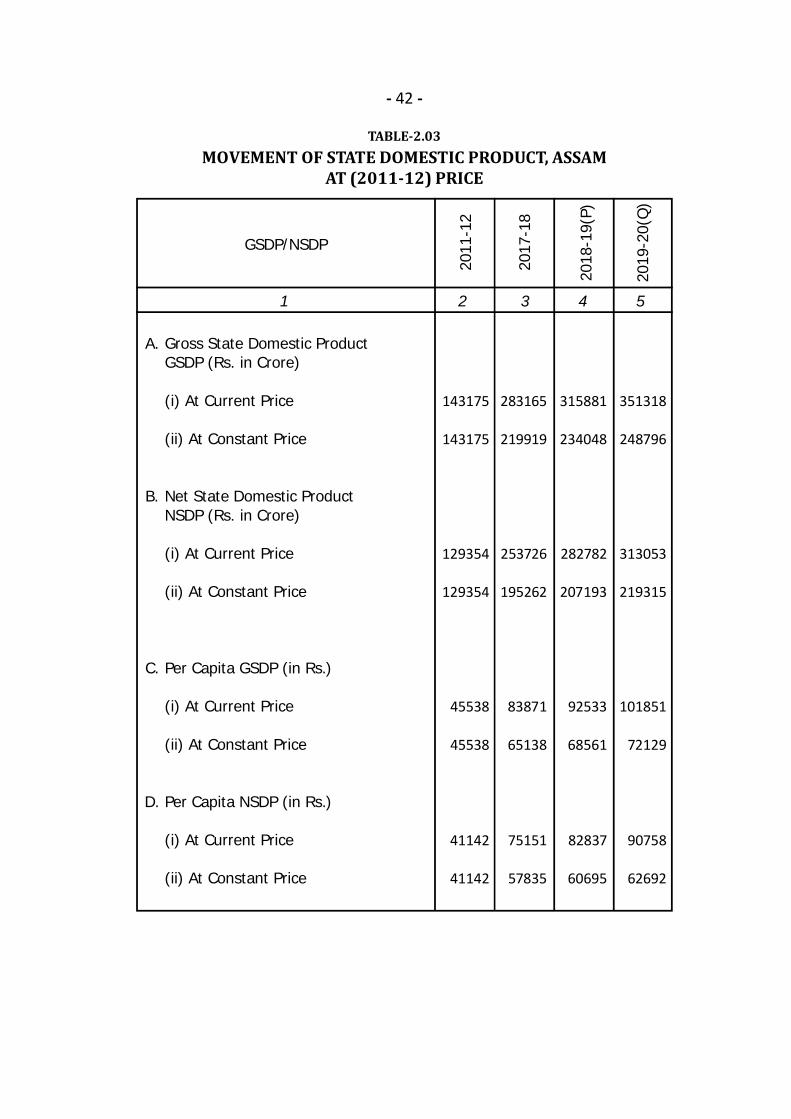
- 42 -
TABLE-2.03MOVEMENT OF STATE DOMESTIC PRODUCT, ASSAM
AT (2011-12) PRICE
1 2 3 4 5
GSDP/NSDP
A.
B.
C.
D.
Gross State Domestic ProductGSDP (Rs. in Crore)
(i) At Current Price
(ii) At Constant Price
Net State Domestic ProductNSDP (Rs. in Crore)
(i) At Current Price
(ii) At Constant Price
Per Capita GSDP (in Rs.)
(i) At Current Price
(ii) At Constant Price
Per Capita NSDP (in Rs.)
(i) At Current Price
(ii) At Constant Price
143175
143175
129354
129354
45538
45538
41142
41142
283165
219919
253726
195262
83871
65138
75151
57835
315881
234048
282782
207193
92533
68561
82837
60695
351318
248796
313053
219315
101851
72129
90758
62692
2011
-12
2017
-18
2018
-19(
P)
2019
-20(
Q)

- 43 -
TABLE-2.04GROSS DISTRICT DOMESTIC PRODUCTS AT CURRENT PRICES
[Base Year : 2011-12]
1 2 3 4 5 6 7
KokrajharDhubriGoalparaBarpetaMorigaonNagaonSonitpurLakhimpurDhemajiTinsukiaDibrugarhSivasagarJorhatGolaghatKarbi AnglongDima HasaoCacharKarimganjHailakandiBongaigaonChirangKamrupKamrup MetroNalbariBaksaDarrangUdalguriBiswanathCharaideoHojaiMajuliSouth SalmaraWest Karbi Anglong
Assam
District 2011-12 2013-14 2014-15 2015-16
386609312669343514632577284860684296459571384742210611
10542931029354
689126469671485155299962173355680648381944199747366491153909654977
1453153322183265708299907290203230505294007419509133621121764148934
14317491
481156391762398503778199367917881851560298496975260603
12330671218864
791355597218603973347045216920885771478474263363459254191040827842
1828741410563344714375919376373304749356712531641179535148356185769
17774522
529247433577441531875133401842974449619830550576287747
13384881324438
869599654510665449377841237770979667532965291605507182211075911948
2017935457888381413416069407874334321388644586228197295164578203601
19572315
594669480088494711951318445825
1092379700952615882327085
176917917515541164657
747645776423451473286329
1098348580737322819571637239289
10239682280855
510393421253464368456693374986487350669789216867180712245649
22795882
656271548562546806
1090163497496
1248213791568675578354929
196087519111341269286
843191864823495361307814
1237230665335358537642784264498
11556932569659
555364471694524498500890420922538690760899245605195702268166
25438236
734717599565608177
1216343554611
1371744865823748592399579
217403821367351411590
938367956183548940350721
1381425743688408293712934292315
13067962887647
621478522513581831553438463761603085827890278198220343295131
28316491
2016-17 2017-18
(Rs. in Lakhs)

- 44 -
TABLE-2.05GROSS DISTRICT DOMESTIC PRODUCTS AT CONSTANT PRICES
[Base Year : 2011-12]
1 2 3 4 5 6 7
KokrajharDhubriGoalparaBarpetaMorigaonNagaonSonitpurLakhimpurDhemajiTinsukiaDibrugarhSivasagarJorhatGolaghatKarbi AnglongDima HasaoCacharKarimganjHailakandiBongaigaonChirangKamrupKamrup MetroNalbariBaksaDarrangUdalguriBiswanathCharaideoHojaiMajuliSouth SalmaraWest Karbi Anglong
Assam
District 2011-12 2013-14 2014-15 2015-16
386609312669343514632577284860684296459571384742210611
10542931029354
689126469671485155299962173355680648381944199747366491153909654977
1453153322183265708299907290203230505294007419509133621121764148934
14317491
432060332956341365677317313256765607483742433356226129
10706521053438
696683519886524229298849188076769718415585229733395263175395722274
1577067356374304938329811326147267291314714451716155369133211170333
15452540
462040356936365778730673334570818748520315462556241108
11363941117220
740997557695560515315350198856823928449408246365423551187556776618
1694057382893326079353464346937283402333905485256164953142732180375
16521230
496218386514402398767359359850916084582774501052263864
152987615145361023611
635070645597382149242743908033483280268762474161196320864533
1904077416786344930393757367779312229431300570411176929149493198424
19110899
523864406520418788816250376718984666623337519069271609
161316015891871063586
681077683063394198251398971319515219281293503515204793928292
2027819436518363813420451385891331251464579607659186062156294206826
20208084
562343442197454642888993407790
1074106678578562694295295
175737717317851161024
742184744058423498271396
1056254562364307357546677221709
10063502237089
475766392395456863410171358700504135661878202881169708223682
21991939
2016-17 2017-18
(Rs. in Lakhs)
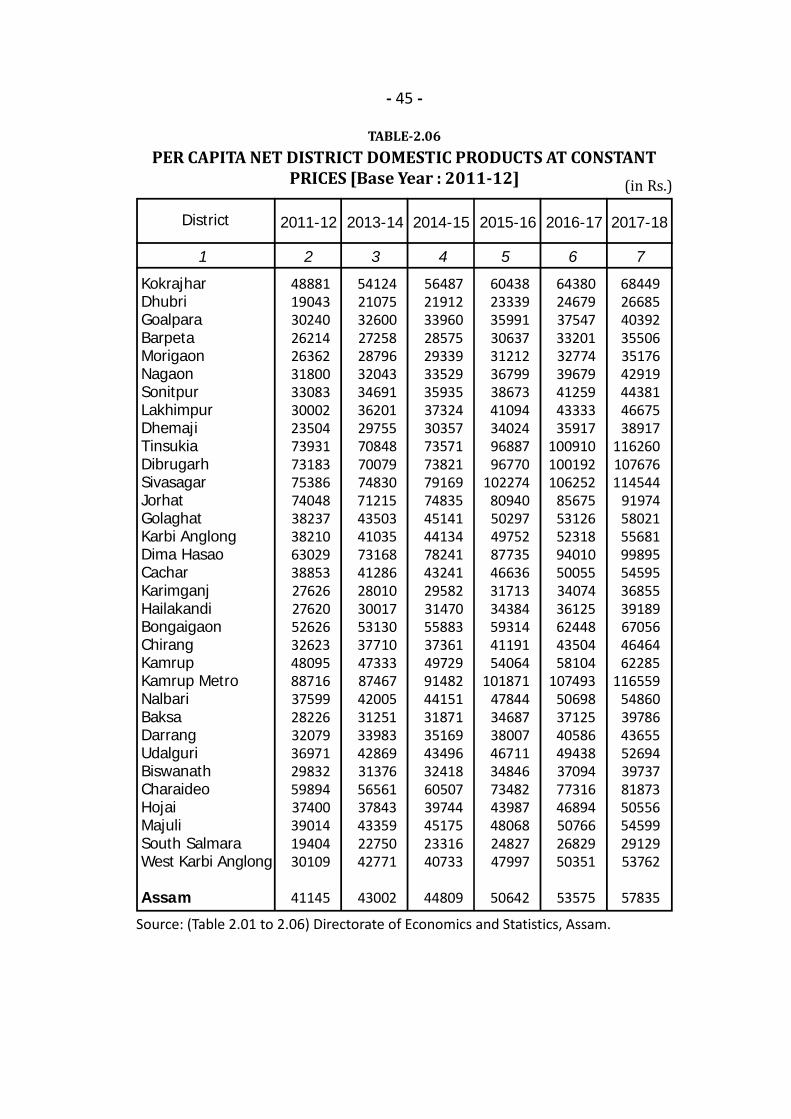
- 45 -
TABLE-2.06PER CAPITA NET DISTRICT DOMESTIC PRODUCTS AT CONSTANT
PRICES [Base Year : 2011-12]
1 2 3 4 5 6 7
KokrajharDhubriGoalparaBarpetaMorigaonNagaonSonitpurLakhimpurDhemajiTinsukiaDibrugarhSivasagarJorhatGolaghatKarbi AnglongDima HasaoCacharKarimganjHailakandiBongaigaonChirangKamrupKamrup MetroNalbariBaksaDarrangUdalguriBiswanathCharaideoHojaiMajuliSouth SalmaraWest Karbi Anglong
Assam
District 2011-12 2013-14 2014-15 2015-16
488811904330240262142636231800330833000223504739317318375386740483823738210630293885327626276205262632623480958871637599282263207936971298325989437400390141940430109
41145
541242107532600272582879632043346913620129755708487007974830712154350341035731684128628010300175313037710473338746742005312513398342869313765656137843433592275042771
43002
564872191233960285752933933529359353732430357735717382179169748354514144134782414324129582314705588337361497299148244151318713516943496324186050739744451752331640733
44809
6043823339359913063731212367993867341094340249688796770
10227480940502974975287735466363171334384593144119154064
10187147844346873800746711348467348243987480682482747997
50642
643802467937547332013277439679412594333335917
100910100192106252
85675531265231894010500553407436125624484350458104
10749350698371254058649438370947731646894507662682950351
53575
684492668540392355063517642919443814667538917
116260107676114544
91974580215568199895545953685539189670564646462285
11655954860397864365552694397378187350556545992912953762
57835
2016-17 2017-18
(in Rs.)
Source: (Table 2.01 to 2.06) Directorate of Economics and Statistics, Assam.
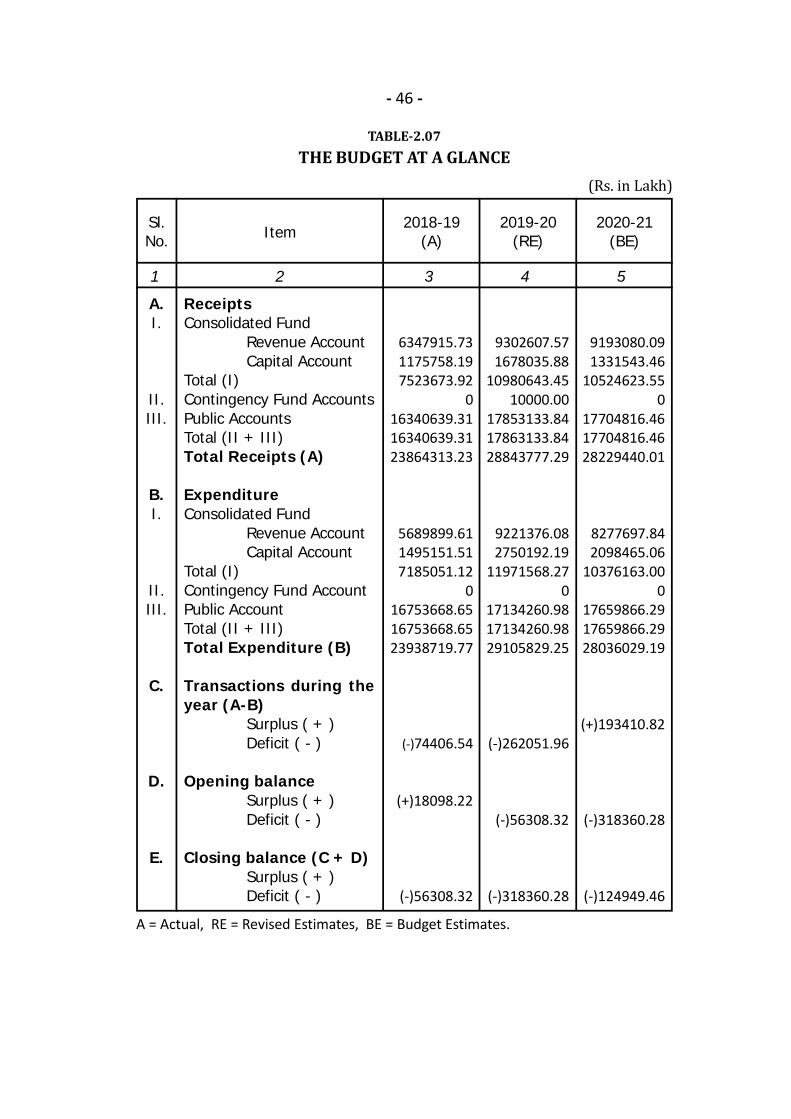
- 46 -
TABLE-2.07THE BUDGET AT A GLANCE
A = Actual, RE = Revised Estimates, BE = Budget Estimates.
1 2 3 4 5
Item
A.I.
II.III.
B.I.
II.III.
C.
D.
E.
ReceiptsConsolidated Fund
Revenue AccountCapital Account
Total (I)Contingency Fund AccountsPublic AccountsTotal (II + III)Total Receipts (A)
ExpenditureConsolidated Fund
Revenue AccountCapital Account
Total (I)Contingency Fund AccountPublic AccountTotal (II + III)Total Expenditure (B)
Transactions during theyear (A-B)
Surplus ( + )Deficit ( - )
Opening balanceSurplus ( + )Deficit ( - )
Closing balance (C + D)Surplus ( + )Deficit ( - )
9302607.571678035.88
10980643.4510000.00
17853133.8417863133.8428843777.29
9221376.082750192.19
11971568.270
17134260.9817134260.9829105829.25
(-)262051.96
(-)56308.32
(-)318360.28
9193080.091331543.46
10524623.550
17704816.4617704816.4628229440.01
8277697.842098465.06
10376163.000
17659866.2917659866.2928036029.19
(+)193410.82
(-)318360.28
(-)124949.46
2019-20(RE)
2020-21(BE)
Sl.No.
(Rs. in Lakh)2018-19
(A)
6347915.731175758.197523673.92
016340639.3116340639.3123864313.23
5689899.611495151.517185051.12
016753668.6516753668.6523938719.77
(-)74406.54
(+)18098.22
(-)56308.32
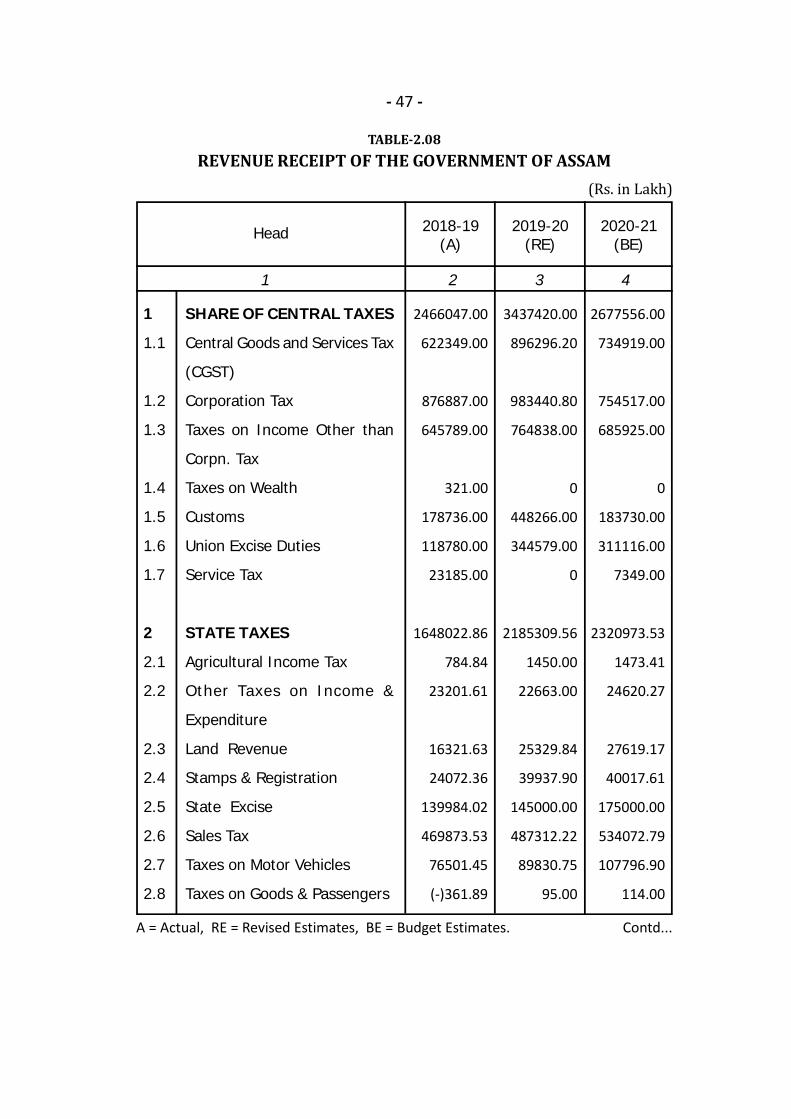
- 47 -
TABLE-2.08REVENUE RECEIPT OF THE GOVERNMENT OF ASSAM
A = Actual, RE = Revised Estimates, BE = Budget Estimates.
1 2 3 4
Head
1
1.1
1.2
1.3
1.4
1.5
1.6
1.7
2
2.1
2.2
2.3
2.4
2.5
2.6
2.7
2.8
SHARE OF CENTRAL TAXES
Central Goods and Services Tax
(CGST)
Corporation Tax
Taxes on Income Other than
Corpn. Tax
Taxes on Wealth
Customs
Union Excise Duties
Service Tax
STATE TAXES
Agricultural Income Tax
Other Taxes on Income &
Expenditure
Land Revenue
Stamps & Registration
State Excise
Sales Tax
Taxes on Motor Vehicles
Taxes on Goods & Passengers
2466047.00
622349.00
876887.00
645789.00
321.00
178736.00
118780.00
23185.00
1648022.86
784.84
23201.61
16321.63
24072.36
139984.02
469873.53
76501.45
(-)361.89
2677556.00
734919.00
754517.00
685925.00
0
183730.00
311116.00
7349.00
2320973.53
1473.41
24620.27
27619.17
40017.61
175000.00
534072.79
107796.90
114.00
2018-19(A)
2019-20(RE)
(Rs. in Lakh)2020-21
(BE)
3437420.00
896296.20
983440.80
764838.00
0
448266.00
344579.00
0
2185309.56
1450.00
22663.00
25329.84
39937.90
145000.00
487312.22
89830.75
95.00
Contd...

- 48 -
TABLE-2.08
1 2 3 4
Head
2.9
2.10
2.11
2.12
3
3.1
3.2
3.3
3.4
4
Taxes & Duties on Electricity
Other Taxes and Duties on
Commodities and Services
State Goods and Service Tax
(SGST)
Integrated Goods and Services
Tax (IGST)
STATE NON-TAX REVENUE
Interest, Dividend & Profits
General services
Social and Community Services
Economic Services
GRANTS-IN-AID
TOTAL RECEIPTS :
(1+2+3+4)
7275.34
1396.08
839303.89
49670.00
822128.90
74133.81
97296.67
5211.40
645487.02
1411716.97
6347915.73
16622.51
125.74
1393511.18
0
730378.86
114661.44
134321.19
6653.13
474743.10
3464171.65
9193080.09
2018-19(A)
2019-20(RE)
(Rs. in Lakh)2020-21
(BE)
14250.79
0
1314917.06
44523.00
1020819.42
96195.07
24366.10
9119.74
891138.51
2659058.59
9302607.57

- 49 -
TABLE-2.09REVENUE EXPENDITURE OF THE GOVERNMENT OF ASSAM
1 2 3 4
Source of Revenue
11.11.21.3
1.41.52
2.12.22.3
2.42.533.13.23.33.4
3.54
GENERAL SERVICESOrgans of StateFiscal ServicesInterest, Payments & Servicing ofDebtsAdministrative ServicesPension & Miscellaneous ServicesSOCIAL & COMMUNITYSERVICESEducation, Sports, Art & CultureHealth and Family WelfareWater Supply, Sanitation,Housing and Urban DevelopmentInformation and BroadcastingOthersECONOMIC SERVICESGeneral Economic ServicesAgriculture and Allied ServicesIndustry and MineralsScience, Technology andEnvironmentTransport and CommunicationGRANTS-IN-AID &CONTRIBUTION
TOTAL EXPENDITURE(1+2+3+4)
2105864.0857463.8583200.01
407342.83
628162.52929694.87
2533444.27
1560887.38425175.78139745.24
6734.43400901.44
1023202.1170852.48
289545.7656587.79
3005.97
145041.6327389.15
5689899.61
3121557.3379120.11
115929.48616240.63
1367825.28942441.83
3649864.16
1887114.01574245.04478051.77
10840.84699612.50
1452320.2388391.20
458021.7558758.71
3541.12
184536.0353956.13
8277697.84
2018-19(A)
2019-20(RE)
(Rs. in Lakh)2020-21
(BE)
2842771.2267697.70
169466.72512296.34
1068680.221024630.244068292.35
2089637.24681737.39580007.60
10220.95706689.17
1606641.54101792.55644850.79
86625.432782.24
236008.98103670.97
9221376.08
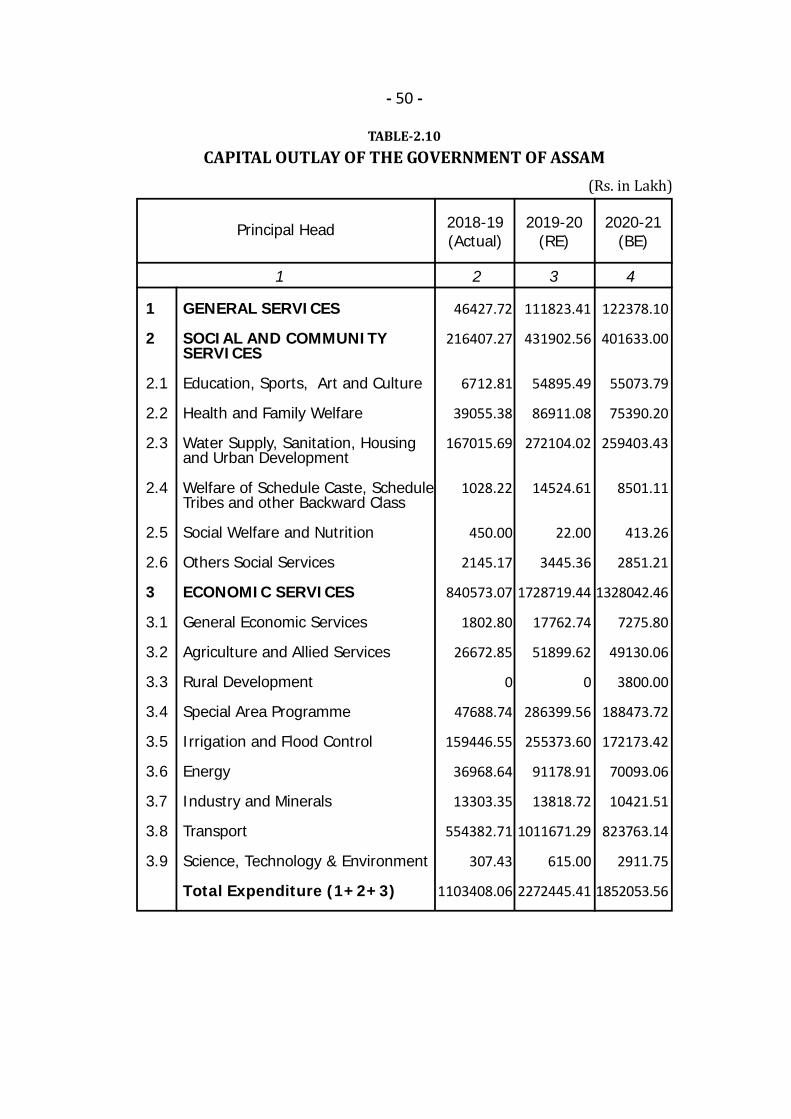
- 50 -
TABLE-2.10CAPITAL OUTLAY OF THE GOVERNMENT OF ASSAM
1 2 3 4
Principal Head
1
2
2.1
2.2
2.3
2.4
2.5
2.6
3
3.1
3.2
3.3
3.4
3.5
3.6
3.7
3.8
3.9
GENERAL SERVICES
SOCIAL AND COMMUNITYSERVICES
Education, Sports, Art and Culture
Health and Family Welfare
Water Supply, Sanitation, Housingand Urban Development
Welfare of Schedule Caste, ScheduleTribes and other Backward Class
Social Welfare and Nutrition
Others Social Services
ECONOMIC SERVICES
General Economic Services
Agriculture and Allied Services
Rural Development
Special Area Programme
Irrigation and Flood Control
Energy
Industry and Minerals
Transport
Science, Technology & Environment
Total Expenditure (1+2+3)
46427.72
216407.27
6712.81
39055.38
167015.69
1028.22
450.00
2145.17
840573.07
1802.80
26672.85
0
47688.74
159446.55
36968.64
13303.35
554382.71
307.43
1103408.06
122378.10
401633.00
55073.79
75390.20
259403.43
8501.11
413.26
2851.21
1328042.46
7275.80
49130.06
3800.00
188473.72
172173.42
70093.06
10421.51
823763.14
2911.75
1852053.56
2018-19(Actual)
2019-20(RE)
(Rs. in Lakh)2020-21
(BE)
111823.41
431902.56
54895.49
86911.08
272104.02
14524.61
22.00
3445.36
1728719.44
17762.74
51899.62
0
286399.56
255373.60
91178.91
13818.72
1011671.29
615.00
2272445.41

- 51 -
TABLE-2.11PUBLIC DEBT OF THE GOVERNMENT OF ASSAM
1 2 3 4
Principal Head
A12
B
12
Internal debt of the State Govt.ReceiptExpenditure
Loan and Advances from theCentreReceiptExpenditure
TotalReceiptExpenditure
Net Extension of Debt. (1-2)
1166549.35344809.73
8915.9114126.72
1175465.26358936.45
816528.81
1276389.02199855.14
25125.0014928.37
1301514.02214783.51
1086731
2018-19(Actual)
2019-20(RE)
(Rs. in Lakh)2020-21
(BE)
1547868.01396417.40
25225.0014539.94
1573093.01410957.34
1162135.67
TABLE-2.12LOANS AND ADVANCES BY THE GOVERNMENT OF ASSAM
1 2 3 4
Head
Receipt 34832.39 31627.99
2018-19(Actual)
2019-20(RE)
(Rs. in Lakh)2020-21
(BE)
46789.43
Source: (Table 2.07 to 2.12) Department of Finance, Assam.
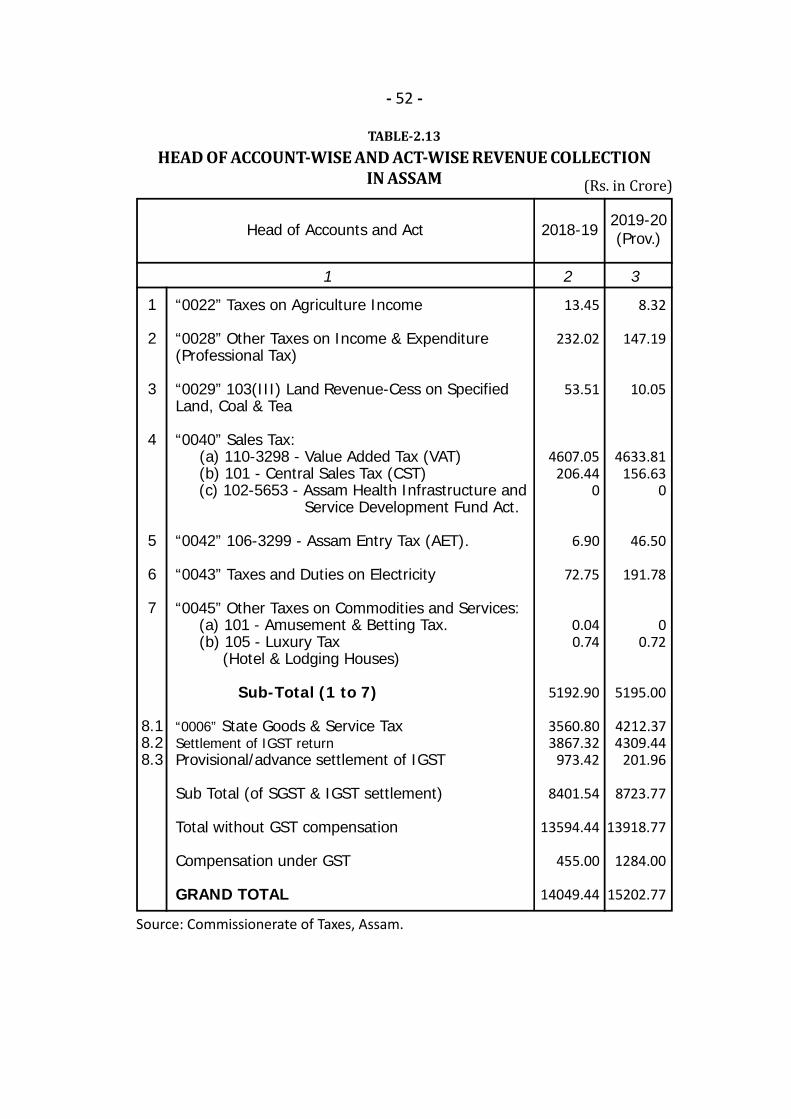
- 52 -
TABLE-2.13HEAD OF ACCOUNT-WISE AND ACT-WISE REVENUE COLLECTION
IN ASSAM
1 2 3
Head of Accounts and Act
1
2
3
4
5
6
7
8.18.28.3
“0022” Taxes on Agriculture Income
“0028” Other Taxes on Income & Expenditure(Professional Tax)
“0029” 103(III) Land Revenue-Cess on SpecifiedLand, Coal & Tea
“0040” Sales Tax: (a) 110-3298 - Value Added Tax (VAT) (b) 101 - Central Sales Tax (CST) (c) 102-5653 - Assam Health Infrastructure and
Service Development Fund Act.
“0042” 106-3299 - Assam Entry Tax (AET).
“0043” Taxes and Duties on Electricity
“0045” Other Taxes on Commodities and Services: (a) 101 - Amusement & Betting Tax. (b) 105 - Luxury Tax (Hotel & Lodging Houses)
Sub-Total (1 to 7)
“0006” State Goods & Service TaxSettlement of IGST returnProvisional/advance settlement of IGST
Sub Total (of SGST & IGST settlement)
Total without GST compensation
Compensation under GST
GRAND TOTAL
8.32
147.19
10.05
4633.81156.63
0
46.50
191.78
00.72
5195.00
4212.374309.44
201.96
8723.77
13918.77
1284.00
15202.77
2018-19
(Rs. in Crore)2019-20(Prov.)
13.45
232.02
53.51
4607.05206.44
0
6.90
72.75
0.040.74
5192.90
3560.803867.32
973.42
8401.54
13594.44
455.00
14049.44
Source: Commissionerate of Taxes, Assam.

3.PRICEFIGURE AT A GLANCEWholesale Price Index for Agricultural Commodities, 2019-20(Base 1993-94=100)C P I for Industrial Workers, 2019(Base 2001=100)C P I for Working Class Population, 2019(Base 2001=100)C P I for Agricultural Labourers, 2019(Base 1986-87=100)General :Food :C P I for Rural Labourers, 2019(Base 1986-87=100)General :Food :
423274281
896861897877
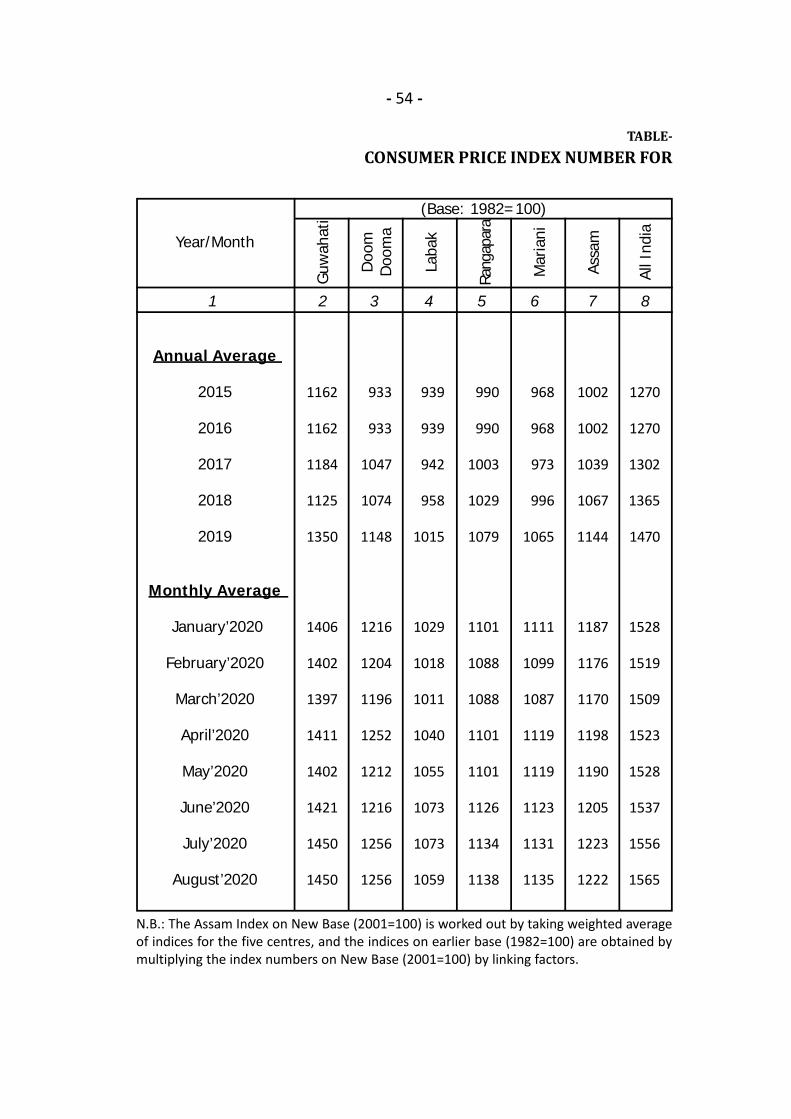
- 54 -
TABLE-CONSUMER PRICE INDEX NUMBER FOR
1 2 3 4 5 6 7 8
Annual Average
2015
2016
2017
2018
2019
Monthly Average
January’2020
February’2020
March’2020
April’2020
May’2020
June’2020
July’2020
August’2020
Year/Month
Guw
ahat
i (Base: 1982=100)
1162
1162
1184
1125
1350
1406
1402
1397
1411
1402
1421
1450
1450
933
933
1047
1074
1148
1216
1204
1196
1252
1212
1216
1256
1256
939
939
942
958
1015
1029
1018
1011
1040
1055
1073
1073
1059
990
990
1003
1029
1079
1101
1088
1088
1101
1101
1126
1134
1138
968
968
973
996
1065
1111
1099
1087
1119
1119
1123
1131
1135
1002
1002
1039
1067
1144
1187
1176
1170
1198
1190
1205
1223
1222
1270
1270
1302
1365
1470
1528
1519
1509
1523
1528
1537
1556
1565
Doo
mD
oom
a
Laba
k
Rang
apar
a
Mar
iani
Assa
m
All I
ndia
N.B.: The Assam Index on New Base (2001=100) is worked out by taking weighted averageof indices for the five centres, and the indices on earlier base (1982=100) are obtained bymultiplying the index numbers on New Base (2001=100) by linking factors.
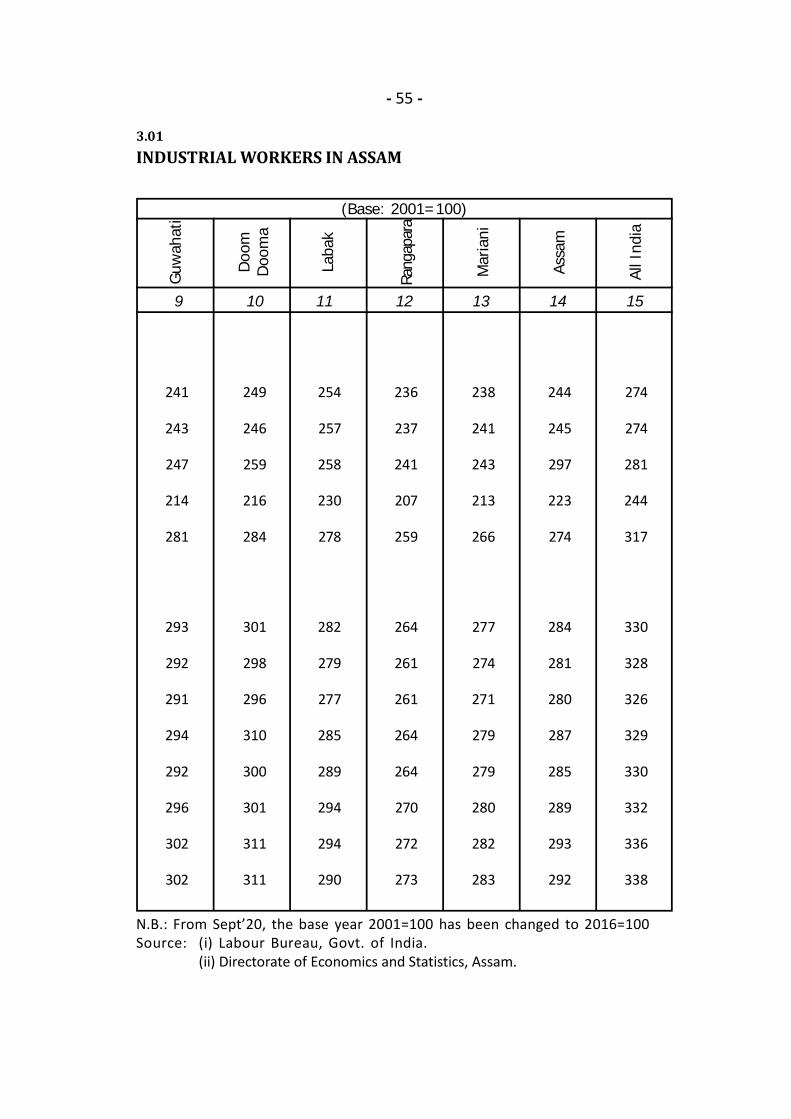
- 55 -
3.01INDUSTRIAL WORKERS IN ASSAM
9 10 11 12 13 14 15
(Base: 2001=100)
241
243
247
214
281
293
292
291
294
292
296
302
302
249
246
259
216
284
301
298
296
310
300
301
311
311
254
257
258
230
278
282
279
277
285
289
294
294
290
236
237
241
207
259
264
261
261
264
264
270
272
273
238
241
243
213
266
277
274
271
279
279
280
282
283
244
245
297
223
274
284
281
280
287
285
289
293
292
274
274
281
244
317
330
328
326
329
330
332
336
338
Guw
ahat
i
Doo
mD
oom
a
Laba
k
Rang
apar
a
Mar
iani
Assa
m
All I
ndia
N.B.: From Sept’20, the base year 2001=100 has been changed to 2016=100Source: (i) Labour Bureau, Govt. of India.
(ii) Directorate of Economics and Statistics, Assam.
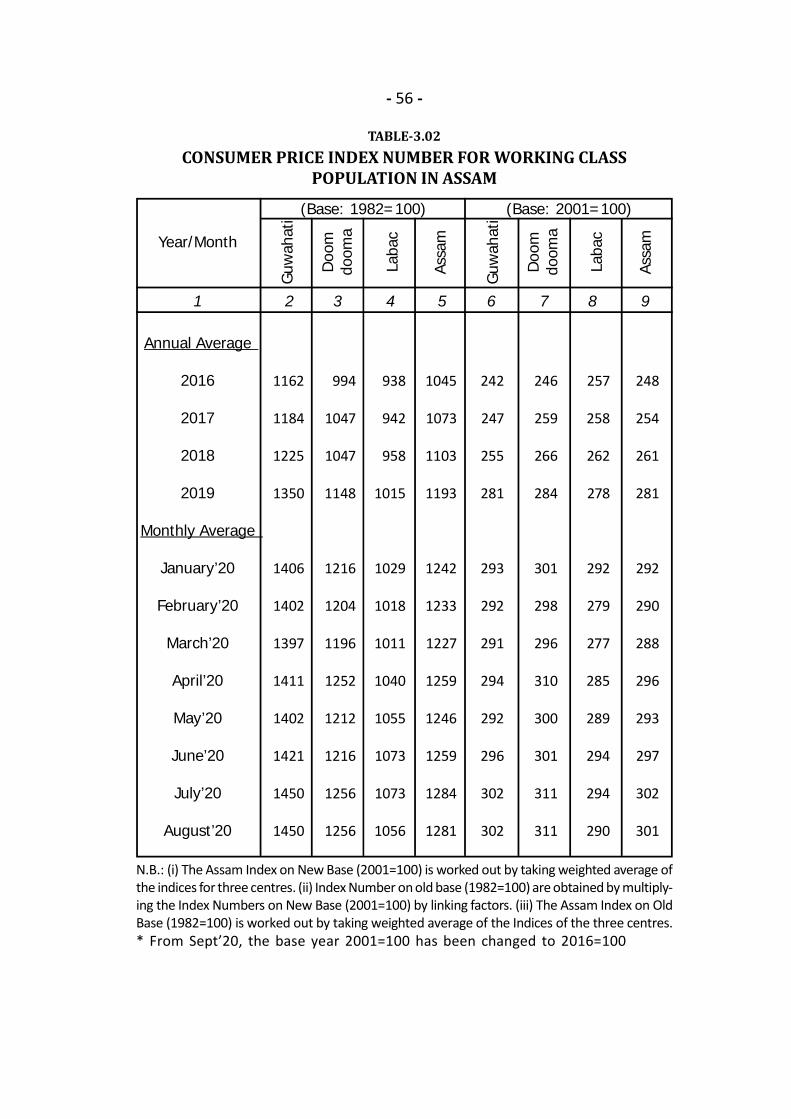
- 56 -
TABLE-3.02CONSUMER PRICE INDEX NUMBER FOR WORKING CLASS
POPULATION IN ASSAM
N.B.: (i) The Assam Index on New Base (2001=100) is worked out by taking weighted average ofthe indices for three centres. (ii) Index Number on old base (1982=100) are obtained by multiply-ing the Index Numbers on New Base (2001=100) by linking factors. (iii) The Assam Index on OldBase (1982=100) is worked out by taking weighted average of the Indices of the three centres.* From Sept’20, the base year 2001=100 has been changed to 2016=100
1 2 3 4 5 6 7 8 9
Annual Average
2016
2017
2018
2019
Monthly Average
January’20
February’20
March’20
April’20
May’20
June’20
July’20
August’20
Year/Month
(Base: 1982=100) (Base: 2001=100)
1162
1184
1225
1350
1406
1402
1397
1411
1402
1421
1450
1450
994
1047
1047
1148
1216
1204
1196
1252
1212
1216
1256
1256
938
942
958
1015
1029
1018
1011
1040
1055
1073
1073
1056
1045
1073
1103
1193
1242
1233
1227
1259
1246
1259
1284
1281
242
247
255
281
293
292
291
294
292
296
302
302
246
259
266
284
301
298
296
310
300
301
311
311
257
258
262
278
292
279
277
285
289
294
294
290
248
254
261
281
292
290
288
296
293
297
302
301
Guw
ahat
i
Doo
mdo
oma
Laba
c
Assa
m
Guw
ahat
i
Doo
mdo
oma
Laba
c
Assa
m

- 57 -
TABLE-3.03WHOLESALE PRICE INDEX OF AGRICULTURAL COMMODITIES IN ASSAM
(Base: 1993-94=100)
1 2 3 4
Period 2017-18 2018-19 2019-20
April
May
June
July
August
September
October
November
December
January
February
March
Monthly Average
380
385
386
387
389
390
391
390
391
392
394
395
389
396
398
400
404
406
407
408
409
410
412
413
414
384
416
417
419
419
422
423
424
425
426
427
429
430
423
Source: (Table 3.02 to 3.03) Directorate of Economics & Statistics, Assam.
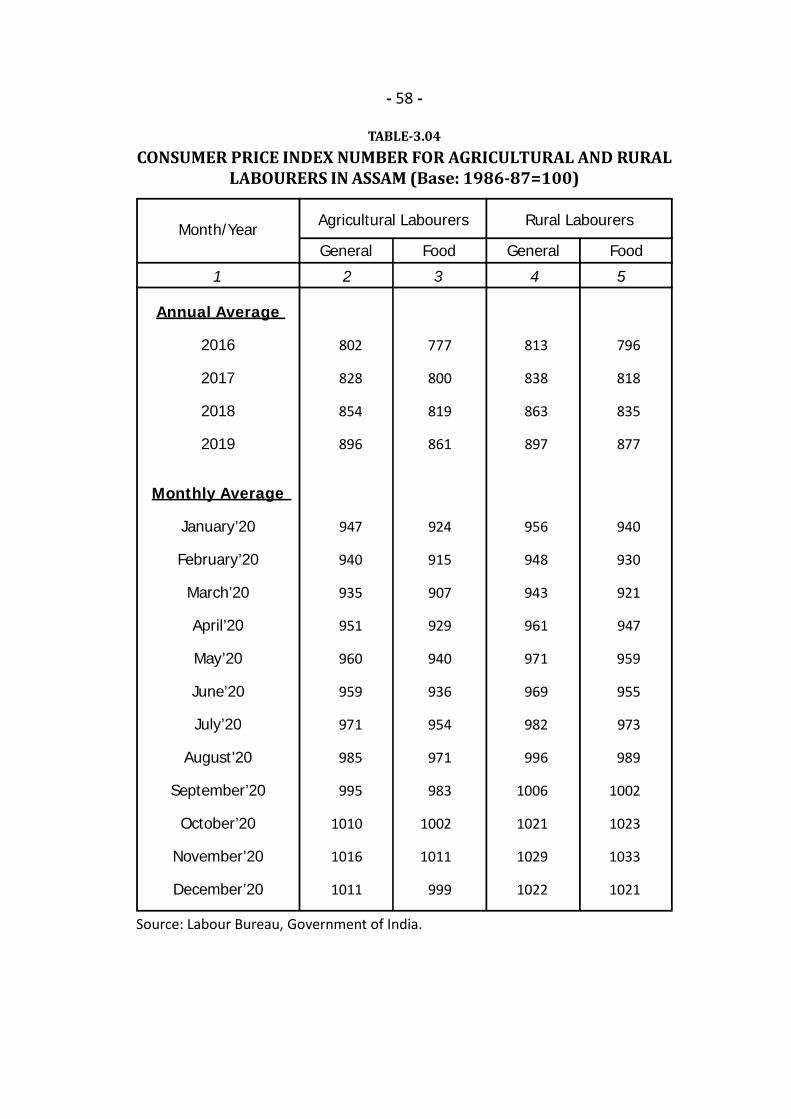
.- 58 -
TABLE-3.04CONSUMER PRICE INDEX NUMBER FOR AGRICULTURAL AND RURAL
LABOURERS IN ASSAM (Base: 1986-87=100)
Source: Labour Bureau, Government of India.
1 2 3 4 5
Month/Year Rural Labourers
Annual Average
2016
2017
2018
2019
Monthly Average
January’20
February’20
March’20
April’20
May’20
June’20
July’20
August’20
September’20
October’20
November’20
December’20
802
828
854
896
947
940
935
951
960
959
971
985
995
1010
1016
1011
777
800
819
861
924
915
907
929
940
936
954
971
983
1002
1011
999
813
838
863
897
956
948
943
961
971
969
982
996
1006
1021
1029
1022
796
818
835
877
940
930
921
947
959
955
973
989
1002
1023
1033
1021
General Food General Food
Agricultural Labourers
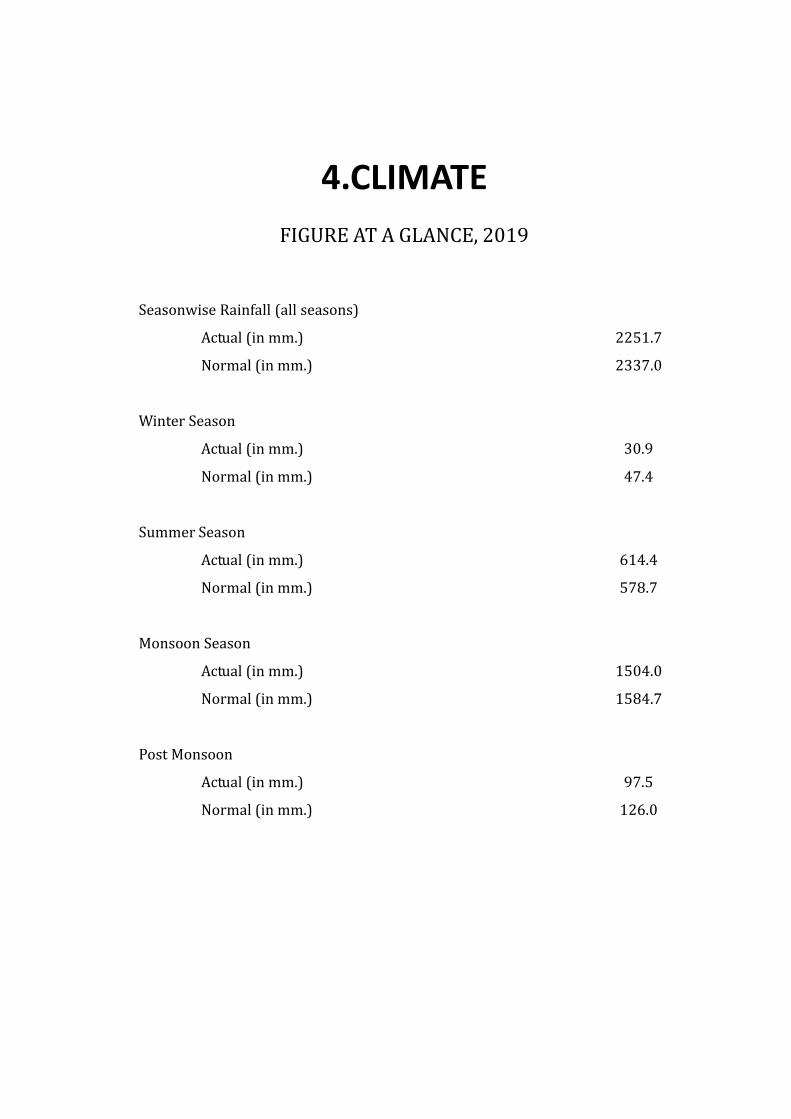
4.CLIMATEFIGURE AT A GLANCE, 2019Seasonwise Rainfall (all seasons)Actual (in mm.)Normal (in mm.)Winter SeasonActual (in mm.)Normal (in mm.)Summer SeasonActual (in mm.)Normal (in mm.)Monsoon SeasonActual (in mm.)Normal (in mm.)Post MonsoonActual (in mm.)Normal (in mm.)
2251.72337.030.947.4
614.4578.71504.01584.7
97.5126.0
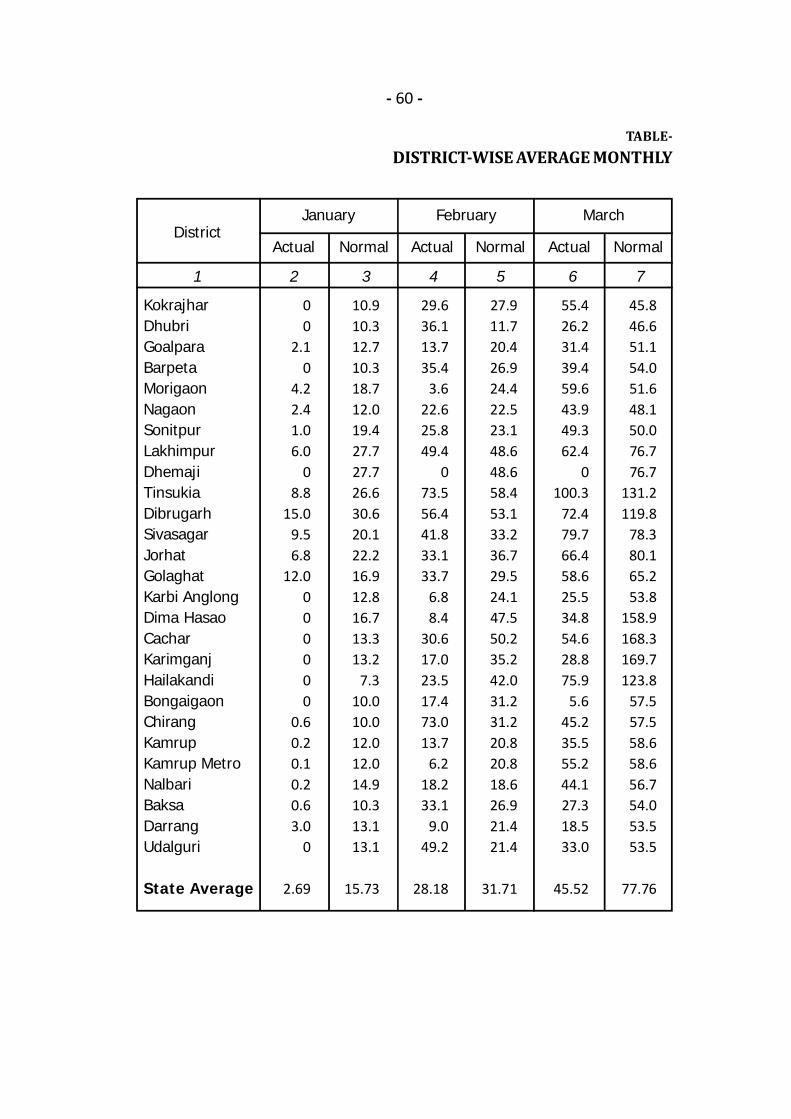
- 60 -
TABLE-DISTRICT-WISE AVERAGE MONTHLY
1 2 3 4 5 6 7
KokrajharDhubriGoalparaBarpetaMorigaonNagaonSonitpurLakhimpurDhemajiTinsukiaDibrugarhSivasagarJorhatGolaghatKarbi AnglongDima HasaoCacharKarimganjHailakandiBongaigaonChirangKamrupKamrup MetroNalbariBaksaDarrangUdalguri
State Average
DistrictActual Normal Actual Normal Actual Normal
00
2.10
4.22.41.06.0
08.8
15.09.56.8
12.0000000
0.60.20.10.20.63.0
0
2.69
10.910.312.710.318.712.019.427.727.726.630.620.122.216.912.816.713.313.2
7.310.010.012.012.014.910.313.113.1
15.73
29.636.113.735.4
3.622.625.849.4
073.556.441.833.133.7
6.88.4
30.617.023.517.473.013.7
6.218.233.1
9.049.2
28.18
27.911.720.426.924.422.523.148.648.658.453.133.236.729.524.147.550.235.242.031.231.220.820.818.626.921.421.4
31.71
55.426.231.439.459.643.949.362.4
0100.3
72.479.766.458.625.534.854.628.875.9
5.645.235.555.244.127.318.533.0
45.52
45.846.651.154.051.648.150.076.776.7
131.2119.8
78.380.165.253.8
158.9168.3169.7123.8
57.557.558.658.656.754.053.553.5
77.76
January February March
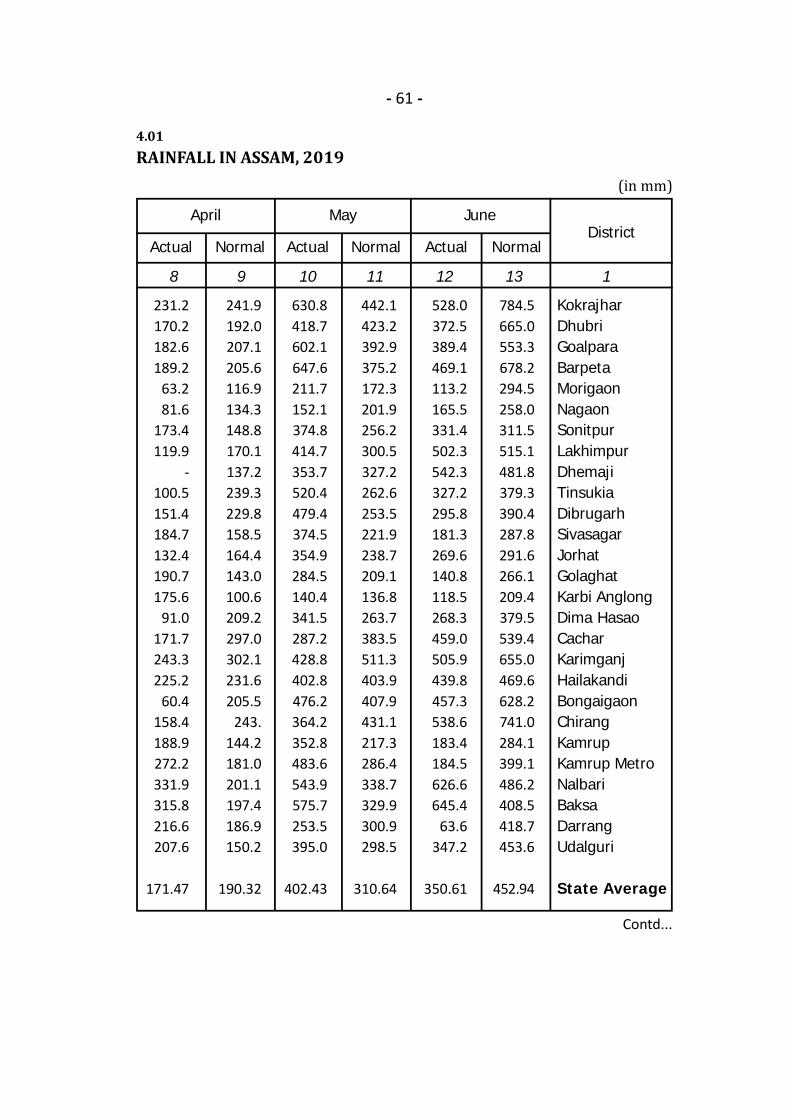
- 61 -
4.01RAINFALL IN ASSAM, 2019 (in mm)
Contd...
8 9 10 11 12 13 1
KokrajharDhubriGoalparaBarpetaMorigaonNagaonSonitpurLakhimpurDhemajiTinsukiaDibrugarhSivasagarJorhatGolaghatKarbi AnglongDima HasaoCacharKarimganjHailakandiBongaigaonChirangKamrupKamrup MetroNalbariBaksaDarrangUdalguri
State Average
Normal Normal Actual NormalDistrict
ActualActual
231.2170.2182.6189.2
63.281.6
173.4119.9
-100.5151.4184.7132.4190.7175.6
91.0171.7243.3225.2
60.4158.4188.9272.2331.9315.8216.6207.6
171.47
241.9192.0207.1205.6116.9134.3148.8170.1137.2239.3229.8158.5164.4143.0100.6209.2297.0302.1231.6205.5
243.144.2181.0201.1197.4186.9150.2
190.32
630.8418.7602.1647.6211.7152.1374.8414.7353.7520.4479.4374.5354.9284.5140.4341.5287.2428.8402.8476.2364.2352.8483.6543.9575.7253.5395.0
402.43
442.1423.2392.9375.2172.3201.9256.2300.5327.2262.6253.5221.9238.7209.1136.8263.7383.5511.3403.9407.9431.1217.3286.4338.7329.9300.9298.5
310.64
528.0372.5389.4469.1113.2165.5331.4502.3542.3327.2295.8181.3269.6140.8118.5268.3459.0505.9439.8457.3538.6183.4184.5626.6645.4
63.6347.2
350.61
784.5665.0553.3678.2294.5258.0311.5515.1481.8379.3390.4287.8291.6266.1209.4379.5539.4655.0469.6628.2741.0284.1399.1486.2408.5418.7453.6
452.94
JuneMayApril
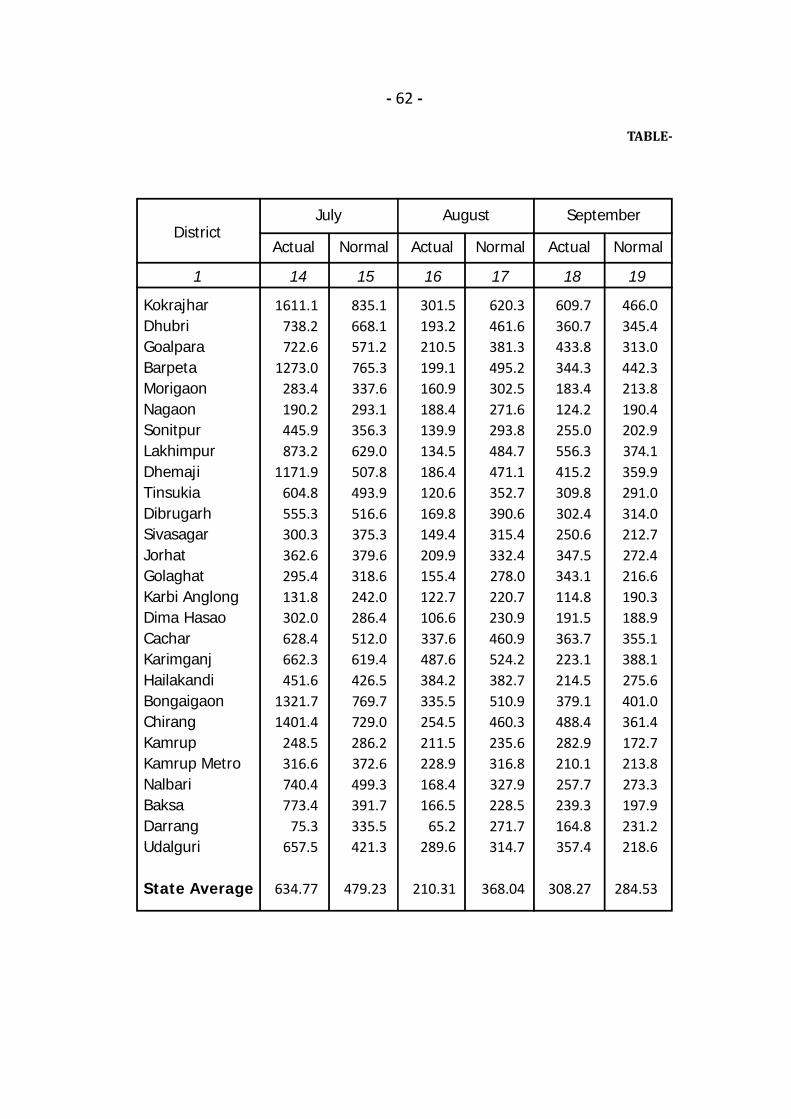
- 62 -
TABLE-
1 14 15 16 17 18 19
KokrajharDhubriGoalparaBarpetaMorigaonNagaonSonitpurLakhimpurDhemajiTinsukiaDibrugarhSivasagarJorhatGolaghatKarbi AnglongDima HasaoCacharKarimganjHailakandiBongaigaonChirangKamrupKamrup MetroNalbariBaksaDarrangUdalguri
State Average
DistrictActual Normal Actual Normal Actual Normal
1611.1738.2722.6
1273.0283.4190.2445.9873.2
1171.9604.8555.3300.3362.6295.4131.8302.0628.4662.3451.6
1321.71401.4
248.5316.6740.4773.4
75.3657.5
634.77
835.1668.1571.2765.3337.6293.1356.3629.0507.8493.9516.6375.3379.6318.6242.0286.4512.0619.4426.5769.7729.0286.2372.6499.3391.7335.5421.3
479.23
301.5193.2210.5199.1160.9188.4139.9134.5186.4120.6169.8149.4209.9155.4122.7106.6337.6487.6384.2335.5254.5211.5228.9168.4166.5
65.2289.6
210.31
620.3461.6381.3495.2302.5271.6293.8484.7471.1352.7390.6315.4332.4278.0220.7230.9460.9524.2382.7510.9460.3235.6316.8327.9228.5271.7314.7
368.04
609.7360.7433.8344.3183.4124.2255.0556.3415.2309.8302.4250.6347.5343.1114.8191.5363.7223.1214.5379.1488.4282.9210.1257.7239.3164.8357.4
308.27
466.0345.4313.0442.3213.8190.4202.9374.1359.9291.0314.0212.7272.4216.6190.3188.9355.1388.1275.6401.0361.4172.7213.8273.3197.9231.2218.6
284.53
July August September
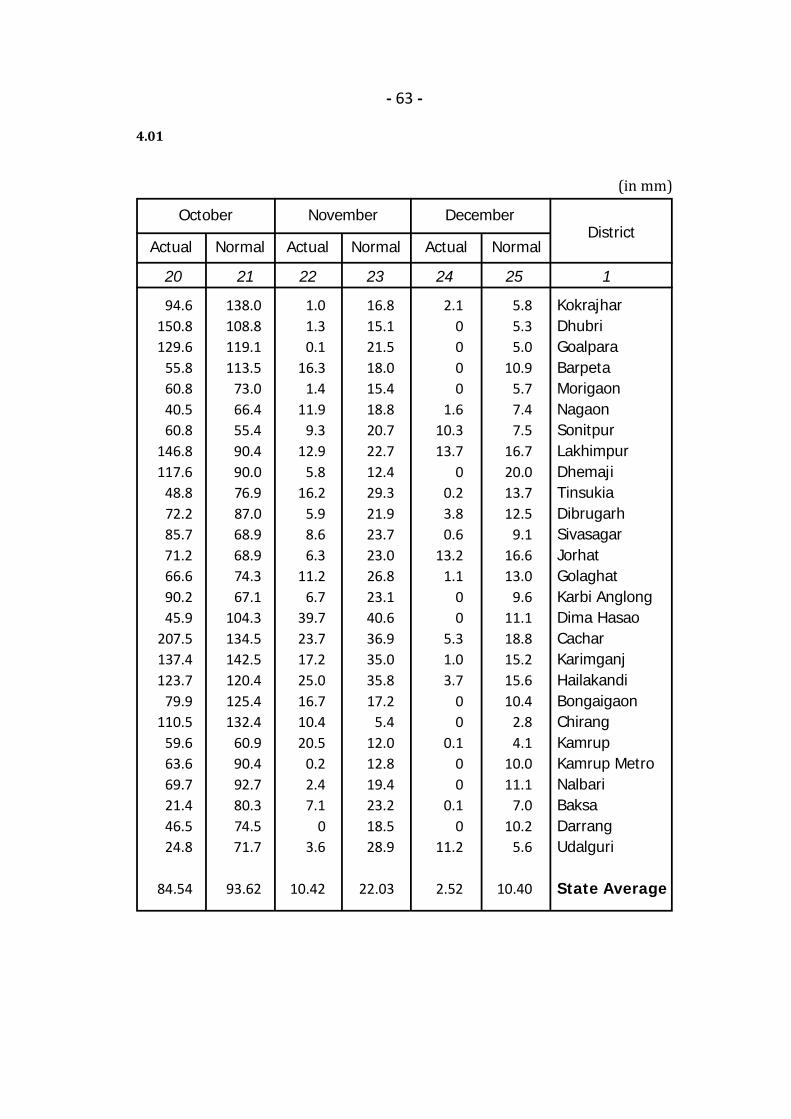
- 63 -
4.01
(in mm) 20 21 22 23 24 25 1
KokrajharDhubriGoalparaBarpetaMorigaonNagaonSonitpurLakhimpurDhemajiTinsukiaDibrugarhSivasagarJorhatGolaghatKarbi AnglongDima HasaoCacharKarimganjHailakandiBongaigaonChirangKamrupKamrup MetroNalbariBaksaDarrangUdalguri
State Average
Normal Normal Actual NormalDistrict
ActualActual
94.6150.8129.6
55.860.840.560.8
146.8117.6
48.872.285.771.266.690.245.9
207.5137.4123.7
79.9110.5
59.663.669.721.446.524.8
84.54
138.0108.8119.1113.5
73.066.455.490.490.076.987.068.968.974.367.1
104.3134.5142.5120.4125.4132.4
60.990.492.780.374.571.7
93.62
1.01.30.1
16.31.4
11.99.3
12.95.8
16.25.98.66.3
11.26.7
39.723.717.225.016.710.420.5
0.22.47.1
03.6
10.42
16.815.121.518.015.418.820.722.712.429.321.923.723.026.823.140.636.935.035.817.2
5.412.012.819.423.218.528.9
22.03
2.10000
1.610.313.7
00.23.80.6
13.21.1
00
5.31.03.7
00
0.100
0.10
11.2
2.52
5.85.35.0
10.95.77.47.5
16.720.013.712.5
9.116.613.0
9.611.118.815.215.610.4
2.84.1
10.011.1
7.010.2
5.6
10.40
DecemberNovemberOctober

- 64 -
TABLE-MONTH-WISE & AGRO CLIMATIC ZONE WISE
1 2 3 4 5 6 7
LowerBrahmaputra
North BankPlain Zone
CentralBrahmaputra
UpperBrahmaputra
Barak ValleyZone
Hills Zone
StateTotal
Agro-Climatic Zone
Janu
ary
ActualNormal
ActualNormal
ActualNormal
ActualNormal
ActualNormal
ActualNormal
ActualNormal
3.8113.4
10.0101.0
6.630.7
52.1116.4
033.8
029.5
72.5424.8
276.4236.4
133.4163.1
26.246.9
238.5210.9
71.1127.4
15.271.6
760.8856.3
365.3540.4
163.2310.4
103.599.7
377.4474.6
159.3461.8
60.3212.7
1229.02099.6
2100.82018.8
717.5793.2
144.8251.2
759.7935.0
640.2830.7
266.6309.8
4629.65138.7
5095.63644.7
1791.71483.3
363.8374.2
2013.71185.8
1118.81298.7
481.9400.5
10865.58387.2
4394.85628.1
1786.82180.7
278.7552.5
1214.71615.2
1404.71664.0
386.8588.9
9466.512229.4
Febr
uary
March
April
May
June
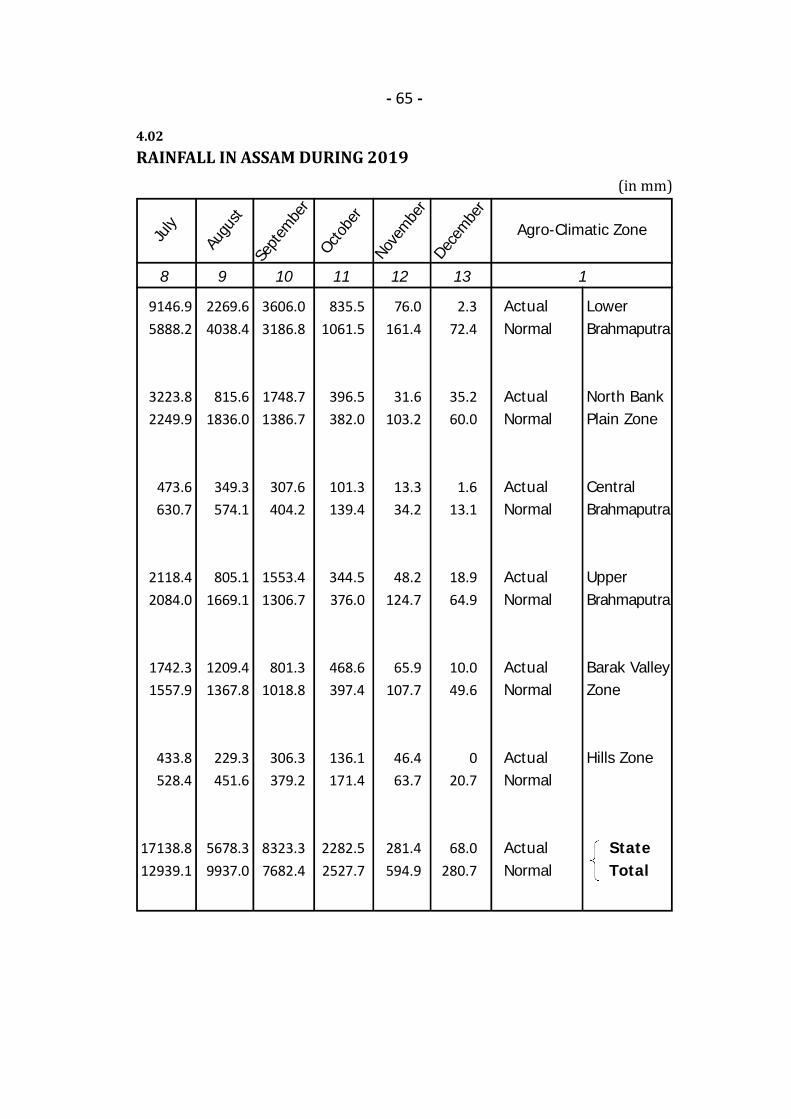
- 65 -
4.02RAINFALL IN ASSAM DURING 2019 (in mm) 8 9 10 11 12 13 1
LowerBrahmaputra
North BankPlain Zone
CentralBrahmaputra
UpperBrahmaputra
Barak ValleyZone
Hills Zone
State Total
Agro-Climatic Zone
9146.95888.2
3223.82249.9
473.6630.7
2118.42084.0
1742.31557.9
433.8528.4
17138.812939.1
2269.64038.4
815.61836.0
349.3574.1
805.11669.1
1209.41367.8
229.3451.6
5678.39937.0
3606.03186.8
1748.71386.7
307.6404.2
1553.41306.7
801.31018.8
306.3379.2
8323.37682.4
835.51061.5
396.5382.0
101.3139.4
344.5376.0
468.6397.4
136.1171.4
2282.52527.7
76.0161.4
31.6103.2
13.334.2
48.2124.7
65.9107.7
46.463.7
281.4594.9
2.372.4
35.260.0
1.613.1
18.964.9
10.049.6
020.7
68.0280.7
ActualNormal
ActualNormal
ActualNormal
ActualNormal
ActualNormal
ActualNormal
ActualNormal
July
Augu
stSe
ptem
ber
Octo
ber
Nove
mbe
rDe
cem
ber
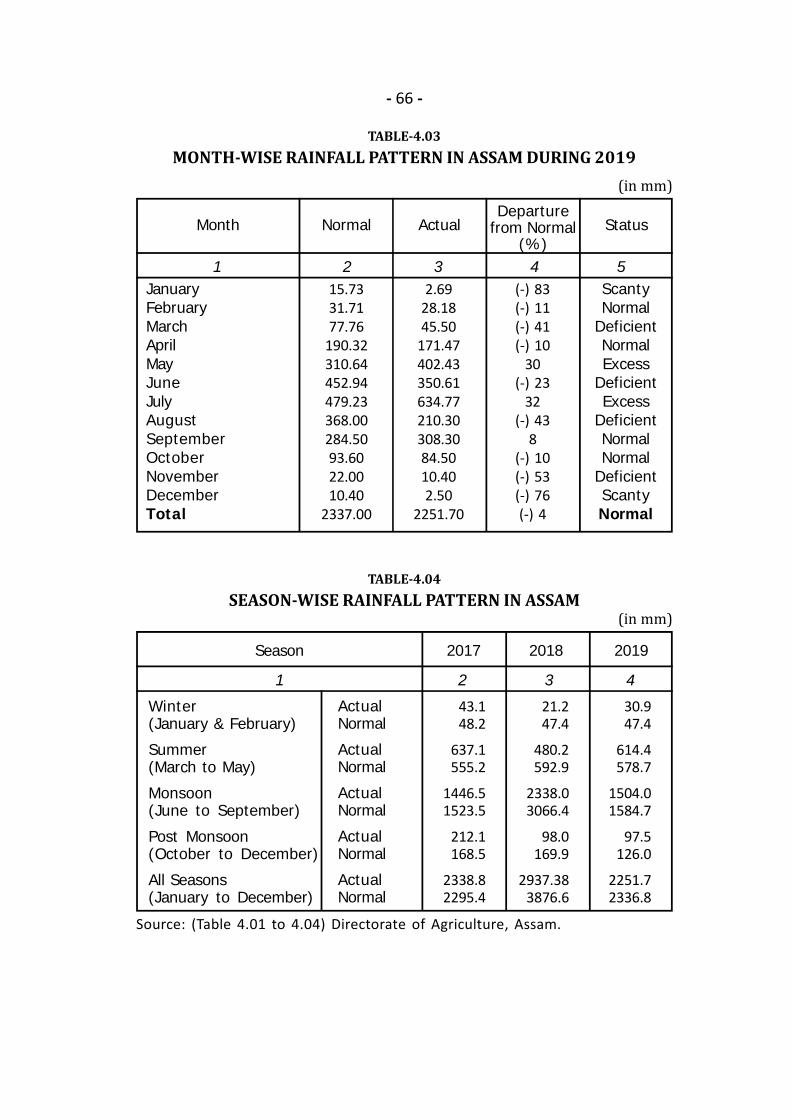
- 66 -
TABLE-4.03MONTH-WISE RAINFALL PATTERN IN ASSAM DURING 2019
1 2 3 4 5
Month Normal ActualDeparture
from Normal(%)
Status
JanuaryFebruaryMarchAprilMayJuneJulyAugustSeptemberOctoberNovemberDecemberTotal
15.7331.7177.76
190.32310.64452.94479.23368.00284.5093.6022.0010.40
2337.00
2.6928.1845.50
171.47402.43350.61634.77210.30308.3084.5010.402.50
2251.70
(-) 83(-) 11(-) 41(-) 10
30(-) 23
32(-) 43
8(-) 10(-) 53(-) 76(-) 4
ScantyNormal
DeficientNormalExcess
DeficientExcess
DeficientNormalNormal
DeficientScantyNormal
(in mm)
TABLE-4.04SEASON-WISE RAINFALL PATTERN IN ASSAM
1 2 3 4
Season 20192017 2018
Winter(January & February)
Summer(March to May)
Monsoon(June to September)
Post Monsoon(October to December)
All Seasons(January to December)
ActualNormal
ActualNormal
ActualNormal
ActualNormal
ActualNormal
30.947.4
614.4578.7
1504.01584.7
97.5126.0
2251.72336.8
43.148.2
637.1555.2
1446.51523.5
212.1168.5
2338.82295.4
21.247.4
480.2592.9
2338.03066.4
98.0169.9
2937.383876.6
(in mm)
Source: (Table 4.01 to 4.04) Directorate of Agriculture, Assam.

5.AGRICULTUREFIGURE AT A GLANCETotal Cropped Area, 2018-19Net Area Shown, 2018-19Area under non-agricultural uses, 2018-19Fallow land, 2018-19Index number of all commodities, 2019-20(Base triennium ending 2007-08=100)(i) Area(ii) Production(iii) ProductivityArea under Rice, 2019-20 (P)Production of RiceArea under Pulses, 2019-20 (P)Production of Pulses, 2019-20 (P)Area under Total Foodgrains, 2019-20 (P)Production of Total Foodgrains, 2019-20 (P)Area under Total oilseeds, 2019-20 (P)Production of oil seeds (excluding coconut),2019-20 (P)Area under Total Fibres, 2019-20 (P)Production of Fibres, 2019-20 (P)Consumption of Fertilizer (NPK), 2019-20Per Hect. consumption of Fertilizer, 2019-20
400446227234662514657199407107.26147.51137.522400521414310625985467332192
69812273.2368.23
(hect.)(hect.)(hect.)(hect.)
(`000 hect)(`000 tonne)(`000 hect)(`000 tonne)(`000 hect)(`000 tonne)(`000 hect)(`000 tonne)(`000 hect)(`000 tonne)(`000 tonne)(Kg./hect)
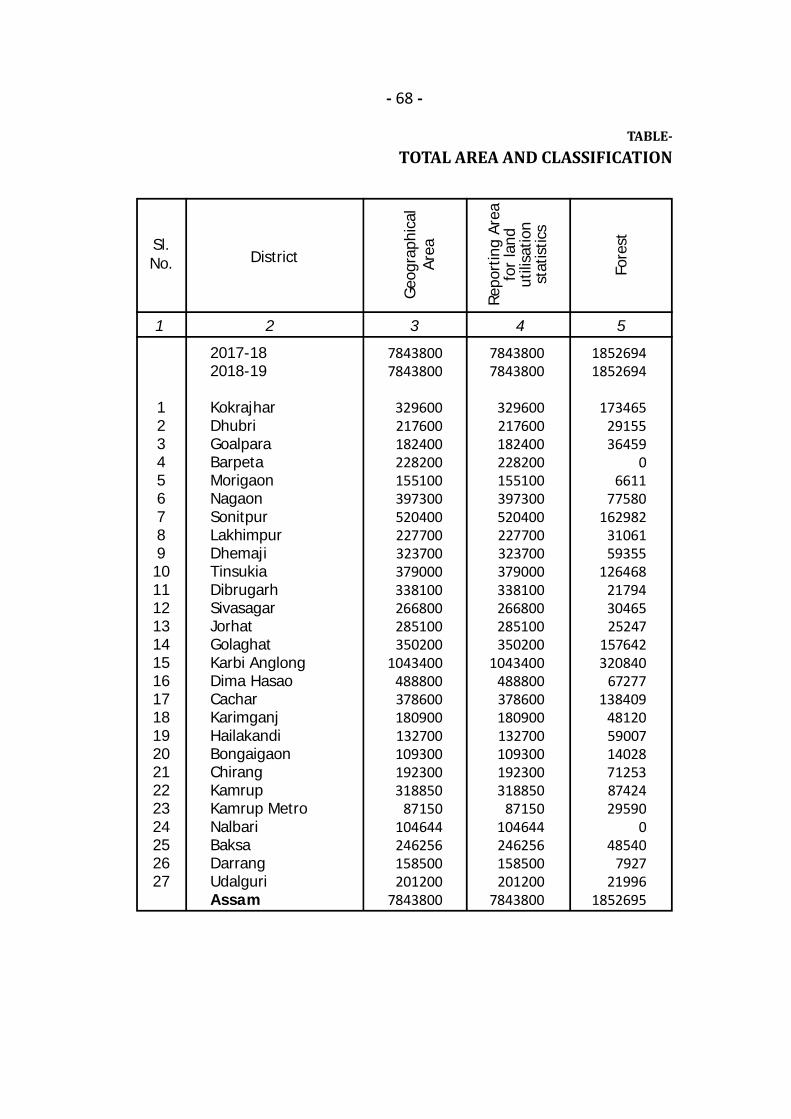
- 68 -
TABLE-TOTAL AREA AND CLASSIFICATION
1 2 3 4 5
Sl.No. District
Geo
grap
hica
lAr
ea
Repo
rtin
g Ar
eafo
r la
ndut
ilisa
tion
stat
istic
s
Fore
st
2017-182018-19
KokrajharDhubriGoalparaBarpetaMorigaonNagaonSonitpurLakhimpurDhemajiTinsukiaDibrugarhSivasagarJorhatGolaghatKarbi AnglongDima HasaoCacharKarimganjHailakandiBongaigaonChirangKamrupKamrup MetroNalbariBaksaDarrangUdalguriAssam
123456789101112131415161718192021222324252627
78438007843800
329600217600182400228200155100397300520400227700323700379000338100266800285100350200
1043400488800378600180900132700109300192300318850
87150104644246256158500201200
7843800
78438007843800
329600217600182400228200155100397300520400227700323700379000338100266800285100350200
1043400488800378600180900132700109300192300318850
87150104644246256158500201200
7843800
18526941852694
1734652915536459
06611
77580162982
3106159355
126468217943046525247
157642320840
67277138409
481205900714028712538742429590
048540
792721996
1852695
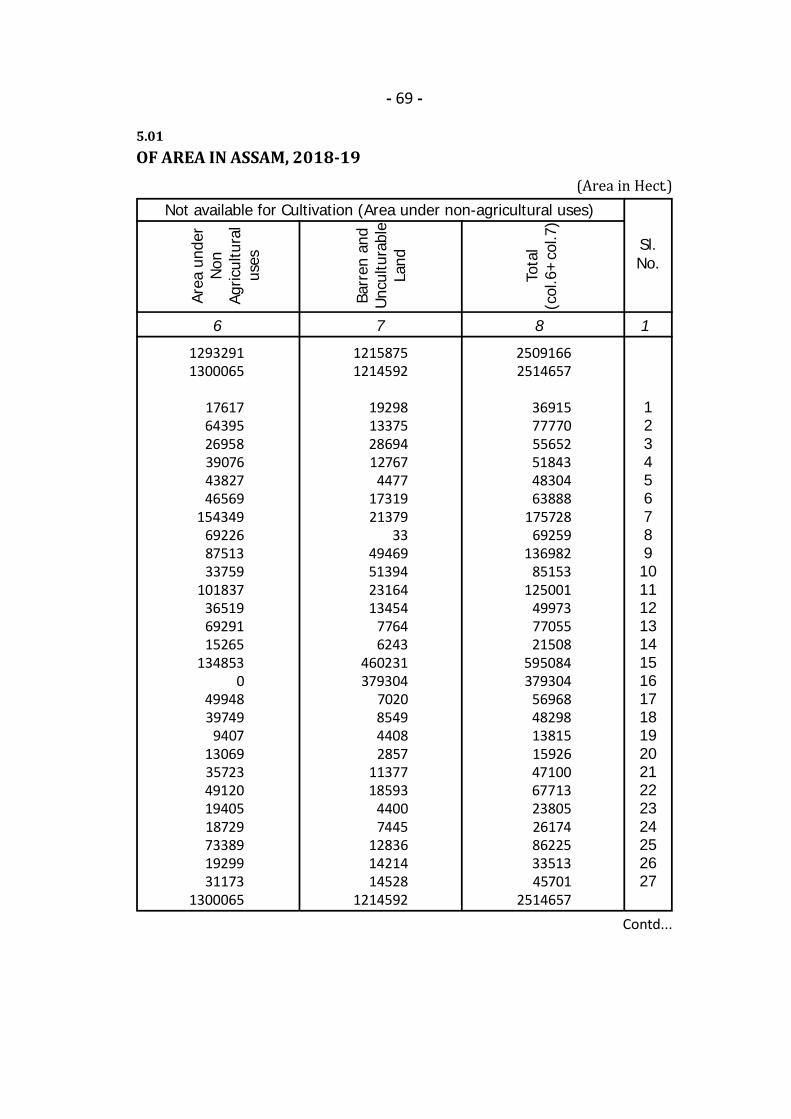
- 69 -
5.01OF AREA IN ASSAM, 2018-19 (Area in Hect.)
Contd...
6 7 8 1
Sl.No.
Not available for Cultivation (Area under non-agricultural uses)Ar
ea u
nder
Non
Agric
ultu
ral
uses
12932911300065
176176439526958390764382746569
154349692268751333759
101837365196929115265
1348530
4994839749
94071306935723491201940518729733891929931173
1300065
12158751214592
19298133752869412767
44771731921379
3349469513942316413454
77646243
460231379304
7020854944082857
1137718593
44007445
128361421414528
1214592
25091662514657
369157777055652518434830463888
17572869259
13698285153
125001499737705521508
595084379304
5696848298138151592647100677132380526174862253351345701
2514657
123456789101112131415161718192021222324252627
Barr
en a
ndU
ncul
tura
ble
Land
Tota
l(c
ol.6
+co
l.7)

- 70 -
TABLE-
1 2 9 10 11 12
2017-182018-19
KokrajharDhubriGoalparaBarpetaMorigaonNagaonSonitpurLakhimpurDhemajiTinsukiaDibrugarhSivasagarJorhatGolaghatKarbi AnglongDima HasaoCacharKarimganjHailakandiBongaigaonChirangKamrupKamrup MetroNalbariBaksaDarrangUdalguriAssam
Sl.No. District
Other cultivable Land excluding Fallow Land
Perm
anen
tPa
stur
es a
ndot
her
Gra
zing
Land
123456789101112131415161718192021222324252627
179822171739
1247921962786
101584278
1365410003
322315811
56375069
1351445666868
##
87803658157860622309
13591606
381310091
57045305
171739
220816221944
2782300269929171
1104111882
65066270
1810714118130201527613711
3940##
222407366382133443922
179503306
748967152488510
221944
160056159892
27663418746365006335
1332414458720
170613677
11064602865847814
##
189121739431925933552
16130452
1411145135073627
159892
560694553575
180278616
172412582921654388601795418213509792343229153348182486118622
##
4993212763
971811999
978347671
43645972
212131445917442
553575
Land
und
erM
isc.
Tre
esgr
oves
not
incl
uded
in N
etAr
ea S
own
Cultu
rabl
eW
aste
Lan
d
Tota
l
# Separate classification of area for Hill Districts are not available. All included
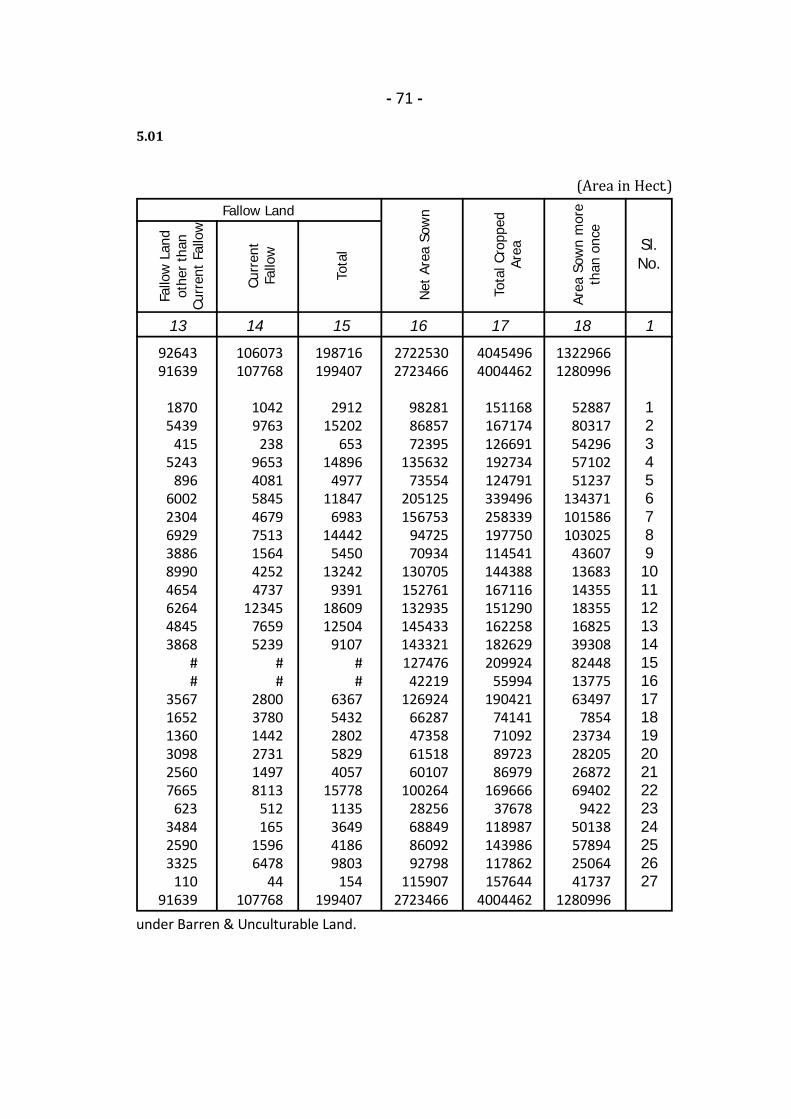
- 71 -
5.01
(Area in Hect.)
under Barren & Unculturable Land.
13 14 15 16 17 18 1
Net
Are
a So
wn
Sl.No.
Fallow Land
9264391639
18705439
4155243
896600223046929388689904654626448453868
##
356716521360309825607665
623348425903325
11091639
106073107768
10429763
23896534081584546797513156442524737
1234576595239
##
280037801442273114978113
512165
15966478
44107768
198716199407
291215202
65314896
497711847
698314442
545013242
93911860912504
9107##
63675432280258294057
157781135364941869803
154199407
27225302723466
982818685772395
13563273554
205125156753
9472570934
13070515276113293514543314332112747642219
12692466287473586151860107
10026428256688498609292798
1159072723466
40454964004462
151168167174126691192734124791339496258339197750114541144388167116151290162258182629209924
55994190421
74141710928972386979
16966637678
118987143986117862157644
4004462
13229661280996
5288780317542965710251237
134371101586103025
436071368314355183551682539308824481377563497
785423734282052687269402
942250138578942506441737
1280996
123456789101112131415161718192021222324252627
Fallo
w L
and
othe
r th
anCu
rren
t Fa
llow
Curr
ent
Fallo
w
Tota
l
Tota
l Cro
pped
Area
Area
Sow
n m
ore
than
onc
e

- 72 -
TABLE-5.02INDEX NUMBER OF AREA, PRODUCTION AND PRODUCTIVITY
FOR FOOD GRAINS, NON-FOOD GRAINS AND ALL COMMODITIESIN ASSAM & INDIA (Base triennium ending 2007-08=100)
1 2 3 4 5 6 7 8
Assam India
Year Type ofIndex
AreaProductionProductivity
AreaProductionProductivity
AreaProductionProductivity
AreaProductionProductivity
AreaProductionProductivity
AreaProductionProductivity
AreaProductionProductivity
107.06155.81145.54
106.55157.43147.76
105.99154.54145.80
105.23154.36146.69
104.04159.37153.18
103.61163.88158.17
102.47157.67153.86
115.65123.81107.09
118.38130.24110.02
118.28127.98108.20
119.19131.82110.59
117.63134.17114.06
116.72134.64115.35
115.94134.85116.32
108.90141.56130.03
109.10145.32133.21
108.51142.72131.52
108.16144.33133.44
107.21148.15137.54
108.01150.86139.68
107.26147.51137.52
105.6123.3116.8
103.9116.4112.1
103.7115.2115.5
107.6129.7120.5
106.3136.6128.6
105.0135.3128.9
108.6139.6128.5
119.4136.1114.0
120.4131.5109.2
116.1122.0105.1
106.3122.4115.2
108.8133.7122.9
116.9137.7117.8
119.4144.1120.1
112.4129.6115.4
112.0123.9110.6
109.8116.0108.2
107.0126.1117.9
107.5135.2125.7
110.9136.5123.1
113.9141.8124.2
Food
Gra
ins
Non
-Foo
dG
rain
s
All
Com
mod
ities
Food
Gra
ins
Non
-Foo
dG
rain
s
All
Com
mod
ities
2019
-20
2013
-14
2014
-15
2015
-16
2016
-17
2017
-18
2018
-19
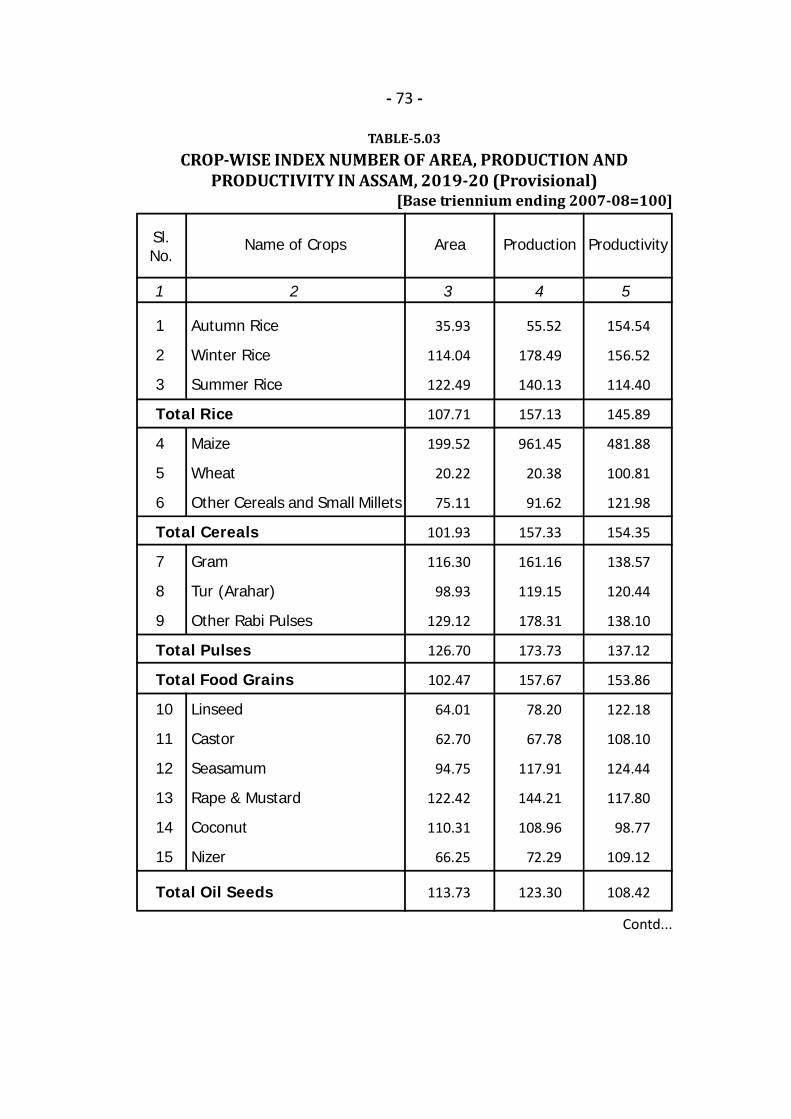
- 73 -
TABLE-5.03CROP-WISE INDEX NUMBER OF AREA, PRODUCTION AND
PRODUCTIVITY IN ASSAM, 2019-20 (Provisional)[Base triennium ending 2007-08=100]
1 2 3 4 5
Sl.No.
Area Production ProductivityName of Crops
Autumn Rice
Winter Rice
Summer Rice
Maize
Wheat
Other Cereals and Small Millets
Gram
Tur (Arahar)
Other Rabi Pulses
Linseed
Castor
Seasamum
Rape & Mustard
Coconut
Nizer
35.93
114.04
122.49
107.71
199.52
20.22
75.11
101.93
116.30
98.93
129.12
126.70
102.47
64.01
62.70
94.75
122.42
110.31
66.25
113.73
55.52
178.49
140.13
157.13
961.45
20.38
91.62
157.33
161.16
119.15
178.31
173.73
157.67
78.20
67.78
117.91
144.21
108.96
72.29
123.30
154.54
156.52
114.40
145.89
481.88
100.81
121.98
154.35
138.57
120.44
138.10
137.12
153.86
122.18
108.10
124.44
117.80
98.77
109.12
108.42
1
2
3
Total Rice
4
5
6
Total Cereals
7
8
9
Total Pulses
Total Food Grains
10
11
12
13
14
15
Total Oil Seeds
Contd...
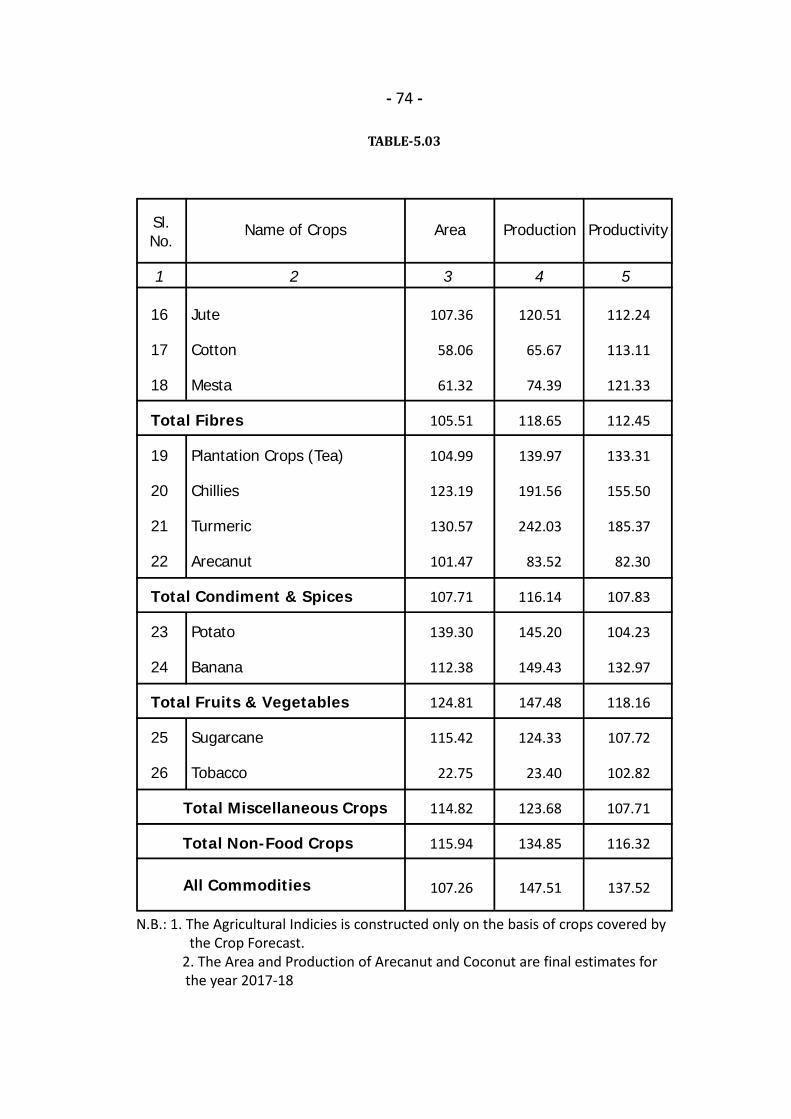
- 74 -
TABLE-5.03
N.B.: 1. The Agricultural Indicies is constructed only on the basis of crops covered by the Crop Forecast. 2. The Area and Production of Arecanut and Coconut are final estimates for the year 2017-18
1 2 3 4 5
Sl.No.
Area Production ProductivityName of Crops
Jute
Cotton
Mesta
Plantation Crops (Tea)
Chillies
Turmeric
Arecanut
Potato
Banana
Sugarcane
Tobacco
107.36
58.06
61.32
105.51
104.99
123.19
130.57
101.47
107.71
139.30
112.38
124.81
115.42
22.75
114.82
115.94
107.26
120.51
65.67
74.39
118.65
139.97
191.56
242.03
83.52
116.14
145.20
149.43
147.48
124.33
23.40
123.68
134.85
147.51
112.24
113.11
121.33
112.45
133.31
155.50
185.37
82.30
107.83
104.23
132.97
118.16
107.72
102.82
107.71
116.32
137.52
16
17
18
Total Fibres
19
20
21
22
Total Condiment & Spices
23
24
Total Fruits & Vegetables
25
26
Total Miscellaneous Crops
Total Non-Food Crops
All Commodities

- 75 -
TABLE-5.04AREA UNDER FOOD AND NON-FOOD CROPS COVERED BY CROP
FORECAST IN ASSAM (Area in Hect.) 1 2 3 4
Name of Crops 2017-18 2018-19 2019-20(P)
Autumn Rice
Winter Rice
Summer Rice
Total Rice
Maize
Wheat
Other Cereals and Small Milletes
Total Cereals
Gram
Tur (Arahar)
Rabi Pulses
Total Pulses
Total Food Grains
Sesamum
Rape and Mustard
Linseed
Castor
Nizer
Coconut
Total Oil Seeds
154511
1878798
400402
2433711
31537
17786
5233
2488267
2273
5609
146824
154706
2642973
12214
290285
5004
758
5968
19917
334146
144766
1879539
400873
2425178
32264
16945
5210
2479597
2244
5550
142435
150229
2629826
11983
285736
4763
724
5674
20612
329492
127223
187208
395518
2400949
36636
11336
5212
2454133
2176
5830
135956
143962
2598095
12027
287447
4885
748
5715
20752
331574
Contd...
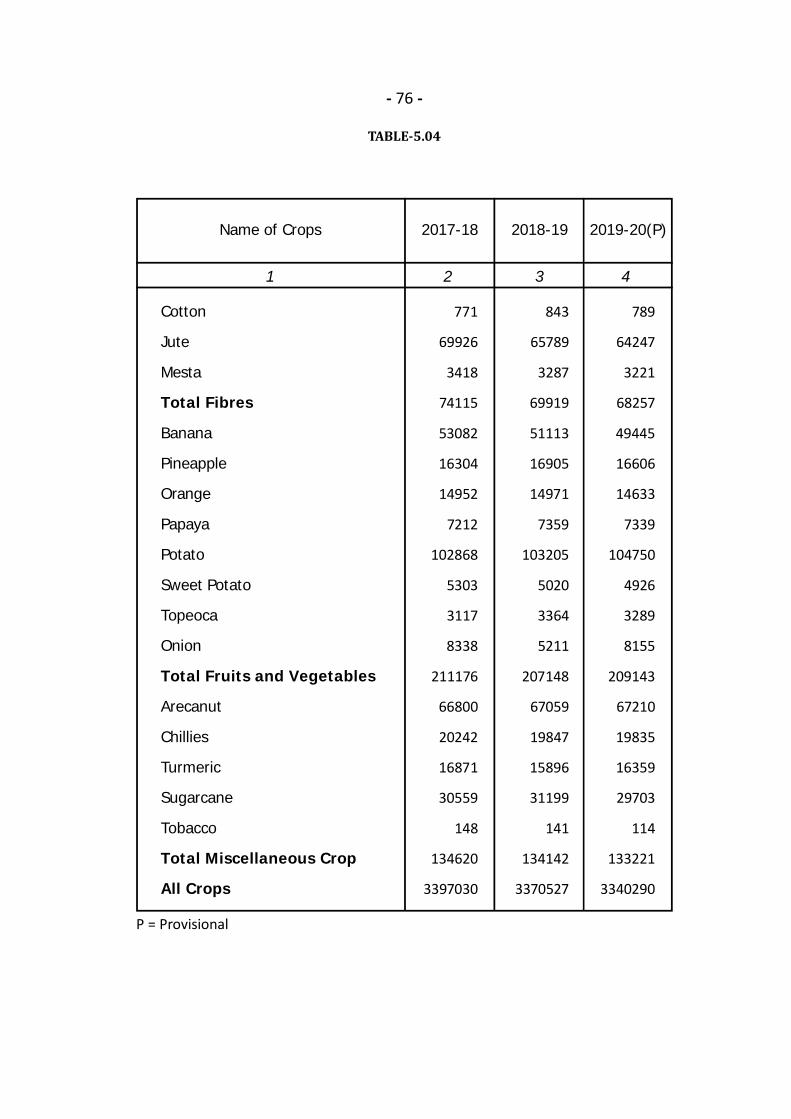
- 76 -
TABLE-5.04
P = Provisional
1 2 3 4
Name of Crops 2017-18 2018-19 2019-20(P)
Cotton
Jute
Mesta
Total Fibres
Banana
Pineapple
Orange
Papaya
Potato
Sweet Potato
Topeoca
Onion
Total Fruits and Vegetables
Arecanut
Chillies
Turmeric
Sugarcane
Tobacco
Total Miscellaneous Crop
All Crops
771
69926
3418
74115
53082
16304
14952
7212
102868
5303
3117
8338
211176
66800
20242
16871
30559
148
134620
3397030
843
65789
3287
69919
51113
16905
14971
7359
103205
5020
3364
5211
207148
67059
19847
15896
31199
141
134142
3370527
789
64247
3221
68257
49445
16606
14633
7339
104750
4926
3289
8155
209143
67210
19835
16359
29703
114
133221
3340290
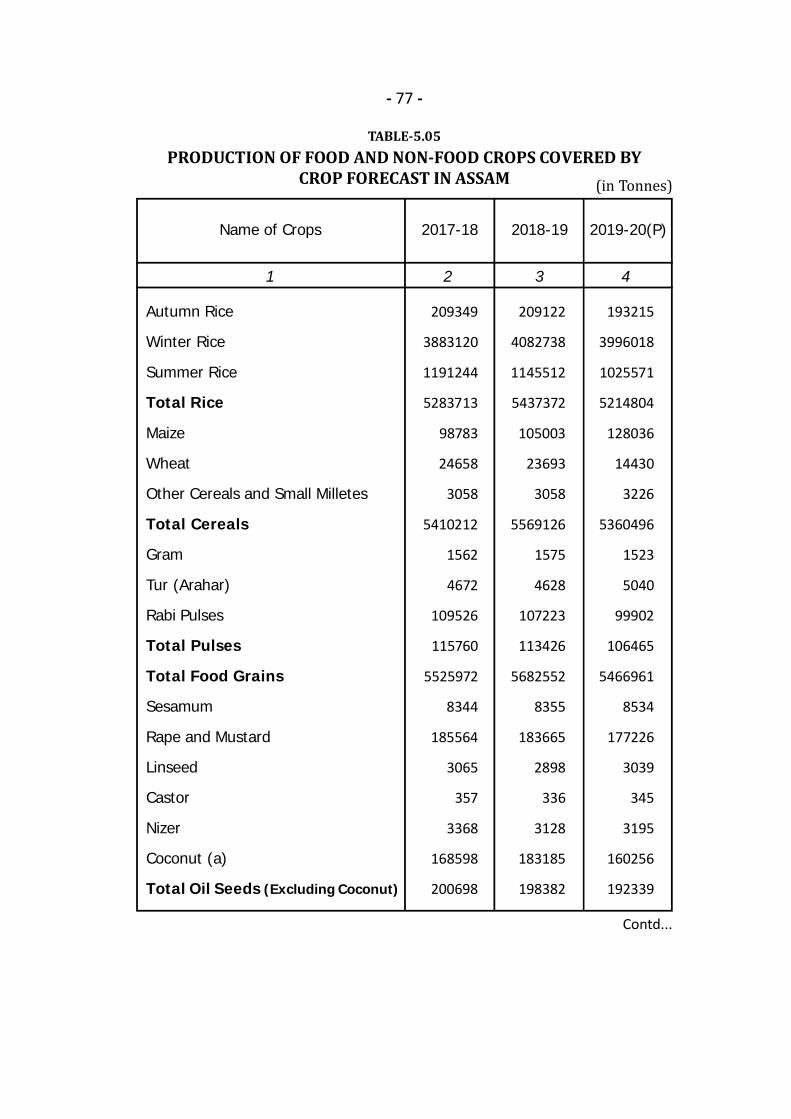
- 77 -
TABLE-5.05PRODUCTION OF FOOD AND NON-FOOD CROPS COVERED BY
CROP FORECAST IN ASSAM (in Tonnes)
Contd...
1 2 3 4
Name of Crops 2017-18 2018-19 2019-20(P)
Autumn Rice
Winter Rice
Summer Rice
Total Rice
Maize
Wheat
Other Cereals and Small Milletes
Total Cereals
Gram
Tur (Arahar)
Rabi Pulses
Total Pulses
Total Food Grains
Sesamum
Rape and Mustard
Linseed
Castor
Nizer
Coconut (a)
Total Oil Seeds (Excluding Coconut)
209349
3883120
1191244
5283713
98783
24658
3058
5410212
1562
4672
109526
115760
5525972
8344
185564
3065
357
3368
168598
200698
209122
4082738
1145512
5437372
105003
23693
3058
5569126
1575
4628
107223
113426
5682552
8355
183665
2898
336
3128
183185
198382
193215
3996018
1025571
5214804
128036
14430
3226
5360496
1523
5040
99902
106465
5466961
8534
177226
3039
345
3195
160256
192339
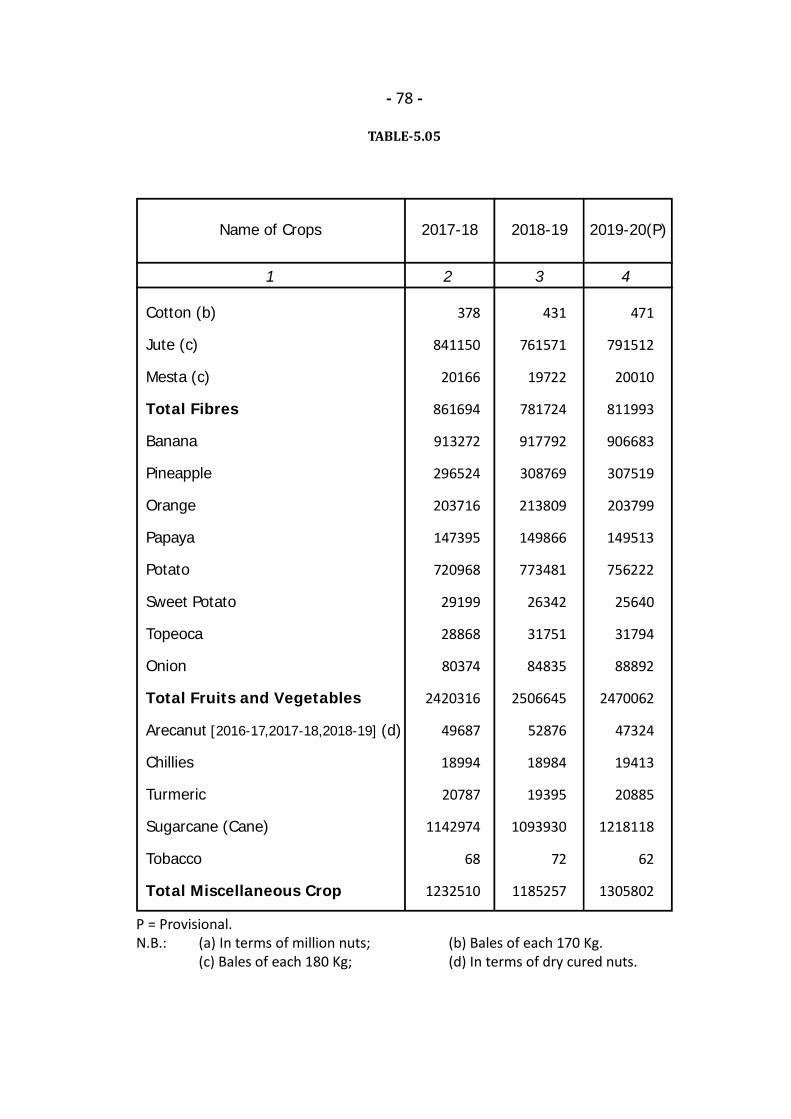
- 78 -
TABLE-5.05
P = Provisional.N.B.: (a) In terms of million nuts; (b) Bales of each 170 Kg.
(c) Bales of each 180 Kg; (d) In terms of dry cured nuts.
1 2 3 4
Name of Crops 2017-18 2018-19 2019-20(P)
Cotton (b)
Jute (c)
Mesta (c)
Total Fibres
Banana
Pineapple
Orange
Papaya
Potato
Sweet Potato
Topeoca
Onion
Total Fruits and Vegetables
Arecanut [2016-17,2017-18,2018-19] (d)
Chillies
Turmeric
Sugarcane (Cane)
Tobacco
Total Miscellaneous Crop
378
841150
20166
861694
913272
296524
203716
147395
720968
29199
28868
80374
2420316
49687
18994
20787
1142974
68
1232510
431
761571
19722
781724
917792
308769
213809
149866
773481
26342
31751
84835
2506645
52876
18984
19395
1093930
72
1185257
471
791512
20010
811993
906683
307519
203799
149513
756222
25640
31794
88892
2470062
47324
19413
20885
1218118
62
1305802
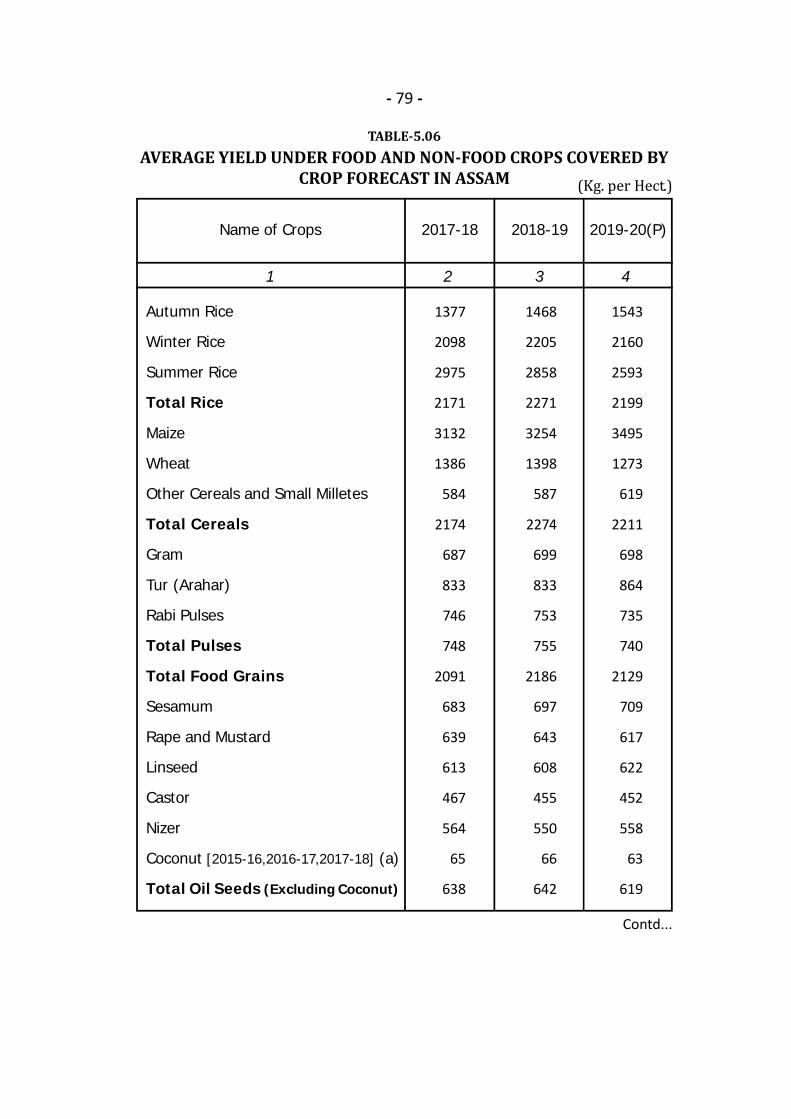
- 79 -
TABLE-5.06AVERAGE YIELD UNDER FOOD AND NON-FOOD CROPS COVERED BY
CROP FORECAST IN ASSAM (Kg. per Hect.)
Contd...
1 2 3 4
Name of Crops 2017-18 2018-19 2019-20(P)
Autumn Rice
Winter Rice
Summer Rice
Total Rice
Maize
Wheat
Other Cereals and Small Milletes
Total Cereals
Gram
Tur (Arahar)
Rabi Pulses
Total Pulses
Total Food Grains
Sesamum
Rape and Mustard
Linseed
Castor
Nizer
Coconut [2015-16,2016-17,2017-18] (a)
Total Oil Seeds (Excluding Coconut)
1377
2098
2975
2171
3132
1386
584
2174
687
833
746
748
2091
683
639
613
467
564
65
638
1468
2205
2858
2271
3254
1398
587
2274
699
833
753
755
2186
697
643
608
455
550
66
642
1543
2160
2593
2199
3495
1273
619
2211
698
864
735
740
2129
709
617
622
452
558
63
619
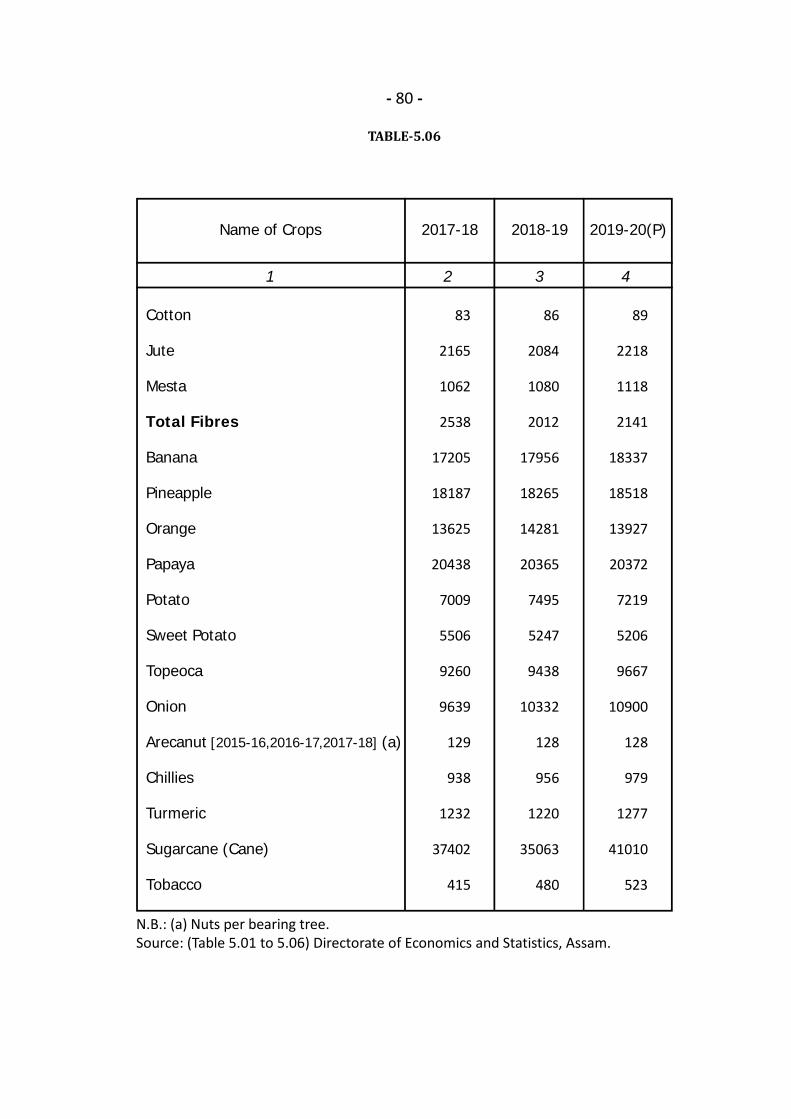
- 80 -
TABLE-5.06
N.B.: (a) Nuts per bearing tree.Source: (Table 5.01 to 5.06) Directorate of Economics and Statistics, Assam.
1 2 3 4
Name of Crops 2017-18 2018-19 2019-20(P)
Cotton
Jute
Mesta
Total Fibres
Banana
Pineapple
Orange
Papaya
Potato
Sweet Potato
Topeoca
Onion
Arecanut [2015-16,2016-17,2017-18] (a)
Chillies
Turmeric
Sugarcane (Cane)
Tobacco
83
2165
1062
2538
17205
18187
13625
20438
7009
5506
9260
9639
129
938
1232
37402
415
86
2084
1080
2012
17956
18265
14281
20365
7495
5247
9438
10332
128
956
1220
35063
480
89
2218
1118
2141
18337
18518
13927
20372
7219
5206
9667
10900
128
979
1277
41010
523
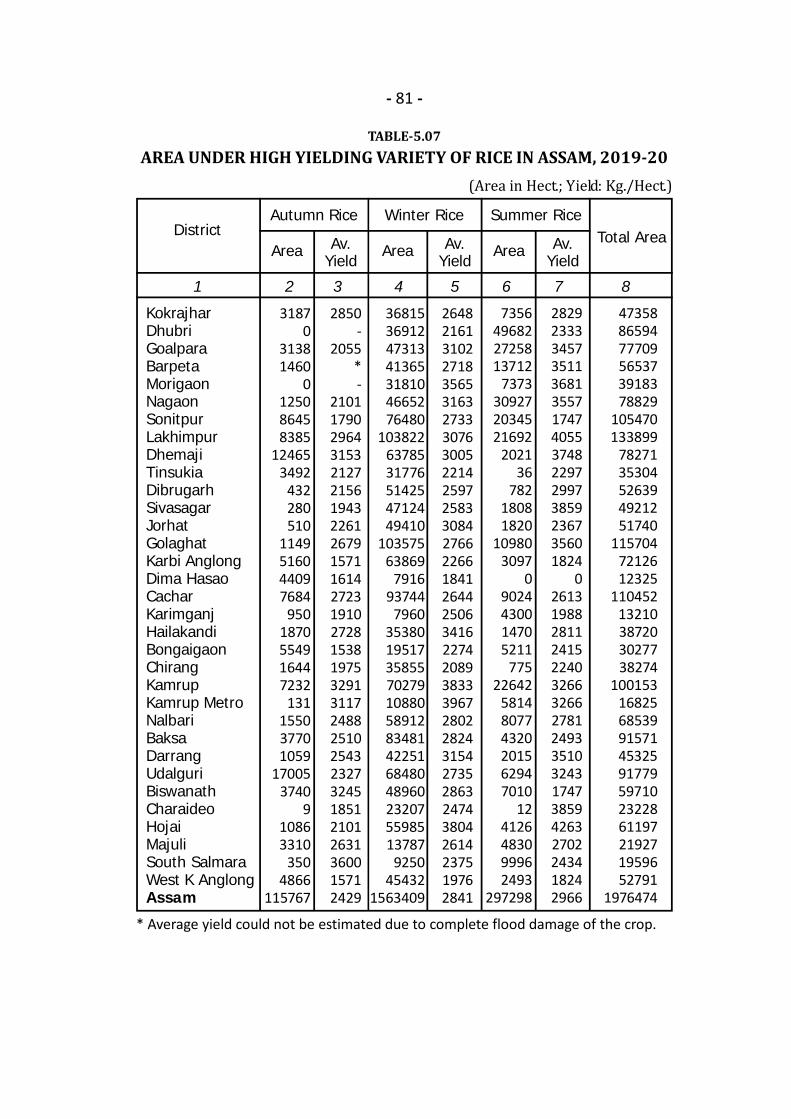
- 81 -
TABLE-5.07AREA UNDER HIGH YIELDING VARIETY OF RICE IN ASSAM, 2019-20(Area in Hect.; Yield: Kg./Hect.) 1 2 3 4 5 6 7 8
DistrictWinter Rice Summer Rice
Total Area
KokrajharDhubriGoalparaBarpetaMorigaonNagaonSonitpurLakhimpurDhemajiTinsukiaDibrugarhSivasagarJorhatGolaghatKarbi AnglongDima HasaoCacharKarimganjHailakandiBongaigaonChirangKamrupKamrup MetroNalbariBaksaDarrangUdalguriBiswanathCharaideoHojaiMajuliSouth SalmaraWest K AnglongAssam
31870
31381460
0125086458385
124653492
432280510
1149516044097684
9501870554916447232
131155037701059
170053740
910863310
3504866
115767
2850-
2055*-
21011790296431532127215619432261267915711614272319102728153819753291311724882510254323273245185121012631360015712429
2648216131022718356531632733307630052214259725833084276622661841264425063416227420893833396728022824315427352863247438042614237519762841
36815369124731341365318104665276480
1038226378531776514254712449410
10357563869
791693744
796035380195173585570279108805891283481422516848048960232075598513787
925045432
1563409
Area Av.Yield
Area Av.Yield
Area Av.Yield
7356496822725813712
7373309272034521692
202136
78218081820
109803097
09024430014705211
77522642
581480774320201562947010
124126483099962493
297298
282923333457351136813557174740553748229729973859236735601824
0261319882811241522403266326627812493351032431747385942632702243418242966
473588659477709565373918378829
105470133899
7827135304526394921251740
1157047212612325
11045213210387203027738274
1001531682568539915714532591779597102322861197219271959652791
1976474
Autumn Rice
* Average yield could not be estimated due to complete flood damage of the crop.

- 82 -
TABLE-5.08AREA UNDER HIGH YIELDING VARIETY OF RICE IN ASSAM(Area in Lakh Hect.)
1 2 3 4 5
Year Winter Rice Summer RiceTotal HYVRice Area
2010-11
2011-12
2012-13
2013-14
2014-15
2015-16
2016-17
2017-18
2018-19
2019-20
2.13
2.19
1.60
1.43
1.28
1.26
1.07
1.04
1.19
1.11
11.34
12.80
11.70
12.22
12.42
13.70
14.09
14.36
14.30
15.18
3.54
4.02
3.61
2.24
3.95
3.37
3.47
2.90
3.84
2.95
17.01
19.01
16.91
15.89
17.65
18.87
19.18
18.30
19.33
19.24
Autumn Rice

- 83 -
TABLE-5.09DISTRICT-WISE FERTILIZER CONSUMPTION IN ASSAM, 2019-20(in Tonne)
1 2 3 4 5 6 7
KokrajharDhubriGoalparaBarpetaMorigaonNagaonSonitpurLakhimpurDhemajiTinsukiaDibrugarhSivasagarJorhatGolaghatKarbi AnglongDima HasaoCacharKarimganjHailakandiBongaigaonChirangKamrupKamrup MetroNalbariBaksaDarrangUdalguri
Assam
DistrictN
itrog
en(N
)
Phos
phor
ous
(P)
Mur
ate
ofPo
tash
(K)
Tota
l(N
+P+
K)
Per
Hec
t.co
nsum
ptio
n (K
g)
147.3810508.00
7403.3717245.30
2776.3931068.20
5891.391656.80
370.5316099.20
6548.184189.95
10014.904232.873534.39
015747.904349.684608.288059.49
616.8320347.50
446.191325.84
293.2616798.50
15.95
194296.27
0363.00
1085.002303.00
11.005688.00
473.0000
6176.002689.00
710.005542.00
972.00106.00
01877.00
14.0049.00
905.0097.00
4084.005212.00
25.0011.00
1593.0030.00
40015.00
174.0812691.00
9933.9726209.20
3359.4946685.30
7154.491790.90
375.3323307.20
9700.685224.85
17262.306669.374358.49
019169.90
4466.486362.68
10366.19993.23
28389.506607.091492.24
346.5620094.30
53.95
273238.77
151.17167.17126.69192.73124.79339.50258.34197.75114.54144.39167.12151.29162.26182.63209.92
55.99190.42
74.1471.0989.7286.98
169.6737.68
118.99143.99117.86157.64
4004.46
1.15275.91578.411
135.98626.921
137.51427.694
9.0563.277
161.42158.04834.535
106.38836.51920.762
0100.671
60.24389.499
115.53511.419
167.326175.357
12.5412.407
170.4900.342
68.234
Gro
ss c
rope
d ar
ea(‘0
00 H
ac.)
26.701820.001445.606660.90
572.109929.10
790.10134.10
4.801032.00
463.50324.90
1705.401464.50
718.100
1545.00102.80
1705.401401.70
279.403958.00
948.90141.40
42.301702.80
8.00
38927.50
Consumption in terms ofN,P,K nutrients
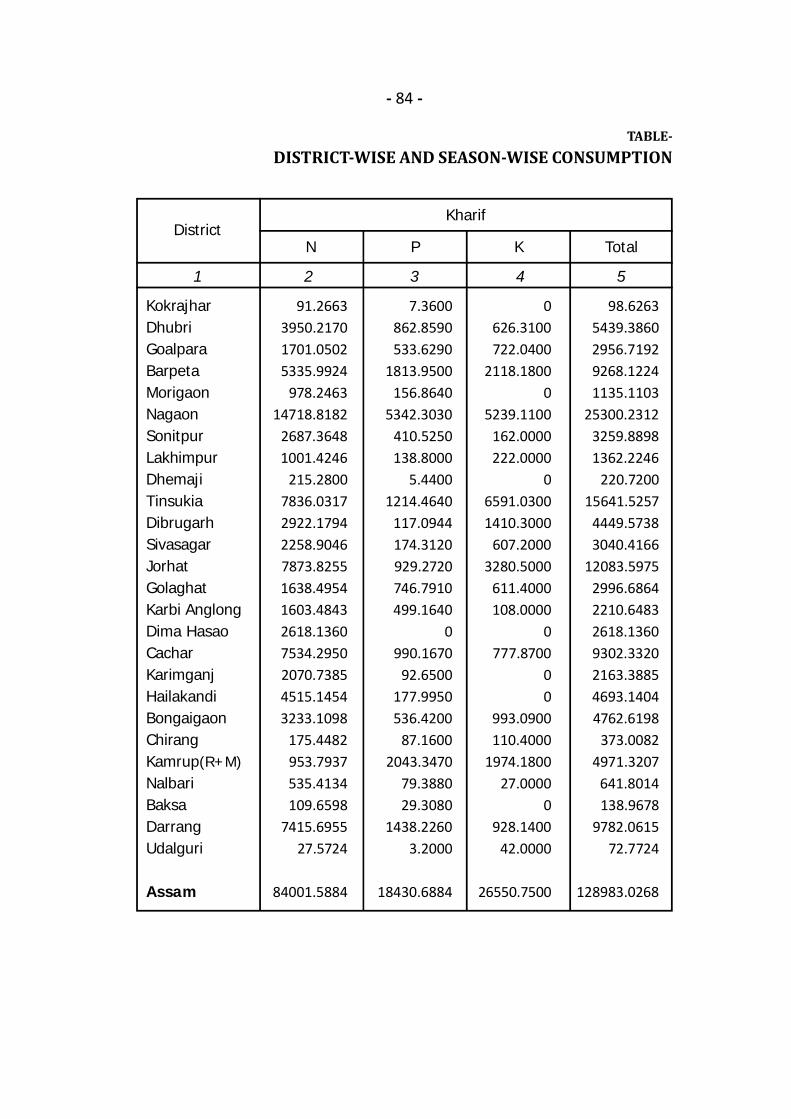
- 84 -
TABLE-DISTRICT-WISE AND SEASON-WISE CONSUMPTION
1 2 3 4 5
DistrictN P K Total
KokrajharDhubriGoalparaBarpetaMorigaonNagaonSonitpurLakhimpurDhemajiTinsukiaDibrugarhSivasagarJorhatGolaghatKarbi AnglongDima HasaoCacharKarimganjHailakandiBongaigaonChirangKamrup(R+M)NalbariBaksaDarrangUdalguri
Assam
91.26633950.21701701.05025335.9924
978.246314718.8182
2687.36481001.4246
215.28007836.03172922.17942258.90467873.82551638.49541603.48432618.13607534.29502070.73854515.14543233.1098
175.4482953.7937535.4134109.6598
7415.695527.5724
84001.5884
7.3600862.8590533.6290
1813.9500156.8640
5342.3030410.5250138.8000
5.44001214.4640
117.0944174.3120929.2720746.7910499.1640
0990.1670
92.6500177.9950536.4200
87.16002043.3470
79.388029.3080
1438.22603.2000
18430.6884
0626.3100722.0400
2118.18000
5239.1100162.0000222.0000
06591.03001410.3000
607.20003280.5000
611.4000108.0000
0777.8700
00
993.0900110.4000
1974.180027.0000
0928.1400
42.0000
26550.7500
98.62635439.38602956.71929268.12241135.1103
25300.23123259.88981362.2246
220.720015641.5257
4449.57383040.4166
12083.59752996.68642210.64832618.13609302.33202163.38854693.14044762.6198
373.00824971.3207
641.8014138.9678
9782.061572.7724
128983.0268
Kharif
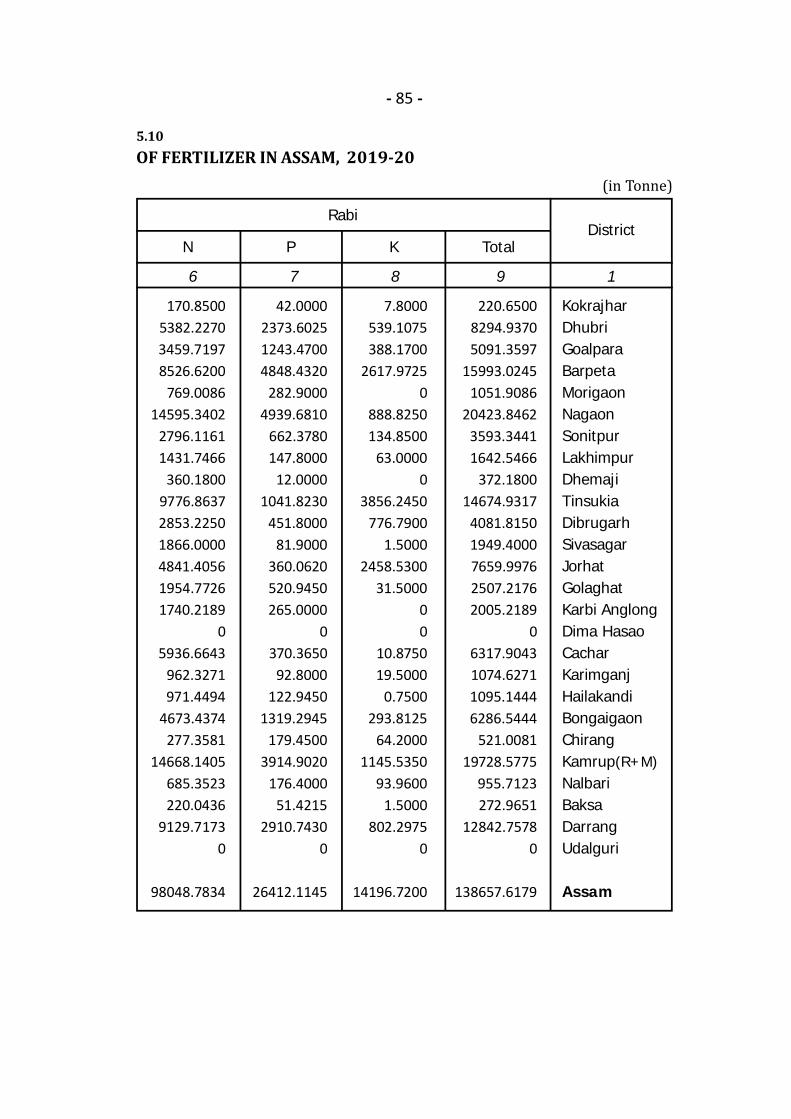
- 85 -
5.10OF FERTILIZER IN ASSAM, 2019-20 (in Tonne) 6 7 8 9 1
KokrajharDhubriGoalparaBarpetaMorigaonNagaonSonitpurLakhimpurDhemajiTinsukiaDibrugarhSivasagarJorhatGolaghatKarbi AnglongDima HasaoCacharKarimganjHailakandiBongaigaonChirangKamrup(R+M)NalbariBaksaDarrangUdalguri
Assam
N P K TotalDistrict
170.85005382.22703459.71978526.6200
769.008614595.3402
2796.11611431.7466
360.18009776.86372853.22501866.00004841.40561954.77261740.2189
05936.6643
962.3271971.4494
4673.4374277.3581
14668.1405685.3523220.0436
9129.71730
98048.7834
42.00002373.60251243.47004848.4320
282.90004939.6810
662.3780147.8000
12.00001041.8230
451.800081.9000
360.0620520.9450265.0000
0370.3650
92.8000122.9450
1319.2945179.4500
3914.9020176.4000
51.42152910.7430
0
26412.1145
7.8000539.1075388.1700
2617.97250
888.8250134.8500
63.00000
3856.2450776.7900
1.50002458.5300
31.500000
10.875019.5000
0.7500293.8125
64.20001145.5350
93.96001.5000
802.29750
14196.7200
220.65008294.93705091.3597
15993.02451051.9086
20423.84623593.34411642.5466
372.180014674.9317
4081.81501949.40007659.99762507.21762005.2189
06317.90431074.62711095.14446286.5444
521.008119728.5775
955.7123272.9651
12842.75780
138657.6179
Rabi
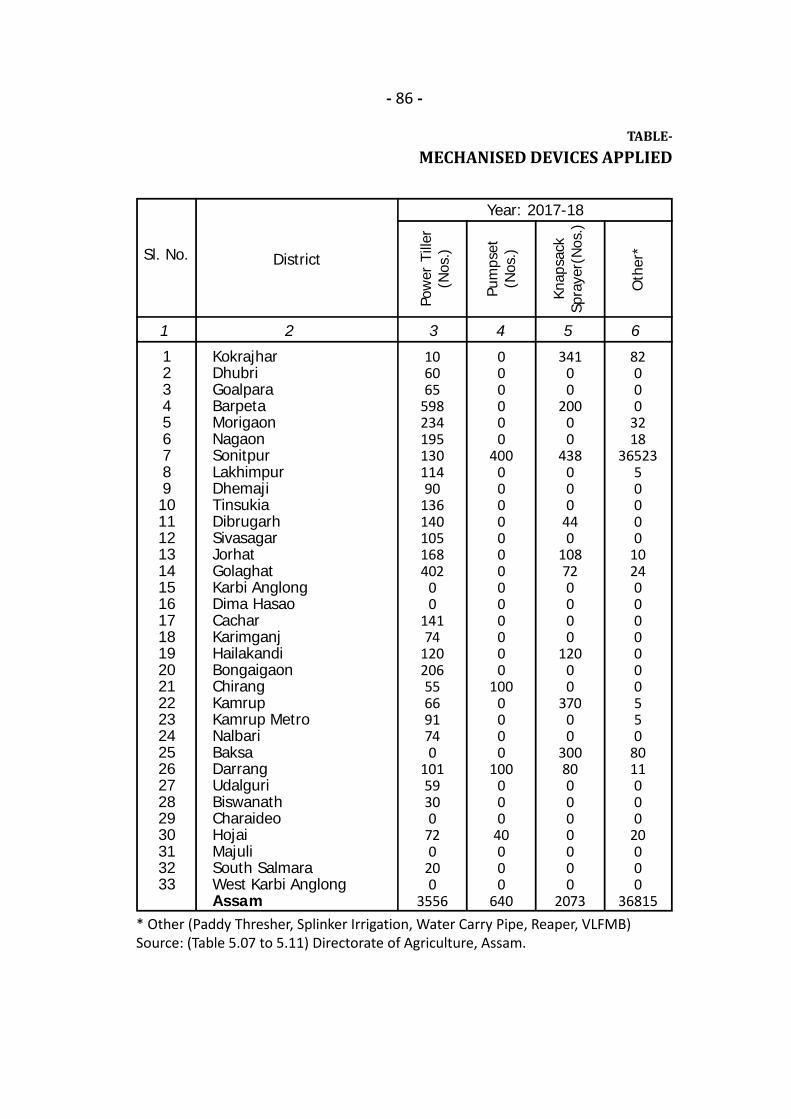
- 86 -
TABLE-MECHANISED DEVICES APPLIED
1 2 3 4 5 6
District
Knap
sack
Spra
yer(
Nos
.)
KokrajharDhubriGoalparaBarpetaMorigaonNagaonSonitpurLakhimpurDhemajiTinsukiaDibrugarhSivasagarJorhatGolaghatKarbi AnglongDima HasaoCacharKarimganjHailakandiBongaigaonChirangKamrupKamrup MetroNalbariBaksaDarrangUdalguriBiswanathCharaideoHojaiMajuliSouth SalmaraWest Karbi AnglongAssam
Year: 2017-18
* Other (Paddy Thresher, Splinker Irrigation, Water Carry Pipe, Reaper, VLFMB)Source: (Table 5.07 to 5.11) Directorate of Agriculture, Assam.
123456789101112131415161718192021222324252627282930313233
Sl. No.
106065
59823419513011490
136140105168402
00
14174
120206556691740
10159300
720
200
3556
000000
4000000000000000
1000000
100000
40000
640
34100
20000
438000
440
108720000
12000
37000
300800000000
2073
82000
3218
3652350000
10240000000550
8011000
20000
36815
Pow
er T
iller
(Nos
.)
Pum
pset
(Nos
.)
Oth
er*
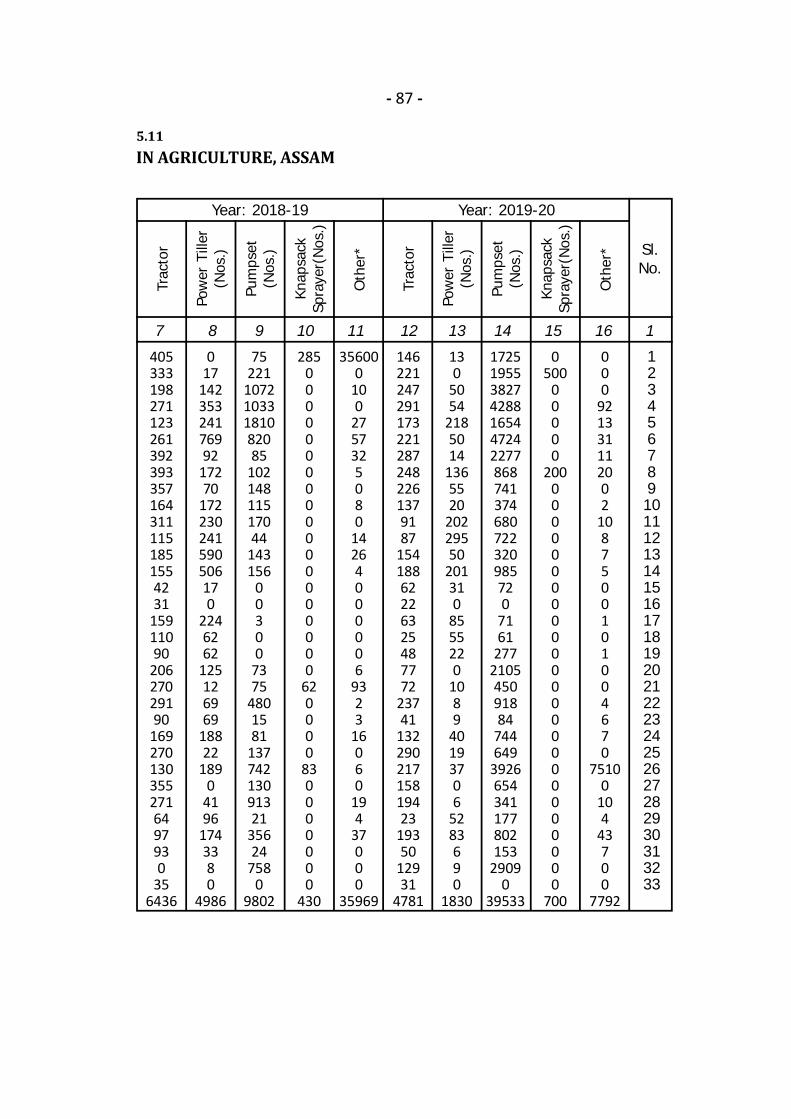
- 87 -
5.11IN AGRICULTURE, ASSAM
7 8 9 10 11 12 13 14 15 16 1
4053331982711232613923933571643111151851554231
15911090
20627029190
1692701303552716497930
356436
Year: 2018-19
123456789101112131415161718192021222324252627282930313233
Sl.No.
Year: 2019-20
017
14235324176992
17270
172230241590506170
2246262
125126969
18822
1890
4196
1743380
4986
75221
10721033181082085
10214811517044
143156
00300
7375
4801581
13774213091321
35624
7580
9802
2850000000000000000000
620000
830000000
430
356000
100
2757325080
14264000006
9323
16060
194
37000
35969
1462212472911732212872482261379187
15418862226325487772
23741
13229021715819423
19350
12931
4781
130
5054
2185014
1365520
20229550
201310
8555220
1089
40193706
5283690
1830
1725195538274288165447242277868741374680722320985720
7161
277210545091884
744649
3926654341177802153
29090
39533
0500
00000
2000000000000000000000000000
700
000
921331112002
1087500101004670
75100
104
43700
7792
Knap
sack
Spra
yer(
Nos
.)
Trac
tor
Pow
er T
iller
(Nos
.)
Pum
pset
(Nos
.)
Oth
er*
Knap
sack
Spra
yer(
Nos
.)
Trac
tor
Pow
er T
iller
(Nos
.)
Pum
pset
(Nos
.)
Oth
er*
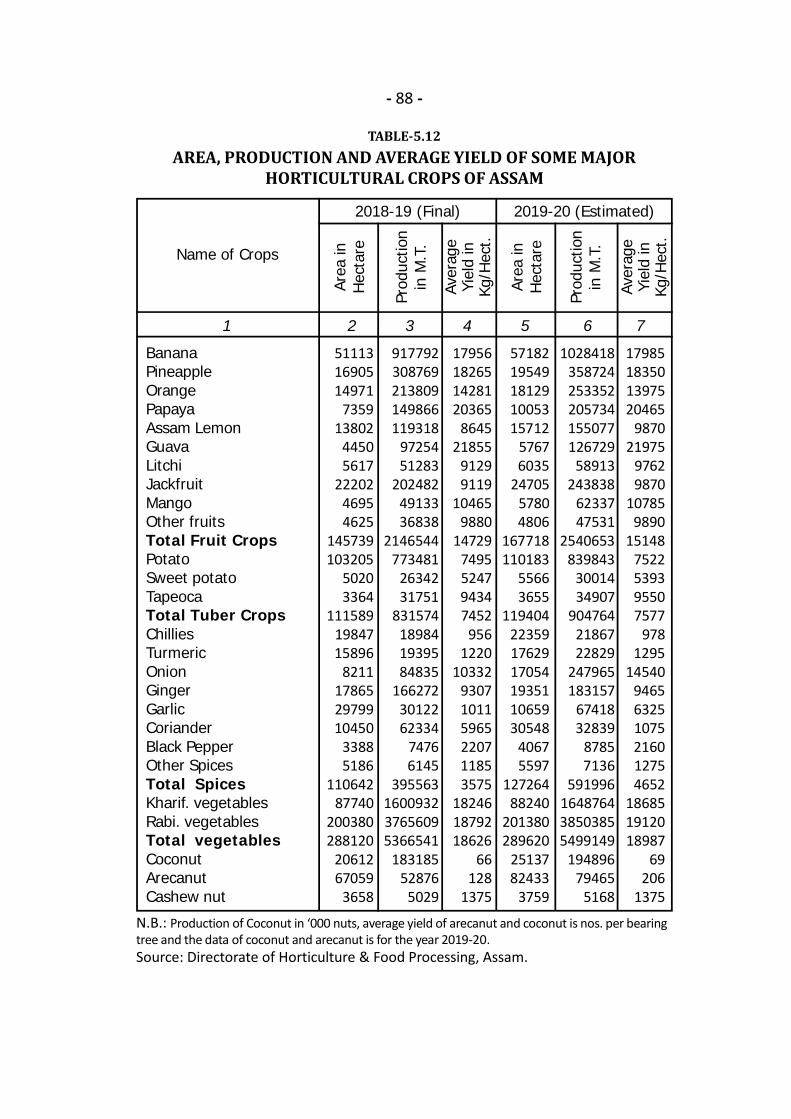
- 88 -
TABLE-5.12AREA, PRODUCTION AND AVERAGE YIELD OF SOME MAJOR
HORTICULTURAL CROPS OF ASSAM
N.B.: Production of Coconut in ‘000 nuts, average yield of arecanut and coconut is nos. per bearingtree and the data of coconut and arecanut is for the year 2019-20.Source: Directorate of Horticulture & Food Processing, Assam.
1 2 3 4 5 6 7
BananaPineappleOrangePapayaAssam LemonGuavaLitchiJackfruitMangoOther fruitsTotal Fruit CropsPotatoSweet potatoTapeocaTotal Tuber CropsChilliesTurmericOnionGingerGarlicCorianderBlack PepperOther SpicesTotal SpicesKharif. vegetablesRabi. vegetablesTotal vegetablesCoconutArecanutCashew nut
Name of Crops
Area
inH
ecta
re
2019-20 (Estimated)
511131690514971
735913802
44505617
2220246954625
145739103205
50203364
1115891984715896
8211178652979910450
33885186
11064287740
200380288120
2061267059
3658
917792308769213809149866119318
9725451283
2024824913336838
2146544773481
2634231751
831574189841939584835
1662723012262334
74766145
395563160093237656095366541
18318552876
5029
17956182651428120365
864521855
91299119
104659880
147297495524794347452
9561220
10332930710115965220711853575
182461879218626
66128
1375
5718219549181291005315712
57676035
2470557804806
167718110183
55663655
119404223591762917054193511065930548
40675597
12726488240
201380289620
2513782433
3759
1028418358724253352205734155077126729
58913243838
6233747531
2540653839843
3001434907
9047642186722829
247965183157
6741832839
87857136
591996164876438503855499149
19489679465
5168
17985183501397520465
987021975
97629870
107859890
151487522539395507577
9781295
14540946563251075216012754652
186851912018987
69206
1375
Prod
uctio
nin
M.T
.
Aver
age
Yiel
d in
Kg/H
ect.
Area
inH
ecta
re
Prod
uctio
nin
M.T
.
Aver
age
Yiel
d in
Kg/H
ect.
2018-19 (Final)
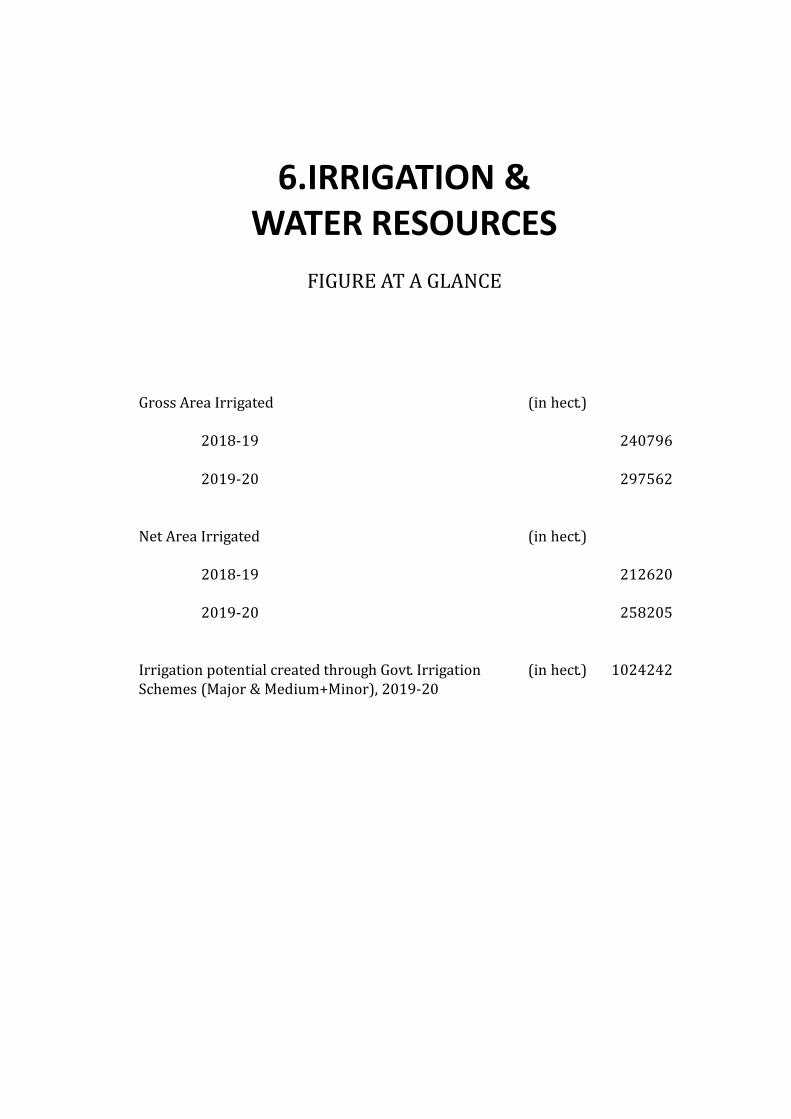
6.IRRIGATION &WATER RESOURCESFIGURE AT A GLANCE
Gross Area Irrigated2018-192019-20Net Area Irrigated2018-192019-20Irrigation potential created through Govt. IrrigationSchemes (Major & Medium+Minor), 2019-20
240796297562212620258205
1024242
(in hect.)
(in hect.)
(in hect.)

- 90 -
TABLE-DISTRICT-WISE & CATEGORY-WISE IRRIGATION POTENTIAL CREA-
1 2 3 4
KokrajharDhubriGoalparaBarpetaMorigaonNagaonSonitpurLakhimpurDhemajiTinsukiaDibrugarhSivasagarJorhatGolaghatKarbi AnglongDima HasaoCacharKarimganjHailakandiBongaigaonChirangKamrupKamrup MetroNalbariBaksaDarrangUdalguriBiswanathCharaideoHojaiMajuliSouth SalmaraWest Karbi AnglongAssam
District SurfaceFlow
SurfaceLift
Total
4960--
25650--
32131-------
5660-----
23504---
33356-
69230--
41014---
235505
-----
42063----
4158---
3977------------------
50198
4960--
25650-
4206332131
---
4158---
9637-----
23504---
33356-
69230--
41014---
285703
Major & Medium
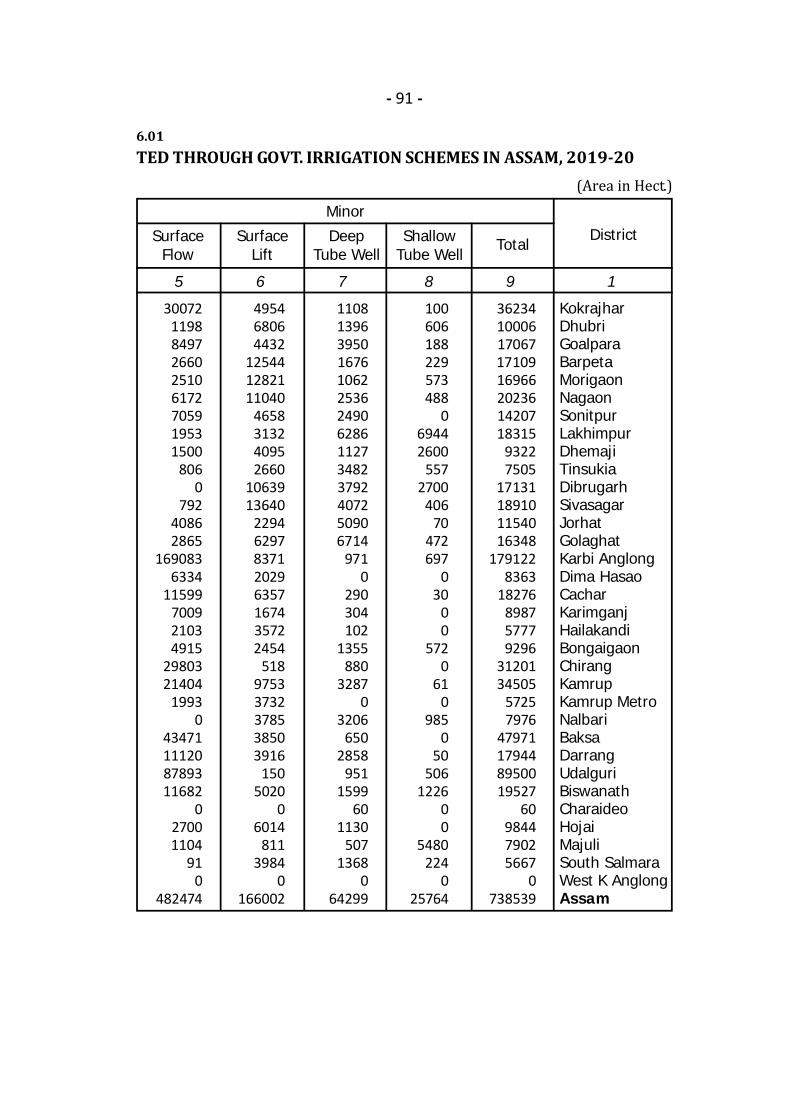
- 91 -
6.01TED THROUGH GOVT. IRRIGATION SCHEMES IN ASSAM, 2019-20(Area in Hect.) 5 6 7 8 9 1
KokrajharDhubriGoalparaBarpetaMorigaonNagaonSonitpurLakhimpurDhemajiTinsukiaDibrugarhSivasagarJorhatGolaghatKarbi AnglongDima HasaoCacharKarimganjHailakandiBongaigaonChirangKamrupKamrup MetroNalbariBaksaDarrangUdalguriBiswanathCharaideoHojaiMajuliSouth SalmaraWest K AnglongAssam
DistrictSurfaceFlow
SurfaceLift
DeepTube Well
ShallowTube Well
Total
3007211988497266025106172705919531500
8060
79240862865
1690836334
11599700921034915
2980321404
19930
43471111208789311682
027001104
910
482474
495468064432
125441282111040
4658313240952660
1063913640
22946297837120296357167435722454
51897533732378538503916
1505020
06014
8113984
0166002
11081396395016761062253624906286112734823792407250906714
9710
290304102
1355880
32870
3206650
2858951
159960
1130507
13680
64299
100606188229573488
069442600
5572700
40670
472697
030
00
5720
610
9850
50506
122600
5480224
025764
3623410006170671710916966202361420718315
93227505
17131189101154016348
1791228363
18276898757779296
3120134505
57257976
47971179448950019527
60984479025667
0738539
Minor
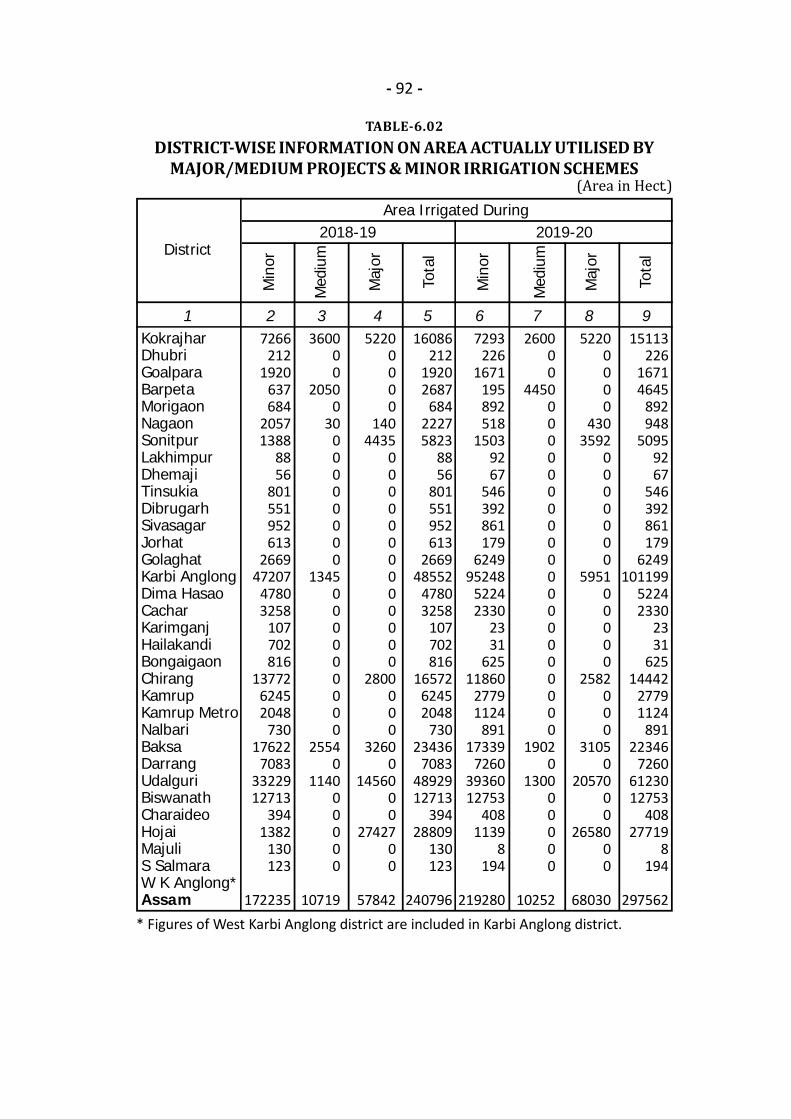
- 92 -
TABLE-6.02DISTRICT-WISE INFORMATION ON AREA ACTUALLY UTILISED BY
MAJOR/MEDIUM PROJECTS & MINOR IRRIGATION SCHEMES(Area in Hect.)
1 2 3 4 5 6 7 8 9KokrajharDhubriGoalparaBarpetaMorigaonNagaonSonitpurLakhimpurDhemajiTinsukiaDibrugarhSivasagarJorhatGolaghatKarbi AnglongDima HasaoCacharKarimganjHailakandiBongaigaonChirangKamrupKamrup MetroNalbariBaksaDarrangUdalguriBiswanathCharaideoHojaiMajuliS SalmaraW K Anglong*Assam
District
Area Irrigated During
Med
ium
2019-20
7266212
1920637684
20571388
8856
801551952613
266947207
47803258
107702816
1377262452048
73017622
70833322912713
3941382
130123
172235
360000
20500
3000000000
1345000000000
25540
114000000
10719
52200000
1404435
0000000000000
2800000
32600
1456000
2742700
57842
16086212
19202687
68422275823
8856
801551952613
266948552
47803258
107702816
1657262452048
73023436
70834892912713
39428809
130123
240796
7293226
1671195892518
15039267
546392861179
624995248
52242330
2331
62511860
27791124
89117339
72603936012753
4081139
8194
219280
260000
445000000000000000000000
19020
130000000
10252
52200000
4303592
0000000
595100000
2582000
31050
2057000
2658000
68030
15113226
16714645
892948
50959267
546392861179
6249101199
52242330
2331
62514442
27791124
89122346
72606123012753
40827719
8194
297562
Min
or
Maj
or
Tota
l
Min
or
Med
ium
Maj
or
Tota
l
2018-19
* Figures of West Karbi Anglong district are included in Karbi Anglong district.

- 93 -TABLE-6.03
DISTRICT-WISE & SEASON-WISE INFORMATION ON AREAIRRIGATED IN ASSAM THROUGH BURGE
(Through Govt. Surface Lift Irrigation Schemes)(Area in Hect.) 1 2 3 4 5
DistrictKharif Rabi & Pre
KharifKharif Rabi & Pre
Kharif
KokrajharDhubriGoalparaBarpetaMorigaonNagaonSonitpurLakhimpurDhemajiTinsukiaDibrugarhSivasagarJorhatGolaghatKarbi AnglongDima HasaoCacharKarimganjHailakandiBongaigaonChirangKamrupKamrup MetroNalbariBaksaDarrangUdalguriBiswanathCharaideoHojaiMajuliSouth SalmaraWest K AnglongAssam
6080
55242216408
3021
9104171200
52165361
0370
0255233
0163354
6810
535200
192025
635100
7411
20162
88180388637
1310
01
1105
1661157
0330
5281
23963
1171600
10344
0110
200
4841
6088
24118155122
23151510913821
5502653
3055
00
2020
123135
834713
363196
192020
41000
7886
20139105
4655522
1410
900
155
241991
0790
00
112
6440
41100
165
4417
10200
4232
Area Irrigated during 2018-19 Area Irrigated during 2019-20

- 94 -
TABLE-DISTRICT-WISE GROSS AREA IRRIGATED UNDER
1 2 3 4 5 6 7 8
KokrajharDhubriGoalparaBarpetaMorigaonNagaonSonitpurLakhimpurDhemajiTinsukiaDibrugarhSivasagarJorhatGolaghatKarbi AnglongDima HasaoCacharKarimganjHailakandiBongaigaonChirangKamrupKamrup MetroNalbariBaksaDarrangUdalguriBiswanathCharaideoHojaiMajuliSouth SalmaraWest K AnglongAssam
District2018-19 2019-20 2018-19 2019-20 2018-19 2019-20
628162143422604
10454331
9105182200
57331
15180
70052
336235
39226
15257410
535303
196425
745300
12252
628147129122810644
37252410915326
7913644
30845
03122
187175494
4713
381201
196437
512---
12120
154000
15022206
5681
519005
2500
122164
123746251
47802558
55366107
165335408
523470
234186012
4862610015
9027839
020
0219833
144470
12274450
16179
463909
260-
11219
215096619
51941485
23-
9314255
2222630577
223186053
6095410015
4026992
040
0275018
5850
2755975
501590
5742
446369630392
1101784
0000
4740
6110
1868
5360
734278225127103
08711
3879
3157366
125419
6734
276301696134
3308936
0000
5100
3820
26715
82675
774331215
8154
010424
Surface Lift Ground Water LiftSurface FlowSl.No.
123456789
101112131415161718192021222324252627282930313233

- 95 -
6.04GOVT. IRRIGATION FACILITIES IN ASSAM (Area in Hect.) 9 10 11 12 13 14 1
Sl.No.2018-19 2019-20 2018-19 2019-20 2018-19 2019-20
16028162
16452628
60917265233
3114
355182322221
156847769
47803258
107702342
1657256342048
54423428
65474892911979
11528584
320
0232085
15075147
13564572
826823
46762533
27091
16545
2941100263
52242330
2331
11514442
23971124
62422331
64346115511979
7727504
040
0287138
5850
2755975
501590
5742
446396630392
1101784
0000
4740
6110
1868
5360
734278225127103
08738
3879
3157366
125419
6734
276301696134
3308936
0000
5100
3820
26715
82675
774331215
8154
010424
16086212
19202687
68422275823
8856
801578952613
266948553
47803258
107702816
1657262452048
73023436
70834892912713
39328809
130123
0240823
15113226
16714645
892948
50959267
546392861179
6249101199
52242330
2331
62514442
27791124
89122346
72606123012753
40827719
8194
0297562
Canals Tube Wells Total
123456789
101112131415161718192021222324252627282930313233
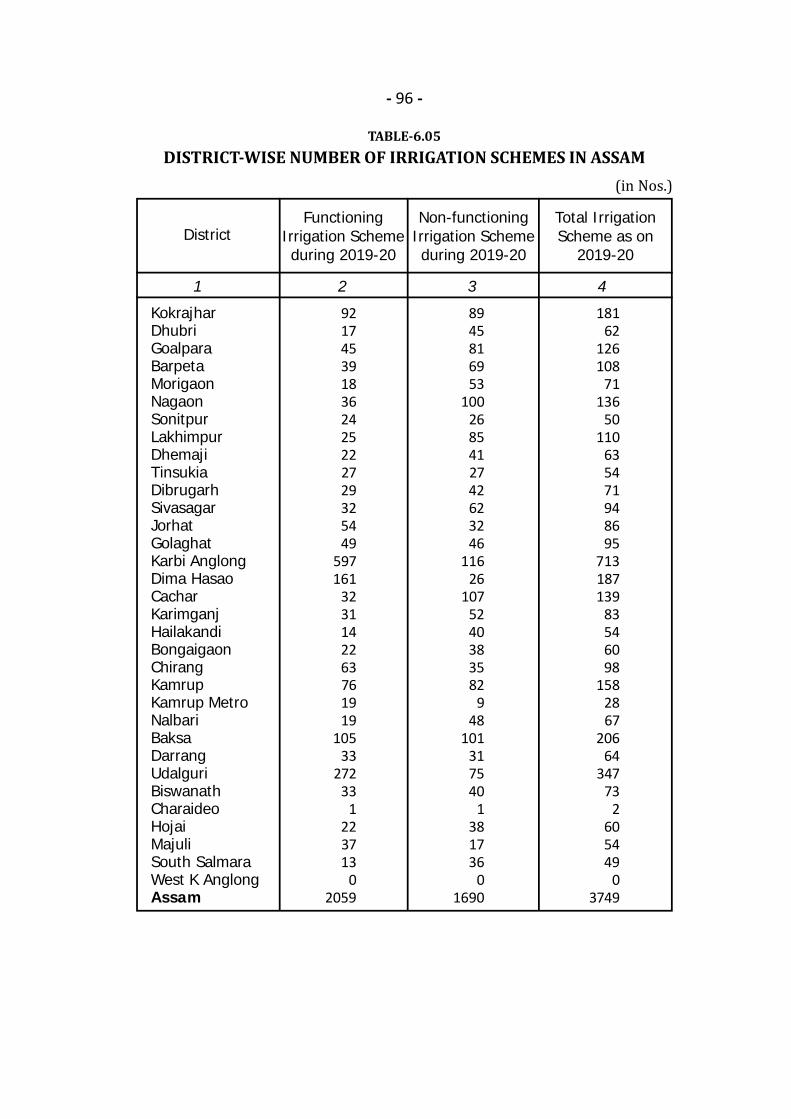
- 96 -
TABLE-6.05DISTRICT-WISE NUMBER OF IRRIGATION SCHEMES IN ASSAM(in Nos.)
1 2 3 4
KokrajharDhubriGoalparaBarpetaMorigaonNagaonSonitpurLakhimpurDhemajiTinsukiaDibrugarhSivasagarJorhatGolaghatKarbi AnglongDima HasaoCacharKarimganjHailakandiBongaigaonChirangKamrupKamrup MetroNalbariBaksaDarrangUdalguriBiswanathCharaideoHojaiMajuliSouth SalmaraWest K AnglongAssam
District
9217453918362425222729325449
597161
3231142263761919
10533
27233
1223713
02059
8945816953
1002685412742623246
11626
1075240383582
948
101317540
1381736
01690
18162
126108
71136
50110
635471948695
713187139
83546098
1582867
20664
34773
2605449
03749
FunctioningIrrigation Schemeduring 2019-20
Total IrrigationScheme as on
2019-20
Non-functioningIrrigation Schemeduring 2019-20
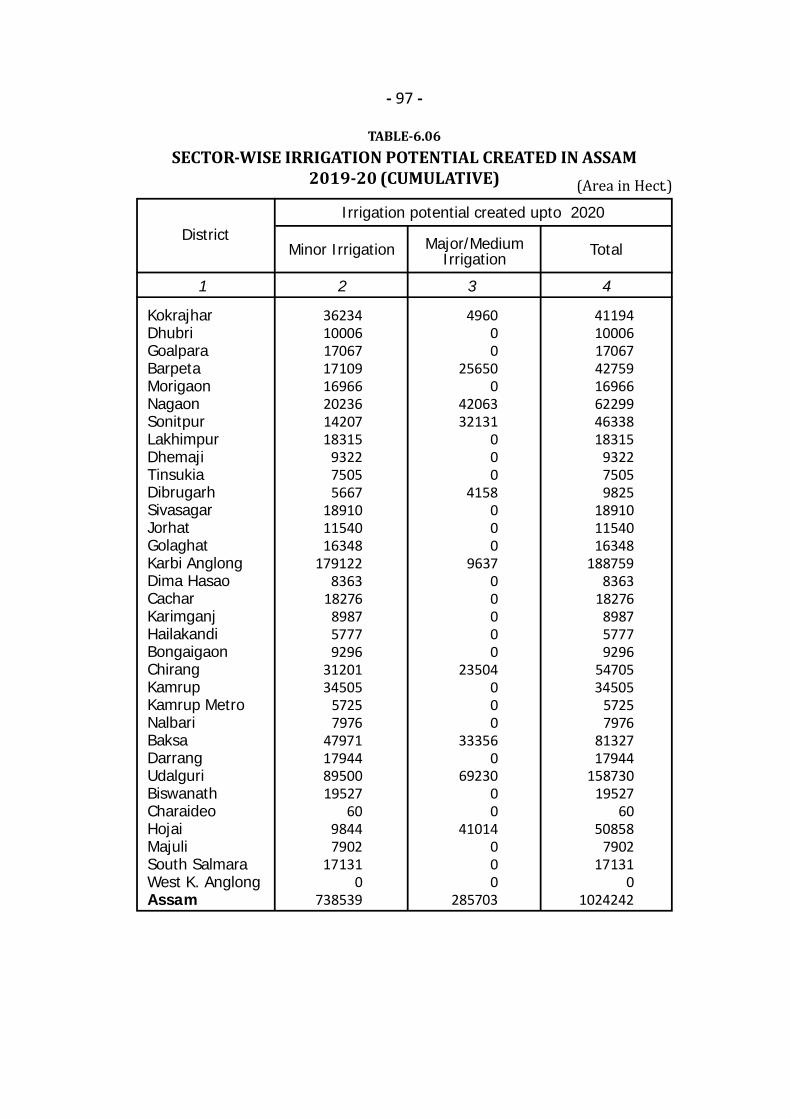
- 97 -
TABLE-6.06SECTOR-WISE IRRIGATION POTENTIAL CREATED IN ASSAM
2019-20 (CUMULATIVE) (Area in Hect.)1 2 3 4
KokrajharDhubriGoalparaBarpetaMorigaonNagaonSonitpurLakhimpurDhemajiTinsukiaDibrugarhSivasagarJorhatGolaghatKarbi AnglongDima HasaoCacharKarimganjHailakandiBongaigaonChirangKamrupKamrup MetroNalbariBaksaDarrangUdalguriBiswanathCharaideoHojaiMajuliSouth SalmaraWest K. AnglongAssam
DistrictIrrigation potential created upto 2020
Minor Irrigation
3623410006170671710916966202361420718315
932275055667
189101154016348
1791228363
18276898757779296
3120134505
57257976
47971179448950019527
6098447902
171310
738539
496000
256500
4206332131
000
4158000
963700000
23504000
333560
6923000
41014000
285703
4119410006170674275916966622994633818315
932275059825
189101154016348
1887598363
18276898757779296
5470534505
57257976
8132717944
15873019527
6050858
790217131
01024242
Major/MediumIrrigation Total
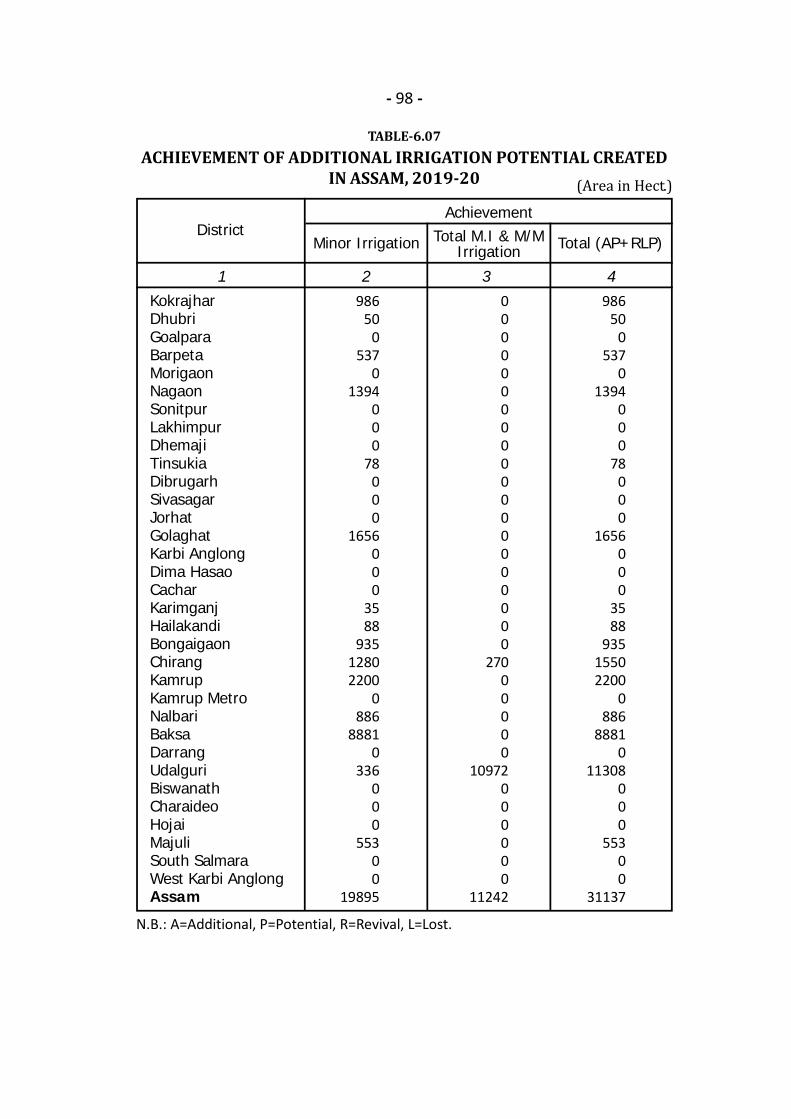
- 98 -
TABLE-6.07ACHIEVEMENT OF ADDITIONAL IRRIGATION POTENTIAL CREATED
IN ASSAM, 2019-20 (Area in Hect.)
N.B.: A=Additional, P=Potential, R=Revival, L=Lost.
1 2 3 4KokrajharDhubriGoalparaBarpetaMorigaonNagaonSonitpurLakhimpurDhemajiTinsukiaDibrugarhSivasagarJorhatGolaghatKarbi AnglongDima HasaoCacharKarimganjHailakandiBongaigaonChirangKamrupKamrup MetroNalbariBaksaDarrangUdalguriBiswanathCharaideoHojaiMajuliSouth SalmaraWest Karbi AnglongAssam
DistrictAchievement
98650
0537
01394
000
78000
1656000
3588
93512802200
0886
88810
336000
55300
19895
00000000000000000000
27000000
10972000000
11242
98650
0537
01394
000
78000
1656000
3588
93515502200
0886
88810
11308000
55300
31137
Minor Irrigation Total M.I & M/MIrrigation Total (AP+RLP)

TABLE-6.08DISTRICT-WISE NET AREA IRRIGATED IN ASSAM(Area in Hect.)
Source: (Table 6.01 to 6.08) Chief Engineer, Irrigation Department, Assam.
1 2 3
KokrajharDhubriGoalparaBarpetaMorigaonNagaonSonitpurLakhimpurDhemajiTinsukiaDibrugarhSivasagarJorhatGolaghatKarbi AnglongDima HasaoCacharKarimganjHailakandiBongaigaonChirangKamrupKamrup MetroNalbariBaksaDarrangUdalguriBiswanathCharaideoHojaiMajuliSouth SalmaraWest Karbi AnglongAssam
District 2018-19 2019-20
16021183
14272469
43011315733
5756
793515887545
134932598
47801925
85537431
1570555251171
67022751
68834775812652
39026989
9975
0212620
15051190
12603688
719695
50015748
543391600150
386172305
52241900
2320
37113305
23731001
88821479
67615993512692
36827179
8119
0258205
- 99 -
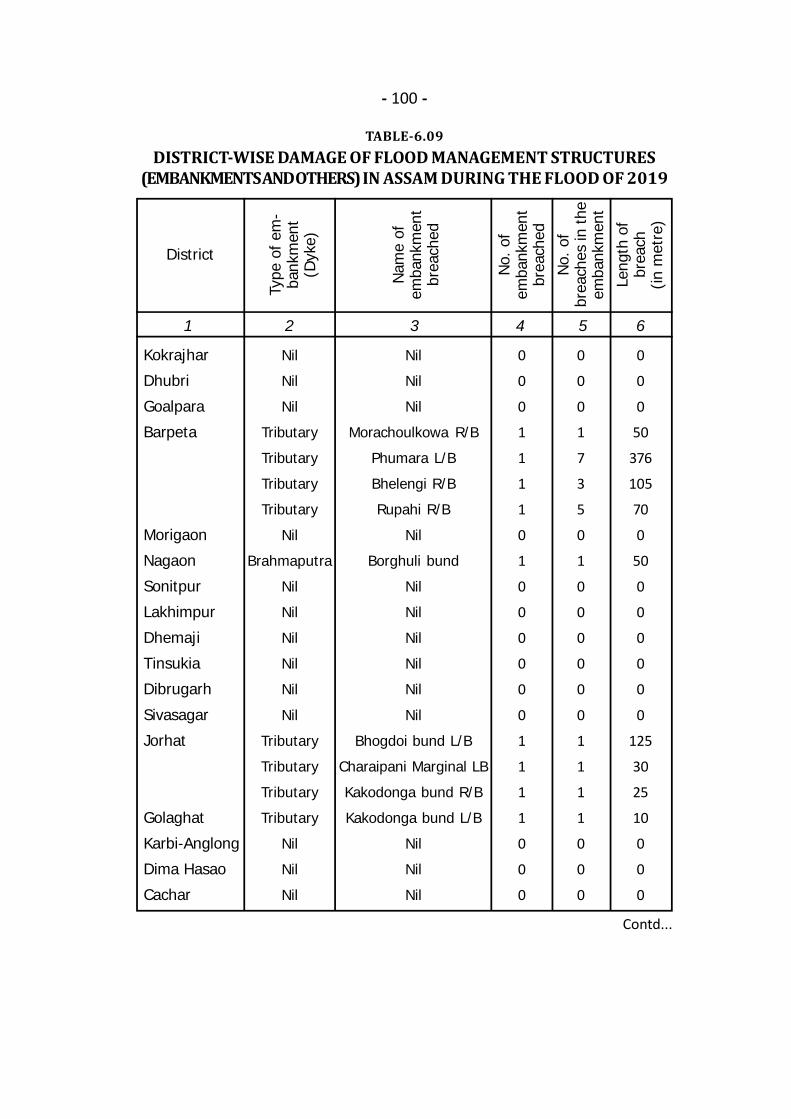
- 100 -
TABLE-6.09DISTRICT-WISE DAMAGE OF FLOOD MANAGEMENT STRUCTURES
(EMBANKMENTS AND OTHERS) IN ASSAM DURING THE FLOOD OF 2019
Contd...
1 2 3 4 5 6
DistrictTy
pe o
f em
-ba
nkm
ent
(Dyk
e)
No.
of
emba
nkm
ent
brea
ched
No.
of
brea
ches
in th
eem
bank
men
t
Leng
th o
fbr
each
(in m
etre
)
Kokrajhar
Dhubri
Goalpara
Barpeta
Morigaon
Nagaon
Sonitpur
Lakhimpur
Dhemaji
Tinsukia
Dibrugarh
Sivasagar
Jorhat
Golaghat
Karbi-Anglong
Dima Hasao
Cachar
Nil
Nil
Nil
Tributary
Tributary
Tributary
Tributary
Nil
Brahmaputra
Nil
Nil
Nil
Nil
Nil
Nil
Tributary
Tributary
Tributary
Tributary
Nil
Nil
Nil
0
0
0
1
1
1
1
0
1
0
0
0
0
0
0
1
1
1
1
0
0
0
0
0
0
1
7
3
5
0
1
0
0
0
0
0
0
1
1
1
1
0
0
0
0
0
0
50
376
105
70
0
50
0
0
0
0
0
0
125
30
25
10
0
0
0
Nam
e of
emba
nkm
ent
brea
ched
Nil
Nil
Nil
Morachoulkowa R/B
Phumara L/B
Bhelengi R/B
Rupahi R/B
Nil
Borghuli bund
Nil
Nil
Nil
Nil
Nil
Nil
Bhogdoi bund L/B
Charaipani Marginal LB
Kakodonga bund R/B
Kakodonga bund L/B
Nil
Nil
Nil

- 101 -
TABLE-6.09
1 2 3 4 5 6
DistrictTy
pe o
f em
-ba
nkm
ent
(Dyk
e)
No.
of
emba
nkm
ent
brea
ched
No.
of
brea
ches
in th
eem
bank
men
t
Leng
th o
fbr
each
(in m
etre
)
Karimganj
HailakandiBongaigaonChirangKamrup
Kamrup MetroNalbari
BaksaDarrang
UdalguriBiswanathCharaideoHajaiMajuliSouth SalmaraW K Anglong
Assam Total
Tributary
Tributary
Nil
Nil
Nil
Tributary
Tributary
Tributary
Brahmaputra
Tributary
Tributary
Tributary
Brahmaputra
Tributary
Tributary
-
Tributary
Nil
Nil
Nil
Nil
Nil
110001111111111-100000
22
120002111221111-100000
38
3035000
1101801530
325100250605045-
5000000
2121
Nam
e of
emba
nkm
ent
brea
ched
B/B of River Longai L/B
Singla R/B
Nil
Nil
Nil
Puthimari L/B
Puthimari R/B
Bornadi R/B
Khanamukh-Majirgaon
Mora Pagaladia L/B
Nadla L/B
Puthimari R/B
Kurua Ring Bund
Nonoi R/B
Nonoi L/B
-
Brahmajan L/B
Nil
Nil
Nil
Nil
Nil
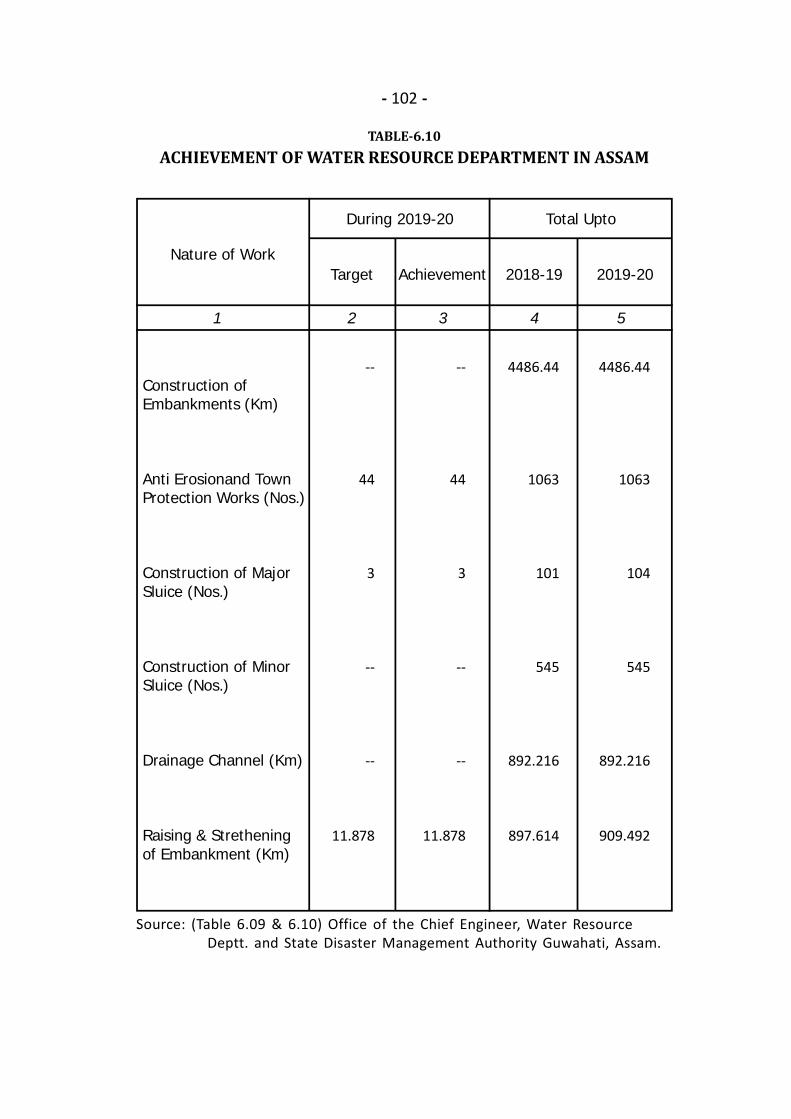
- 102 -
TABLE-6.10ACHIEVEMENT OF WATER RESOURCE DEPARTMENT IN ASSAM
.
1 2 3 4 5
Construction ofEmbankments (Km)
Anti Erosionand TownProtection Works (Nos.)
Construction of MajorSluice (Nos.)
Construction of MinorSluice (Nos.)
Drainage Channel (Km)
Raising & Stretheningof Embankment (Km)
Nature of Work
During 2019-20 Total Upto
--
44
3
--
--
11.878
--
44
3
--
--
11.878
4486.44
1063
101
545
892.216
897.614
4486.44
1063
104
545
892.216
909.492
Achievement 2019-20Target 2018-19
Source: (Table 6.09 & 6.10) Office of the Chief Engineer, Water Resource Deptt. and State Disaster Management Authority Guwahati, Assam.
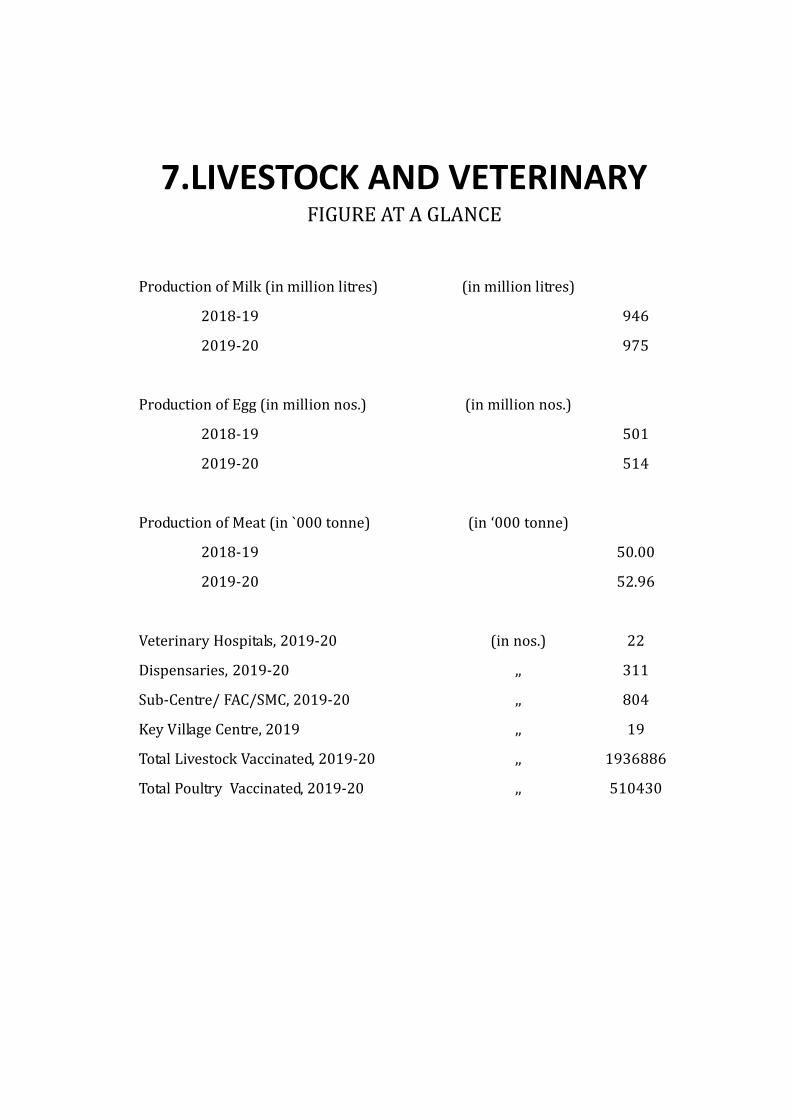
7.LIVESTOCK AND VETERINARYFIGURE AT A GLANCEProduction of Milk (in million litres)2018-192019-20Production of Egg (in million nos.)2018-192019-20Production of Meat (in `000 tonne)2018-192019-20Veterinary Hospitals, 2019-20Dispensaries, 2019-20Sub-Centre/ FAC/SMC, 2019-20Key Village Centre, 2019Total Livestock Vaccinated, 2019-20Total Poultry Vaccinated, 2019-20
946975501514
50.0052.9622311804191936886510430
(in million litres)
(in million nos.)
(in ‘000 tonne)
(in nos.),,,,,,,,,,
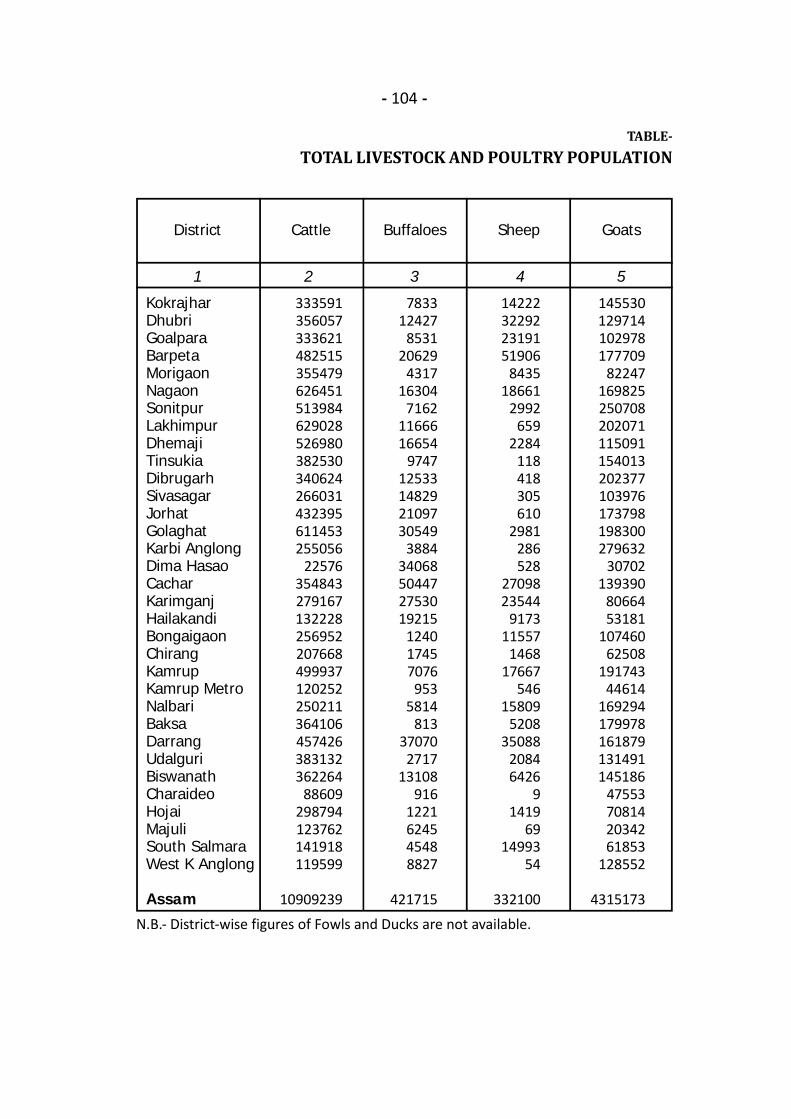
- 104 -
TABLE-TOTAL LIVESTOCK AND POULTRY POPULATION
1 2 3 4 5
District Cattle Buffaloes Sheep Goats
KokrajharDhubriGoalparaBarpetaMorigaonNagaonSonitpurLakhimpurDhemajiTinsukiaDibrugarhSivasagarJorhatGolaghatKarbi AnglongDima HasaoCacharKarimganjHailakandiBongaigaonChirangKamrupKamrup MetroNalbariBaksaDarrangUdalguriBiswanathCharaideoHojaiMajuliSouth SalmaraWest K Anglong
Assam
333591356057333621482515355479626451513984629028526980382530340624266031432395611453255056
22576354843279167132228256952207668499937120252250211364106457426383132362264
88609298794123762141918119599
10909239
783312427
853120629
431716304
71621166616654
974712533148292109730549
388434068504472753019215
124017457076953
5814813
370702717
13108916
1221624545488827
421715
14222322922319151906
843518661
2992659
2284118418305610
2981286528
2709823544
917311557
146817667
54615809
520835088
20846426
91419
6914993
54
332100
145530129714102978177709
82247169825250708202071115091154013202377103976173798198300279632
30702139390
8066453181
10746062508
19174344614
169294179978161879131491145186
47553708142034261853
128552
4315173N.B.- District-wise figures of Fowls and Ducks are not available.
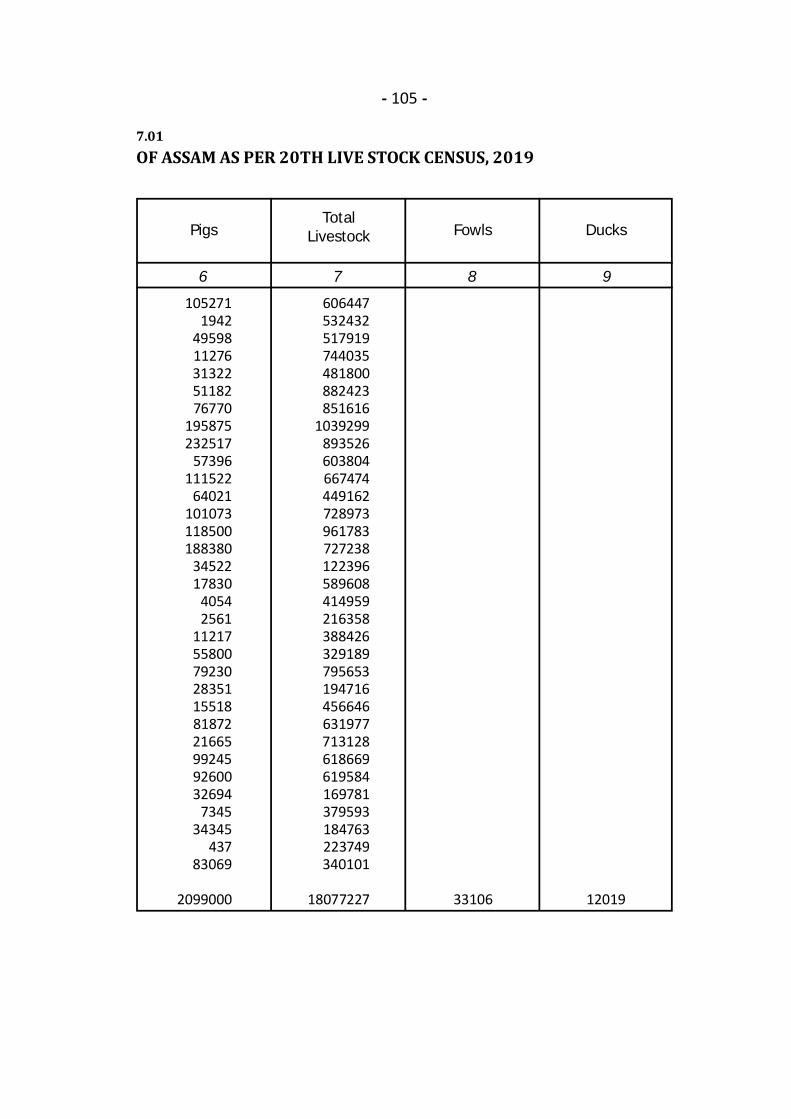
- 105 -
7.01OF ASSAM AS PER 20TH LIVE STOCK CENSUS, 2019
6 7 8 9
PigsTotal
Livestock Fowls Ducks
1052711942
4959811276313225118276770
195875232517
57396111522
64021101073118500188380
3452217830
40542561
11217558007923028351155188187221665992459260032694
734534345
43783069
2099000
606447532432517919744035481800882423851616
1039299893526603804667474449162728973961783727238122396589608414959216358388426329189795653194716456646631977713128618669619584169781379593184763223749340101
18077227 33106 12019
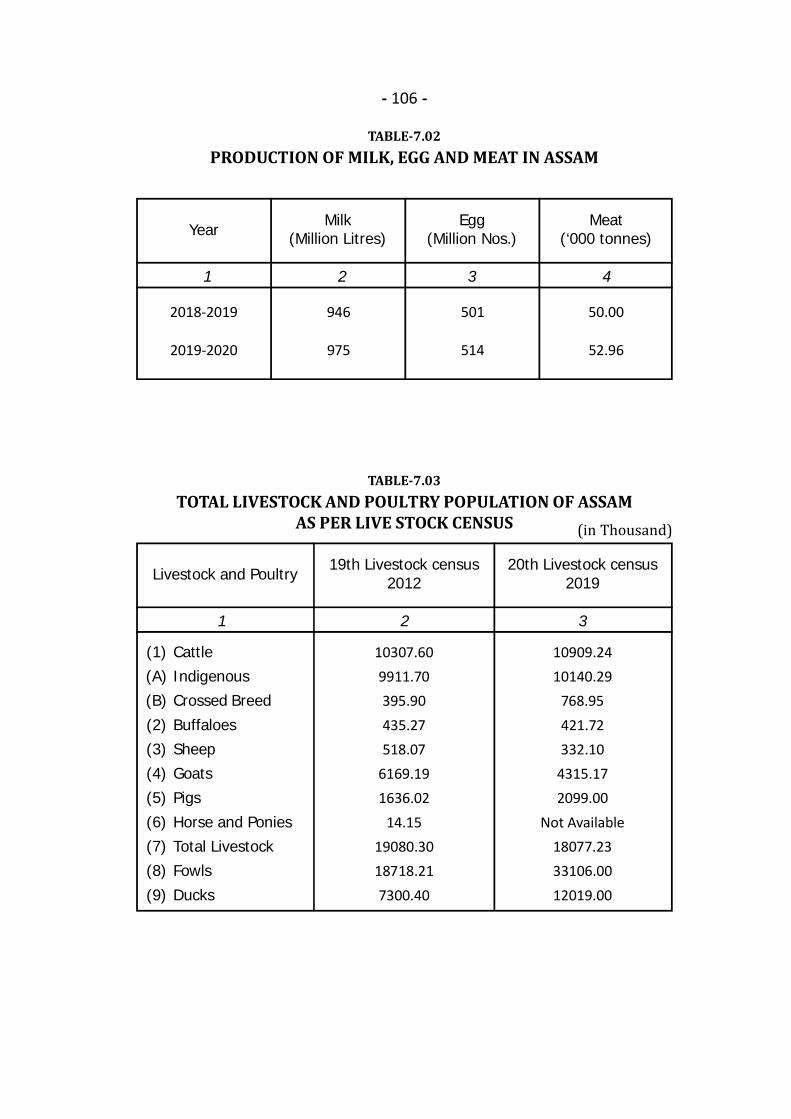
- 106 -
TABLE-7.02PRODUCTION OF MILK, EGG AND MEAT IN ASSAM
1 2 3 4
YearMilk
(Million Litres)Egg
(Million Nos.)Meat
(‘000 tonnes)
2018-2019
2019-2020
946
975
501
514
50.00
52.96
TABLE-7.03TOTAL LIVESTOCK AND POULTRY POPULATION OF ASSAM
AS PER LIVE STOCK CENSUS
1 2 3
Livestock and Poultry19th Livestock census
201220th Livestock census
2019
(1)(A)(B)(2)(3)(4)(5)(6)(7)(8)(9)
10307.609911.70395.90435.27518.07
6169.191636.02
14.1519080.3018718.217300.40
10909.2410140.29
768.95421.72332.10
4315.172099.00
Not Available18077.2333106.0012019.00
CattleIndigenousCrossed BreedBuffaloesSheepGoatsPigsHorse and PoniesTotal LivestockFowlsDucks
(in Thousand)
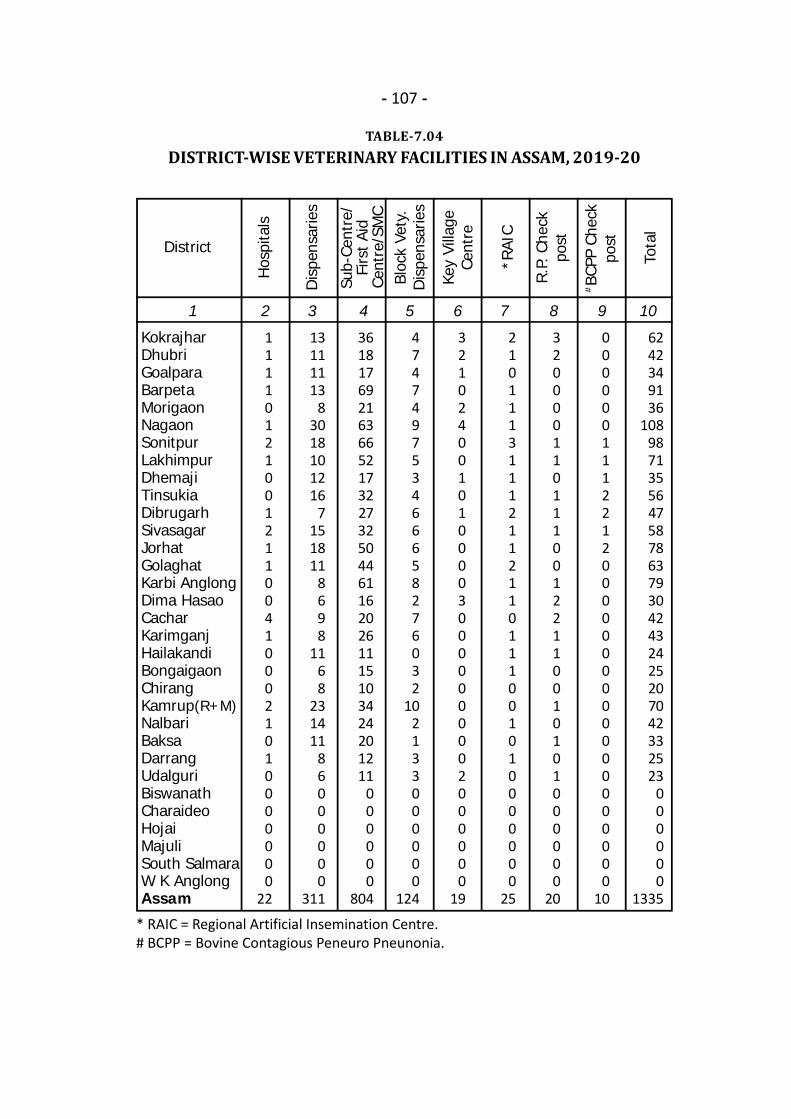
- 107 -
TABLE-7.04DISTRICT-WISE VETERINARY FACILITIES IN ASSAM, 2019-20
* RAIC = Regional Artificial Insemination Centre.# BCPP = Bovine Contagious Peneuro Pneunonia.
1 2 3 4 5 6 7 8 9 10
KokrajharDhubriGoalparaBarpetaMorigaonNagaonSonitpurLakhimpurDhemajiTinsukiaDibrugarhSivasagarJorhatGolaghatKarbi AnglongDima HasaoCacharKarimganjHailakandiBongaigaonChirangKamrup(R+M)NalbariBaksaDarrangUdalguriBiswanathCharaideoHojaiMajuliSouth SalmaraW K AnglongAssam
DistrictH
ospi
tals
11110121001211004100021010000000
22
13111113
83018101216
7151811
8698
1168
231411
86000000
311
3618176921636652173227325044611620261115103424201211
000000
804
474749753466658276032
102133000000
124
32102400101000030000000002000000
19
21011131112112110111001010000000
25
32000011011100122110010101000000
20
00000011122120000000000000000000
10
6242349136
1089871355647587863793042432425207042332523
000000
1335
Dis
pens
arie
s
Sub-
Cent
re/
Firs
t Ai
dCe
ntre
/SM
CBl
ock
Vety
.D
ispe
nsar
ies
Key
Villa
geCe
ntre
*RAI
C
R.P.
Che
ckpo
st
#BC
PP C
heck
post
Tota
l
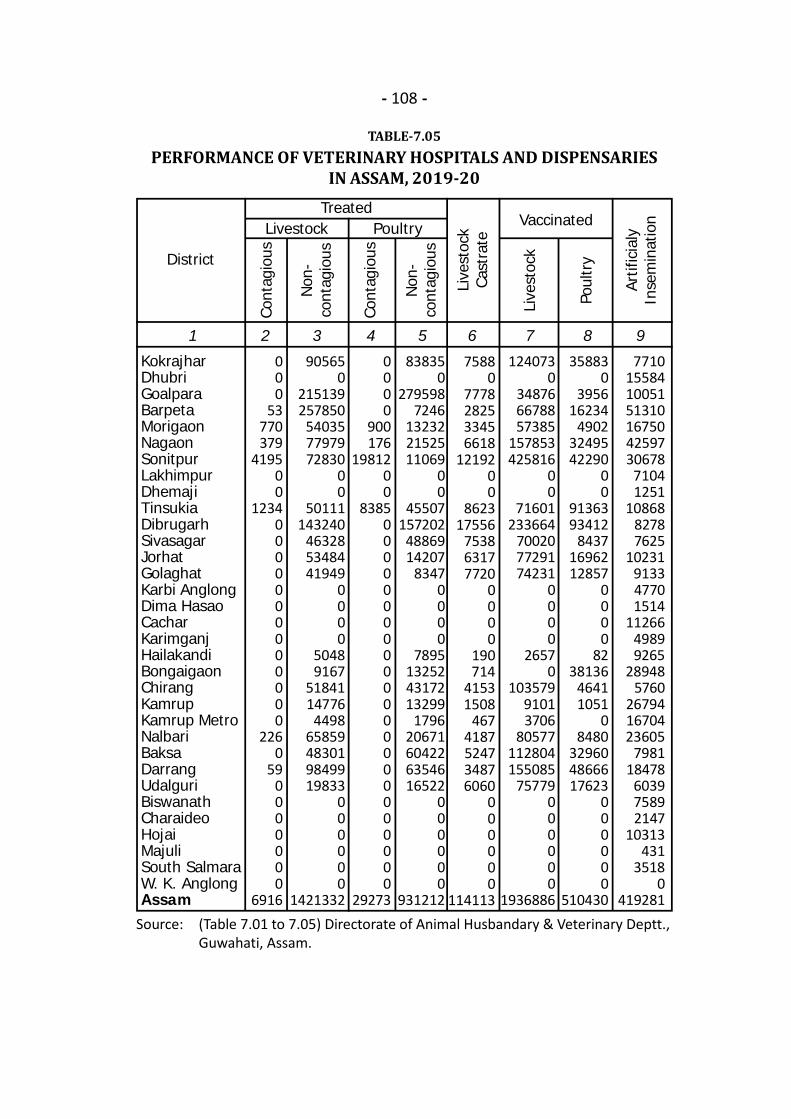
- 108 -
TABLE-7.05PERFORMANCE OF VETERINARY HOSPITALS AND DISPENSARIES
IN ASSAM, 2019-20
1 2 3 4 5 6 7 8 9
KokrajharDhubriGoalparaBarpetaMorigaonNagaonSonitpurLakhimpurDhemajiTinsukiaDibrugarhSivasagarJorhatGolaghatKarbi AnglongDima HasaoCacharKarimganjHailakandiBongaigaonChirangKamrupKamrup MetroNalbariBaksaDarrangUdalguriBiswanathCharaideoHojaiMajuliSouth SalmaraW. K. AnglongAssam
District
TreatedLivestock Poultry
Cont
agio
us
Vaccinated
000
53770379
419500
12340000000000000
2260
590000000
6916
905650
215139257850
540357797972830
00
50111143240
463285348441949
0000
50489167
5184114776
449865859483019849919833
000000
1421332
0000
900176
1981200
838500000000000000000000000
29273
838350
2795987246
132322152511069
00
455071572024886914207
83470000
7895132524317213299
179620671604226354616522
000000
931212
75880
7778282533456618
1219200
862317556
753863177720
0000
190714
41531508
4674187524734876060
000000
114113
1240730
348766678857385
157853425816
00
71601233664
700207729174231
0000
26570
10357991013706
80577112804155085
75779000000
1936886
7710155841005151310167504259730678
71041251
1086882787625
10231913347701514
1126649899265
289485760
267941670423605
798118478
603975892147
10313431
35180
419281
Non
-co
ntag
ious
Cont
agio
us
Non
-co
ntag
ious
Live
stoc
kCa
stra
te
Live
stoc
k
Poul
try
Artif
icia
lyIn
sem
inat
ion
358830
395616234
49023249542290
00
9136393412
84371696212857
0000
8238136
46411051
08480
329604866617623
000000
510430Source: (Table 7.01 to 7.05) Directorate of Animal Husbandary & Veterinary Deptt.,
Guwahati, Assam.

8.FISHERYFIGURE AT A GLANCE, 2019-20Registered Beel Fisheries (in Nos.)Area under Registered Beel Fisheries (in Hect.)Ponds and Tanks (in Nos.)Area under Ponds and Tanks (in Hect.)Area under River Fisheries (in Hect.)Area under Forest Fisheries (in Hect.)Area under Derelict Water Bodies/ Swamps (in Hect.)Area under Reservoir Fisheries (in Hect.)Nos. of Hatcheries [Govt.+Private]Production of Fish Seeds (Million Nos.) [Govt.+Private]Production of Fish (in Tonne)Registered Fish Market (in Nos.)
190361763
47540481346.00
164481.654782
919091813521
95187.99373154.45
263
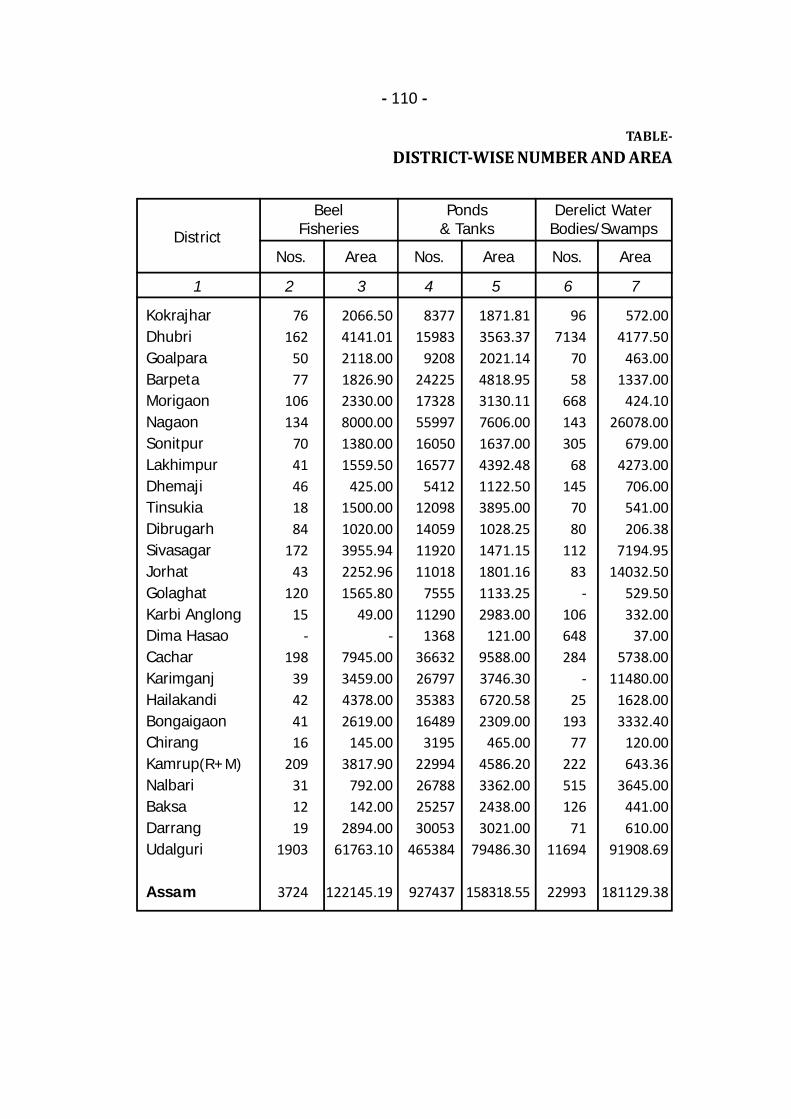
- 110 -
TABLE-DISTRICT-WISE NUMBER AND AREA
1 2 3 4 5 6 7
District
BeelFisheries
Ponds& Tanks
KokrajharDhubriGoalparaBarpetaMorigaonNagaonSonitpurLakhimpurDhemajiTinsukiaDibrugarhSivasagarJorhatGolaghatKarbi AnglongDima HasaoCacharKarimganjHailakandiBongaigaonChirangKamrup(R+M)NalbariBaksaDarrangUdalguri
Assam
76162
5077
106134
7041461884
17243
12015
-198
39424116
209311219
1903
3724
2066.504141.012118.001826.902330.008000.001380.001559.50
425.001500.001020.003955.942252.961565.80
49.00-
7945.003459.004378.002619.00
145.003817.90
792.00142.00
2894.0061763.10
122145.19
837715983
92082422517328559971605016577
541212098140591192011018
755511290
136836632267973538316489
319522994267882525730053
465384
927437
1871.813563.372021.144818.953130.117606.001637.004392.481122.503895.001028.251471.151801.161133.252983.00
121.009588.003746.306720.582309.00
465.004586.203362.002438.003021.00
79486.30
158318.55
Nos. Area Nos. Area
Derelict WaterBodies/Swamps
Nos. Area
967134
7058
668143305
68145
7080
11283
-106648284
-25
19377
222515126
7111694
22993
572.004177.50
463.001337.00
424.1026078.00
679.004273.00
706.00541.00206.38
7194.9514032.50
529.50332.00
37.005738.00
11480.001628.003332.40
120.00643.36
3645.00441.00610.00
91908.69
181129.38
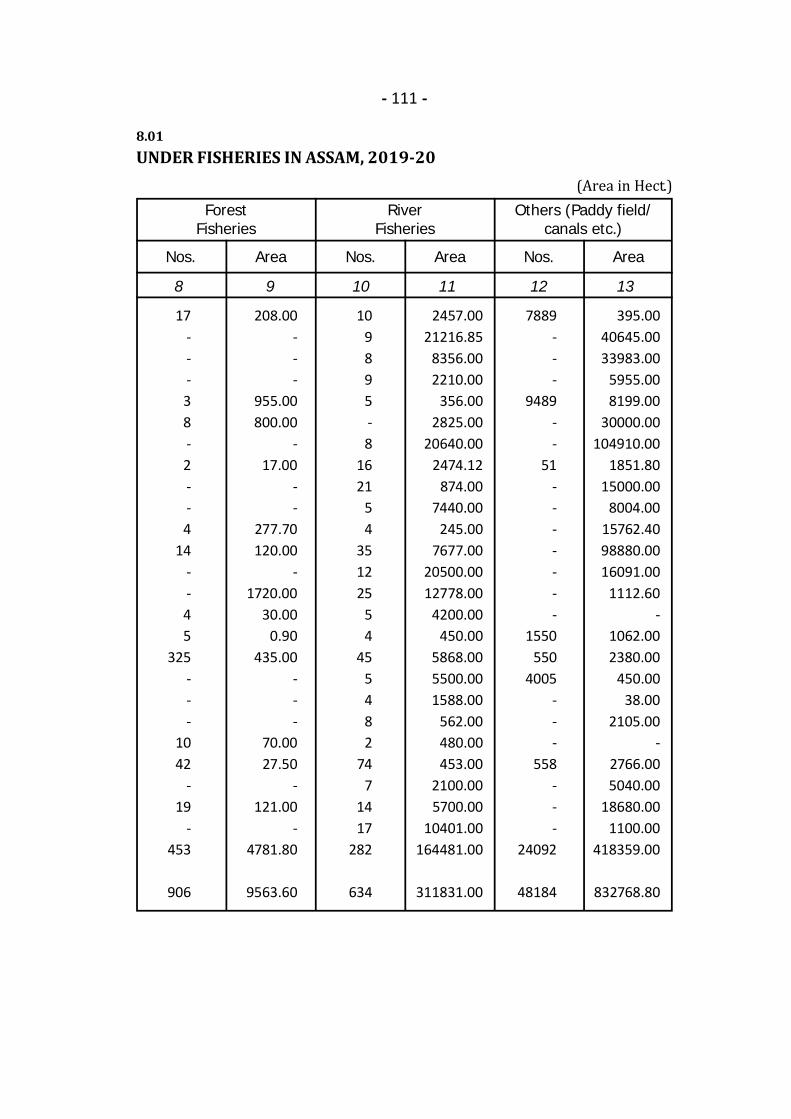
- 111 -
8.01UNDER FISHERIES IN ASSAM, 2019-20 (Area in Hect.) 8 9 10 11 12 13
ForestFisheries
17---38-2--4
14--45
325---
1042
-19
-453
906
208.00---
955.00800.00
-17.00
--
277.70120.00
-1720.00
30.000.90
435.00---
70.0027.50
-121.00
-4781.80
9563.60
Nos. Area Nos. Area
RiverFisheries
109895-8
1621
54
351225
54
455482
747
1417
282
634
2457.0021216.85
8356.002210.00
356.002825.00
20640.002474.12
874.007440.00
245.007677.00
20500.0012778.00
4200.00450.00
5868.005500.001588.00
562.00480.00453.00
2100.005700.00
10401.00164481.00
311831.00
Nos. Area
Others (Paddy field/canals etc.)
7889---
9489--
51-------
1550550
4005---
558---
24092
48184
395.0040645.0033983.00
5955.008199.00
30000.00104910.00
1851.8015000.00
8004.0015762.4098880.0016091.00
1112.60-
1062.002380.00
450.0038.00
2105.00-
2766.005040.00
18680.001100.00
418359.00
832768.80
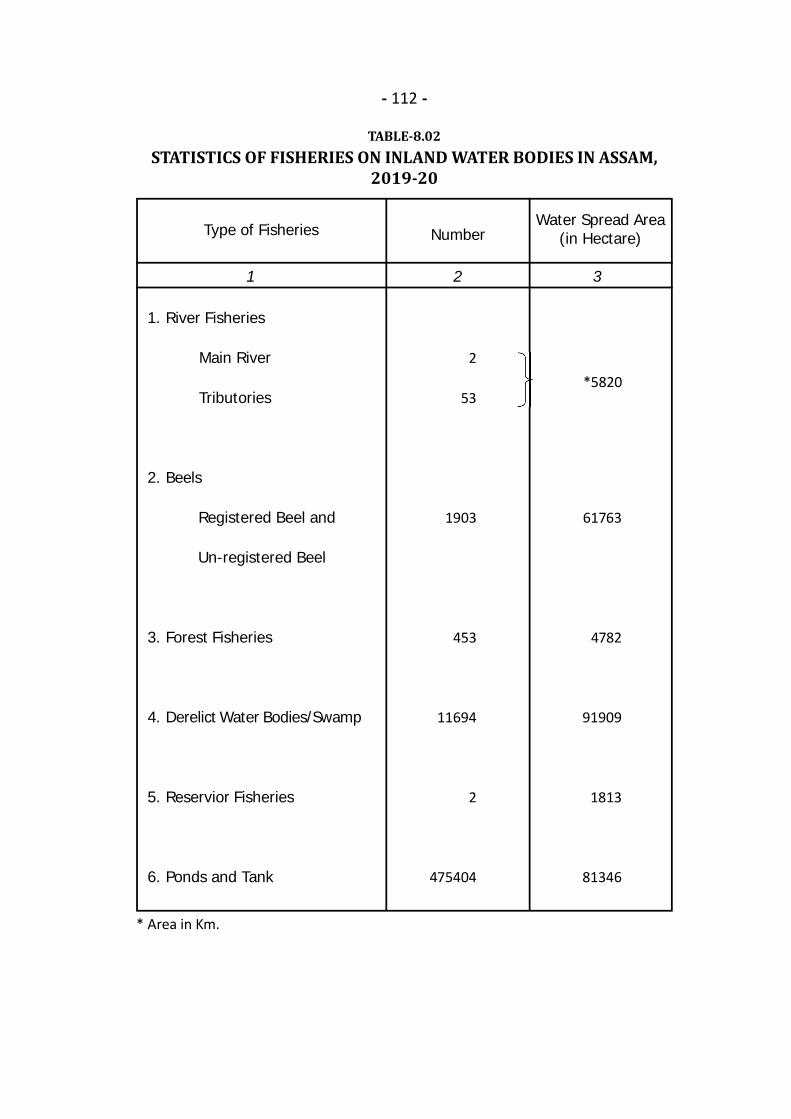
- 112 -
TABLE-8.02STATISTICS OF FISHERIES ON INLAND WATER BODIES IN ASSAM,
2019-20
* Area in Km.
1 2 3
NumberWater Spread Area
(in Hectare)Type of Fisheries
River Fisheries
Main River
Tributories
Beels
Registered Beel and
Un-registered Beel
Forest Fisheries
Derelict Water Bodies/Swamp
Reservior Fisheries
Ponds and Tank
2
53
1903
453
11694
2
475404
1.
2.
3.
4.
5.
6.
*5820
61763
4782
91909
1813
81346
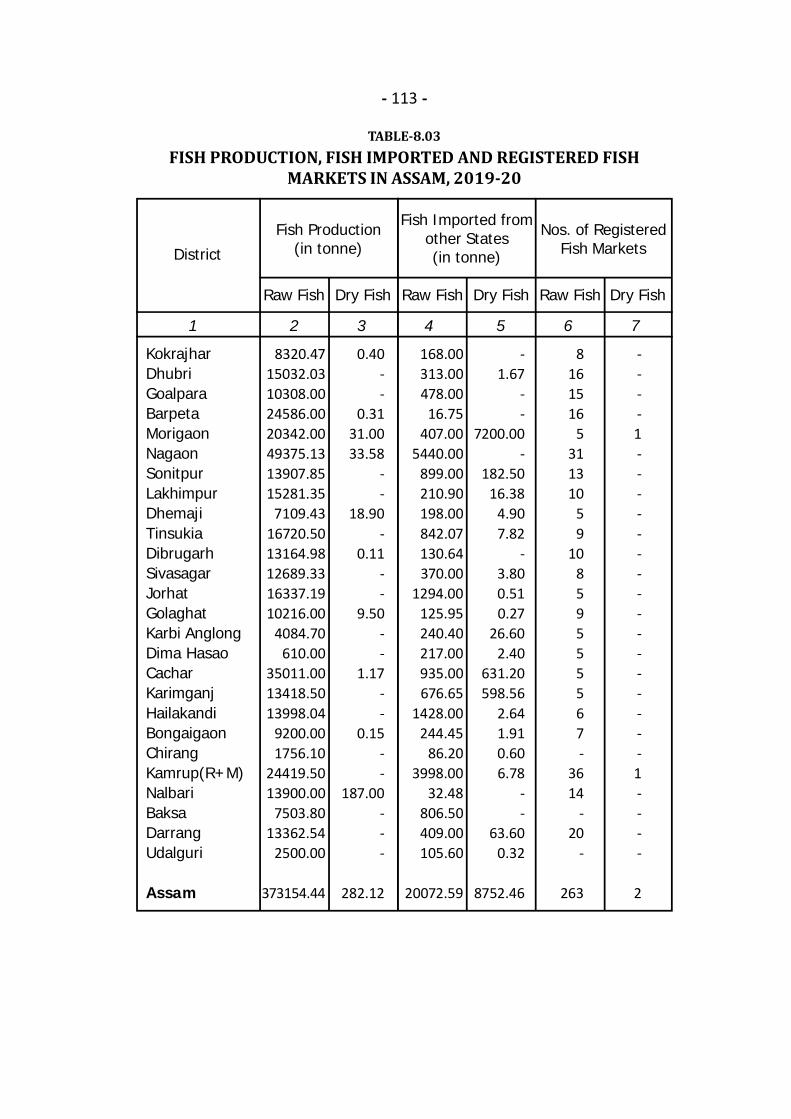
- 113 -
TABLE-8.03FISH PRODUCTION, FISH IMPORTED AND REGISTERED FISH
MARKETS IN ASSAM, 2019-20
1 2 3 4 5 6 7
KokrajharDhubriGoalparaBarpetaMorigaonNagaonSonitpurLakhimpurDhemajiTinsukiaDibrugarhSivasagarJorhatGolaghatKarbi AnglongDima HasaoCacharKarimganjHailakandiBongaigaonChirangKamrup(R+M)NalbariBaksaDarrangUdalguri
Assam
District
Fish Production(in tonne)
Fish Imported fromother States(in tonne)
Nos. of RegisteredFish Markets
8320.4715032.0310308.0024586.0020342.0049375.1313907.8515281.35
7109.4316720.5013164.9812689.3316337.1910216.00
4084.70610.00
35011.0013418.5013998.04
9200.001756.10
24419.5013900.00
7503.8013362.54
2500.00
373154.44
168.00313.00478.00
16.75407.00
5440.00899.00210.90198.00842.07130.64370.00
1294.00125.95240.40217.00935.00676.65
1428.00244.45
86.203998.00
32.48806.50409.00105.60
20072.59
8161516
5311310
59
10859555567-
3614
-20
-
263
----1----------------1----
2
Raw Fish Dry FishRaw Fish Dry FishRaw Fish Dry Fish
0.40--
0.3131.0033.58
--
18.90-
0.11--
9.50--
1.17--
0.15--
187.00---
282.12
-1.67
--
7200.00-
182.5016.38
4.907.82
-3.800.510.27
26.602.40
631.20598.56
2.641.910.606.78
--
63.600.32
8752.46
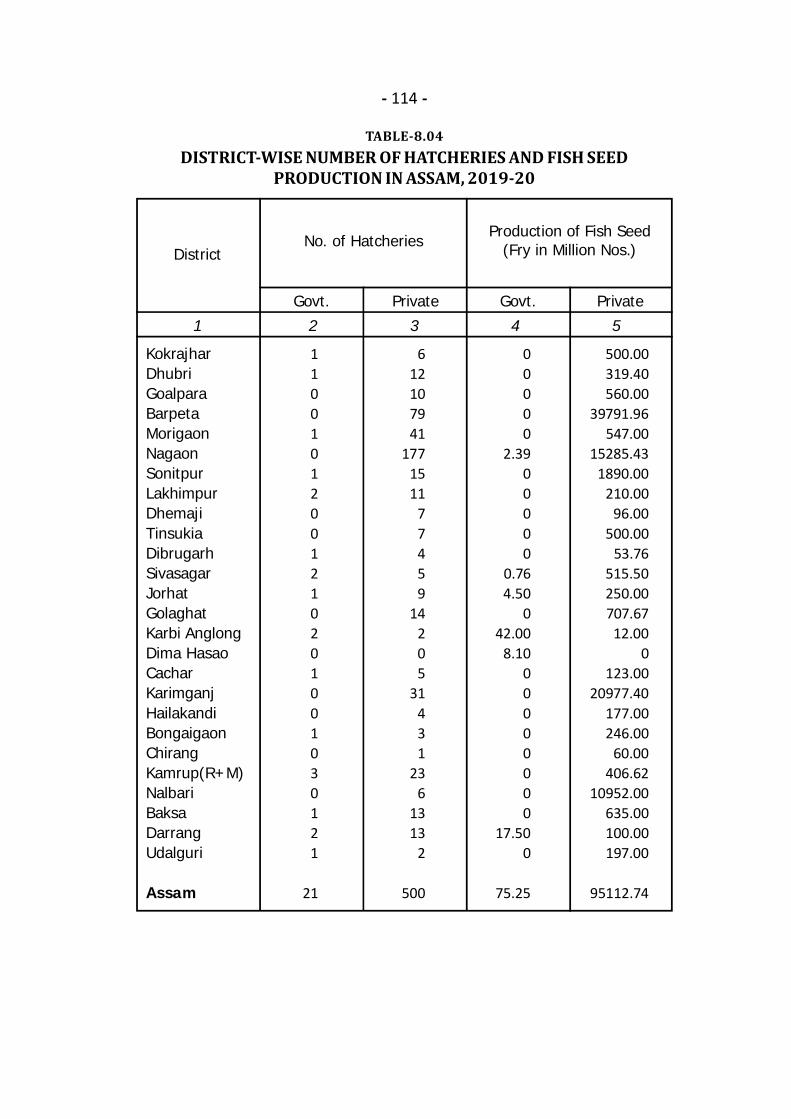
- 114 -
TABLE-8.04DISTRICT-WISE NUMBER OF HATCHERIES AND FISH SEED
PRODUCTION IN ASSAM, 2019-20
1 2 3 4 5
KokrajharDhubriGoalparaBarpetaMorigaonNagaonSonitpurLakhimpurDhemajiTinsukiaDibrugarhSivasagarJorhatGolaghatKarbi AnglongDima HasaoCacharKarimganjHailakandiBongaigaonChirangKamrup(R+M)NalbariBaksaDarrangUdalguri
Assam
DistrictNo. of Hatcheries
Production of Fish Seed(Fry in Million Nos.)
11001012001210201001030121
21
612107941
1771511
77459
14205
31431
236
1313
2
500
00000
2.3900000
0.764.50
042.00
8.1000000000
17.500
75.25
500.00319.40560.00
39791.96547.00
15285.431890.00
210.0096.00
500.0053.76
515.50250.00707.67
12.000
123.0020977.40
177.00246.00
60.00406.62
10952.00635.00100.00197.00
95112.74
Govt. PrivatePrivateGovt.
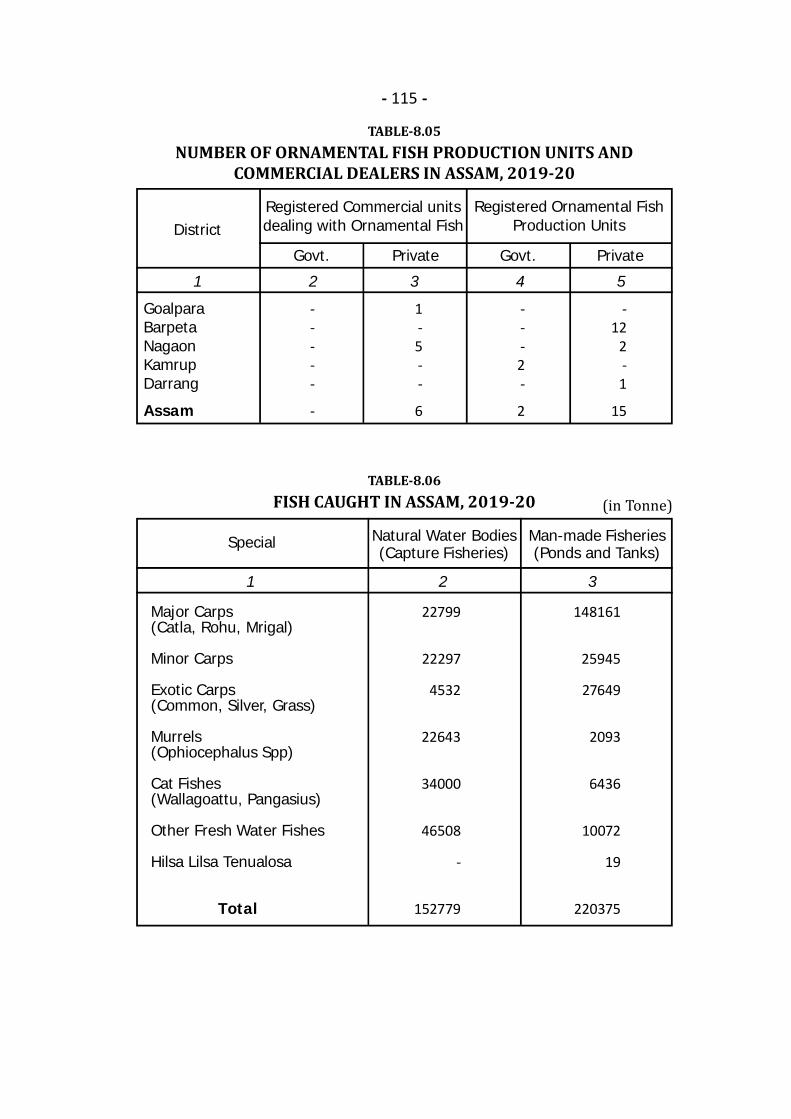
- 115 -
TABLE-8.05NUMBER OF ORNAMENTAL FISH PRODUCTION UNITS AND
COMMERCIAL DEALERS IN ASSAM, 2019-20
1 2 3 4 5
GoalparaBarpetaNagaonKamrupDarrang
Assam
DistrictRegistered Ornamental Fish
Production Units
-----
-
1-5--
6
---2-
2
-12
2-1
15
Govt. Private
Registered Commercial unitsdealing with Ornamental Fish
Govt. Private
TABLE-8.06FISH CAUGHT IN ASSAM, 2019-20
1 2 3
Major Carps(Catla, Rohu, Mrigal)
Minor Carps
Exotic Carps(Common, Silver, Grass)
Murrels(Ophiocephalus Spp)
Cat Fishes(Wallagoattu, Pangasius)
Other Fresh Water Fishes
Hilsa Lilsa Tenualosa
Total
Special Natural Water Bodies(Capture Fisheries)
Man-made Fisheries(Ponds and Tanks)
(in Tonne)22799
22297
4532
22643
34000
46508
-
152779
148161
25945
27649
2093
6436
10072
19
220375
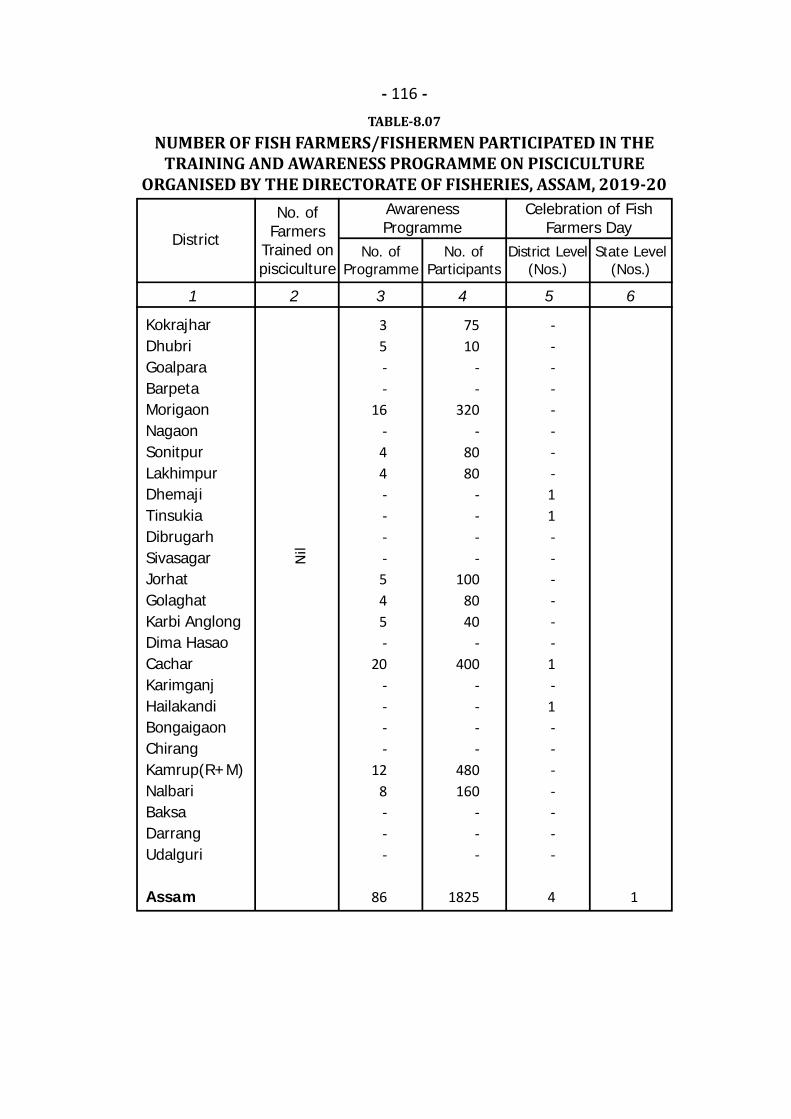
- 116 -TABLE-8.07
NUMBER OF FISH FARMERS/FISHERMEN PARTICIPATED IN THETRAINING AND AWARENESS PROGRAMME ON PISCICULTURE
ORGANISED BY THE DIRECTORATE OF FISHERIES, ASSAM, 2019-20
1 2 3 4 5 6
District
AwarenessProgramme
Celebration of FishFarmers Day
KokrajharDhubriGoalparaBarpetaMorigaonNagaonSonitpurLakhimpurDhemajiTinsukiaDibrugarhSivasagarJorhatGolaghatKarbi AnglongDima HasaoCacharKarimganjHailakandiBongaigaonChirangKamrup(R+M)NalbariBaksaDarrangUdalguri
Assam
Nil
1
No. ofFarmers
Trained onpisciculture
No. ofProgramme
No. ofParticipants
District Level(Nos.)
State Level(Nos.)
35--
16-44----545-
20----
128---
86
7510
--
320-
8080
----
1008040
-400
----
480160
---
1825
--------11------1-1-------
4

- 117 -
TABLE-8.08PRIVATE FISHERIES AND GOVT. FINANCIAL ASSISTANCE RECEIVED,
2019-20
1 2 3 4 5 6
KokrajharDhubriGoalparaBarpetaMorigaonNagaonSonitpurLakhimpurDhemajiTinsukiaDibrugarhSivasagarJorhatGolaghatKarbi AnglongDima HasaoCacharKarimganjHailakandiBongaigaonChirangKamrup (R+M)NalbariBaksaDarrangUdalguriBiswanathCharaideoHojai
Assam
District IndividualPond
Commu-nity SHG
Benefi-ciary of
BeelFisheries
124333309691498568816286258239268437421233230
7561432194292187420505220614297
000
9440
1004704115551346210935232591641028453209212119792887321322700353
687141153744887691911
1321418125449698166763574814871
8190003180304511390155
563701891276123233515
3008169825053600
928198217213580
3485886000
401067082
39136134444302293424
79225154112276220158147
0367300108122110232295112468550
000
5807
3355
0132
699
1100
111
110
440
660
1342
55881133
044
11088
000
1133
000
100
3020
020
0000000
1000
3000
101010
0000
150
No. of Fishers benefited
No. ofFisheries
Amount ofFinancial
Assistancereceived(in Rs.)

- 118 -
TABLE-8.09DISTRICT-WISE REQUIREMENT OF FISH IN ASSAM
1 2 3 4
KokrajharDhubriGoalparaBarpetaMorigaonNagaonSonitpurLakhimpurDhemajiTinsukiaDibrugarhSivasagarJorhatGolaghatKarbi AnglongDima HasaoCacharKarimganjHailakandiBongaigaonChirangKamrup(R+M)NalbariBaksaDarrangUdalguri
Assam
DistrictPer capita
Consumption2019-20
910805522845020116711981944564611136796325552152122872411625317
7802707146409671427420512166693115372181154568810697324
23362571977591014165525
756983784363295164005
308835018304494
1015433110719346
8803003
348593311
998782825529940130199642166740412432312362961122351986812900300
8682288162195241575872413397520127031161275651611875200
25843202200951215793272
843472893928445697120
342655209168168
1119931211953428
9695460
386940300
11.1
2
Requirement(District wise per annum)
(in Kg.)2018-19 2019-20
Source: (Table 8.01 to 8.09) Directorate of Fisheries, Assam.
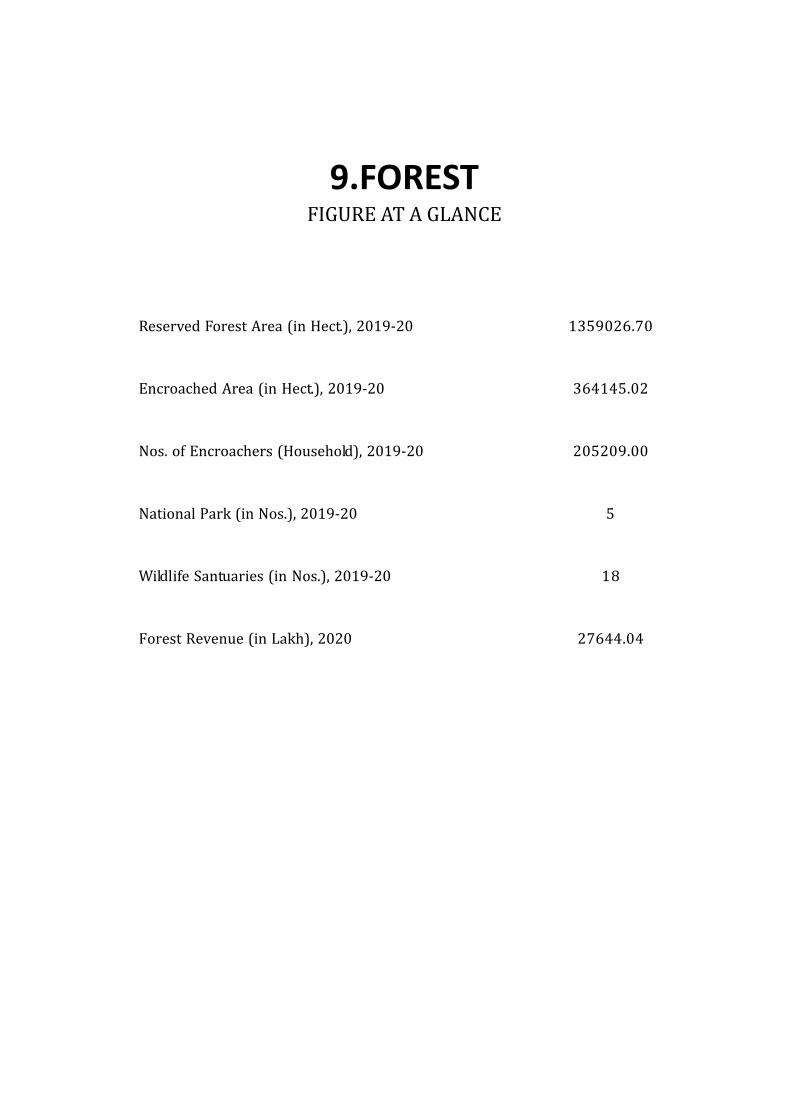
9.FORESTFIGURE AT A GLANCEReserved Forest Area (in Hect.), 2019-20Encroached Area (in Hect.), 2019-20Nos. of Encroachers (Household), 2019-20National Park (in Nos.), 2019-20Wildlife Santuaries (in Nos.), 2019-20Forest Revenue (in Lakh), 2020
1359026.70364145.02205209.00
518
27644.04

- 120 -
TABLE-9.01FOREST DIVISION WISE AREA UNDER RESERVED FORESTS &
ENCROACHMENT IN ASSAM, 2019-20 (Area in Hect.)
Contd...
1 2 3 4 5
Sl.No.
ReservedForest Area
EncroachedForest Area
Nos. ofEncroachers inForest Areas(Household)
ForestDivision
1
2
3
4
5
6
7
8
9
10
11
12
13
14
15
16
17
18
Goalpara
Kamrup East
Kamrup West
North Kamrup
Dibrugarh
Digboi
Doom Dooma
Golaghat
Jorhat
Sivasagar
Hamren
Karbi-Anglong East
Karbi-Anglong West
Dima Hasao
Baksa
Lakhimpur
Dhemaji
Nagaon
25249.66
35329.55
68133.89
4518.61
21794.65
55714.65
30904.35
94078.87
25037.15
24085.99
10268.00
48033.95
89371.66
132633.60
13323.33
31096.55
49553.45
33640.78
5798.25
6384.90
21069.00
132.30
1445.97
2272.10
9344.80
87213.46
18651.29
9788.00
6282.32
4635.51
1273.00
810.16
6686.00
6856.87
31001.50
3668.50
3668.00
15546.00
2450.00
882.00
0.00
665.00
2306.00
39243.00
1765.00
3319.00
0
2035.00
0
2674.00
4142.00
2683.00
13072.00
486.00
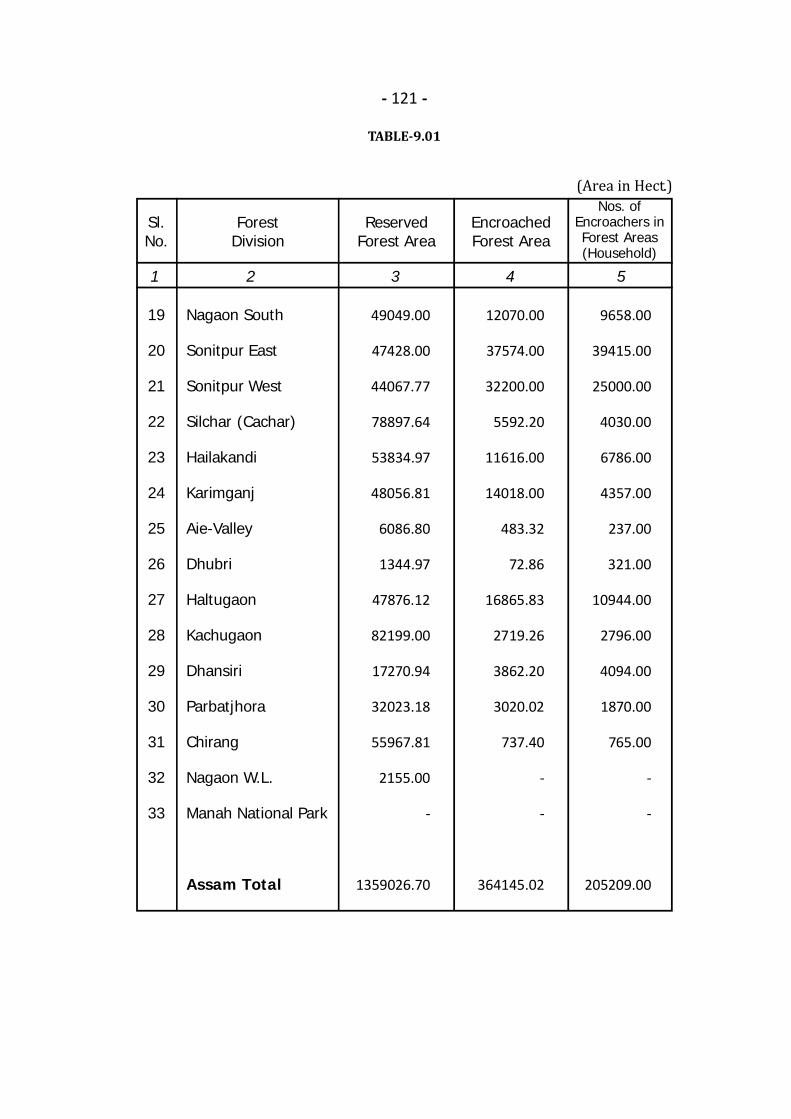
- 121 -
TABLE-9.01
(Area in Hect.)Sl.No.
19
20
21
22
23
24
25
26
27
28
29
30
31
32
33
Nagaon South
Sonitpur East
Sonitpur West
Silchar (Cachar)
Hailakandi
Karimganj
Aie-Valley
Dhubri
Haltugaon
Kachugaon
Dhansiri
Parbatjhora
Chirang
Nagaon W.L.
Manah National Park
Assam Total
1 2 3 4 5
ReservedForest Area
EncroachedForest Area
Nos. ofEncroachers inForest Areas(Household)
ForestDivision
49049.00
47428.00
44067.77
78897.64
53834.97
48056.81
6086.80
1344.97
47876.12
82199.00
17270.94
32023.18
55967.81
2155.00
-
1359026.70
12070.00
37574.00
32200.00
5592.20
11616.00
14018.00
483.32
72.86
16865.83
2719.26
3862.20
3020.02
737.40
-
-
364145.02
9658.00
39415.00
25000.00
4030.00
6786.00
4357.00
237.00
321.00
10944.00
2796.00
4094.00
1870.00
765.00
-
-
205209.00

- 122 -
TABLE-9.02VISITORS AND REVENUE COLLECTION FROM ASSAM STATE
ZOO-CUM-BOTANICAL GARDEN
No. of Visitors:
1. Indian
2. Foreigner
3. Total
Revenue Collected (in Rs.)
Revenue collected
279945
86
280031
21226923
719998
294
720292
22323327
751065
306
751371
22197791
1 2 3 4
Item 2017-18 2019-202018-19
TABLE-9.03NUMBER OF TOURISTS VISITED DIFFERENT NATIONAL PARKS
DURING THE YEAR, 2019-20
Name of National ParksDomesticTourists(in nos.)
Total Tourists(in nos.)
Foreign Tourists(in nos.)
1. Kaziranga National Park
2. Manas National Park
3. Nameri national Park
4. Dibru Sikhowa National Park
5. Orang (Rajib Gandhi National Park
162418
44422
9137
923
3434
174013
45143
9891
938
3487
11595
721
754
15
53
1 2 3 4
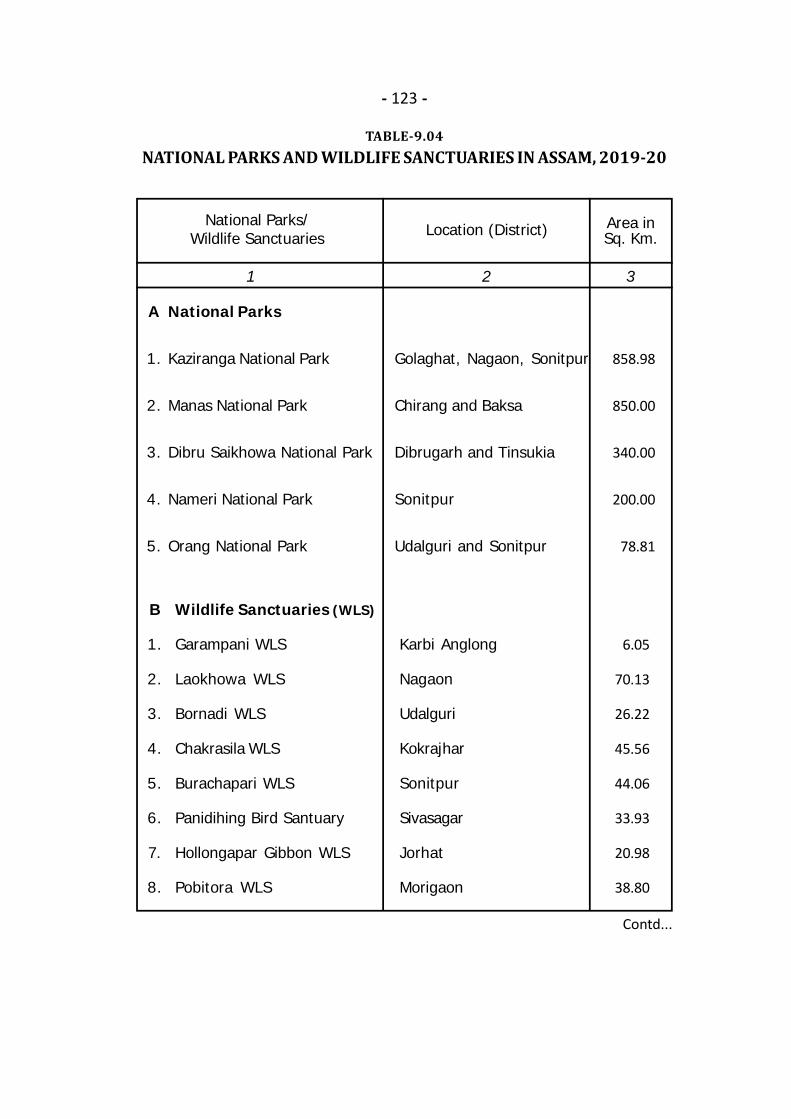
- 123 -
TABLE-9.04NATIONAL PARKS AND WILDLIFE SANCTUARIES IN ASSAM, 2019-20
Contd...
1 2 3
National Parks
Kaziranga National Park
Manas National Park
Dibru Saikhowa National Park
Nameri National Park
Orang National Park
Golaghat, Nagaon, Sonitpur
Chirang and Baksa
Dibrugarh and Tinsukia
Sonitpur
Udalguri and Sonitpur
858.98
850.00
340.00
200.00
78.81
A
1.
2.
3.
4.
5.
National Parks/Wildlife Sanctuaries Location (District) Area in
Sq. Km.
Karbi Anglong
Nagaon
Udalguri
Kokrajhar
Sonitpur
Sivasagar
Jorhat
Morigaon
B
1.
2.
3.
4.
5.
6.
7.
8.
Wildlife Sanctuaries (WLS)
Garampani WLS
Laokhowa WLS
Bornadi WLS
Chakrasila WLS
Burachapari WLS
Panidihing Bird Santuary
Hollongapar Gibbon WLS
Pobitora WLS
6.05
70.13
26.22
45.56
44.06
33.93
20.98
38.80
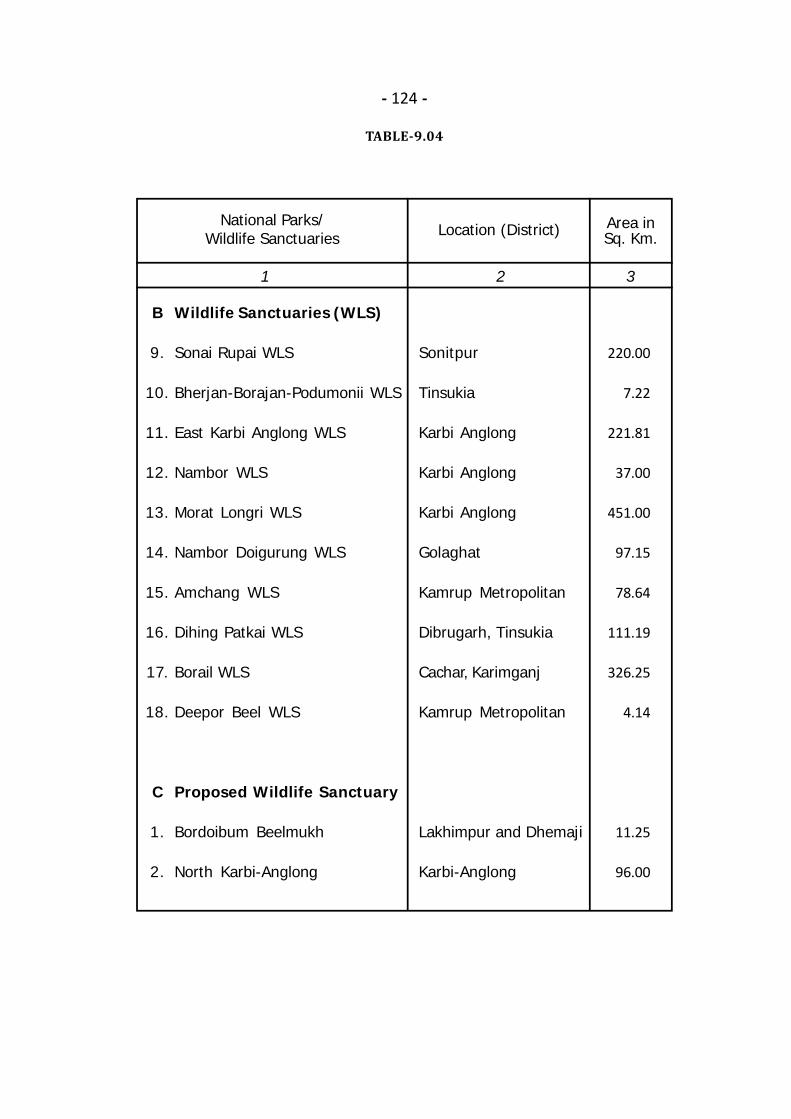
- 124 -
TABLE-9.04
1 2 3
Wildlife Sanctuaries (WLS)
Sonai Rupai WLS
Bherjan-Borajan-Podumonii WLS
East Karbi Anglong WLS
Nambor WLS
Morat Longri WLS
Nambor Doigurung WLS
Amchang WLS
Dihing Patkai WLS
Borail WLS
Deepor Beel WLS
Proposed Wildlife Sanctuary
Bordoibum Beelmukh
North Karbi-Anglong
Sonitpur
Tinsukia
Karbi Anglong
Karbi Anglong
Karbi Anglong
Golaghat
Kamrup Metropolitan
Dibrugarh, Tinsukia
Cachar, Karimganj
Kamrup Metropolitan
Lakhimpur and Dhemaji
Karbi-Anglong
220.00
7.22
221.81
37.00
451.00
97.15
78.64
111.19
326.25
4.14
11.25
96.00
B
9.
10.
11.
12.
13.
14.
15.
16.
17.
18.
C
1.
2.
National Parks/Wildlife Sanctuaries Location (District) Area in
Sq. Km.

- 125 -
TABLE-9.05CENSUS OF WILDLIFE IN ASSAM
1 2 3
ELEPHANT
TIGER
RHINO
LEOPARD
SWAMP DEER
PRIMATE CENSUS, 2009
Rhesus MacaqueAssamese MacaquePig Tailed MacaqueStump Tailed MacaqueSlow LorisCapped LangurGolden LangurPhayre’s leaf Monkey/Spectacled LangurHoolock Gibbon
5719Not DoneNot Done
Not DoneReport awaited
Not Done
Not Done2650
Not Done
Not DoneNot DoneNot Done
Not Done1007
Not Done
7267430866
649648431
178132772132
1517
1.
2.
3.
4.
5.
Year of Census Numbers as perEstimationCategory
201720182019
201720182019
201720182019
201720182019
201720182019
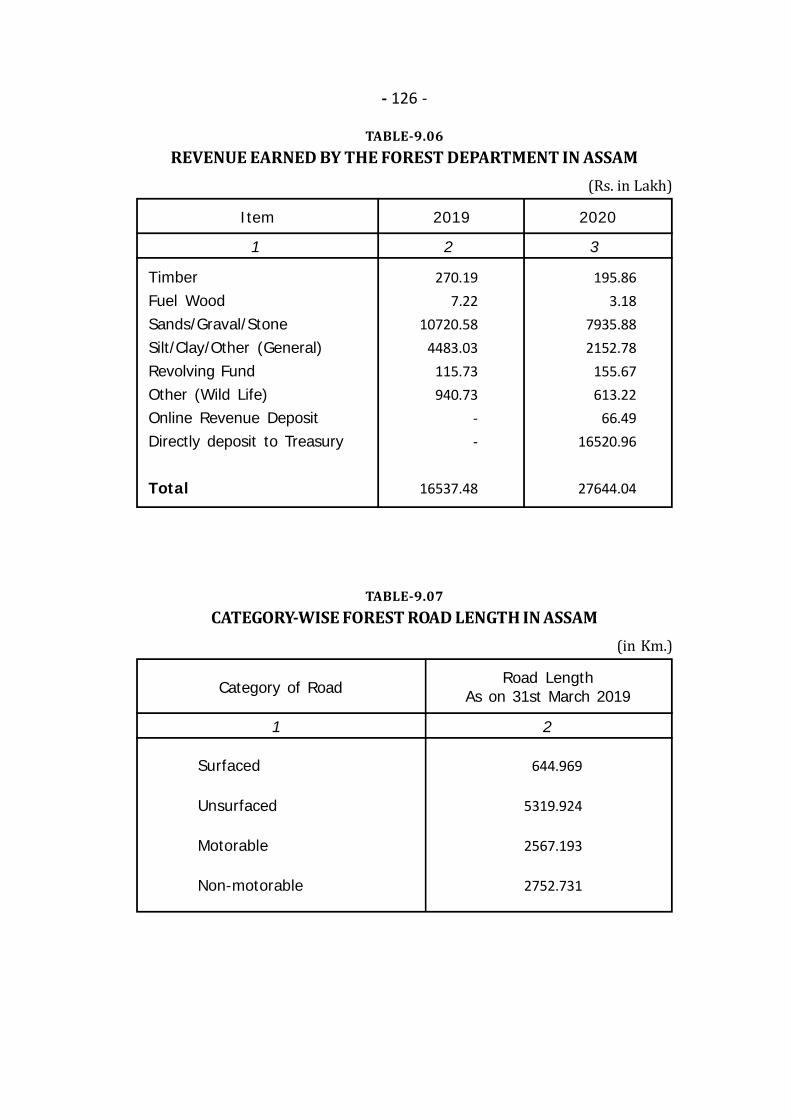
- 126 -
TABLE-9.06REVENUE EARNED BY THE FOREST DEPARTMENT IN ASSAM
TimberFuel WoodSands/Graval/StoneSilt/Clay/Other (General)Revolving FundOther (Wild Life)Online Revenue DepositDirectly deposit to Treasury
Total
270.197.22
10720.584483.03
115.73940.73
--
16537.48
195.863.18
7935.882152.78
155.67613.22
66.4916520.96
27644.04
1 2 3
Item 2019 2020
TABLE-9.07CATEGORY-WISE FOREST ROAD LENGTH IN ASSAM
Surfaced
Unsurfaced
Motorable
Non-motorable
644.969
5319.924
2567.193
2752.731
1 2
Category of RoadRoad Length
As on 31st March 2019
(Rs. in Lakh)
(in Km.)
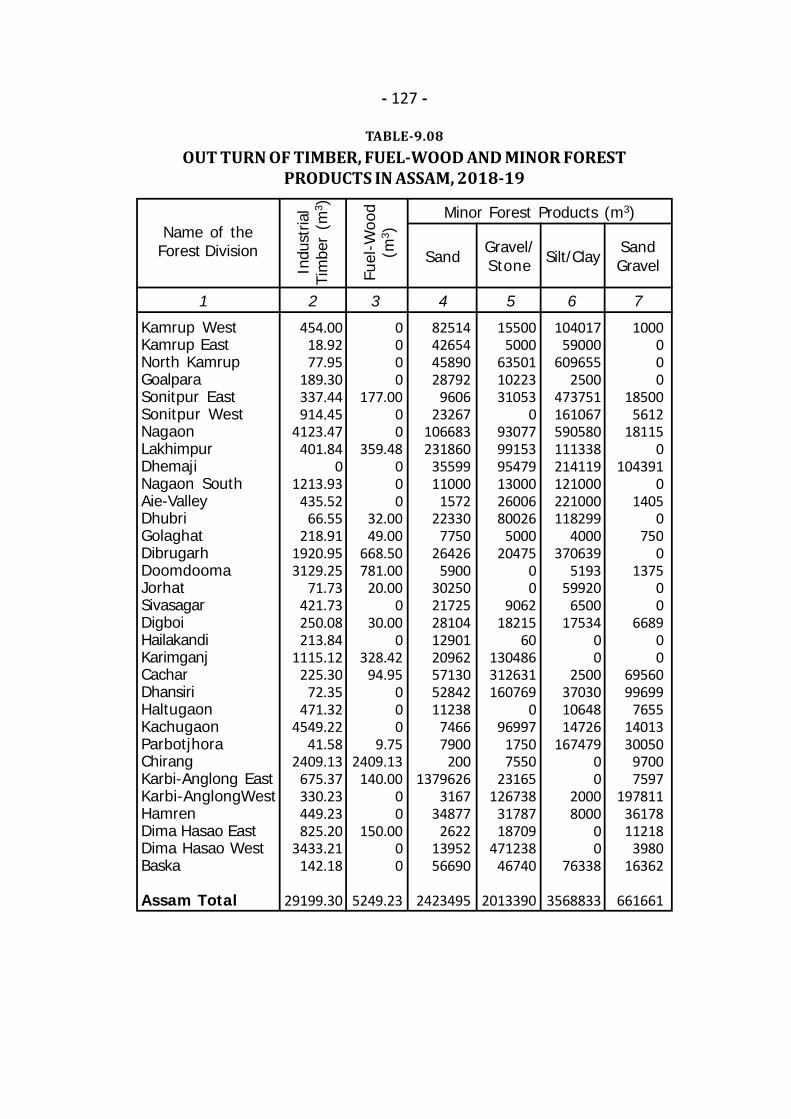
- 127 -
TABLE-9.08OUT TURN OF TIMBER, FUEL-WOOD AND MINOR FOREST
PRODUCTS IN ASSAM, 2018-19
1 2 3 4 5 6 7
Kamrup WestKamrup EastNorth KamrupGoalparaSonitpur EastSonitpur WestNagaonLakhimpurDhemajiNagaon SouthAie-ValleyDhubriGolaghatDibrugarhDoomdoomaJorhatSivasagarDigboiHailakandiKarimganjCacharDhansiriHaltugaonKachugaonParbotjhoraChirangKarbi-Anglong EastKarbi-AnglongWestHamrenDima Hasao EastDima Hasao WestBaska
Assam Total
Name of theForest Division
Indu
stria
lTi
mbe
r (m
3 )
Fuel
-Woo
d(m
3 )
SandGravel/Stone Silt/Clay
SandGravel
454.0018.9277.95
189.30337.44914.45
4123.47401.84
01213.93
435.5266.55
218.911920.953129.25
71.73421.73250.08213.84
1115.12225.30
72.35471.32
4549.2241.58
2409.13675.37330.23449.23825.20
3433.21142.18
29199.30
0000
177.0000
359.48000
32.0049.00
668.50781.00
20.000
30.000
328.4294.95
000
9.752409.13
140.0000
150.0000
5249.23
82514426544589028792
960623267
106683231860
3559911000
157222330
775026426
59003025021725281041290120962571305284211238
74667900
2001379626
316734877
26221395256690
2423495
155005000
635011022331053
0930779915395479130002600680026
500020475
00
906218215
60130486312631160769
096997
17507550
23165126738
3178718709
47123846740
2013390
10401759000
6096552500
473751161067590580111338214119121000221000118299
4000370639
519359920
650017534
00
2500370301064814726
16747900
20008000
00
76338
3568833
1000000
185005612
181150
1043910
14050
7500
137500
668900
6956099699
76551401330050
97007597
1978113617811218
398016362
661661
Minor Forest Products (m3)
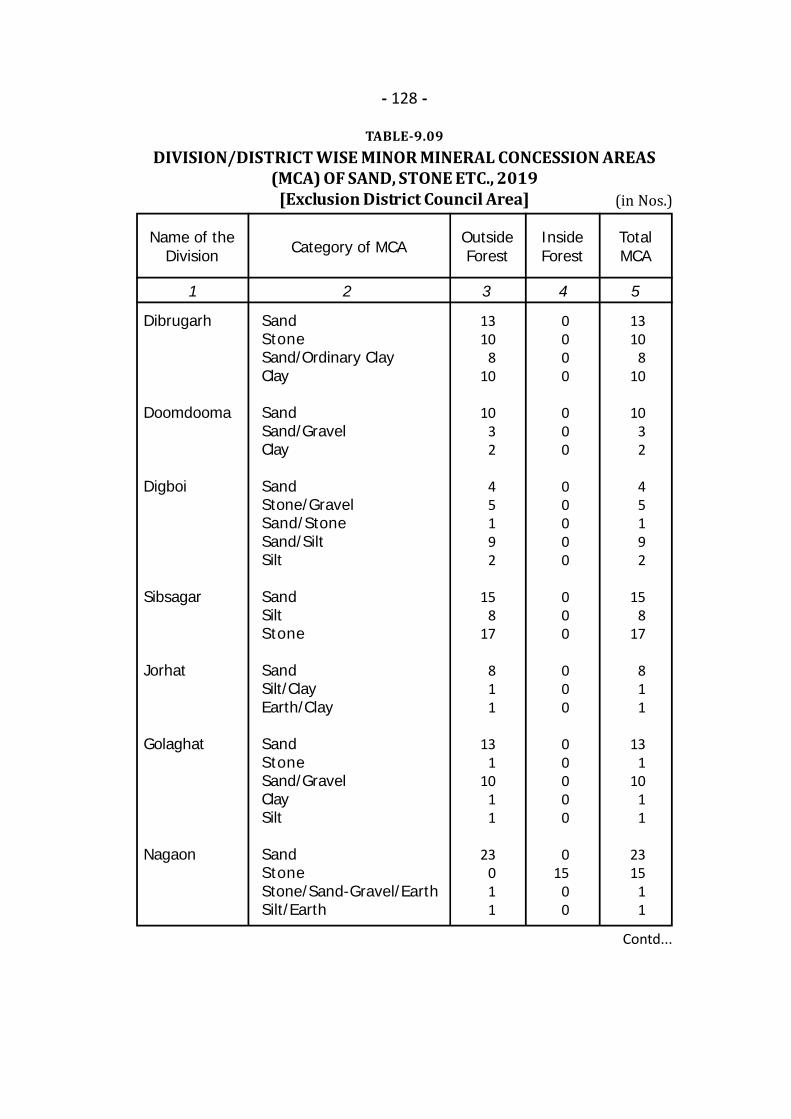
- 128 -
TABLE-9.09DIVISION/DISTRICT WISE MINOR MINERAL CONCESSION AREAS
(MCA) OF SAND, STONE ETC., 2019[Exclusion District Council Area] (in Nos.)
Contd...
1 2 3 4 5
OutsideForest
InsideForest
Name of theDivision
Dibrugarh
Doomdooma
Digboi
Sibsagar
Jorhat
Golaghat
Nagaon
1310
810
1032
45192
158
17
811
131
1011
23011
0000
000
00000
000
000
00000
015
00
1310
810
1032
45192
158
17
811
131
1011
2315
11
TotalMCACategory of MCA
SandStoneSand/Ordinary ClayClay
SandSand/GravelClay
SandStone/GravelSand/StoneSand/SiltSilt
SandSiltStone
SandSilt/ClayEarth/Clay
SandStoneSand/GravelClaySilt
SandStoneStone/Sand-Gravel/EarthSilt/Earth

- 129 -
TABLE-9.09
(in Nos.)
Contd...
1 2 3 4 5
OutsideForest
InsideForest
Name of theDivision
Nagaon South
Sonitpur East
Sonitpur West
Lakhimpur
Dhemaji
Kamrup East
SandStoneSand/Gravel
SandSand/EarthSand/GravelSand/Gravel/BoulderBoulder/Gravel/EarthOrdinary EarthEarth
Sand/GravelSand/Gravel/EarthEarthSilt/EarthSilt
Sand/GravelSand/Gravel/BoulderSand/Gravel/Earth
Sand/StoneSand/GravelEarthOrdinary Clay/EarthSand
SandStone
800
31
112171
15321
813
410
471
61
031
0000000
00000
200
03000
014
831
31
112171
15321
1013
413
471
615
TotalMCACategory of MCA

- 130 -
TABLE-9.09
(in Nos.) 1 2 3 4 5
OutsideForest
InsideForest
Name of theDivision
Kamrup West
North Kamrup
Goalpara
Cachar
Karimganj
Hailakandi
Aie Valley
Dhubri
TOTAL
SandStoneSand/Gravel
StoneSand/StoneSandSilt/Clay
SandOrdinary ClayStone
StoneSand
SandStone
Sand
StoneSand/GravelSandSilt/Ordinary Earth
SandStoneSand/GravelOrdinary Clay
1621
2934
1210
79
1512
10
4212
2034
390
200
5000
001
00
01
0
0000
0400
51
1821
7934
1211
79
1513
10
4212
2434
441
TotalMCACategory of MCA
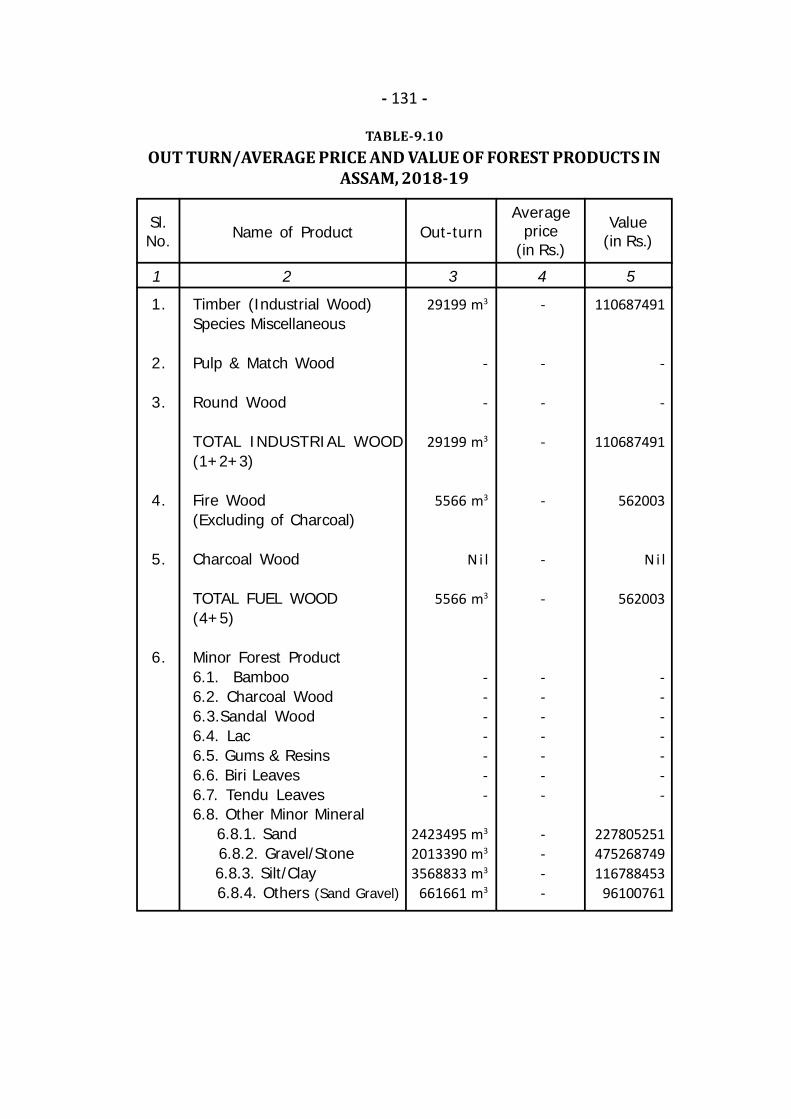
- 131 -
TABLE-9.10OUT TURN/AVERAGE PRICE AND VALUE OF FOREST PRODUCTS IN
ASSAM, 2018-19
1 2 3 4 5
Out-turnAverage
price(in Rs.)
Sl.No.
1.
2.
3.
4.
5.
6.
Timber (Industrial Wood)Species Miscellaneous
Pulp & Match Wood
Round Wood
TOTAL INDUSTRIAL WOOD(1+2+3)
Fire Wood(Excluding of Charcoal)
Charcoal Wood
TOTAL FUEL WOOD(4+5)
Minor Forest Product6.1. Bamboo6.2. Charcoal Wood6.3.Sandal Wood6.4. Lac6.5. Gums & Resins6.6. Biri Leaves6.7. Tendu Leaves6.8. Other Minor Mineral 6.8.1. Sand 6.8.2. Gravel/Stone 6.8.3. Silt/Clay 6.8.4. Others (Sand Gravel)
29199 m3
-
-
29199 m3
5566 m3
N i l
5566 m3
-------
2423495 m3
2013390 m3
3568833 m3
661661 m3
Value(in Rs.)Name of Product
-
-
-
-
-
-
-
-------
----
110687491
-
-
110687491
562003
N i l
562003
-------
227805251475268749116788453
96100761

- 132 -
TABLE-9.11FOREST/DIVISION WISE NOS. OF FOREST NURSERY AND NOS. OF
SAPLING DISTRIBUTED
.
1 2 3 4 5 6 7
Guwahati
Silchar
Karimganj
Nalbari
Barpeta
Bongaigaon
Goalpara
Nagaon
Golaghat
Sivasagar
Dibrugarh
Lakhimpur
Sonitpur
Kokrajhar
Assam
Name ofSF Division Nos. of
NurseryArea
(in Hect.)
SaplingDistributedcum sold
Nos. ofNursery
Area(in Hect.)
SaplingDistributedcum sold
5
4
3
4
3
3
3
4
5
3
3
3
3
2
48
2017-18 2018-19
7.0
5.5
4.5
5.5
4.5
4.5
4.5
5.5
7.0
4.5
4.0
4.0
4.5
3.0
68.5
139352
560000
144000
362241
209670
458200
310452
1047637
271069
323963
300744
206054
168139
-
4501521
5
4
3
4
3
3
3
4
5
3
3
3
3
2
48
7.0
5.5
4.5
5.5
4.5
4.5
4.5
5.5
7.0
4.5
4.0
4.0
4.5
3.0
68.5
897346
990100
808789
285201
346909
685971
1151694
2131554
463102
567101
510069
259619
410263
-
9507718
Source: (Table 9.01 to 9.11) O/o the Principal Chief Conservator of Forests& Head, Forest Force, Assam.
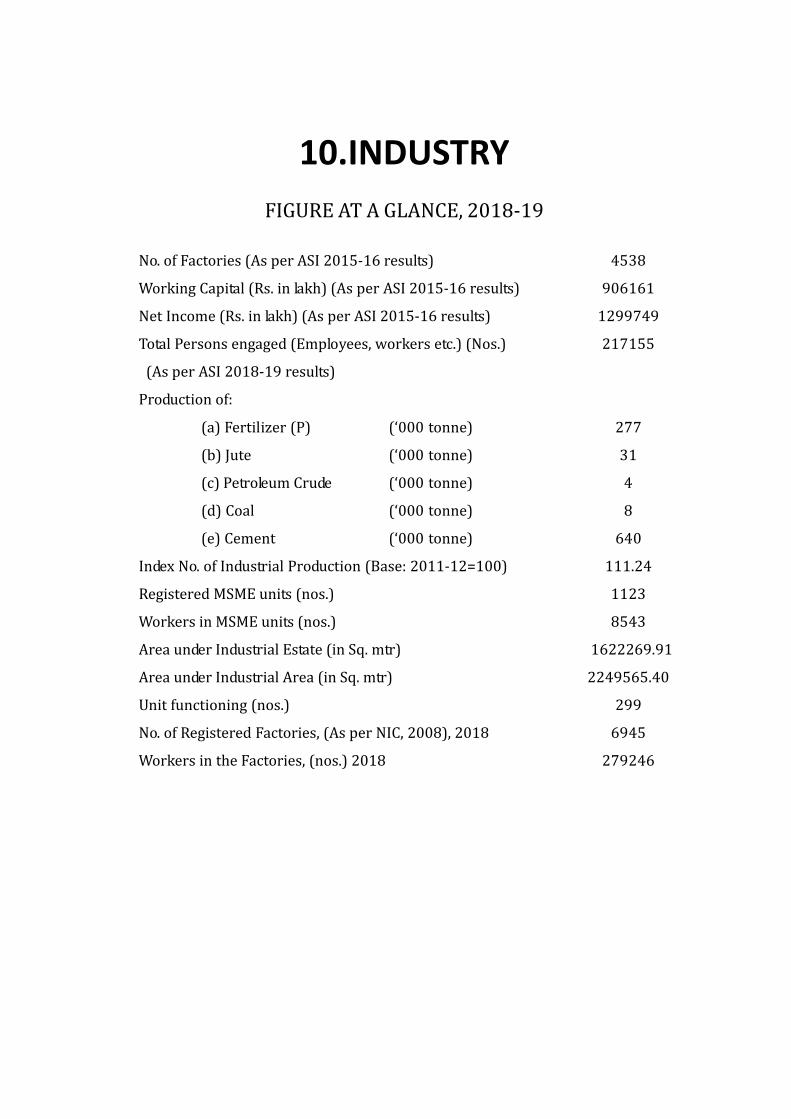
10.INDUSTRYFIGURE AT A GLANCE, 2018-19No. of Factories (As per ASI 2015-16 results)Working Capital (Rs. in lakh) (As per ASI 2015-16 results)Net Income (Rs. in lakh) (As per ASI 2015-16 results)Total Persons engaged (Employees, workers etc.) (Nos.) (As per ASI 2018-19 results)Production of:(a) Fertilizer (P) (‘000 tonne)(b) Jute (‘000 tonne)(c) Petroleum Crude (‘000 tonne)(d) Coal (‘000 tonne)(e) Cement (‘000 tonne)Index No. of Industrial Production (Base: 2011-12=100)Registered MSME units (nos.)Workers in MSME units (nos.)Area under Industrial Estate (in Sq. mtr)Area under Industrial Area (in Sq. mtr)Unit functioning (nos.)No. of Registered Factories, (As per NIC, 2008), 2018Workers in the Factories, (nos.) 2018
453890616112997492171552773148640111.24112385431622269.912249565.402996945279246

- 134 -
TABLE-INDEX OF INDUSTRIAL
(Base:
NIC= National Industrial Classification.Source: Directorate of Economics and Statistics, Assam.
1 2 3
Manufacturing of food productsManufacturing of beveragesManufacturing of paper & tobacco productsManufacturing of TextilesManufacturing of wearing apparelManufacturing of wood productsManufacturing of paper & paper productsPublishing, printing & reproduction of recorded mediaManufacturing of coke, Refined petroleum productsManufacturing of chemical & chemical productsManufacturing of pharmaceuticals, medical, chemical &botanicalManufacturing of rubber & plastic productsManufacturing of non-metallic mineral productsManufacturing of basic metalsManufacturing of fabricated metal products, exceptmachinery & equipmentsManufacturing of computer,electronic and optical productsManufacturing of electronic equipmentManufacturing of machinery & equipments n.e.c.Manufacturing of motor vehicles, trailers and semi-trailersManufacturing of furniture
Total Manufacturing
MINING AND QUARRYING
MANUFACTURING
ELECTRICITY
TOTAL
1011121314161718192021
22232425
2627282931
10-14
15-36
NIC2008 Industry Division Weight
109.349717.998518.8445
2.61750.03067.60735.6893
50.4046109.2777
63.95897.7672
6.941232.850213.9742
0.6329
0.43410.96850.92160.31816.3935
456.9800
460.4598
456.9800
82.5700
1000.00
51,61,62,81

- 135 -
10.01PRODUCTION IN ASSAM2011-12=100)
4 5 6 7 8 9 1
2014-15 2016-17 2017-18 2018-19 2019-202015-16
120.69113.98110.25103.40113.26120.44
90.83119.64110.68110.70140.85
113.6794.36
108.51143.35
158.5692.66
113.83100.00
82.19
113.02
90.62
113.02
94.22
101.16
136.10121.30110.72106.31113.76
87.00101.76133.24107.66107.44139.89
64.2788.79
109.26153.32
160.06111.35108.62112.27179.26
117.20
85.30
117.20
100.37
101.13
137.10131.25114.34103.22116.23106.28
94.26138.29110.56107.73156.58
66.1495.65
117.46160.67
161.2699.26
111.96122.70
87.56
119.26
86.72
119.26
140.66
106.04
138.80136.49117.16116.93118.20108.16
94.18141.13112.03120.61162.81
137.08103.13121.11163.77
167.72153.43140.66128.83
90.98
124.55
90.15
124.55
131.11
109.29
139.91155.51112.81103.94111.80114.61
92.70157.08115.22107.13135.85
140.3998.30
123.40172.75
161.86161.06142.93143.56
90.34
125.46
89.55
125.46
153.46
111.24
1011121314161718192021
22232425
2627282931
10-14
15-36
143.62161.38126.62104.67111.88109.95
94.43148.28115.91107.21129.05
137.76100.79125.80178.61
169.67141.08165.30147.24
90.70
126.43
84.82
126.43
183.75
112.00
NIC2008
51,61,62,81
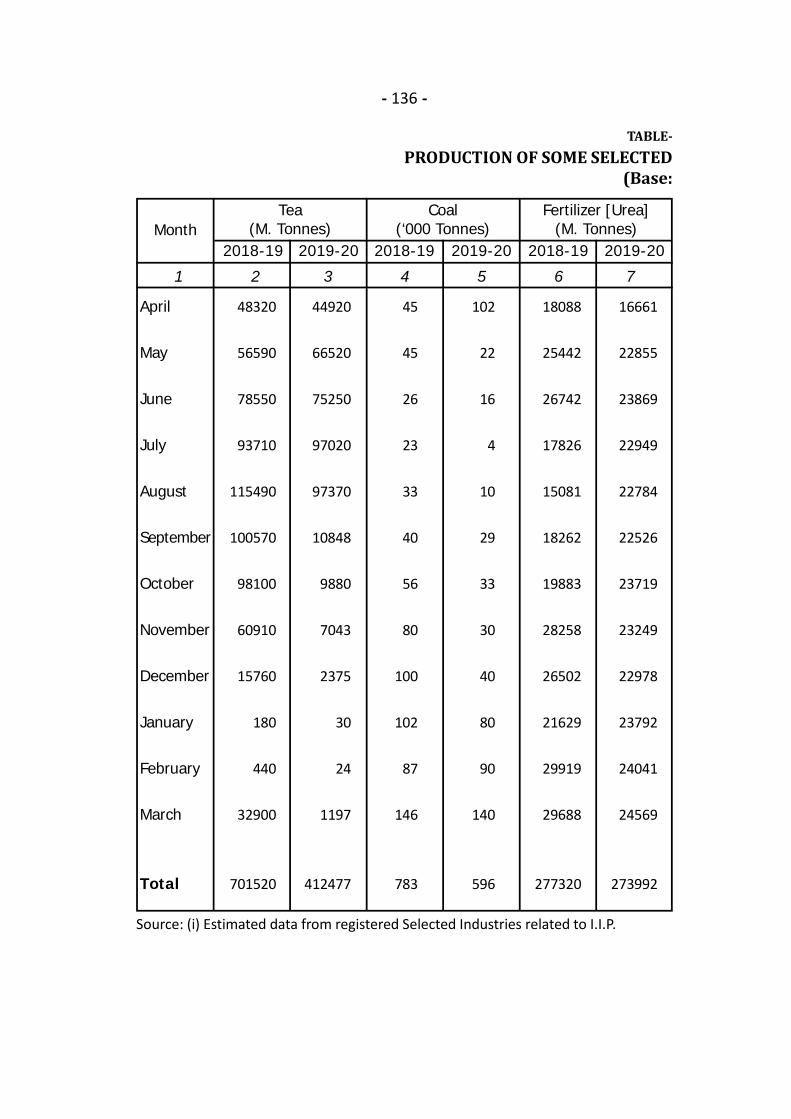
- 136 -
TABLE-PRODUCTION OF SOME SELECTED
(Base:
Source: (i) Estimated data from registered Selected Industries related to I.I.P.
1 2 3 4 5 6 7
2018-19 2018-19 2019-20 2018-19 2019-202019-20Month
April
May
June
July
August
September
October
November
December
January
February
March
Total
48320
56590
78550
93710
115490
100570
98100
60910
15760
180
440
32900
701520
44920
66520
75250
97020
97370
10848
9880
7043
2375
30
24
1197
412477
45
45
26
23
33
40
56
80
100
102
87
146
783
102
22
16
4
10
29
33
30
40
80
90
140
596
18088
25442
26742
17826
15081
18262
19883
28258
26502
21629
29919
29688
277320
16661
22855
23869
22949
22784
22526
23719
23249
22978
23792
24041
24569
273992
Tea(M. Tonnes)
Coal(‘000 Tonnes)
Fertilizer [Urea](M. Tonnes)
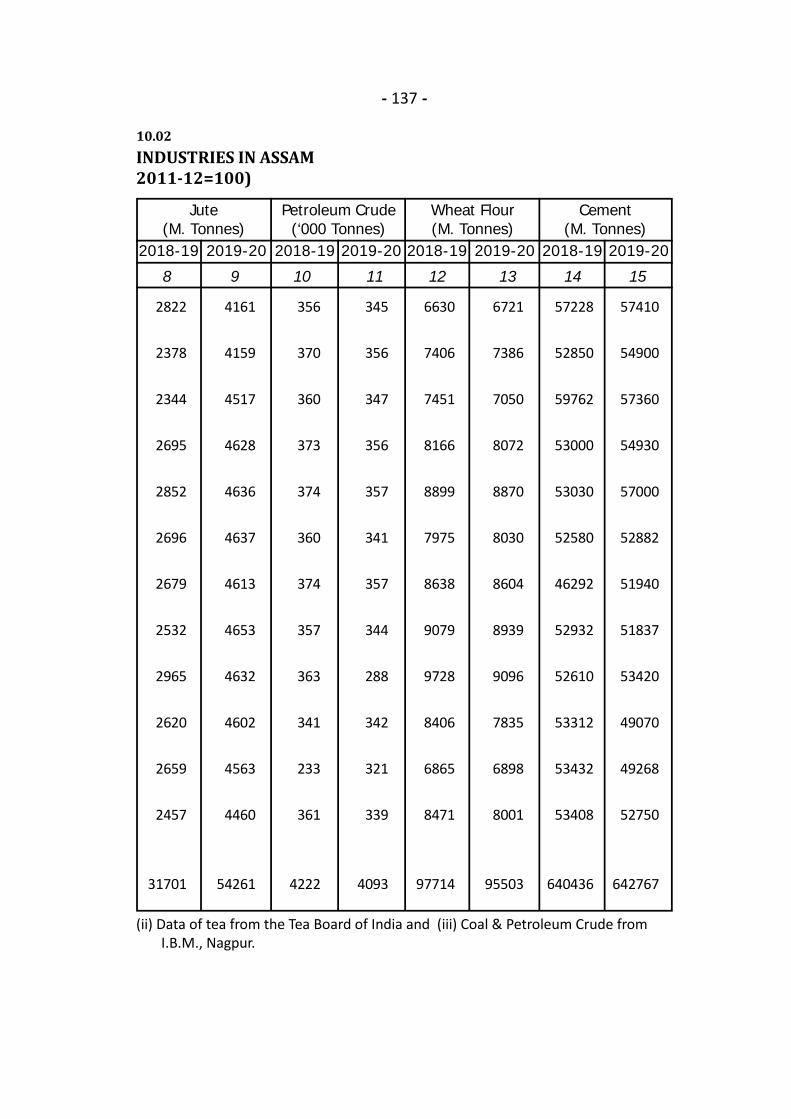
- 137 -
10.02INDUSTRIES IN ASSAM2011-12=100)
(ii) Data of tea from the Tea Board of India and (iii) Coal & Petroleum Crude from I.B.M., Nagpur.
8 9 10 11 12 13 14 15
2018-19 2018-19 2019-20 2018-19 2019-202019-202018-19 2019-20
2822
2378
2344
2695
2852
2696
2679
2532
2965
2620
2659
2457
31701
4161
4159
4517
4628
4636
4637
4613
4653
4632
4602
4563
4460
54261
356
370
360
373
374
360
374
357
363
341
233
361
4222
345
356
347
356
357
341
357
344
288
342
321
339
4093
6630
7406
7451
8166
8899
7975
8638
9079
9728
8406
6865
8471
97714
6721
7386
7050
8072
8870
8030
8604
8939
9096
7835
6898
8001
95503
57228
52850
59762
53000
53030
52580
46292
52932
52610
53312
53432
53408
640436
57410
54900
57360
54930
57000
52882
51940
51837
53420
49070
49268
52750
642767
Petroleum Crude(‘000 Tonnes)
Wheat Flour(M. Tonnes)
Cement(M. Tonnes)
Jute(M. Tonnes)
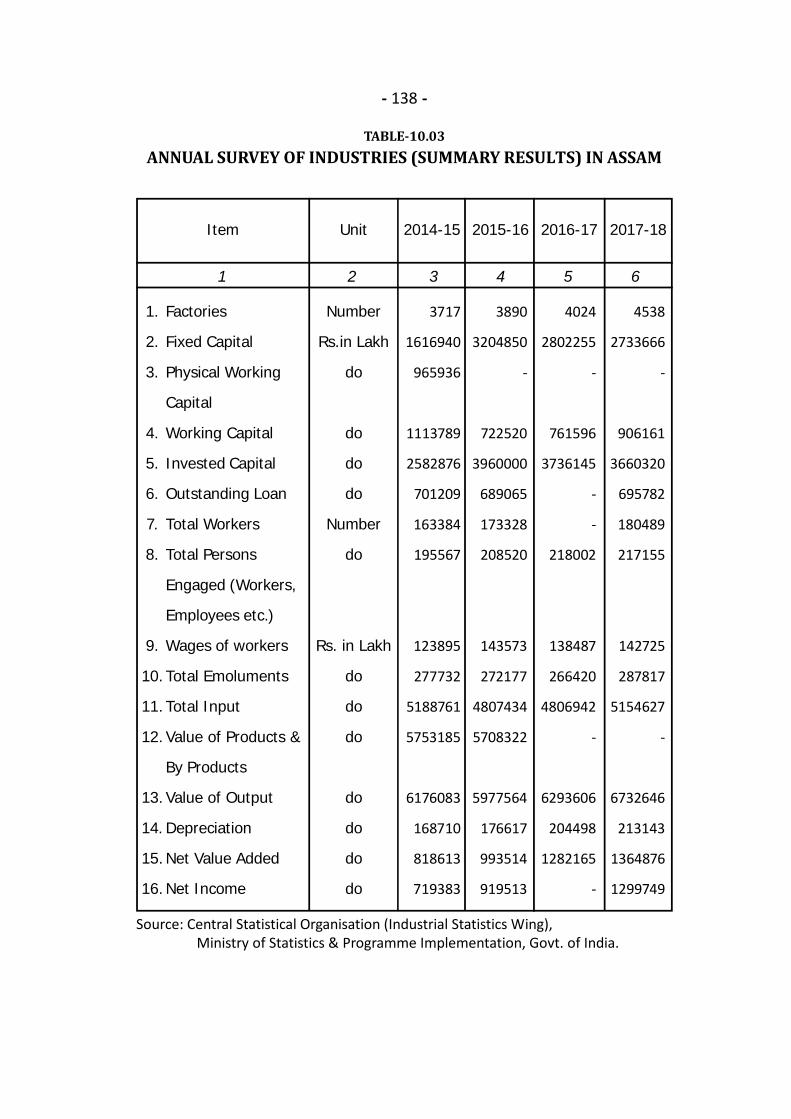
- 138 -
TABLE-10.03ANNUAL SURVEY OF INDUSTRIES (SUMMARY RESULTS) IN ASSAM
Source: Central Statistical Organisation (Industrial Statistics Wing), Ministry of Statistics & Programme Implementation, Govt. of India.
1 2 3 4 5 6
Factories
Fixed Capital
Physical Working
Capital
Working Capital
Invested Capital
Outstanding Loan
Total Workers
Total Persons
Engaged (Workers,
Employees etc.)
Wages of workers
Total Emoluments
Total Input
Value of Products &
By Products
Value of Output
Depreciation
Net Value Added
Net Income
Item Unit 2014-15 2015-16 2016-17 2017-18
1.
2.
3.
4.
5.
6.
7.
8.
9.
10.
11.
12.
13.
14.
15.
16.
Number
Rs.in Lakh
do
do
do
do
Number
do
Rs. in Lakh
do
do
do
do
do
do
do
3717
1616940
965936
1113789
2582876
701209
163384
195567
123895
277732
5188761
5753185
6176083
168710
818613
719383
3890
3204850
-
722520
3960000
689065
173328
208520
143573
272177
4807434
5708322
5977564
176617
993514
919513
4024
2802255
-
761596
3736145
-
-
218002
138487
266420
4806942
-
6293606
204498
1282165
-
4538
2733666
-
906161
3660320
695782
180489
217155
142725
287817
5154627
-
6732646
213143
1364876
1299749
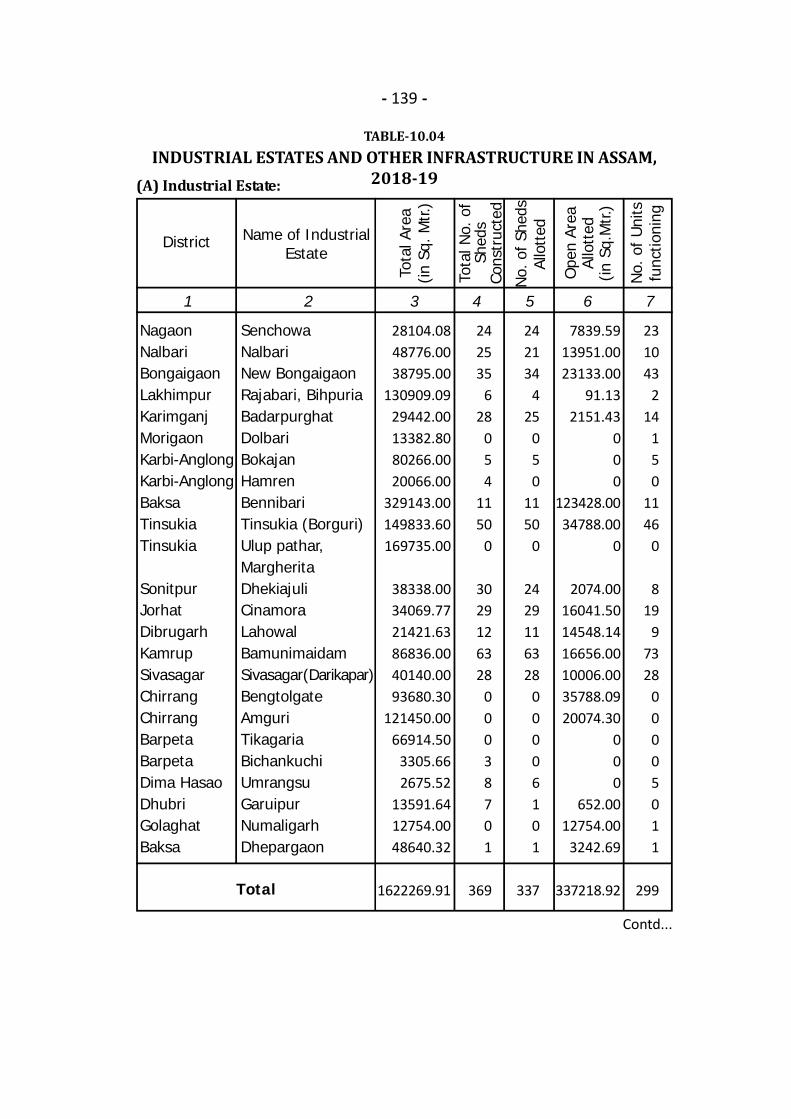
- 139 -
TABLE-10.04INDUSTRIAL ESTATES AND OTHER INFRASTRUCTURE IN ASSAM,
2018-19(A) Industrial Estate:
Contd...
1 2 3 4 5 6 7
Name of IndustrialEstate
Tota
l Are
a(in
Sq.
Mtr.
)
District
NagaonNalbariBongaigaonLakhimpurKarimganjMorigaonKarbi-AnglongKarbi-AnglongBaksaTinsukiaTinsukia
SonitpurJorhatDibrugarhKamrupSivasagarChirrangChirrangBarpetaBarpetaDima HasaoDhubriGolaghatBaksa
SenchowaNalbariNew BongaigaonRajabari, BihpuriaBadarpurghatDolbariBokajanHamrenBennibariTinsukia (Borguri)Ulup pathar,MargheritaDhekiajuliCinamoraLahowalBamunimaidamSivasagar(Darikapar)BengtolgateAmguriTikagariaBichankuchiUmrangsuGaruipurNumaligarhDhepargaon
28104.0848776.0038795.00
130909.0929442.0013382.8080266.0020066.00
329143.00149833.60169735.00
38338.0034069.7721421.6386836.0040140.0093680.30
121450.0066914.50
3305.662675.52
13591.6412754.0048640.32
1622269.91
242535
628
054
1150
0
3029126328
00038701
369
242134
425
050
1150
0
2429116328
00006101
337
7839.5913951.0023133.00
91.132151.43
000
123428.0034788.00
0
2074.0016041.5014548.1416656.0010006.0035788.0920074.30
000
652.0012754.00
3242.69
337218.92
231043
214
150
1146
0
819
97328
00005011
299
Tota
l No.
of
Shed
sCo
nstr
ucte
d
No.
of
Shed
sAl
lott
ed
Ope
n Ar
eaAl
lott
ed(in
Sq.
Mtr.
)
No.
of U
nits
func
tioni
ng
Total
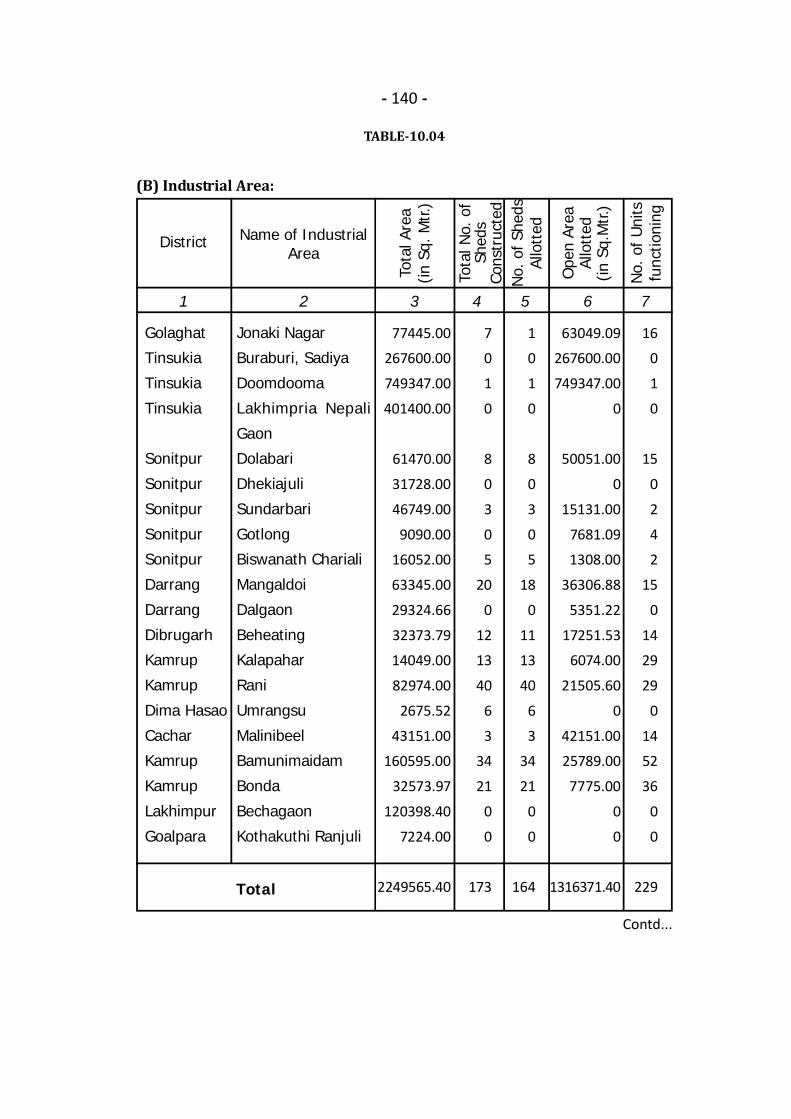
- 140 -
TABLE-10.04
(B) Industrial Area:
Contd...
1 2 3 4 5 6 7
Name of IndustrialArea
Tota
l Are
a(in
Sq.
Mtr.
)
District
Golaghat
Tinsukia
Tinsukia
Tinsukia
Sonitpur
Sonitpur
Sonitpur
Sonitpur
Sonitpur
Darrang
Darrang
Dibrugarh
Kamrup
Kamrup
Dima Hasao
Cachar
Kamrup
Kamrup
Lakhimpur
Goalpara
Jonaki Nagar
Buraburi, Sadiya
Doomdooma
Lakhimpria Nepali
Gaon
Dolabari
Dhekiajuli
Sundarbari
Gotlong
Biswanath Chariali
Mangaldoi
Dalgaon
Beheating
Kalapahar
Rani
Umrangsu
Malinibeel
Bamunimaidam
Bonda
Bechagaon
Kothakuthi Ranjuli
77445.00
267600.00
749347.00
401400.00
61470.00
31728.00
46749.00
9090.00
16052.00
63345.00
29324.66
32373.79
14049.00
82974.00
2675.52
43151.00
160595.00
32573.97
120398.40
7224.00
2249565.40
7
0
1
0
8
0
3
0
5
20
0
12
13
40
6
3
34
21
0
0
173
1
0
1
0
8
0
3
0
5
18
0
11
13
40
6
3
34
21
0
0
164
63049.09
267600.00
749347.00
0
50051.00
0
15131.00
7681.09
1308.00
36306.88
5351.22
17251.53
6074.00
21505.60
0
42151.00
25789.00
7775.00
0
0
1316371.40
16
0
1
0
15
0
2
4
2
15
0
14
29
29
0
14
52
36
0
0
229
Tota
l No.
of
Shed
sCo
nstr
ucte
dN
o. o
f She
dsAl
lott
ed
Ope
n Ar
eaAl
lott
ed(in
Sq.
Mtr.
)
No.
of U
nits
func
tioni
ng
Total
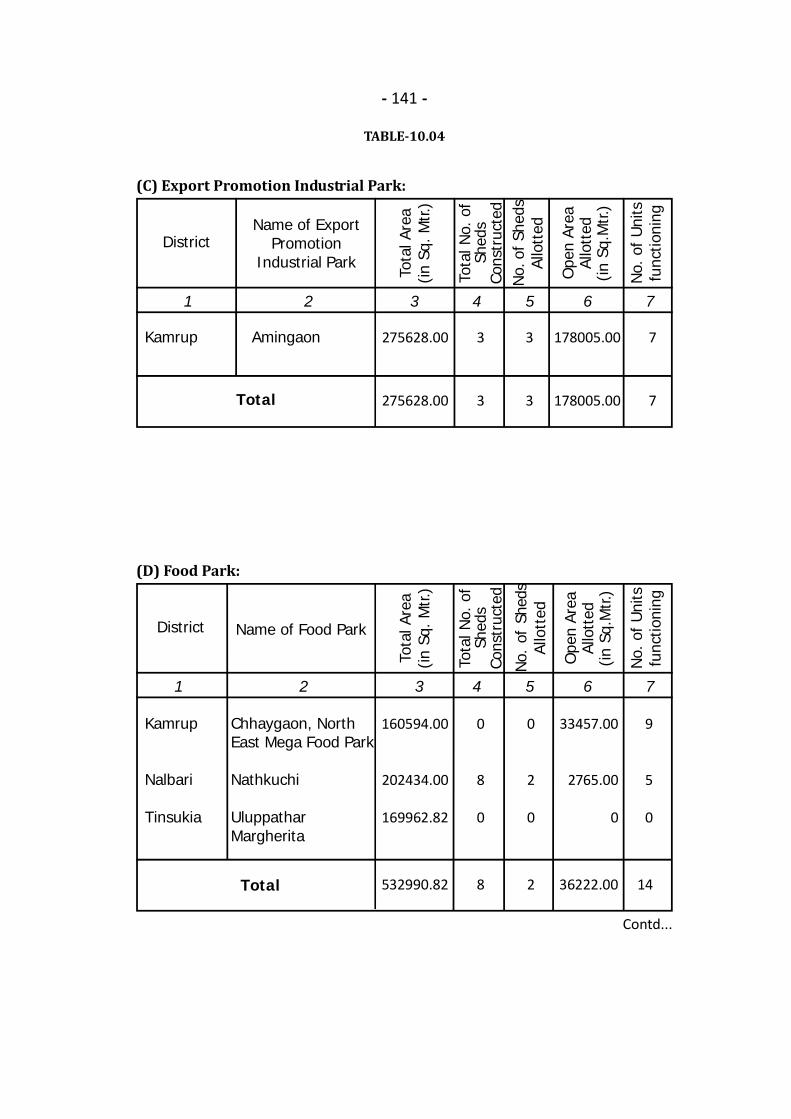
- 141 -
TABLE-10.04
(C) Export Promotion Industrial Park:
Contd...
1 2 3 4 5 6 7
Name of ExportPromotion
Industrial Park
Tota
l Are
a(in
Sq.
Mtr.
)
District
Kamrup Amingaon 275628.00
275628.00
3
3
3
3
178005.00
178005.00
7
7
Tota
l No.
of
Shed
sCo
nstr
ucte
dN
o.of
She
dsAl
lott
ed
Ope
n Ar
eaAl
lott
ed(in
Sq.
Mtr.
)
No.
of U
nits
func
tioni
ng
Total
(D) Food Park:
1 2 3 4 5 6 7
Name of Food Park
Tota
l Are
a(in
Sq.
Mtr.
)
District
Kamrup
Nalbari
Tinsukia
Chhaygaon, NorthEast Mega Food Park
Nathkuchi
UluppatharMargherita
160594.00
202434.00
169962.82
532990.82
0
8
0
8
0
2
0
2
33457.00
2765.00
0
36222.00
9
5
0
14
Tota
l No.
of
Shed
sCo
nstr
ucte
d
No.
of
Shed
sAl
lott
ed
Ope
n Ar
eaAl
lott
ed(in
Sq.
Mtr.
)
No.
of U
nits
func
tioni
ng
Total
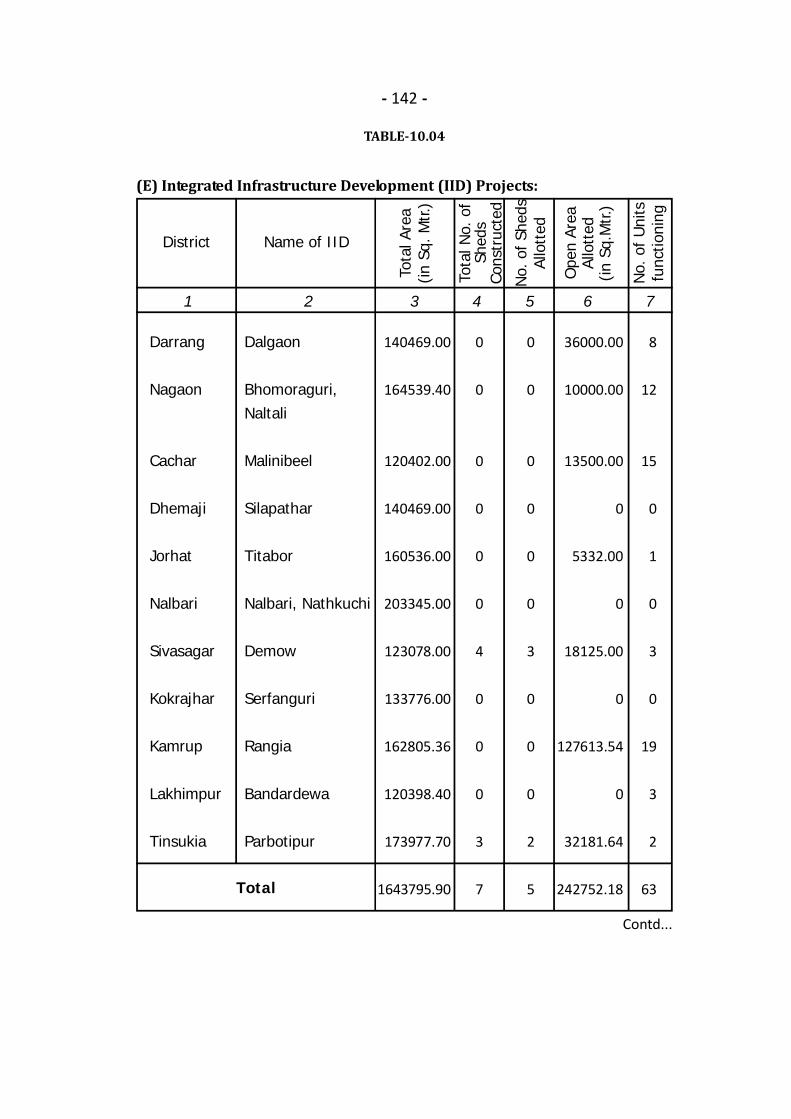
- 142 -
TABLE-10.04
(E) Integrated Infrastructure Development (IID) Projects:
Contd...
1 2 3 4 5 6 7
Name of IID
Tota
l Are
a(in
Sq.
Mtr.
)
District
Darrang
Nagaon
Cachar
Dhemaji
Jorhat
Nalbari
Sivasagar
Kokrajhar
Kamrup
Lakhimpur
Tinsukia
Dalgaon
Bhomoraguri,Naltali
Malinibeel
Silapathar
Titabor
Nalbari, Nathkuchi
Demow
Serfanguri
Rangia
Bandardewa
Parbotipur
140469.00
164539.40
120402.00
140469.00
160536.00
203345.00
123078.00
133776.00
162805.36
120398.40
173977.70
1643795.90
0
0
0
0
0
0
4
0
0
0
3
7
0
0
0
0
0
0
3
0
0
0
2
5
36000.00
10000.00
13500.00
0
5332.00
0
18125.00
0
127613.54
0
32181.64
242752.18
8
12
15
0
1
0
3
0
19
3
2
63
Tota
l No.
of
Shed
sCo
nstr
ucte
d
No.
of S
heds
Allo
tted
Ope
n Ar
eaAl
lott
ed(in
Sq.
Mtr.
)
No.
of U
nits
func
tioni
ng
Total
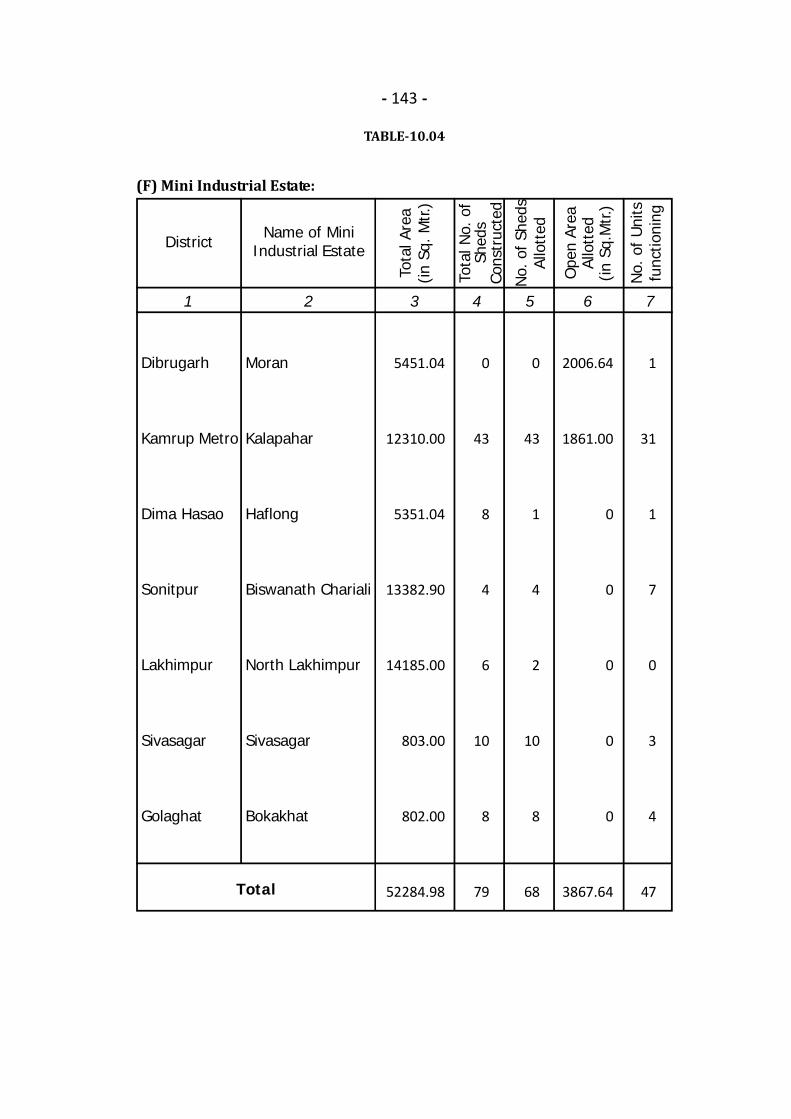
- 143 -
TABLE-10.04
(F) Mini Industrial Estate:
1 2 3 4 5 6 7
Name of MiniIndustrial Estate
Tota
l Are
a(in
Sq.
Mtr.
)
District
Dibrugarh
Kamrup Metro
Dima Hasao
Sonitpur
Lakhimpur
Sivasagar
Golaghat
Moran
Kalapahar
Haflong
Biswanath Chariali
North Lakhimpur
Sivasagar
Bokakhat
5451.04
12310.00
5351.04
13382.90
14185.00
803.00
802.00
52284.98
0
43
8
4
6
10
8
79
0
43
1
4
2
10
8
68
2006.64
1861.00
0
0
0
0
0
3867.64
1
31
1
7
0
3
4
47
Tota
l No.
of
Shed
sCo
nstr
ucte
d
No.
of S
heds
Allo
tted
Ope
n Ar
eaAl
lott
ed(in
Sq.
Mtr.
)
No.
of U
nits
func
tioni
ng
Total
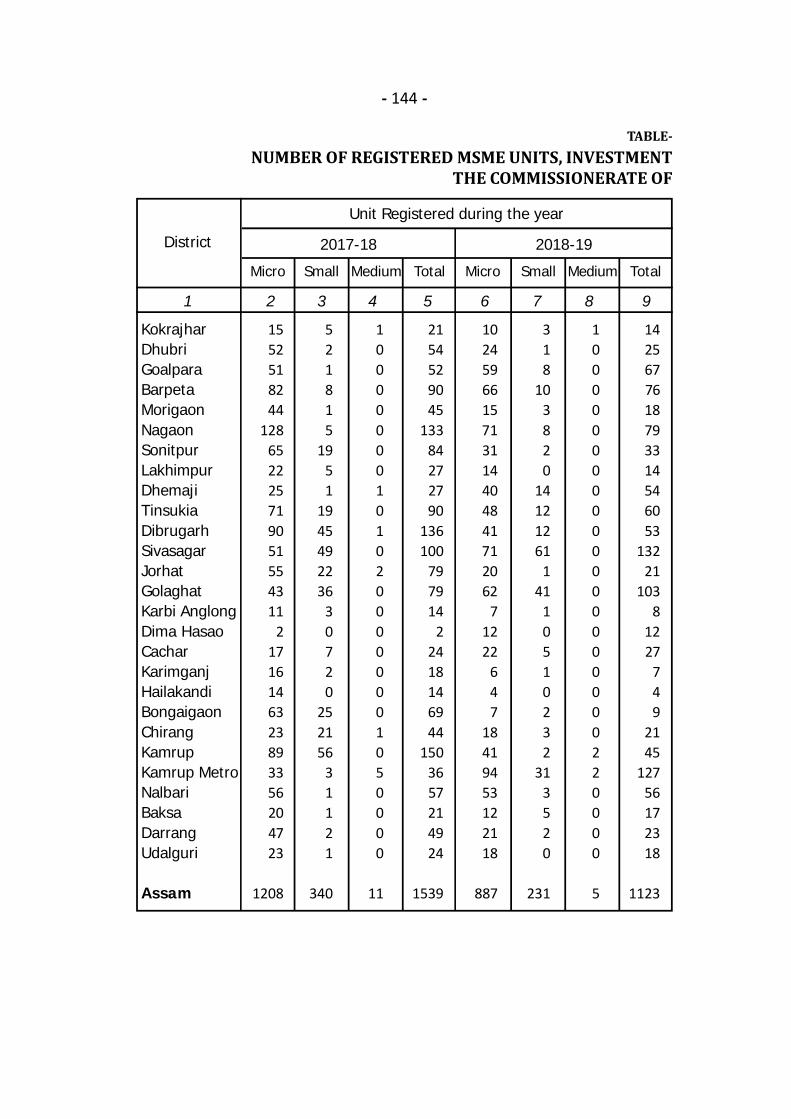
- 144 -
TABLE-NUMBER OF REGISTERED MSME UNITS, INVESTMENT
THE COMMISSIONERATE OF
1 2 3 4 5 6 7 8 9
KokrajharDhubriGoalparaBarpetaMorigaonNagaonSonitpurLakhimpurDhemajiTinsukiaDibrugarhSivasagarJorhatGolaghatKarbi AnglongDima HasaoCacharKarimganjHailakandiBongaigaonChirangKamrupKamrup MetroNalbariBaksaDarrangUdalguri
Assam
District
Micro Small Medium Total Micro Small Medium Total
1552518244
128652225719051554311
21716146323893356204723
1208
521815
1951
1945492236
30720
252156
31121
340
100000001010200000001050000
11
2154529045
13384272790
136100
797914
22418146944
1503657214924
1539
1024596615713114404841712062
71222
647
18419453122118
887
318
103820
14121261
141
10510232
313520
231
100000000000000000000220000
5
1425677618793314546053
13221
1038
1227
749
2145
12756172318
1123
2017-18 2018-19
Unit Registered during the year
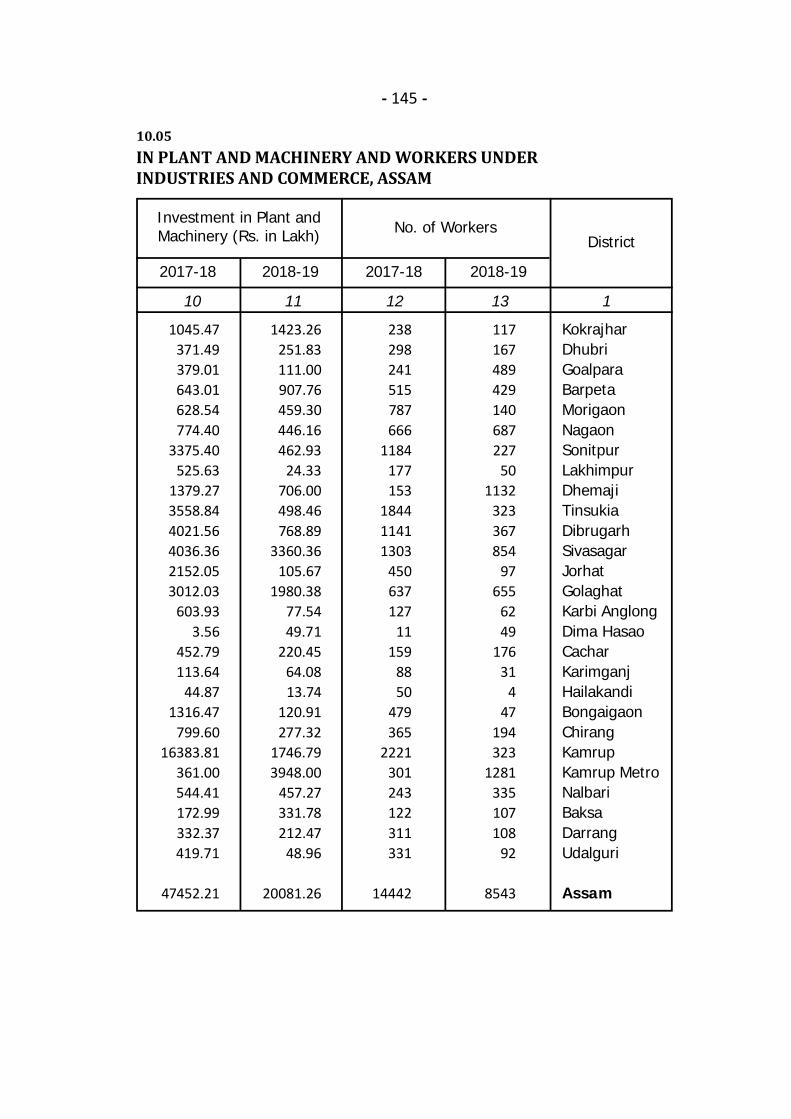
- 145 -
10.05IN PLANT AND MACHINERY AND WORKERS UNDERINDUSTRIES AND COMMERCE, ASSAM
10 11 12 13 1
KokrajharDhubriGoalparaBarpetaMorigaonNagaonSonitpurLakhimpurDhemajiTinsukiaDibrugarhSivasagarJorhatGolaghatKarbi AnglongDima HasaoCacharKarimganjHailakandiBongaigaonChirangKamrupKamrup MetroNalbariBaksaDarrangUdalguri
Assam
2017-18 2018-19 2017-18 2018-19
District
1045.47371.49379.01643.01628.54774.40
3375.40525.63
1379.273558.844021.564036.362152.053012.03
603.933.56
452.79113.64
44.871316.47
799.6016383.81
361.00544.41172.99332.37419.71
47452.21
1423.26251.83111.00907.76459.30446.16462.93
24.33706.00498.46768.89
3360.36105.67
1980.3877.5449.71
220.4564.0813.74
120.91277.32
1746.793948.00
457.27331.78212.47
48.96
20081.26
238298241515787666
1184177153
184411411303
450637127
11159
8850
479365
2221301243122311331
14442
117167489429140687227
501132
323367854
97655
6249
17631
447
194323
1281335107108
92
8543
Investment in Plant andMachinery (Rs. in Lakh) No. of Workers
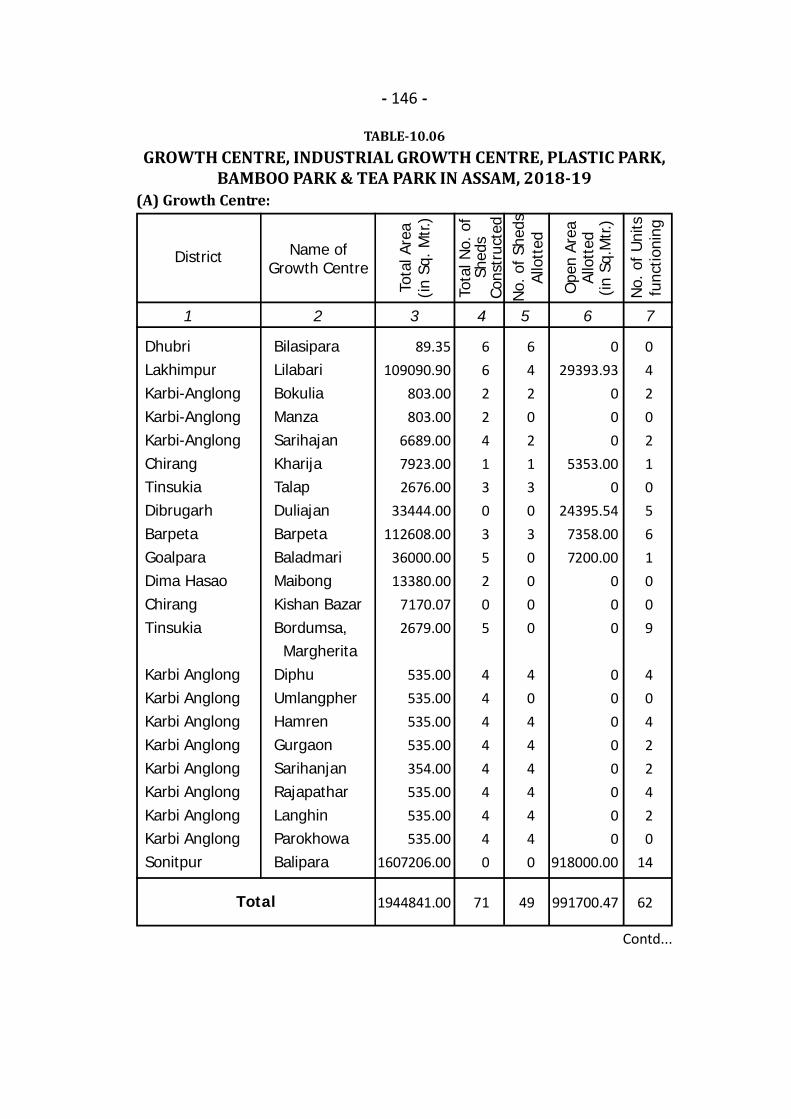
- 146 -
TABLE-10.06GROWTH CENTRE, INDUSTRIAL GROWTH CENTRE, PLASTIC PARK,
BAMBOO PARK & TEA PARK IN ASSAM, 2018-19(A) Growth Centre:
Contd...
1 2 3 4 5 6 7
Name ofGrowth Centre
Tota
l Are
a(in
Sq.
Mtr.
)
District
DhubriLakhimpurKarbi-AnglongKarbi-AnglongKarbi-AnglongChirangTinsukiaDibrugarhBarpetaGoalparaDima HasaoChirangTinsukia
Karbi AnglongKarbi AnglongKarbi AnglongKarbi AnglongKarbi AnglongKarbi AnglongKarbi AnglongKarbi AnglongSonitpur
BilasiparaLilabariBokuliaManzaSarihajanKharijaTalapDuliajanBarpetaBaladmariMaibongKishan BazarBordumsa, MargheritaDiphuUmlangpherHamrenGurgaonSarihanjanRajapatharLanghinParokhowaBalipara
89.35109090.90
803.00803.00
6689.007923.002676.00
33444.00112608.00
36000.0013380.00
7170.072679.00
535.00535.00535.00535.00354.00535.00535.00535.00
1607206.00
1944841.00
6622413035205
444444440
71
6420213030000
404444440
49
029393.93
000
5353.000
24395.547358.007200.00
000
00000000
918000.00
991700.47
0420210561009
40422420
14
62
Tota
l No.
of
Shed
sCo
nstr
ucte
dN
o. o
f She
dsAl
lott
ed
Ope
n Ar
eaAl
lott
ed(in
Sq.
Mtr.
)
No.
of U
nits
func
tioni
ng
Total
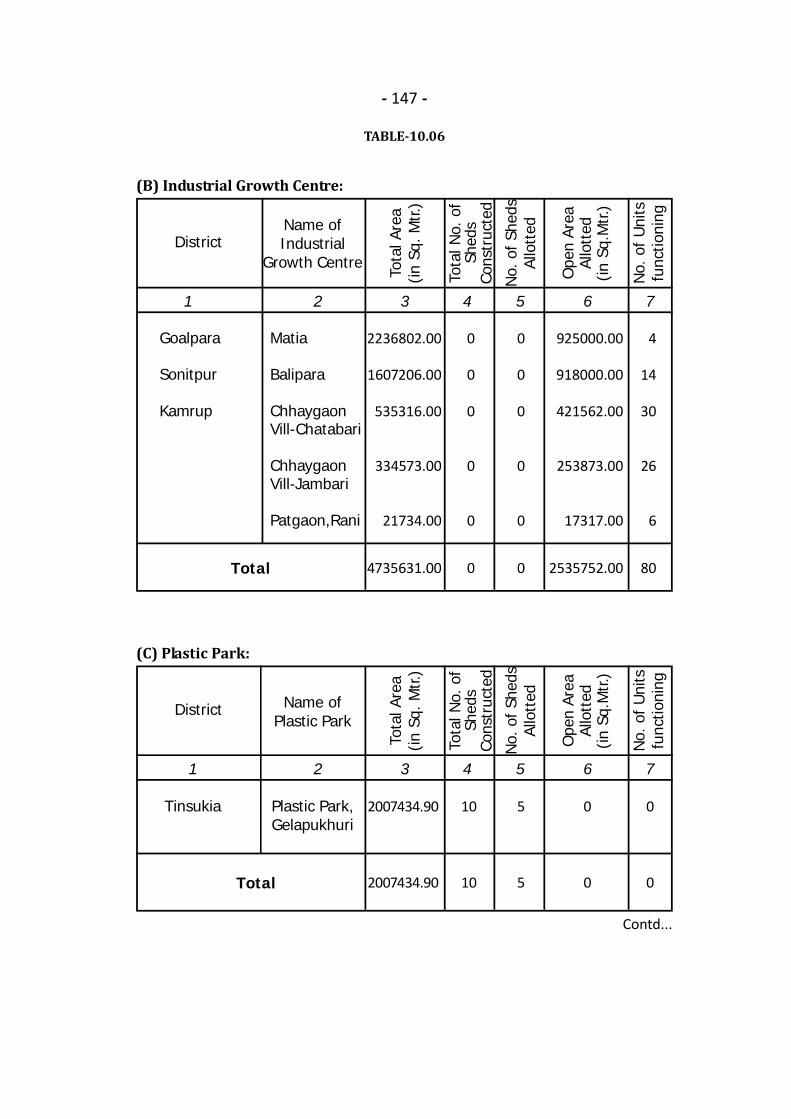
- 147 -
TABLE-10.06
(B) Industrial Growth Centre:
Contd...
1 2 3 4 5 6 7
Name ofIndustrial
Growth Centre
Tota
l Are
a(in
Sq.
Mtr.
)
District
Goalpara
Sonitpur
Kamrup
Matia
Balipara
ChhaygaonVill-Chatabari
ChhaygaonVill-Jambari
Patgaon,Rani
2236802.00
1607206.00
535316.00
334573.00
21734.00
4735631.00
0
0
0
0
0
0
0
0
0
0
0
0
925000.00
918000.00
421562.00
253873.00
17317.00
2535752.00
4
14
30
26
6
80
Tota
l No.
of
Shed
sCo
nstr
ucte
d
No.
of S
heds
Allo
tted
Ope
n Ar
eaAl
lott
ed(in
Sq.
Mtr.
)
No.
of U
nits
func
tioni
ng
Total
(C) Plastic Park:
1 2 3 4 5 6 7
Name ofPlastic Park
Tota
l Are
a(in
Sq.
Mtr.
)
District
Tinsukia Plastic Park,Gelapukhuri
2007434.90
2007434.90
10
10
5
5
0
0
0
0
Tota
l No.
of
Shed
sCo
nstr
ucte
d
No.
of S
heds
Allo
tted
Ope
n Ar
eaAl
lott
ed(in
Sq.
Mtr.
)
No.
of U
nits
func
tioni
ng
Total
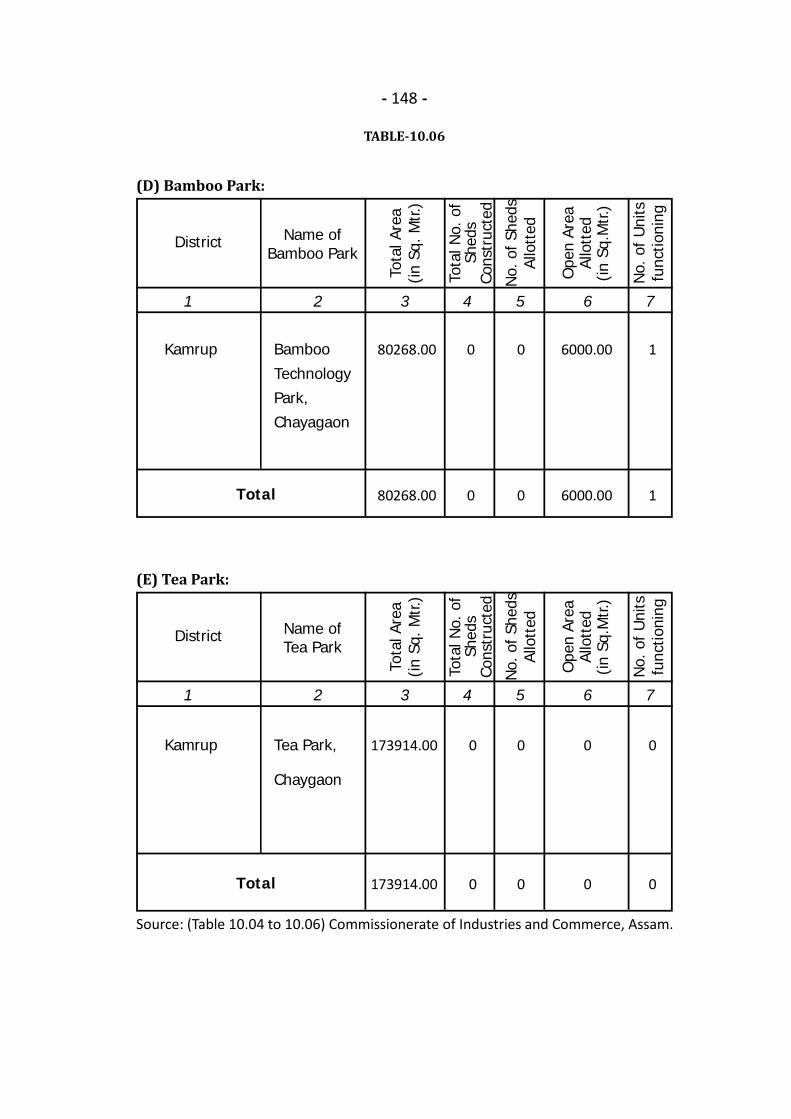
Source: (Table 10.04 to 10.06) Commissionerate of Industries and Commerce, Assam.
- 148 -
TABLE-10.06
(D) Bamboo Park:
1 2 3 4 5 6 7
Name ofBamboo Park
Tota
l Are
a(in
Sq.
Mtr.
)
District
Kamrup BambooTechnologyPark,Chayagaon
80268.00
80268.00
0
0
0
0
6000.00
6000.00
1
1
Tota
l No.
of
Shed
sCo
nstr
ucte
d
No.
of S
heds
Allo
tted
Ope
n Ar
eaAl
lott
ed(in
Sq.
Mtr.
)
No.
of U
nits
func
tioni
ng
Total
(E) Tea Park:
1 2 3 4 5 6 7
Name ofTea Park
Tota
l Are
a(in
Sq.
Mtr.
)
District
Kamrup Tea Park,
Chaygaon
173914.00
173914.00
0
0
0
0
0
0
Tota
l No.
of
Shed
sCo
nstr
ucte
d
No.
of S
heds
Allo
tted
Ope
n Ar
eaAl
lott
ed(in
Sq.
Mtr.
)
No.
of U
nits
func
tioni
ng
Total
0
0
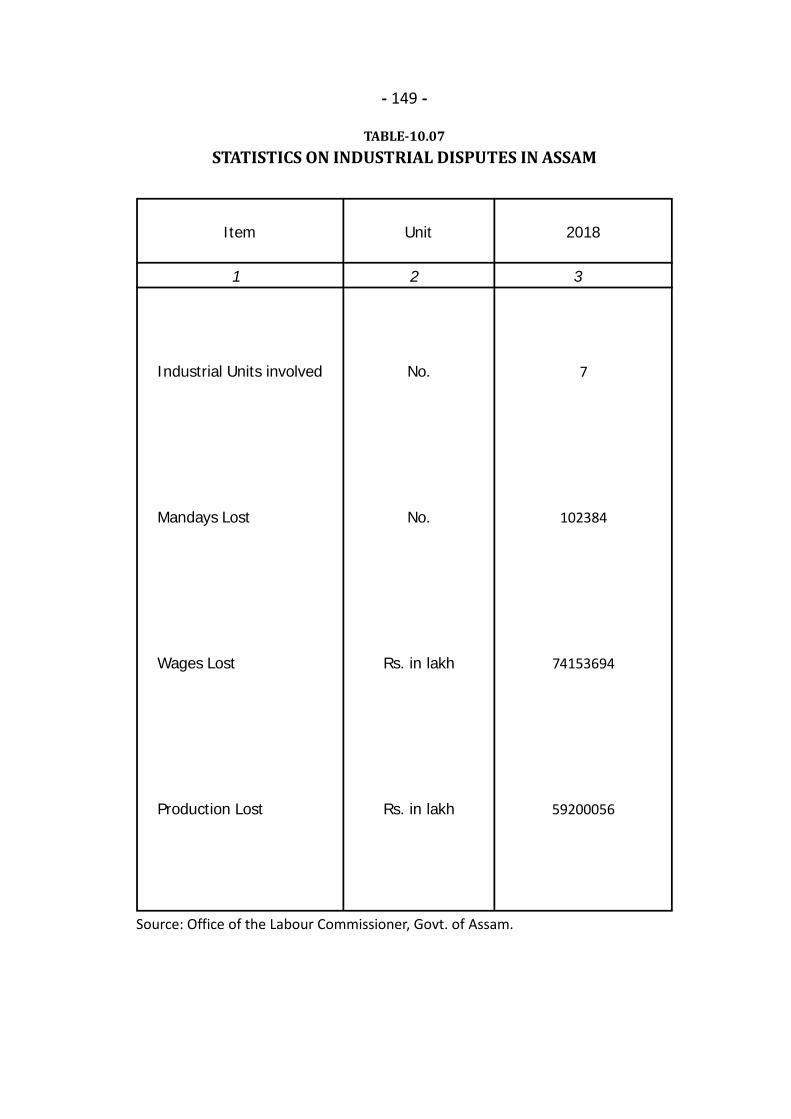
Source: Office of the Labour Commissioner, Govt. of Assam.
TABLE-10.07STATISTICS ON INDUSTRIAL DISPUTES IN ASSAM
1 2 3
Item Unit 2018
Industrial Units involved
Mandays Lost
Wages Lost
Production Lost
No.
No.
Rs. in lakh
Rs. in lakh
7
102384
74153694
59200056
- 149 -
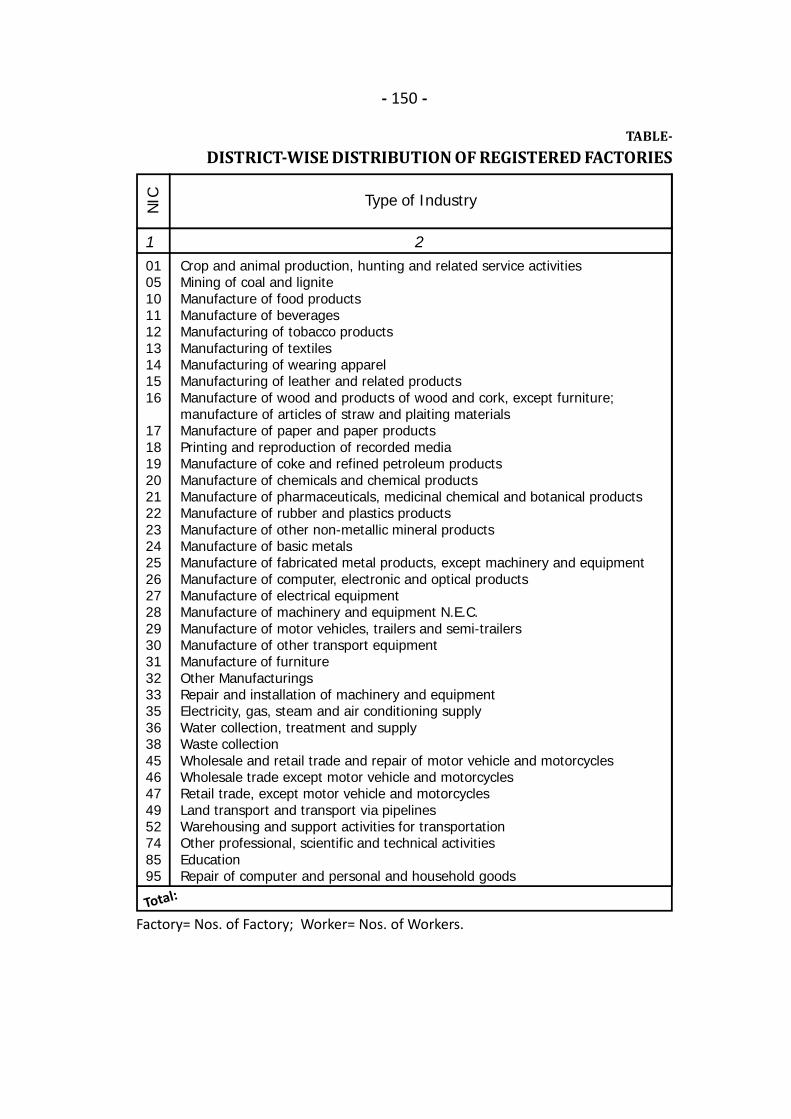
- 150 -
TABLE-DISTRICT-WISE DISTRIBUTION OF REGISTERED FACTORIES
Factory= Nos. of Factory; Worker= Nos. of Workers.
1 2
Type of Industry
010510111213141516
17181920212223242526272829303132333536384546474952748595
Crop and animal production, hunting and related service activitiesMining of coal and ligniteManufacture of food productsManufacture of beveragesManufacturing of tobacco productsManufacturing of textilesManufacturing of wearing apparelManufacturing of leather and related productsManufacture of wood and products of wood and cork, except furniture;manufacture of articles of straw and plaiting materialsManufacture of paper and paper productsPrinting and reproduction of recorded mediaManufacture of coke and refined petroleum productsManufacture of chemicals and chemical productsManufacture of pharmaceuticals, medicinal chemical and botanical productsManufacture of rubber and plastics productsManufacture of other non-metallic mineral productsManufacture of basic metalsManufacture of fabricated metal products, except machinery and equipmentManufacture of computer, electronic and optical productsManufacture of electrical equipmentManufacture of machinery and equipment N.E.C.Manufacture of motor vehicles, trailers and semi-trailersManufacture of other transport equipmentManufacture of furnitureOther ManufacturingsRepair and installation of machinery and equipmentElectricity, gas, steam and air conditioning supplyWater collection, treatment and supplyWaste collectionWholesale and retail trade and repair of motor vehicle and motorcyclesWholesale trade except motor vehicle and motorcyclesRetail trade, except motor vehicle and motorcyclesLand transport and transport via pipelinesWarehousing and support activities for transportationOther professional, scientific and technical activitiesEducationRepair of computer and personal and household goods
NIC
Total:
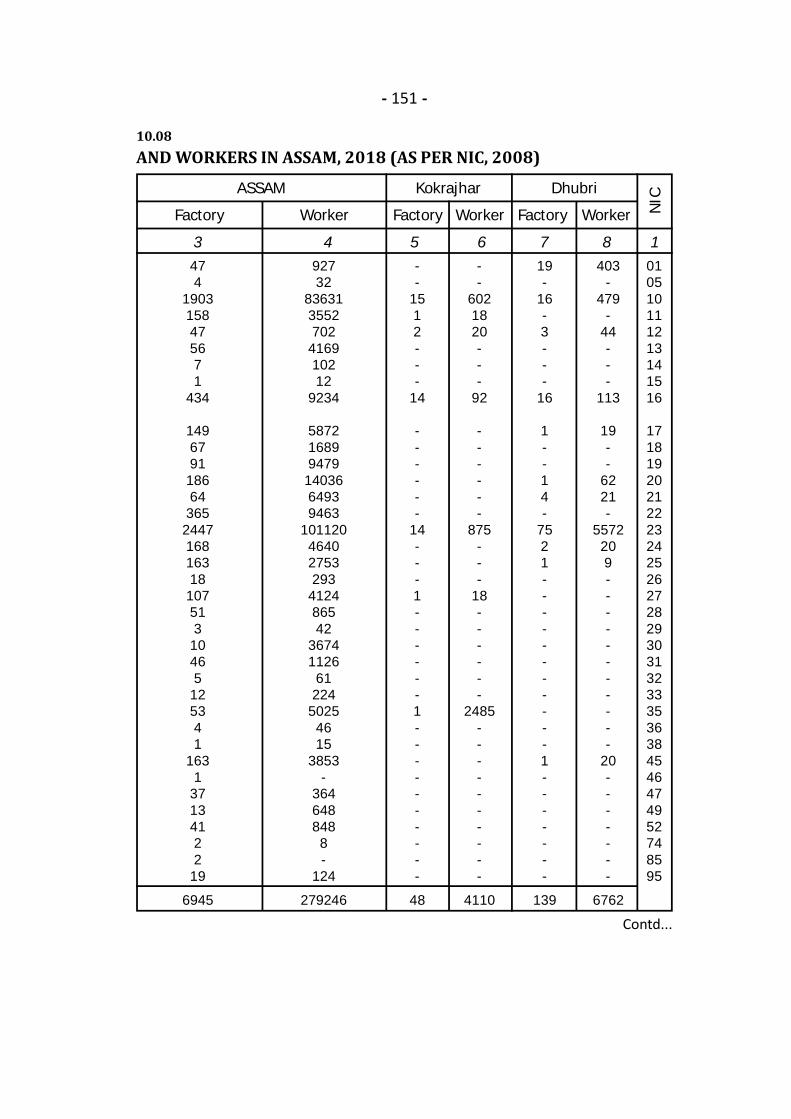
- 151 -
10.08AND WORKERS IN ASSAM, 2018 (AS PER NIC, 2008)
Contd...
3 4 5 6 7 8 1
Factory Worker Factory Worker Factory Worker NIC
ASSAM Kokrajhar Dhubri
474
1903158475671
434
14967911866436524471681631810751310465125341
16313713412219
6945
92732
836313552702416910212
9234
5872168994791403664939463
10112046402753293412486542
367411266122450254615
3853-
3646488488-
124
279246
--
1512---
14
------
14---1------1----------
48
--
6021820---
92
------
875---
18------
2485----------
4110
19-
16-3---
16
1--14-
7521-----------1-------
139
403-
479-
44---
113
19--
6221-
5572209-----------
20-------
6762
010510111213141516
17181920212223242526272829303132333536384546474952748595

- 152 -
TABLE-
1 9 10 11 12 13 14 15 16
NIC
Factory Worker Factory Worker Factory Worker Factory Worker
Goalpara Barpeta Morigaon Nagaon
Total:
--
122----6
1-12116---3-----------------
35
010510111213141516
17181920212223242526272829303132333536384546474952748595
--
17630----
49
240-
1010834050118
---
478-----------------
1599
--
2211--122
--11-135---1-----1---2-------
89
--
1942045--
12138
---
10-
102042
---
10-----
20---
60-------
2561
--
135-2--2
2--2-287-------------1-------
116
--
26266----
26
850--
50-
314804
-------------
20-------
6109
--
12515-9--
15
1--2-6
24766-4---1--1--6--22---
448
--
3537243
-1210
--
173
10--
250-
11714664194178
-209
---
47--
19--
155--
11968---
21193
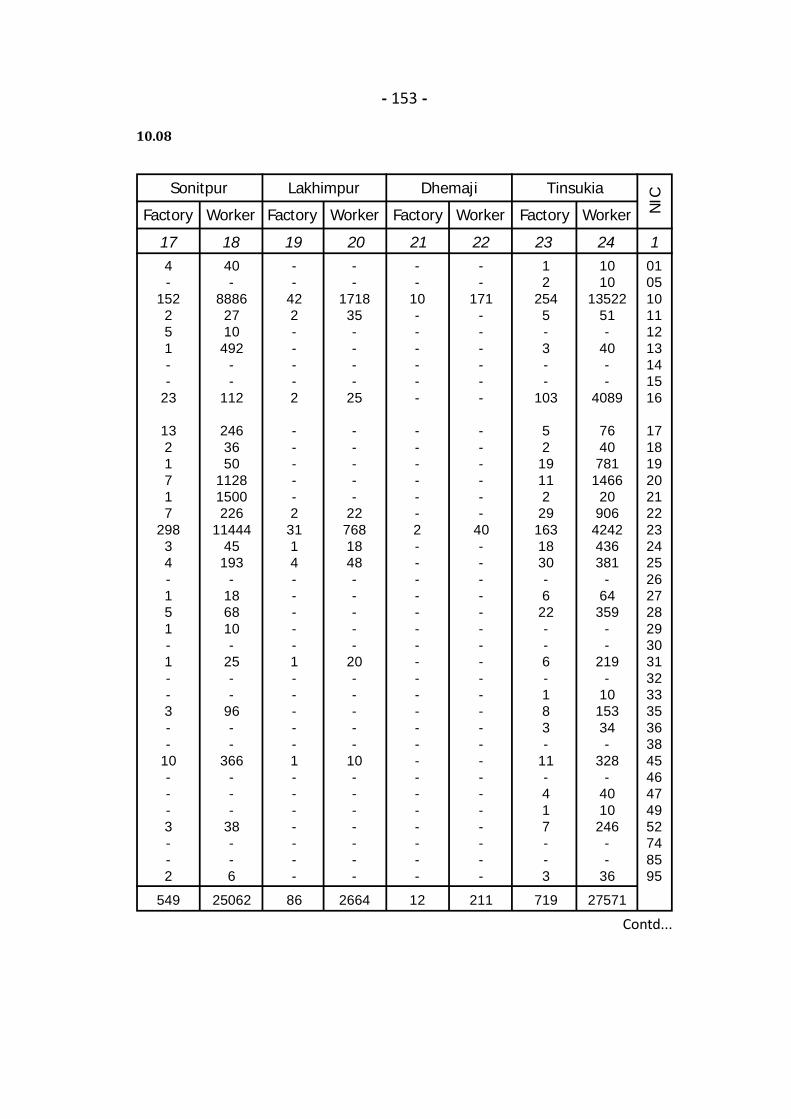
- 153 -
10.08
Contd...
17 18 19 20 21 22 23 24 1
Factory Worker Factory Worker Factory Worker Factory Worker NIC
Sonitpur Lakhimpur Dhemaji Tinsukia
010510111213141516
17181920212223242526272829303132333536384546474952748595
4-
152251--
23
1321717
29834-151-1--3--
10---3--2
549
40-
88862710492
--
112
2463650
11281500226
1144445193
-186810-
25--
96--
366---
38--6
25062
--
422----2
-----23114-----1-----1-------
86
--
171835----
25
-----
227681848-----
20-----
10-------
2664
--
10------
------2---------------------
12
--
171------
------
40---------------------
211
12
2545-3--
103
5219112291631830-622--6-183-
11-417--3
719
1010
1352251-
40--
4089
76407811466209064242436381
-64359
--
219-
1015334-
328-
4010246
--
36
27571
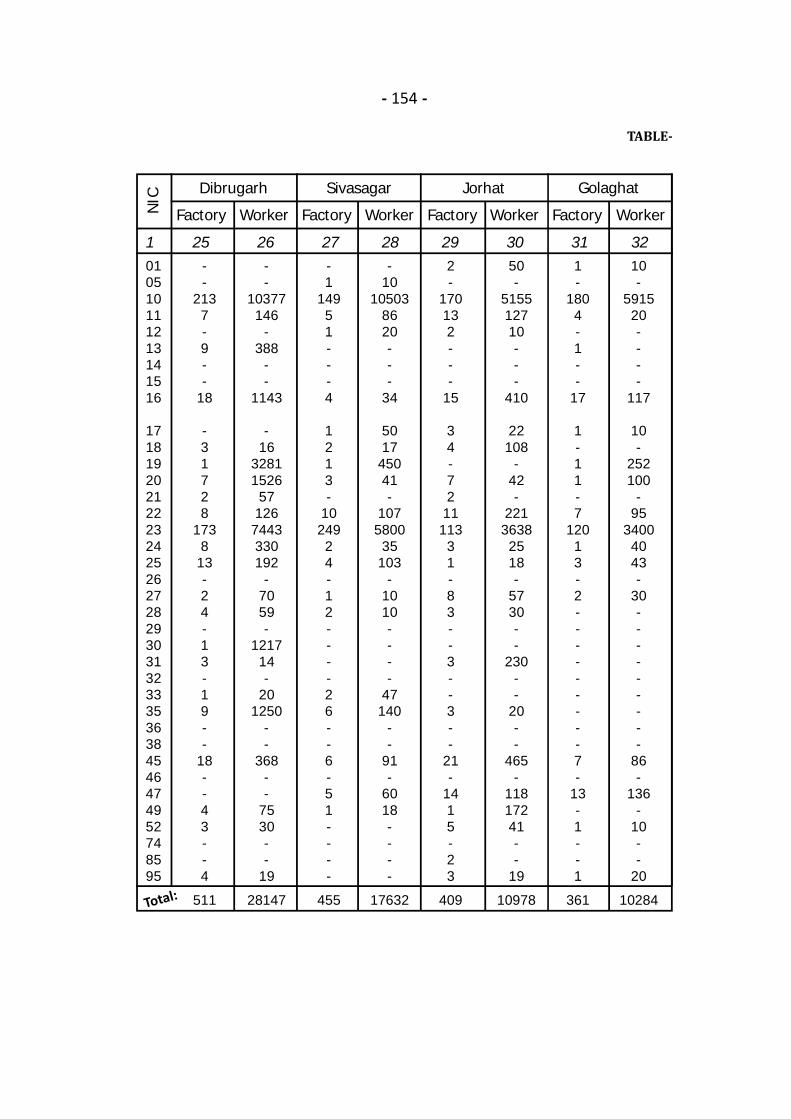
- 154 -
TABLE-
1 25 26 27 28 29 30 31 32
NIC
Factory Worker Factory Worker Factory Worker Factory Worker
Dibrugarh Sivasagar Jorhat Golaghat
Total:
010510111213141516
17181920212223242526272829303132333536384546474952748595
--
2137-9--
18
-31728
173813-24-13-19--
18--43--4
511
--
10377146
-388
--
1143
-16
32811526571267443330192
-7059-
121714-
201250
--
368--
7530--
19
28147
-1
14951---4
1213-
1024924-12----26--6-51----
455
-10
105038620---
34
501745041-
107580035103
-1010----
47140
--
91-
6018----
17632
2-
170132---
15
34-721111331-83--3--3--
21-
1415-23
409
50-
515512710---
410
22108
-42-
22136382518-
5730--
230--
20--
465-
11817241--
19
10978
1-
1804-1--
17
1-11-7
12013-2---------7-
13-1--1
361
10-
591520----
117
10-
252100
-95
34004043-
30---------
86-
136-
10--
20
10284
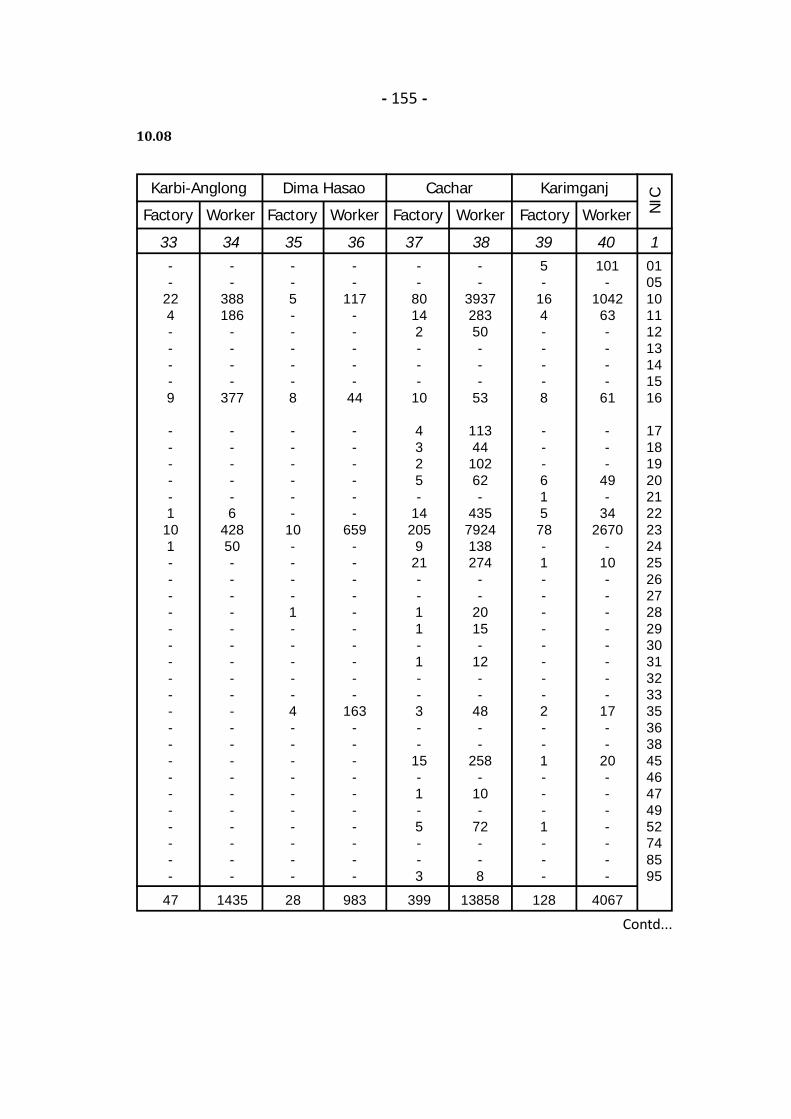
- 155 -
10.08
Contd...
33 34 35 36 37 38 39 40 1
Factory Worker Factory Worker Factory Worker Factory Worker NIC
Karbi-Anglong Dima Hasao Karimganj
010510111213141516
17181920212223242526272829303132333536384546474952748595
--
224----9
-----1101--------------------
47
--
388186
----
377
-----6
42850--------------------
1435
--5-----8
------
10----1-----4----------
28
--
117-----
44
------
659----------
163----------
983
--
80142---
10
4325-
14205921--11-1--3--
15-1-5--3
399
--
393728350---
53
1134410262-
4357924138274
--
2015-
12--
48--
258-
10-
72--8
13858
5-
164----8
---61578-1--------2--1---1---
128
101-
104263----
61
---
49-
342670
-10--------
17--
20-------
4067
Cachar
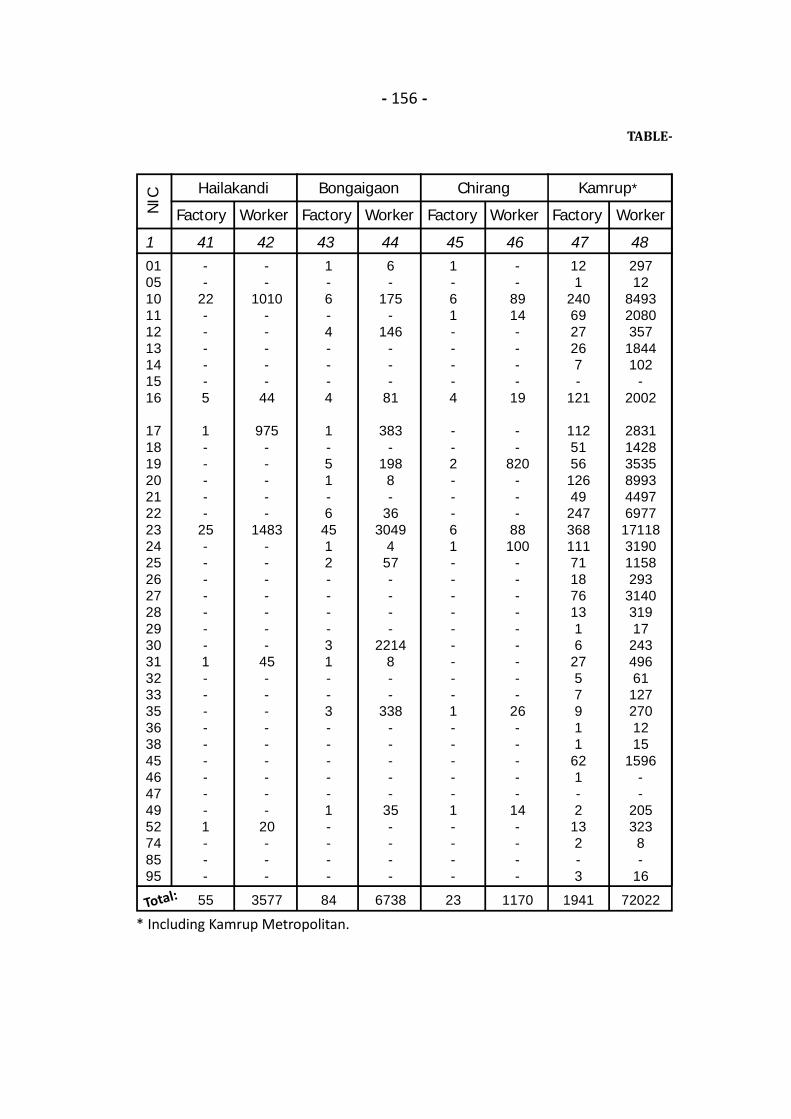
- 156 -
TABLE-
* Including Kamrup Metropolitan.
1 41 42 43 44 45 46 47 48
NIC
Factory Worker Factory Worker Factory Worker Factory Worker
Hailakandi Bongaigaon Chirang Kamrup*
Total:
010510111213141516
17181920212223242526272829303132333536384546474952748595
--
22-----5
1-----
25-------1---------1---
55
--
1010-----
44
975-----
1483-------
45---------
20---
3577
1-6-4---4
1-51-64512----31--3-----1----
84
6-
175-
146---
81
383-
1988-
363049
457----
22148--
338-----
35----
6738
1-61----4
--2---61---------1-----1----
23
--
8914----
19
--
820---
88100
---------
26-----
14----
1170
121
2406927267-
121
11251561264924736811171187613162757911621-2132-3
1941
29712
849320803571844102
-2002
2831142835358993449769771711831901158293314031917243496611272701215
1596--
2053238-
16
72022
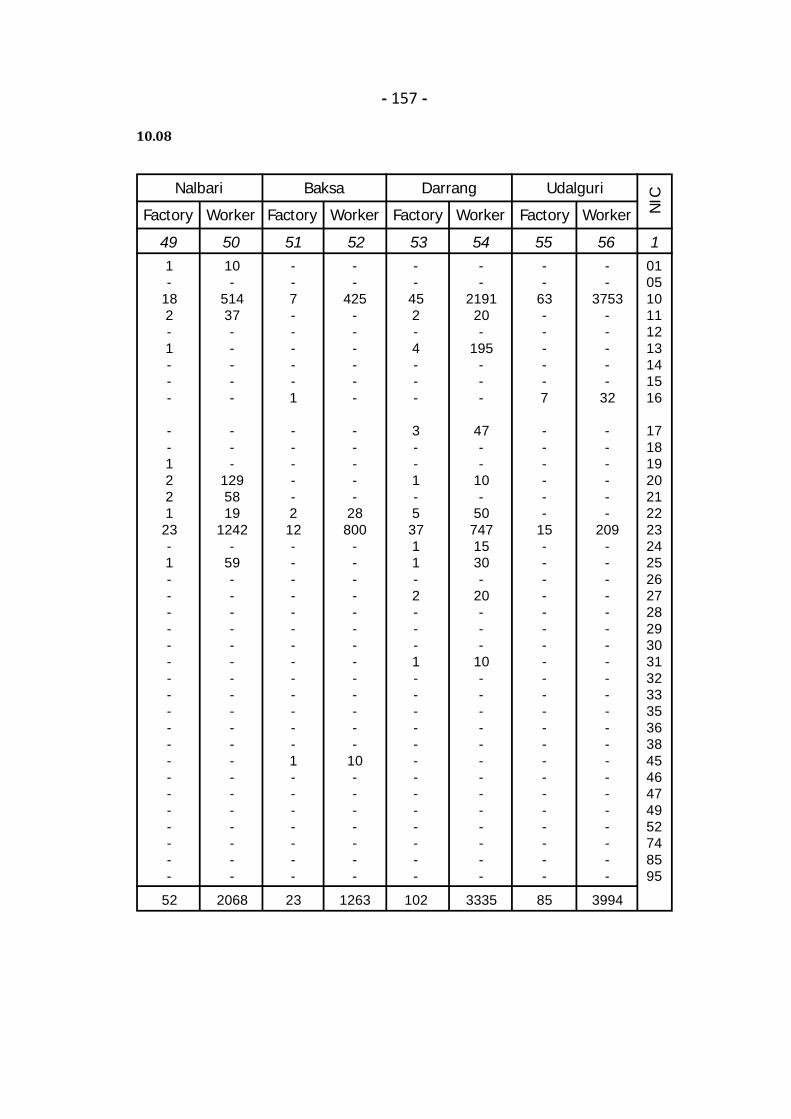
- 157 -
10.08
49 50 51 52 53 54 55 56 1
Factory Worker Factory Worker Factory Worker Factory Worker NIC
Nalbari Baksa Darrang Udalguri
010510111213141516
17181920212223242526272829303132333536384546474952748595
1-
182-1---
--122123-1-------------------
52
10-
51437-----
---
1295819
1242-
59-------------------
2068
--7-----1
-----212-------------1-------
23
--
425------
-----
28800
-------------
10-------
1263
--
452-4---
3--1-53711-2---1-------------
102
--
219120-
195---
47--
10-
507471530-
20---
10-------------
3335
--
63-----7
------
15---------------------
85
--
3753-----
32
------
209---------------------
3994
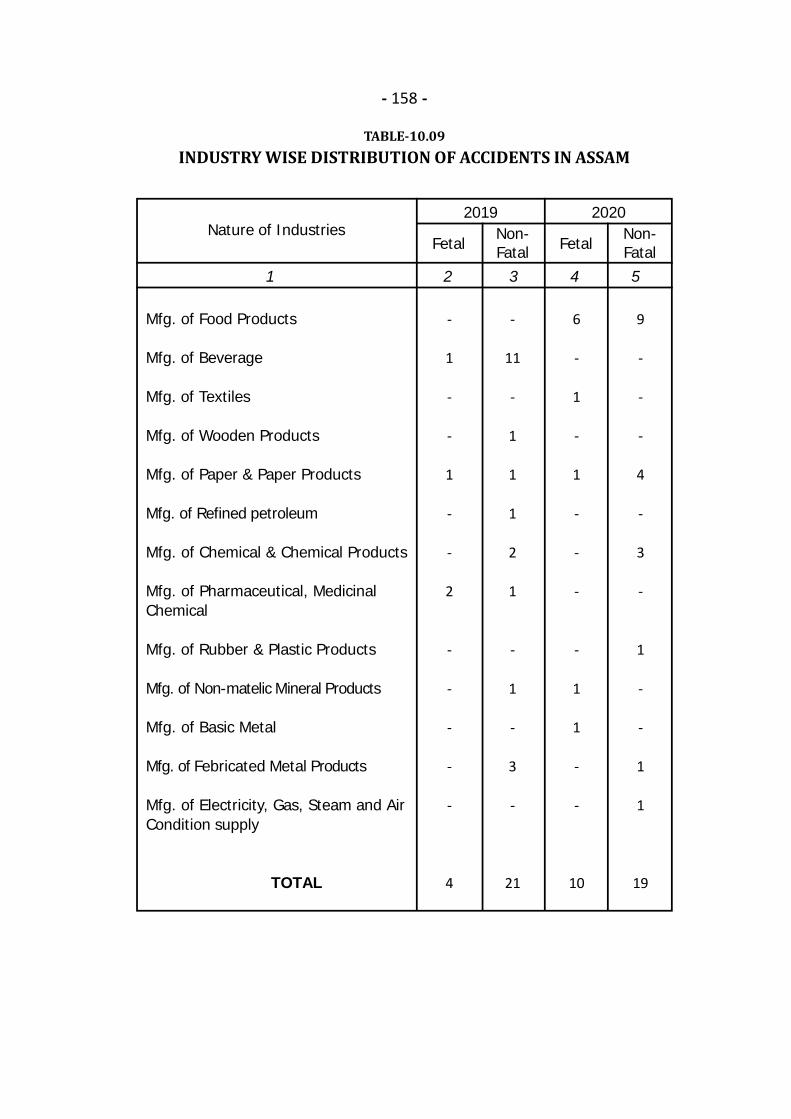
- 158 -
TABLE-10.09INDUSTRY WISE DISTRIBUTION OF ACCIDENTS IN ASSAM
1 2 3 4 5
Mfg. of Food Products
Mfg. of Beverage
Mfg. of Textiles
Mfg. of Wooden Products
Mfg. of Paper & Paper Products
Mfg. of Refined petroleum
Mfg. of Chemical & Chemical Products
Mfg. of Pharmaceutical, MedicinalChemical
Mfg. of Rubber & Plastic Products
Mfg. of Non-matelic Mineral Products
Mfg. of Basic Metal
Mfg. of Febricated Metal Products
Mfg. of Electricity, Gas, Steam and AirCondition supply
TOTAL
Nature of Industries
-
1
-
-
1
-
-
2
-
-
-
-
-
4
-
11
-
1
1
1
2
1
-
1
-
3
-
21
FetalNon-FatalFetal
Non-Fatal
6
-
1
-
1
-
-
-
-
1
1
-
-
10
9
-
-
-
4
-
3
-
1
-
-
1
1
19
2019 2020
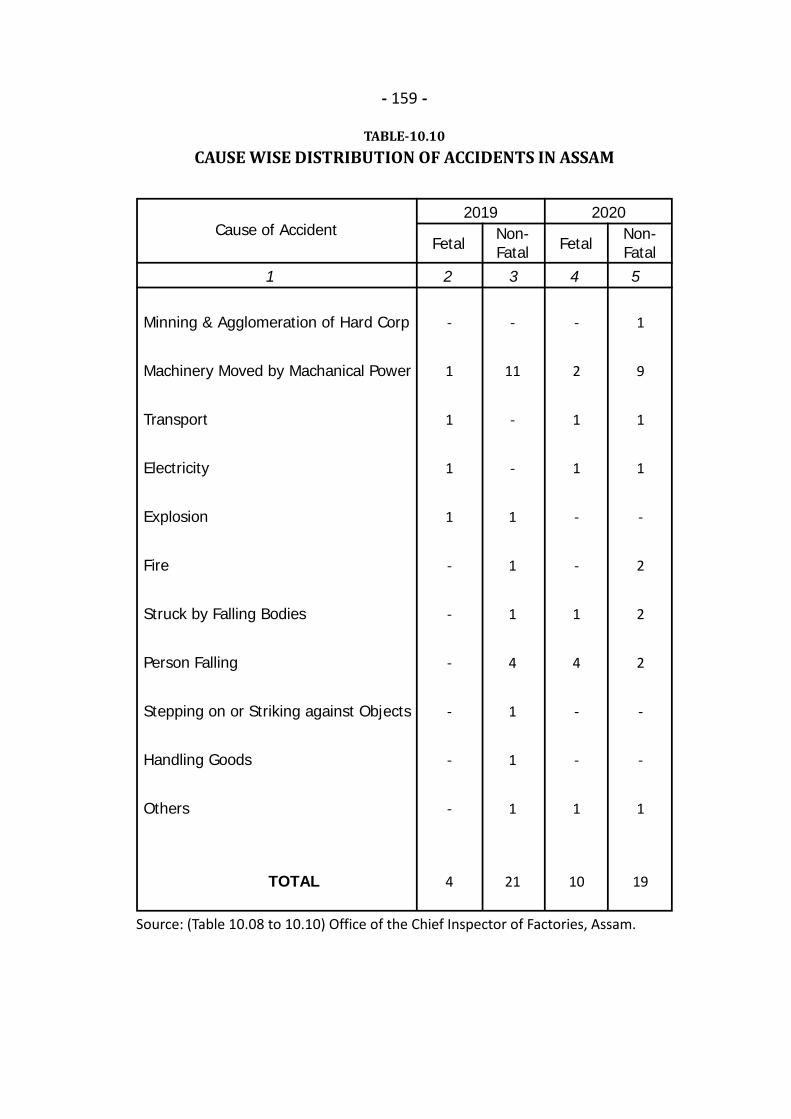
- 159 -
TABLE-10.10CAUSE WISE DISTRIBUTION OF ACCIDENTS IN ASSAM
1 2 3 4 5
Minning & Agglomeration of Hard Corp
Machinery Moved by Machanical Power
Transport
Electricity
Explosion
Fire
Struck by Falling Bodies
Person Falling
Stepping on or Striking against Objects
Handling Goods
Others
TOTAL
Cause of Accident
-
1
1
1
1
-
-
-
-
-
-
4
-
11
-
-
1
1
1
4
1
1
1
21
FetalNon-FatalFetal
Non-Fatal
-
2
1
1
-
-
1
4
-
-
1
10
1
9
1
1
-
2
2
2
-
-
1
19
2019 2020
Source: (Table 10.08 to 10.10) Office of the Chief Inspector of Factories, Assam.

.
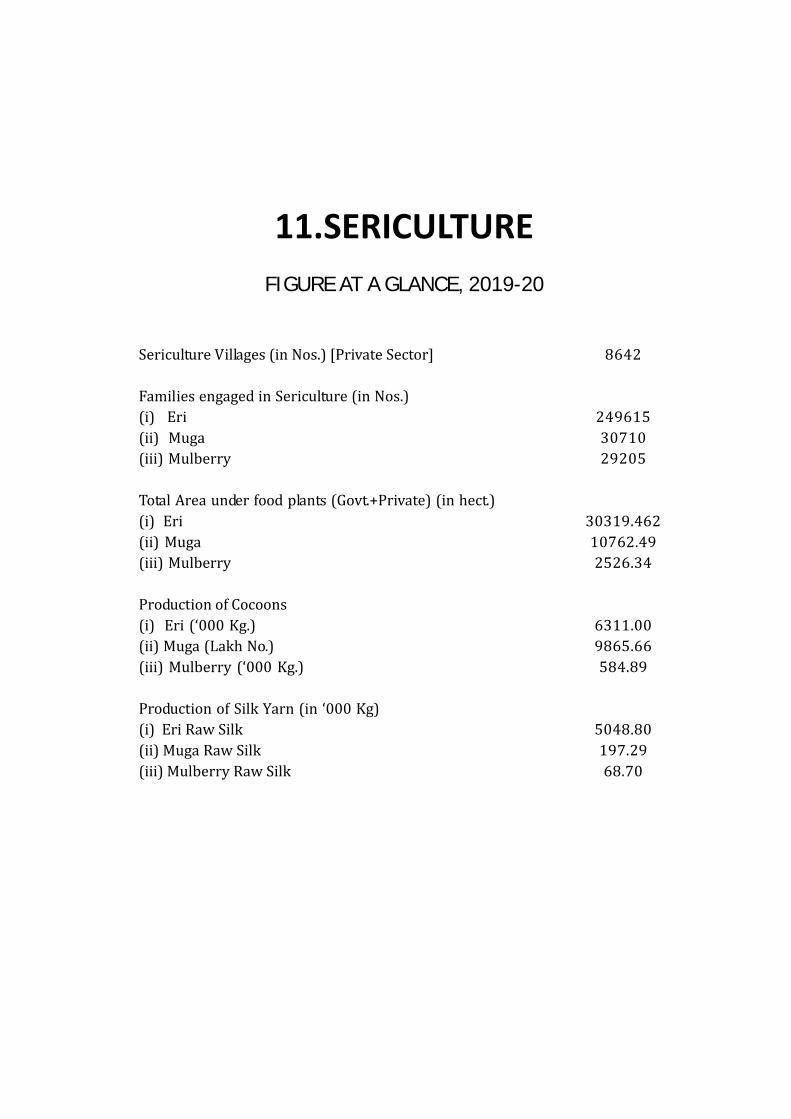
11.SERICULTUREFIGURE AT A GLANCE, 2019-20
Sericulture Villages (in Nos.) [Private Sector]Families engaged in Sericulture (in Nos.)(i) Eri(ii) Muga(iii) MulberryTotal Area under food plants (Govt.+Private) (in hect.)(i) Eri(ii) Muga(iii) MulberryProduction of Cocoons(i) Eri (‘000 Kg.)(ii) Muga (Lakh No.)(iii) Mulberry (‘000 Kg.)Production of Silk Yarn (in ‘000 Kg)(i) Eri Raw Silk(ii) Muga Raw Silk(iii) Mulberry Raw Silk
86422496153071029205
30319.46210762.492526.346311.009865.66584.895048.80197.2968.70

- 162 -
TABLE-AREA UNDER FOOD TREE PLANTATION BOTH GOVERNMENT &
1 2 3 4 5 6 7
KokrajharDhubriGoalparaBarpetaMorigaonNagaonSonitpurLakhimpurDhemajiTinsukiaDibrugarhSivasagarJorhatGolaghatKarbi AnglongDima HasaoCacharKarimganjHailakandiBongaigaonChirangKamrupKamrup MetroNalbariBaksaDarrangUdalguriBiswanathCharaideoHojaiMajuliSouth SalmaraWest Karbi AnglongAssam
Sl.No. District
No. ofSericultr.Villages(PrivateSector)
No. ofFarm/Centre(Govt.) Govt. Pvt. Total
123456789101112131415161718192021222324252627282930313233
478117273
77218339405736531183390431290155549375158128
70158257210
8167
408159515215
67122106
44330
8642
81515781231211
2512
63302311
1036001101
124
45.360
21.990
28.859.633.00
10.005.009.292.002.46
01.53
36.381.20
21.4720.14
0.300
10.52347.47
13.533.65
32.578.07
28.5731.42
07.001.602.00
227.30932.30
454.64105.00
1090.00915.00106.00
1130.00490.00
2058.00803.00
1070.001230.001130.001140.001120.002150.002090.00
163.00115.00169.00
4040.00390.66
1322.00428.00230.00372.43980.00774.43436.00410.00230.00350.00
95.001800.00
29387.16
500.00105.00
1111.99915.00134.85
1139.63493.00
2068.00808.00
1079.291232.001132.461140.001121.532186.382091.20
184.47135.14169.30
4040.00401.18
1669.47441.53233.65405.00988.07803.00467.42410.00237.00351.60
97.002027.30
30319.46
ERI
Area under food plantboth Govt. & Private Sector
(in Hect.)

- 163 -
11.01PRIVATE SECTOR FOR PRODUCTION OF COCOON IN ASSAM, 2019-20
8 9 10 11 12 13 14 15 1
Pvt.
No. ofFarm/Centre
Govt. Pvt. TotalTotal
No. ofFarm/Centre
Govt.
Sl.No.
207034375266753330111621301100000
83
55.100
170.0016.9028.8521.3651.1468.1714.0016.00
114.7095.9789.2375.60
012.2534.3917.00
8.00281.00
16.00440.80
19.0048.0020.9312.9813.00
00000
10.201750.37
262.9021.00
403.0091.00
102.0095.00
133.002170.001165.00
272.00601.00544.00360.00396.00
38.0020.00
265.0062.0030.0035.00
176.00481.56
7.00207.39
96.00497.02105.00260.00
9.0062.00
2.2514.0029.00
9012.12
318.0021.00
573.00107.90130.85116.36184.14
2238.171179.00
288.00715.70639.97449.23471.60
38.0032.25
299.3978.6038.00
316.00192.00922.36
26.00255.59116.93510.00118.00260.00
9.0062.00
2.2514.0039.20
10762.49
61632769255525
1811
62230305331000000
121
4.204.00
35.209.758.00
12.5812.0215.35
6.500
20.633.506.00
16.2022.50
2.5523.85
1.411.50
13.102.007.00
14.606.00
14.606.67
00
2.002.002.002.00
13.20291.27
20.952.00
42.008.00
57.0047.0042.00
495.00165.00
75.0099.0065.00
153.0030.0015.5010.00
3.505.006.008.00
59.2026.00
1.0024.85
593.0052.4952.0027.0013.0023.00
4.581.009.00
2235.07
25.156.20
77.2017.7565.0059.5854.02
510.35171.50
75.00119.63
68.50159.00
46.2038.0012.5527.35
6.417.50
21.1061.2033.0015.6031.01
607.6059.1652.0027.0015.0025.00
6.583.00
22.202526.34
123456789101112131415161718192021222324252627282930313233
MUGA MULBERRY
Area under food plantboth Govt. & Private
Sector (in Hect.)
Area under food plantboth Govt. & Private
Sector (in Hect.)
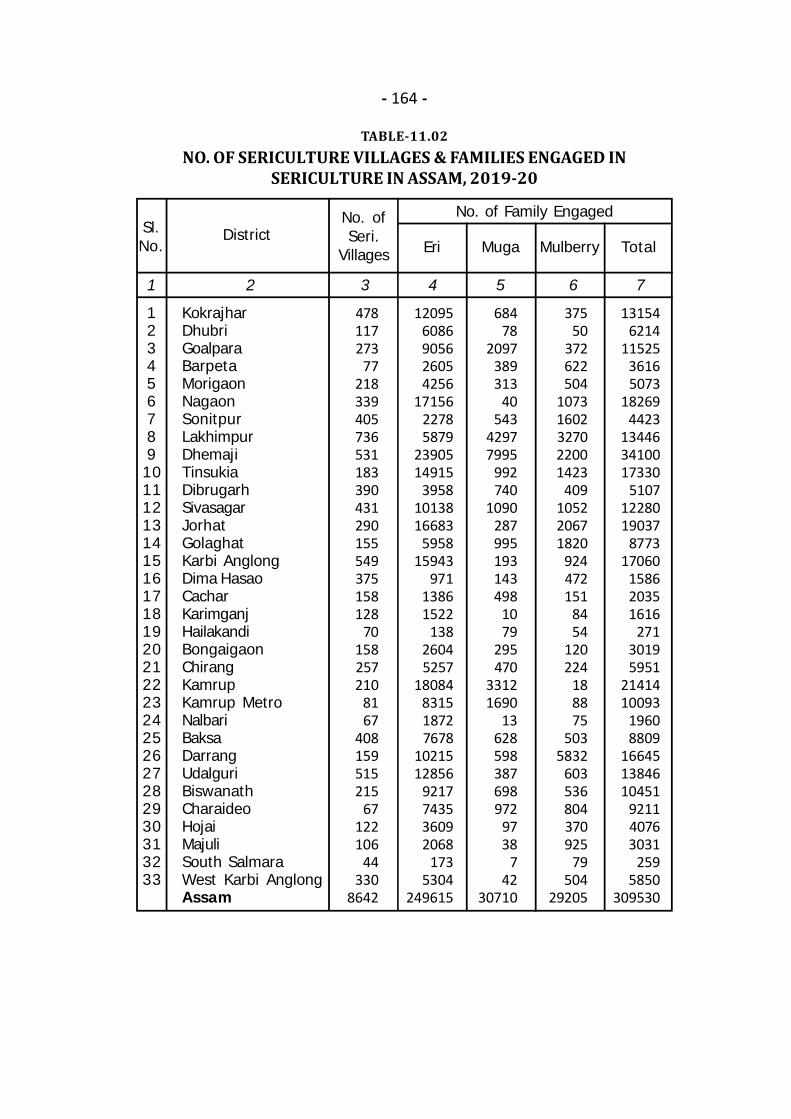
- 164 -
TABLE-11.02NO. OF SERICULTURE VILLAGES & FAMILIES ENGAGED IN
SERICULTURE IN ASSAM, 2019-20
1 2 3 4 5 6 7
KokrajharDhubriGoalparaBarpetaMorigaonNagaonSonitpurLakhimpurDhemajiTinsukiaDibrugarhSivasagarJorhatGolaghatKarbi AnglongDima HasaoCacharKarimganjHailakandiBongaigaonChirangKamrupKamrup MetroNalbariBaksaDarrangUdalguriBiswanathCharaideoHojaiMajuliSouth SalmaraWest Karbi AnglongAssam
Sl.No.
DistrictNo. ofSeri.
Villages Eri Muga Mulberry Total
123456789101112131415161718192021222324252627282930313233
478117273
77218339405736531183390431290155549375158128
70158257210
8167
408159515215
67122106
44330
8642
120956086905626054256
1715622785879
2390514915
39581013816683
595815943
97113861522
13826045257
18084831518727678
1021512856
9217743536092068
1735304
249615
68478
2097389313
40543
42977995
992740
1090287995193143498
1079
295470
33121690
13628598387698972
9738
742
30710
37550
372622504
10731602327022001423
409105220671820
924472151
8454
120224
188875
5035832
603536804370925
79504
29205
131546214
1152536165073
182694423
134463410017330
51071228019037
877317060
158620351616
27130195951
2141410093
19608809
166451384610451
921140763031
2595850
309530
No. of Family Engaged

- 165 -
TABLE-11.03PRODUCTION OF COCOON & RAW SILK IN ASSAM, 2019-20
1 2 3 4 5 6 7
KokrajharDhubriGoalparaBarpetaMorigaonNagaonSonitpurLakhimpurDhemajiTinsukiaDibrugarhSivasagarJorhatGolaghatKarbi AnglongDima HasaoCacharKarimganjHailakandiBongaigaonChirangKamrup(R+M)NalbariBaksaDarrangUdalguriBiswanathCharaideoHojaiMajuliSouth SalmaraWest K AnglongAssam
District Eri(in ‘000
Kg)
Muga(in Lakh
No.)
Mulberry(in ‘000
Kg)
Eri(in ‘000
Kg)
Muga(in ‘000
Kg.)
Mulberry(in ‘000
Kg)
314.07129.79157.06159.70260.00203.00219.78322.26365.68250.73190.19325.96211.90309.85310.62212.61
69.4953.0033.32
135.77201.17199.97
67.29304.07
96.00546.20100.00215.00
60.53185.00
30.0071.00
6311.00
510.000
1105.1627.0076.00
7.0053.52
2055.50820.00
91.00725.27900.00
14.50800.21
2.003.00
50.0000
15.00527.00653.50
0435.00395.00544.00
10.0037.00
3.004.00
02.00
9865.66
34.003.717.466.867.417.11
16.4179.8127.7112.3115.56
8.1121.5621.1636.00
4.333.714.963.714.71
17.005.113.46
51.0098.8168.00
4.002.001.003.001.003.91
584.89
251.25103.83125.65127.76208.00162.40175.82257.81292.54200.58152.15260.77169.52247.88248.49170.08
55.5942.4026.65
108.62160.94160.00
53.83243.25
76.80436.96
80.00172.00
48.42148.00
24.0056.80
5048.80
10.200
22.100.541.520.141.07
41.1116.40
1.8214.5018.00
0.2916.00
0.040.061.00
00
0.3010.5413.06
08.707.90
10.880.200.740.060.08
00.04
197.29
4.000.440.880.810.870.841.939.393.271.451.830.952.542.494.230.510.440.500.400.552.000.600.416.00
11.628.000.470.240.120.350.110.46
68.70
Production of Cocoon Production of Yarn/Raw Silk
Source: (Table 11.01 to 11.03) Directorate of Sericulture, Assam.

.

12.HANDLOOM AND TEXTILESFIGURE AT A GLANCE, 2019-20
Handloom Training Centres (in Nos.)Trainee in Handloom Training Centre (in Nos.)Weavers Extension Service Unit (in Nos.)Handloom Production Centre (in Nos.)Handloom Production Clothes (in Metre)
1021565
9820
17026.09
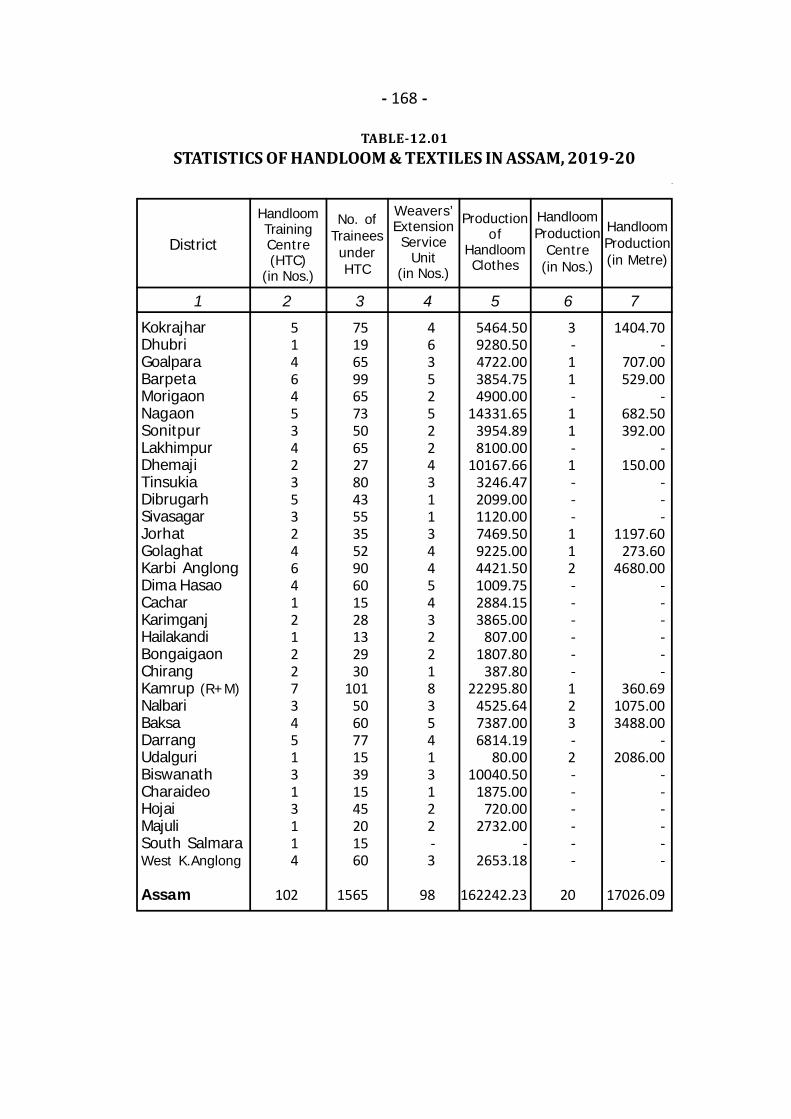
TABLE-12.01STATISTICS OF HANDLOOM & TEXTILES IN ASSAM, 2019-20
.
KokrajharDhubriGoalparaBarpetaMorigaonNagaonSonitpurLakhimpurDhemajiTinsukiaDibrugarhSivasagarJorhatGolaghatKarbi AnglongDima HasaoCacharKarimganjHailakandiBongaigaonChirangKamrup (R+M)NalbariBaksaDarrangUdalguriBiswanathCharaideoHojaiMajuliSouth SalmaraWest K.Anglong
Assam
District
HandloomTrainingCentre(HTC)
(in Nos.)
No. ofTraineesunderHTC
51464534235324641212273451313114
102
751965996573506527804355355290601528132930
10150607715391545201560
1565
5464.509280.504722.003854.754900.00
14331.653954.898100.00
10167.663246.472099.001120.007469.509225.004421.501009.752884.153865.00
807.001807.80
387.8022295.80
4525.647387.006814.19
80.0010040.50
1875.00720.00
2732.00-
2653.18
162242.23
3-11-11-1---112------123-2------
20
1404.70-
707.00529.00
-682.50392.00
-150.00
---
1197.60273.60
4680.00------
360.691075.003488.00
-2086.00
------
17026.09
Productionof
HandloomClothes
HandloomProduction
Centre(in Nos.)
- 168 -
1 2 3 4 5 6 7
HandloomProduction(in Metre)
Weavers’ExtensionService
Unit(in Nos.)
463525224311344543221835413122-3
98
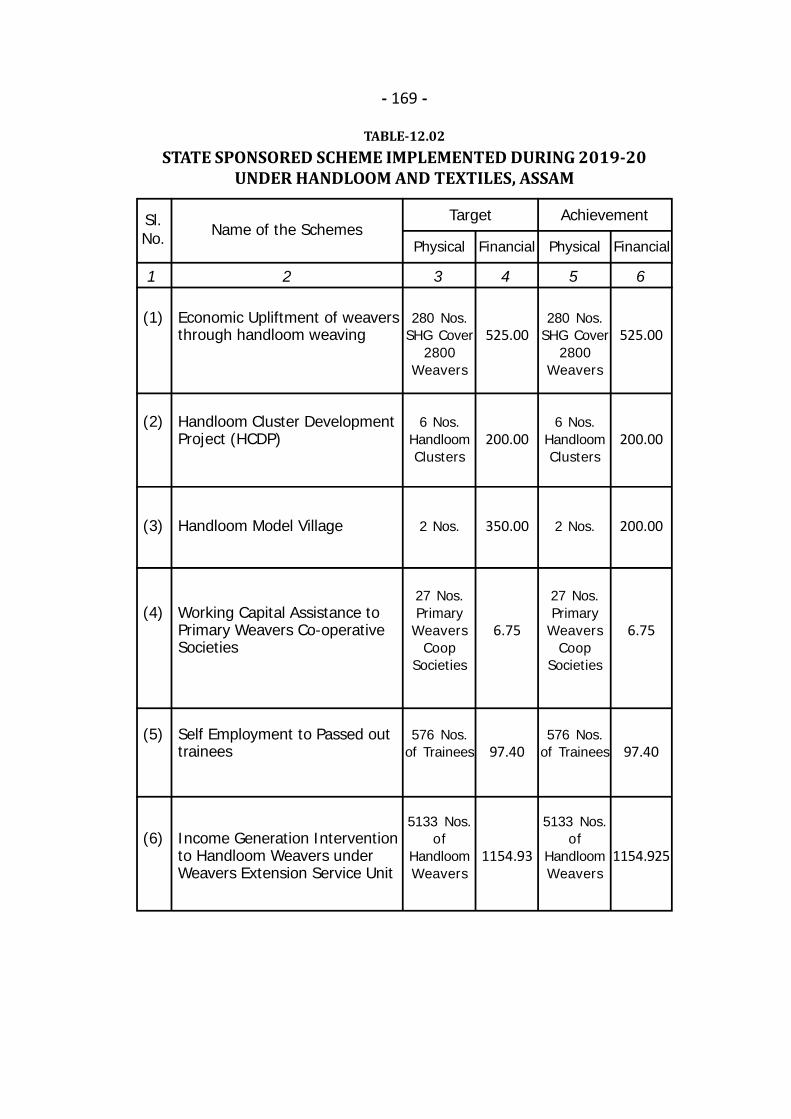
TABLE-12.02STATE SPONSORED SCHEME IMPLEMENTED DURING 2019-20
UNDER HANDLOOM AND TEXTILES, ASSAM
1 2 3 4 5 6
Economic Upliftment of weaversthrough handloom weaving
Handloom Cluster DevelopmentProject (HCDP)
Handloom Model Village
Working Capital Assistance toPrimary Weavers Co-operativeSocieties
Self Employment to Passed outtrainees
Income Generation Interventionto Handloom Weavers underWeavers Extension Service Unit
Sl.No. Name of the Schemes
Target
(1)
(2)
(3)
(4)
(5)
(6)
- 169 -
Achievement
Physical Financial Physical Financial
280 Nos.SHG Cover
2800Weavers
6 Nos.HandloomClusters
2 Nos.
27 Nos.Primary
WeaversCoop
Societies
576 Nos.of Trainees
5133 Nos.of
HandloomWeavers
280 Nos.SHG Cover
2800Weavers
6 Nos.HandloomClusters
2 Nos.
27 Nos.Primary
WeaversCoop
Societies
576 Nos.of Trainees
5133 Nos.of
HandloomWeavers
525.00
200.00
350.00
6.75
97.40
1154.93
525.00
200.00
200.00
6.75
97.40
1154.925
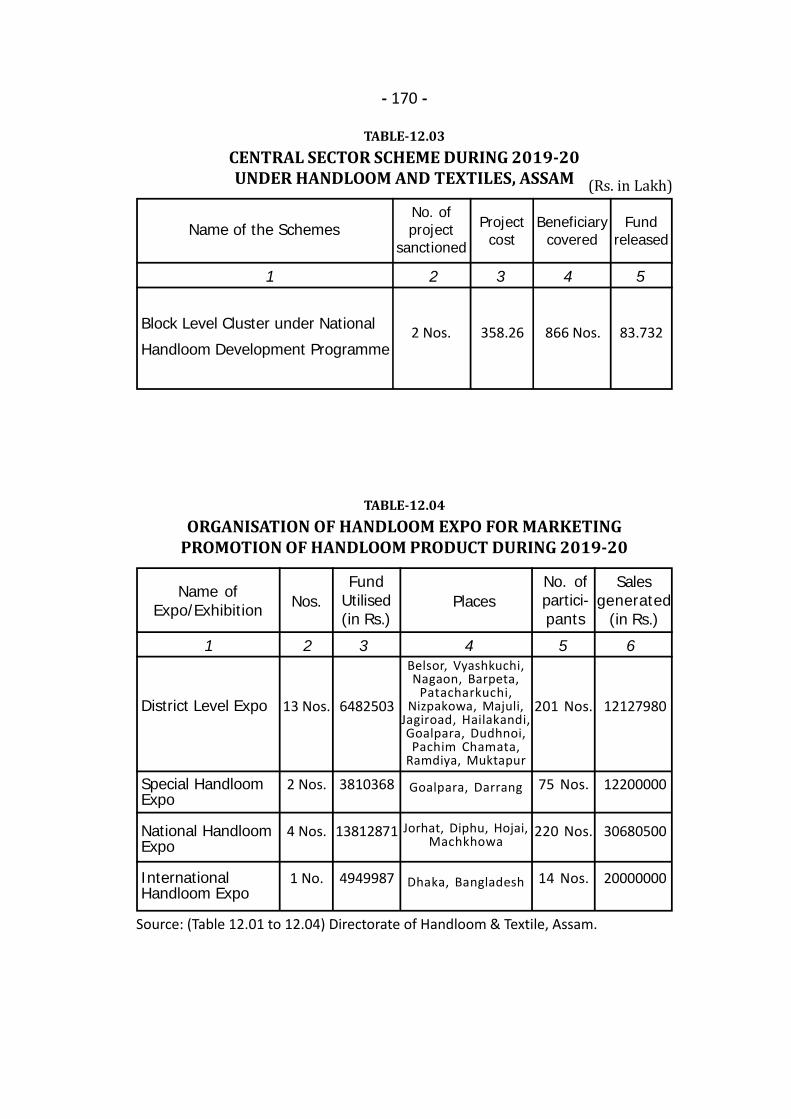
TABLE-12.03CENTRAL SECTOR SCHEME DURING 2019-20UNDER HANDLOOM AND TEXTILES, ASSAM
1 2 3 4 5
Block Level Cluster under National
Handloom Development Programme
Name of the Schemes
- 170 -
No. ofproject
sanctioned
Projectcost
Beneficiarycovered
Fundreleased
358.26 83.732
(Rs. in Lakh)
2 Nos. 866 Nos.
TABLE-12.04ORGANISATION OF HANDLOOM EXPO FOR MARKETING
PROMOTION OF HANDLOOM PRODUCT DURING 2019-20
1 2 3 4 5 6
District Level Expo
Special HandloomExpo
National HandloomExpo
InternationalHandloom Expo
Name ofExpo/Exhibition Nos.
FundUtilised(in Rs.)
PlacesNo. ofpartici-pants
6482503
3810368
13812871
4949987
201 Nos.
75 Nos.
220 Nos.
14 Nos.
13 Nos.
2 Nos.
4 Nos.
1 No.
Belsor, Vyashkuchi,Nagaon, Barpeta,
Patacharkuchi,Nizpakowa, Majuli,
Jagiroad, Hailakandi,Goalpara, Dudhnoi,Pachim Chamata,
Ramdiya, Muktapur
Goalpara, Darrang
Jorhat, Diphu, Hojai,Machkhowa
Dhaka, Bangladesh
Salesgenerated
(in Rs.)
12127980
12200000
30680500
20000000
Source: (Table 12.01 to 12.04) Directorate of Handloom & Textile, Assam.

13.KHADI & VILLAGE INDUSTRIESFIGURE AT A GLANCE, 2019-20
Working Centre under Khadi & Village IndustryBoardValue of Production in Khadi & Village IndustriesValue of Sales in Khadi & Village IndustriesEmployment in Khadi & Village Industries
(in Nos.)(in Lakh)(in Lakh)(in Nos.)
62702800.123459.93
5337
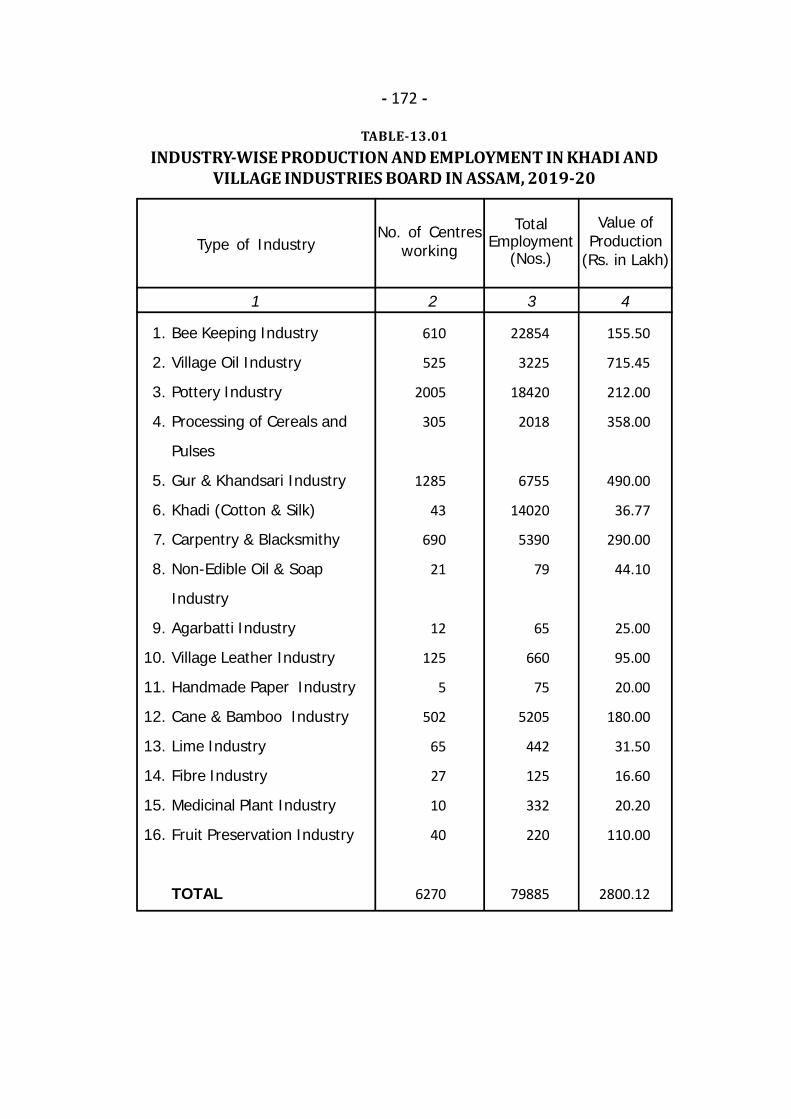
- 172 -
TABLE-13.01INDUSTRY-WISE PRODUCTION AND EMPLOYMENT IN KHADI AND
VILLAGE INDUSTRIES BOARD IN ASSAM, 2019-20
1 2 3 4
No. of CentresworkingType of Industry
1.
2.
3.
4.
5.
6.
7.
8.
9.
10.
11.
12.
13.
14.
15.
16.
610
525
2005
305
1285
43
690
21
12
125
5
502
65
27
10
40
6270
22854
3225
18420
2018
6755
14020
5390
79
65
660
75
5205
442
125
332
220
79885
155.50
715.45
212.00
358.00
490.00
36.77
290.00
44.10
25.00
95.00
20.00
180.00
31.50
16.60
20.20
110.00
2800.12
TotalEmployment
(Nos.)
Value ofProduction
(Rs. in Lakh)
Bee Keeping Industry
Village Oil Industry
Pottery Industry
Processing of Cereals and
Pulses
Gur & Khandsari Industry
Khadi (Cotton & Silk)
Carpentry & Blacksmithy
Non-Edible Oil & Soap
Industry
Agarbatti Industry
Village Leather Industry
Handmade Paper Industry
Cane & Bamboo Industry
Lime Industry
Fibre Industry
Medicinal Plant Industry
Fruit Preservation Industry
TOTAL
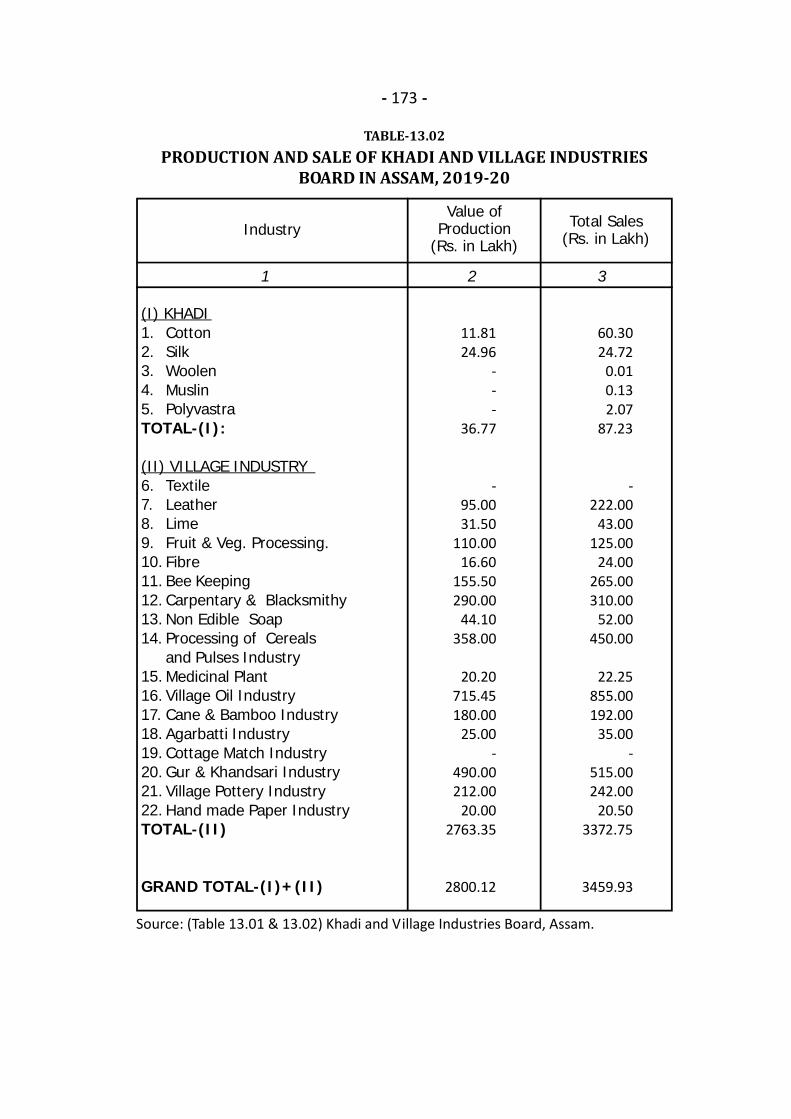
- 173 -
TABLE-13.02PRODUCTION AND SALE OF KHADI AND VILLAGE INDUSTRIES
BOARD IN ASSAM, 2019-20
1 2 3
CottonSilkWoolenMuslinPolyvastra
TextileLeatherLimeFruit & Veg. Processing.FibreBee KeepingCarpentary & BlacksmithyNon Edible SoapProcessing of Cerealsand Pulses IndustryMedicinal PlantVillage Oil IndustryCane & Bamboo IndustryAgarbatti IndustryCottage Match IndustryGur & Khandsari IndustryVillage Pottery IndustryHand made Paper Industry
IndustryValue of
Production(Rs. in Lakh)
11.8124.96
---
36.77
-95.0031.50
110.0016.60
155.50290.00
44.10358.00
20.20715.45180.00
25.00-
490.00212.00
20.002763.35
2800.12
60.3024.72
0.010.132.07
87.23
-222.00
43.00125.00
24.00265.00310.00
52.00450.00
22.25855.00192.00
35.00-
515.00242.00
20.503372.75
3459.93
Total Sales(Rs. in Lakh)
(I) KHADI1.2.3.4.5.TOTAL-(I):
(II) VILLAGE INDUSTRY6.7.8.9.10.11.12.13.14.
15.16.17.18.19.20.21.22.TOTAL-(II)
GRAND TOTAL-(I)+(II)
Source: (Table 13.01 & 13.02) Khadi and Village Industries Board, Assam.

- 174 -
TABLE-13.03STATUS OF KHADI AND VILLAGE INDUSTRIES IN ASSAM
DURING 2019-20
1 2 3 4 5
Cotton & Muslin
Silk
Woolen
Polyvastra
IndustryValue of
Production(Rs. in Lakh)
Sales(Rs. in Lakh)
Employ-ment
(in Nos.)
Wages(Rs. in Lakh)
75.39
1242.00
0
9.30
1326.69
171.24
1297.00
0
9.25
1477.49
808
4482
0
47
5337
33.95
275.00
0
1.62
310.57
A. KHADI AND POLYVASTRA
1.
2.
3.
4.
TOTAL - A:
Source: Khadi and Village Industries Commission, Govt. of India.
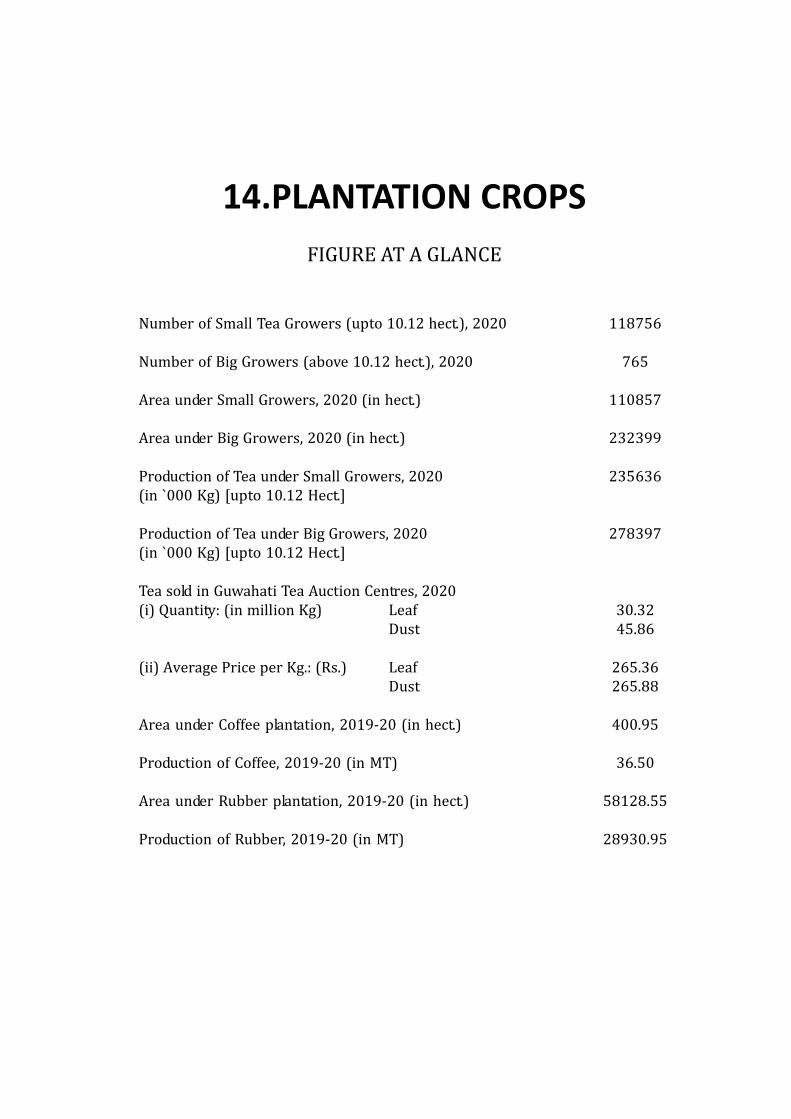
14.PLANTATION CROPSFIGURE AT A GLANCE118756765110857232399235636278397
30.3245.86265.36265.88400.9536.5058128.5528930.95
Number of Small Tea Growers (upto 10.12 hect.), 2020Number of Big Growers (above 10.12 hect.), 2020Area under Small Growers, 2020 (in hect.)Area under Big Growers, 2020 (in hect.)Production of Tea under Small Growers, 2020(in `000 Kg) [upto 10.12 Hect.]Production of Tea under Big Growers, 2020(in `000 Kg) [upto 10.12 Hect.]Tea sold in Guwahati Tea Auction Centres, 2020(i) Quantity: (in million Kg) LeafDust(ii) Average Price per Kg.: (Rs.) LeafDustArea under Coffee plantation, 2019-20 (in hect.)Production of Coffee, 2019-20 (in MT)Area under Rubber plantation, 2019-20 (in hect.)Production of Rubber, 2019-20 (in MT)
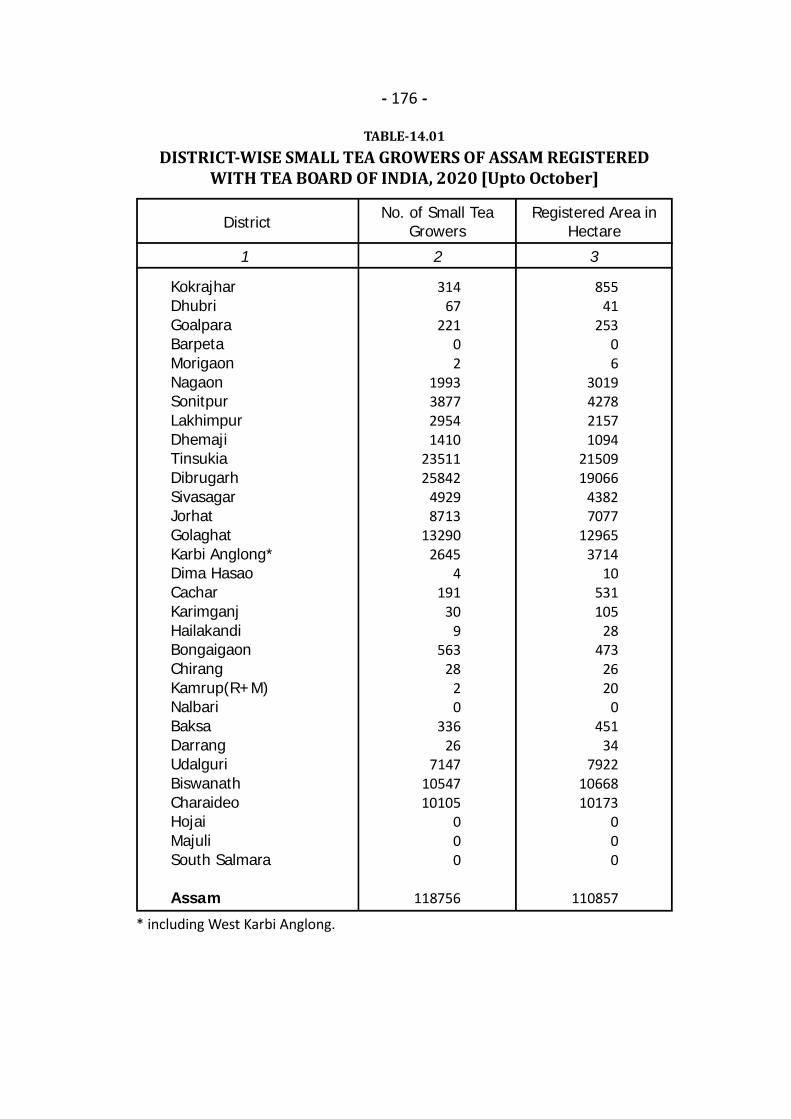
- 176 -
TABLE-14.01DISTRICT-WISE SMALL TEA GROWERS OF ASSAM REGISTERED
WITH TEA BOARD OF INDIA, 2020 [Upto October]
1 2 3
KokrajharDhubriGoalparaBarpetaMorigaonNagaonSonitpurLakhimpurDhemajiTinsukiaDibrugarhSivasagarJorhatGolaghatKarbi Anglong*Dima HasaoCacharKarimganjHailakandiBongaigaonChirangKamrup(R+M)NalbariBaksaDarrangUdalguriBiswanathCharaideoHojaiMajuliSouth Salmara
Assam
31467
22102
1993387729541410
2351125842
49298713
132902645
4191
309
56328
20
33626
71471054710105
000
118756
85541
25306
3019427821571094
2150919066
43827077
129653714
10531105
28473
2620
0451
347922
1066810173
000
110857
No. of Small TeaGrowers
Registered Area inHectareDistrict
* including West Karbi Anglong.
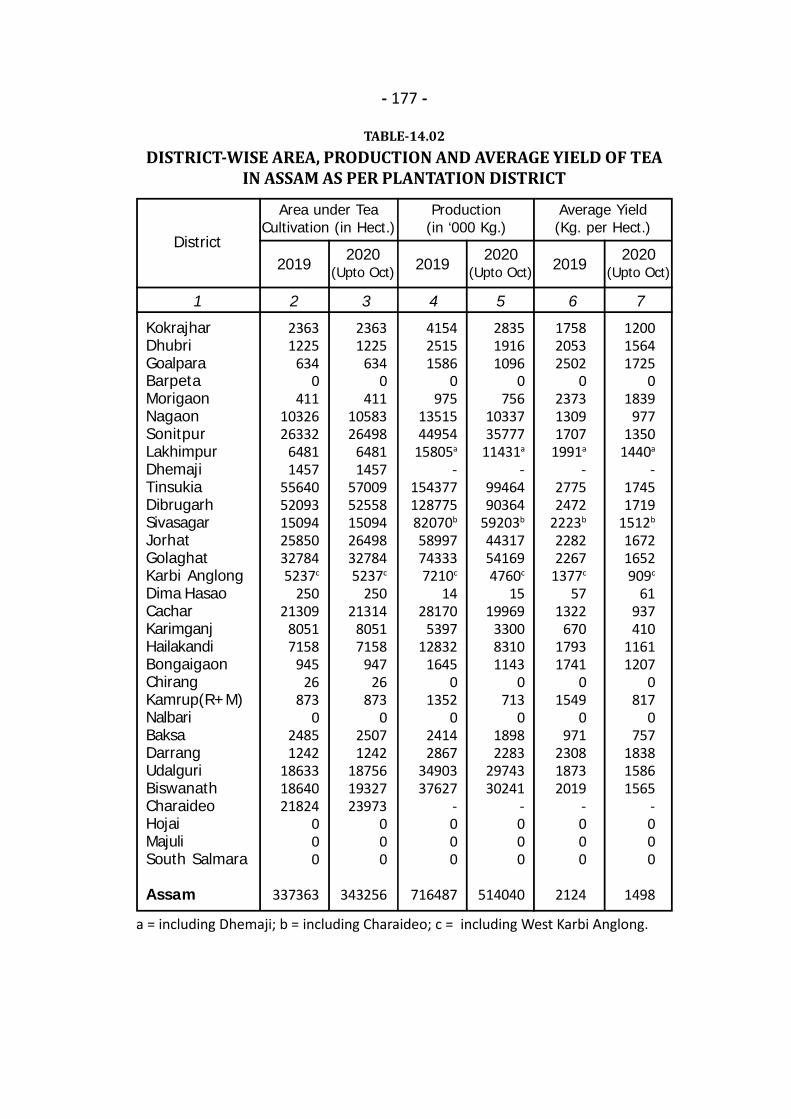
- 177 -
TABLE-14.02DISTRICT-WISE AREA, PRODUCTION AND AVERAGE YIELD OF TEA
IN ASSAM AS PER PLANTATION DISTRICT
a = including Dhemaji; b = including Charaideo; c = including West Karbi Anglong.
1 2 3 4 5 6 7
KokrajharDhubriGoalparaBarpetaMorigaonNagaonSonitpurLakhimpurDhemajiTinsukiaDibrugarhSivasagarJorhatGolaghatKarbi AnglongDima HasaoCacharKarimganjHailakandiBongaigaonChirangKamrup(R+M)NalbariBaksaDarrangUdalguriBiswanathCharaideoHojaiMajuliSouth Salmara
Assam
District
Area under TeaCultivation (in Hect.)
2019 2020(Upto Oct)
23631225
6340
4111032626332
64811457
55640520931509425850327845237c
25021309
80517158
94526
8730
24851242
186331864021824
000
337363
23631225
6340
4111058326498
64811457
57009525581509426498327845237c
25021314
80517158
94726
8730
25071242
187561932723973
000
343256
415425151586
0975
1351544954
15805a
-15437712877582070b
58997743337210c
1428170
539712832
16450
13520
24142867
3490337627
-000
716487
283519161096
0756
1033735777
11431a
-9946490364
59203b
44317541694760c
1519969
330083101143
0713
018982283
2974330241
-000
514040
175820532502
0237313091707
1991a
-27752472
2223b
22822267
1377c
571322
67017931741
01549
0971
230818732019
-000
2124
120015641725
01839
9771350
1440a
-17451719
1512b
16721652909c
61937410
11611207
0817
0757
183815861565
-000
1498
Production(in ‘000 Kg.)
Average Yield(Kg. per Hect.)
2019 2020(Upto Oct) 2019 2020
(Upto Oct)

- 178 -TABLE-14.03
NUMBER OF TEA GARDENS, AREA AND PRODUCTION OF TEAACCORDING TO SIZE OF THE GARDENS IN ASSAM
* Number of Gardens having Factory; # Upto October’2020.Source: (Table 14.01 to 14.03) Tea Board of India, Regional Office, Guwahati, Assam.
1 2 3 4 5 6 7 8 9 10 11
No.
of
Gar
dens
Big Growers(above 10.12 hect.) Total
Year
Small Growers(upto 10.12 hect.)
2018
2019
2020#
101085
107371
118756
105291
104965
110857
304490
321410
235636
765
765
765
232399
232399
232399
387420
395080
278397
101850
108136
119521
691910
716490
514033
Area
(in H
a)
Prod
uctio
n(‘0
00 K
g.)
No.
of
Gar
dens
Area
(in H
a)
Prod
uctio
n(‘0
00 K
g.)
No.
of
Gar
dens
Area
(in H
a)
Prod
uctio
n(‘0
00 K
g.)
337690
337364
343256
Gar
den
Fact
ory*
480
480
480
TABLE-14.04MONTH-WISE SALE AND PRICE OF TEA AT
GUWAHATI TEA AUCTION CENTRE
1 2 3 4 5
Month 2019 2020 2019 2020
JanuaryFebruaryMarchAprilMayJuneJulyAugustSeptemberOctoberNovemberDecemberTOTAL(Auction Centre)Private SaleGrand Total
16.163.220.696.01
10.6111.4217.9716.8922.8414.5716.8613.01
150.2533.79
184.04
20.9714.864.430.756.25
14.398.36
16.8020.4416.4917.2112.92153.8732.37186.24
126.59122.29116.20153.77136.18156.05161.25158.10152.16148.60143.42138.25147.06139.24145.62
120.0491.8785.03
120.88200.35253.20280.73293.93272.69221.49180.67162.61201.25266.97212.67
Sale (Million Kg.) Price (Rs. per Kg.)
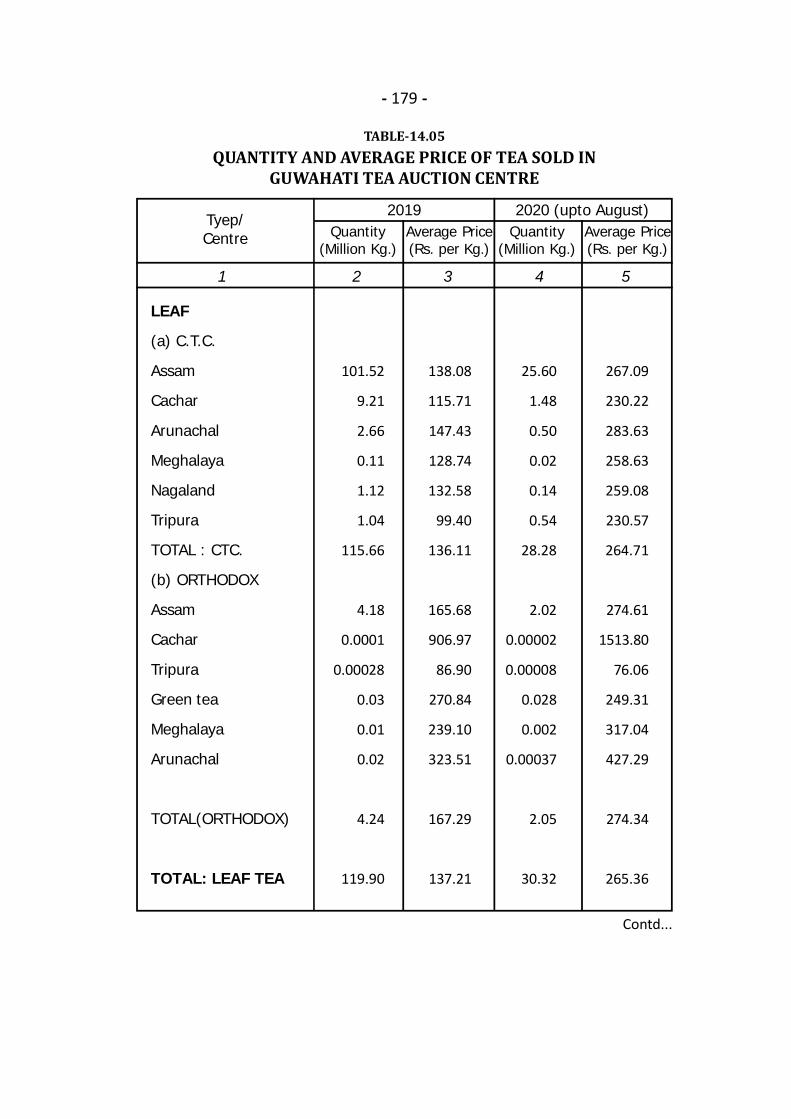
- 179 -
TABLE-14.05QUANTITY AND AVERAGE PRICE OF TEA SOLD IN
GUWAHATI TEA AUCTION CENTRE
Contd...
1 2 3 4 5
Tyep/Centre Quantity
(Million Kg.)Average Price(Rs. per Kg.)
Quantity(Million Kg.)
Average Price(Rs. per Kg.)
LEAF
(a) C.T.C.
Assam
Cachar
Arunachal
Meghalaya
Nagaland
Tripura
TOTAL : CTC.
(b) ORTHODOX
Assam
Cachar
Tripura
Green tea
Meghalaya
Arunachal
TOTAL(ORTHODOX)
TOTAL: LEAF TEA
101.52
9.21
2.66
0.11
1.12
1.04
115.66
4.18
0.0001
0.00028
0.03
0.01
0.02
4.24
119.90
138.08
115.71
147.43
128.74
132.58
99.40
136.11
165.68
906.97
86.90
270.84
239.10
323.51
167.29
137.21
25.60
1.48
0.50
0.02
0.14
0.54
28.28
2.02
0.00002
0.00008
0.028
0.002
0.00037
2.05
30.32
267.09
230.22
283.63
258.63
259.08
230.57
264.71
274.61
1513.80
76.06
249.31
317.04
427.29
274.34
265.36
2019 2020 (upto August)
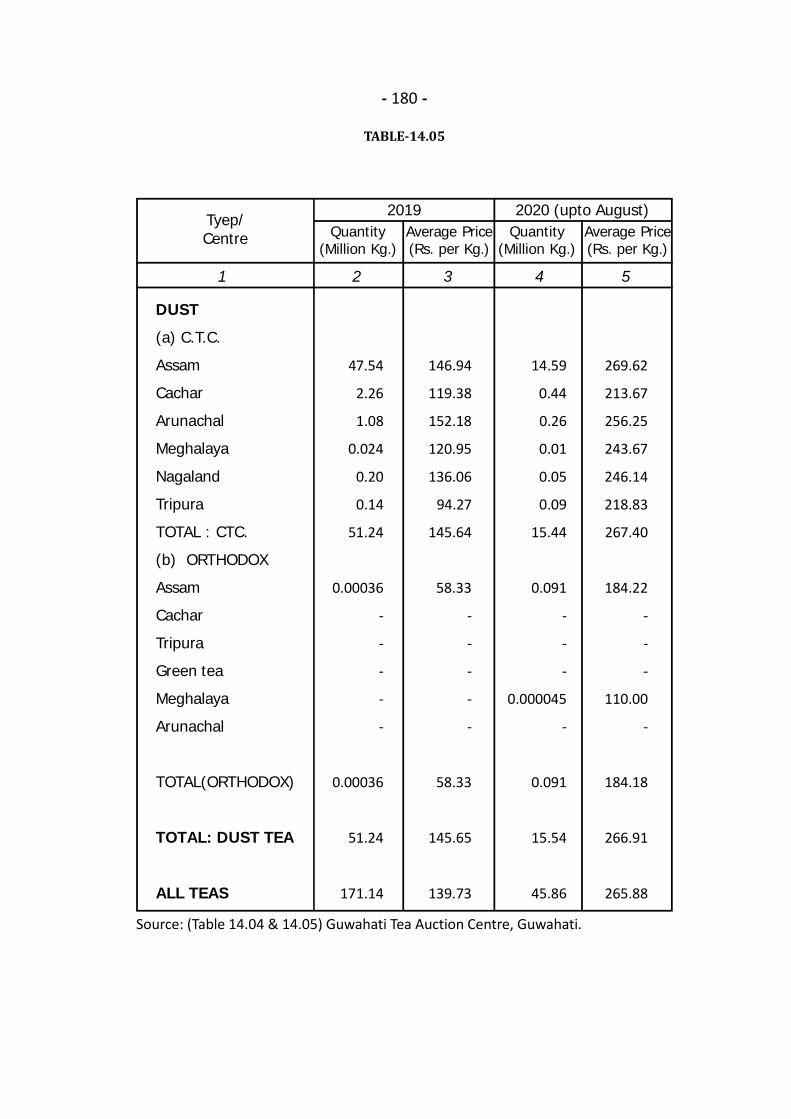
- 180 -
TABLE-14.05
Source: (Table 14.04 & 14.05) Guwahati Tea Auction Centre, Guwahati.
1 2 3 4 5
Tyep/Centre Quantity
(Million Kg.)Average Price(Rs. per Kg.)
Quantity(Million Kg.)
Average Price(Rs. per Kg.)
DUST
(a) C.T.C.
Assam
Cachar
Arunachal
Meghalaya
Nagaland
Tripura
TOTAL : CTC.
(b) ORTHODOX
Assam
Cachar
Tripura
Green tea
Meghalaya
Arunachal
TOTAL(ORTHODOX)
TOTAL: DUST TEA
ALL TEAS
47.54
2.26
1.08
0.024
0.20
0.14
51.24
0.00036
-
-
-
-
-
0.00036
51.24
171.14
146.94
119.38
152.18
120.95
136.06
94.27
145.64
58.33
-
-
-
-
-
58.33
145.65
139.73
14.59
0.44
0.26
0.01
0.05
0.09
15.44
0.091
-
-
-
0.000045
-
0.091
15.54
45.86
269.62
213.67
256.25
243.67
246.14
218.83
267.40
184.22
-
-
-
110.00
-
184.18
266.91
265.88
2019 2020 (upto August)
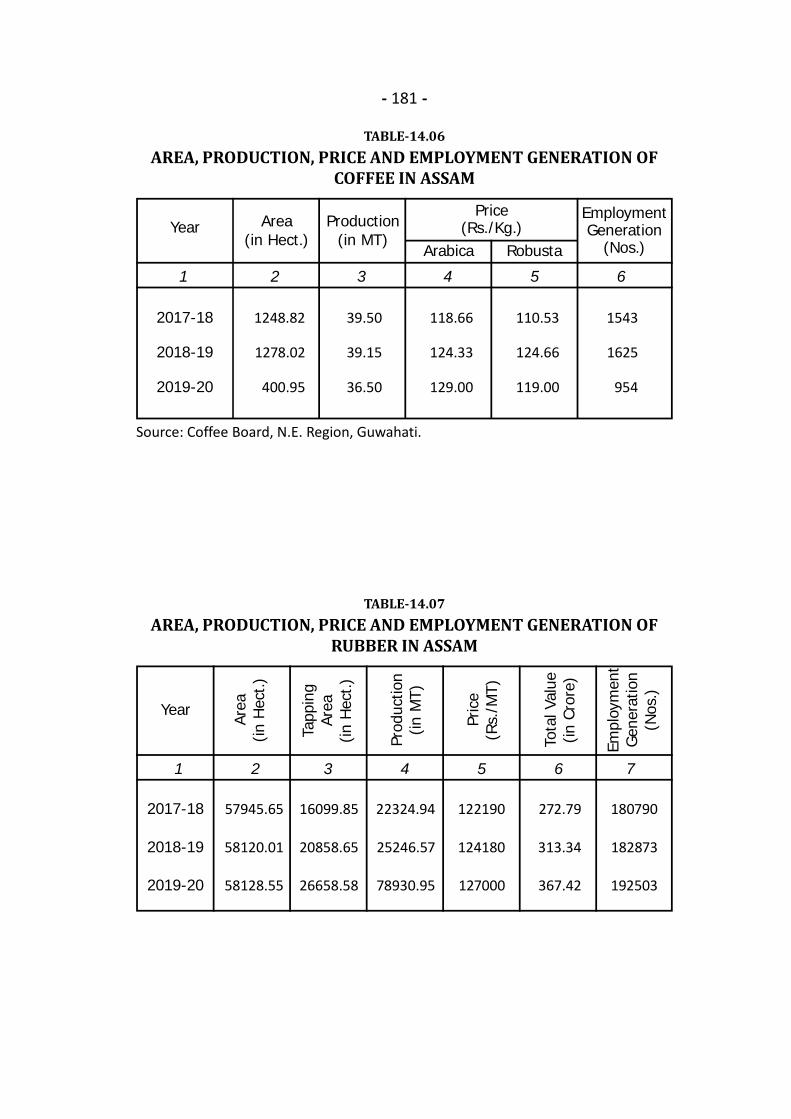
- 181 -
TABLE-14.06AREA, PRODUCTION, PRICE AND EMPLOYMENT GENERATION OF
COFFEE IN ASSAM
Source: Coffee Board, N.E. Region, Guwahati.
1 2 3 4 5 6
Year Area(in Hect.)
Production(in MT)
Price(Rs./Kg.)
EmploymentGeneration
(Nos.)
2017-18
2018-19
2019-20
1248.82
1278.02
400.95
39.50
39.15
36.50
1543
1625
954
TABLE-14.07AREA, PRODUCTION, PRICE AND EMPLOYMENT GENERATION OF
RUBBER IN ASSAM
1 2 3 4 5 6 7
Area
(in H
ect.)
Prod
uctio
n(in
MT)
Pric
e(R
s./M
T)
Tota
l Val
ue(in
Cro
re)
Empl
oym
ent
Gen
erat
ion
(Nos
.)
Tapp
ing
Area
(in H
ect.)
Year
2017-18
2018-19
2019-20
57945.65
58120.01
58128.55
16099.85
20858.65
26658.58
22324.94
25246.57
78930.95
122190
124180
127000
272.79
313.34
367.42
180790
182873
192503
Arabica Robusta
118.66
124.33
129.00
110.53
124.66
119.00
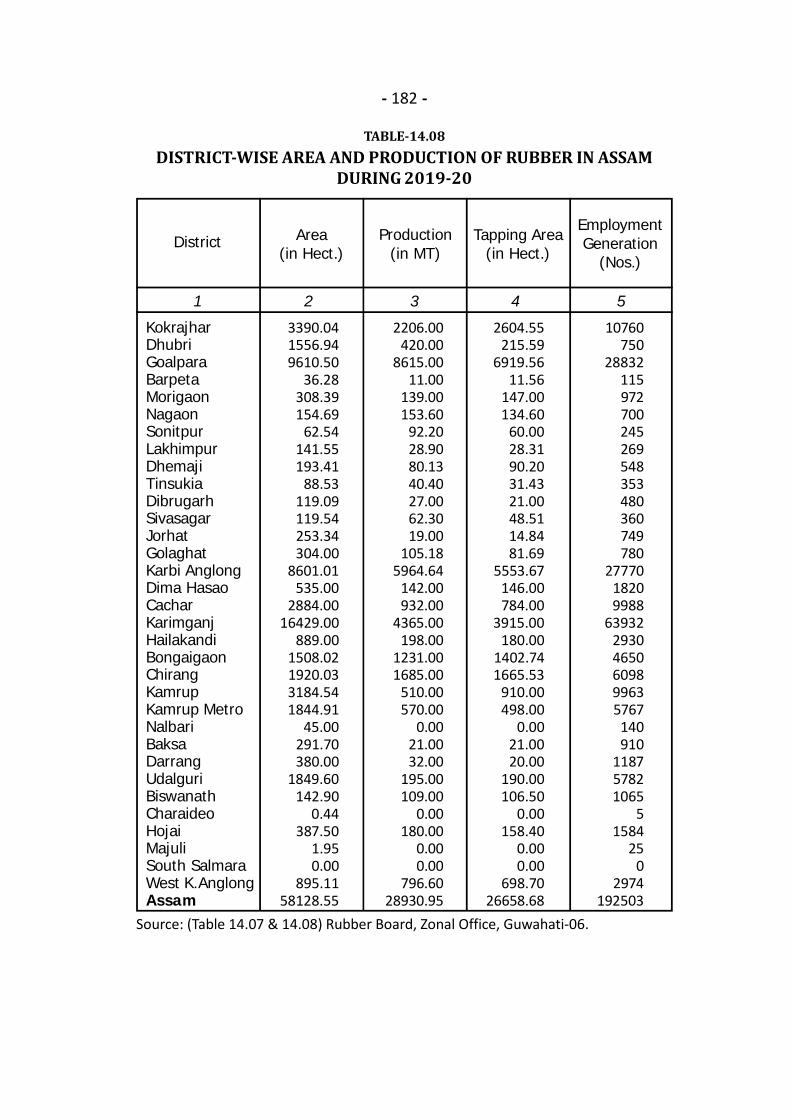
- 182 -
TABLE-14.08DISTRICT-WISE AREA AND PRODUCTION OF RUBBER IN ASSAM
DURING 2019-20
Source: (Table 14.07 & 14.08) Rubber Board, Zonal Office, Guwahati-06.
1 2 3 4 5
KokrajharDhubriGoalparaBarpetaMorigaonNagaonSonitpurLakhimpurDhemajiTinsukiaDibrugarhSivasagarJorhatGolaghatKarbi AnglongDima HasaoCacharKarimganjHailakandiBongaigaonChirangKamrupKamrup MetroNalbariBaksaDarrangUdalguriBiswanathCharaideoHojaiMajuliSouth SalmaraWest K.AnglongAssam
District Area(in Hect.)
3390.041556.949610.50
36.28308.39154.69
62.54141.55193.41
88.53119.09119.54253.34304.00
8601.01535.00
2884.0016429.00
889.001508.021920.033184.541844.91
45.00291.70380.00
1849.60142.90
0.44387.50
1.950.00
895.1158128.55
2206.00420.00
8615.0011.00
139.00153.60
92.2028.9080.1340.4027.0062.3019.00
105.185964.64
142.00932.00
4365.00198.00
1231.001685.00
510.00570.00
0.0021.0032.00
195.00109.00
0.00180.00
0.000.00
796.6028930.95
2604.55215.59
6919.5611.56
147.00134.60
60.0028.3190.2031.4321.0048.5114.8481.69
5553.67146.00784.00
3915.00180.00
1402.741665.53
910.00498.00
0.0021.0020.00
190.00106.50
0.00158.40
0.000.00
698.7026658.68
10760750
28832115972700245269548353480360749780
2777018209988
6393229304650609899635767140910
118757821065
51584
250
2974192503
Production(in MT)
Tapping Area(in Hect.)
EmploymentGeneration
(Nos.)
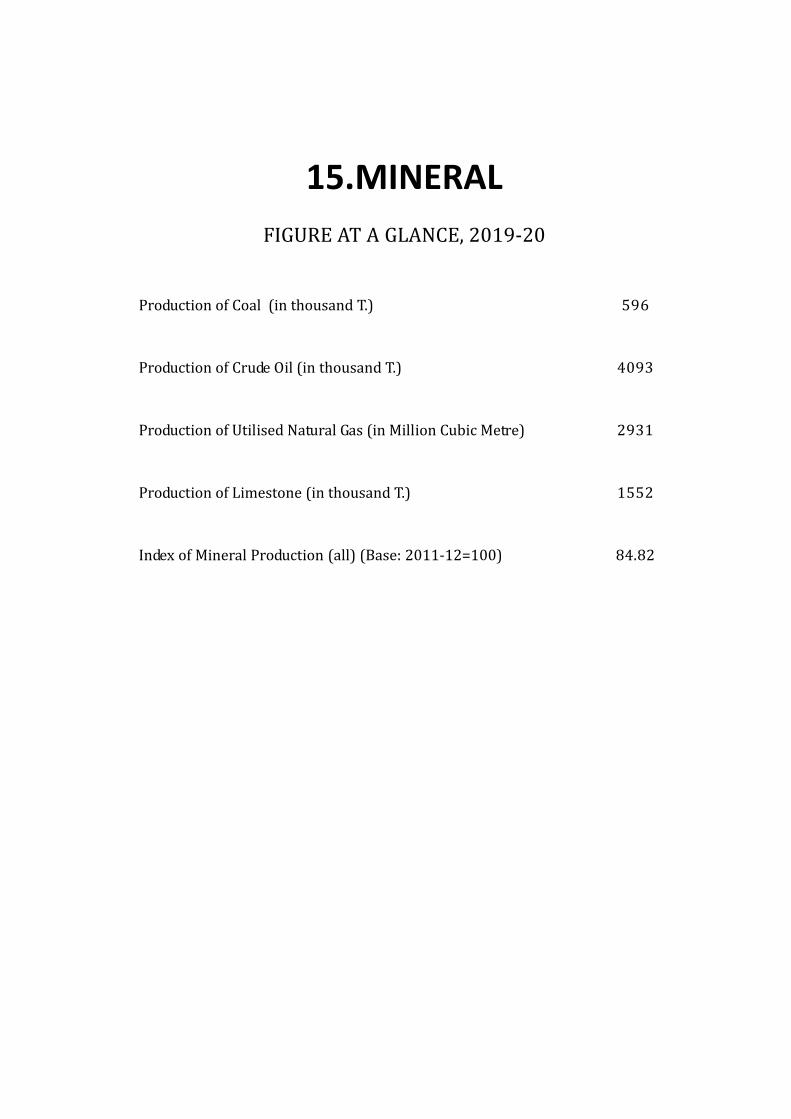
15.MINERALFIGURE AT A GLANCE, 2019-20Production of Coal (in thousand T.)Production of Crude Oil (in thousand T.)Production of Utilised Natural Gas (in Million Cubic Metre)Production of Limestone (in thousand T.)Index of Mineral Production (all) (Base: 2011-12=100)
59640932931155284.82
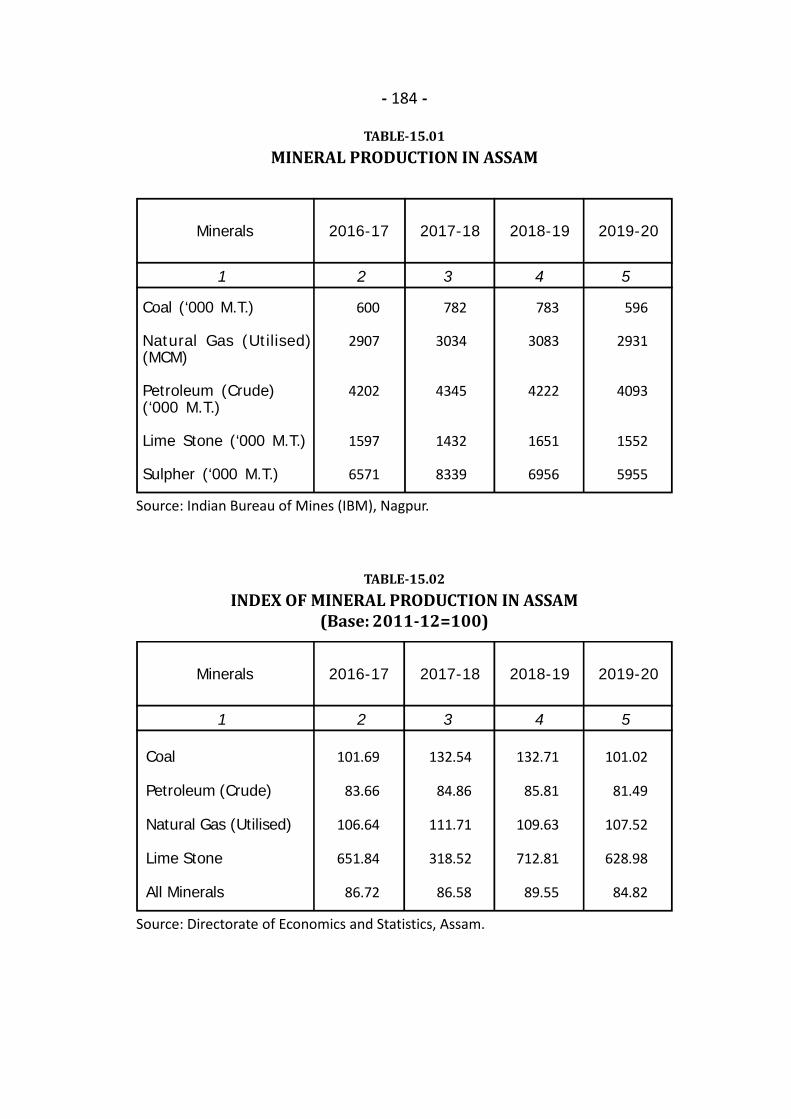
- 184 -
TABLE-15.02INDEX OF MINERAL PRODUCTION IN ASSAM
(Base: 2011-12=100)
Source: Directorate of Economics and Statistics, Assam.
1 2 3 4 5
Minerals 2016-17 2017-18 2018-19 2019-20
Coal
Petroleum (Crude)
Natural Gas (Utilised)
Lime Stone
All Minerals
101.69
83.66
106.64
651.84
86.72
132.54
84.86
111.71
318.52
86.58
132.71
85.81
109.63
712.81
89.55
101.02
81.49
107.52
628.98
84.82
TABLE-15.01MINERAL PRODUCTION IN ASSAM
1 2 3 4 5
Minerals 2016-17 2017-18 2018-19 2019-20
Coal (‘000 M.T.)
Natural Gas (Utilised)(MCM)
Petroleum (Crude)(‘000 M.T.)
Lime Stone (‘000 M.T.)
Sulpher (‘000 M.T.)
600
2907
4202
1597
6571
782
3034
4345
1432
8339
783
3083
4222
1651
6956
596
2931
4093
1552
5955
Source: Indian Bureau of Mines (IBM), Nagpur.

- 185 -
TABLE-15.03COLLIERY-WISE PRODUCTION OF COAL IN ASSAM(in ‘000 MT)1 2 3 4 5
Ledo O.C.P.
Tirap
Tipong
Tikok
Khota Ardha
Garampani
Tinsukia
- do -
- do -
- do -
Dima Hassao
- do -
23.688
468.461
3.000
286.182
2.790
245.830
1029.951
1.968
529.767
0
252.252
3.700
300.238
1087.925TOTAL
AMDC
CIL
0.000
450.046
0.000
66.794
3.920
272.096
792.856
CIL- Coal India LimitedAMDC- Assam Mineral Development Corporation
Colliery District 2017-18 2018-19 2019-20
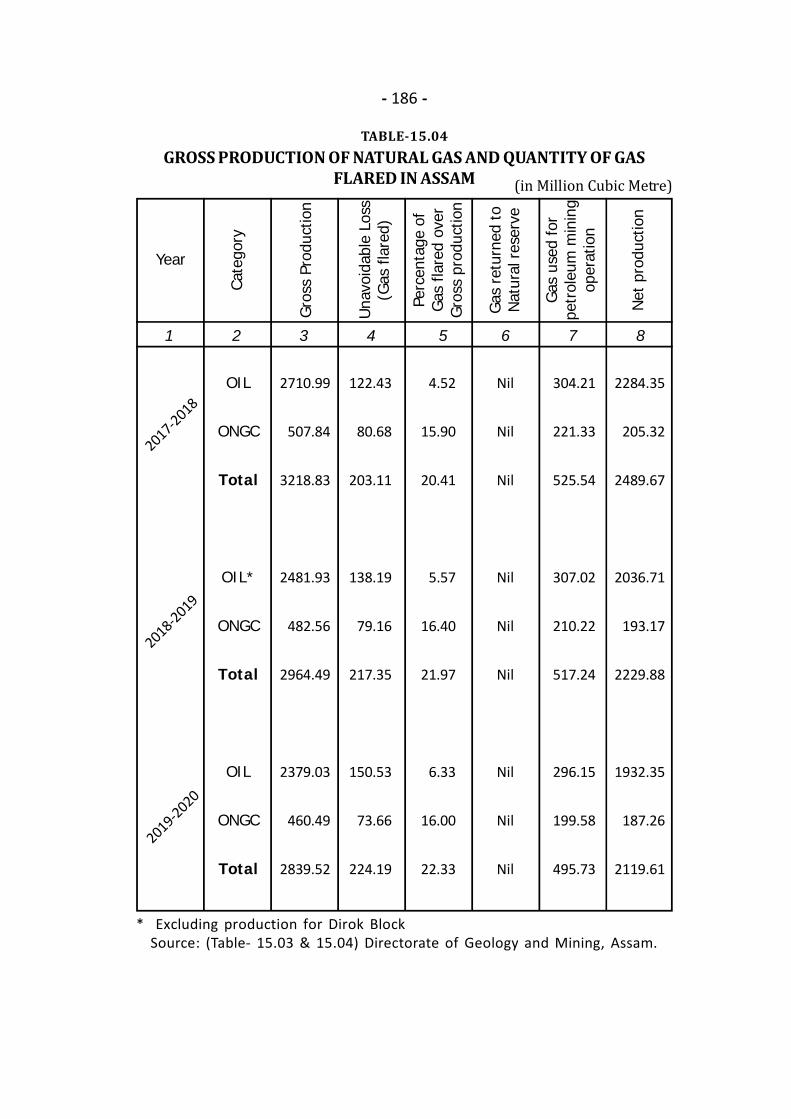
- 186 -
TABLE-15.04GROSS PRODUCTION OF NATURAL GAS AND QUANTITY OF GAS
FLARED IN ASSAM (in Million Cubic Metre)
* Excluding production for Dirok BlockSource: (Table- 15.03 & 15.04) Directorate of Geology and Mining, Assam.
1 2 3 4 5 6 7 8
YearCa
tego
ry
2017-2018OIL
ONGC
Total
OIL*
ONGC
Total
OIL
ONGC
Total
2710.99
507.84
3218.83
2481.93
482.56
2964.49
2379.03
460.49
2839.52
122.43
80.68
203.11
138.19
79.16
217.35
150.53
73.66
224.19
4.52
15.90
20.41
5.57
16.40
21.97
6.33
16.00
22.33
Nil
Nil
Nil
Nil
Nil
Nil
Nil
Nil
Nil
304.21
221.33
525.54
307.02
210.22
517.24
296.15
199.58
495.73
2284.35
205.32
2489.67
2036.71
193.17
2229.88
1932.35
187.26
2119.61
Gro
ss P
rodu
ctio
n
Una
void
able
Los
s(G
as fl
ared
)
Perc
enta
ge o
fG
as fl
ared
ove
rG
ross
pro
duct
ion
Gas
ret
urne
d to
Nat
ural
res
erve
Gas
use
d fo
rpe
trol
eum
min
ing
oper
atio
n
Net
pro
duct
ion
2018-2019
2019-2020

- 187 -
TABLE-15.05PRODUCTION OF MAJOR MINERALS IN ASSAM
1 2 3 4 5 6 7
AprilMayJuneJulyAugustSeptemberOctoberNovemberDecemberJanuaryFebruaryMarch
Total
Month Coal(‘000 MT)
Natural Gas(MCM)
PetroleumCrude
(‘000 MT)
Lime Stone(‘000 MT)
Sulpher(‘000 MT)
1022216
410293330408090
140
596
251250246270268260268256207220212223
2931
345356347356357341357344288342321339
4093
148169144110156117128112124118123103
1552
617699664675609606650650
94209364118
5955
Year
2018
-19
AprilMayJuneJulyAugustSeptemberOctoberNovemberDecemberJanuaryFebruaryMarch
Total
4545262333405680
100102
87146
783
239253251264271265270255263250233269
3083
356370360373374360374357363341233361
4222
179170114156
96115141153132
98138159
1651
513661557476613778554633610564418616
6993
2019
-20
Source: Indian Bureau of Mines, Nagpur.

.
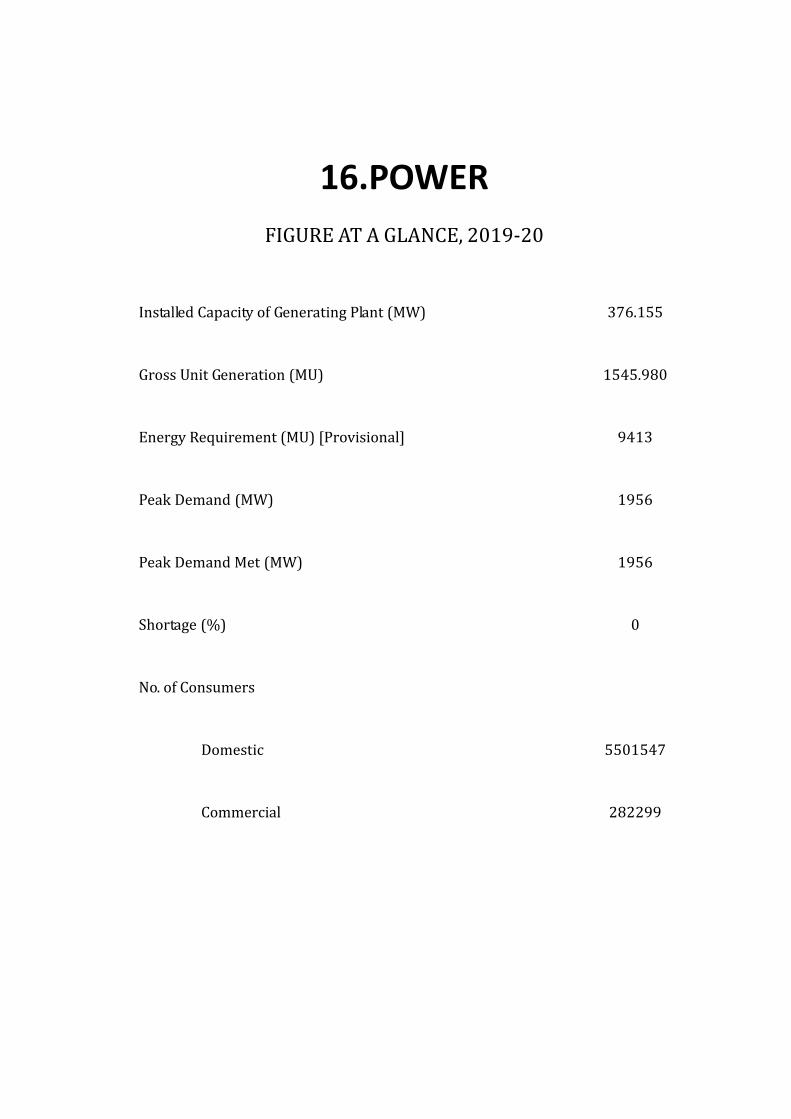
16.POWERFIGURE AT A GLANCE, 2019-20Installed Capacity of Generating Plant (MW)Gross Unit Generation (MU)Energy Requirement (MU) [Provisional]Peak Demand (MW)Peak Demand Met (MW)Shortage (%)No. of Consumers
DomesticCommercial
376.1551545.980
941319561956
0
5501547282299

TABLE-16.01REQUIREMENT AND SHORTAGE OF ELECTRICITY IN ASSAM
1 2 3 4
2017-18 2018-192019-20(Prov.)
Item
Energy Requirement (MU)
Energy Availability (MU)
Shortage (MU)
Peak Demand (MW)
Peak Demand Met (MW)
Shortage (MW)
Shortage (In %)
8694
9364
(-) 670
1745
1745
0
0
9173
9730
(-) 557
1809
1809
0
0
9413
10933
(-) 1520
1956
1956
0
0
- 190 -
TABLE-16.02TRANSMISSION, DISTRIBUTION AND COMMERCIAL LOSSES
IN ASSAM
1 2 3 4
2017-18 2018-19 2019-20Item
Energy Input(MUs) (At APDCL end)Energy Billed (MUs)T & D Losses (MUs)Amount Billed (Rs. in Crore)Amount Realised (Rs. in Crore)Collection Efficiency (in %)Overall Efficiency (in %)Aggregate Transmission and CommercialLosses (%)
82736814145947474858
102.3484.2915.71
86786968171050725050
99.5779.9520.05
89667257170953925268
97.7079.0820.92
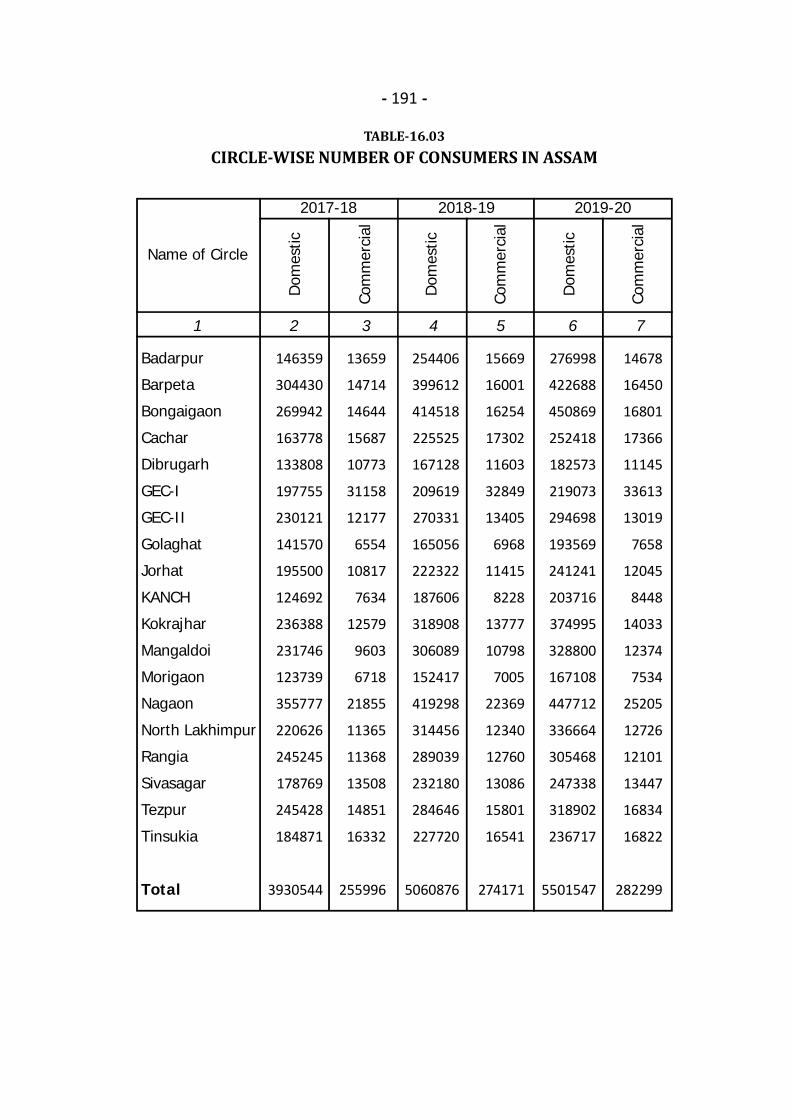
- 191 -
TABLE-16.03CIRCLE-WISE NUMBER OF CONSUMERS IN ASSAM
1 2 3 4 5 6 7
Badarpur
Barpeta
Bongaigaon
Cachar
Dibrugarh
GEC-I
GEC-II
Golaghat
Jorhat
KANCH
Kokrajhar
Mangaldoi
Morigaon
Nagaon
North Lakhimpur
Rangia
Sivasagar
Tezpur
Tinsukia
Total
Name of Circle
2017-18 2018-19 2019-20
146359
304430
269942
163778
133808
197755
230121
141570
195500
124692
236388
231746
123739
355777
220626
245245
178769
245428
184871
3930544
13659
14714
14644
15687
10773
31158
12177
6554
10817
7634
12579
9603
6718
21855
11365
11368
13508
14851
16332
255996
254406
399612
414518
225525
167128
209619
270331
165056
222322
187606
318908
306089
152417
419298
314456
289039
232180
284646
227720
5060876
15669
16001
16254
17302
11603
32849
13405
6968
11415
8228
13777
10798
7005
22369
12340
12760
13086
15801
16541
274171
276998
422688
450869
252418
182573
219073
294698
193569
241241
203716
374995
328800
167108
447712
336664
305468
247338
318902
236717
5501547
14678
16450
16801
17366
11145
33613
13019
7658
12045
8448
14033
12374
7534
25205
12726
12101
13447
16834
16822
282299
Dom
estic
Com
mer
cial
Dom
estic
Com
mer
cial
Dom
estic
Com
mer
cial

TABLE-16.05ELECTRICITY PURCHASED IN ASSAM
1 2 3 4
MU Purchased/generated(ex-bus)
All Charges Total(Rs. in Crore)
Average Rate(Rs/kwh)
Year
2017-18
2018-19
2019-20
9364.54
9730.24
10925.47
4506.31
5100.59
5449.35
4.81
5.24
4.99
TABLE-16.04SECTOR-WISE ELECTRICITY CONSUMPTION IN ASSAM
1 2 3 4 5
2017-18 2018-19
% Change in2019-20 over
2018-19Sector
Industrial
Agriculture
Domestic
Commercial
Public Services*
Other
1448.00
35.00
3704.00
979.00
13.00
635.00
1642.00
47.00
3477.00
1097.00
16.00
690.00
(-) 3.41%
0%
9.81%
1.37%
0%
(-) 1.74%
2019-20
Period
1586.00
47.00
3818.00
1112.00
16.00
678.00
(Units in MU)- 192 -
Source: (Table 16.01 to 16.05) CGM (Com & EE), APDCL, Bijulee Bhawan, Guwahati-1
* Public Lighting Works.

- 193 -
TABLE-16.06INSTALLED CAPACITY AND GENERATION OF ELECTRICITY IN ASSAM
1 2 3 4
2017-18 2018-19 2019-20Type
A. Installed Capacity of Generating Plant(MW)Hydel KLHEP
Myntriang SHEPStage-IStage-II
Gas LTPSLRPPNTPS
Waste Heat LTPS WHRURecovery Unit NTPS WHRUTotal (A) APGCLB. Gross Unit Generation (MU)Hydel KLHEP
Myntriang SHEPStage-IStage-II
Gas LTPSLRPPNTPS
Total (B) APGCLC. Auxiliary Consumption (MU)Hydel KLHEP
Myntriang SHEPStage-IStage-II
Gas LTPSLRPPNTPS
Total (C) APGCLD. Net Unit Generation (MU)Hydel KLHEP
Myntriang SHEPStage-IStage-II
Gas LTPSLRPPNTPS
Total (D) APGCL
100.000
03.000
105.0000
97.00037.20022.500
364.700
490.057
010.730
663.4020
325.6521489.841
0.822
00.057
48.0750
19.25868.212
489.230
010.673
615.3170
306.3961421.620
100.000
4.4004.500
60.00069.75577.00037.20022.500
375.360
369.288
0.7627.650
472.091429.989314.373
1594.153
0.621
0.0050.068
41.3887.881
21.20571.169
368.660
0.7577.582
430.703422.108293.168
1522.978
100.000
5.2004.500
60.00069.75577.00037.20022.500
376.155
398.528
18.9609.420
362.006504.200252.863
1545.980
0.612
0.0540.061
33.8169.465
15.02659.033
397.920
18.9069.359
328.190494.735237.837
1486.947
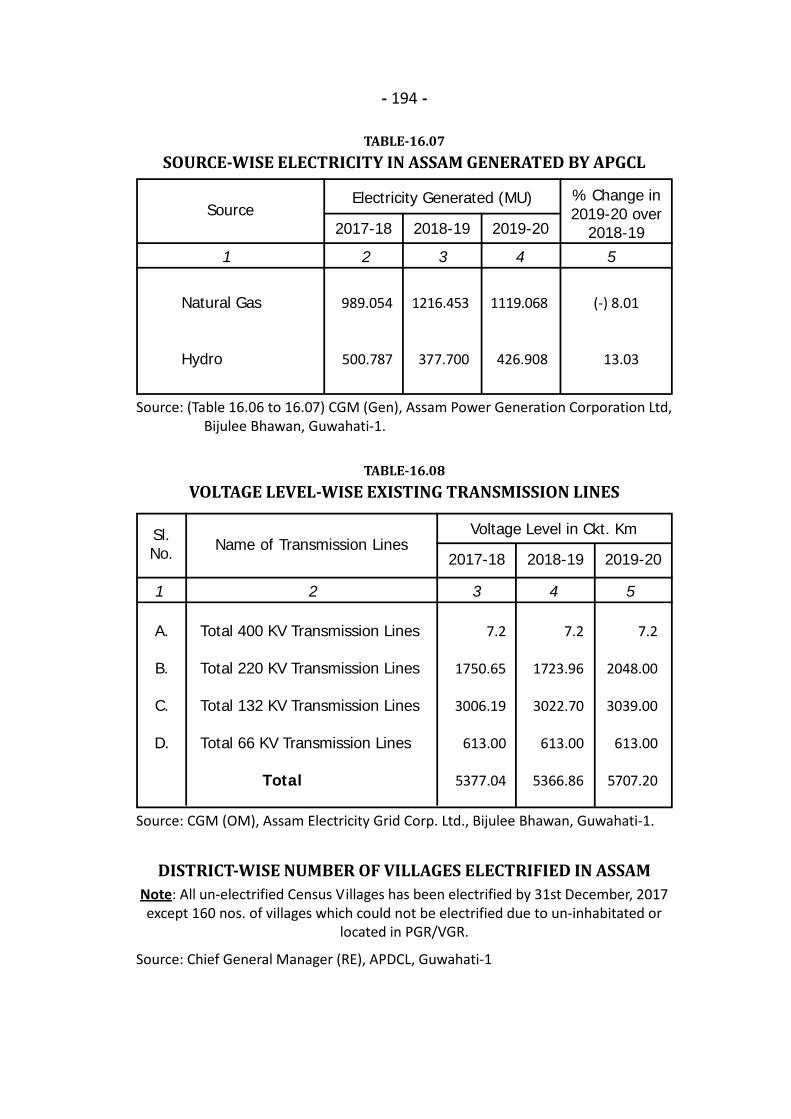
TABLE-16.08VOLTAGE LEVEL-WISE EXISTING TRANSMISSION LINES
1 2 3 4 5
2017-18 2019-20Name of Transmission Lines
Total 400 KV Transmission Lines
Total 220 KV Transmission Lines
Total 132 KV Transmission Lines
Total 66 KV Transmission Lines
Total
7.2
1750.65
3006.19
613.00
5377.04
7.2
2048.00
3039.00
613.00
5707.20
- 194 -
TABLE-16.07SOURCE-WISE ELECTRICITY IN ASSAM GENERATED BY APGCL
1 2 3 4 5
2017-18 2018-19
% Change in2019-20 over
2018-19Source
Natural Gas
Hydro
989.054
500.787
1216.453
377.700
(-) 8.01
13.03
7.2
1723.96
3022.70
613.00
5366.86
2018-19
Voltage Level in Ckt. Km
Source: CGM (OM), Assam Electricity Grid Corp. Ltd., Bijulee Bhawan, Guwahati-1.
2019-20
Electricity Generated (MU)
1119.068
426.908
Source: (Table 16.06 to 16.07) CGM (Gen), Assam Power Generation Corporation Ltd, Bijulee Bhawan, Guwahati-1.
Sl.No.
A.
B.
C.
D.
DISTRICT-WISE NUMBER OF VILLAGES ELECTRIFIED IN ASSAMNote: All un-electrified Census Villages has been electrified by 31st December, 2017except 160 nos. of villages which could not be electrified due to un-inhabitated or
located in PGR/VGR.
Source: Chief General Manager (RE), APDCL, Guwahati-1
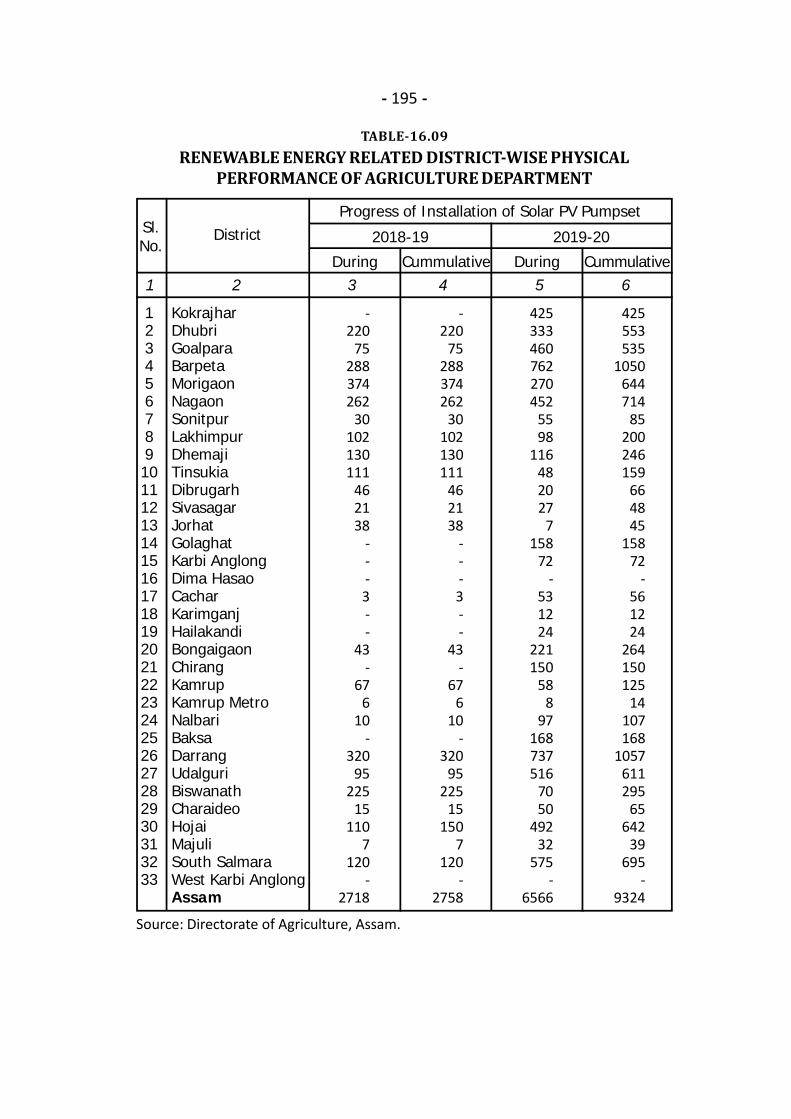
- 195 -
TABLE-16.09RENEWABLE ENERGY RELATED DISTRICT-WISE PHYSICAL
PERFORMANCE OF AGRICULTURE DEPARTMENT
1 2 3 4 5 6
KokrajharDhubriGoalparaBarpetaMorigaonNagaonSonitpurLakhimpurDhemajiTinsukiaDibrugarhSivasagarJorhatGolaghatKarbi AnglongDima HasaoCacharKarimganjHailakandiBongaigaonChirangKamrupKamrup MetroNalbariBaksaDarrangUdalguriBiswanathCharaideoHojaiMajuliSouth SalmaraWest Karbi AnglongAssam
Sl.No.
District 2018-19
During Cummulative
2019-20
123456789101112131415161718192021222324252627282930313233
-220
75288374262
30102130111
462138
---3--
43-
676
10-
32095
22515
1107
120-
2718
-220
75288374262
30102130111
462138
---3--
43-
676
10-
32095
22515
1507
120-
2758
425333460762270452
5598
116482027
7158
72-
531224
221150
588
97168737516
7050
49232
575-
6566
425553535
1050644714
85200246159
664845
15872
-561224
264150125
14107168
1057611295
65642
39695
-9324
Progress of Installation of Solar PV Pumpset
During Cummulative
Source: Directorate of Agriculture, Assam.
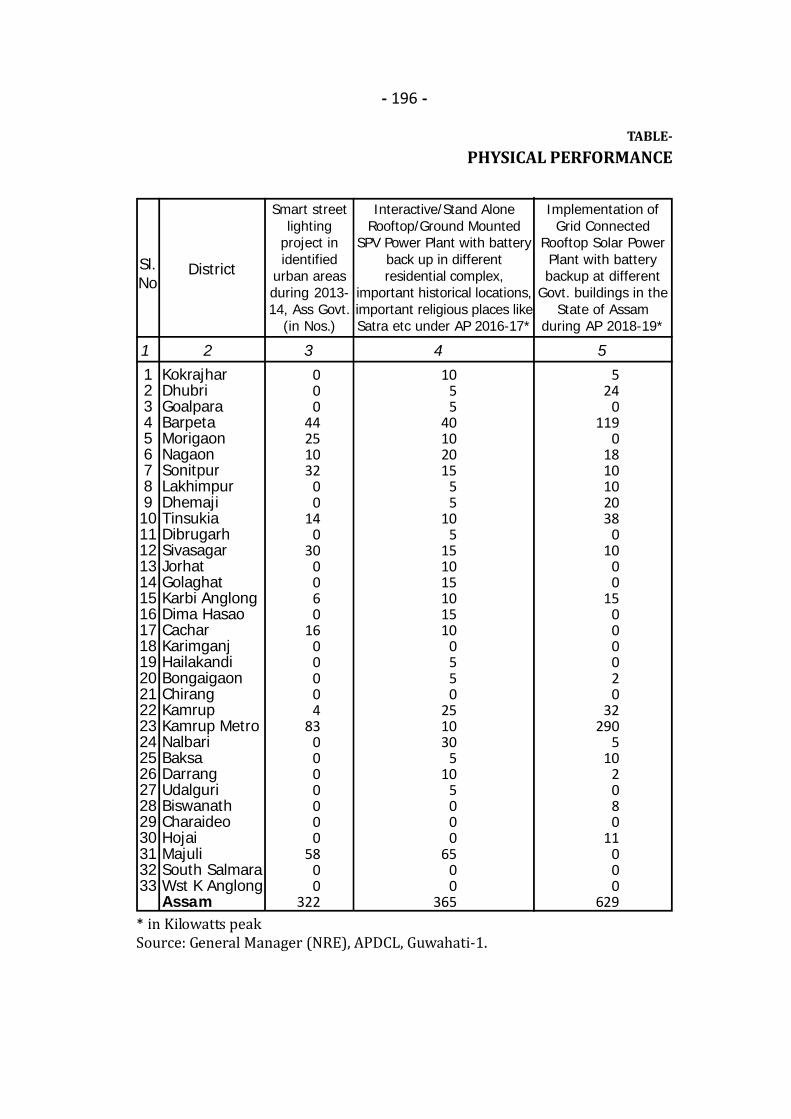
- 196 -
TABLE-PHYSICAL PERFORMANCE
1 2 3 4 5KokrajharDhubriGoalparaBarpetaMorigaonNagaonSonitpurLakhimpurDhemajiTinsukiaDibrugarhSivasagarJorhatGolaghatKarbi AnglongDima HasaoCacharKarimganjHailakandiBongaigaonChirangKamrupKamrup MetroNalbariBaksaDarrangUdalguriBiswanathCharaideoHojaiMajuliSouth SalmaraWst K AnglongAssam
District
Smart streetlighting
project inidentified
urban areasduring 2013-14, Ass Govt.
(in Nos.)
000
44251032
00
140
300060
1600004
830000000
5800
322
1055
40102015
55
105
151015101510
0550
251030
510
5000
6500
365
Interactive/Stand AloneRooftop/Ground Mounted
SPV Power Plant with batteryback up in differentresidential complex,
important historical locations,important religious places likeSatra etc under AP 2016-17*
Implementation ofGrid Connected
Rooftop Solar PowerPlant with batterybackup at different
Govt. buildings in theState of Assam
during AP 2018-19*
524
0119
01810102038
010
00
15000020
32290
510
2080
11000
629
Sl.No
123456789101112131415161718192021222324252627282930313233
* in Kilowatts peakSource: General Manager (NRE), APDCL, Guwahati-1.

- 197 -
16.10OF APDCL DURING 2019-20
6 7 8 9 1
Rooftop Solar PV Stationon Govt. Buildings andOff-Grid Solar Plant atPrimary Health Center
(PHC) located in Off-GridRemote Villages underAnnual Plan 2019-20,
Govt. of Assam*
252020252035251010101525202020
51515
51010351520151510
000000
470
11101427
41620
6142321212020
00
144
1013
02020131116
200
22000
372
Smart StreetLighting System
in identifiedurban areas
under AnnualPlan 2019-20,Govt. of Assam
(in Nos.)
Off Grid RuralElectrification
works in Assamthrough Stansalone
Solar PV systemunder SAUBHAGYA
Scheme(in Nos.)
57886304038
1222000
1544561
1138887910
0517268
415831261537
4231551
00
11860
13960
21050000000
46773
Sl.No.
123456789101112131415161718192021222324252627282930313233
Grid ConnectedRooftop SolarPower Plant at
differentlocations in theState of Assamunder IPDS*
1700
650
37000
6040
0631740
020
0000
19197
00
290000000
604
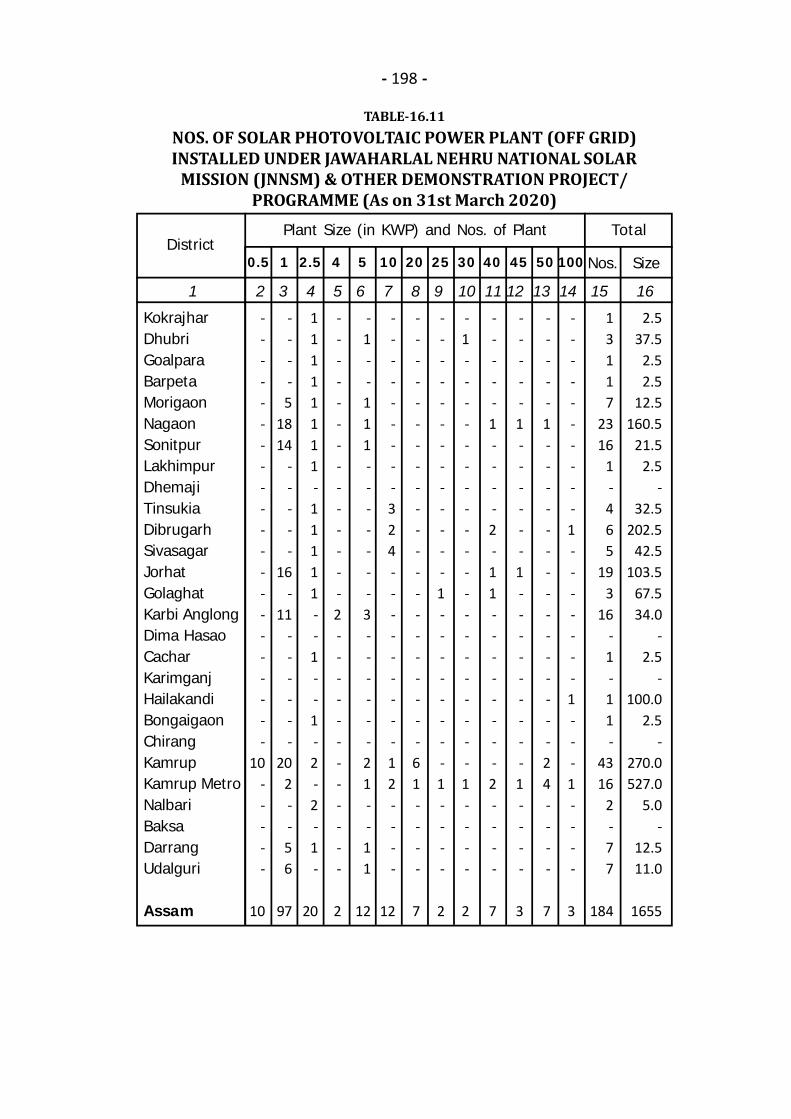
- 198 -
TABLE-16.11NOS. OF SOLAR PHOTOVOLTAIC POWER PLANT (OFF GRID)INSTALLED UNDER JAWAHARLAL NEHRU NATIONAL SOLAR
MISSION (JNNSM) & OTHER DEMONSTRATION PROJECT/PROGRAMME (As on 31st March 2020)
1 2 3 4 5 6 7 8 9 10 11 12 13 14 15 16
KokrajharDhubriGoalparaBarpetaMorigaonNagaonSonitpurLakhimpurDhemajiTinsukiaDibrugarhSivasagarJorhatGolaghatKarbi AnglongDima HasaoCacharKarimganjHailakandiBongaigaonChirangKamrupKamrup MetroNalbariBaksaDarrangUdalguri
Assam
District0.5 2.5 5 45 Nos.
2.537.5
2.52.5
12.5160.5
21.52.5
-32.5
202.542.5
103.567.534.0
-2.5
-100.0
2.5-
270.0527.0
5.0-
12.511.0
1655
1 4 10 50 Size
Plant Size (in KWP) and Nos. of Plant Total
---------------------
10-----
10
20 25 30 40 100
----5
1814
-----
16-
11------
202--56
97
11111111-11111--1--1-2-2-1-
20
--------------2------------
2
-1--111-------3------21--11
12
---------324---------12----
12
---------------------61----
7
-------------1--------1----
2
-1--------------------1----
2
-----1----2-11--------2----
7
-----1------1---------1----
3
-----1---------------24----
7
----------1-------1---1----
3
13117
2316
1-465
193
16-1-11-
4316
2-77
184
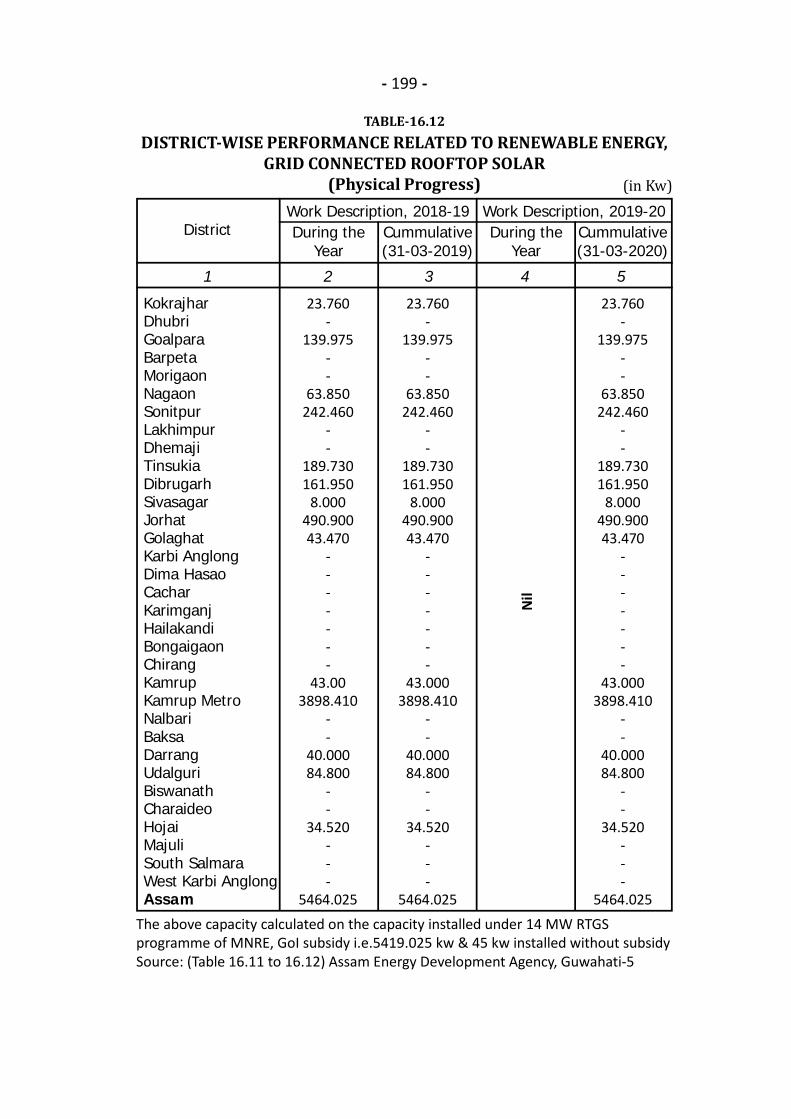
- 199 -
TABLE-16.12DISTRICT-WISE PERFORMANCE RELATED TO RENEWABLE ENERGY,
GRID CONNECTED ROOFTOP SOLAR(Physical Progress)
1 2 3 4 5
KokrajharDhubriGoalparaBarpetaMorigaonNagaonSonitpurLakhimpurDhemajiTinsukiaDibrugarhSivasagarJorhatGolaghatKarbi AnglongDima HasaoCacharKarimganjHailakandiBongaigaonChirangKamrupKamrup MetroNalbariBaksaDarrangUdalguriBiswanathCharaideoHojaiMajuliSouth SalmaraWest Karbi AnglongAssam
DistrictWork Description, 2018-19 Work Description, 2019-20
23.760-
139.975--
63.850242.460
--
189.730161.950
8.000490.90043.470
-------
43.0003898.410
--
40.00084.800
--
34.520---
5464.025
Nil
23.760-
139.975--
63.850242.460
--
189.730161.950
8.000490.90043.470
-------
43.003898.410
--
40.00084.800
--
34.520---
5464.025
23.760-
139.975--
63.850242.460
--
189.730161.950
8.000490.90043.470
-------
43.0003898.410
--
40.00084.800
--
34.520---
5464.025
During theYear
Cummulative(31-03-2019)
During theYear
Cummulative(31-03-2020)
(in Kw)
The above capacity calculated on the capacity installed under 14 MW RTGSprogramme of MNRE, GoI subsidy i.e.5419.025 kw & 45 kw installed without subsidySource: (Table 16.11 to 16.12) Assam Energy Development Agency, Guwahati-5

.
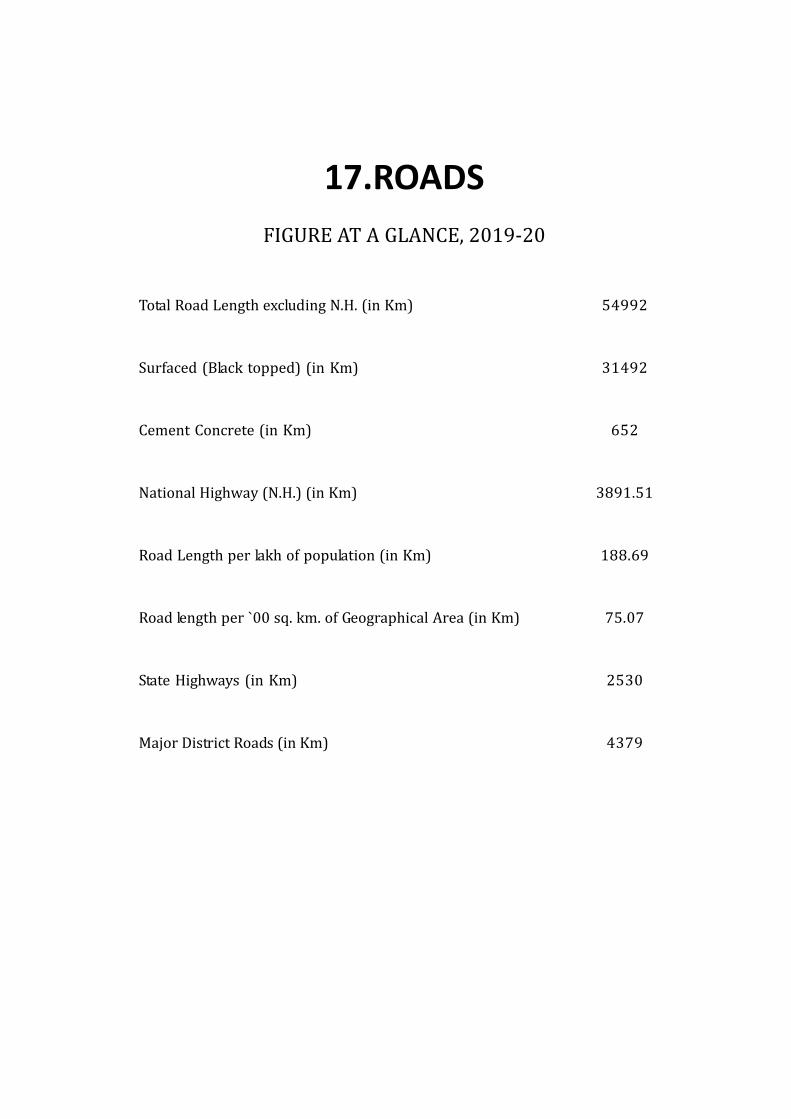
17.ROADSFIGURE AT A GLANCE, 2019-20Total Road Length excluding N.H. (in Km)Surfaced (Black topped) (in Km)Cement Concrete (in Km)National Highway (N.H.) (in Km)Road Length per lakh of population (in Km)Road length per `00 sq. km. of Geographical Area (in Km)State Highways (in Km)Major District Roads (in Km)
5499231492
6523891.51188.6975.0725304379
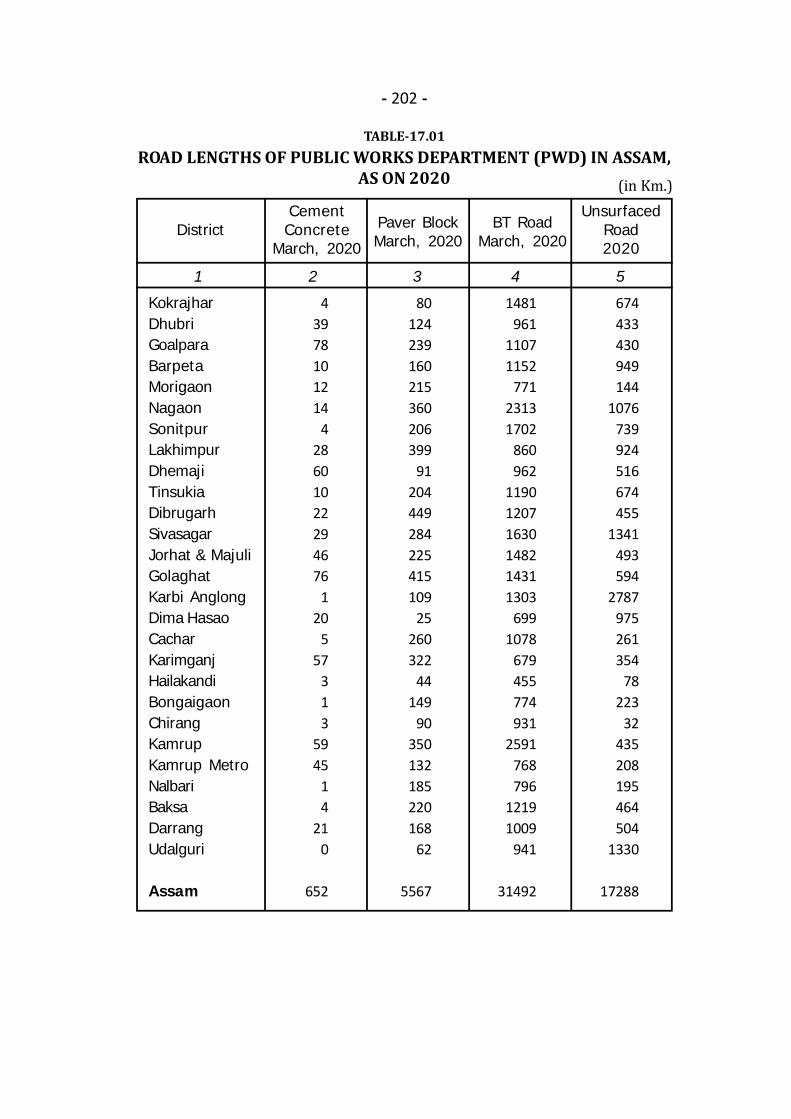
- 202 -
TABLE-17.01ROAD LENGTHS OF PUBLIC WORKS DEPARTMENT (PWD) IN ASSAM,
AS ON 2020 (in Km.) 1 2 3 4 5
KokrajharDhubriGoalparaBarpetaMorigaonNagaonSonitpurLakhimpurDhemajiTinsukiaDibrugarhSivasagarJorhat & MajuliGolaghatKarbi AnglongDima HasaoCacharKarimganjHailakandiBongaigaonChirangKamrupKamrup MetroNalbariBaksaDarrangUdalguri
Assam
DistrictCementConcrete
March, 2020
Paver BlockMarch, 2020
BT RoadMarch, 2020
UnsurfacedRoad2020
43978101214
428601022294676
120
557
313
5945
14
210
652
80124239160215360206399
91204449284225415109
25260322
44149
90350132185220168
62
5567
1481961
11071152
77123131702
860962
119012071630148214311303
6991078
679455774931
2591768796
12191009
941
31492
674433430949144
1076739924516674455
1341493594
2787975261354
78223
32435208195464504
1330
17288
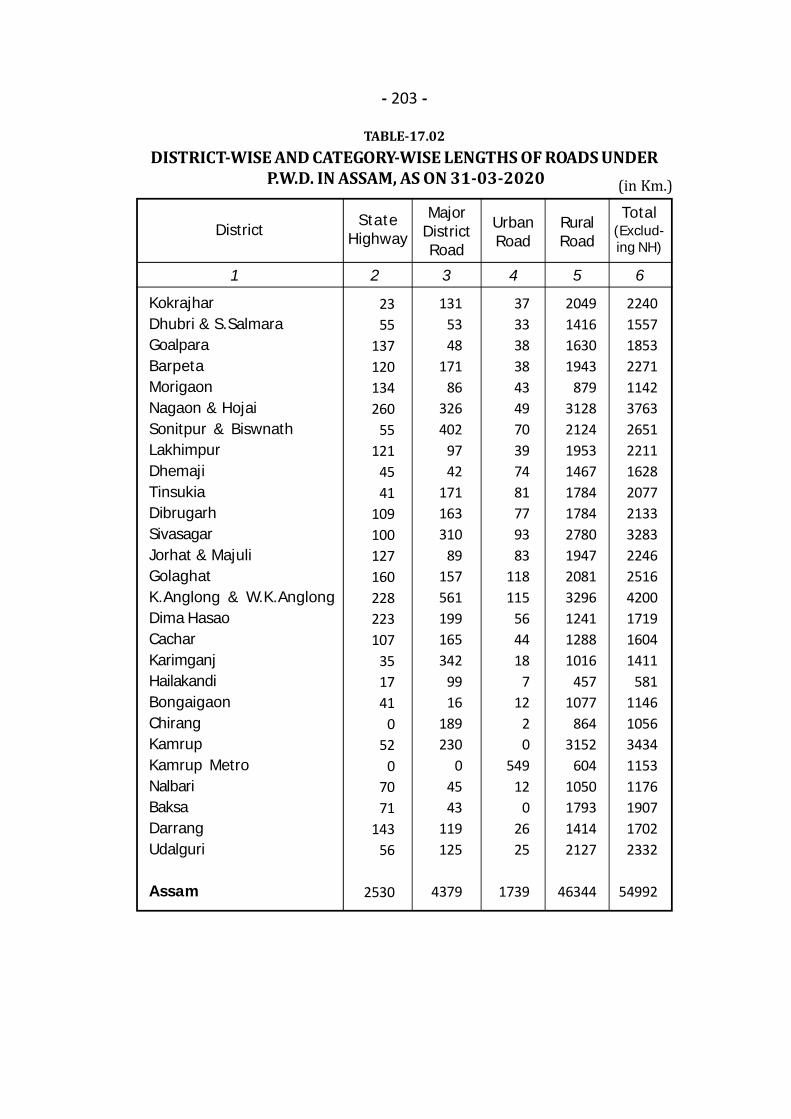
- 203 -
TABLE-17.02DISTRICT-WISE AND CATEGORY-WISE LENGTHS OF ROADS UNDER
P.W.D. IN ASSAM, AS ON 31-03-2020 (in Km.) 1 2 3 4 5 6
KokrajharDhubri & S.SalmaraGoalparaBarpetaMorigaonNagaon & HojaiSonitpur & BiswnathLakhimpurDhemajiTinsukiaDibrugarhSivasagarJorhat & MajuliGolaghatK.Anglong & W.K.AnglongDima HasaoCacharKarimganjHailakandiBongaigaonChirangKamrupKamrup MetroNalbariBaksaDarrangUdalguri
Assam
DistrictState
Highway
MajorDistrictRoad
UrbanRoad
RuralRoad
Total(Exclud-ing NH)
2355
137120134260
55121
4541
109100127160228223107
351741
052
07071
14356
2530
1315348
17186
326402
9742
171163310
89157561199165342
9916
189230
04543
119125
4379
37333838434970397481779383
118115
564418
712
20
54912
02625
1739
2049141616301943
8793128212419531467178417842780194720813296124112881016
4571077
8643152
6041050179314142127
46344
224015571853227111423763265122111628207721333283224625164200171916041411
58111461056343411531176190717022332
54992
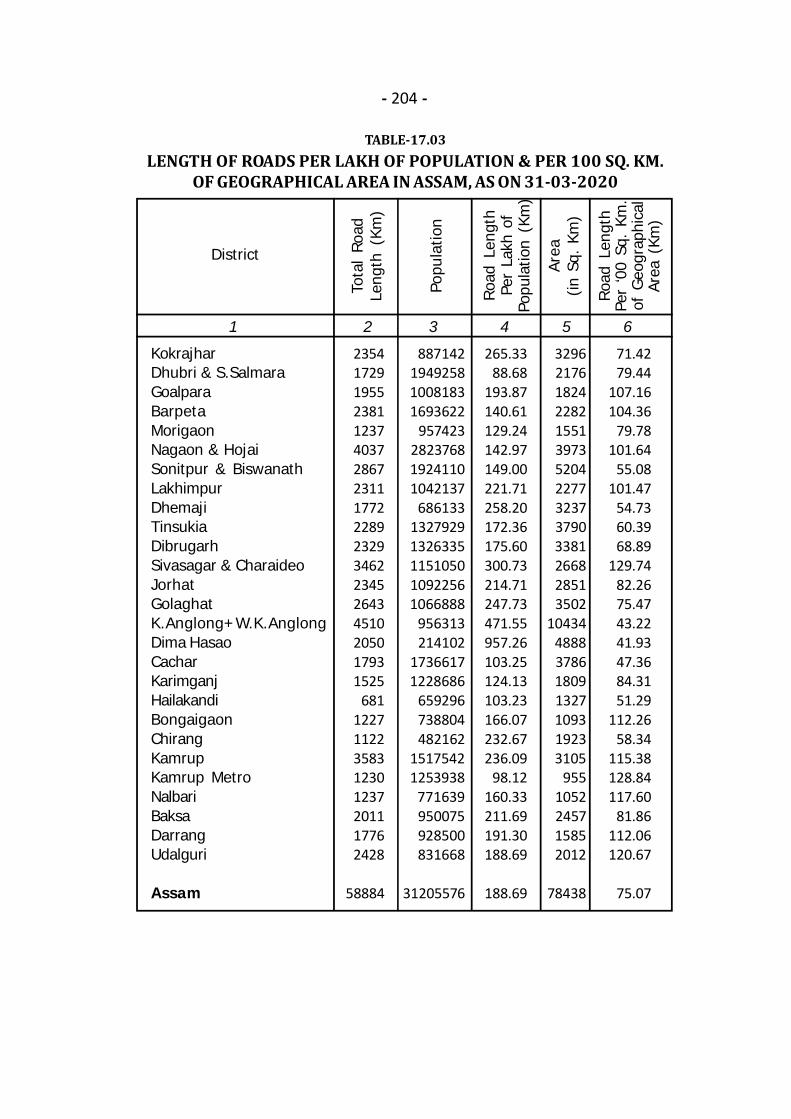
- 204 -
TABLE-17.03LENGTH OF ROADS PER LAKH OF POPULATION & PER 100 SQ. KM.
OF GEOGRAPHICAL AREA IN ASSAM, AS ON 31-03-2020
1 2 3 4 5 6
KokrajharDhubri & S.SalmaraGoalparaBarpetaMorigaonNagaon & HojaiSonitpur & BiswanathLakhimpurDhemajiTinsukiaDibrugarhSivasagar & CharaideoJorhatGolaghatK.Anglong+W.K.AnglongDima HasaoCacharKarimganjHailakandiBongaigaonChirangKamrupKamrup MetroNalbariBaksaDarrangUdalguri
Assam
District
Tota
l Ro
adLe
ngth
(Km
)
Popu
latio
n
Roa
d Le
ngth
Per
Lakh
of
Popu
latio
n (K
m)
Area
(in S
q. K
m)
Roa
d Le
ngth
Per
‘00
Sq.
Km.
of G
eogr
aphi
cal
Area
(Km
)
235417291955238112374037286723111772228923293462234526434510205017931525
68112271122358312301237201117762428
58884
887142194925810081831693622
957423282376819241101042137
68613313279291326335115105010922561066888
956313214102
17366171228686
659296738804482162
15175421253938
771639950075928500831668
31205576
265.3388.68
193.87140.61129.24142.97149.00221.71258.20172.36175.60300.73214.71247.73471.55957.26103.25124.13103.23166.07232.67236.09
98.12160.33211.69191.30188.69
188.69
32962176182422821551397352042277323737903381266828513502
104344888378618091327109319233105
9551052245715852012
78438
71.4279.44
107.16104.36
79.78101.64
55.08101.47
54.7360.3968.89
129.7482.2675.4743.2241.9347.3684.3151.29
112.2658.34
115.38128.84117.60
81.86112.06120.67
75.07

- 205 -
TABLE-17.04DISTRICT-WISE HABITATION CONNECTIVITY STATUS FROM PHASE-I
AND WORKS IN PROGRESS UNDER PMGSY AS ON 31-03-2020
N.B.: PMGSY = Pradhan Mantri Gram Sadak Yojana.Source: (Table 17.01 to 17.04) Office of the Chief Engineer, P.W.D (Roads),
Assam.
1 2 3 4 5 6
District(1000+) (500+) (250+)
Total(2+3+4+5)
KokrajharDhubri & S.SalmaraGoalparaBarpetaMorigaonNagaon & HojaiSonitpur & BiswanathLakhimpurDhemajiTinsukiaDibrugarhSivasagar & CharaideoJorhat & MajuliGolaghatK.Anglong & W.K.AnglongDima HasaoCacharKarimganjHailakandiBongaigaonChirangKamrupKamrup MetroNalbariBaksaDarrangUdalguri
Assam
161350211424265637338162346169163287258240
340
279171149139
74415
159294202
64
5991
169164169162113296381265263239254273219200
945
134160
32110
87294
73143175175
4649
11888
144937673
211222239185199138160177157
538687156037
262
27695774
3107
500643555719477
10221011
718986669686731743770421115571438209342216
1040
272528444338
15164
No. of Villages
<250(incidental)
5241314023168169
138767033
106153136
57722013331869
13221025
1417
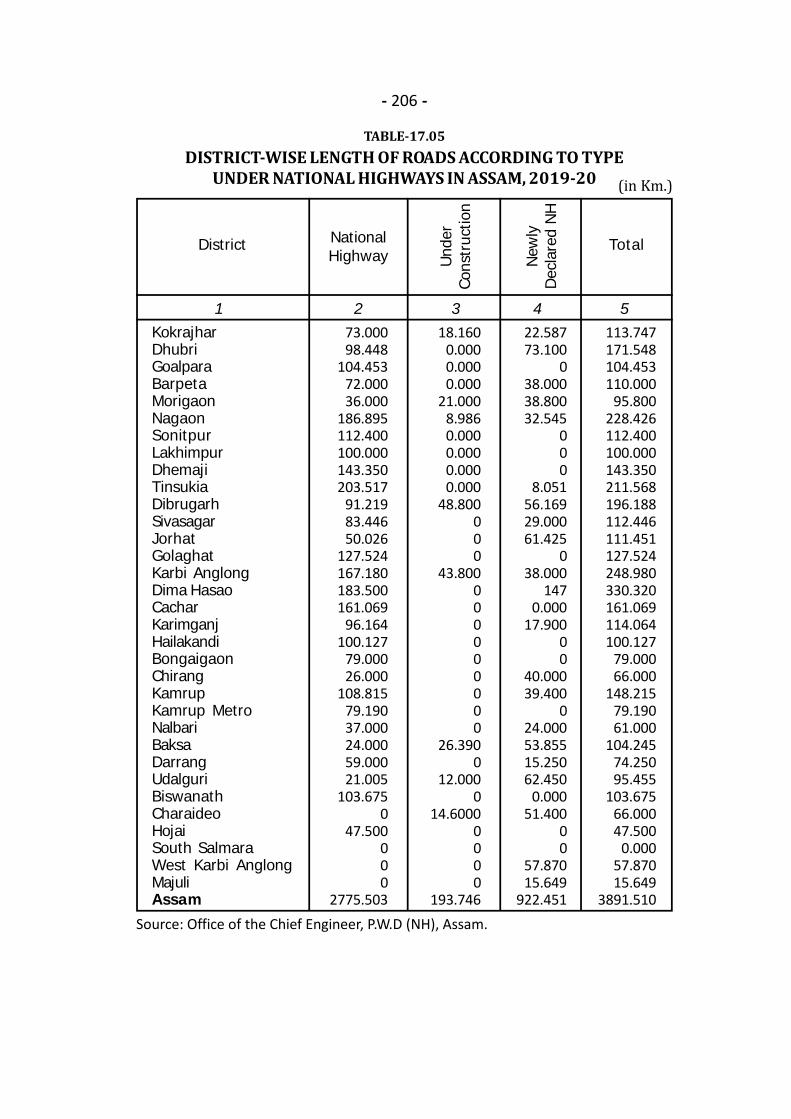
- 206 -
TABLE-17.05DISTRICT-WISE LENGTH OF ROADS ACCORDING TO TYPE
UNDER NATIONAL HIGHWAYS IN ASSAM, 2019-20 (in Km.)
Source: Office of the Chief Engineer, P.W.D (NH), Assam.
1 2 3 4 5KokrajharDhubriGoalparaBarpetaMorigaonNagaonSonitpurLakhimpurDhemajiTinsukiaDibrugarhSivasagarJorhatGolaghatKarbi AnglongDima HasaoCacharKarimganjHailakandiBongaigaonChirangKamrupKamrup MetroNalbariBaksaDarrangUdalguriBiswanathCharaideoHojaiSouth SalmaraWest Karbi AnglongMajuliAssam
District NationalHighway U
nder
Cons
truc
tion
New
lyD
ecla
red
NH
Total
73.00098.448
104.45372.00036.000
186.895112.400100.000143.350203.517
91.21983.44650.026
127.524167.180183.500161.069
96.164100.127
79.00026.000
108.81579.19037.00024.00059.00021.005
103.6750
47.500000
2775.503
113.747171.548104.453110.000
95.800228.426112.400100.000143.350211.568196.188112.446111.451127.524248.980330.320161.069114.064100.127
79.00066.000
148.21579.19061.000
104.24574.25095.455
103.67566.00047.500
0.00057.87015.649
3891.510
18.1600.0000.0000.000
21.0008.9860.0000.0000.0000.000
48.800000
43.800000000000
26.3900
12.0000
14.60000000
193.746
22.58773.100
038.00038.80032.545
000
8.05156.16929.00061.425
038.000
1470.000
17.90000
40.00039.400
024.00053.85515.25062.450
0.00051.400
00
57.87015.649
922.451
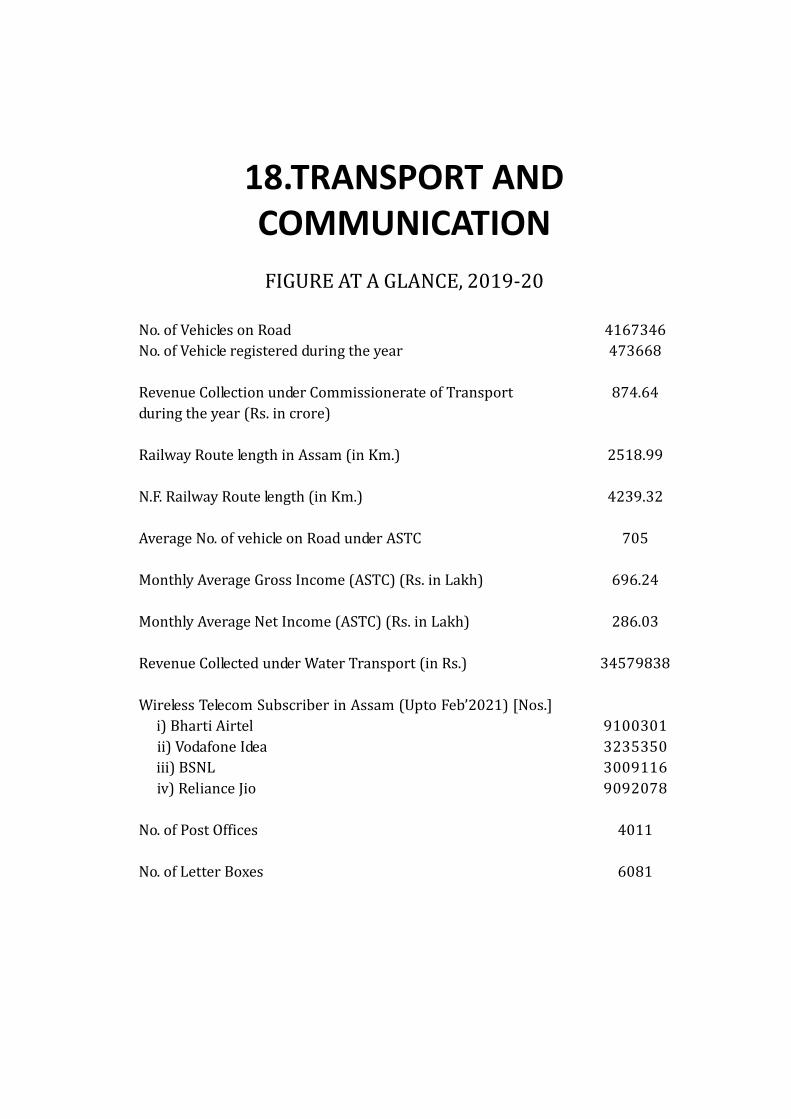
18.TRANSPORT ANDCOMMUNICATIONFIGURE AT A GLANCE, 2019-20
No. of Vehicles on RoadNo. of Vehicle registered during the yearRevenue Collection under Commissionerate of Transportduring the year (Rs. in crore)Railway Route length in Assam (in Km.)N.F. Railway Route length (in Km.)Average No. of vehicle on Road under ASTCMonthly Average Gross Income (ASTC) (Rs. in Lakh)Monthly Average Net Income (ASTC) (Rs. in Lakh)Revenue Collected under Water Transport (in Rs.)Wireless Telecom Subscriber in Assam (Upto Feb’2021) [Nos.] i) Bharti Airtel ii) Vodafone Idea iii) BSNL iv) Reliance JioNo. of Post OfficesNo. of Letter Boxes
4167346473668874.642518.994239.32705696.24286.0334579838
910030132353503009116909207840116081
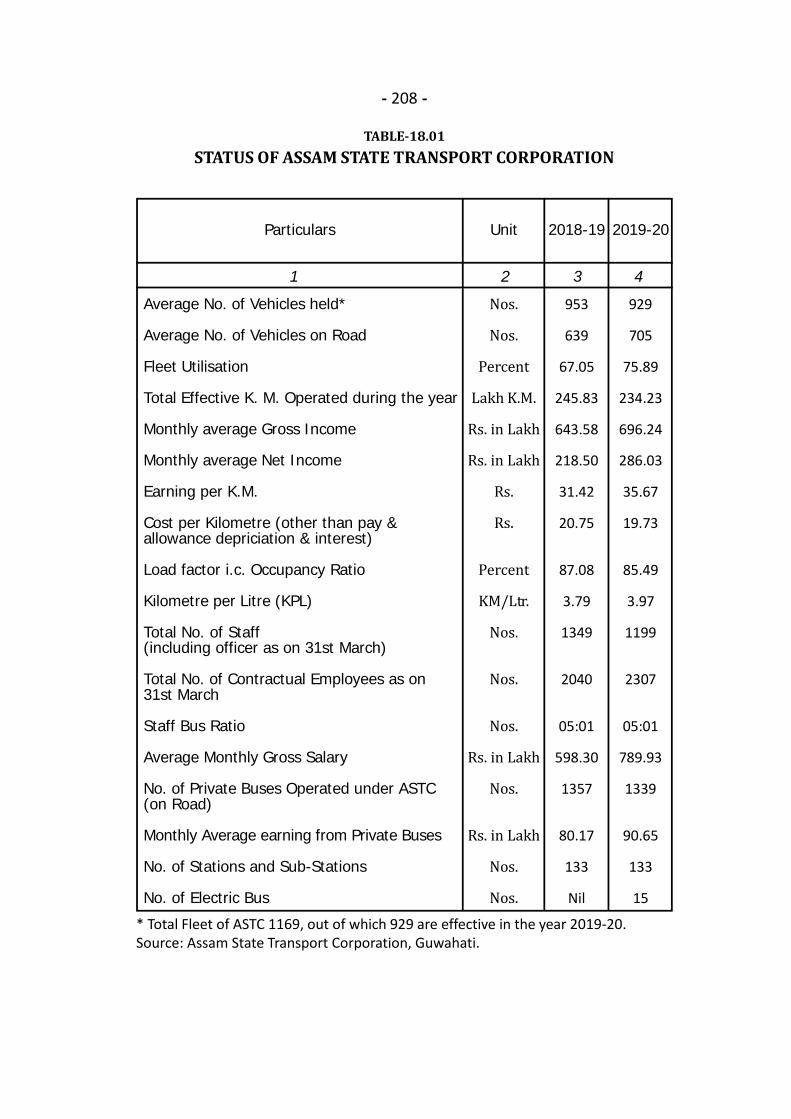
- 208 -
TABLE-18.01STATUS OF ASSAM STATE TRANSPORT CORPORATION
* Total Fleet of ASTC 1169, out of which 929 are effective in the year 2019-20.Source: Assam State Transport Corporation, Guwahati.
1 2 3 4
Unit 2018-19 2019-20Particulars
Average No. of Vehicles held*
Average No. of Vehicles on Road
Fleet Utilisation
Total Effective K. M. Operated during the year
Monthly average Gross Income
Monthly average Net Income
Earning per K.M.
Cost per Kilometre (other than pay &allowance depriciation & interest)
Load factor i.c. Occupancy Ratio
Kilometre per Litre (KPL)
Total No. of Staff(including officer as on 31st March)
Total No. of Contractual Employees as on31st March
Staff Bus Ratio
Average Monthly Gross Salary
No. of Private Buses Operated under ASTC(on Road)
Monthly Average earning from Private Buses
No. of Stations and Sub-Stations
No. of Electric Bus
Nos.Nos.PercentLakh K.M.Rs. in LakhRs. in LakhRs.Rs.PercentKM/Ltr.Nos.
Nos.Nos.Rs. in LakhNos.
Rs. in LakhNos.Nos.
953
639
67.05
245.83
643.58
218.50
31.42
20.75
87.08
3.79
1349
2040
05:01
598.30
1357
80.17
133
Nil
929
705
75.89
234.23
696.24
286.03
35.67
19.73
85.49
3.97
1199
2307
05:01
789.93
1339
90.65
133
15
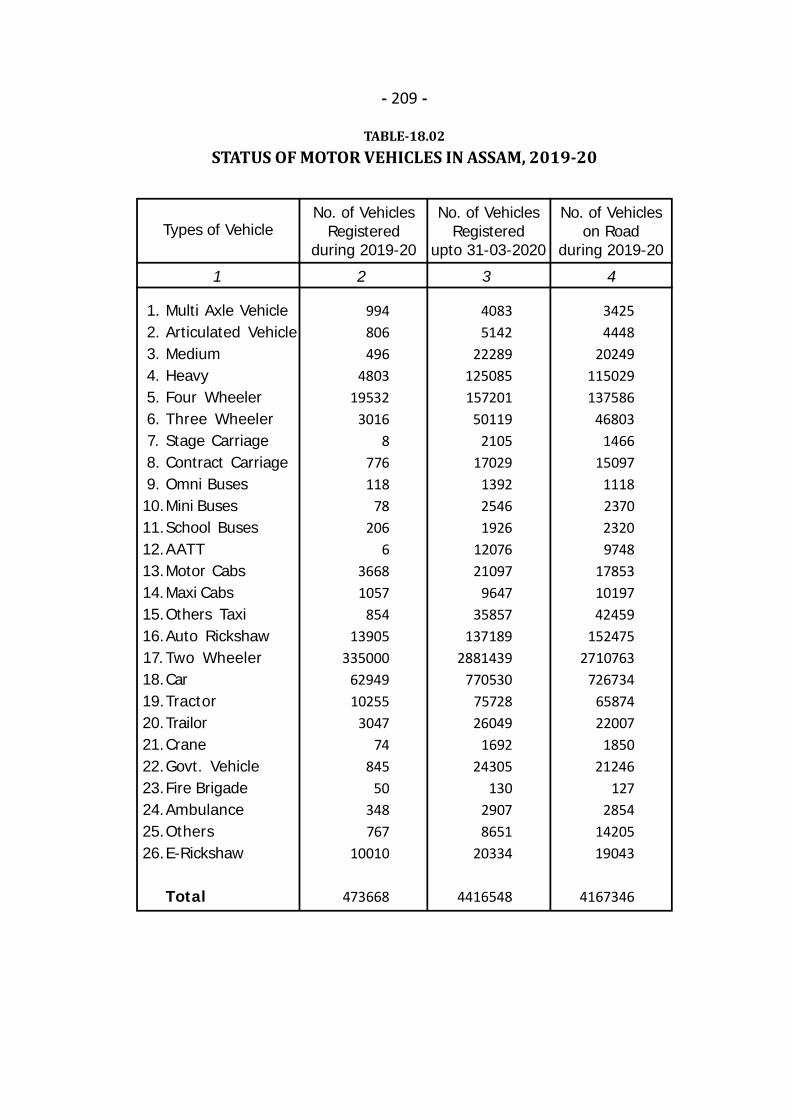
- 209 -
TABLE-18.02STATUS OF MOTOR VEHICLES IN ASSAM, 2019-20
1 2 3 4
Types of VehicleNo. of Vehicles
Registeredupto 31-03-2020
No. of Vehicleson Road
during 2019-20
Multi Axle VehicleArticulated VehicleMediumHeavyFour WheelerThree WheelerStage CarriageContract CarriageOmni BusesMini BusesSchool BusesAATTMotor CabsMaxi CabsOthers TaxiAuto RickshawTwo WheelerCarTractorTrailorCraneGovt. VehicleFire BrigadeAmbulanceOthersE-Rickshaw
Total
40835142
22289125085157201
501192105
17029139225461926
1207621097
964735857
1371892881439
7705307572826049
169224305
13029078651
20334
4416548
34254448
20249115029137586
468031466
150971118237023209748
178531019742459
1524752710763
7267346587422007
185021246
1272854
1420519043
4167346
1.2.3.4.5.6.7.8.9.10.11.12.13.14.15.16.17.18.19.20.21.22.23.24.25.26.
No. of VehiclesRegistered
during 2019-20
994806496
480319532
30168
776118
78206
636681057
85413905
3350006294910255
304774
84550
348767
10010
473668
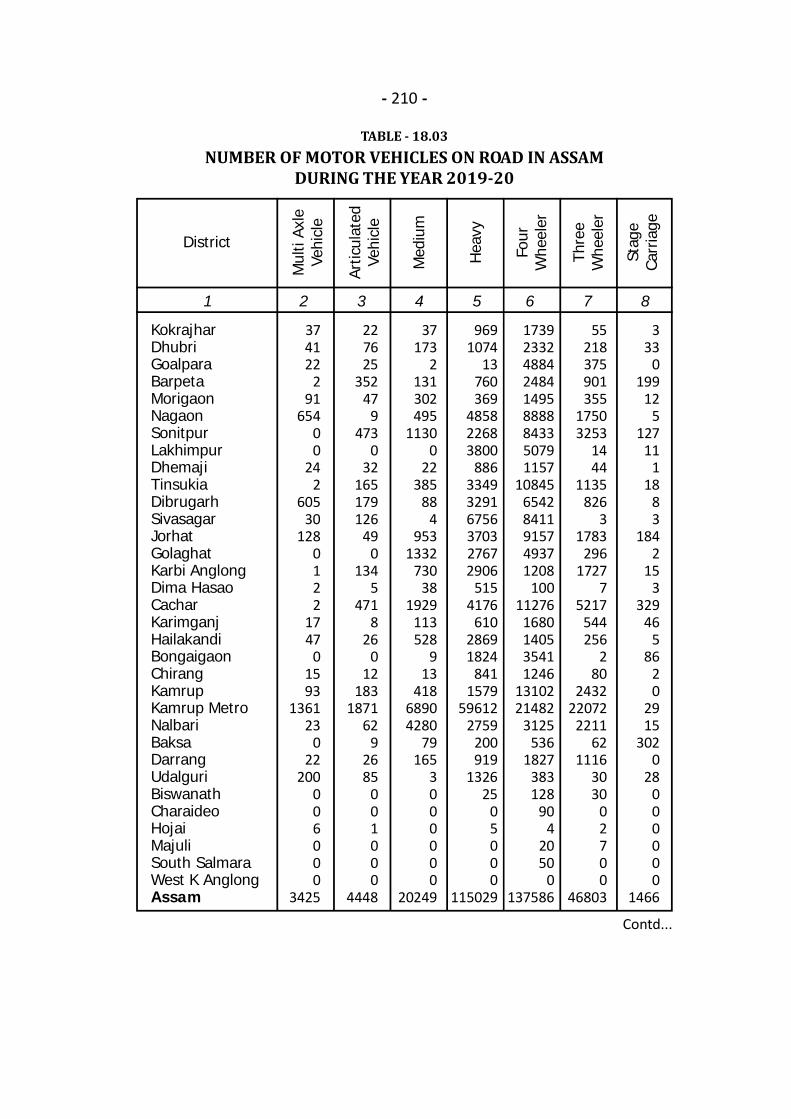
- 210 -
TABLE - 18.03NUMBER OF MOTOR VEHICLES ON ROAD IN ASSAM
DURING THE YEAR 2019-20
Contd...
1 2 3 4 5 6 7 8
KokrajharDhubriGoalparaBarpetaMorigaonNagaonSonitpurLakhimpurDhemajiTinsukiaDibrugarhSivasagarJorhatGolaghatKarbi AnglongDima HasaoCacharKarimganjHailakandiBongaigaonChirangKamrupKamrup MetroNalbariBaksaDarrangUdalguriBiswanathCharaideoHojaiMajuliSouth SalmaraWest K AnglongAssam
District
Mul
ti Ax
leVe
hicl
e374122
291
65400
242
60530
1280122
1747
01593
136123
022
200006000
3425
227625
35247
9473
032
165179126
490
1345
4718
260
12183
187162
92685
001000
4448
37173
2131302495
11300
22385
884
9531332
73038
1929113528
913
41868904280
79165
3000000
20249
9691074
13760369
485822683800
886334932916756370327672906
5154176
61028691824
8411579
596122759
200919
132625
05000
115029
173923324884248414958888843350791157
1084565428411915749371208
10011276
1680140535411246
1310221482
3125536
1827383128
904
2050
0137586
55218375901355
17503253
1444
1135826
31783
2961727
75217
544256
280
243222072
221162
11163030
02700
46803
333
0199
125
12711
118
83
1842
153
32946
586
20
2915
3020
28000000
1466
Artic
ulat
edVe
hicl
e
Med
ium
Hea
vy
Four
Whe
eler
Thre
eW
heel
er
Stag
eCa
rria
ge

- 211 -
TABLE - 18.03
Contd...
1 9 10 11 12 13 14 15
KokrajharDhubriGoalparaBarpetaMorigaonNagaonSonitpurLakhimpurDhemajiTinsukiaDibrugarhSivasagarJorhatGolaghatKarbi AnglongDima HasaoCacharKarimganjHailakandiBongaigaonChirangKamrupKamrup MetroNalbariBaksaDarrangUdalguriBiswanathCharaideoHojaiMajuliSouth SalmaraWest K AnglongAssam
District
Cont
ract
Carr
iage
80230444226
52456871337114452
1242264716316275
17538
47731432
6257336
1565
1781000000
15097
710
2183
36002
4118
3400
1480
2201
22755
022
40000000
1118
30106
610
8230
721
130152
29244
010
3568967
010
10400
1220000000
2370
1016
228
753913
032
1580
71420
08
4414
407
149960
221
310
000000
2320
220151
0305
86189
119000
12845
80
541
19166
102
170338
5513221102155
0000000
9748
110614
209145555550517108135
482542
76228
4073
280132
144
15021668607
43834516
0005
250
17853
1151126411635
9501
13427
142
230226
84
1298230
05
40889
311056
369167
39000300
10197
Om
niBu
ses
Min
iBu
ses
Scho
olBu
ses
AATT
Mot
orCa
b
Max
iCa
b

- 212 -
TABLE - 18.03
Contd...
1 16 17 18 19 20 21 22
KokrajharDhubriGoalparaBarpetaMorigaonNagaonSonitpurLakhimpurDhemajiTinsukiaDibrugarhSivasagarJorhatGolaghatKarbi AnglongDima HasaoCacharKarimganjHailakandiBongaigaonChirangKamrupKamrup MetroNalbariBaksaDarrangUdalguriBiswanathCharaideoHojaiMajuliSouth SalmaraWest K AnglongAssam
District
Oth
ers
Taxi
3121066
3349312
236010772813
6102321
59856415261
856416
94027
9971362
397594
22713529
8502968
218396
000000
42459
826948492255265217608926424129322426
29986251131705324
68943941820
1997589065764535120983683
14290126426281171
816966510
2152
0152475
457446923659785
12771653559
170907169680119242
17851113345151935175352166833
6683151389
3813102662
2172518390
1070942681897383
58220968960147697252431067
1232615
1199469429
02710763
59155106671781893814
347143088421360
39853407975803405825763213091
61931728
2734280374032
1113143351821
3059662734109885611731
8912102419
0726734
9142541220132841951613967554363
76811053554121158811056
26643
115436
24931422452454049642416116122121480
122
20110
65874
68278344
1355188654
25401716
577186131171003
69235
69
8182618
211111825
30721000
486720700
000000
22007
1140
115
1025
80
8285
204434
924
341
330
3971
75552
160000000
1850
Auto
Rick
shaw
Two
Whe
eler
Pvt.
Car
Trac
tor
Trai
lor
Cran
e

- 213 -
TABLE - 18.03
1 23 24 25 26 27 28
KokrajharDhubriGoalparaBarpetaMorigaonNagaonSonitpurLakhimpurDhemajiTinsukiaDibrugarhSivasagarJorhatGolaghatKarbi AnglongDima HasaoCacharKarimganjHailakandiBongaigaonChirangKamrupKamrup MetroNalbariBaksaDarrangUdalguriBiswanathCharaideoHojaiMajuliSouth SalmaraWest K AnglongAssam
District
Gov
t.Ve
hicl
e838
240
1182
360358
22391534
240126
022
0602658159
60
2797
149966152
12983
000000
21246
3500010010
15900000400020
600000000000
127
121124030
767
13821
264265179116
3068
91650
1096
11908
1071936
000000
2854
1177513999
2214634
2340790108177597218339
7690
50
192708536454149
38191053
654145163183124
1539
010
19043
680578814778368
15156765715
245963235857164187
28875200679255217249069261650
9398169807
8794183801
4413235749
13326739322
1370811076718
90991254359037638630
1739819
1297532678
04167346
Fire
Brig
ade
Ambu
lanc
e
E-Ri
cksh
aw
Tota
l
223162
185425
15190
103097
3715409
144434118
27614
038
077
4793996
86217
1417
320
1110
14205
Oth
ers
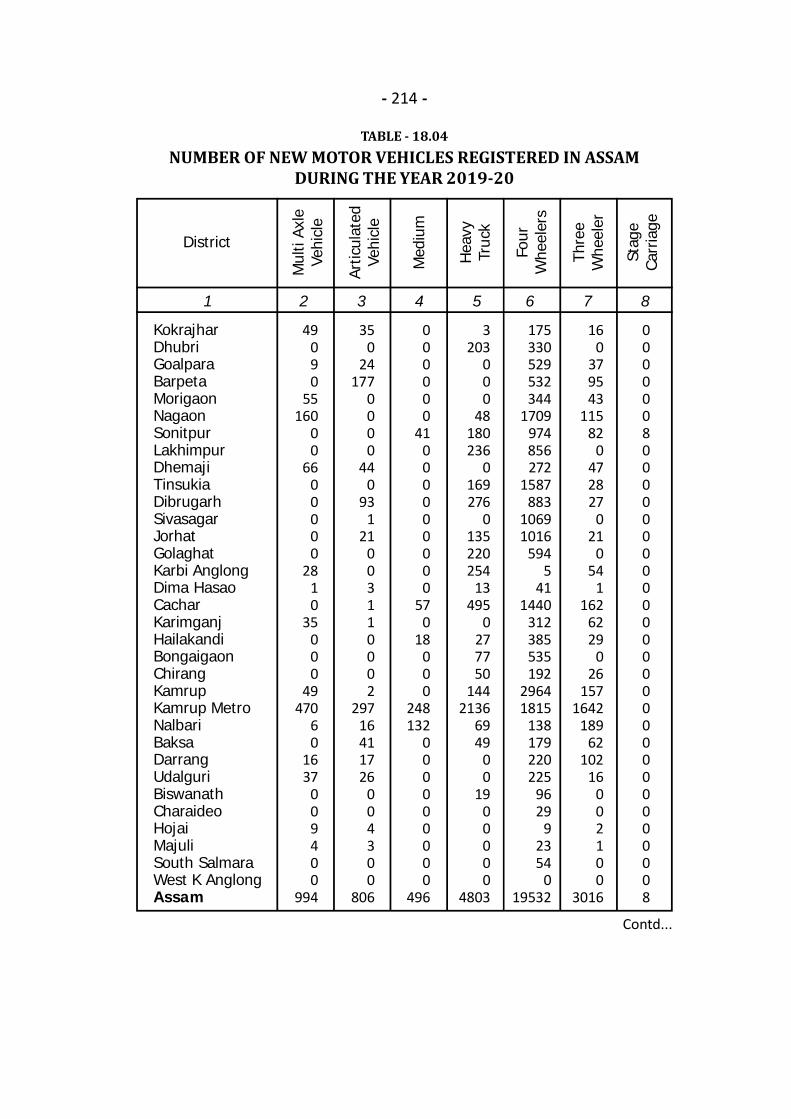
- 214 -
TABLE - 18.04NUMBER OF NEW MOTOR VEHICLES REGISTERED IN ASSAM
DURING THE YEAR 2019-20
Contd...
1 2 3 4 5 6 7 8
KokrajharDhubriGoalparaBarpetaMorigaonNagaonSonitpurLakhimpurDhemajiTinsukiaDibrugarhSivasagarJorhatGolaghatKarbi AnglongDima HasaoCacharKarimganjHailakandiBongaigaonChirangKamrupKamrup MetroNalbariBaksaDarrangUdalguriBiswanathCharaideoHojaiMajuliSouth SalmaraWest K AnglongAssam
District
Mul
ti Ax
leVe
hicl
e49
090
55160
00
6600000
2810
35000
49470
60
1637
009400
994
350
24177
0000
440
931
21003110002
29716411726
004300
806
000000
41000000000
570
18000
248132
000000000
496
3203
000
48180236
0169276
0135220254
13495
0277750
1442136
6949
00
1900000
4803
175330529532344
1709974856272
1587883
10691016
5945
411440
312385535192
29641815
138179220225
9629
92354
019532
160
379543
11582
0472827
021
054
1162
6229
026
1571642
18962
10216
002100
3016
0000008000000000000000000000000008
Artic
ulat
edVe
hicl
e
Med
ium
Hea
vyTr
uck
Four
Whe
eler
s
Thre
eW
heel
er
Stag
eCa
rria
ge
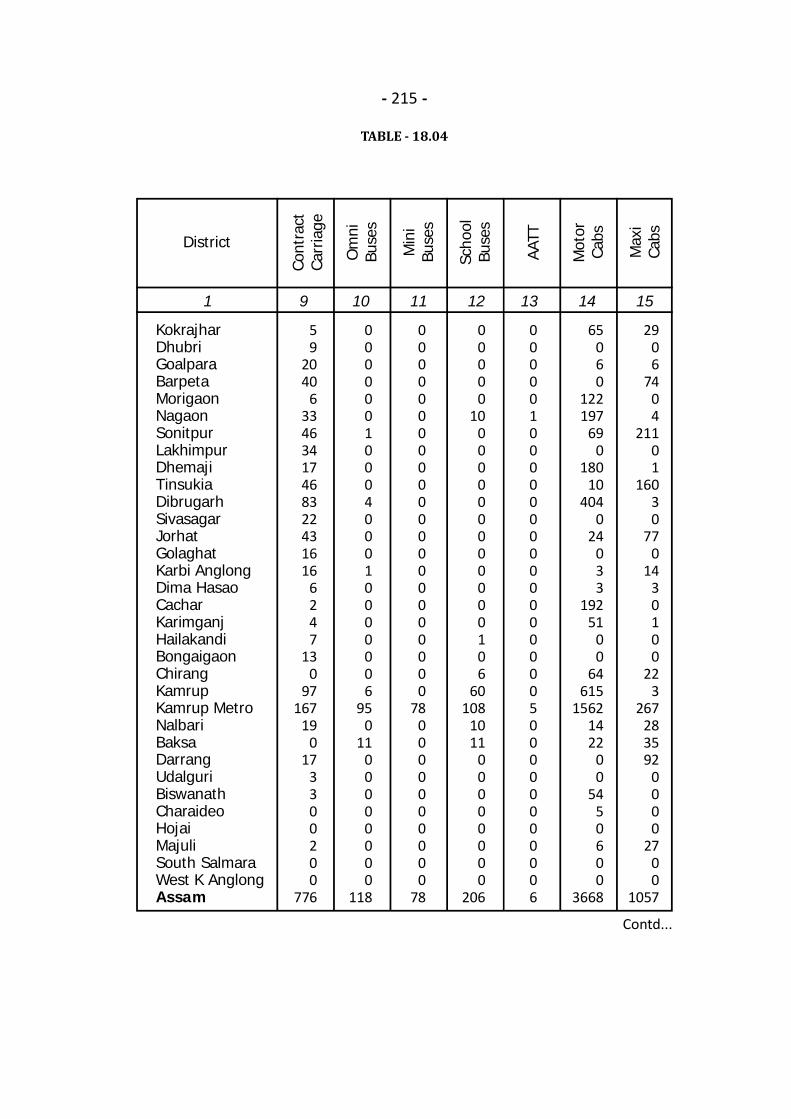
- 215 -
TABLE - 18.04
Contd...
1 9 10 11 12 13 14 15
KokrajharDhubriGoalparaBarpetaMorigaonNagaonSonitpurLakhimpurDhemajiTinsukiaDibrugarhSivasagarJorhatGolaghatKarbi AnglongDima HasaoCacharKarimganjHailakandiBongaigaonChirangKamrupKamrup MetroNalbariBaksaDarrangUdalguriBiswanathCharaideoHojaiMajuliSouth SalmaraWest K AnglongAssam
District
Cont
ract
Carr
iage
59
2040
633463417468322431616
6247
130
97167
190
173300200
776
0000001000400010000006
950
1100000000
118
0000000000000000000000
780000000000
78
00000
10000000000000106
60108
1011
00000000
206
0000010000000000000000500000000006
65060
122197
690
18010
4040
24033
19251
00
64615
15621422
00
5450600
3668
2906
7404
21101
16030
770
1430100
223
267283592
0000
2700
1057
Om
niBu
ses
Min
iBu
ses
Scho
olBu
ses
AATT
Mot
orCa
bs
Max
iCa
bs

- 216 -
TABLE - 18.04
Contd...
1 16 17 18 19 20 21 22
KokrajharDhubriGoalparaBarpetaMorigaonNagaonSonitpurLakhimpurDhemajiTinsukiaDibrugarhSivasagarJorhatGolaghatKarbi AnglongDima HasaoCacharKarimganjHailakandiBongaigaonChirangKamrupKamrup MetroNalbariBaksaDarrangUdalguriBiswanathCharaideoHojaiMajuliSouth SalmaraWest K AnglongAssam
District
Oth
ers
Taxi
029
025
000
29900
95162
092
0000
3655
000000
61000000
854
278674194218384980438391581168310
895484
787350
23081826
885250243685641233238228
856965
017
1520
13905
566380518908
201339467
180731950713119
692414284108601908515708
74604451
42013993
33222118
119802537
187105836014430
470613433
30551984
4622589
777431
0335000
865637663995655
332935242396
99825414006317942741319
622205
2730678282
1501436262
24966365179
1065114
629
284816
062949
173353372510383
1134581693
5985
24121
254206
65407
178237
11452531
398220288153
1200510
10255
565522
1503
228
65101947
527
1010000
19104
2117154108
3616
020000
3047
60000030006
242310000005
240000000000
74
Auto
Rick
shaw
Two
Whe
eler
Pvt.
Car
Trac
tor
Trai
lor
Cran
e
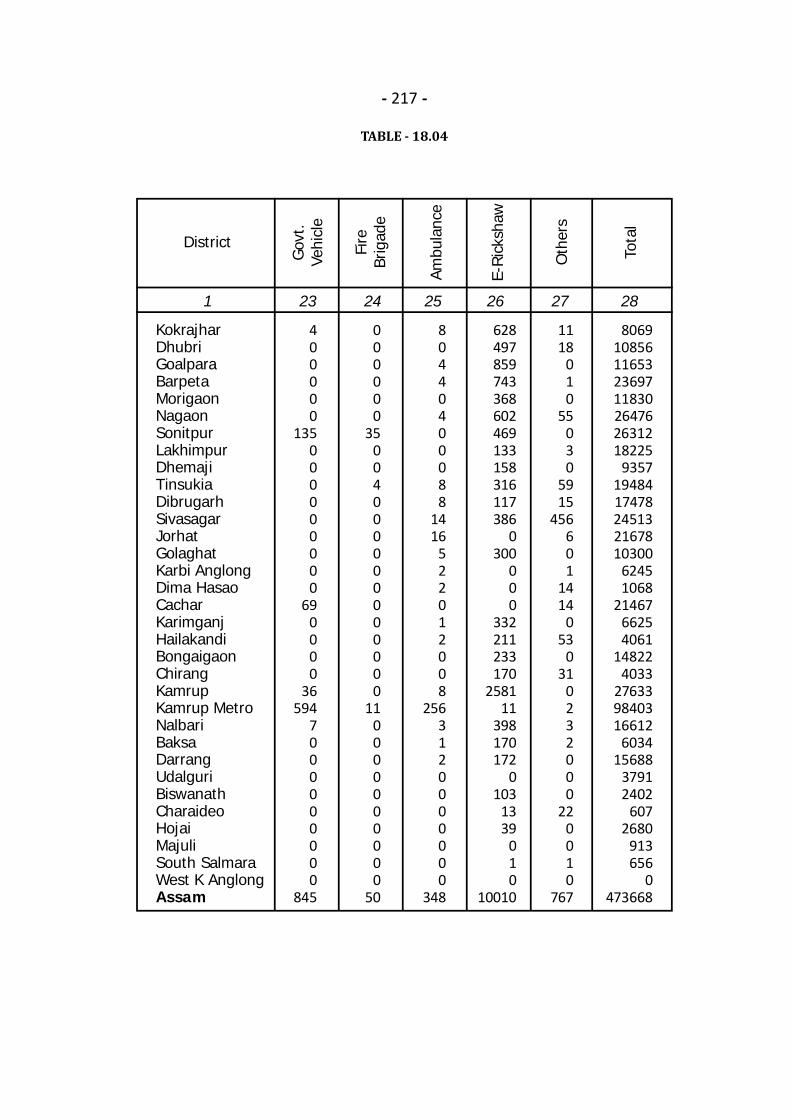
- 217 -
TABLE - 18.04
1 23 24 25 26 27 28
KokrajharDhubriGoalparaBarpetaMorigaonNagaonSonitpurLakhimpurDhemajiTinsukiaDibrugarhSivasagarJorhatGolaghatKarbi AnglongDima HasaoCacharKarimganjHailakandiBongaigaonChirangKamrupKamrup MetroNalbariBaksaDarrangUdalguriBiswanathCharaideoHojaiMajuliSouth SalmaraWest K AnglongAssam
District
Gov
t.Ve
hicl
e400000
135000000000
690000
36594
7000000000
845
000000
35004000000000000
110000000000
50
80440400088
1416
522012008
2563120000000
348
628497859743368602469133158316117386
0300
000
332211233170
258111
398170172
0103
1339
010
10010
806910856116532369711830264762631218225
93571948417478245132167810300
62451068
2146766254061
148224033
276339840316612
603415688
37912402
6072680
913656
0473668
Fire
Brig
ade
Ambu
lanc
e
E-Ri
cksh
aw
1118
010
55030
5915
456601
1414
053
031
0232000
220010
767
Oth
ers
Tota
l
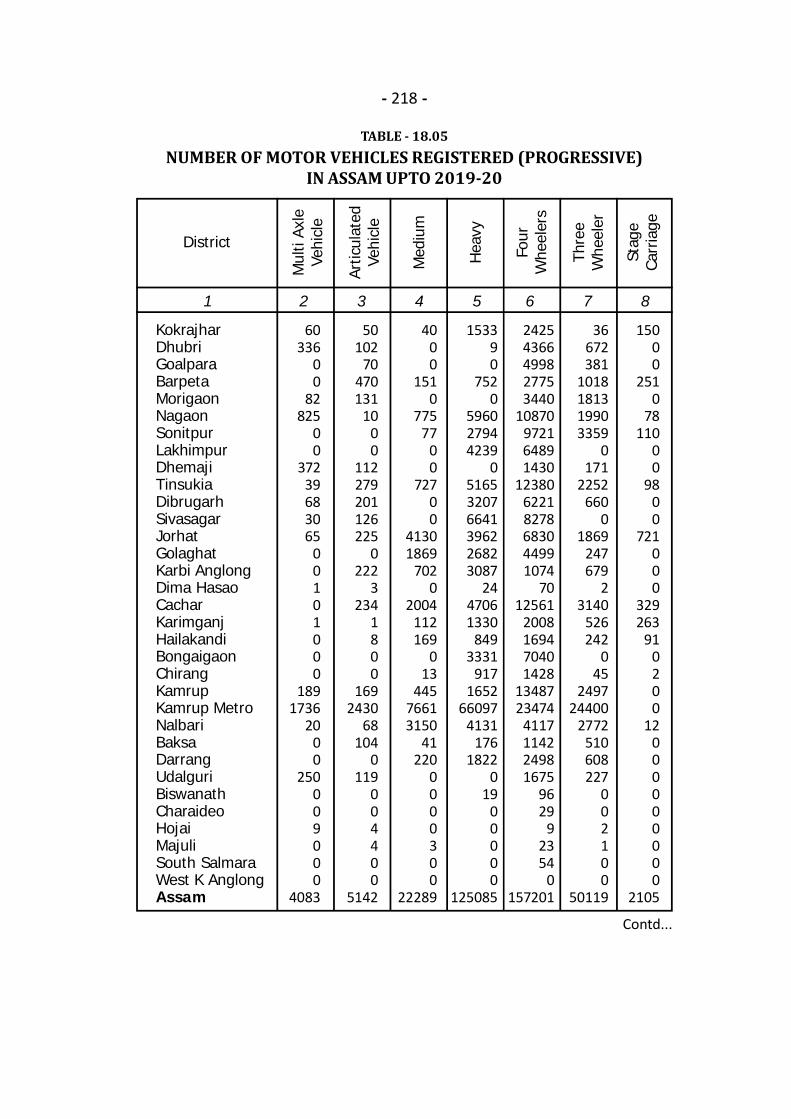
- 218 -
TABLE - 18.05NUMBER OF MOTOR VEHICLES REGISTERED (PROGRESSIVE)
IN ASSAM UPTO 2019-20
Contd...
1 2 3 4 5 6 7 8
KokrajharDhubriGoalparaBarpetaMorigaonNagaonSonitpurLakhimpurDhemajiTinsukiaDibrugarhSivasagarJorhatGolaghatKarbi AnglongDima HasaoCacharKarimganjHailakandiBongaigaonChirangKamrupKamrup MetroNalbariBaksaDarrangUdalguriBiswanathCharaideoHojaiMajuliSouth SalmaraWest K AnglongAssam
District
Mul
ti Ax
leVe
hicl
e60
33600
82825
00
37239683065
00101000
1891736
2000
250009000
4083
50102
70470131
1000
112279201126225
0222
3234
1800
1692430
68104
0119
004400
5142
4000
1510
77577
00
72700
41301869
7020
2004112169
013
44576613150
41220
0000300
22289
153390
7520
596027944239
0516532076641396226823087
2447061330
8493331
9171652
660974131
1761822
019
00000
125085
24254366499827753440
10870972164891430
1238062218278683044991074
7012561
2008169470401428
1348723474
4117114224981675
9629
92354
0157201
36672381
1018181319903359
0171
2252660
01869
247679
23140
526242
045
249724400
2772510608227
002100
50119
15000
2510
78110
00
9800
721000
329263
910200
12000000000
2105
Artic
ulat
edVe
hicl
e
Four
Whe
eler
s
Thre
eW
heel
er
Stag
eCa
rria
ge
Med
ium
Hea
vy
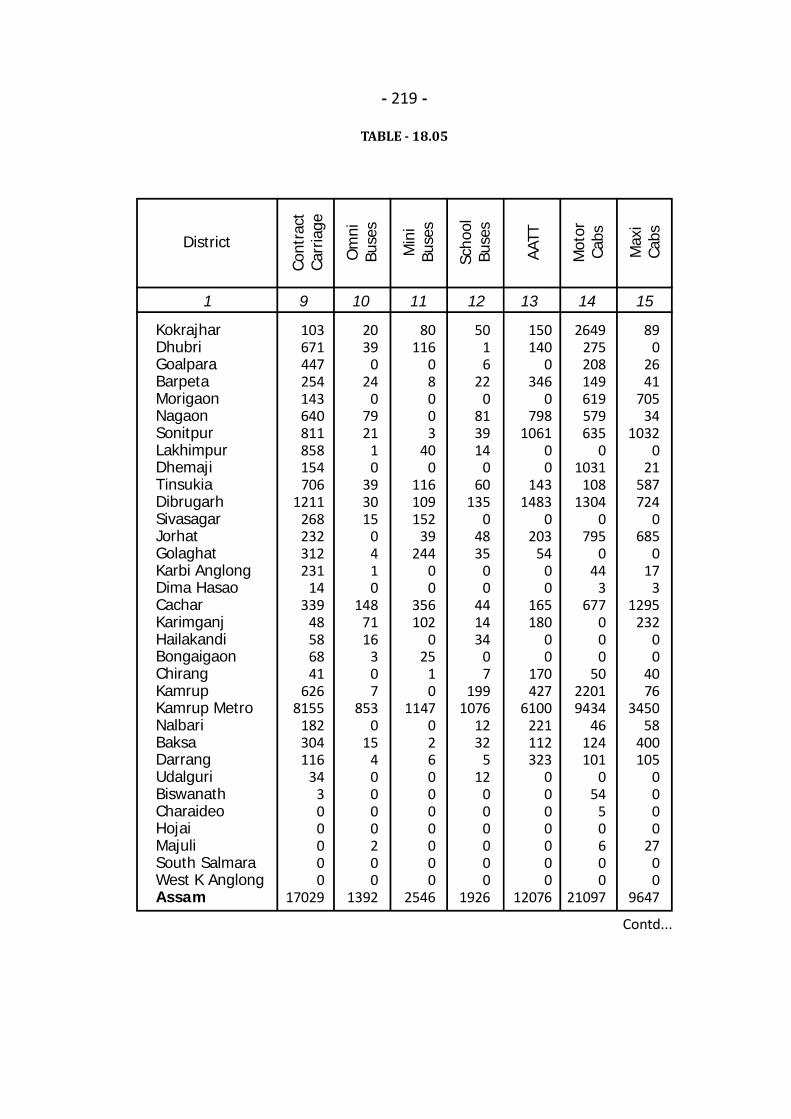
- 219 -
TABLE - 18.05
Contd...
1 9 10 11 12 13 14 15
KokrajharDhubriGoalparaBarpetaMorigaonNagaonSonitpurLakhimpurDhemajiTinsukiaDibrugarhSivasagarJorhatGolaghatKarbi AnglongDima HasaoCacharKarimganjHailakandiBongaigaonChirangKamrupKamrup MetroNalbariBaksaDarrangUdalguriBiswanathCharaideoHojaiMajuliSouth SalmaraWest K AnglongAssam
District
Cont
ract
Carr
iage
103671447254143640811858154706
1211268232312231
14339
48586841
6268155
182304116
34300000
17029
2039
024
07921
10
393015
0410
1487116
307
8530
1540000200
1392
80116
08003
400
116109152
39244
00
356102
025
10
11470260000000
2546
5016
220
813914
060
1350
4835
00
441434
07
1991076
1232
512
000000
1926
150140
0346
0798
106100
1431483
0203
5400
165180
00
170427
6100221112323
0000000
12076
2649275208149619579635
01031
1081304
0795
044
3677
000
5022019434
46124101
054
50600
21097
890
2641
70534
10320
21587724
0685
017
31295
23200
4076
345058
400105
0000
2700
9647
Om
niBu
ses
Min
iBu
ses
Scho
olBu
ses
AATT
Mot
orCa
bs
Max
iCa
bs
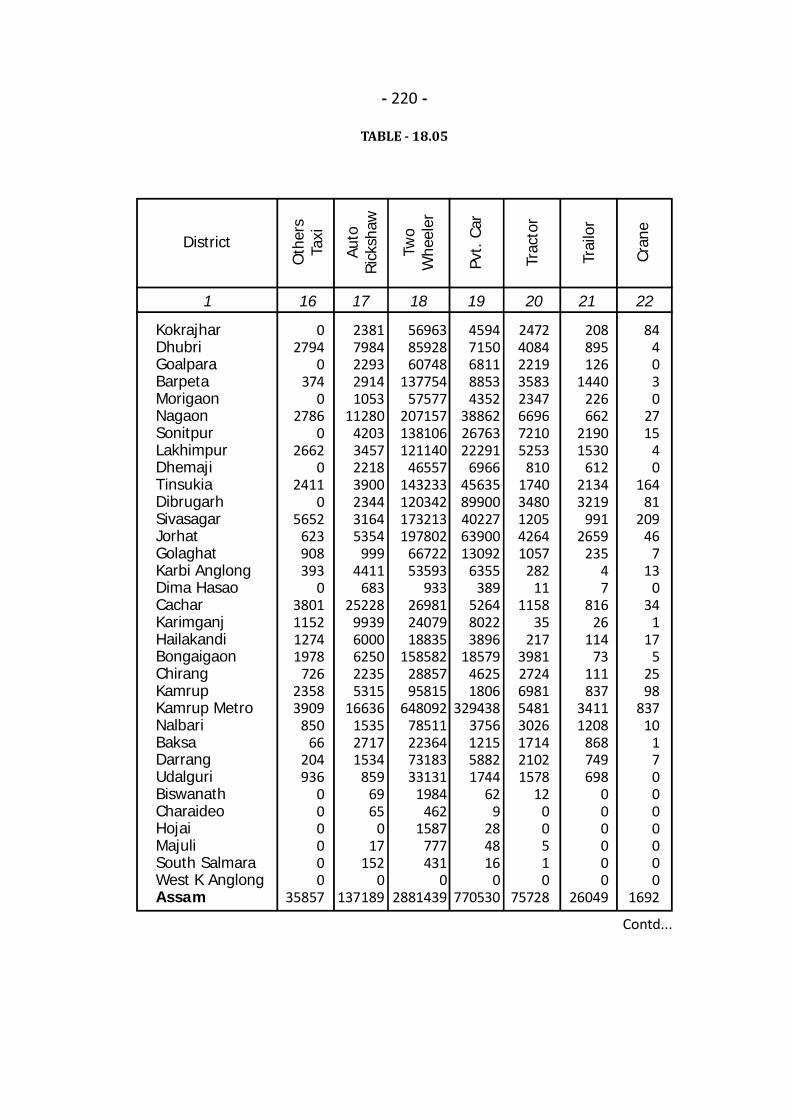
- 220 -
TABLE - 18.05
Contd...
1 16 17 18 19 20 21 22
KokrajharDhubriGoalparaBarpetaMorigaonNagaonSonitpurLakhimpurDhemajiTinsukiaDibrugarhSivasagarJorhatGolaghatKarbi AnglongDima HasaoCacharKarimganjHailakandiBongaigaonChirangKamrupKamrup MetroNalbariBaksaDarrangUdalguriBiswanathCharaideoHojaiMajuliSouth SalmaraWest K AnglongAssam
District
Oth
ers
Taxi
02794
0374
02786
02662
02411
05652
623908393
03801115212741978
72623583909
85066
204936
000000
35857
23817984229329141053
112804203345722183900234431645354
9994411
68325228
99396000625022355315
16636153527171534
8596965
017
1520
137189
569638592860748
13775457577
207157138106121140
46557143233120342173213197802
6672253593
933269812407918835
1585822885795815
64809278511223647318333131
1984462
1587777431
02881439
45947150681188534352
388622676322291
69664563589900402276390013092
6355389
526480223896
1857946251806
3294383756121558821744
629
284816
0770530
24724084221935832347669672105253
81017403480120542641057
28211
115835
21739812724698154813026171421021578
1200510
75728
208895126
1440226662
21901530
61221343219
9912659
23547
81626
11473
111837
34111208
868749698
000000
26049
844030
2715
40
16481
20946
713
034
117
52598
83710
170000000
1692
Auto
Rick
shaw
Two
Whe
eler
Pvt.
Car
Trac
tor
Trai
lor
Cran
e
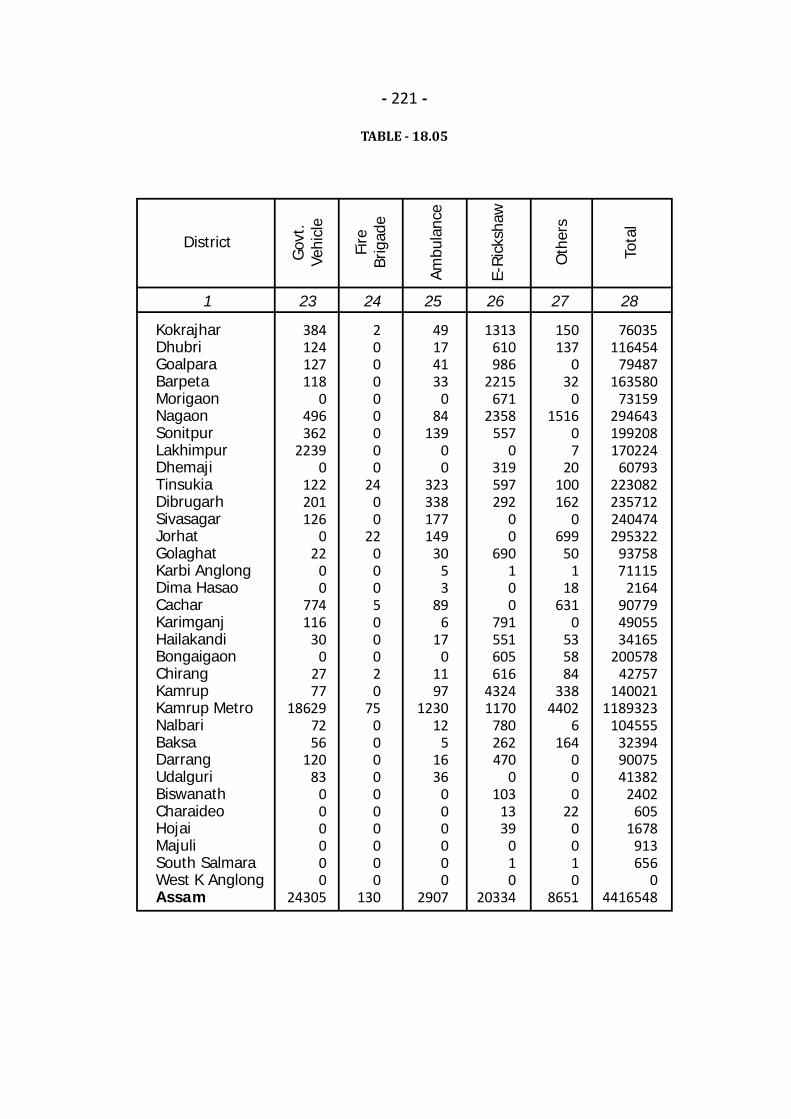
- 221 -
TABLE - 18.05
1 23 24 25 26 27 28
KokrajharDhubriGoalparaBarpetaMorigaonNagaonSonitpurLakhimpurDhemajiTinsukiaDibrugarhSivasagarJorhatGolaghatKarbi AnglongDima HasaoCacharKarimganjHailakandiBongaigaonChirangKamrupKamrup MetroNalbariBaksaDarrangUdalguriBiswanathCharaideoHojaiMajuliSouth SalmaraWest K AnglongAssam
District
Gov
t.Ve
hicl
e384124127118
0496362
22390
122201126
022
00
774116
300
2777
186297256
12083
000000
24305
200000000
2400
22000500020
750000000000
130
49174133
084
13900
323338177149
3053
896
170
1197
123012
51636
000000
2907
1313610986
2215671
2358557
0319597292
00
690100
791551605616
43241170
780262470
0103
1339
010
20334
76035116454
79487163580
73159294643199208170224
60793223082235712240474295322
9375871115
2164907794905534165
20057842757
1400211189323
104555323949007541382
2402605
1678913656
04416548
Fire
Brig
ade
Ambu
lanc
e
E-Ri
cksh
aw
Tota
l
150137
032
01516
07
20100162
0699
501
18631
0535884
3384402
6164
000
220010
8651
Oth
ers
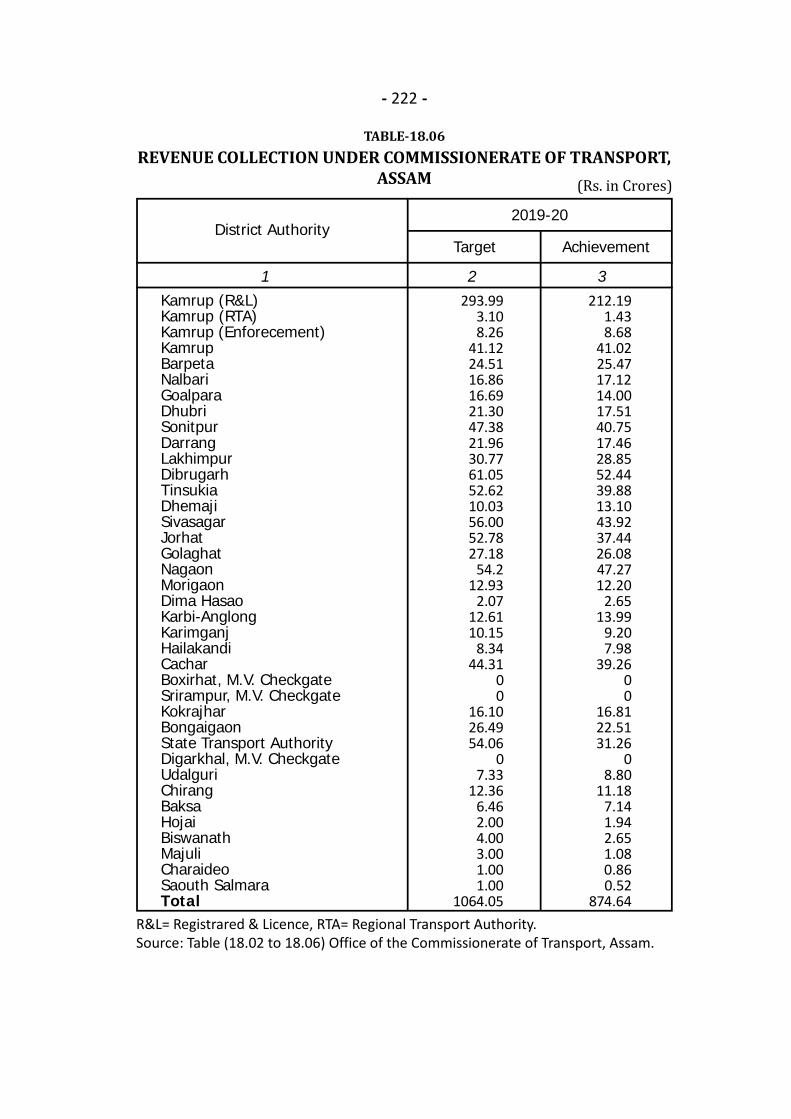
- 222 -
TABLE-18.06REVENUE COLLECTION UNDER COMMISSIONERATE OF TRANSPORT,
ASSAM
R&L= Registrared & Licence, RTA= Regional Transport Authority.Source: Table (18.02 to 18.06) Office of the Commissionerate of Transport, Assam.
1 2 3Kamrup (R&L)Kamrup (RTA)Kamrup (Enforecement)KamrupBarpetaNalbariGoalparaDhubriSonitpurDarrangLakhimpurDibrugarhTinsukiaDhemajiSivasagarJorhatGolaghatNagaonMorigaonDima HasaoKarbi-AnglongKarimganjHailakandiCacharBoxirhat, M.V. CheckgateSrirampur, M.V. CheckgateKokrajharBongaigaonState Transport AuthorityDigarkhal, M.V. CheckgateUdalguriChirangBaksaHojaiBiswanathMajuliCharaideoSaouth SalmaraTotal
District Authority2019-20
Target
212.191.438.68
41.0225.4717.1214.0017.5140.7517.4628.8552.4439.8813.1043.9237.4426.0847.2712.20
2.6513.99
9.207.98
39.2600
16.8122.5131.26
08.80
11.187.141.942.651.080.860.52
874.64
Achievement
293.993.108.26
41.1224.5116.8616.6921.3047.3821.9630.7761.0552.6210.0356.0052.7827.18
54.212.93
2.0712.6110.15
8.3444.31
00
16.1026.4954.06
07.33
12.366.462.004.003.001.001.00
1064.05
(Rs. in Crores)
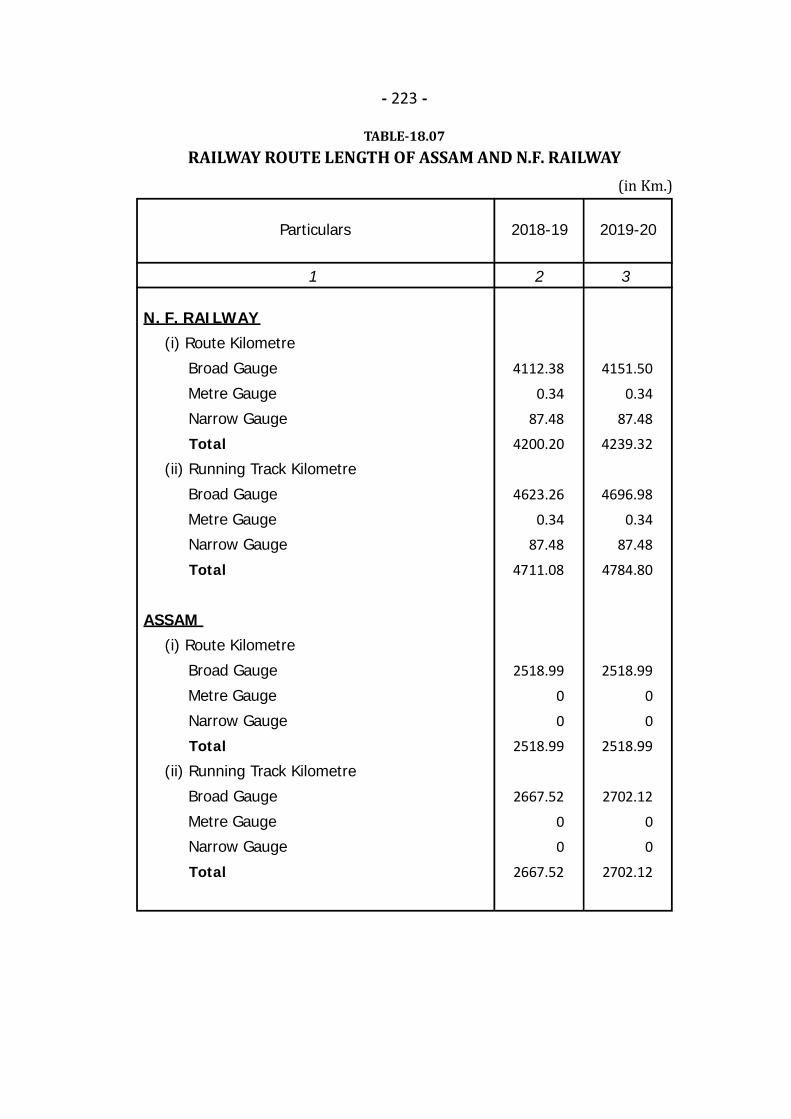
- 223 -
TABLE-18.07RAILWAY ROUTE LENGTH OF ASSAM AND N.F. RAILWAY(in Km.)
1 2 3
Particulars 2018-19 2019-20
(i) Route Kilometre
Broad Gauge
Metre Gauge
Narrow Gauge
Total
(ii) Running Track Kilometre
Broad Gauge
Metre Gauge
Narrow Gauge
Total
(i) Route Kilometre
Broad Gauge
Metre Gauge
Narrow Gauge
Total
(ii) Running Track Kilometre
Broad Gauge
Metre Gauge
Narrow Gauge
Total
4112.38
0.34
87.48
4200.20
4623.26
0.34
87.48
4711.08
2518.99
0
0
2518.99
2667.52
0
0
2667.52
4151.50
0.34
87.48
4239.32
4696.98
0.34
87.48
4784.80
2518.99
0
0
2518.99
2702.12
0
0
2702.12
N. F. RAILWAY
ASSAM
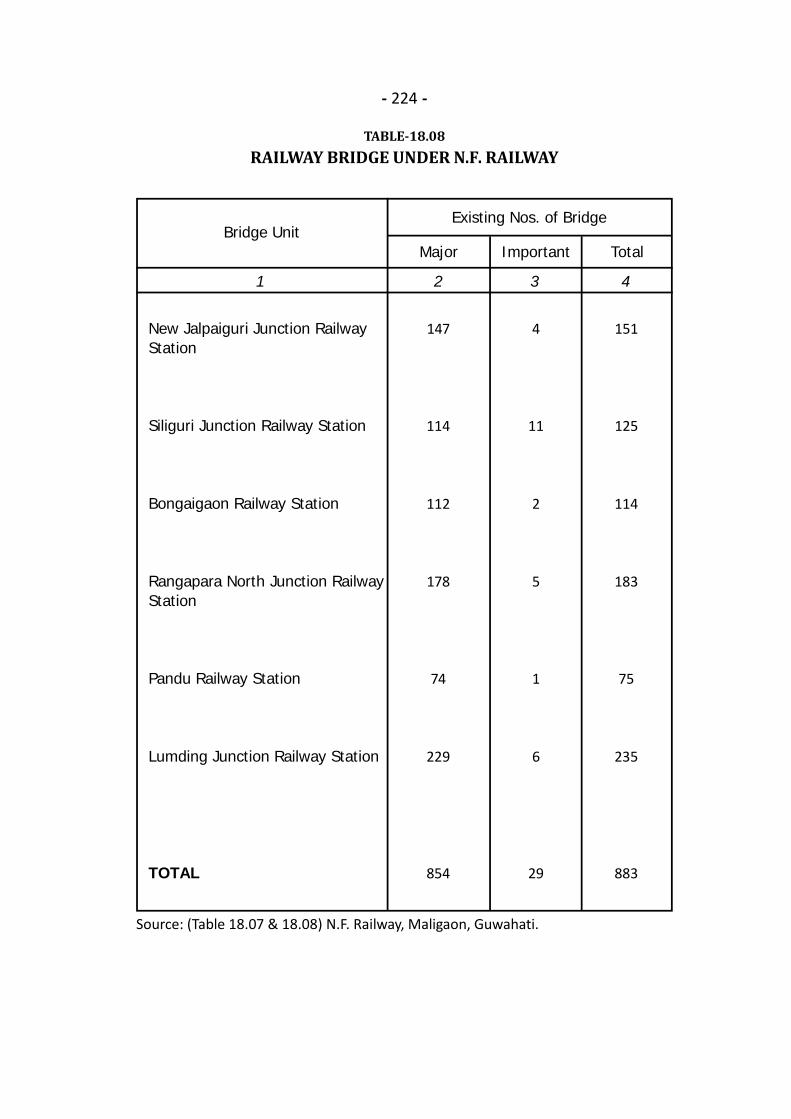
- 224 -
TABLE-18.08RAILWAY BRIDGE UNDER N.F. RAILWAY
Source: (Table 18.07 & 18.08) N.F. Railway, Maligaon, Guwahati.
1 2 3 4
Major Important TotalBridge Unit
New Jalpaiguri Junction RailwayStation
Siliguri Junction Railway Station
Bongaigaon Railway Station
Rangapara North Junction RailwayStation
Pandu Railway Station
Lumding Junction Railway Station
TOTAL
147
114
112
178
74
229
854
4
11
2
5
1
6
29
151
125
114
183
75
235
883
Existing Nos. of Bridge
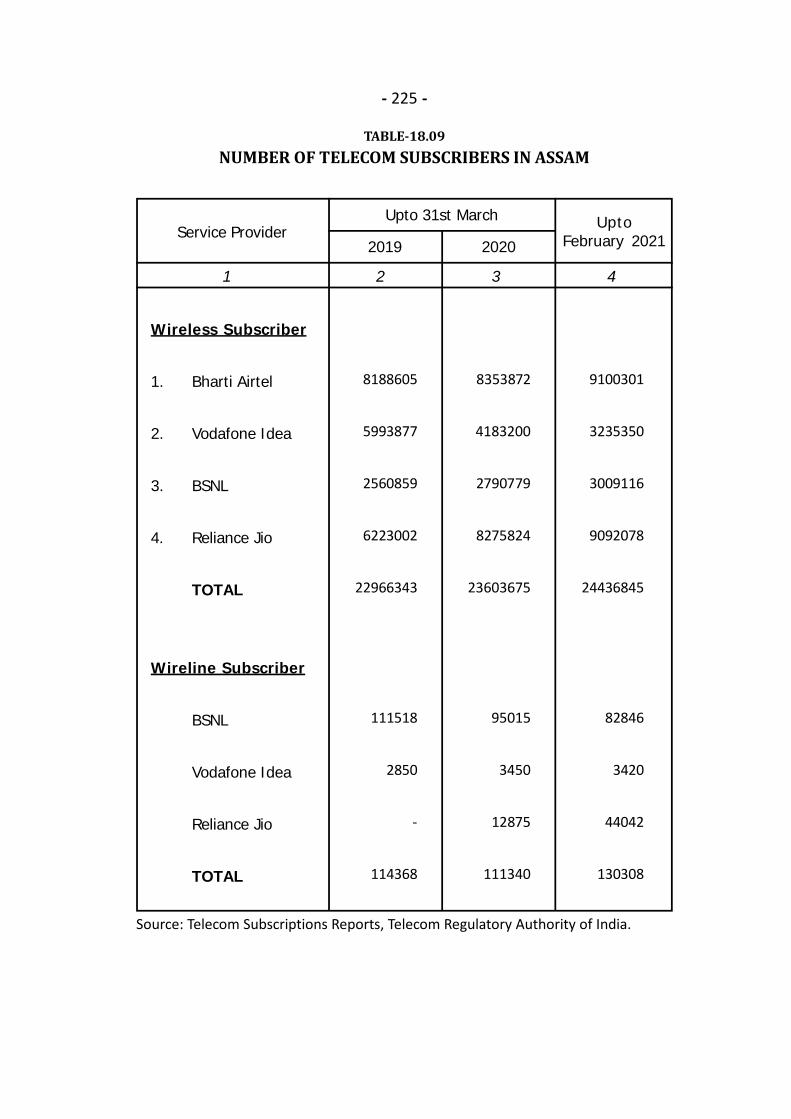
- 225 -
TABLE-18.09NUMBER OF TELECOM SUBSCRIBERS IN ASSAM
Source: Telecom Subscriptions Reports, Telecom Regulatory Authority of India.
1 2 3 4
Upto 31st March UptoFebruary 2021
Bharti Airtel
Vodafone Idea
BSNL
Reliance Jio
TOTAL
BSNL
Vodafone Idea
Reliance Jio
TOTAL
9100301
3235350
3009116
9092078
24436845
82846
3420
44042
130308
Wireless Subscriber
1.
2.
3.
4.
Wireline Subscriber
2019 2020Service Provider
8353872
4183200
2790779
8275824
23603675
95015
3450
12875
111340
8188605
5993877
2560859
6223002
22966343
111518
2850
-
114368

- 226 -
TABLE-DISTRICT-WISE NUMBER OF POST OFFICES
1 2 3 4 5 6 7 8
KokrajharDhubriGoalparaBarpetaMorigaonNagaonSonitpurLakhimpurDhemajiTinsukiaDibrugarhSivasagarJorhatGolaghatKarbi AnglongDima HasaoCacharKarimganjHailakandiBongaigaonChirangKamrupKamrup MetroNalbariBaksaDarrangUdalguriBiswanathCharaideoHojaiMajuliSouth SalmaraWest K AnglongAssam
District
Rural Urban Total
118113100168
92202108172
80124199180150144
8363
210130153
6745
21117
139119103
96677168492524
3690
482
11101310
94
2116
719
887
221711
63
1658
7022338024
321
122121102179102215118181
84145215187169152
9170
232147164
7348
22775
146119105
98707476492728
4011
1713181317133113403017
9112416121814
916271543
718152127152112263117
3134930123812544
760594
1213
23514204563302
58049
705310766
8701920496108393
10825552879738574544034004696673068172407676786083994938899296517
12760495678818476827286736041
111603414
2115811562
7265
13735221926903113396
733015168142481014812071126071523311482116071221711888
892714339
64534376
1830211779
89001788011819
0277471878710456
990821544
013081
446613703
No. ofPost Offices
*Area servedper Post Office(in Sq. Km.)
*Populationserved perPost Office
* Figures are calculated by Directorate of Economics and Statistics, Assam on the basis of Census of India 2011 figures.Source: O/o the Chief Postmaster General, Assam Circle.
Rural Urban Rural Urban
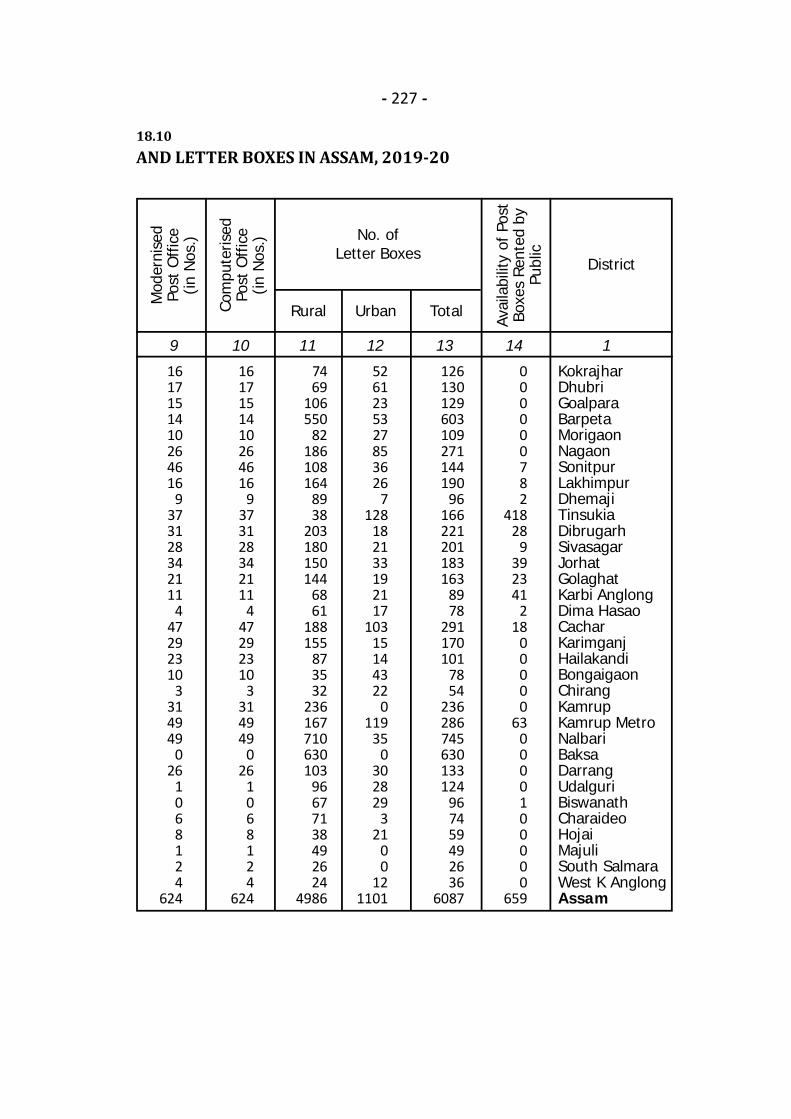
- 227 -
18.10AND LETTER BOXES IN ASSAM, 2019-20
9 10 11 12 13 14 1
KokrajharDhubriGoalparaBarpetaMorigaonNagaonSonitpurLakhimpurDhemajiTinsukiaDibrugarhSivasagarJorhatGolaghatKarbi AnglongDima HasaoCacharKarimganjHailakandiBongaigaonChirangKamrupKamrup MetroNalbariBaksaDarrangUdalguriBiswanathCharaideoHojaiMajuliSouth SalmaraWest K AnglongAssam
Com
pute
rised
Post
Offi
ce(in
Nos
.)
Urban Total
Avai
labi
lity
of P
ost
Boxe
s Re
nted
by
Publ
ic
District
Rural
Mod
erni
sed
Post
Offi
ce(in
Nos
.)
1617151410264616
9373128342111
447292310
3314949
026
1068124
624
1617151410264616
9373128342111
447292310
3314949
026
1068124
624
7469
106550
82186108164
8938
203180150144
6861
188155
873532
236167710630103
96677138492624
4986
5261235327853626
7128
182133192117
10315144322
0119
350
302829
321
00
121101
126130129603109271144190
96166221201183163
8978
291170101
7854
236286745630133124
967459492636
6087
000000782
41828
9392341
218
00000
630000100000
659
No. ofLetter Boxes
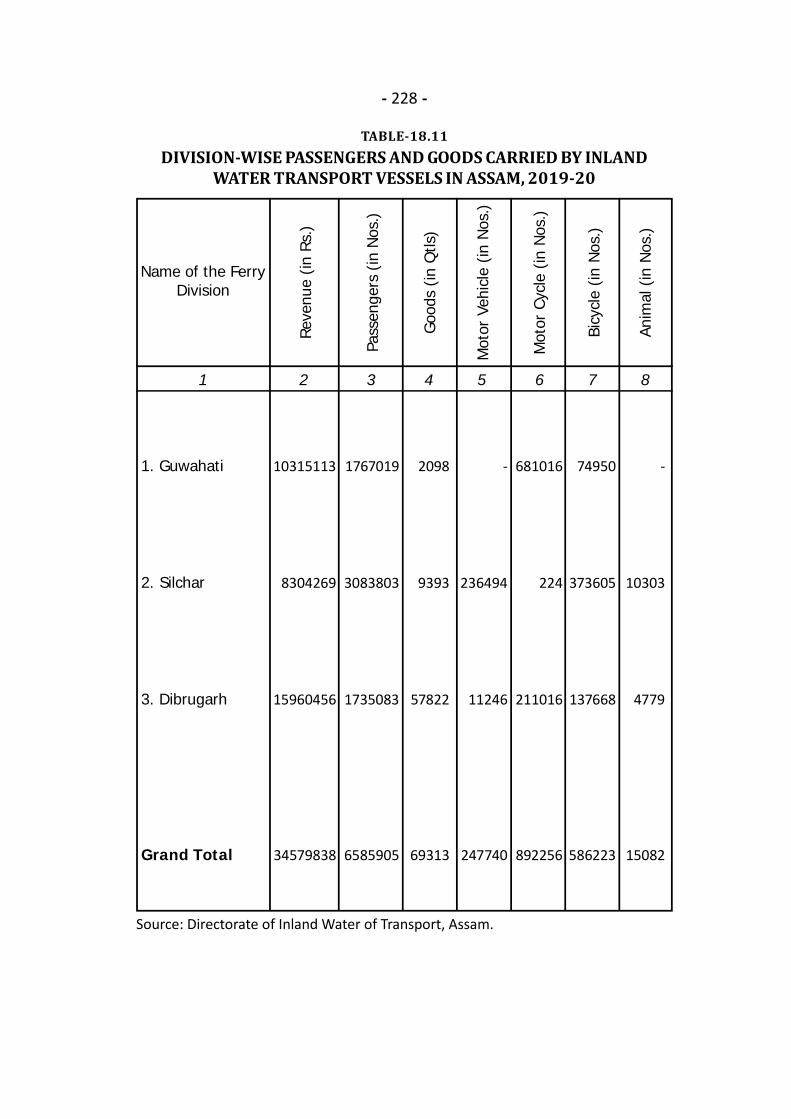
- 228 -
TABLE-18.11DIVISION-WISE PASSENGERS AND GOODS CARRIED BY INLAND
WATER TRANSPORT VESSELS IN ASSAM, 2019-20
Source: Directorate of Inland Water of Transport, Assam.
1 2 3 4 5 6 7 8
Reve
nue
(in R
s.)
Name of the FerryDivision
1. Guwahati
2. Silchar
3. Dibrugarh
Grand Total
10315113
8304269
15960456
34579838
Pass
enge
rs (
in N
os.)
Goo
ds (
in Q
tls)
Mot
or V
ehic
le (
in N
os.)
Mot
or C
ycle
(in
Nos
.)
Bicy
cle
(in N
os.)
Anim
al (
in N
os.)
1767019
3083803
1735083
6585905
2098
9393
57822
69313
-
236494
11246
247740
681016
224
211016
892256
74950
373605
137668
586223
-
10303
4779
15082
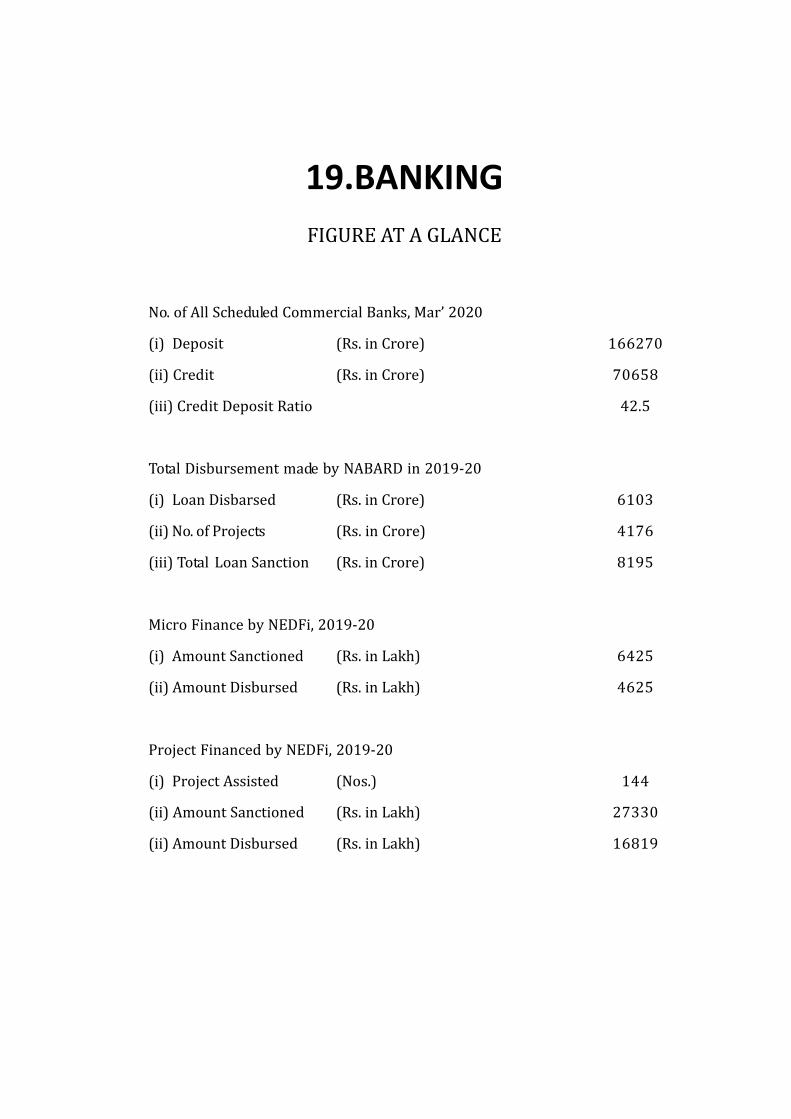
19.BANKINGFIGURE AT A GLANCENo. of All Scheduled Commercial Banks, Mar’ 2020(i) Deposit (Rs. in Crore)(ii) Credit (Rs. in Crore)(iii) Credit Deposit RatioTotal Disbursement made by NABARD in 2019-20(i) Loan Disbarsed (Rs. in Crore)(ii) No. of Projects (Rs. in Crore)(iii) Total Loan Sanction (Rs. in Crore)Micro Finance by NEDFi, 2019-20(i) Amount Sanctioned (Rs. in Lakh)(ii) Amount Disbursed (Rs. in Lakh)Project Financed by NEDFi, 2019-20(i) Project Assisted (Nos.)(ii) Amount Sanctioned (Rs. in Lakh)(ii) Amount Disbursed (Rs. in Lakh)
1662707065842.5610341768195642546251442733016819

- 230 -TABLE-19.01
DISTRICT-WISE DISTRIBUTION OF AGGREGATE DEPOSIT & GROSSBANK CREDIT IN ASSAM, AS ON MARCH’2020 (Rs. in Crore)
1 2 3 4 5 6 7 8 9
KokrajharDhubriGoalparaBarpetaMorigaonNagaonSonitpurLakhimpurDhemajiTinsukiaDibrugarhSivasagarJorhatGolaghatKarbi AnglongDima HasaoCacharKarimganjHailakandiBongaigaonChirangKamrupKamrup MetroNalbariBaksaDarrangUdalguriBiswanathCharaideoHojaiMajuliSouth SalmaraW K AnglongAssam
District
Scheduled Commercial Banks
No.
of
Repo
rtin
gO
ffice
s
All Regional Rural Banks
447566
11466
160127
8642
145183
94133114
6126
16486415928
150422
77516640443147111422
2889
2702272321884107190155505218259814446988
1138149157066347117861029871037661687299814554580
655672525111520291220137710622246
232347286
166270
8651452101025331192355828621901
86631374301231935442196
904261
33741185
5891440
5823256
206911483
5511259
876793393853100131199
70658
32.053.346.261.762.764.154.873.260.044.937.847.250.263.350.625.438.731.534.948.040.071.131.658.749.462.171.857.637.038.043.137.869.642.5
1112121912362520
9141713152632102317
997
191617131512
810
3NANA16
477
304314313561219776500352322265266362331500441176641373275288174525915436254329209188246
65NANA
13211050
95107120229119240189175
8785
119110118155288
72118
70527669
230211200138161125
518211
NANA
1084009
31.334.138.340.854.330.937.849.727.032.144.730.435.631.065.340.918.418.818.926.439.743.823.145.954.348.959.827.133.316.9
NANA
81.836.3
Dep
osit
Cred
it
Cred
itD
epos
itRa
tio (
%)
No.
of
Repo
rtin
gO
ffice
s
Dep
osit
Cred
it
Cred
itD
epos
itRa
tio (
%)
Note: No data available for the districts of South Salmara & Majuli in 2020 for Regional Rural Banks.
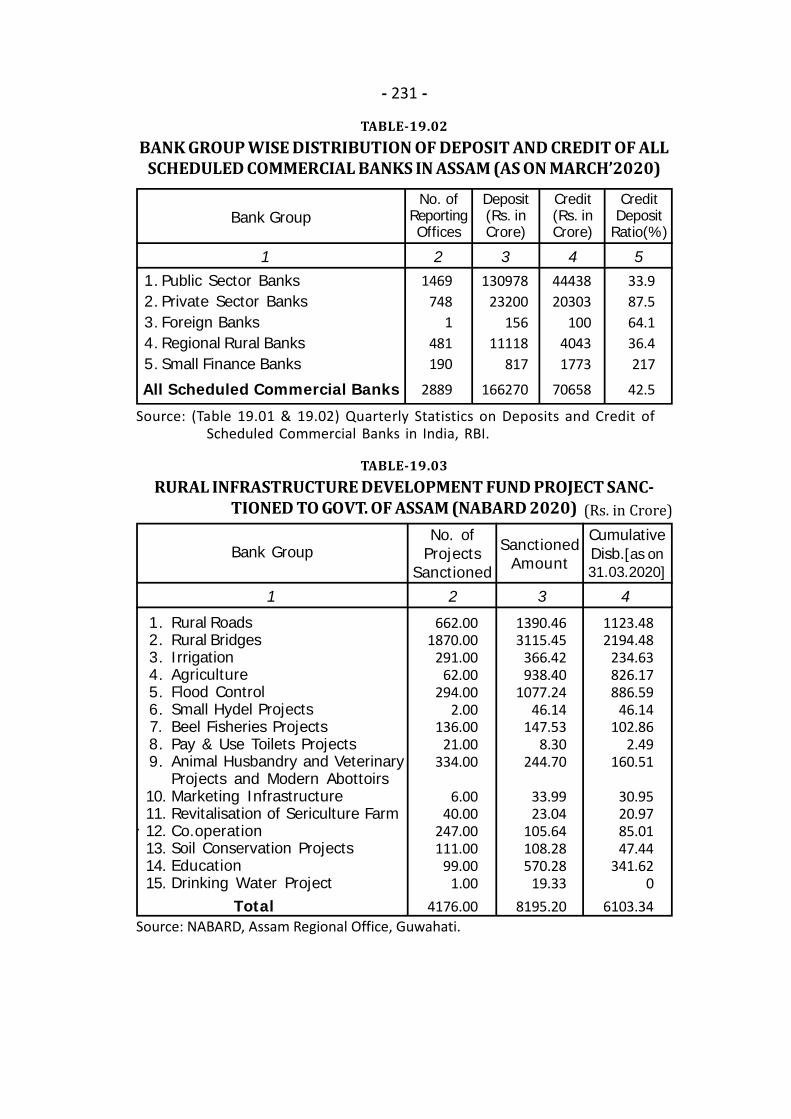
- 231 -
TABLE-19.02BANK GROUP WISE DISTRIBUTION OF DEPOSIT AND CREDIT OF ALL
SCHEDULED COMMERCIAL BANKS IN ASSAM (AS ON MARCH’2020)
1 2 3 4 5
No. ofReportingOffices
Deposit(Rs. inCrore)
Credit(Rs. inCrore)
CreditDeposit
Ratio(%)Bank Group
1.2.3.4.5.
Public Sector BanksPrivate Sector BanksForeign BanksRegional Rural BanksSmall Finance Banks
1469748
1481190
2889
13097823200
15611118
817
166270
4443820303
10040431773
70658
33.987.564.136.4217
42.5All Scheduled Commercial Banks
.
TABLE-19.03RURAL INFRASTRUCTURE DEVELOPMENT FUND PROJECT SANC-
TIONED TO GOVT. OF ASSAM (NABARD 2020)
1 2 3 4
No. ofProjects
Sanctioned
SanctionedAmount
CumulativeDisb.[as on31.03.2020]
Bank Group
1.2.3.4.5.6.7.8.9.
10.11.12.13.14.15.
Rural RoadsRural BridgesIrrigationAgricultureFlood ControlSmall Hydel ProjectsBeel Fisheries ProjectsPay & Use Toilets ProjectsAnimal Husbandry and VeterinaryProjects and Modern AbottoirsMarketing InfrastructureRevitalisation of Sericulture FarmCo.operationSoil Conservation ProjectsEducationDrinking Water Project
Total
662.001870.00
291.0062.00
294.002.00
136.0021.00
334.00
6.0040.00
247.00111.00
99.001.00
4176.00
1390.463115.45
366.42938.40
1077.2446.14
147.538.30
244.70
33.9923.04
105.64108.28570.28
19.338195.20
1123.482194.48
234.63826.17886.59
46.14102.86
2.49160.51
30.9520.9785.0147.44
341.620
6103.34
(Rs. in Crore)Source: (Table 19.01 & 19.02) Quarterly Statistics on Deposits and Credit of Scheduled Commercial Banks in India, RBI.
Source: NABARD, Assam Regional Office, Guwahati.
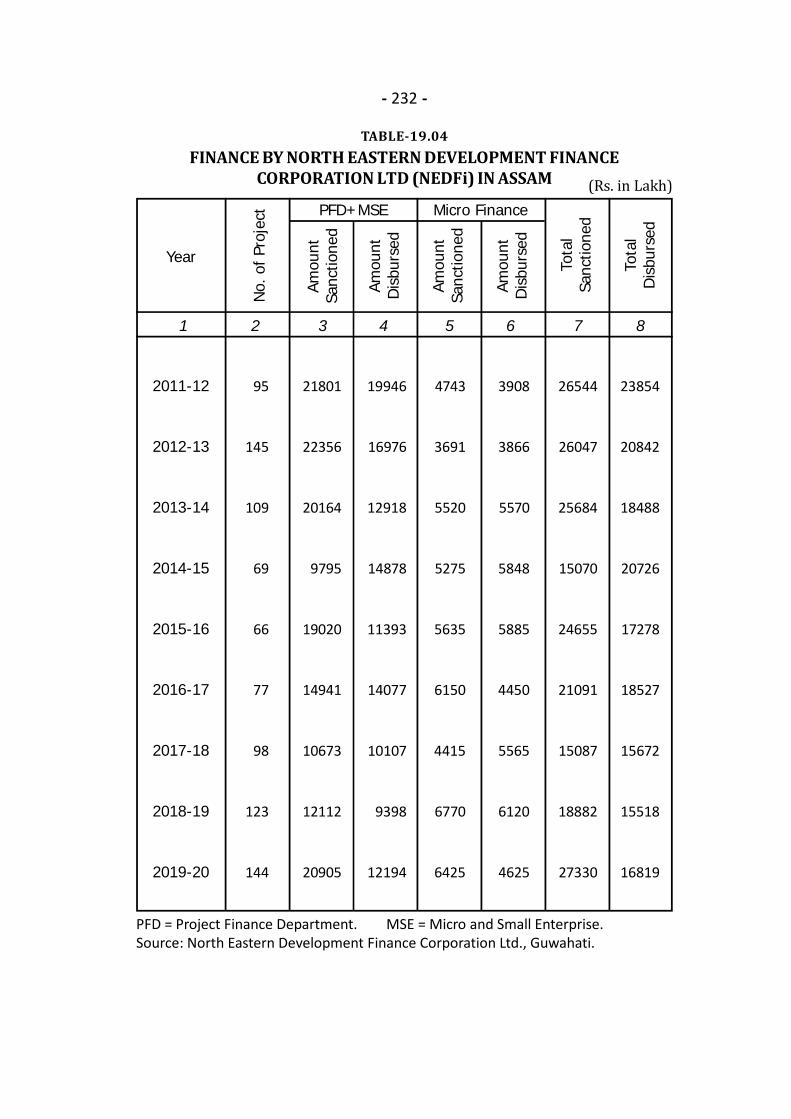
- 232 -
TABLE-19.04FINANCE BY NORTH EASTERN DEVELOPMENT FINANCE
CORPORATION LTD (NEDFi) IN ASSAM (Rs. in Lakh)
PFD = Project Finance Department. MSE = Micro and Small Enterprise.Source: North Eastern Development Finance Corporation Ltd., Guwahati.
1 2 3 4 5 6 7 8
Year
Amou
ntSa
nctio
ned
Amou
ntD
isbu
rsed
Amou
ntSa
nctio
ned
Amou
ntD
isbu
rsed
No.
of P
roje
ct
2011-12
2012-13
2013-14
2014-15
2015-16
2016-17
2017-18
2018-19
2019-20
95
145
109
69
66
77
98
123
144
21801
22356
20164
9795
19020
14941
10673
12112
20905
19946
16976
12918
14878
11393
14077
10107
9398
12194
4743
3691
5520
5275
5635
6150
4415
6770
6425
3908
3866
5570
5848
5885
4450
5565
6120
4625
PFD+MSE Micro Finance
Tota
lSa
nctio
ned
Tota
lD
isbu
rsed
26544
26047
25684
15070
24655
21091
15087
18882
27330
23854
20842
18488
20726
17278
18527
15672
15518
16819
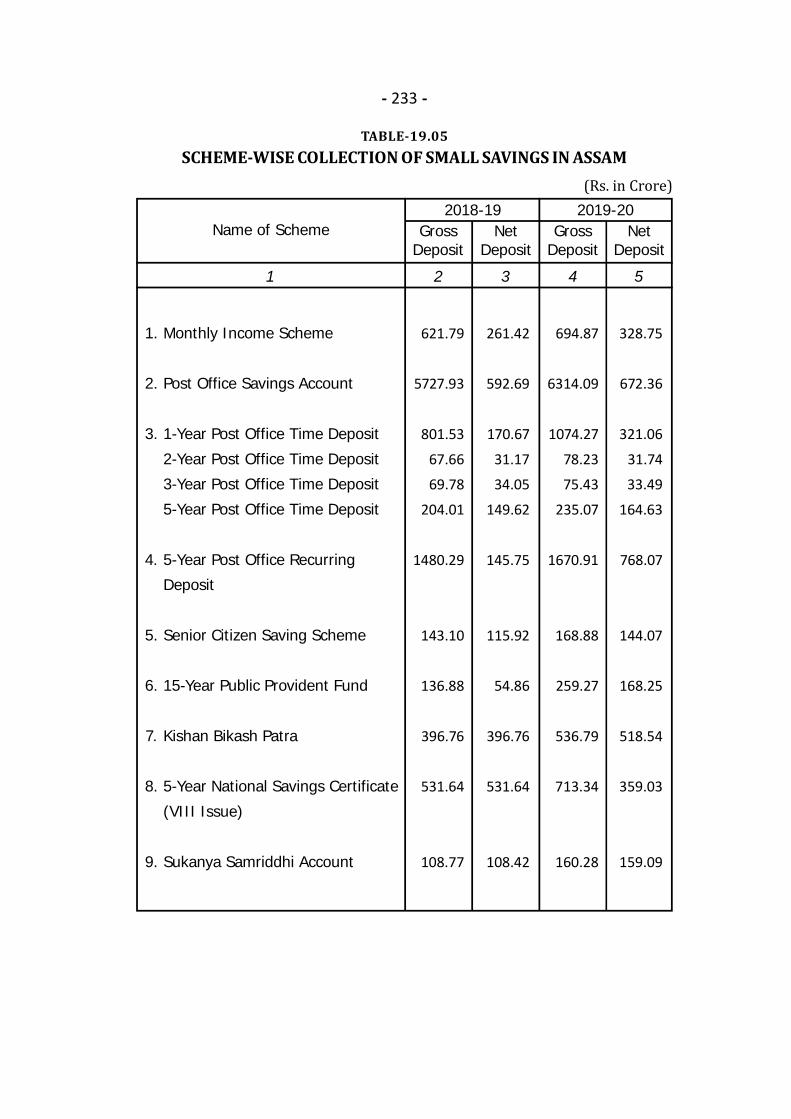
- 233 -
TABLE-19.05SCHEME-WISE COLLECTION OF SMALL SAVINGS IN ASSAM(Rs. in Crore)
1 2 3 4 5
GrossDeposit
NetDeposit
GrossDeposit
NetDeposit
2019-20Name of Scheme
2018-19
Monthly Income Scheme
Post Office Savings Account
1-Year Post Office Time Deposit
2-Year Post Office Time Deposit
3-Year Post Office Time Deposit
5-Year Post Office Time Deposit
5-Year Post Office Recurring
Deposit
Senior Citizen Saving Scheme
15-Year Public Provident Fund
Kishan Bikash Patra
5-Year National Savings Certificate
(VIII Issue)
Sukanya Samriddhi Account
1.
2.
3.
4.
5.
6.
7.
8.
9.
621.79
5727.93
801.53
67.66
69.78
204.01
1480.29
143.10
136.88
396.76
531.64
108.77
261.42
592.69
170.67
31.17
34.05
149.62
145.75
115.92
54.86
396.76
531.64
108.42
694.87
6314.09
1074.27
78.23
75.43
235.07
1670.91
168.88
259.27
536.79
713.34
160.28
328.75
672.36
321.06
31.74
33.49
164.63
768.07
144.07
168.25
518.54
359.03
159.09
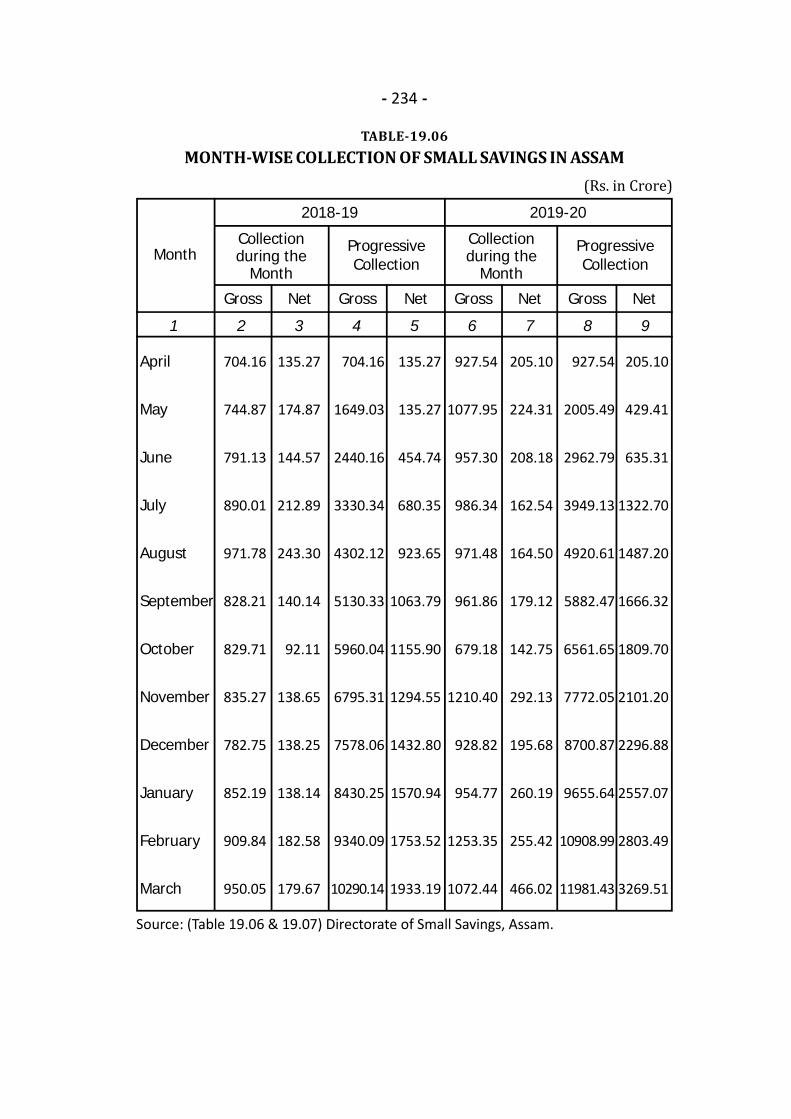
- 234 -
TABLE-19.06MONTH-WISE COLLECTION OF SMALL SAVINGS IN ASSAM(Rs. in Crore)
Source: (Table 19.06 & 19.07) Directorate of Small Savings, Assam.
1 2 3 4 5 6 7 8 9
Net Net Gross Net GrossGross
Month
Gross Net
April
May
June
July
August
September
October
November
December
January
February
March
704.16
744.87
791.13
890.01
971.78
828.21
829.71
835.27
782.75
852.19
909.84
950.05
135.27
174.87
144.57
212.89
243.30
140.14
92.11
138.65
138.25
138.14
182.58
179.67
704.16
1649.03
2440.16
3330.34
4302.12
5130.33
5960.04
6795.31
7578.06
8430.25
9340.09
10290.14
135.27
135.27
454.74
680.35
923.65
1063.79
1155.90
1294.55
1432.80
1570.94
1753.52
1933.19
927.54
1077.95
957.30
986.34
971.48
961.86
679.18
1210.40
928.82
954.77
1253.35
1072.44
205.10
224.31
208.18
162.54
164.50
179.12
142.75
292.13
195.68
260.19
255.42
466.02
927.54
2005.49
2962.79
3949.13
4920.61
5882.47
6561.65
7772.05
8700.87
9655.64
10908.99
11981.43
205.10
429.41
635.31
1322.70
1487.20
1666.32
1809.70
2101.20
2296.88
2557.07
2803.49
3269.51
Collectionduring the
Month
ProgressiveCollection
ProgressiveCollection
Collectionduring the
Month
2019-202018-19
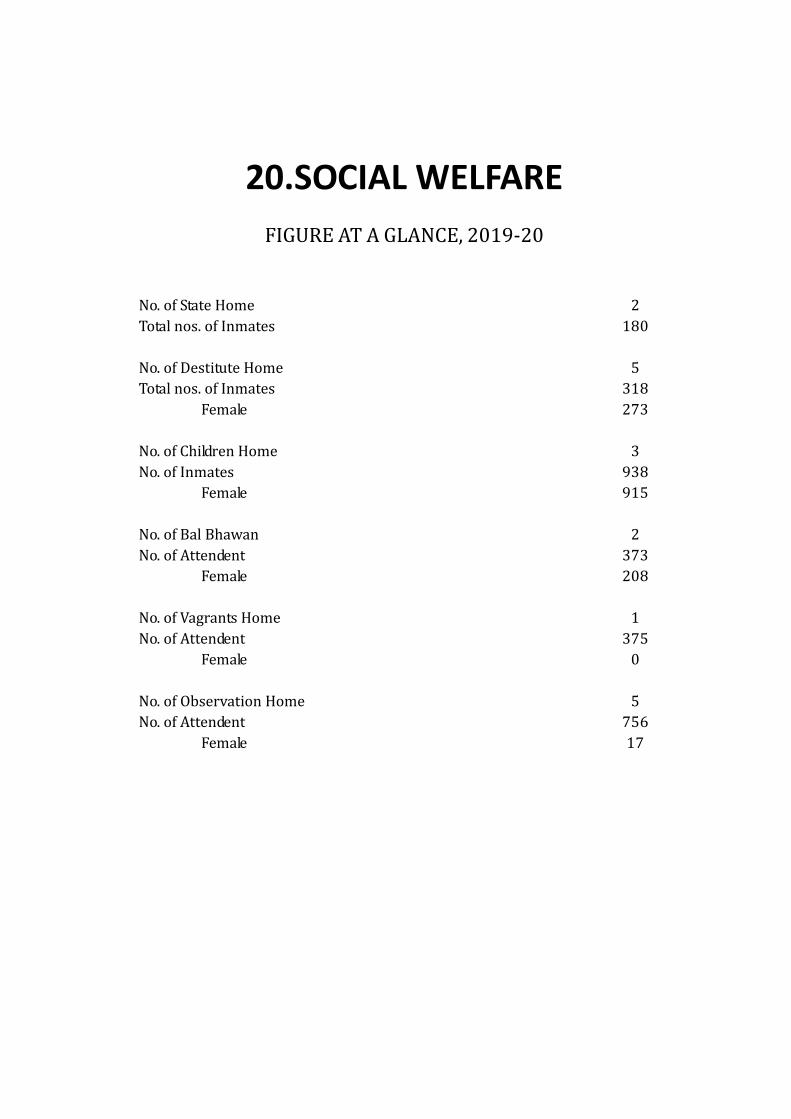
20.SOCIAL WELFAREFIGURE AT A GLANCE, 2019-20No. of State HomeTotal nos. of InmatesNo. of Destitute HomeTotal nos. of InmatesFemaleNo. of Children HomeNo. of InmatesFemaleNo. of Bal BhawanNo. of AttendentFemaleNo. of Vagrants HomeNo. of AttendentFemaleNo. of Observation HomeNo. of AttendentFemale
218053182733938915237320813750575617
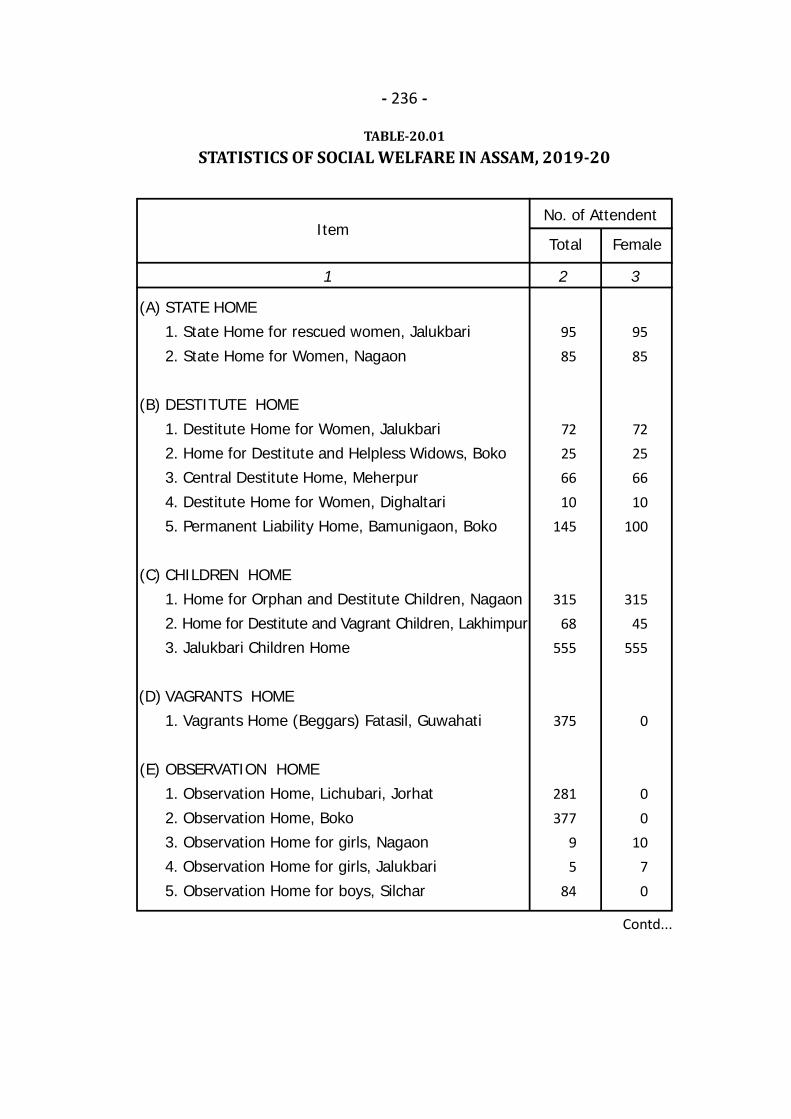
- 236 -
TABLE-20.01STATISTICS OF SOCIAL WELFARE IN ASSAM, 2019-20
Contd...
1 2 3
No. of Attendent
Total FemaleItem
(A)
(B)
(C)
(D)
(E)
STATE HOME1. State Home for rescued women, Jalukbari
2. State Home for Women, Nagaon
DESTITUTE HOME1. Destitute Home for Women, Jalukbari2. Home for Destitute and Helpless Widows, Boko3. Central Destitute Home, Meherpur4. Destitute Home for Women, Dighaltari5. Permanent Liability Home, Bamunigaon, Boko
CHILDREN HOME1. Home for Orphan and Destitute Children, Nagaon2. Home for Destitute and Vagrant Children, Lakhimpur3. Jalukbari Children Home
VAGRANTS HOME1. Vagrants Home (Beggars) Fatasil, Guwahati
OBSERVATION HOME1. Observation Home, Lichubari, Jorhat2. Observation Home, Boko3. Observation Home for girls, Nagaon4. Observation Home for girls, Jalukbari
5. Observation Home for boys, Silchar
9585
72256610
145
31568
555
375
281377
95
84
9585
72256610
100
31545
555
0
00
1070
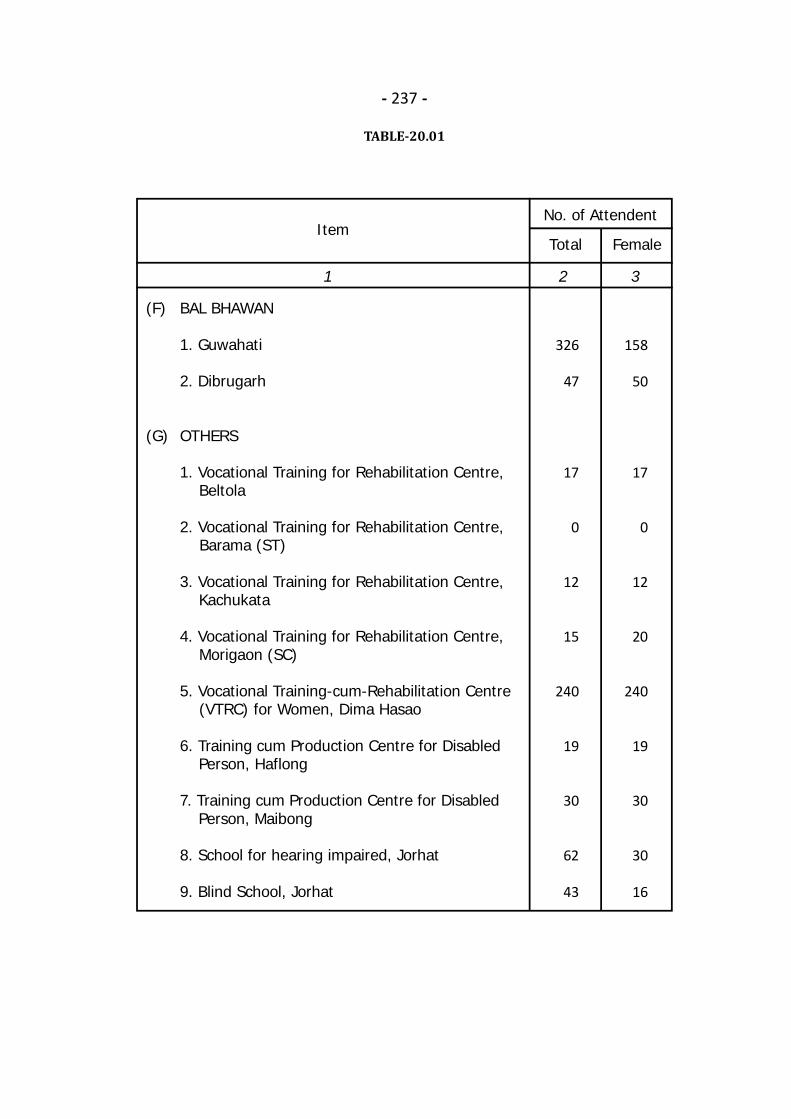
- 237 -
TABLE-20.01
1 2 3
No. of Attendent
Total FemaleItem
(F)
(G)
BAL BHAWAN
1. Guwahati
2. Dibrugarh
OTHERS
1. Vocational Training for Rehabilitation Centre, Beltola
2. Vocational Training for Rehabilitation Centre, Barama (ST)
3. Vocational Training for Rehabilitation Centre, Kachukata
4. Vocational Training for Rehabilitation Centre, Morigaon (SC)
5. Vocational Training-cum-Rehabilitation Centre (VTRC) for Women, Dima Hasao
6. Training cum Production Centre for Disabled Person, Haflong
7. Training cum Production Centre for Disabled Person, Maibong
8. School for hearing impaired, Jorhat
9. Blind School, Jorhat
326
47
17
0
12
15
240
19
30
62
43
158
50
17
0
12
20
240
19
30
30
16
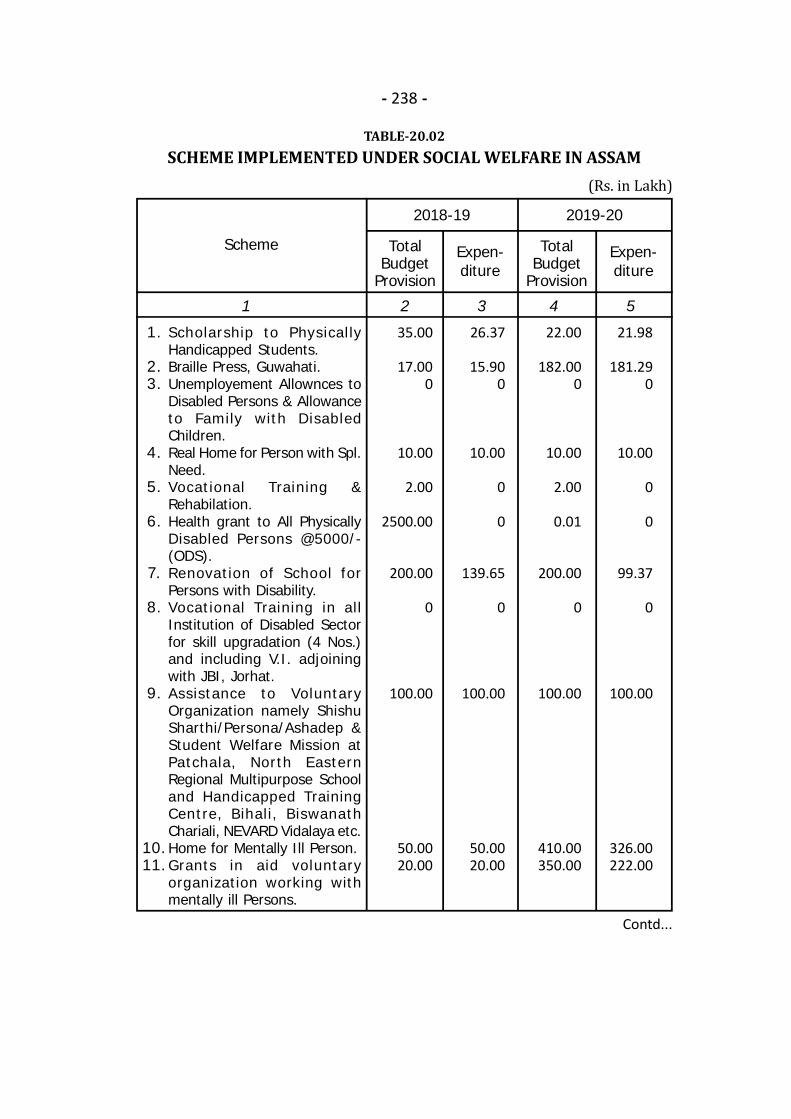
- 238 -
TABLE-20.02SCHEME IMPLEMENTED UNDER SOCIAL WELFARE IN ASSAM(Rs. in Lakh)
Contd...
1 2 3 4 5
TotalBudget
Provision
Expen-diture
TotalBudget
Provision
Expen-diture
Scheme
1.
2.3.
4.
5.
6.
7.
8.
9.
10.11.
Scholarship to PhysicallyHandicapped Students.Braille Press, Guwahati.Unemployement Allownces toDisabled Persons & Allowanceto Family with DisabledChildren.Real Home for Person with Spl.Need.Vocational Training &Rehabilation.Health grant to All PhysicallyDisabled Persons @5000/-(ODS).Renovation of School forPersons with Disability.Vocational Training in allInstitution of Disabled Sectorfor skill upgradation (4 Nos.)and including V.I. adjoiningwith JBI, Jorhat.Assistance to VoluntaryOrganization namely ShishuSharthi/Persona/Ashadep &Student Welfare Mission atPatchala, North EasternRegional Multipurpose Schooland Handicapped TrainingCentre, Bihali, BiswanathChariali, NEVARD Vidalaya etc.Home for Mentally Ill Person.Grants in aid voluntaryorganization working withmentally ill Persons.
35.00
17.000
10.00
2.00
2500.00
200.00
0
100.00
50.0020.00
26.37
15.900
10.00
0
0
139.65
0
100.00
50.0020.00
22.00
182.000
10.00
2.00
0.01
200.00
0
100.00
410.00350.00
21.98
181.290
10.00
0
0
99.37
0
100.00
326.00222.00
2018-19 2019-20

- 239 -
TABLE-20.02
(Rs. in Lakh)
Contd...
1 2 3 4 5
TotalBudget
Provision
Expen-diture
TotalBudget
Provision
Expen-diture
Scheme
12.
13.
14.15.
16.
17.18.
19.
20.
21.
22.
23.
24.
25.
26.27.
Scholarship to differentlyabled students persuingMedical, Technical Educationetc.Govt. BDS Deaf and DumbSchool, Guwahati.Esstt. of Blind School, Jorhat.Sheltered Workshop of Blind,Nagaon.School for Hearing Impaired,Jorhat.Impl. of Disabilities Act, 1995.Setting up of Special Schoolfor the Hearing and VisuallyImpaired.Commissioner for Personswith Disabalities, Assam.National Programme forRehabilitation of Persons withDisability (NPRPD).Assam Andha Sishu Vidyalaya,Bihpuria.Socity for Welfare of Blind,(Blind School Guwahati).Janamagla Adarsha AndhaVidyalay, Maranhat.Mental Welfare Society,Guwahati.Sremanta Sankar Mission,Nagaon.Lado Rani Yojana.Bal Bhawan, Guwahati &Dibrugarh.
100.00
80.00
8.004.84
30.00
200.0035.00
20.00
88.04
5.00
15.00
5.00
5.00
5.00
031.00
9.96
79.93
5.690
29.40
36.2935.00
20.00
87.98
5.00
14.99
0
5.00
5.00
06.68
100.00
104.00
8.50-
31.32
200.0035.00
0
124.75
30.00
85.00
5.00
5.00
5.00
5.0031.00
15.48
103.80
0.93-
8.07
158.4635.00
0
88.39
30.00
84.99
0
0
0
010.27
2018-19 2019-20
* NERMP = North Eastern Regional Multipurpose School and Handicapped Training Centre, at Bihali.
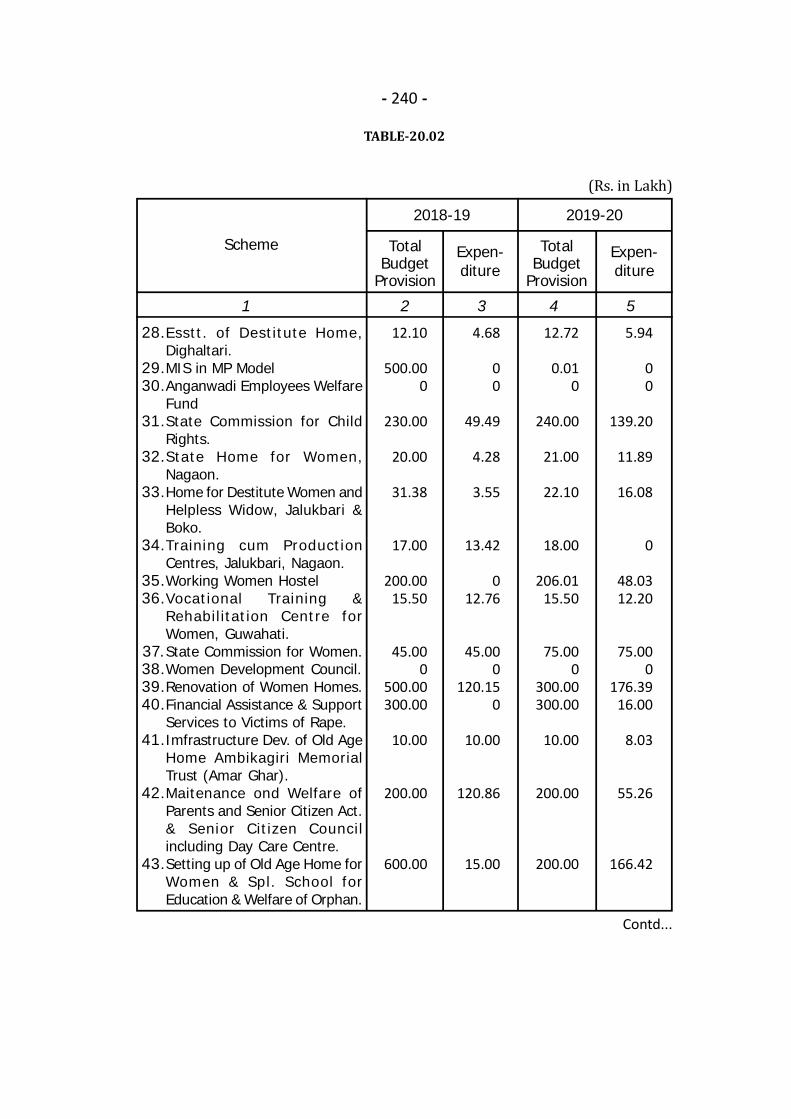
- 240 -
TABLE-20.02
(Rs. in Lakh)
Contd...
1 2 3 4 5
TotalBudget
Provision
Expen-diture
TotalBudget
Provision
Expen-diture
Scheme
28.
29.30.
31.
32.
33.
34.
35.36.
37.38.39.40.
41.
42.
43.
Esstt. of Destitute Home,Dighaltari.MIS in MP ModelAnganwadi Employees WelfareFundState Commission for ChildRights.State Home for Women,Nagaon.Home for Destitute Women andHelpless Widow, Jalukbari &Boko.Training cum ProductionCentres, Jalukbari, Nagaon.Working Women HostelVocational Training &Rehabil itation Centre forWomen, Guwahati.State Commission for Women.Women Development Council.Renovation of Women Homes.Financial Assistance & SupportServices to Victims of Rape.Imfrastructure Dev. of Old AgeHome Ambikagiri MemorialTrust (Amar Ghar).Maitenance ond Welfare ofParents and Senior Citizen Act.& Senior Citizen Councilincluding Day Care Centre.Setting up of Old Age Home forWomen & Spl. School forEducation & Welfare of Orphan.
12.10
500.000
230.00
20.00
31.38
17.00
200.0015.50
45.000
500.00300.00
10.00
200.00
600.00
4.68
00
49.49
4.28
3.55
13.42
012.76
45.000
120.150
10.00
120.86
15.00
12.72
0.010
240.00
21.00
22.10
18.00
206.0115.50
75.000
300.00300.00
10.00
200.00
200.00
5.94
00
139.20
11.89
16.08
0
48.0312.20
75.000
176.3916.00
8.03
55.26
166.42
2018-19 2019-20
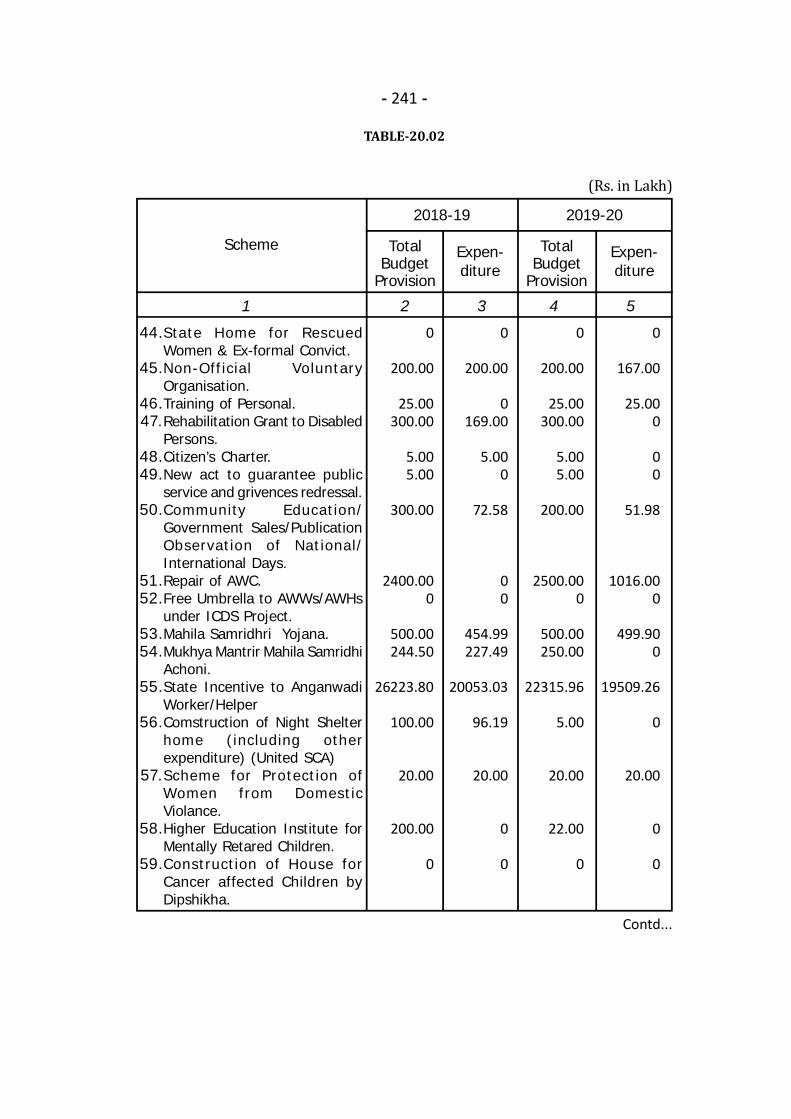
- 241 -
TABLE-20.02
(Rs. in Lakh)
1 2 3 4 5
TotalBudget
Provision
Expen-diture
TotalBudget
Provision
Expen-diture
Scheme
44.
45.
46.47.
48.49.
50.
51.52.
53.54.
55.
56.
57.
58.
59.
State Home for RescuedWomen & Ex-formal Convict.Non-Official VoluntaryOrganisation.Training of Personal.Rehabilitation Grant to DisabledPersons.Citizen’s Charter.New act to guarantee publicservice and grivences redressal.Community Education/Government Sales/PublicationObservation of National/International Days.Repair of AWC.Free Umbrella to AWWs/AWHsunder ICDS Project.Mahila Samridhri Yojana.Mukhya Mantrir Mahila SamridhiAchoni.State Incentive to AnganwadiWorker/HelperComstruction of Night Shelterhome (including otherexpenditure) (United SCA)Scheme for Protection ofWomen from DomesticViolance.Higher Education Institute forMentally Retared Children.Construction of House forCancer affected Children byDipshikha.
0
200.00
25.00300.00
5.005.00
300.00
2400.000
500.00244.50
26223.80
100.00
20.00
200.00
0
0
200.00
0169.00
5.000
72.58
00
454.99227.49
20053.03
96.19
20.00
0
0
0
200.00
25.00300.00
5.005.00
200.00
2500.000
500.00250.00
22315.96
5.00
20.00
22.00
0
0
167.00
25.000
00
51.98
1016.000
499.900
19509.26
0
20.00
0
0
2018-19 2019-20
Contd...
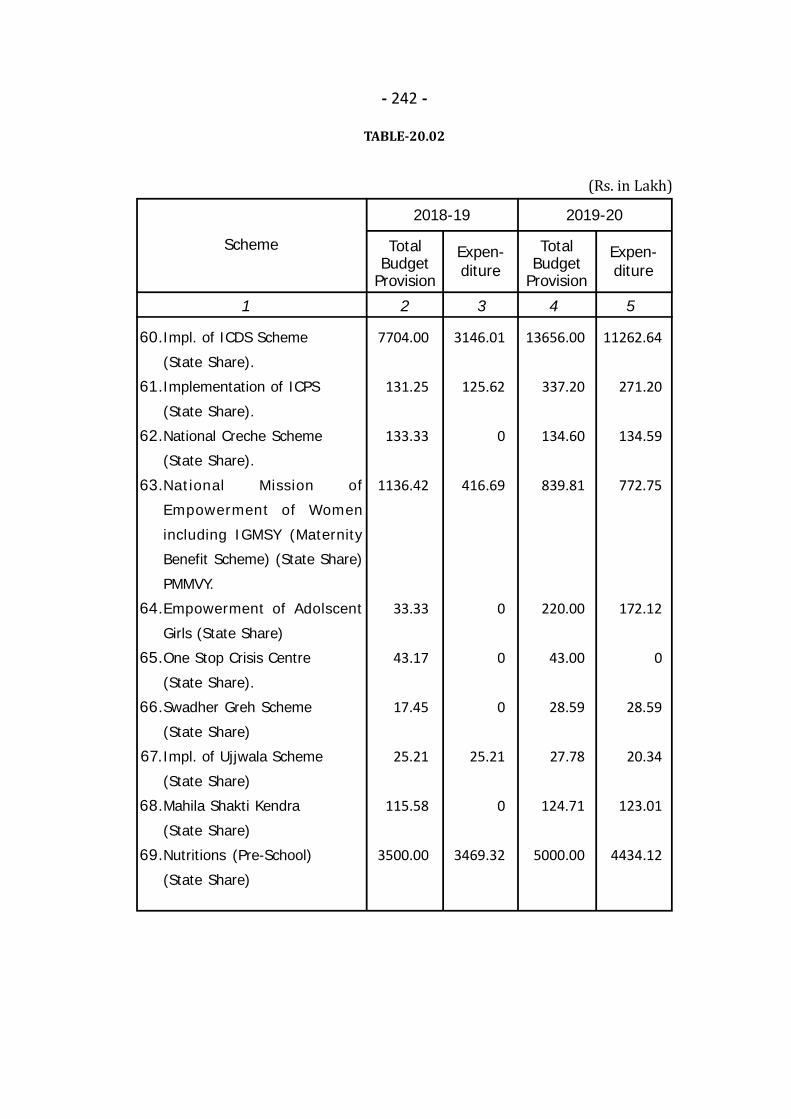
- 242 -
TABLE-20.02
(Rs. in Lakh)
1 2 3 4 5
TotalBudget
Provision
Expen-diture
TotalBudget
Provision
Expen-diture
Scheme
60.
61.
62.
63.
64.
65.
66.
67.
68.
69.
Impl. of ICDS Scheme
(State Share).
Implementation of ICPS
(State Share).
National Creche Scheme
(State Share).
National Mission of
Empowerment of Women
including IGMSY (Maternity
Benefit Scheme) (State Share)
PMMVY.
Empowerment of Adolscent
Girls (State Share)
One Stop Crisis Centre
(State Share).
Swadher Greh Scheme
(State Share)
Impl. of Ujjwala Scheme
(State Share)
Mahila Shakti Kendra
(State Share)
Nutritions (Pre-School)
(State Share)
7704.00
131.25
133.33
1136.42
33.33
43.17
17.45
25.21
115.58
3500.00
3146.01
125.62
0
416.69
0
0
0
25.21
0
3469.32
13656.00
337.20
134.60
839.81
220.00
43.00
28.59
27.78
124.71
5000.00
11262.64
271.20
134.59
772.75
172.12
0
28.59
20.34
123.01
4434.12
2018-19 2019-20
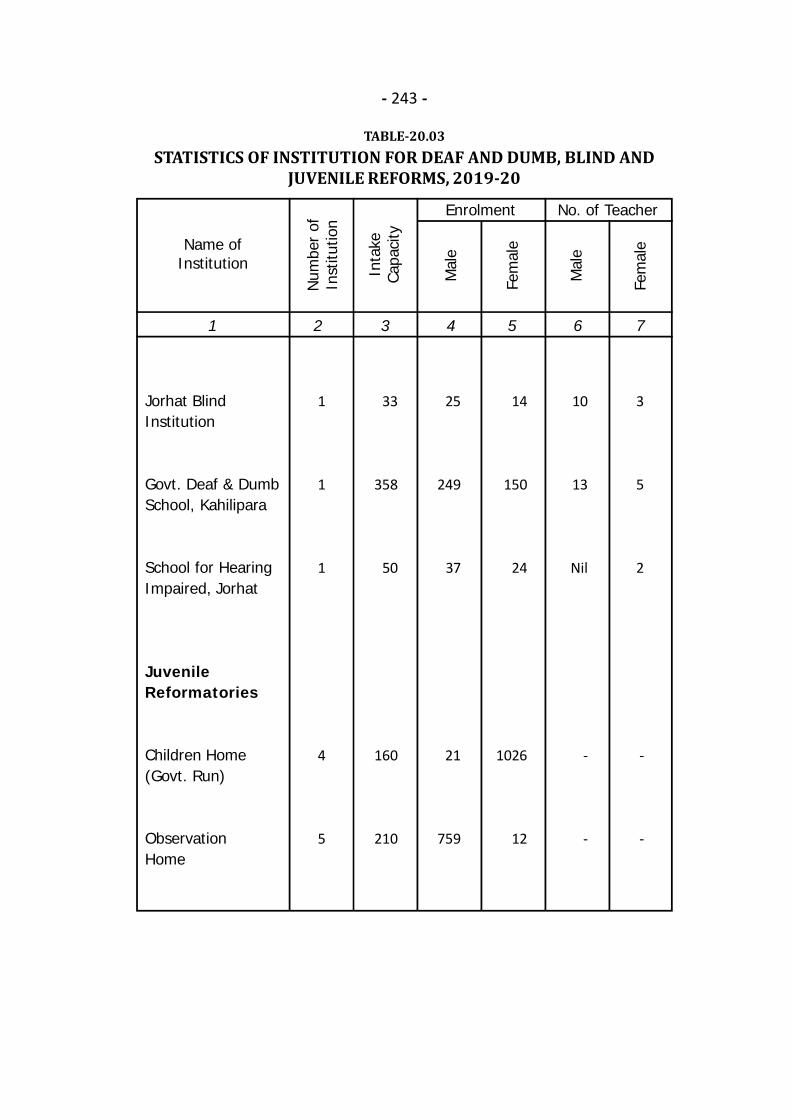
- 243 -
TABLE-20.03STATISTICS OF INSTITUTION FOR DEAF AND DUMB, BLIND AND
JUVENILE REFORMS, 2019-20
1 2 3 4 5 6 7
Name ofInstitution
Num
ber
ofIn
stitu
tion
Inta
keCa
paci
ty
Mal
e
Fem
ale
Jorhat BlindInstitution
Govt. Deaf & DumbSchool, Kahilipara
School for HearingImpaired, Jorhat
JuvenileReformatories
Children Home(Govt. Run)
ObservationHome
1
1
1
4
5
33
358
50
160
210
25
249
37
21
759
14
150
24
1026
12
Enrolment
Mal
e
Fem
ale
10
13
Nil
-
-
3
5
2
-
-
No. of Teacher
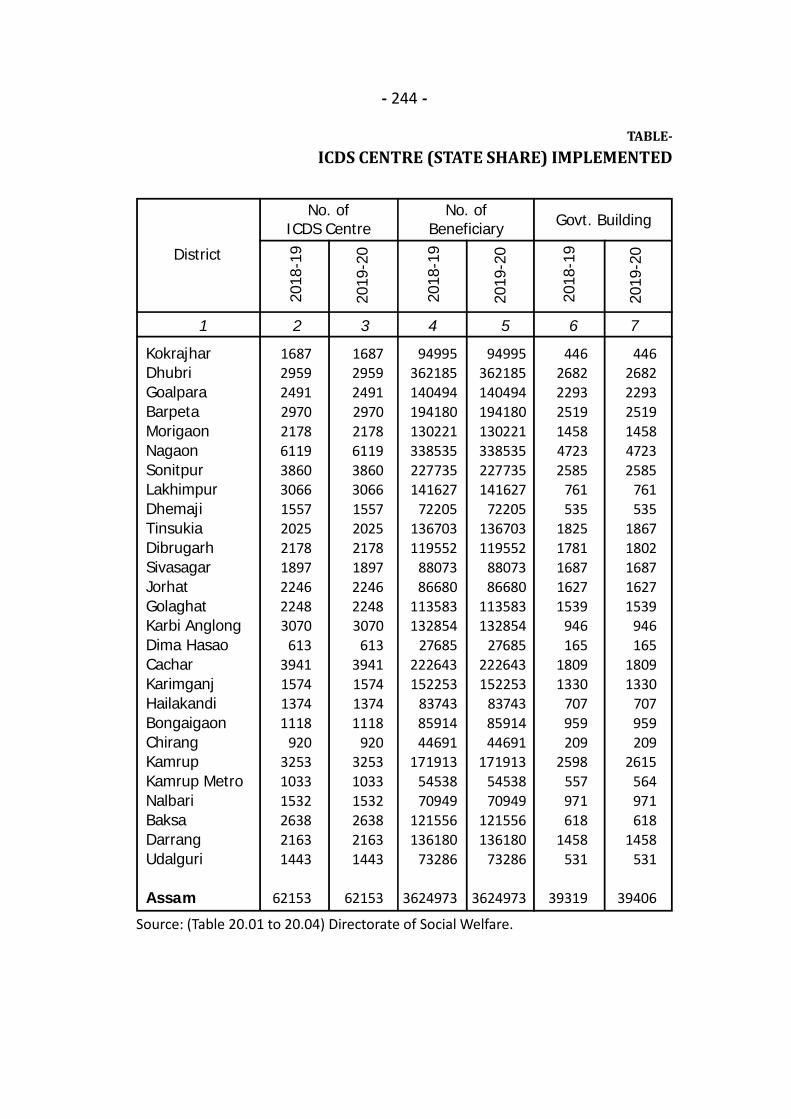
- 244 -
TABLE-ICDS CENTRE (STATE SHARE) IMPLEMENTED
1 2 3 4 5 6 7
KokrajharDhubriGoalparaBarpetaMorigaonNagaonSonitpurLakhimpurDhemajiTinsukiaDibrugarhSivasagarJorhatGolaghatKarbi AnglongDima HasaoCacharKarimganjHailakandiBongaigaonChirangKamrupKamrup MetroNalbariBaksaDarrangUdalguri
Assam
District
2018
-19
2019
-20
168729592491297021786119386030661557202521781897224622483070
6133941157413741118
920325310331532263821631443
62153
168729592491297021786119386030661557202521781897224622483070
6133941157413741118
920325310331532263821631443
62153
94995362185140494194180130221338535227735141627
72205136703119552
8807386680
113583132854
27685222643152253
837438591444691
1719135453870949
121556136180
73286
3624973
94995362185140494194180130221338535227735141627
72205136703119552
8807386680
113583132854
27685222643152253
837438591444691
1719135453870949
121556136180
73286
3624973
446268222932519145847232585
761535
18251781168716271539
946165
18091330
707959209
2598557971618
1458531
39319
446268222932519145847232585
761535
18671802168716271539
946165
18091330
707959209
2615564971618
1458531
39406
No. ofICDS Centre
No. ofBeneficiary Govt. Building
2018
-19
2019
-20
2018
-19
2019
-20
Source: (Table 20.01 to 20.04) Directorate of Social Welfare.

- 245 -
20.04UNDER SOCIAL WELFARE IN ASSAM
8 9 10 11 12 13 14 15 16 17
AmountSanctioned
32013
135436410776967
1628397
74238102182109859
41694
142402134
95383249326527483544
11629
32013
135436410776967
1628397
74238102182109859
41694
142402134
95383249326527483544
11629
113145147148113345223160
7992
105115120102170
72254
92735854
22659
121164132
72
3554
113145147148113345223160
7992
105115120102170
72254
92735854
22659
121164132
72
3554
168529212483284821285904375330581553201721161880223622273070
6133941150613721095
920319010251501263821471396
61223
168529212483284821285904375330581553201721161880223622273070
6133941150613721095
920319010251501263821471396
61223
Rental House No. of Staff No. of WorkerAmountReleased
2018
-19
2019
-20
2018
-19
2019
-20
2018
-19
2019
-20
2018
-19
2019
-20
2018
-19
2019
-20
2622
3.08
(As S
tate
ince
ntiv
e fo
r Ang
anw
adi W
orke
r/He
lper
)
2231
5.96
(As S
tate
ince
ntiv
e fo
r Ang
anw
adi W
orke
r/He
lper
)
2005
3.03
(As S
tate
ince
ntiv
e fo
r Ang
anw
adi W
orke
r/He
lper
)
1950
9.26
(As S
tate
ince
ntiv
e fo
r Ang
anw
adi W
orke
r/He
lper
)

.
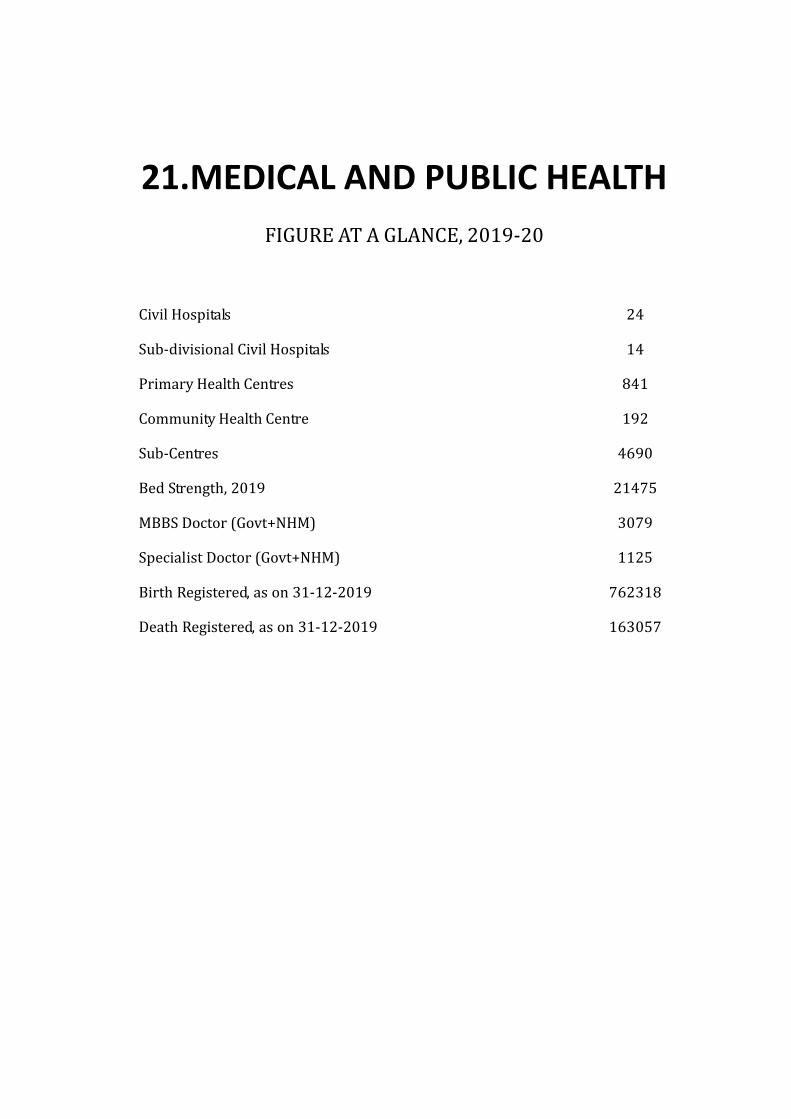
21.MEDICAL AND PUBLIC HEALTHFIGURE AT A GLANCE, 2019-20Civil HospitalsSub-divisional Civil HospitalsPrimary Health CentresCommunity Health CentreSub-CentresBed Strength, 2019MBBS Doctor (Govt+NHM)Specialist Doctor (Govt+NHM)Birth Registered, as on 31-12-2019Death Registered, as on 31-12-2019
241484119246902147530791125762318163057

- 248 -
TABLE-HEALTH SERVICE FACILITIES UNDER GOVT.
N.B.: S.D.C.H = Sub Divisional Civil Hospital; F.R.U. = First Referral Units;
1 2 3 4 5 6
KokrajharDhubriGoalparaBarpetaMorigaonNagaonSonitpurLakhimpurDhemajiTinsukiaDibrugarhSivasagarJorhatGolaghatKarbi AnglongDima HasaoCacharKarimganjHailakandiBongaigaonChirangKamrupKamrup MetroNalbariBaksaDarrangUdalguriBiswanathCharaideoHojaiMajuliSouth SalmaraWest Karbi AnglongAssam
DistrictCivil
Hospital S.D.C.H. F.R.U.Sub-
Centres
123456789
101112131415161718192021222324252627282930313233
111111111101010111111111111000000
24
110100210002211000000100000000010
14
000016000000100000000202000000000
12
162189155264122260199156
98166234173105144
8876
270230107108
87279
51122157159150
854792404966
4690
Sl.No.
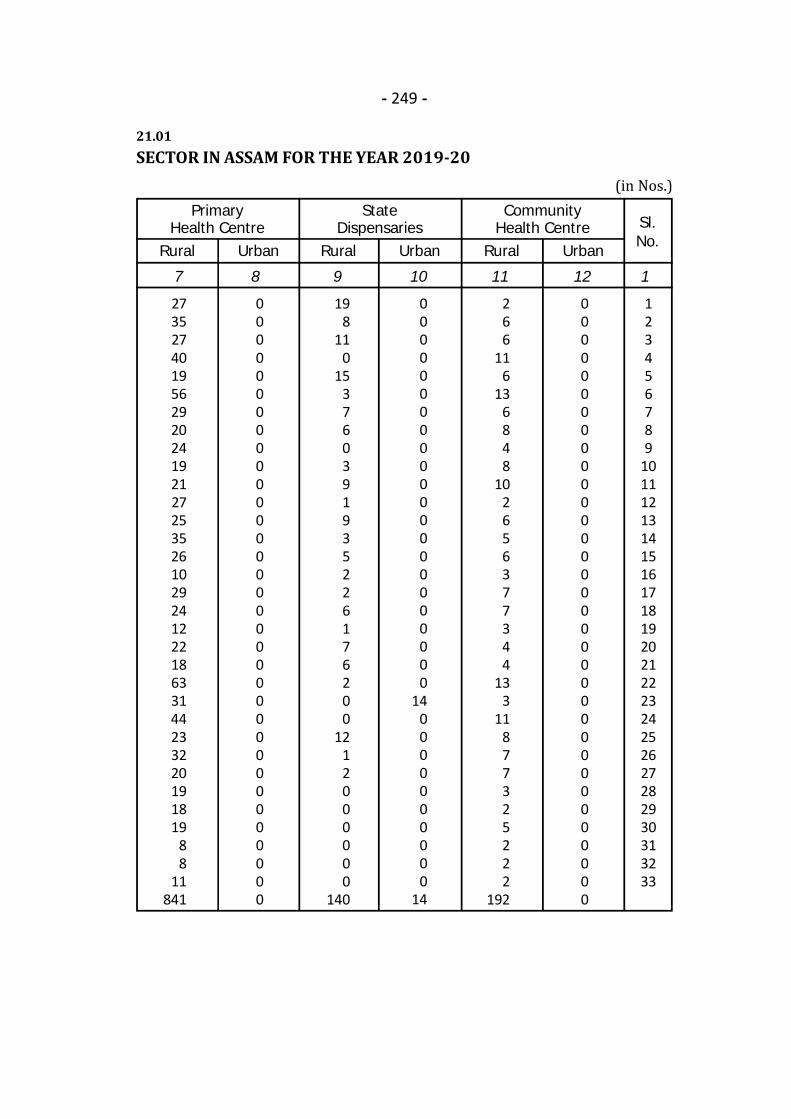
- 249 -
21.01SECTOR IN ASSAM FOR THE YEAR 2019-20
7 8 9 10 11 12 1
PrimaryHealth Centre
Rural
273527401956292024192127253526102924122218633144233220191819
88
11841
Sl.No.
StateDispensaries
CommunityHealth Centre
Urban Rural Urban Rural Urban
0000000000000000000000000000000000
198
110
153760391935226176200
1212000000
140
0000000000000000000000
140000000000
14
266
116
136848
102656377344
133
11877325222
192
0000000000000000000000000000000000
123456789
101112131415161718192021222324252627282930313233
(in Nos.)
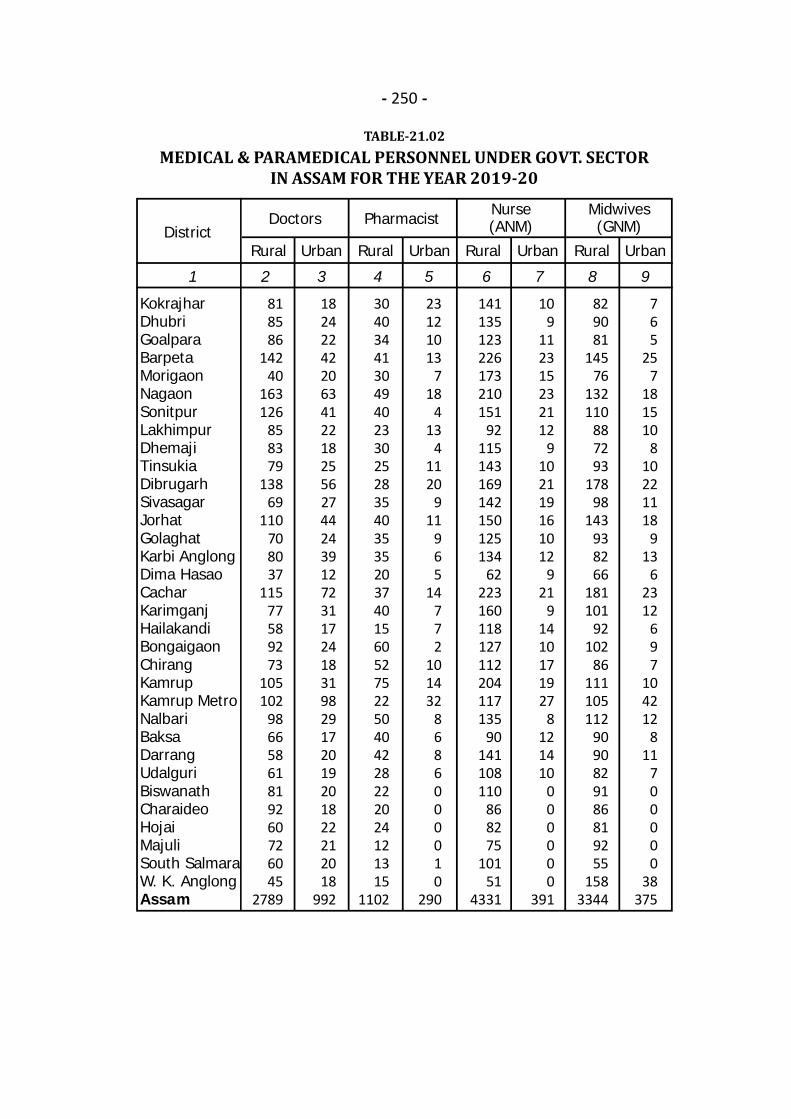
- 250 -
TABLE-21.02MEDICAL & PARAMEDICAL PERSONNEL UNDER GOVT. SECTOR
IN ASSAM FOR THE YEAR 2019-20
1 2 3 4 5 6 7 8 9
KokrajharDhubriGoalparaBarpetaMorigaonNagaonSonitpurLakhimpurDhemajiTinsukiaDibrugarhSivasagarJorhatGolaghatKarbi AnglongDima HasaoCacharKarimganjHailakandiBongaigaonChirangKamrupKamrup MetroNalbariBaksaDarrangUdalguriBiswanathCharaideoHojaiMajuliSouth SalmaraW. K. AnglongAssam
DistrictRural Urban Rural Urban Rural Urban
818586
14240
163126
858379
13869
110708037
11577589273
105102
98665861819260726045
2789
182422422063412218255627442439127231172418319829172019201822212018
992
304034413049402330252835403535203740156052752250404228222024121315
1102
23121013
718
413
41120
911
965
14772
101432
8686000010
290
141135123226173210151
92115143169142150125134
62223160118127112204117135
90141108110
868275
10151
4331
109
112315232112
9102119161012
921
91410171927
8121410
000000
391
829081
14576
132110
887293
17898
143938266
181101
92102
86111105112
9090829186819255
1583344
765
257
181510
810221118
913
62312
697
104212
811
700000
38375
Pharmacist Nurse(ANM)
Midwives(GNM)Doctors
Rural Urban
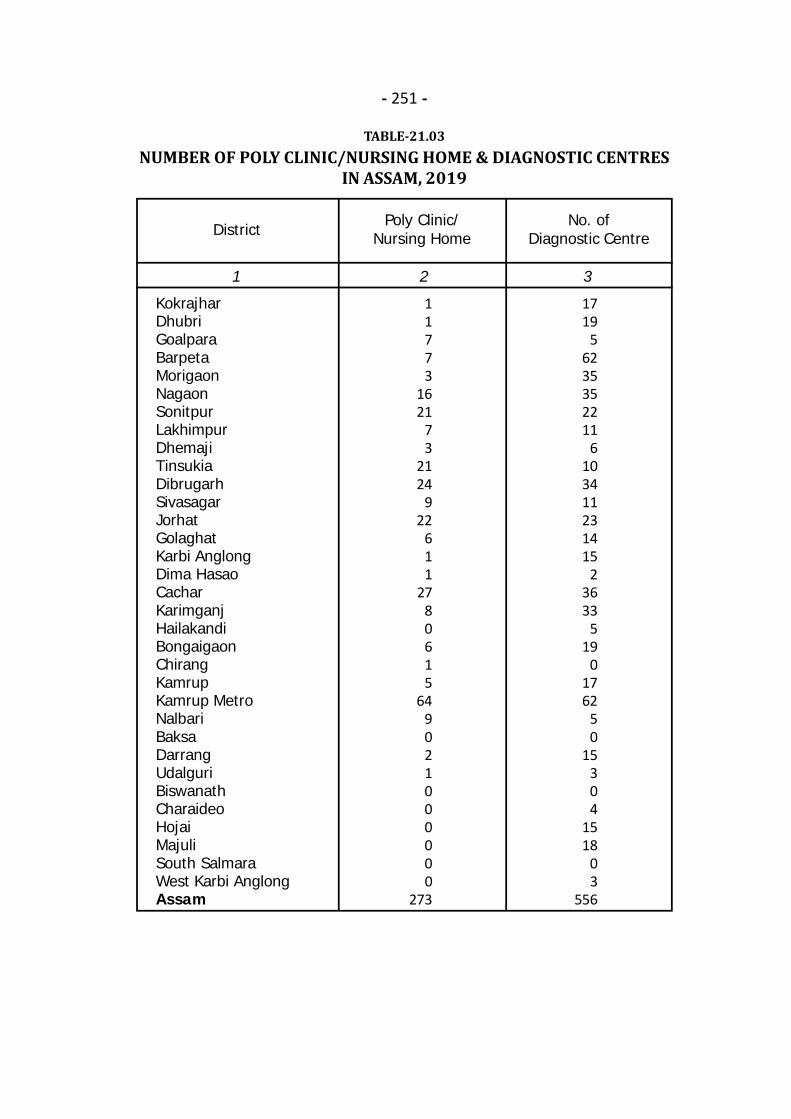
- 251 -
TABLE-21.03NUMBER OF POLY CLINIC/NURSING HOME & DIAGNOSTIC CENTRES
IN ASSAM, 2019
1 2 3
KokrajharDhubriGoalparaBarpetaMorigaonNagaonSonitpurLakhimpurDhemajiTinsukiaDibrugarhSivasagarJorhatGolaghatKarbi AnglongDima HasaoCacharKarimganjHailakandiBongaigaonChirangKamrupKamrup MetroNalbariBaksaDarrangUdalguriBiswanathCharaideoHojaiMajuliSouth SalmaraWest Karbi AnglongAssam
District Poly Clinic/Nursing Home
No. ofDiagnostic Centre
11773
1621
73
2124
922
611
2780615
649021000000
273
1719
56235352211
6103411231415
23633
519
01762
50
15304
1518
03
556
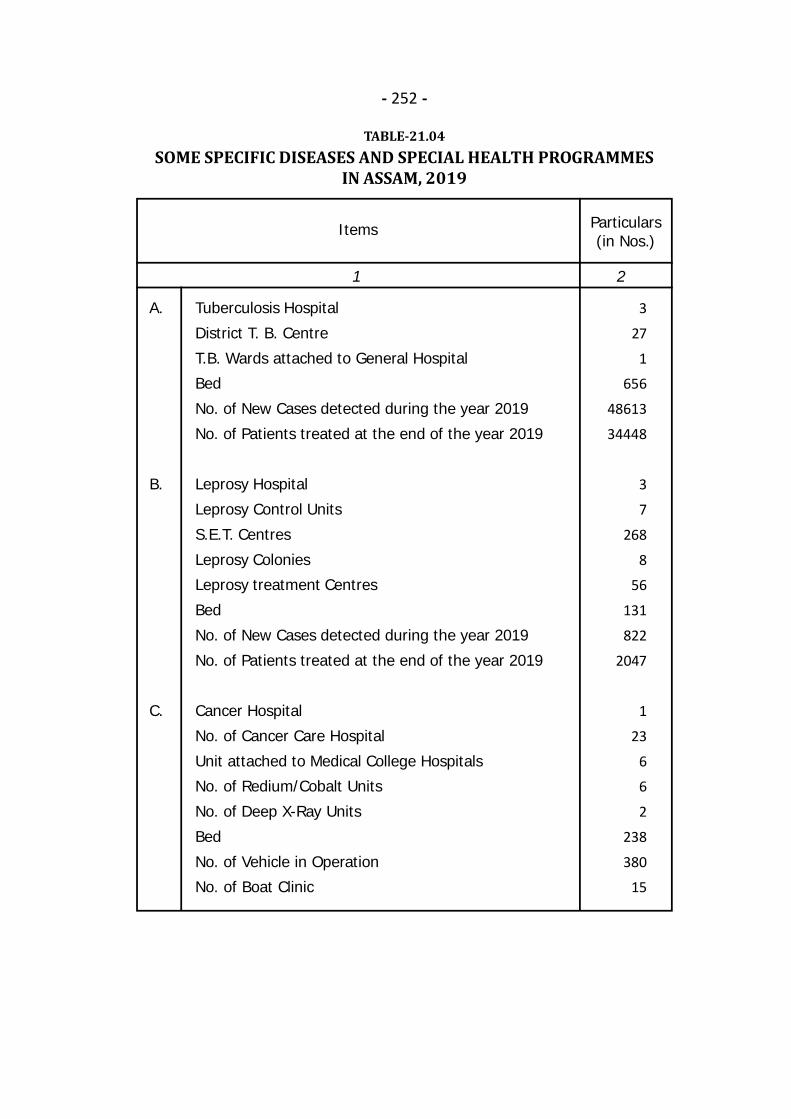
- 252 -
TABLE-21.04SOME SPECIFIC DISEASES AND SPECIAL HEALTH PROGRAMMES
IN ASSAM, 2019
1 2
Tuberculosis Hospital
District T. B. Centre
T.B. Wards attached to General Hospital
Bed
No. of New Cases detected during the year 2019
No. of Patients treated at the end of the year 2019
Leprosy Hospital
Leprosy Control Units
S.E.T. Centres
Leprosy Colonies
Leprosy treatment Centres
Bed
No. of New Cases detected during the year 2019
No. of Patients treated at the end of the year 2019
Cancer Hospital
No. of Cancer Care Hospital
Unit attached to Medical College Hospitals
No. of Redium/Cobalt Units
No. of Deep X-Ray Units
Bed
No. of Vehicle in Operation
No. of Boat Clinic
Items Particulars(in Nos.)
A.
B.
C.
3
27
1
656
48613
34448
3
7
268
8
56
131
822
2047
1
23
6
6
2
238
380
15

- 253 -
TABLE-21.05NUMBER OF BEDS IN DIFFERENT TYPE OF GOVT. HEALTH
INSTITUTIONS IN ASSAM, 2019
N.B.: CH=Civil Hospital; BPHC=Block Primary Health Centre; MPHC=Mini Primary Health Centre; CHC=Community Health Centre; SDCH = Sub Divisional Civil Hospital; MCH=Medical College Hospital.
1 2 3 4 5 6 7 8
KokrajharDhubriGoalparaBarpetaMorigaonNagaonSonitpurLakhimpurDhemajiTinsukiaDibrugarhSivasagarJorhatGolaghatKarbi AnglongDima HasaoCacharKarimganjHailakandiBongaigaonChirangKamrupKamrup MetroNalbariBaksaDarrangUdalguriBiswanathCharaideoHojaiMajuliSouth SalmaraWest K AnglongAssam
DistrictCH BPHC MPHC CHC SDCH Total
200238258156130360230220208254
0270
0330
0156
85198129151100
44116213
90308147
000000
4591
2436305418664836302436484230481848302436
078
642
042
0000060
900
164128144168132240152
6872
10496
116124140128
32100
963696
100232
96160164
9296243236242024
3436
60155150182150450180
30120210240
6081
1203060
120240
90120
904290
330169210150
3545
170483255
4314
100155
050
00
13630
00
100110
813030
000000
42000000000
1000
964
10000
50000
570000
15760
1840
2750
125100000
28140000000000
7270
No. of Beds
648712582
1110430
11161316
384430592
2048604512650511266
1604564279403290438
3122745423652393
5977
20672
15879
21475
MCH

- 254 -
TABLE-21.06NUMBER OF MEDICAL & PARAMEDICAL STAFFS IN GOVT. SECTOR
ASSAM, AS ON 31-03-2019
1 2 3 4
PostGovt. NHM Total
MBBS DoctorsSpecialist Doctor/ Post Graduate DoctorsBAMS/ Ayurvedic DoctorDental SurgeonHomeopathic DoctorsMBBS Doctors for 1 year rural postingANMGNMPharmacistsLabouratory TechnicianRadiographerRural Health Practitioner
2355828358
8775
0667332291392
871109
0
742297453192222402
55783166
697776
46562
30971125
811279297402
12251639520891647
155562
TABLE-21.07MEDICAL & PARAMEDICAL PERSONNEL REGISTERED IN ASSAM
1 2 3
Item Registered as on2019-20
Allopathic PractitionersMBBSPost Graduate (PG)PharmacistsGeneral Nurses Mid Wives (GNM)Auxiliary Nurses Mid Wives (ANM)B.Sc. Nurses
744324633422886620
Position
(in Nos.)
2576367199523
1747030564
4826
Registered as on31-03-2019
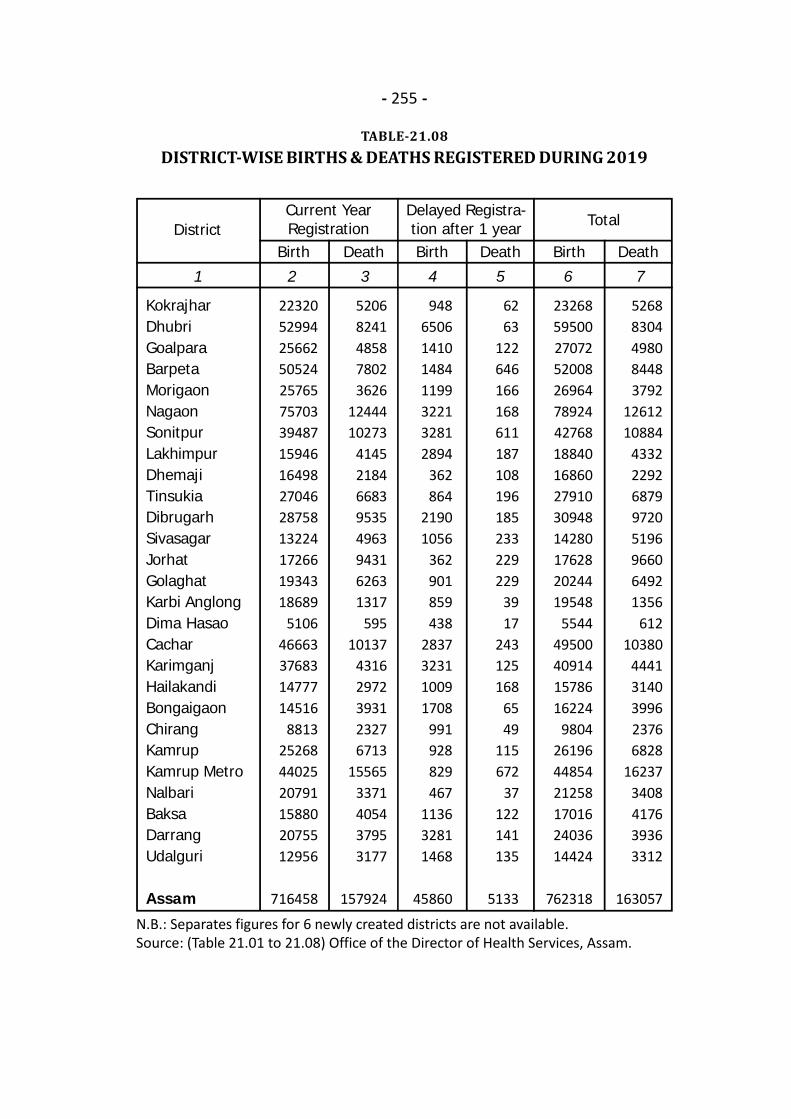
- 255 -
TABLE-21.08DISTRICT-WISE BIRTHS & DEATHS REGISTERED DURING 2019
1 2 3 4 5 6 7
KokrajharDhubriGoalparaBarpetaMorigaonNagaonSonitpurLakhimpurDhemajiTinsukiaDibrugarhSivasagarJorhatGolaghatKarbi AnglongDima HasaoCacharKarimganjHailakandiBongaigaonChirangKamrupKamrup MetroNalbariBaksaDarrangUdalguri
Assam
DistrictBirth Death Birth Death Birth Death
223205299425662505242576575703394871594616498270462875813224172661934318689
510646663376831477714516
8813252684402520791158802075512956
716458
52068241485878023626
1244410273
41452184668395354963943162631317
59510137
43162972393123276713
155653371405437953177
157924
9486506141014841199322132812894
362864
21901056
362901859438
2837323110091708
991928829467
113632811468
45860
6263
122646166168611187108196185233229229
3917
243125168
6549
115672
37122141135
5133
232685950027072520082696478924427681884016860279103094814280176282024419548
554449500409141578616224
9804261964485421258170162403614424
762318
52688304498084483792
1261210884
43322292687997205196966064921356
61210380
44413140399623766828
162373408417639363312
163057
Current YearRegistration
Delayed Registra-tion after 1 year Total
N.B.: Separates figures for 6 newly created districts are not available.Source: (Table 21.01 to 21.08) Office of the Director of Health Services, Assam.
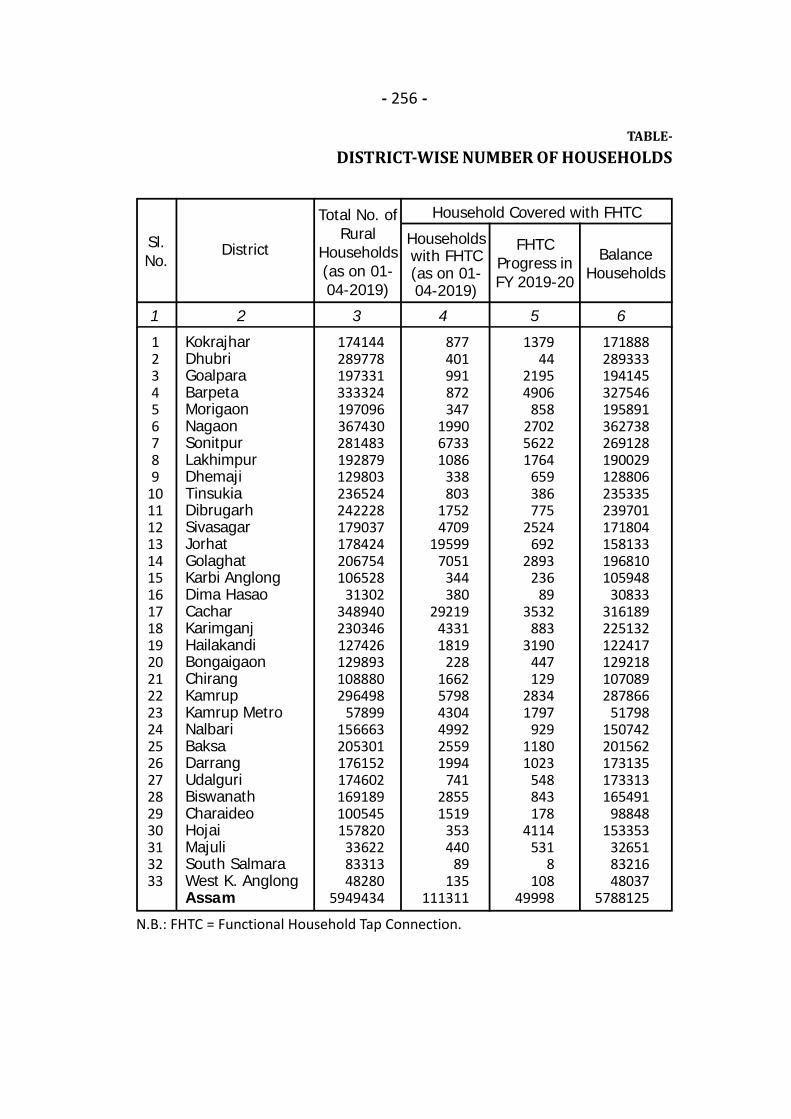
- 256 -
TABLE-DISTRICT-WISE NUMBER OF HOUSEHOLDS
N.B.: FHTC = Functional Household Tap Connection.
1 2 3 4 5 6
KokrajharDhubriGoalparaBarpetaMorigaonNagaonSonitpurLakhimpurDhemajiTinsukiaDibrugarhSivasagarJorhatGolaghatKarbi AnglongDima HasaoCacharKarimganjHailakandiBongaigaonChirangKamrupKamrup MetroNalbariBaksaDarrangUdalguriBiswanathCharaideoHojaiMajuliSouth SalmaraWest K. AnglongAssam
District
Total No. ofRural
Households(as on 01-04-2019)
Householdswith FHTC(as on 01-04-2019)
FHTCProgress inFY 2019-20
BalanceHouseholds
123456789
101112131415161718192021222324252627282930313233
174144289778197331333324197096367430281483192879129803236524242228179037178424206754106528
31302348940230346127426129893108880296498
57899156663205301176152174602169189100545157820
336228331348280
5949434
877401991872347
199067331086
338803
17524709
195997051
344380
2921943311819
228166257984304499225591994
74128551519
353440
89135
111311
137944
21954906
858270256221764
659386775
2524692
2893236
893532
8833190
447129
28341797
92911801023
548843178
4114531
8108
49998
171888289333194145327546195891362738269128190029128806235335239701171804158133196810105948
30833316189225132122417129218107089287866
51798150742201562173135173313165491
98848153353
326518321648037
5788125
Sl.No.
Household Covered with FHTC
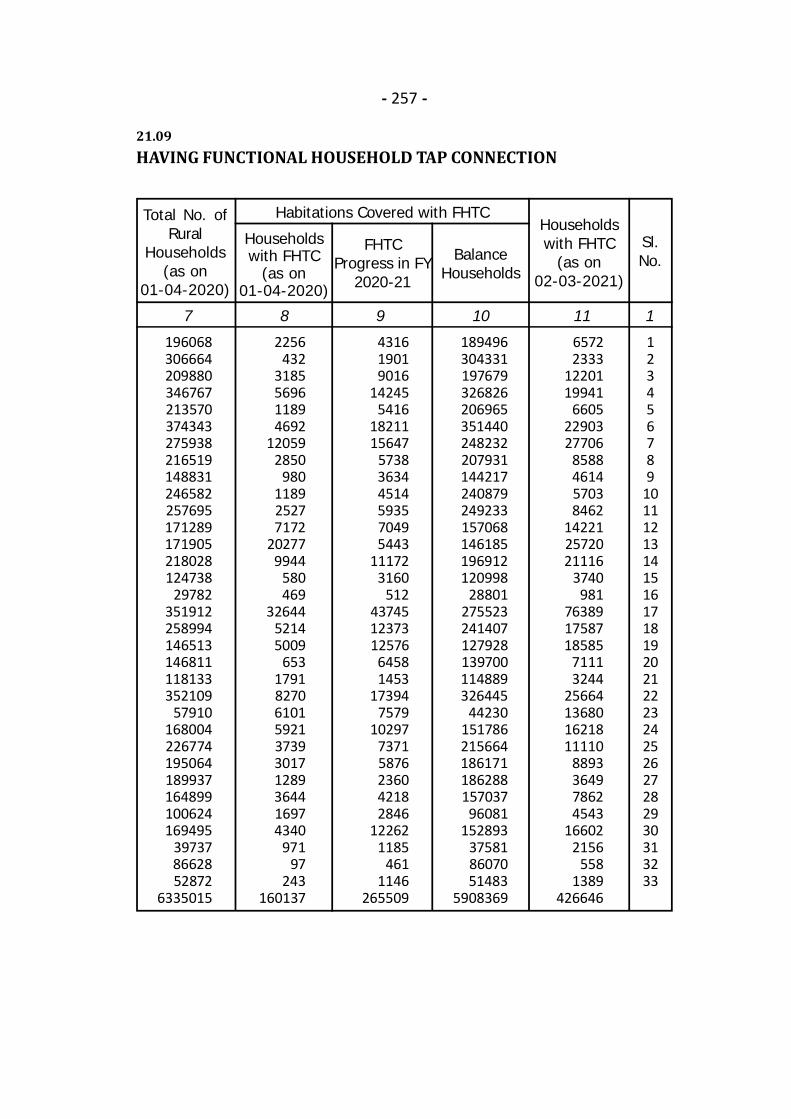
- 257 -
21.09HAVING FUNCTIONAL HOUSEHOLD TAP CONNECTION
7 8 9 10 11 1
Total No. ofRural
Households(as on
01-04-2020)
Householdswith FHTC
(as on01-04-2020)
FHTCProgress in FY
2020-21
BalanceHouseholds
123456789
101112131415161718192021222324252627282930313233
431619019016
142455416
1821115647
573836344514593570495443
111723160
51243745123731257664581453
173947579
1029773715876236042182846
122621185
4611146
265509
189496304331197679326826206965351440248232207931144217240879249233157068146185196912120998
28801275523241407127928139700114889326445
4423015178621566418617118628815703796081
152893375818607051483
5908369
65722333
1220119941
66052290327706
8588461457038462
142212572021116
3740981
763891758718585
71113244
25664136801621811110
8893364978624543
166022156
5581389
426646
Sl.No.
Habitations Covered with FHTCHouseholdswith FHTC
(as on02-03-2021)
2256432
3185569611894692
120592850
980118925277172
202779944
580469
3264452145009
6531791827061015921373930171289364416974340
97197
243160137
196068306664209880346767213570374343275938216519148831246582257695171289171905218028124738
29782351912258994146513146811118133352109
57910168004226774195064189937164899100624169495
397378662852872
6335015
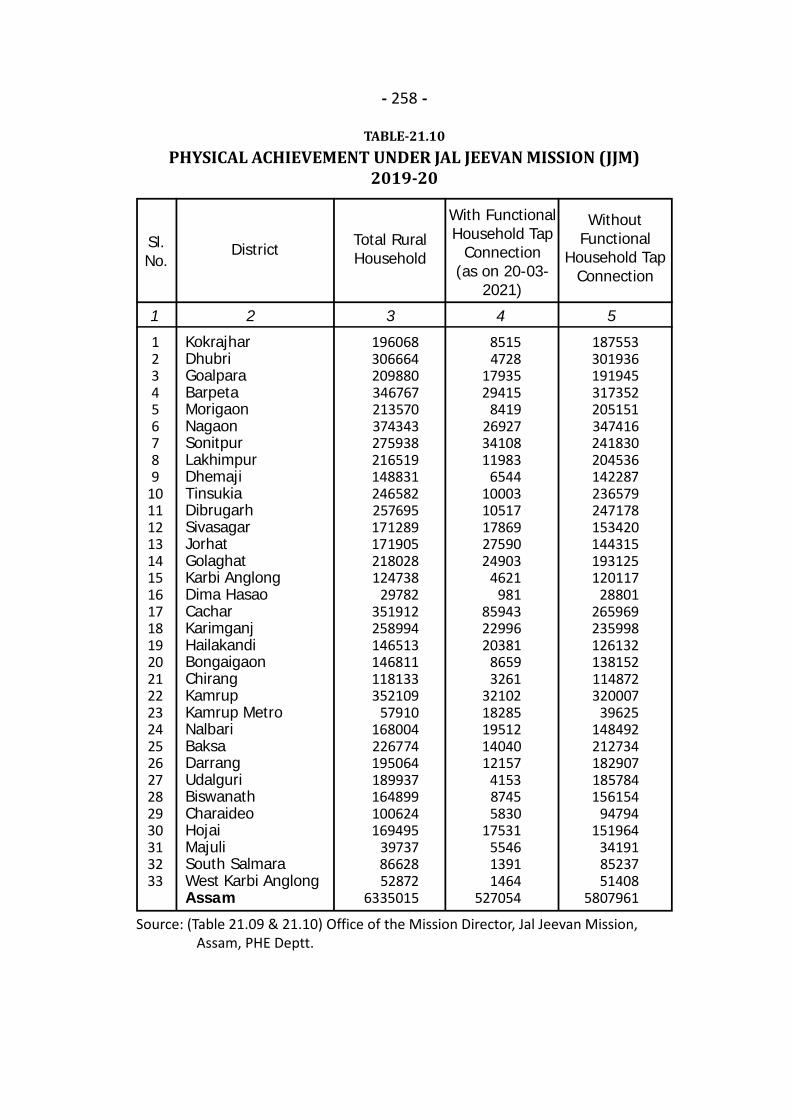
- 258 -
TABLE-21.10PHYSICAL ACHIEVEMENT UNDER JAL JEEVAN MISSION (JJM)
2019-20
Source: (Table 21.09 & 21.10) Office of the Mission Director, Jal Jeevan Mission, Assam, PHE Deptt.
1 2 3 4 5
KokrajharDhubriGoalparaBarpetaMorigaonNagaonSonitpurLakhimpurDhemajiTinsukiaDibrugarhSivasagarJorhatGolaghatKarbi AnglongDima HasaoCacharKarimganjHailakandiBongaigaonChirangKamrupKamrup MetroNalbariBaksaDarrangUdalguriBiswanathCharaideoHojaiMajuliSouth SalmaraWest Karbi AnglongAssam
DistrictTotal RuralHousehold
With FunctionalHousehold Tap
Connection(as on 20-03-
2021)
WithoutFunctional
Household TapConnection
123456789
101112131415161718192021222324252627282930313233
196068306664209880346767213570374343275938216519148831246582257695171289171905218028124738
29782351912258994146513146811118133352109
57910168004226774195064189937164899100624169495
397378662852872
6335015
85154728
1793529415
8419269273410811983
65441000310517178692759024903
4621981
859432299620381
86593261
3210218285195121404012157
415387455830
17531554613911464
527054
187553301936191945317352205151347416241830204536142287236579247178153420144315193125120117
28801265969235998126132138152114872320007
39625148492212734182907185784156154
94794151964
341918523751408
5807961
Sl.No.
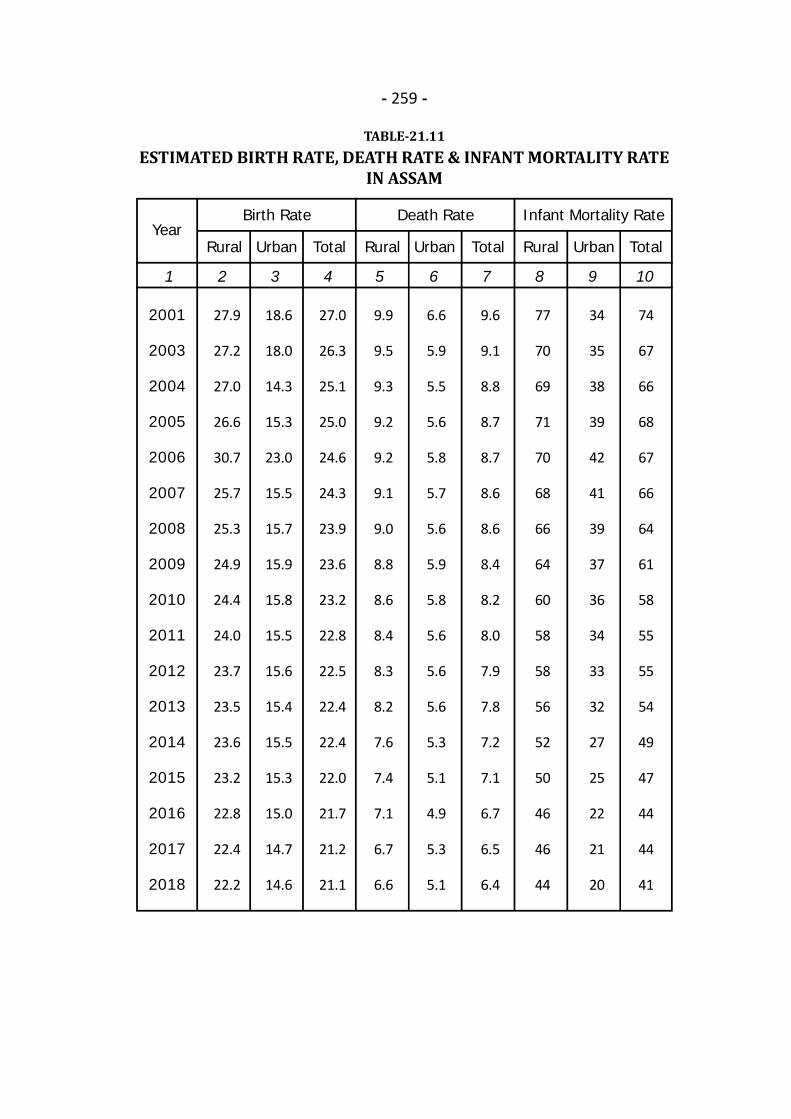
- 259 -
TABLE-21.11ESTIMATED BIRTH RATE, DEATH RATE & INFANT MORTALITY RATE
IN ASSAM
1 2 3 4 5 6 7 8 9 10
Urban Rural Urban Total RuralTotalYear
Rural
2001
2003
2004
2005
2006
2007
2008
2009
2010
2011
2012
2013
2014
2015
2016
2017
2018
27.9
27.2
27.0
26.6
30.7
25.7
25.3
24.9
24.4
24.0
23.7
23.5
23.6
23.2
22.8
22.4
22.2
18.6
18.0
14.3
15.3
23.0
15.5
15.7
15.9
15.8
15.5
15.6
15.4
15.5
15.3
15.0
14.7
14.6
27.0
26.3
25.1
25.0
24.6
24.3
23.9
23.6
23.2
22.8
22.5
22.4
22.4
22.0
21.7
21.2
21.1
9.9
9.5
9.3
9.2
9.2
9.1
9.0
8.8
8.6
8.4
8.3
8.2
7.6
7.4
7.1
6.7
6.6
6.6
5.9
5.5
5.6
5.8
5.7
5.6
5.9
5.8
5.6
5.6
5.6
5.3
5.1
4.9
5.3
5.1
9.6
9.1
8.8
8.7
8.7
8.6
8.6
8.4
8.2
8.0
7.9
7.8
7.2
7.1
6.7
6.5
6.4
77
70
69
71
70
68
66
64
60
58
58
56
52
50
46
46
44
34
35
38
39
42
41
39
37
36
34
33
32
27
25
22
21
20
74
67
66
68
67
66
64
61
58
55
55
54
49
47
44
44
41
Urban Total
Birth Rate Infant Mortality RateDeath Rate
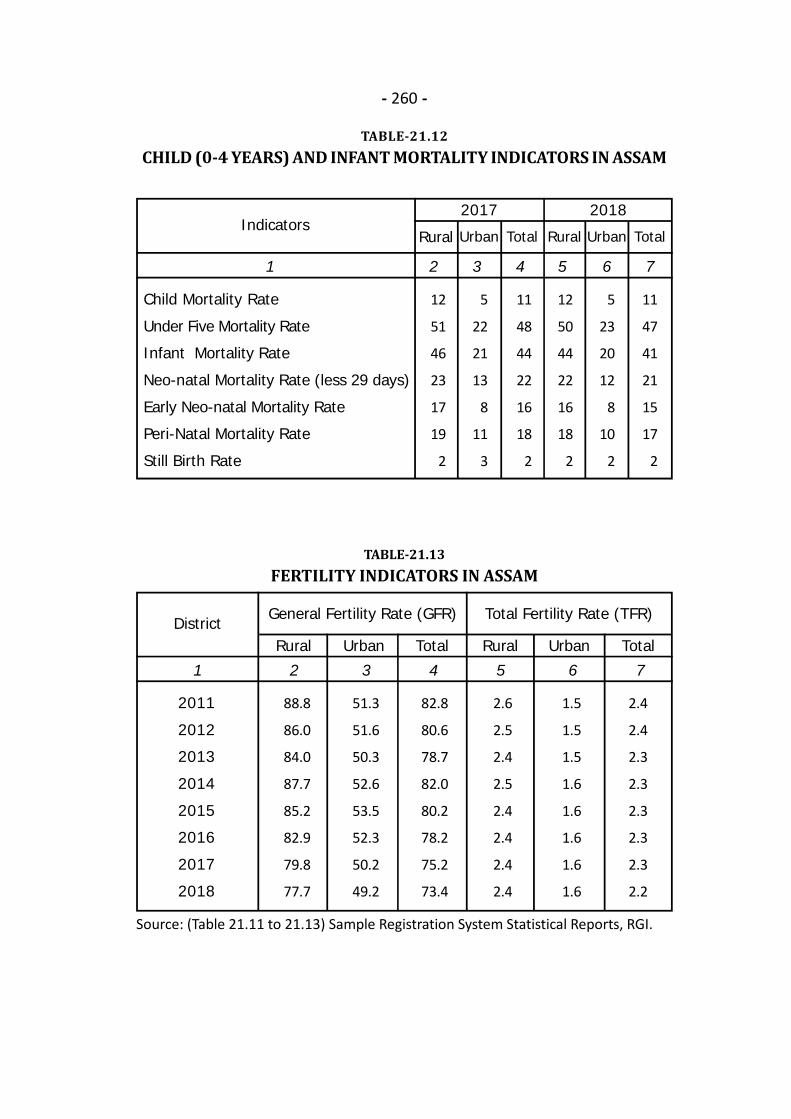
- 260 -
TABLE-21.12CHILD (0-4 YEARS) AND INFANT MORTALITY INDICATORS IN ASSAM
1 2 3 4 5 6 7
Urban RuralTotalIndicators
Rural
Child Mortality Rate
Under Five Mortality Rate
Infant Mortality Rate
Neo-natal Mortality Rate (less 29 days)
Early Neo-natal Mortality Rate
Peri-Natal Mortality Rate
Still Birth Rate
12
51
46
23
17
19
2
5
22
21
13
8
11
3
11
48
44
22
16
18
2
12
50
44
22
16
18
2
5
23
20
12
8
10
2
11
47
41
21
15
17
2
Urban Total
2017 2018
TABLE-21.13FERTILITY INDICATORS IN ASSAM
1 2 3 4 5 6 7
2011
2012
2013
2014
2015
2016
2017
2018
DistrictRural Urban Total Rural Urban Total
88.8
86.0
84.0
87.7
85.2
82.9
79.8
77.7
51.3
51.6
50.3
52.6
53.5
52.3
50.2
49.2
82.8
80.6
78.7
82.0
80.2
78.2
75.2
73.4
2.6
2.5
2.4
2.5
2.4
2.4
2.4
2.4
1.5
1.5
1.5
1.6
1.6
1.6
1.6
1.6
2.4
2.4
2.3
2.3
2.3
2.3
2.3
2.2
General Fertility Rate (GFR) Total Fertility Rate (TFR)
Source: (Table 21.11 to 21.13) Sample Registration System Statistical Reports, RGI.
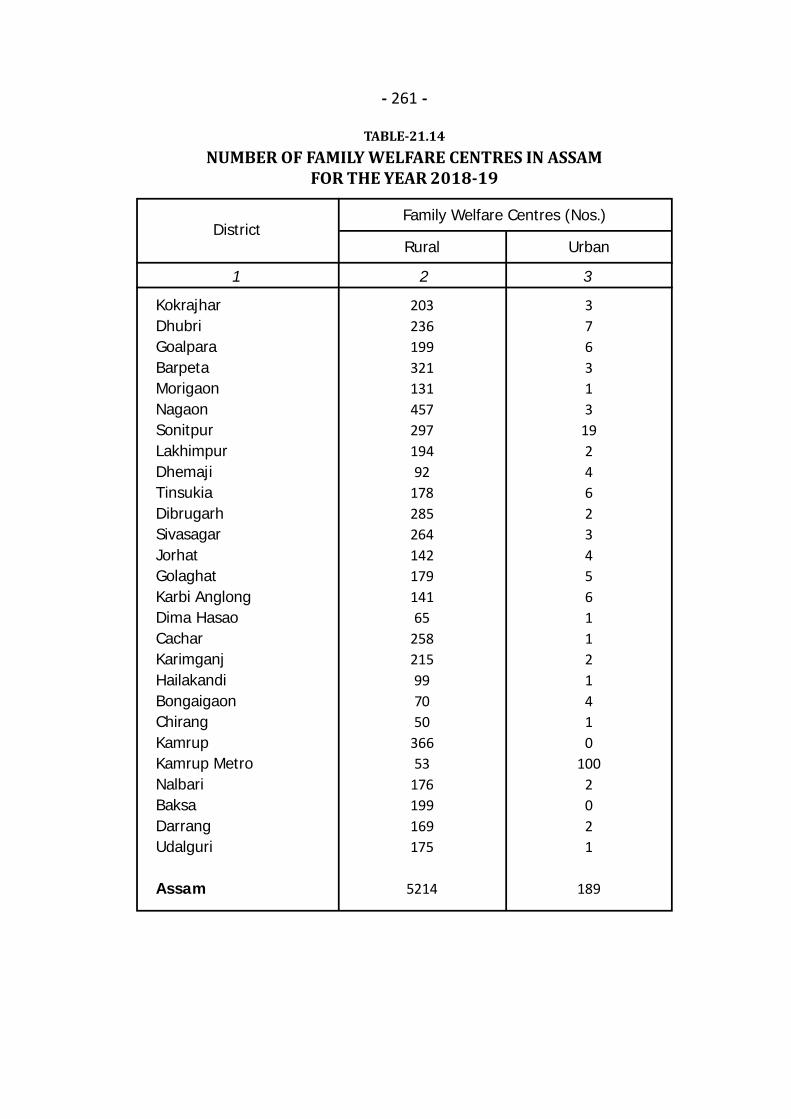
- 261 -
TABLE-21.14NUMBER OF FAMILY WELFARE CENTRES IN ASSAM
FOR THE YEAR 2018-19
1 2 3
KokrajharDhubriGoalparaBarpetaMorigaonNagaonSonitpurLakhimpurDhemajiTinsukiaDibrugarhSivasagarJorhatGolaghatKarbi AnglongDima HasaoCacharKarimganjHailakandiBongaigaonChirangKamrupKamrup MetroNalbariBaksaDarrangUdalguri
Assam
DistrictRural Urban
20323619932113145729719492
17828526414217914165
258215997050
36653
176199169175
5214
376313
19246234561121410
1002021
189
Family Welfare Centres (Nos.)
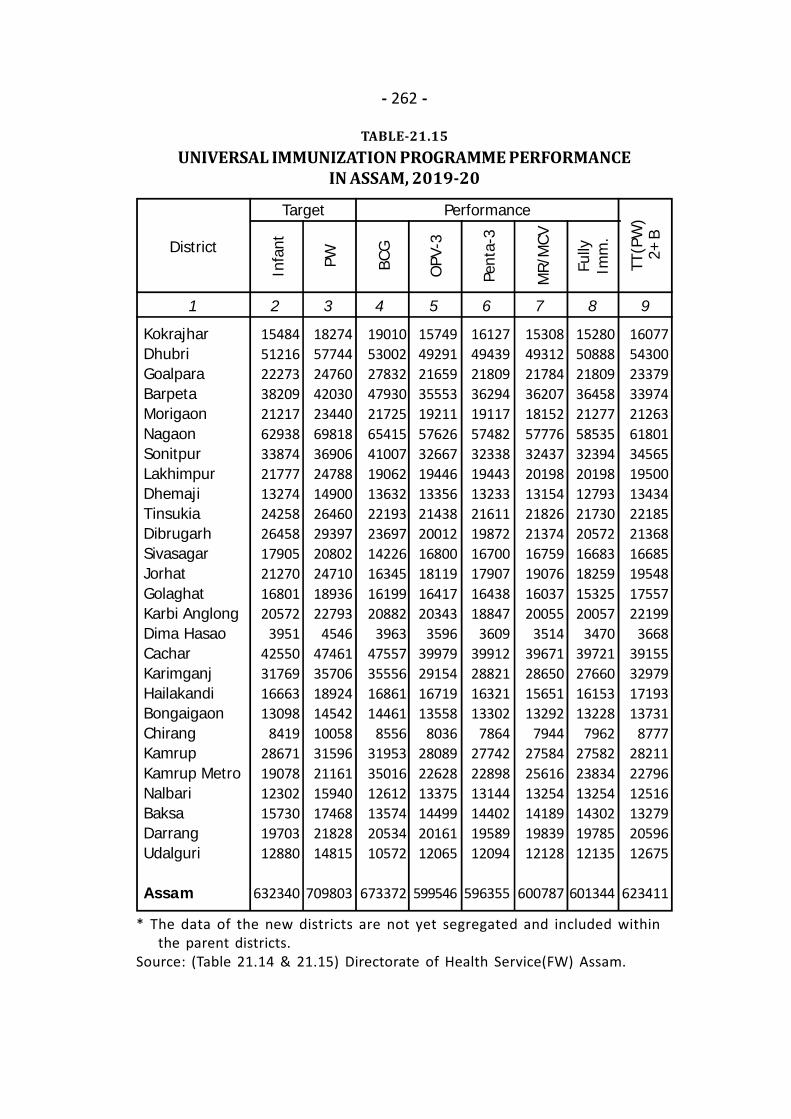
- 262 -
TABLE-21.15UNIVERSAL IMMUNIZATION PROGRAMME PERFORMANCE
IN ASSAM, 2019-20
* The data of the new districts are not yet segregated and included within the parent districts.Source: (Table 21.14 & 21.15) Directorate of Health Service(FW) Assam.
1 2 3 4 5 6 7 8 9
KokrajharDhubriGoalparaBarpetaMorigaonNagaonSonitpurLakhimpurDhemajiTinsukiaDibrugarhSivasagarJorhatGolaghatKarbi AnglongDima HasaoCacharKarimganjHailakandiBongaigaonChirangKamrupKamrup MetroNalbariBaksaDarrangUdalguri
Assam
District
Infa
nt
PW BCG
Pent
a-3
OPV
-3
MR/
MCV
TT(P
W)
2+B
154845121622273382092121762938338742177713274242582645817905212701680120572
395142550317691666313098
8419286711907812302157301970312880
632340
182745774424760420302344069818369062478814900264602939720802247101893622793
45464746135706189241454210058315962116115940174682182814815
709803
190105300227832479302172565415410071906213632221932369714226163451619920882
396347557355561686114461
8556319533501612612135742053410572
673372
157494929121659355531921157626326671944613356214382001216800181191641720343
359639979291541671913558
8036280892262813375144992016112065
599546
161274943921809362941911757482323381944313233216111987216700179071643818847
360939912288211632113302
7864277422289813144144021958912094
596355
153084931221784362071815257776324372019813154218262137416759190761603720055
351439671286501565113292
7944275842561613254141891983912128
600787
160775430023379339742126361801345651950013434221852136816685195481755722199
366839155329791719313731
8777282112279612516132792059612675
623411
Target Performance
152805088821809364582127758535323942019812793217302057216683182591532520057
347039721276601615313228
7962275822383413254143021978512135
601344
Fully
Imm
.

- 263 -
TABLE-21.16DISTRICT-WISE NUMBER OF HABITATIONS/VILLAGES HAVING
DRINKING WATER FACILITIES IN ASSAM
1 2 3 4 5 6 7 8 9
KokrajharDhubriGoalparaBarpetaMorigaonNagaonSonitpurLakhimpurDhemajiTinsukiaDibrugarhSivasagarJorhatGolaghatKarbi AnglongDima HasaoCacharKarimganjHailakandiBongaigaonChirangKamrupKamrup MetroNalbariBaksaDarrangUdalguriBiswanathCharaideoHojaiMajuliSouth SalmaraW.K.AnglongAssam
District
Habitations coveredduring 2018-19
Tota
l Hab
itatio
nas
on
01-0
4-20
18
4328357827693389218137532715262123123214702829652958420722581146314526211701233222104412
8042501324123932420278919391888
556577
112588076
614
19181516
18
11168
17156438
131
290
1337
153815
7000
353
789
232
1003
1242
1214
53000000
100
331918
4000600
204
921013162011
35
166
1170
610
11404
4801
1181
47123842
00
14000
710
1736722814
1347843
1196910300737855
1238429209
1062985713382480171
1628540684212364650
951170
880594339
67118667
23137
86264104685194777217121410490212126624396
4805
1538
120170
110721759
466952
000
317126
09768
250625921851135711441780158822001165186955782410212527491225
433275821261527
69615503558
5911065
8321832
298190913451549
172333458
55171
250625921851135711441780158822001165186955782410212527491225
433275821261527
69615503558
5911065
8321832
298190913451549
172333458
55171
Hab
itatio
n w
ithfu
nctio
ning
drin
king
wat
er s
uppl
y fa
cilit
yas
on
01-0
4-20
19
Un-
Cove
red
Hab
itatio
n
Qua
lity
Affe
cted
Hab
itatio
n
Fully
Cov
ered
Hab
itatio
n
Un-
Cove
red
Hab
itatio
n
Qua
lity
Affe
cted
Hab
itatio
n
Fully
Cov
ered
Hab
itatio
n
Habitationas on 01-04-2019
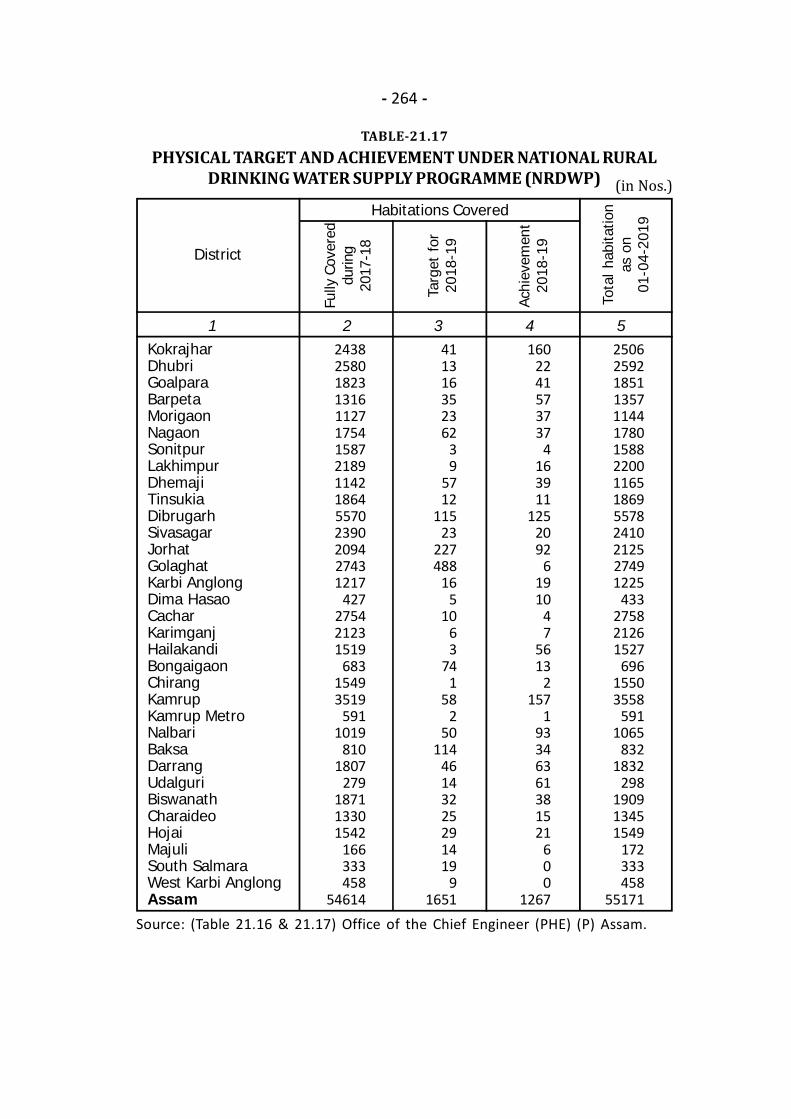
- 264 -
TABLE-21.17PHYSICAL TARGET AND ACHIEVEMENT UNDER NATIONAL RURAL
DRINKING WATER SUPPLY PROGRAMME (NRDWP) (in Nos.)
Source: (Table 21.16 & 21.17) Office of the Chief Engineer (PHE) (P) Assam.
1 2 3 4 5KokrajharDhubriGoalparaBarpetaMorigaonNagaonSonitpurLakhimpurDhemajiTinsukiaDibrugarhSivasagarJorhatGolaghatKarbi AnglongDima HasaoCacharKarimganjHailakandiBongaigaonChirangKamrupKamrup MetroNalbariBaksaDarrangUdalguriBiswanathCharaideoHojaiMajuliSouth SalmaraWest Karbi AnglongAssam
District
Tota
l hab
itatio
nas
on
01-0
4-20
19
Habitations Covered
243825801823131611271754158721891142186455702390209427431217
427275421231519
68315493519
5911019
8101807
279187113301542
166333458
54614
411316352362
39
5712
11523
227488
165
1063
741
582
50114
46143225291419
91651
1602241573737
4163911
1252092
61910
47
5613
2157
193346361381521
600
1267
250625921851135711441780158822001165186955782410212527491225
433275821261527
69615503558
5911065
8321832
298190913451549
172333458
55171
Fully
Cov
ered
durin
g20
17-1
8
Targ
et f
or20
18-1
9
Achi
evem
ent
2018
-19
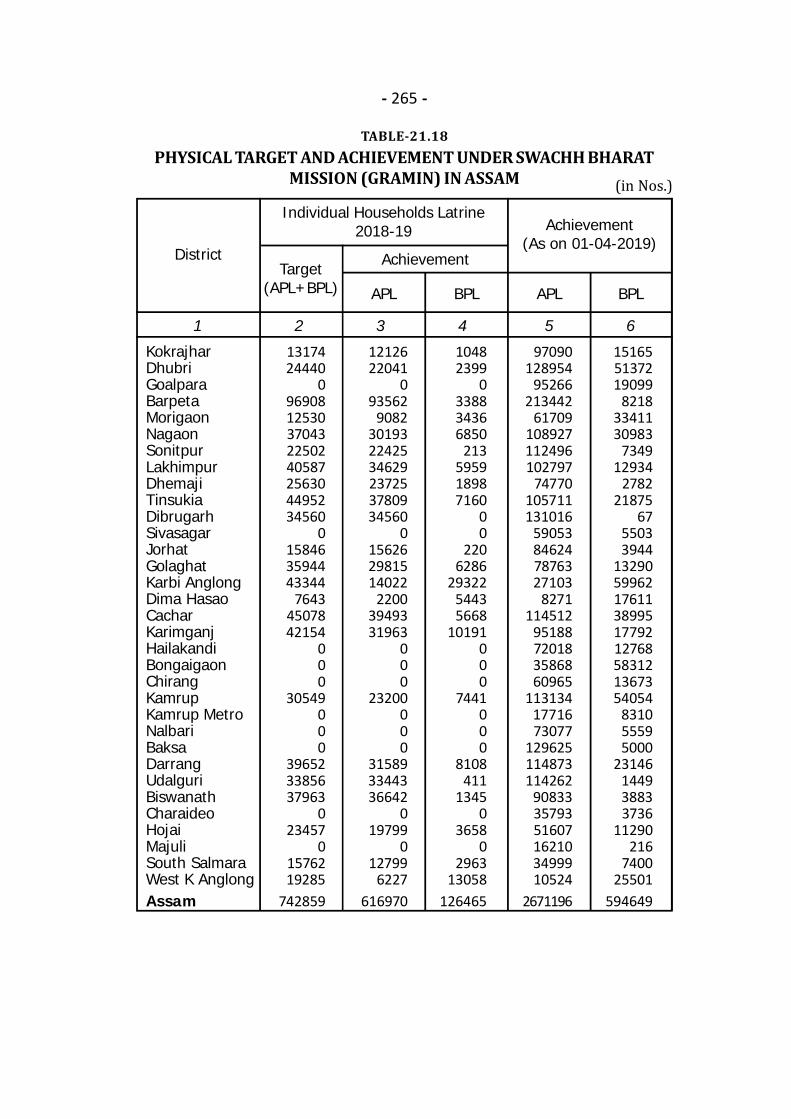
- 265 -
TABLE-21.18PHYSICAL TARGET AND ACHIEVEMENT UNDER SWACHH BHARAT
MISSION (GRAMIN) IN ASSAM (in Nos.)
1 2 3 4 5 6
KokrajharDhubriGoalparaBarpetaMorigaonNagaonSonitpurLakhimpurDhemajiTinsukiaDibrugarhSivasagarJorhatGolaghatKarbi AnglongDima HasaoCacharKarimganjHailakandiBongaigaonChirangKamrupKamrup MetroNalbariBaksaDarrangUdalguriBiswanathCharaideoHojaiMajuliSouth SalmaraWest K AnglongAssam
District
Individual Households Latrine2018-19
AchievementTarget(APL+BPL)
Achievement(As on 01-04-2019)
1317424440
09690812530370432250240587256304495234560
0158463594443344
76434507842154
000
30549000
396523385637963
023457
01576219285
742859
1212622041
093562
9082301932242534629237253780934560
0156262981514022
22003949331963
000
23200000
315893344336642
019799
012799
6227616970
10482399
0338834366850
213595918987160
00
2206286
2932254435668
10191000
7441000
8108411
13450
36580
296313058
126465
97090128954
95266213442
61709108927112496102797
74770105711131016
59053846247876327103
8271114512
95188720183586860965
1131341771673077
129625114873114262
908333579351607162103499910524
2671196
APL APL BPLBPL
151655137219099
82183341130983
734912934
278221875
6755033944
132905996217611389951779212768583121367354054
831055595000
23146144938833736
11290216
740025501
594649
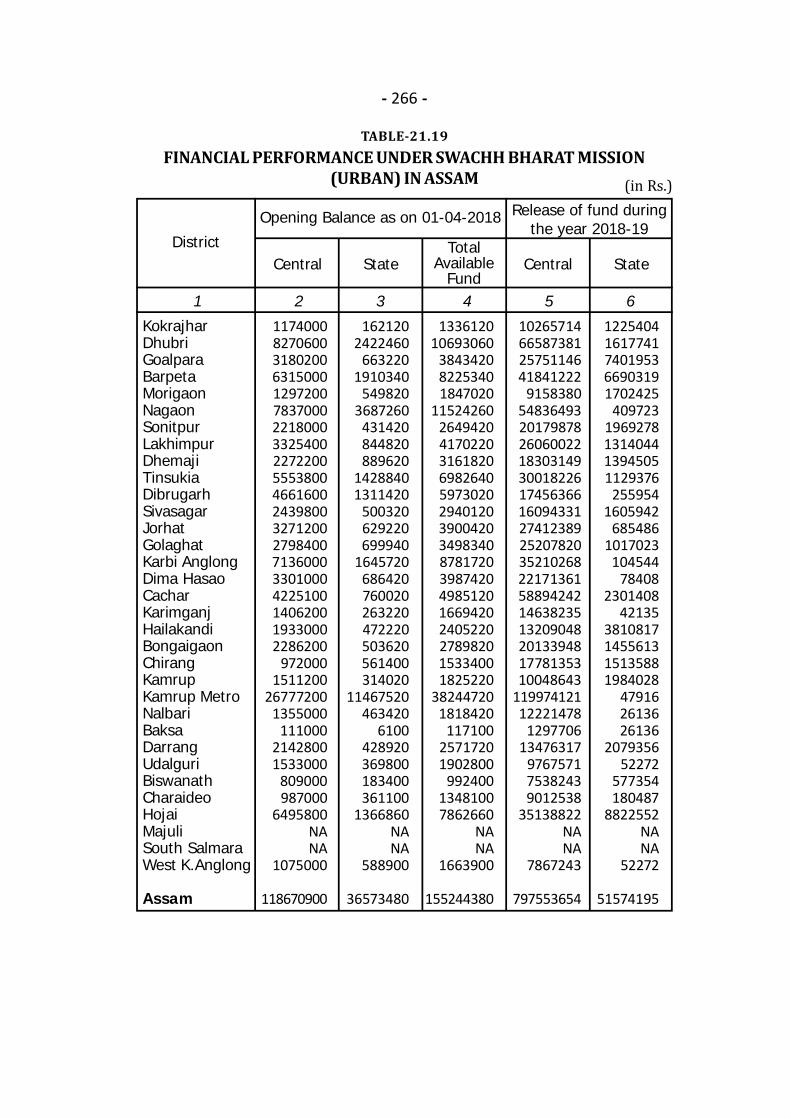
- 266 -
TABLE-21.19FINANCIAL PERFORMANCE UNDER SWACHH BHARAT MISSION
(URBAN) IN ASSAM
1 2 3 4 5 6
KokrajharDhubriGoalparaBarpetaMorigaonNagaonSonitpurLakhimpurDhemajiTinsukiaDibrugarhSivasagarJorhatGolaghatKarbi AnglongDima HasaoCacharKarimganjHailakandiBongaigaonChirangKamrupKamrup MetroNalbariBaksaDarrangUdalguriBiswanathCharaideoHojaiMajuliSouth SalmaraWest K.Anglong
Assam
District
Opening Balance as on 01-04-2018
Central
Release of fund duringthe year 2018-19
11740008270600318020063150001297200783700022180003325400227220055538004661600243980032712002798400713600033010004225100140620019330002286200
9720001511200
267772001355000
11100021428001533000
809000987000
6495800NANA
1075000
118670900
1621202422460
6632201910340
5498203687260
431420844820889620
14288401311420
500320629220699940
1645720686420760020263220472220503620561400314020
11467520463420
6100428920369800183400361100
1366860NANA
588900
36573480
133612010693060
384342082253401847020
115242602649420417022031618206982640597302029401203900420349834087817203987420498512016694202405220278982015334001825220
382447201818420
11710025717201902800
99240013481007862660
NANA
1663900
155244380
10265714665873812575114641841222
91583805483649320179878260600221830314930018226174563661609433127412389252078203521026822171361588942421463823513209048201339481778135310048643
11997412112221478
129770613476317
976757175382439012538
35138822NANA
7867243
797553654
12254041617741740195366903191702425
4097231969278131404413945051129376
2559541605942
6854861017023
10454478408
230140842135
3810817145561315135881984028
479162613626136
207935652272
577354180487
8822552NANA
52272
51574195
StateTotal
AvailableFund
Central State
(in Rs.)

- 267 -
TABLE-21.20FINANCIAL PERFORMANCE UNDER SWACHH BHARAT MISSION
(GRAMIN) IN ASSAM
Source: (Table 21.18 to 21.20) Office of the Chief Engineer (PHE), Sanitation,Assam.
1 2 3 4 5 6
KokrajharDhubriGoalparaBarpetaMorigaonNagaonSonitpurLakhimpurDhemajiTinsukiaDibrugarhSivasagarJorhatGolaghatKarbi AnglongDima HasaoCacharKarimganjHailakandiBongaigaonChirangKamrupKamrup MetroNalbariBaksaDarrangUdalguriBiswanathCharaideoHojaiMajuliSouth SalmaraWest K.Anglong
Assam
District
Opening Balanceas on 01-04-2018
Central
Release of fund duringthe year 2018-19
1929.192208.122257.552479.081575.711641.93
189.971636.551546.931604.60
649.58382.38
1098.23935.47
1697.85461.32
1128.35483.60
1428.891648.84
779.523322.58
670.28220.51
1336.941393.941584.081072.101013.731656.791085.871276.04
355.07
42751.59
----------
69.34184.40
----------
29.60--------
50.00-
333.30
1929.192208.122257.552479.081575.711641.93
189.971636.551546.931604.60
718.92566.77
1098.23935.47
1697.85461.32
1128.35483.60
1428.891648.84
779.523322.58
699.88220.51
1336.941393.941584.081072.101013.731656.791085.871326.04
355.07
43084.92
1869.772150.00
370.005600.001404.243577.472244.052650.001047.001893.891100.00
300.001600.002550.002236.26
232.181644.001800.001000.001053.03
330.322316.47
-800.00
1340.003234.403000.002420.00
-700.00
-596.81941.25
52001.14
343.47700.89
57.941017.35
296.58761.89358.51698.23130.09522.46
68.7929.48
165.22503.36660.17
35.89567.59378.25
78.62554.12217.07597.32
-78.62
131.69792.18718.20629.29204.44508.51100.44183.32218.40
12308.38
StateTotal
AvailableFund
Central State
(Rs. in Lakh)
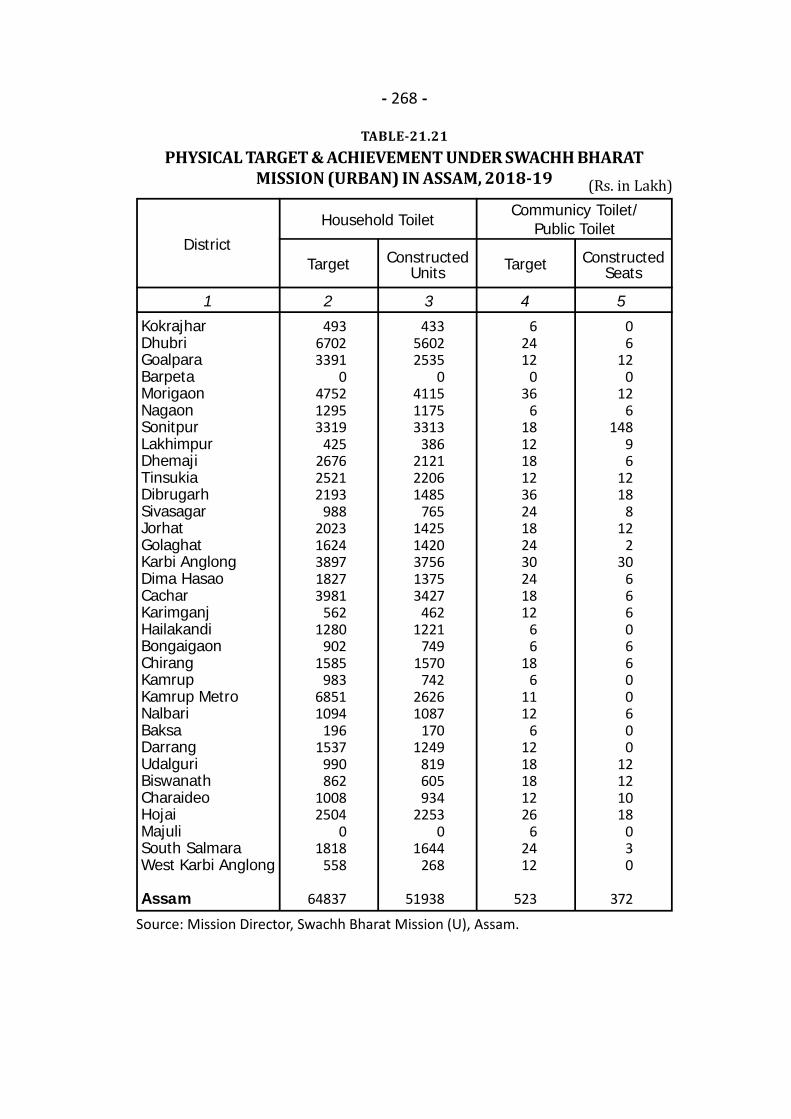
- 268 -
TABLE-21.21PHYSICAL TARGET & ACHIEVEMENT UNDER SWACHH BHARAT
MISSION (URBAN) IN ASSAM, 2018-19
1 2 3 4 5
KokrajharDhubriGoalparaBarpetaMorigaonNagaonSonitpurLakhimpurDhemajiTinsukiaDibrugarhSivasagarJorhatGolaghatKarbi AnglongDima HasaoCacharKarimganjHailakandiBongaigaonChirangKamrupKamrup MetroNalbariBaksaDarrangUdalguriBiswanathCharaideoHojaiMajuliSouth SalmaraWest Karbi Anglong
Assam
District
Household ToiletCommunicy Toilet/
Public Toilet
49367023391
0475212953319
425267625212193
98820231624389718273981
5621280
9021585
98368511094
1961537
990862
10082504
01818
558
64837
43356022535
0411511753313
386212122061485
76514251420375613753427
4621221
7491570
74226261087
1701249
819605934
22530
1644268
51938
62412
036
6181218123624182430241812
66
186
1112
61218181226
62412
523
06
120
126
14896
1218
812
230
66606600600
12121018
030
372
Target ConstructedUnits Target Constructed
Seats
(Rs. in Lakh)
Source: Mission Director, Swachh Bharat Mission (U), Assam.

“COVID-19” STATISTICS ->
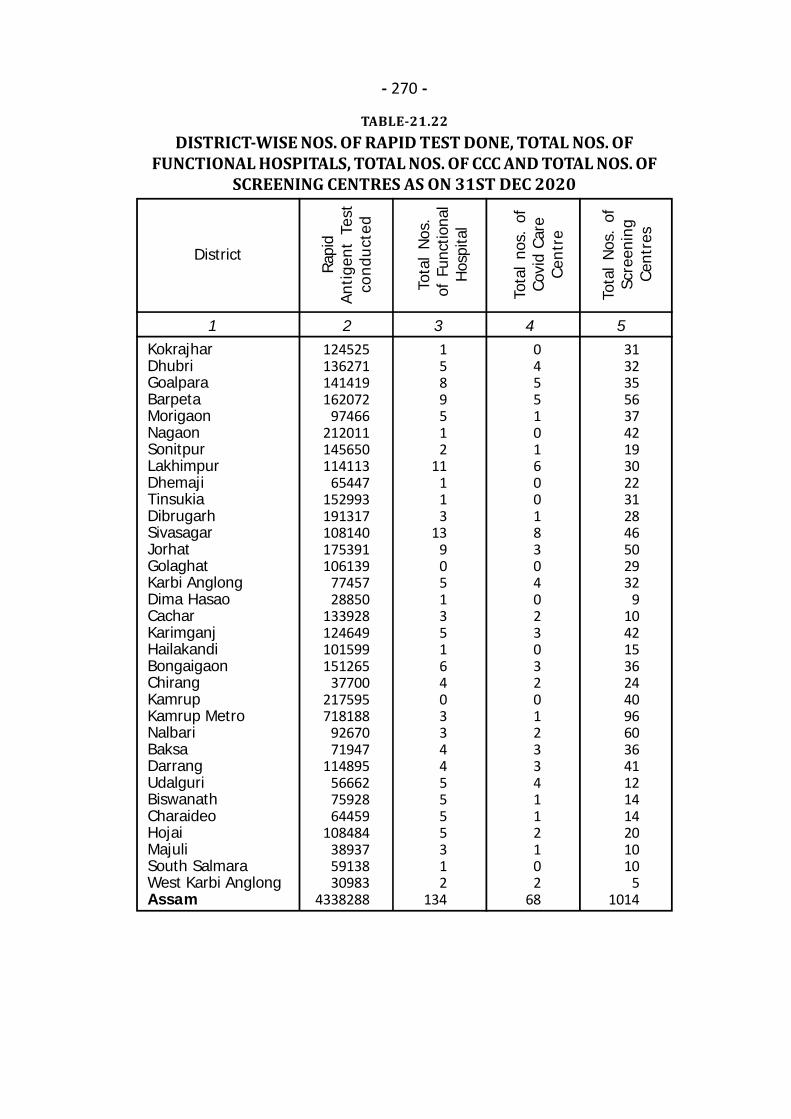
- 270 -
TABLE-21.22DISTRICT-WISE NOS. OF RAPID TEST DONE, TOTAL NOS. OF
FUNCTIONAL HOSPITALS, TOTAL NOS. OF CCC AND TOTAL NOS. OFSCREENING CENTRES AS ON 31ST DEC 2020
1 2 3 4 5KokrajharDhubriGoalparaBarpetaMorigaonNagaonSonitpurLakhimpurDhemajiTinsukiaDibrugarhSivasagarJorhatGolaghatKarbi AnglongDima HasaoCacharKarimganjHailakandiBongaigaonChirangKamrupKamrup MetroNalbariBaksaDarrangUdalguriBiswanathCharaideoHojaiMajuliSouth SalmaraWest Karbi AnglongAssam
District
Tota
l N
os.
ofSc
reen
ing
Cent
res
124525136271141419162072
97466212011145650114113
65447152993191317108140175391106139
7745728850
133928124649101599151265
37700217595718188
9267071947
114895566627592864459
108484389375913830983
4338288
1589512
11113
13905135164033445555312
134
045510160018304023032012334112102
68
313235563742193022312846502932
910421536244096603641121414201010
51014
Rapi
dA
ntig
ent
Test
cond
ucte
d
Tota
l N
os.
of
Func
tiona
lH
ospi
tal
Tota
l no
s. o
fCo
vid
Care
Cen
tre
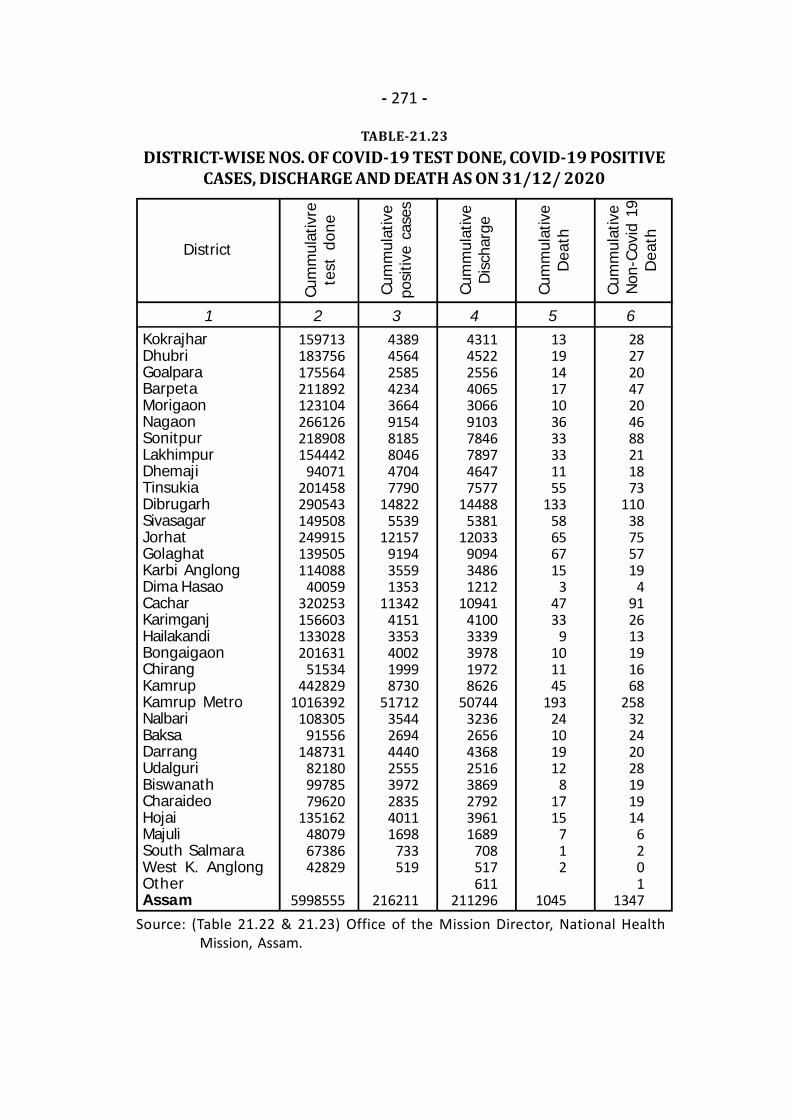
- 271 -
TABLE-21.23DISTRICT-WISE NOS. OF COVID-19 TEST DONE, COVID-19 POSITIVE
CASES, DISCHARGE AND DEATH AS ON 31/12/ 2020
Source: (Table 21.22 & 21.23) Office of the Mission Director, National Health Mission, Assam.
1 2 3 4 5 6KokrajharDhubriGoalparaBarpetaMorigaonNagaonSonitpurLakhimpurDhemajiTinsukiaDibrugarhSivasagarJorhatGolaghatKarbi AnglongDima HasaoCacharKarimganjHailakandiBongaigaonChirangKamrupKamrup MetroNalbariBaksaDarrangUdalguriBiswanathCharaideoHojaiMajuliSouth SalmaraWest K. AnglongOtherAssam
District
Cum
mul
ativ
e N
on-C
ovid
19
Dea
th
159713183756175564211892123104266126218908154442
94071201458290543149508249915139505114088
40059320253156603133028201631
51534442829
1016392108305
91556148731
821809978579620
135162480796738642829
5998555
28272047204688211873
11038755719
4912613191668
25832242028191914
6201
1347
Cum
mul
ativ
rete
st d
one
Cum
mul
ativ
epo
sitiv
e ca
ses
Cum
mul
ativ
eD
isch
arge
4389456425854234366491548185804647047790
148225539
12157919435591353
1134241513353400219998730
5171235442694444025553972283540111698
733519
216211
4311452225564065306691037846789746477577
144885381
12033909434861212
1094141003339397819728626
5074432362656436825163869279239611689
708517611
211296
13191417103633331155
13358656715
34733
9101145
19324101912
81715
712
1045
Cum
mul
ativ
eD
eath

.

22.EDUCATIONFIGURE AT A GLANCE, 2019-20Higher Education University (Including Private and Deemed University)College for General Education(a) Arts, Science and Commerce College Govt. College Provincialised College Private College(b) Junior CollegeCollege for Professional Education(a) Agriculture & Forestry(b) Veterinary(c) Law College (Govt. & Non Govt.)Secondary and Elementary EducationSchool for General Educaiton(a) Higher Secondary School(b) High School(c) Upper Primary School(d) Primary School(e)Sanskrit and Pali Tols (Provincialised)(f)Pre-Sr. Madrassa(g)Sr. Madrassa/Arabic College/Title MadrassaTeachers Training Institution(a) College of Teacher Education (C.T.E)(b) District Institute of Education And Training (D.I.E.T)(c) Basic Training Centre (B.T.C)(d)Normal School (N.S)(e)Pre-Primary Teacher Training Centre (PPTTC)
184292672517426
8343479571836210972502678271871
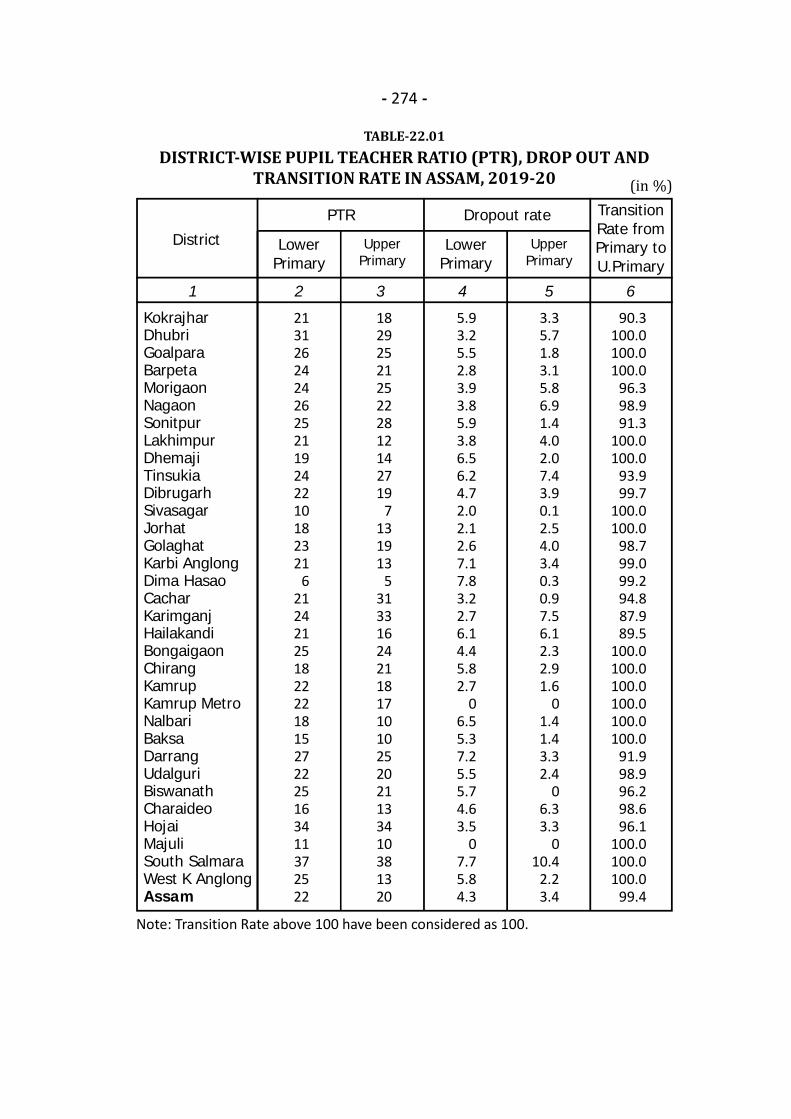
- 274 -
TABLE-22.01DISTRICT-WISE PUPIL TEACHER RATIO (PTR), DROP OUT AND
TRANSITION RATE IN ASSAM, 2019-20
Note: Transition Rate above 100 have been considered as 100.
1 2 3 4 5 6
LowerPrimary
UpperPrimary
UpperPrimary
District LowerPrimary
KokrajharDhubriGoalparaBarpetaMorigaonNagaonSonitpurLakhimpurDhemajiTinsukiaDibrugarhSivasagarJorhatGolaghatKarbi AnglongDima HasaoCacharKarimganjHailakandiBongaigaonChirangKamrupKamrup MetroNalbariBaksaDarrangUdalguriBiswanathCharaideoHojaiMajuliSouth SalmaraWest K AnglongAssam
213126242426252119242210182321
6212421251822221815272225163411372522
1829252125222812142719
7131913
5313316242118171010252021133410381320
5.93.25.52.83.93.85.93.86.56.24.72.02.12.67.17.83.22.76.14.45.82.7
06.55.37.25.55.74.63.5
07.75.84.3
3.35.71.83.15.86.91.44.02.07.43.90.12.54.03.40.30.97.56.12.32.91.6
01.41.43.32.4
06.33.3
010.4
2.23.4
90.3100.0100.0100.0
96.398.991.3
100.0100.0
93.999.7
100.0100.0
98.799.099.294.887.989.5
100.0100.0100.0100.0100.0100.0
91.998.996.298.696.1
100.0100.0100.0
99.4
Dropout rate TransitionRate fromPrimary toU.Primary
PTR
(in %)
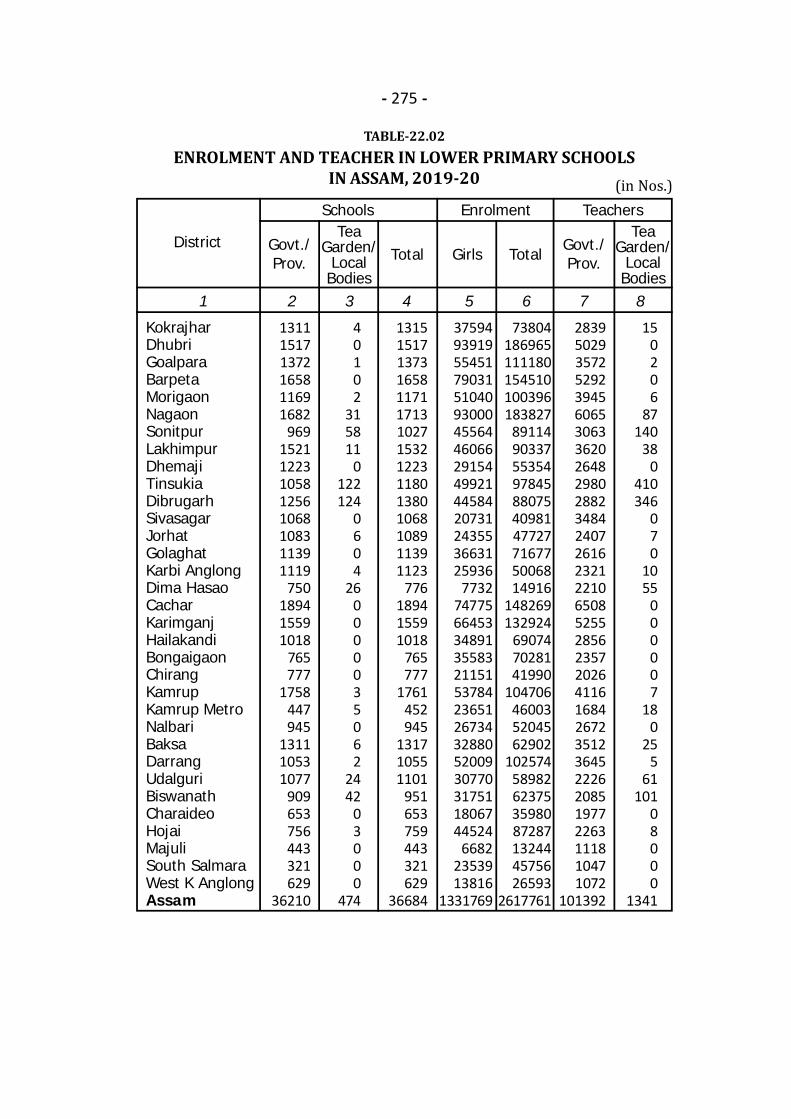
- 275 -
TABLE-22.02ENROLMENT AND TEACHER IN LOWER PRIMARY SCHOOLS
IN ASSAM, 2019-20 (in Nos.)
1 2 3 4 5 6 7 8
KokrajharDhubriGoalparaBarpetaMorigaonNagaonSonitpurLakhimpurDhemajiTinsukiaDibrugarhSivasagarJorhatGolaghatKarbi AnglongDima HasaoCacharKarimganjHailakandiBongaigaonChirangKamrupKamrup MetroNalbariBaksaDarrangUdalguriBiswanathCharaideoHojaiMajuliSouth SalmaraWest K AnglongAssam
District Govt./Prov.
TeaGarden/
LocalBodies
Total Girls TotalGovt./Prov.
TeaGarden/
LocalBodies
131115171372165811691682
96915211223105812561068108311391119
750189415591018
765777
1758447945
131110531077
909653756443321629
36210
40102
315811
0122124
0604
260000035062
2442
03000
474
131515171373165811711713102715321223118013801068108911391123
776189415591018
765777
1761452945
131710551101
951653759443321629
36684
375949391955451790315104093000455644606629154499214458420731243553663125936
77327477566453348913558321151537842365126734328805200930770317511806744524
66822353913816
1331769
73804186965111180154510100396183827
89114903375535497845880754098147727716775006814916
148269132924
690747028141990
104706460035204562902
10257458982623753598087287132444575626593
2617761
283950293572529239456065306336202648298028823484240726162321221065085255285623572026411616842672351236452226208519772263111810471072
101392
150206
87140
380
410346
070
1055
000007
180
255
61101
08000
1341
Schools Enrolment Teachers
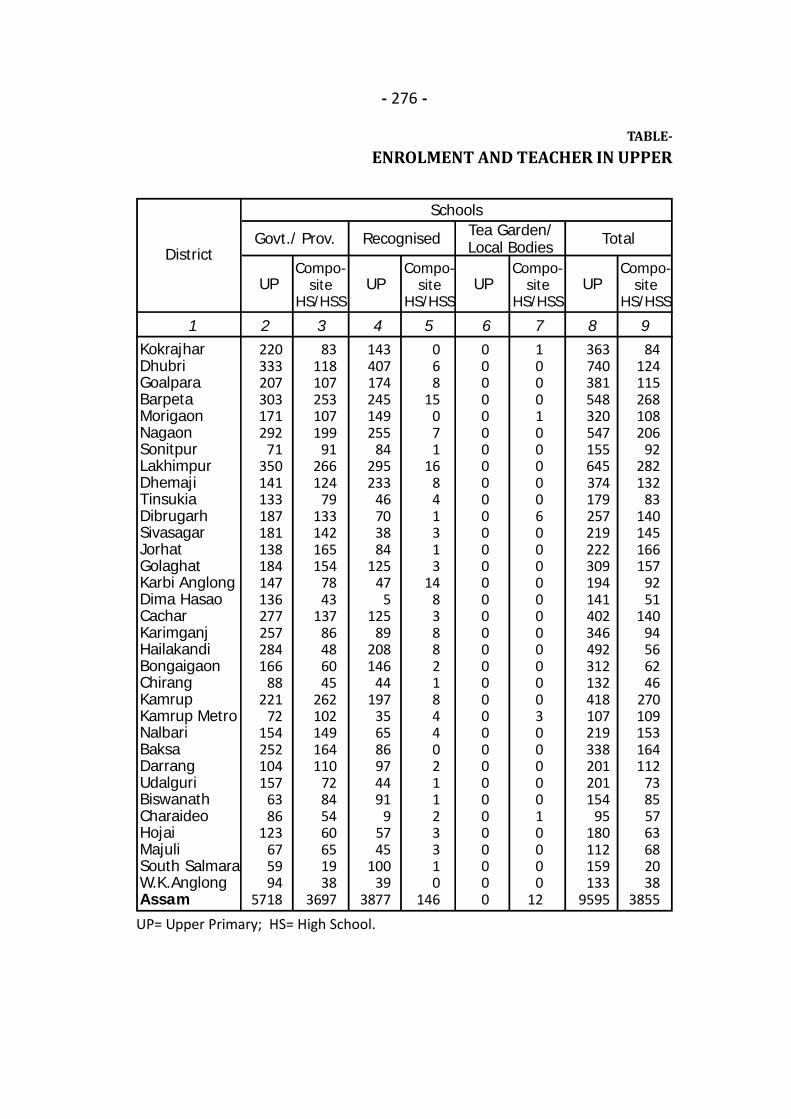
- 276 -
TABLE-ENROLMENT AND TEACHER IN UPPER
UP= Upper Primary; HS= High School.
1 2 3 4 5 6 7 8 9KokrajharDhubriGoalparaBarpetaMorigaonNagaonSonitpurLakhimpurDhemajiTinsukiaDibrugarhSivasagarJorhatGolaghatKarbi AnglongDima HasaoCacharKarimganjHailakandiBongaigaonChirangKamrupKamrup MetroNalbariBaksaDarrangUdalguriBiswanathCharaideoHojaiMajuliSouth SalmaraW.K.AnglongAssam
District
UPCompo-
siteHS/HSS
UPCompo-
siteHS/HSS
UPCompo-
siteHS/HSS
UP
220333207303171292
71350141133187181138184147136277257284166
88221
72154252104157
6386
123675994
5718
83118107253107199
91266124
79133142165154
7843
13786486045
262102149164110
72845460651938
3697
143407174245149255
84295233
46703884
12547
5125
89208146
44197
356586974491
95745
10039
3877
068
15071
16841313
14838821844021123310
146
0000000000000000000000000000000000
100010000060000000000030000010000
12
363740381548320547155645374179257219222309194141402346492312132418107219338201201154
95180112159133
9595
84124115268108206
92282132
83140145166157
9251
14094566246
270109153164112
73855763682038
3855
Govt./ Prov. Recognised Tea Garden/Local Bodies Total
Schools
Compo-site
HS/HSS

- 277 -
22.03PRIMARY SCHOOLS IN ASSAM, 2019-20 (in Nos.)
10 11 12 13 14 15 16 17
Girls
Govt./Prov. Recognised TeaGarden/
LocalBodies
TotalTotal
256765975933200516703006457939260883178620612239672441613084164912257214933
4550433883464019037234081434036687140961823222466240701889018802
941723790
496915090
7720805849
49808113608
611039499354893
103476495506183439979461674740425773324354406528228
85058497364262362804382027074692232691034482429354276835500364391806843311101732580114385
1518225
1441103612142363
9391955
92226131112
9001369205411051458
882471
1254519538689639
25201319136913731026
808871727617296150415
36964
102226191033151510201889
44119681674
235364209415603317
27935670
1472828283
1223178386534573280484
51359290674284
24855
06442
1370
777
2117115
4161316
104107
15467821
5582331
014
64
124
2215
01238
417961073591606530246260193569023635197129594070226932672229131338162514389827101609523722322880401323192177182715071809
90912681260
101761
Enrolment Teacher
UPCompos-ite HS/HSS
UPCompos-ite HS/HSS
171123881302205010592339
5652110
778821
11661791
7361190
926708
1612127918101172
6821436
68910942106
7061083
468711829301429561
38608
5000600000
5600000000000
230000060000
96
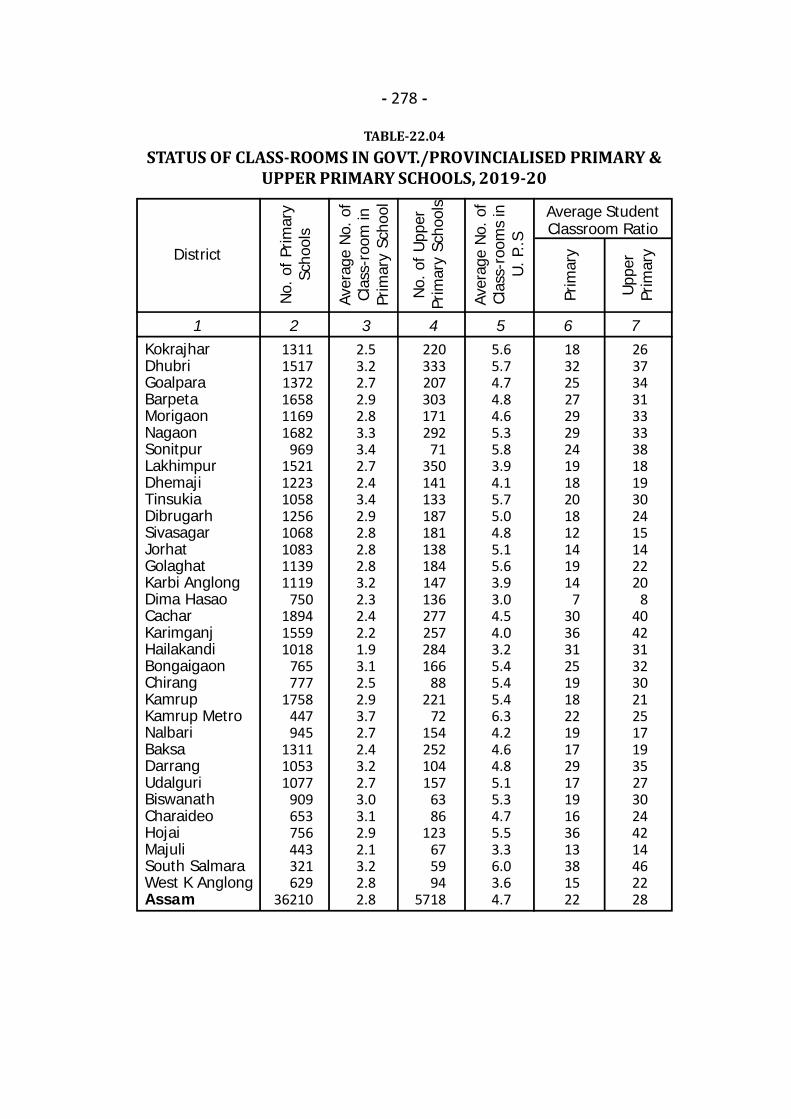
- 278 -
TABLE-22.04STATUS OF CLASS-ROOMS IN GOVT./PROVINCIALISED PRIMARY &
UPPER PRIMARY SCHOOLS, 2019-20
1 2 3 4 5 6 7
District
No.
of
Prim
ary
Scho
ols
Average StudentClassroom Ratio
131115171372165811691682
96915211223105812561068108311391119
750189415591018
765777
1758447945
131110531077
909653756443321629
36210
2.53.22.72.92.83.33.42.72.43.42.92.82.82.83.22.32.42.21.93.12.52.93.72.72.43.22.73.03.12.92.13.22.82.8
220333207303171292
71350141133187181138184147136277257284166
88221
72154252104157
6386
123675994
5718
5.65.74.74.84.65.35.83.94.15.75.04.85.15.63.93.04.54.03.25.45.45.46.34.24.64.85.15.34.75.53.36.03.64.7
183225272929241918201812141914
7303631251918221917291719163613381522
263734313333381819302415142220
8404231323021251719352730244214462228
Aver
age
No.
of
Clas
s-ro
om in
Prim
ary
Scho
ol
No.
of U
pper
Prim
ary
Scho
ols
Aver
age
No.
of
Clas
s-ro
oms
inU
. P..S
Prim
ary
Upp
erPr
imar
y
KokrajharDhubriGoalparaBarpetaMorigaonNagaonSonitpurLakhimpurDhemajiTinsukiaDibrugarhSivasagarJorhatGolaghatKarbi AnglongDima HasaoCacharKarimganjHailakandiBongaigaonChirangKamrupKamrup MetroNalbariBaksaDarrangUdalguriBiswanathCharaideoHojaiMajuliSouth SalmaraWest K AnglongAssam

- 279 -
TABLE-22.05GOVERNMENT AND PROVINCIALISED PRIMARY & UPPER PRIMARY
SCHOOLS HAVING VARIOUS FACILITIES, 2019-20 (in Nos.)
Source: (Table 22.01 & 22.05) DISE, 2019-20 (draft).
1 2 3 4 5 6 7 8 9
KokrajharDhubriGoalparaBarpetaMorigaonNagaonSonitpurLakhimpurDhemajiTinsukiaDibrugarhSivasagarJorhatGolaghatKarbi AnglongDima HasaoCacharKarimganjHailakandiBongaigaonChirangKamrupKamrup MetroNalbariBaksaDarrangUdalguriBiswanathCharaideoHojaiMajuliSouth SalmaraW.K.AnglongAssam
District
Primary School
No.
of
Scho
ols
Upper Primary School
131115171372165811691682
96915211223105812561068108311391119
750189415591018
765777
1758447945
131110531077
909653756443321629
36210
128615171370165511631679
9581511122310511249105310761125
860328
14101312
979745744
1722400945
121010431038
902653711443320596
34277
1264142712431465
9371630
92914831217100611061010107010931036
72517471438
947711683
1570424896
1072979
1005830650738439293618
33681
130014471371150410331627
94614741214103512051055107511321087
726184515251003
727747
1727441938
1193981
1050897652733436301625
35052
220333207303171292
71350141133187181138184147136277257284166
88221
72154252104157
6386
123675994
5718
218333207303171289
71346141133187178137182132
55226228275164
88219
62154234103155
6386
119675994
5479
213317192277139276
69337139127168172136178133125263239270161
84202
70150204
92129
5785
116665489
5329
219323207285151288
71346141130185178136182142129273252283164
86219
71153234
99155
6086
122665594
5585
Drin
king
Wat
er
Boys
Toile
t
Girl
sTo
ilet
No.
of
Scho
ols
Drin
king
Wat
er
Boys
Toile
t
Girl
sTo
ilet
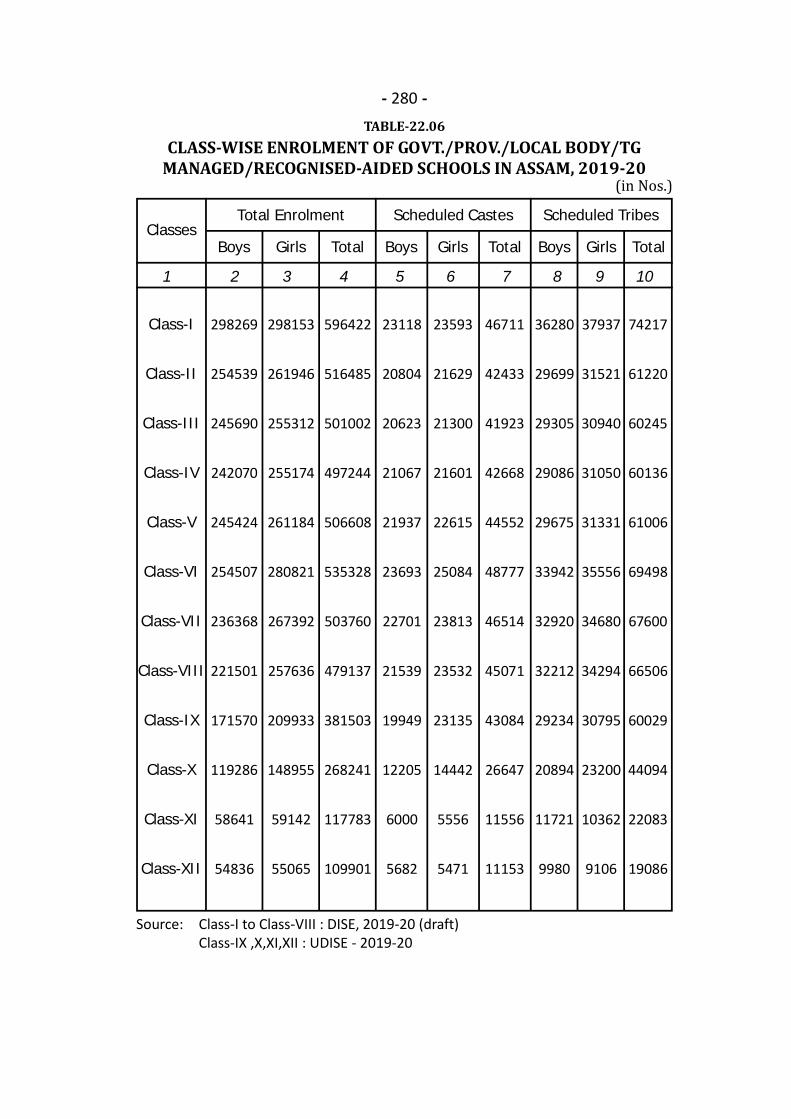
- 280 -TABLE-22.06
CLASS-WISE ENROLMENT OF GOVT./PROV./LOCAL BODY/TGMANAGED/RECOGNISED-AIDED SCHOOLS IN ASSAM, 2019-20
Source: Class-I to Class-VIII : DISE, 2019-20 (draft)Class-IX ,X,XI,XII : UDISE - 2019-20
1 2 3 4 5 6 7 8 9 10
Girls Boys Girls Total BoysTotalClasses
Boys Total
298269
254539
245690
242070
245424
254507
236368
221501
171570
119286
58641
54836
298153
261946
255312
255174
261184
280821
267392
257636
209933
148955
59142
55065
596422
516485
501002
497244
506608
535328
503760
479137
381503
268241
117783
109901
23118
20804
20623
21067
21937
23693
22701
21539
19949
12205
6000
5682
23593
21629
21300
21601
22615
25084
23813
23532
23135
14442
5556
5471
46711
42433
41923
42668
44552
48777
46514
45071
43084
26647
11556
11153
36280
29699
29305
29086
29675
33942
32920
32212
29234
20894
11721
9980
74217
61220
60245
60136
61006
69498
67600
66506
60029
44094
22083
19086
37937
31521
30940
31050
31331
35556
34680
34294
30795
23200
10362
9106
Girls
Scheduled Castes Scheduled TribesTotal Enrolment
Class-I
Class-II
Class-III
Class-IV
Class-V
Class-VI
Class-VII
Class-VIII
Class-IX
Class-X
Class-XI
Class-XII
(in Nos.)

- 281 -TABLE-22.07
NUMBER OF LOWER PRIMARY AND UPPER PRIMARY SCHOOLS INASSAM (Govt./Prov. under Deptt. of Elementary Education), 2019-20
1 2 3 4 5
DistrictRural
KokrajharDhubriGoalparaBarpetaMorigaonNagaonSonitpurLakhimpurDhemajiTinsukiaDibrugarhSivasagarJorhatGolaghatKarbi AnglongDima HasaoCacharKarimganjHailakandiBongaigaonChirangKamrupKamrup MetroNalbariBaksaDarrangUdalguriBiswanathCharaideoHojaiMajuliSouth SalmaraWest Karbi AnglongAssam
129314381339161911591633
93114841204101712111030105511081060
69718491535
994733759
1738213931
131110321062
895631716443321612
35053
18793339104938371941453828315953452424321820
23414
02115142240
00
171157
208307198289168277
63339137119173175136172132124270248270152
79220
18152252100156
5982
109675992
5402
1226
914
315
811
41414
62
121512
79
1414
91
54204144
14002
316
Upper PrimaryLower Primary
(in Nos.)Urban Rural Urban
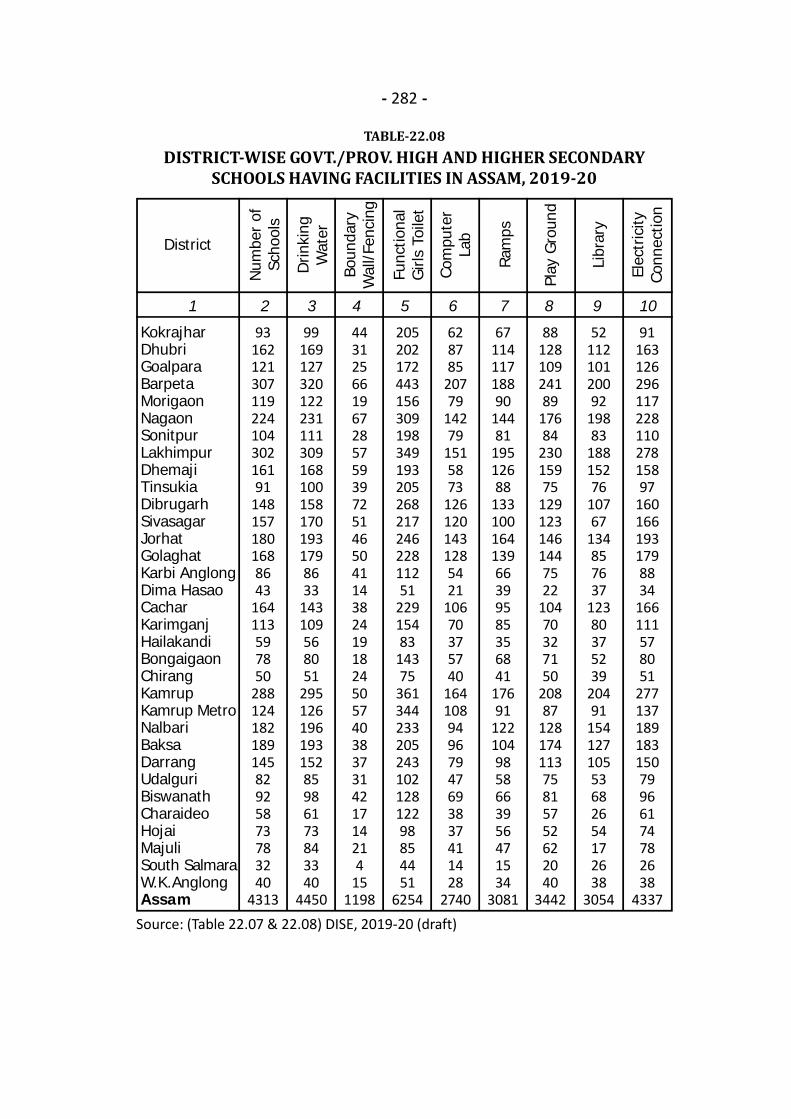
- 282 -
TABLE-22.08DISTRICT-WISE GOVT./PROV. HIGH AND HIGHER SECONDARY
SCHOOLS HAVING FACILITIES IN ASSAM, 2019-20
Source: (Table 22.07 & 22.08) DISE, 2019-20 (draft)
1 2 3 4 5 6 7 8 9 10
KokrajharDhubriGoalparaBarpetaMorigaonNagaonSonitpurLakhimpurDhemajiTinsukiaDibrugarhSivasagarJorhatGolaghatKarbi AnglongDima HasaoCacharKarimganjHailakandiBongaigaonChirangKamrupKamrup MetroNalbariBaksaDarrangUdalguriBiswanathCharaideoHojaiMajuliSouth SalmaraW.K.AnglongAssam
DistrictN
umbe
r of
Scho
ols
9316212130711922410430216191
1481571801688643
164113597850
28812418218914582925873783240
4313
991691273201222311113091681001581701931798633
143109568051
29512619619315285986173843340
4450
443125661967285759397251465041143824191824505740383731421714214
151198
628785
20779
14279
1515873
1261201431285421
10670375740
16410894967947693837411428
2740
6711411718890
14481
19512688
13310016413966399585356841
17691
1221049858663956471534
3081
8812810924189
17684
23015975
1291231461447522
10470327150
20887
12817411375815752622040
3442
5211210120092
19883
18815276
10767
134857637
12380375239
20491
15412710553682654172638
3054
9116312629611722811027815897
1601661931798834
166111578051
27713718918315079966174782638
4337
Drin
king
Wat
er
Boun
dary
Wal
l/Fen
cing
Com
pute
rLa
b
Ram
ps
Play
Gro
und
Libr
ary
Elec
tric
ityCo
nnec
tion
20520217244315630919834919320526821724622811251
22915483
14375
36134423320524310212812298854451
6254
Func
tiona
lG
irls
Toile
t

- 283 -TABLE-22.09
DETAILS OF PARTICIPATION AND PROJECTS PRESENTED IN THEPROGRAMME OF NATIONAL CHILDREN’S SCIENCE CONGRESS
(NCSC) IN VARIOUS DISTRICTS OF ASSAM
NOP= No. of Projects; CI= Children Involved.N.B.: NCSC is a programme of National Council for Science and Technology Commu-nication, Dept. of Science and Technology, Govt. of India. In Assam this programmeis also supported by Science and Technology Deptt., Govt. of Assam.Source: Assam Science Technology and Environment Council, G.S. Road, Guwahati-5.
1 2 3 4 5 6 7 8 9
KokrajharDhubriGoalparaBarpetaMorigaonNagaonSonitpurLakhimpurDhemajiTinsukiaDibrugarhSivasagarJorhatGolaghatKarbi AnglongDima HasaoCacharKarimganjHailakandiBongaigaonChirangKamrupKamrup MetroNalbariBaksaDarrangUdalguriBiswanathCharaideoHojaiMajuliSouth SalmaraW.K.AnglongAssam
DistrictNOP CI NOP CI NOP
415240
69224110342522220814
1389255214247333
90213176124168
7099
247103561115189
000000
1947743
470548283
123360359288
12821338
241215208251150250272190283113
36273180548
94202103630295351327
0150
9801
164136
79122106236254244188622162190
90184190
65168112184102
0254188258
70146166618128256225
50164
6121
11715243056
112102109312317
64556183915073657438109661
257379232
13694
131932276
2985
198146
50100156204162160224620170218186164170
34160128280
58130298144324120246174344190248360
36148
6350
2016 2017 2018 2019
CI NOP CI
869222602294
12485
202361
645671
117354748404427278233
1533563
000000
612151
8268436153
118127122
94311
81954292951984569251
0127
94129
357383
30964
126116
2482
3048
9973256178
1028180
112310
85109
938285178064
1402965
14972
16260
12387
17295
124180
1874
3186

- 284 -
TABLE-ENROLMENT AND TEACHER IN HIGH, HIGHER SECONDARY
IN ASSAM,
1 2 3 4 5 6
KokrajharDhubriGoalparaBarpetaMorigaonNagaonSonitpurLakhimpurDhemajiTinsukiaDibrugarhSivasagarJorhatGolaghatKarbi AnglongDima HasaoCacharKarimganjHailakandiBongaigaonChirangKamrupKamrup MetroNalbariBaksaDarrangUdalguriBiswanathCharaideoHojaiMajuliSouth SalmaraW.K.AnglongAssam
District
High School
Num
ber
ofIn
stitu
tions Enrolment
Fem
ale
78121100244102172
78262145
72126124151140
7739
11974406340
22595
145171115
68674560602437
3479
91281580112957190081045515587
917213268
88348072951856697325937356121298
145327565413577365283
1445064168105
1125972506019692031458404195231992776
280223
173762716321321325231775024557157322466716489140191644910470134671667510034
24232514612928
792913443
990525358114261411820645123401092712517
569813803
393747884865
490888
431338391891514
1096457
1063485477867
1050993732284196642163108266221
1069944629670388276287324229149
26121
16777
15391517152632121511275312563521182210481705227319191781
993559
1600771553851726
334515492214304914761078
956738822687260473
50083
Tota
l
Fem
ale
Tota
l
Teacher
Source: UDISE, 2019-20
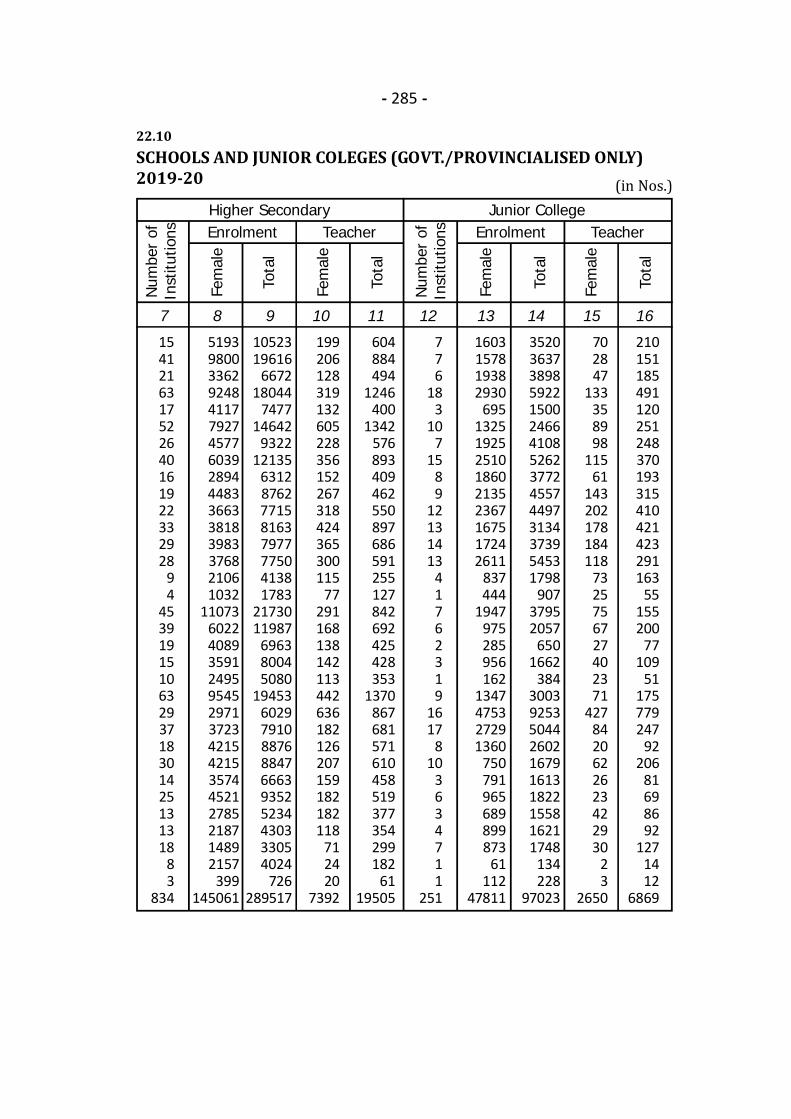
- 285 -
22.10SCHOOLS AND JUNIOR COLEGES (GOVT./PROVINCIALISED ONLY)2019-20 (in Nos.)
7 8 9 10 11 12 13 14 15 16
Num
ber
ofIn
stitu
tions
Junior CollegeEnrolment
Fem
ale
TeacherHigher SecondaryEnrolment Teacher
1052319616
667218044
747714642
932212135
63128762771581637977775041381783
2173011987
696380045080
194536029791088768847666393525234430333054024
726289517
604884494
1246400
1342576893409462550897686591255127842692425428353
1370867681571610458519377354299182
6119505
776
183
107
1589
12131413
41762319
1617
810
3634711
251
1603157819382930
695132519252510186021352367167517242611
837444
1947975285956162
1347475327291360
750791965689899873
61112
47811
352036373898592215002466410852623772455744973134373954531798
90737952057
6501662
3843003925350442602167916131822155816211748
134228
97023
199206128319132605228356152267318424365300115
77291168138142113442636182126207159182182118
712420
7392
1541216317522640161922332928
94
453919151063293718301425131318
83
834
5193980033629248411779274577603928944483366338183983376821061032
11073602240893591249595452971372342154215357445212785218714892157
399145061
210151185491120251248370193315410421423291163
55155200
77109
51175779247
92206
81698692
1271412
6869
702847
133358998
11561
143202178184118
7325756727402371
4278420622623422930
23
2650
Tota
l
Fem
ale
Tota
l
Num
ber
ofIn
stitu
tions
Fem
ale
Tota
l
Fem
ale
Tota
l

.- 286 -
TABLE-22.11DETAILS OF EDUCATIONAL INSTITUTIONS UNDER
DIRECTORATE OF AYUSH IN ASSAM, 2019-20
1 2 3 4 5 6 7 8
Name ofInstitution/
College
Enrolment by sex
Govt. Ayurvedic
College
S J N Homeopathic
Medical College &
Hospital
Dr. J K S
Homeopathic
Medical College &
Hospital
Assam
Homeopathic
Medical College &
Hospital
Cource-wise Enrolment (Nos.)
40
18
16
11
Kamrup
Metro
Kamrup
Metro
Jorhat
Nagaon
Ayurvedic College/ Homeopathic College
UnderGraduate
PostGraduate
AnyOther Male Female
Location/District No. of
Teacher
21
18
16
11
19
0
0
0
0
0
0
0
31
15
11
9
9
3
5
2
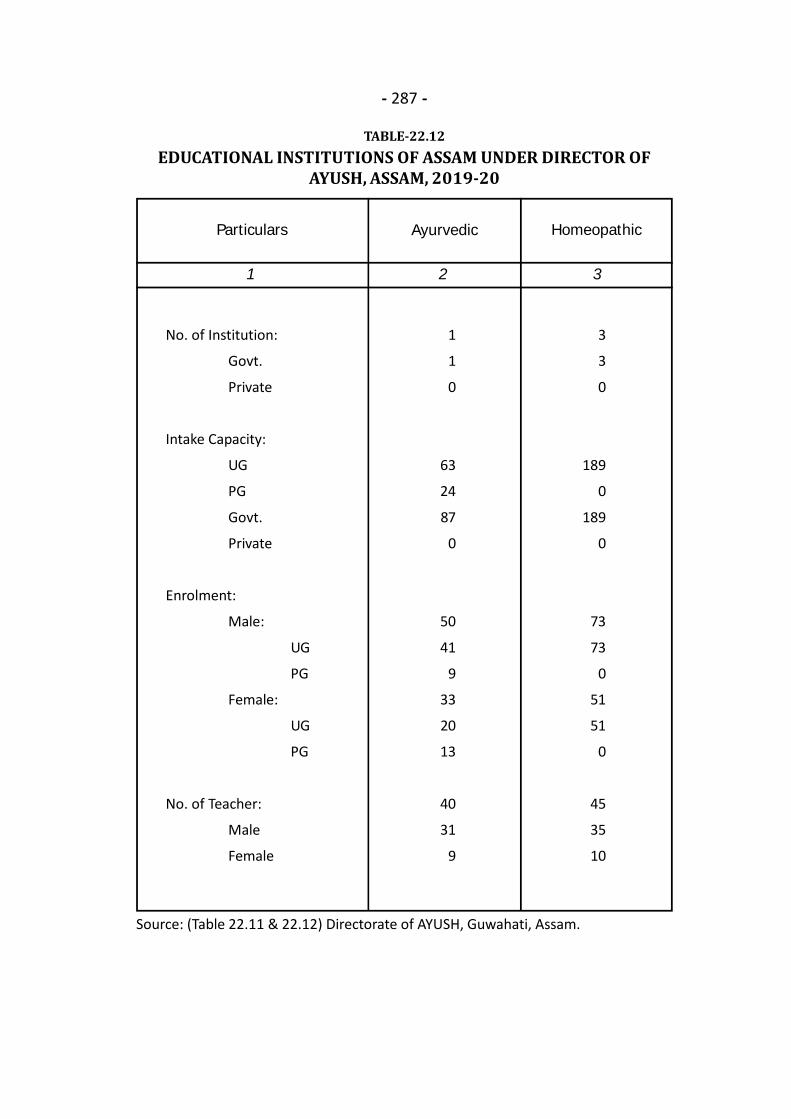
.- 287 -
TABLE-22.12EDUCATIONAL INSTITUTIONS OF ASSAM UNDER DIRECTOR OF
AYUSH, ASSAM, 2019-20
1 2 3
Particulars Homeopathic
No. of Institution:
Govt.
Private
Intake Capacity:
UG
PG
Govt.
Private
Enrolment:
Male:
UG
PG
Female:
UG
PG
No. of Teacher:
Male
Female
3
3
0
189
0
189
0
73
73
0
51
51
0
45
35
10
Ayurvedic
1
1
0
63
24
87
0
50
41
9
33
20
13
40
31
9
Source: (Table 22.11 & 22.12) Directorate of AYUSH, Guwahati, Assam.
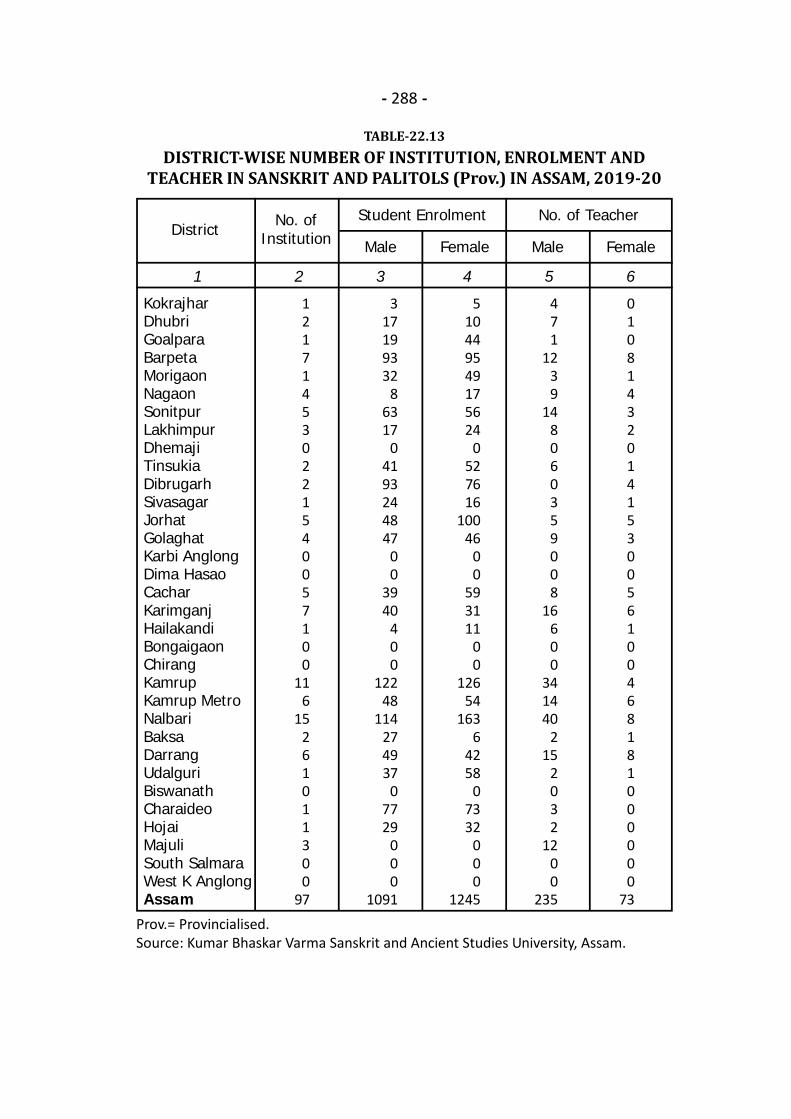
- 288 -
TABLE-22.13DISTRICT-WISE NUMBER OF INSTITUTION, ENROLMENT AND
TEACHER IN SANSKRIT AND PALITOLS (Prov.) IN ASSAM, 2019-20
Prov.= Provincialised.Source: Kumar Bhaskar Varma Sanskrit and Ancient Studies University, Assam.
1 2 3 4 5 6
KokrajharDhubriGoalparaBarpetaMorigaonNagaonSonitpurLakhimpurDhemajiTinsukiaDibrugarhSivasagarJorhatGolaghatKarbi AnglongDima HasaoCacharKarimganjHailakandiBongaigaonChirangKamrupKamrup MetroNalbariBaksaDarrangUdalguriBiswanathCharaideoHojaiMajuliSouth SalmaraWest K AnglongAssam
District No. ofInstitution Male Female Male Female
121714530221540057100
116
15261011300
97
317199332
86317
04193244847
00
3940
400
12248
114274937
07729
000
1091
510449549175624
0527616
10046
00
593111
00
12654
1636
4258
07332
000
1245
471
1239
148060359008
16600
341440
215
2032
1200
235
010814320141530056100468181000000
73
Student Enrolment No. of Teacher
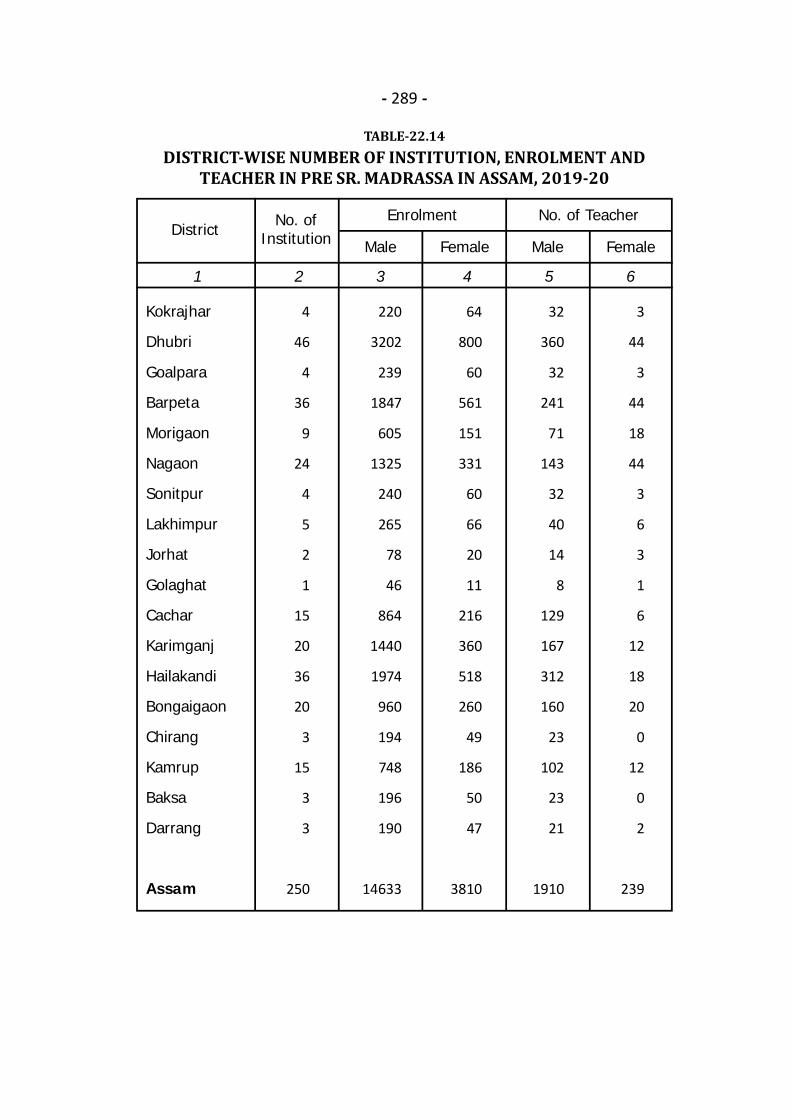
- 289 -
TABLE-22.14DISTRICT-WISE NUMBER OF INSTITUTION, ENROLMENT AND
TEACHER IN PRE SR. MADRASSA IN ASSAM, 2019-20
1 2 3 4 5 6
Kokrajhar
Dhubri
Goalpara
Barpeta
Morigaon
Nagaon
Sonitpur
Lakhimpur
Jorhat
Golaghat
Cachar
Karimganj
Hailakandi
Bongaigaon
Chirang
Kamrup
Baksa
Darrang
Assam
District No. ofInstitution Male Female Male Female
4
46
4
36
9
24
4
5
2
1
15
20
36
20
3
15
3
3
250
220
3202
239
1847
605
1325
240
265
78
46
864
1440
1974
960
194
748
196
190
14633
64
800
60
561
151
331
60
66
20
11
216
360
518
260
49
186
50
47
3810
32
360
32
241
71
143
32
40
14
8
129
167
312
160
23
102
23
21
1910
3
44
3
44
18
44
3
6
3
1
6
12
18
20
0
12
0
2
239
Enrolment No. of Teacher
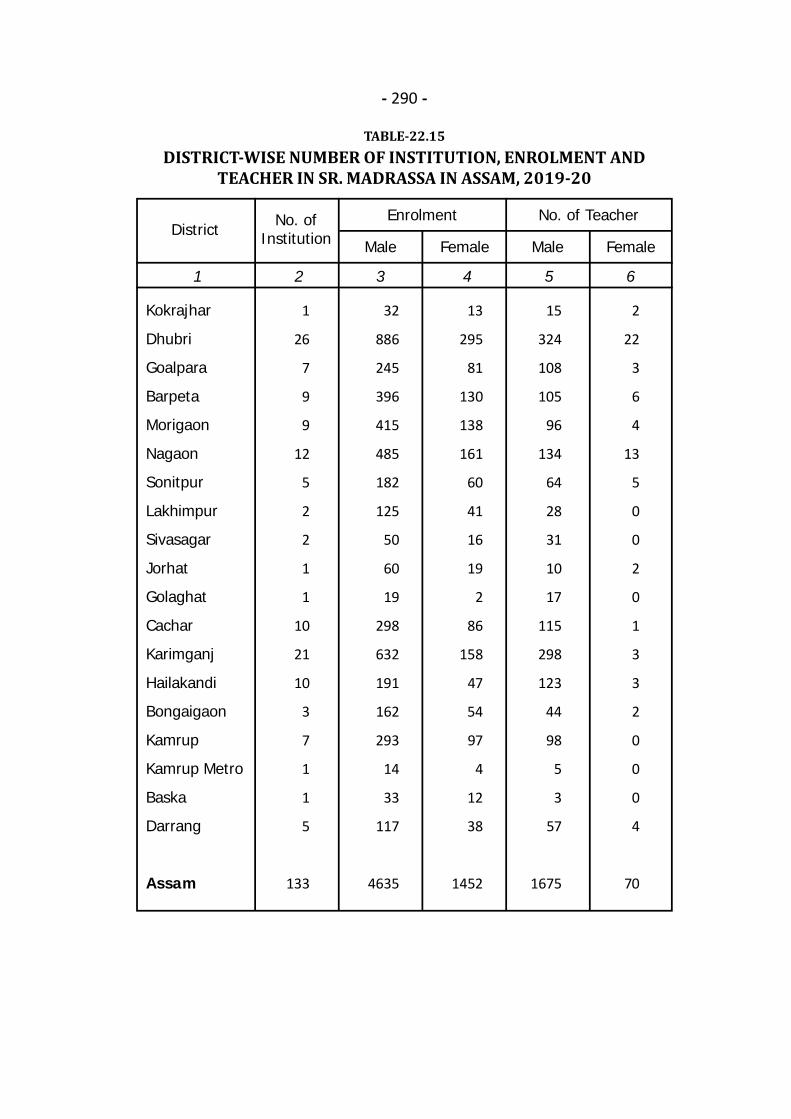
- 290 -
TABLE-22.15DISTRICT-WISE NUMBER OF INSTITUTION, ENROLMENT AND
TEACHER IN SR. MADRASSA IN ASSAM, 2019-20
1 2 3 4 5 6
Kokrajhar
Dhubri
Goalpara
Barpeta
Morigaon
Nagaon
Sonitpur
Lakhimpur
Sivasagar
Jorhat
Golaghat
Cachar
Karimganj
Hailakandi
Bongaigaon
Kamrup
Kamrup Metro
Baska
Darrang
Assam
District No. ofInstitution Male Female Male Female
1
26
7
9
9
12
5
2
2
1
1
10
21
10
3
7
1
1
5
133
32
886
245
396
415
485
182
125
50
60
19
298
632
191
162
293
14
33
117
4635
13
295
81
130
138
161
60
41
16
19
2
86
158
47
54
97
4
12
38
1452
15
324
108
105
96
134
64
28
31
10
17
115
298
123
44
98
5
3
57
1675
2
22
3
6
4
13
5
0
0
2
0
1
3
3
2
0
0
0
4
70
Enrolment No. of Teacher
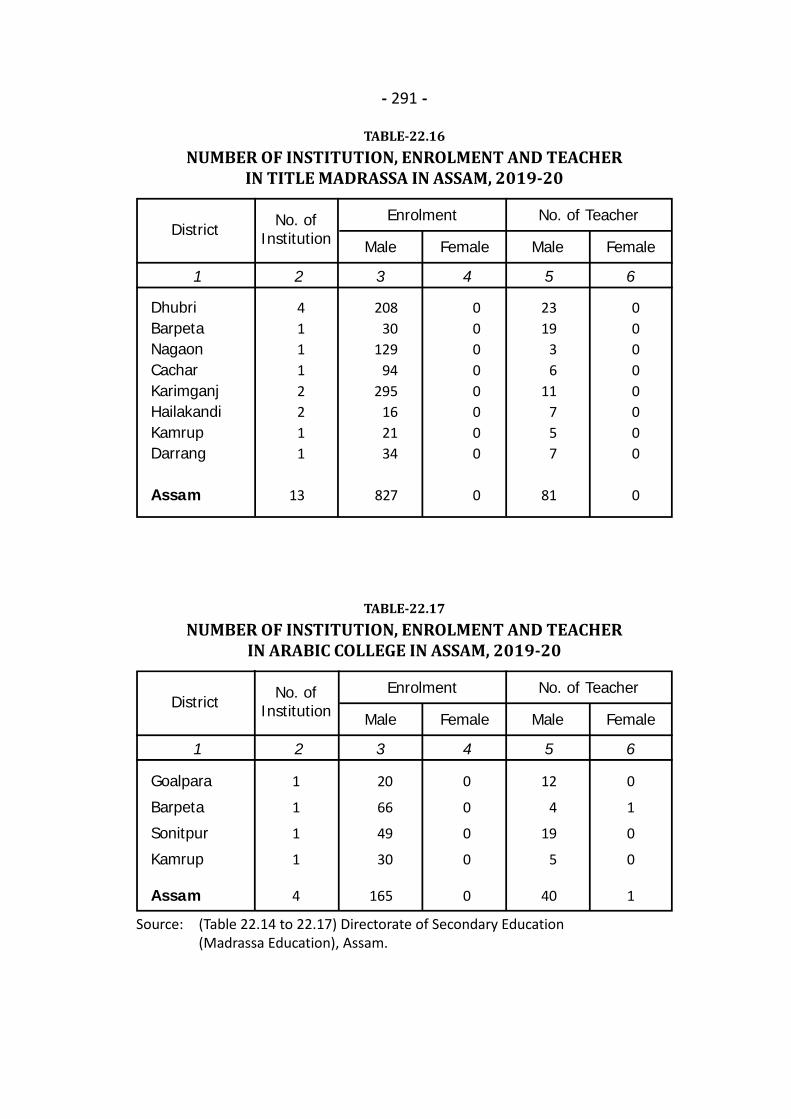
- 291 -
TABLE-22.16NUMBER OF INSTITUTION, ENROLMENT AND TEACHER
IN TITLE MADRASSA IN ASSAM, 2019-20
Source: (Table 22.14 to 22.17) Directorate of Secondary Education(Madrassa Education), Assam.
1 2 3 4 5 6
DhubriBarpetaNagaonCacharKarimganjHailakandiKamrupDarrang
Assam
District No. ofInstitution Male Female Male Female
41112211
13
20830
12994
295162134
827
00000000
0
2319
36
11757
81
00000000
0
Enrolment No. of Teacher
TABLE-22.17NUMBER OF INSTITUTION, ENROLMENT AND TEACHER
IN ARABIC COLLEGE IN ASSAM, 2019-20
1 2 3 4 5 6
Goalpara
Barpeta
Sonitpur
Kamrup
Assam
District No. ofInstitution Male Female Male Female
1
1
1
1
4
20
66
49
30
165
0
0
0
0
0
12
4
19
5
40
0
1
0
0
1
Enrolment No. of Teacher
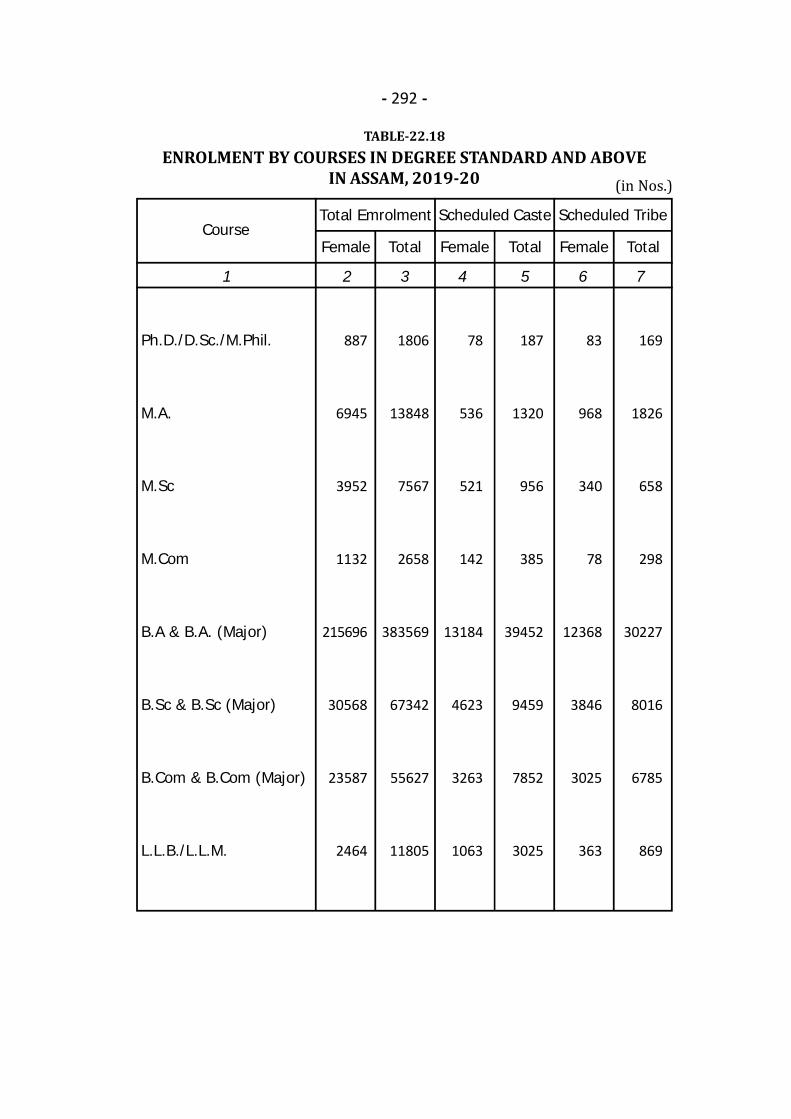
- 292 -
TABLE-22.18ENROLMENT BY COURSES IN DEGREE STANDARD AND ABOVE
IN ASSAM, 2019-20
1 2 3 4 5 6 7
Total Female Total FemaleFemaleCourse
Total
Ph.D./D.Sc./M.Phil.
M.A.
M.Sc
M.Com
B.A & B.A. (Major)
B.Sc & B.Sc (Major)
B.Com & B.Com (Major)
L.L.B./L.L.M.
887
6945
3952
1132
215696
30568
23587
2464
1806
13848
7567
2658
383569
67342
55627
11805
78
536
521
142
13184
4623
3263
1063
187
1320
956
385
39452
9459
7852
3025
83
968
340
78
12368
3846
3025
363
169
1826
658
298
30227
8016
6785
869
Scheduled Caste Scheduled TribeTotal Emrolment
(in Nos.)
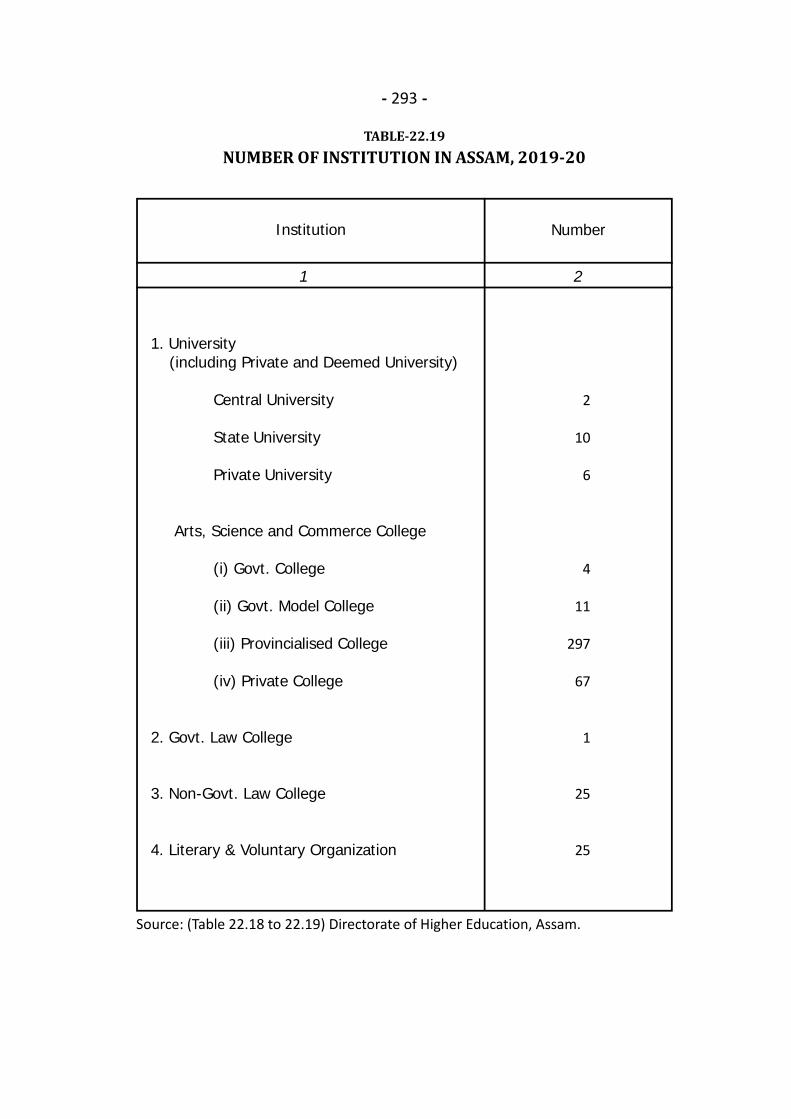
- 293 -
TABLE-22.19NUMBER OF INSTITUTION IN ASSAM, 2019-20
1 2
1. University (including Private and Deemed University)
Central University
State University
Private University
Arts, Science and Commerce College
(i) Govt. College
(ii) Govt. Model College
(iii) Provincialised College
(iv) Private College
2. Govt. Law College
3. Non-Govt. Law College
4. Literary & Voluntary Organization
Institution
2
10
6
4
11
297
67
1
25
25
Number
Source: (Table 22.18 to 22.19) Directorate of Higher Education, Assam.

- 294 -
TABLE-22.20EDUCATIONAL INSTITUTION UNDER
DIRECTOR OF MEDICAL EDUCATION IN ASSAM, 2019
1 2 3 4 5 6 7
Inta
keCa
paci
ty(S
tate
)
Female Total Female
No.
of
Inst
itutio
n(S
tate
)
Institution
Total
Gauhati Medical College,Guwahati
Assam Medical College,Dibrugarh
Silchar Medical College,Silchar
Jorhat Medical College,Jorhat
F.A.A. Medical College,Barpeta
Tezpur Medical College,Tezpur
Regional Dental College,Guwahati
Government DentalCollege, Dibrugarh
Government DentalCollege, Silchar
Regional Nursing College,Guwahati
B.Sc. Nursing College,Dibrugarh
B.Sc. Nursing College,Silchar
1
1
1
1
1
1
1
1
1
1
1
1
200
200
125
125
125
125
50
63
63
60
60
60
60
70
30
50
40
45
30
28
26
60
60
60
200
200
125
125
125
125
50
63
63
60
60
60
184
136
55
59
46
61
18
2
2
26
14
9
468
359
290
162
152
168
41
6
5
26
14
9
EnrolmentNo. of
Teachers
Contd...Source: Directorate of Medical Education, Assam.
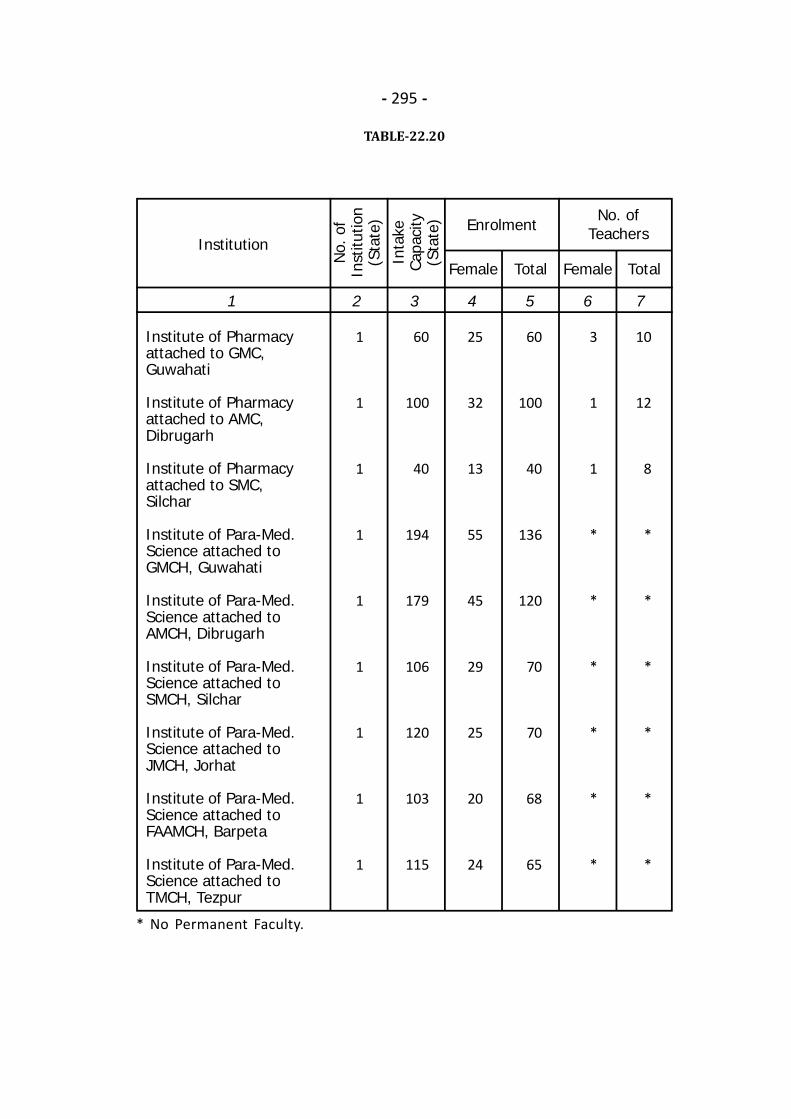
- 295 -
TABLE-22.20
* No Permanent Faculty.
1 2 3 4 5 6 7
Inta
keCa
paci
ty(S
tate
)
Female Total Female
No.
of
Inst
itutio
n(S
tate
)
Institution
Total
Institute of Pharmacyattached to GMC,Guwahati
Institute of Pharmacyattached to AMC,Dibrugarh
Institute of Pharmacyattached to SMC,Silchar
Institute of Para-Med.Science attached toGMCH, Guwahati
Institute of Para-Med.Science attached toAMCH, Dibrugarh
Institute of Para-Med.Science attached toSMCH, Silchar
Institute of Para-Med.Science attached toJMCH, Jorhat
Institute of Para-Med.Science attached toFAAMCH, Barpeta
Institute of Para-Med.Science attached toTMCH, Tezpur
1
1
1
1
1
1
1
1
1
60
100
40
194
179
106
120
103
115
25
32
13
55
45
29
25
20
24
60
100
40
136
120
70
70
68
65
3
1
1
*
*
*
*
*
*
10
12
8
*
*
*
*
*
*
EnrolmentNo. of
Teachers
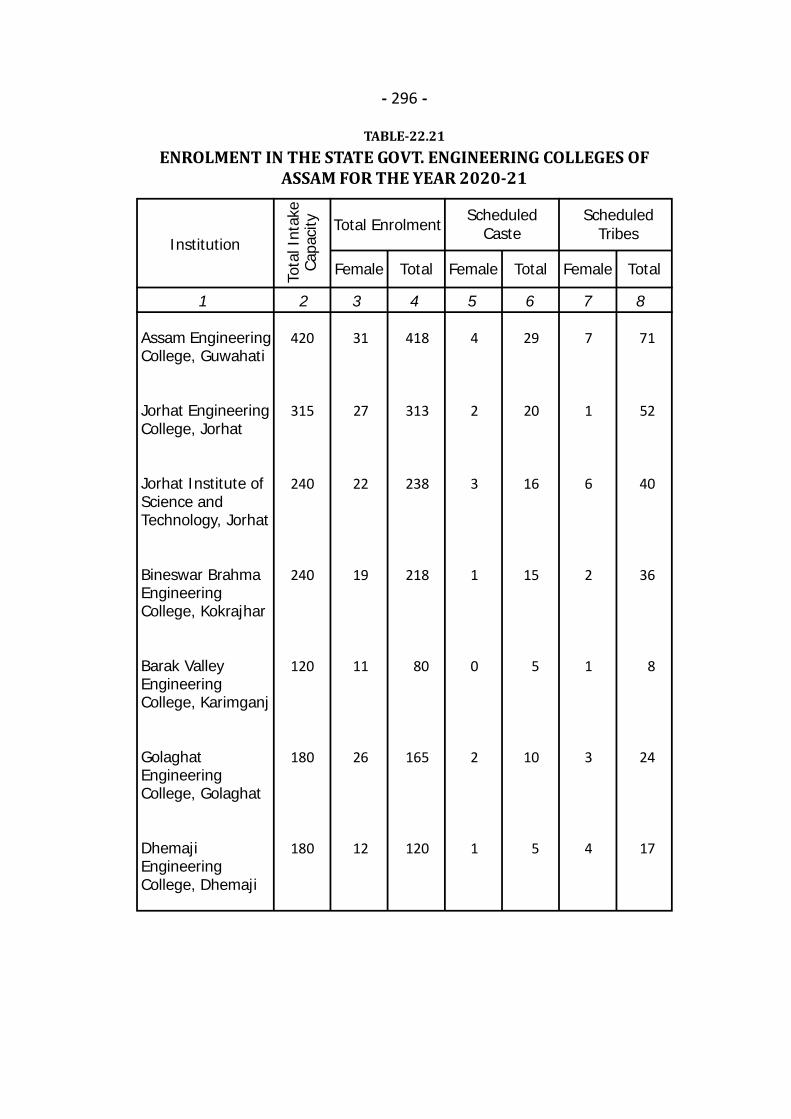
- 296 -
TABLE-22.21ENROLMENT IN THE STATE GOVT. ENGINEERING COLLEGES OF
ASSAM FOR THE YEAR 2020-21
1 2 3 4 5 6 7 8To
tal I
ntak
eCa
paci
ty
Female Total Female
Institution
Total
Assam EngineeringCollege, Guwahati
Jorhat EngineeringCollege, Jorhat
Jorhat Institute ofScience andTechnology, Jorhat
Bineswar BrahmaEngineeringCollege, Kokrajhar
Barak ValleyEngineeringCollege, Karimganj
GolaghatEngineeringCollege, Golaghat
DhemajiEngineeringCollege, Dhemaji
31
27
22
19
11
26
12
418
313
238
218
80
165
120
4
2
3
1
0
2
1
29
20
16
15
5
10
5
7
1
6
2
1
3
4
71
52
40
36
8
24
17
ScheduledCaste
ScheduledTribesTotal Enrolment
Female Total
420
315
240
240
120
180
180

- 297 -
TABLE-22.22ENROLMENT IN THE STATE GOVT. POLYTECHNIC COLLEGES OF
ASSAM FOR THE YEAR 2020-21
1 2 3 4 5 6 7 8To
tal I
ntak
eCa
paci
ty
Female Total Female
Institution
Total
Assam EngineeringInstitute, Guwahati
Diphu Polutechnic,Diphu
Prince of WalesInstitute, Jorhat
Assam Textile Institute,Guwahati
Dibrugarh Polytechnic,Dibrugarh
Bongaigaon PolytechnicBongaigaon
Nowgong Polytechnic,Nagaon
Girls Polytechnic,Guwahati
Silchar Polytechnic,Silchar
Baksa Polytechnic,Baksa
Barpeta Polytechnic,Barpeta
Dhemaji Polytechnic,Dhemaji
Lakhimpur Polytechnic,Lakhimpur
41
6
55
9
34
13
49
120
31
32
42
32
22
285
60
260
61
140
120
170
120
220
178
165
178
176
3
1
4
0
1
1
2
1
1
3
4
3
2
20
4
18
4
9
8
12
8
15
12
12
13
12
2
1
5
2
2
2
3
3
3
4
3
4
3
42
10
44
10
24
20
29
20
37
30
28
28
27
ScheduledCaste
ScheduledTribes
Contd...
TotalEnrolment
Female Total
285
60
260
70
140
120
170
160
220
180
180
180
180
Source: (Table 22.21 & 22.22) Directorate of Technical Education, Assam.
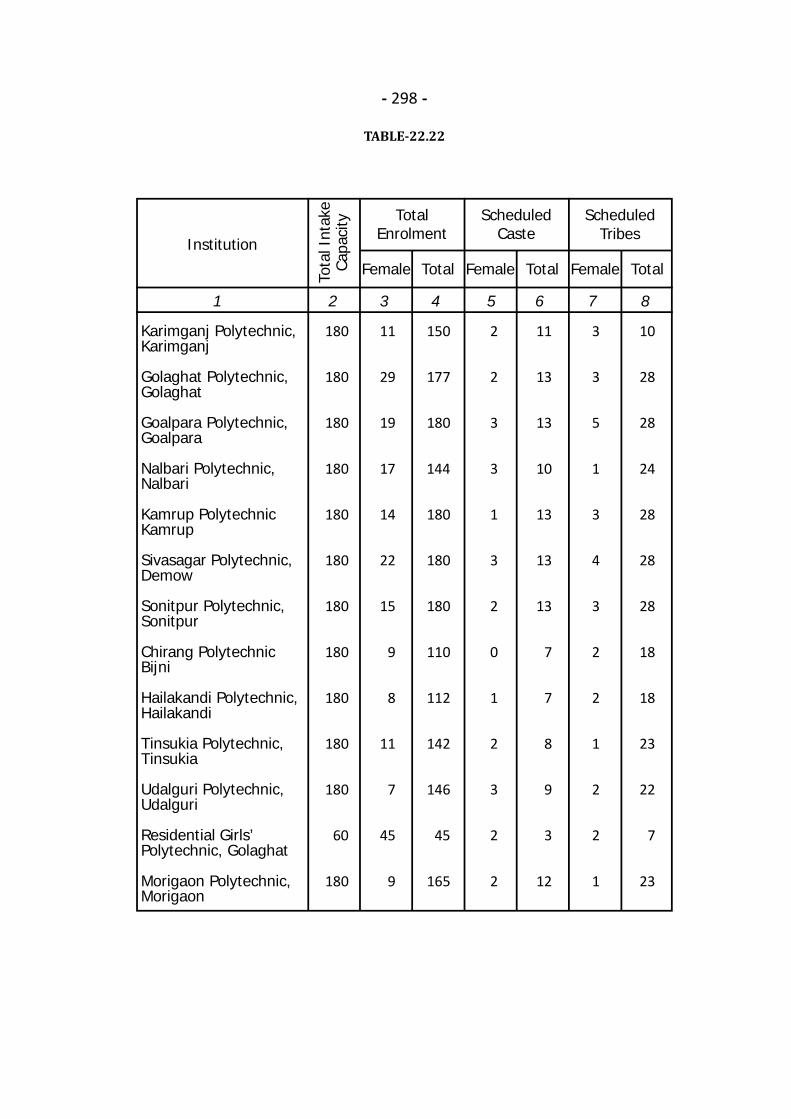
- 298 -
TABLE-22.22
1 2 3 4 5 6 7 8To
tal I
ntak
eCa
paci
ty
Female Total Female
Institution
Total
Karimganj Polytechnic,Karimganj
Golaghat Polytechnic,Golaghat
Goalpara Polytechnic,Goalpara
Nalbari Polytechnic,Nalbari
Kamrup PolytechnicKamrup
Sivasagar Polytechnic,Demow
Sonitpur Polytechnic,Sonitpur
Chirang PolytechnicBijni
Hailakandi Polytechnic,Hailakandi
Tinsukia Polytechnic,Tinsukia
Udalguri Polytechnic,Udalguri
Residential Girls’Polytechnic, Golaghat
Morigaon Polytechnic,Morigaon
11
29
19
17
14
22
15
9
8
11
7
45
9
150
177
180
144
180
180
180
110
112
142
146
45
165
2
2
3
3
1
3
2
0
1
2
3
2
2
11
13
13
10
13
13
13
7
7
8
9
3
12
3
3
5
1
3
4
3
2
2
1
2
2
1
10
28
28
24
28
28
28
18
18
23
22
7
23
ScheduledCaste
ScheduledTribes
TotalEnrolment
Female Total
180
180
180
180
180
180
180
180
180
180
180
60
180
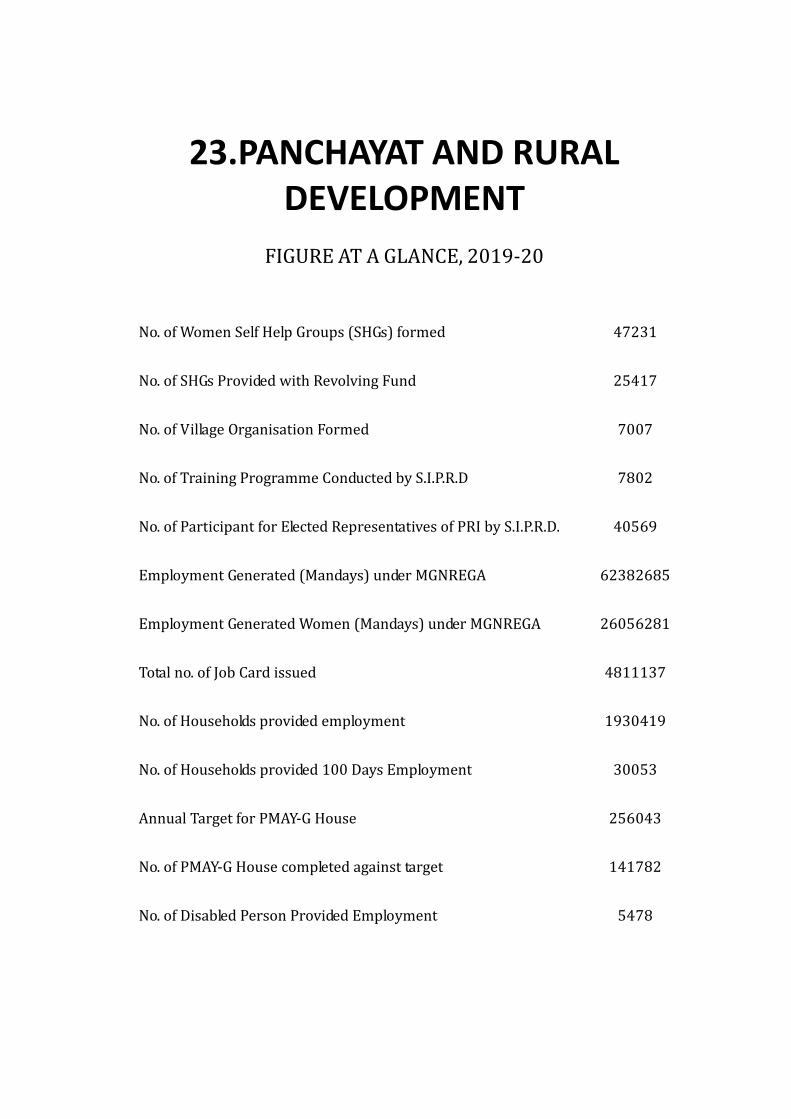
23.PANCHAYAT AND RURALDEVELOPMENTFIGURE AT A GLANCE, 2019-20
No. of Women Self Help Groups (SHGs) formedNo. of SHGs Provided with Revolving FundNo. of Village Organisation FormedNo. of Training Programme Conducted by S.I.P.R.DNo. of Participant for Elected Representatives of PRI by S.I.P.R.D.Employment Generated (Mandays) under MGNREGAEmployment Generated Women (Mandays) under MGNREGATotal no. of Job Card issuedNo. of Households provided employmentNo. of Households provided 100 Days EmploymentAnnual Target for PMAY-G HouseNo. of PMAY-G House completed against targetNo. of Disabled Person Provided Employment
472312541770077802
40569623826852605628148111371930419
30053256043141782
5478

- 300 -
KokrajharDhubriGoalparaBarpetaMorigaonNagaonSonitpurLakhimpurDhemajiTinsukiaDibrugarhSivasagarJorhatGolaghatKarbi AnglongDima HasaoCacharKarimganjHailakandiBongaigaonChirangKamrupKamrup MetroNalbariBaksaDarrangUdalguriBiswanathCharaideoHojaiMajuliSouth SalmaraWest Karbi AnglongAssam
District
20232543215121331128198815683461117717022210
292407
11801237
171298118161205
766342
219159
132832491535129413481028
933322799664
47231
193458256378176317242346110168313140153288198
41391213
98139
26508
7239458241204202
67225
597479
7007
No. of Women SHGformed
No. of VillageOrganisation formed
TABLE-23.01DISTRICT-WISE SELF HELP GROUP (SHG) AND VILLAGE
ORGANISATION (VO) UNDER ASRLMS IN ASSAM, 2019-20
1 2 3
N.B.: ASRLMS = Assam State Rural Livelihood Mission Society.
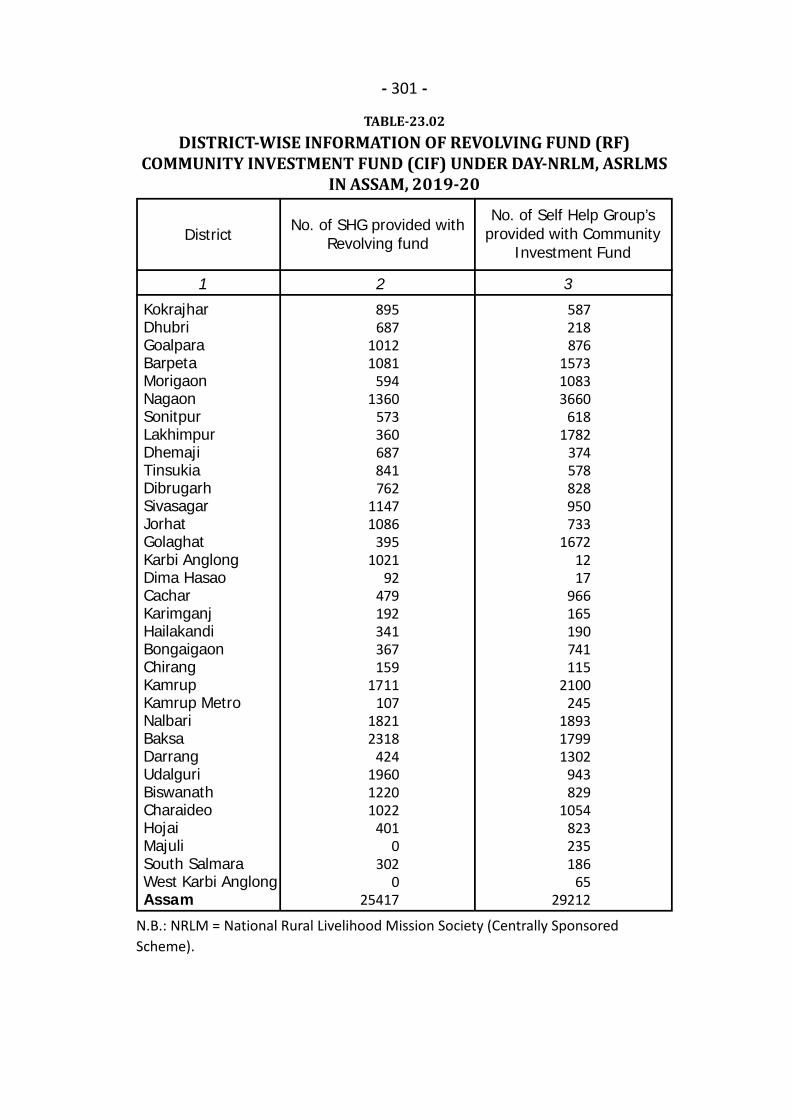
- 301 -
KokrajharDhubriGoalparaBarpetaMorigaonNagaonSonitpurLakhimpurDhemajiTinsukiaDibrugarhSivasagarJorhatGolaghatKarbi AnglongDima HasaoCacharKarimganjHailakandiBongaigaonChirangKamrupKamrup MetroNalbariBaksaDarrangUdalguriBiswanathCharaideoHojaiMajuliSouth SalmaraWest Karbi AnglongAssam
District
895687
10121081
5941360
573360687841762
11471086
3951021
92479192341367159
1711107
18212318
424196012201022
4010
3020
25417
587218876
157310833660
6181782
374578828950733
16721217
966165190741115
2100245
189317991302
943829
1054823235186
6529212
No. of SHG provided withRevolving fund
No. of Self Help Group’sprovided with Community
Investment Fund
TABLE-23.02DISTRICT-WISE INFORMATION OF REVOLVING FUND (RF)
COMMUNITY INVESTMENT FUND (CIF) UNDER DAY-NRLM, ASRLMSIN ASSAM, 2019-20
1 2 3
N.B.: NRLM = National Rural Livelihood Mission Society (Centrally SponsoredScheme).
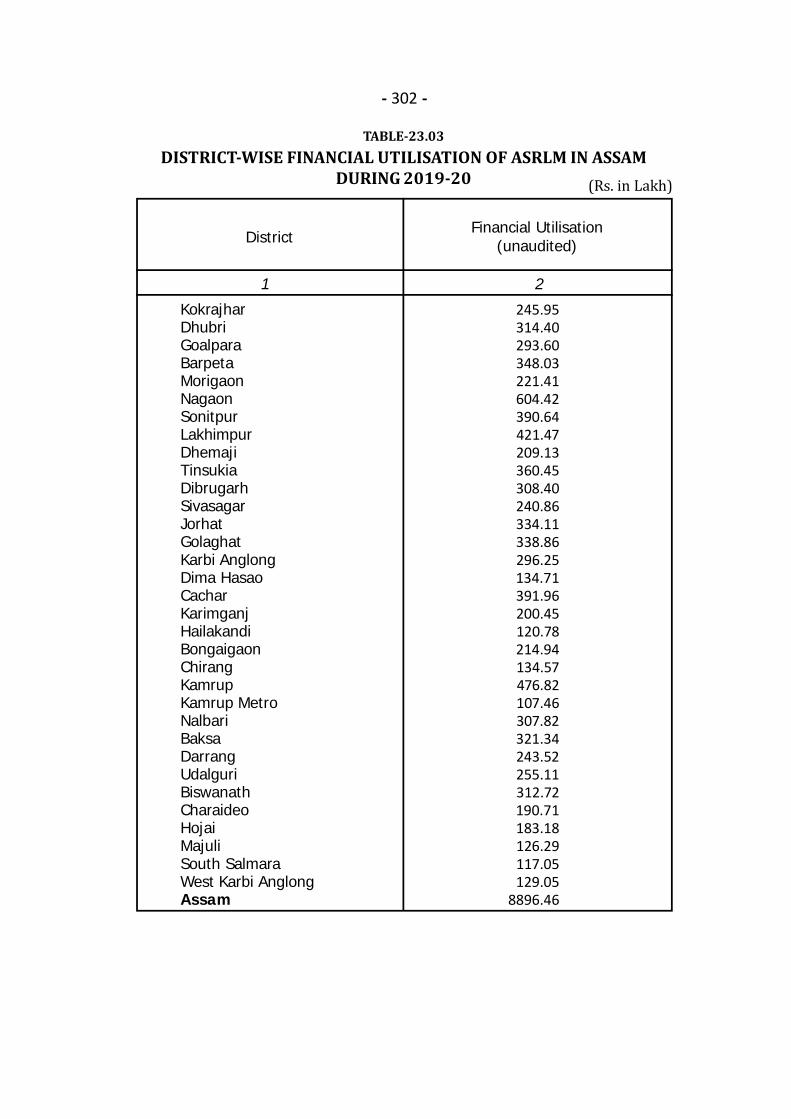
- 302 -
KokrajharDhubriGoalparaBarpetaMorigaonNagaonSonitpurLakhimpurDhemajiTinsukiaDibrugarhSivasagarJorhatGolaghatKarbi AnglongDima HasaoCacharKarimganjHailakandiBongaigaonChirangKamrupKamrup MetroNalbariBaksaDarrangUdalguriBiswanathCharaideoHojaiMajuliSouth SalmaraWest Karbi AnglongAssam
DistrictFinancial Utilisation
(unaudited)
245.95314.40293.60348.03221.41604.42390.64421.47209.13360.45308.40240.86334.11338.86296.25134.71391.96200.45120.78214.94134.57476.82107.46307.82321.34243.52255.11312.72190.71183.18126.29117.05129.05
8896.46
TABLE-23.03DISTRICT-WISE FINANCIAL UTILISATION OF ASRLM IN ASSAM
DURING 2019-20
1 2
(Rs. in Lakh)
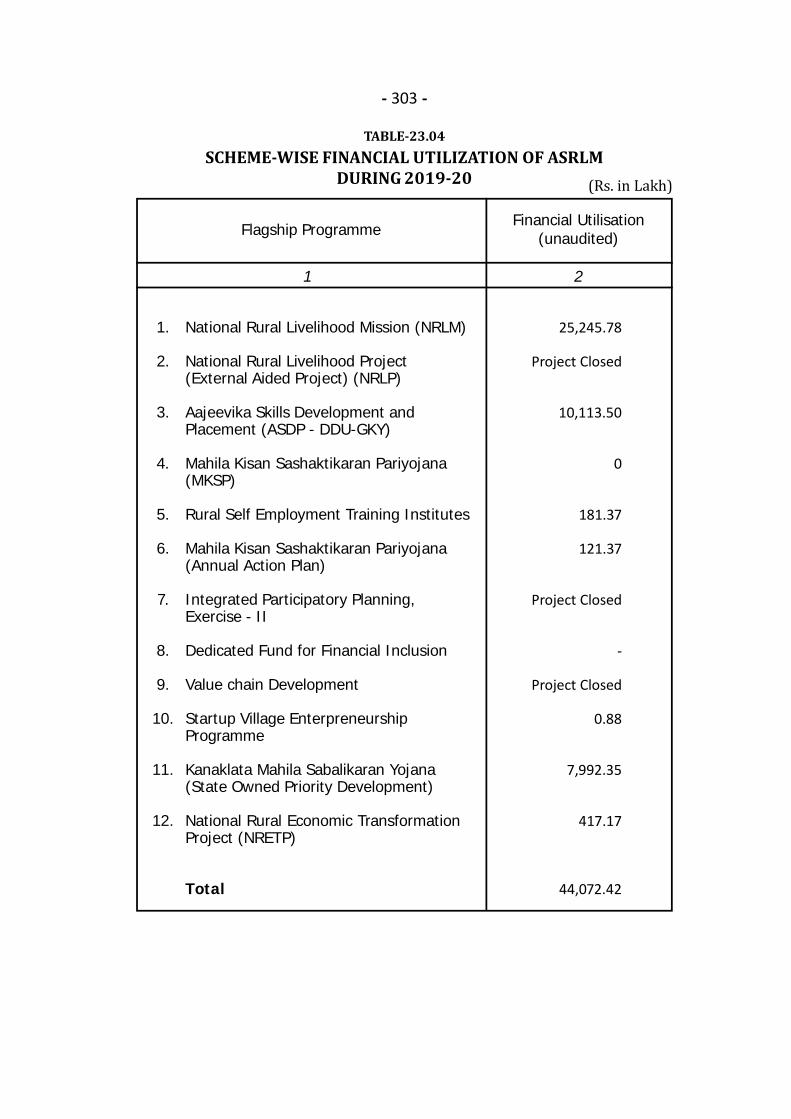
- 303 -
TABLE-23.04SCHEME-WISE FINANCIAL UTILIZATION OF ASRLM
DURING 2019-20
1 2
National Rural Livelihood Mission (NRLM)
National Rural Livelihood Project(External Aided Project) (NRLP)
Aajeevika Skills Development andPlacement (ASDP - DDU-GKY)
Mahila Kisan Sashaktikaran Pariyojana(MKSP)
Rural Self Employment Training Institutes
Mahila Kisan Sashaktikaran Pariyojana(Annual Action Plan)
Integrated Participatory Planning,Exercise - II
Dedicated Fund for Financial Inclusion
Value chain Development
Startup Village EnterpreneurshipProgramme
Kanaklata Mahila Sabalikaran Yojana(State Owned Priority Development)
National Rural Economic TransformationProject (NRETP)
Total
Flagship Programme Financial Utilisation(unaudited)
25,245.78
Project Closed
10,113.50
0
181.37
121.37
Project Closed
-
Project Closed
0.88
7,992.35
417.17
44,072.42
1.
2.
3.
4.
5.
6.
7.
8.
9.
10.
11.
12.
(Rs. in Lakh)
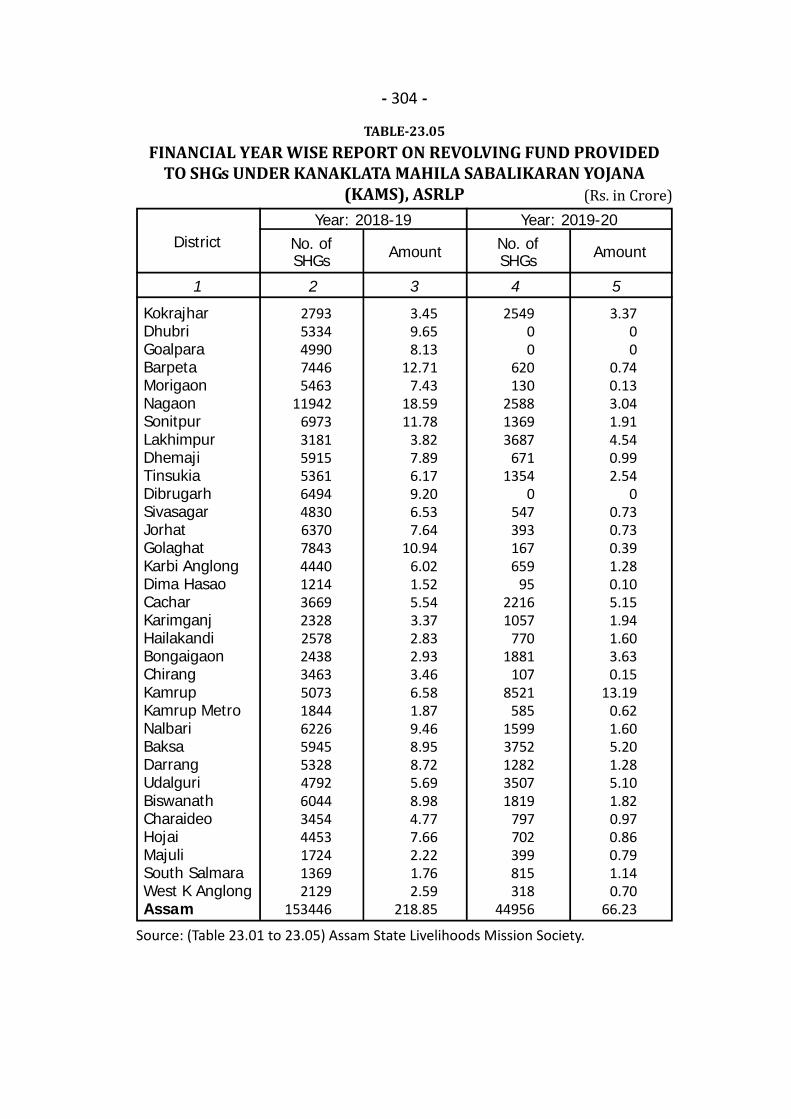
- 304 -
TABLE-23.05FINANCIAL YEAR WISE REPORT ON REVOLVING FUND PROVIDED
TO SHGs UNDER KANAKLATA MAHILA SABALIKARAN YOJANA(KAMS), ASRLP
1 2 3 4 5
KokrajharDhubriGoalparaBarpetaMorigaonNagaonSonitpurLakhimpurDhemajiTinsukiaDibrugarhSivasagarJorhatGolaghatKarbi AnglongDima HasaoCacharKarimganjHailakandiBongaigaonChirangKamrupKamrup MetroNalbariBaksaDarrangUdalguriBiswanathCharaideoHojaiMajuliSouth SalmaraWest K AnglongAssam
District No. ofSHGs Amount
27935334499074465463
11942697331815915536164944830637078434440121436692328257824383463507318446226594553284792604434544453172413692129
153446
3.459.658.13
12.717.43
18.5911.78
3.827.896.179.206.537.64
10.946.021.525.543.372.832.933.466.581.879.468.958.725.698.984.777.662.221.762.59
218.85
254900
620130
258813693687
6711354
0547393167659
9522161057
7701881
1078521
58515993752128235071819
797702399815318
44956
3.3700
0.740.133.041.914.540.992.54
00.730.730.391.280.105.151.941.603.630.15
13.190.621.605.201.285.101.820.970.860.791.140.70
66.23
Year: 2018-19 Year: 2019-20No. ofSHGs Amount
Source: (Table 23.01 to 23.05) Assam State Livelihoods Mission Society.
(Rs. in Crore)
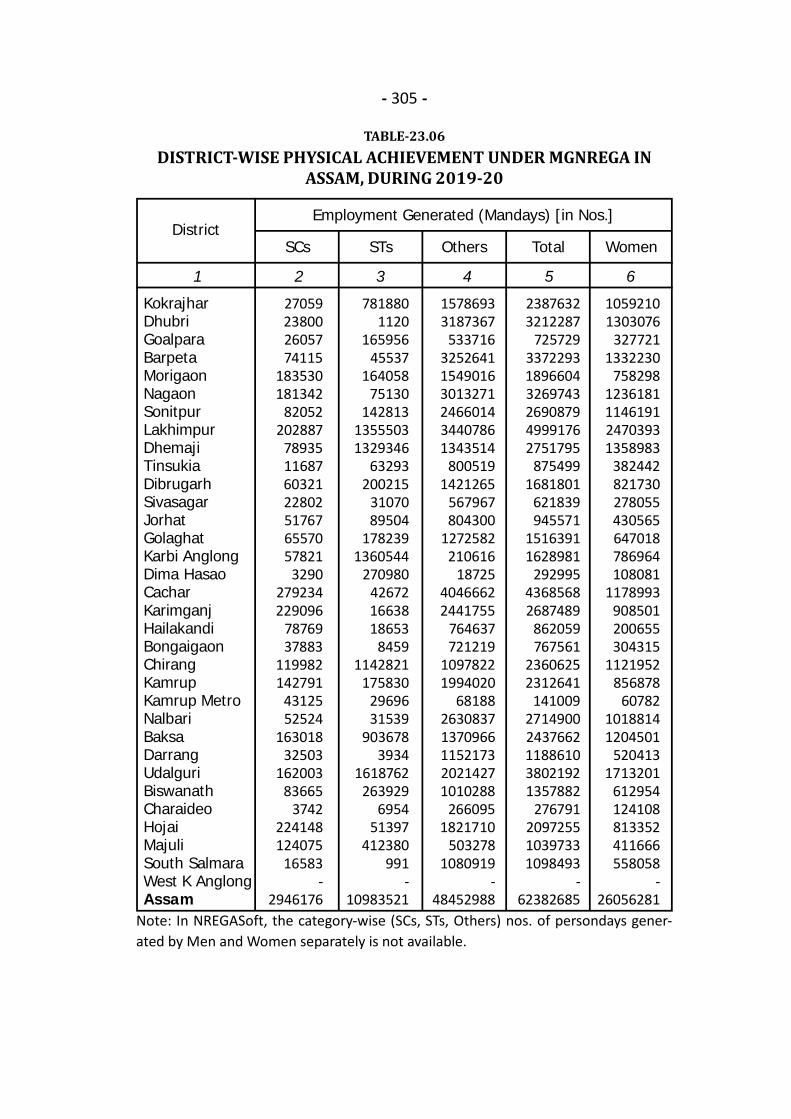
- 305 -
TABLE-23.06DISTRICT-WISE PHYSICAL ACHIEVEMENT UNDER MGNREGA IN
ASSAM, DURING 2019-20
1 2 3 4 5 6
KokrajharDhubriGoalparaBarpetaMorigaonNagaonSonitpurLakhimpurDhemajiTinsukiaDibrugarhSivasagarJorhatGolaghatKarbi AnglongDima HasaoCacharKarimganjHailakandiBongaigaonChirangKamrupKamrup MetroNalbariBaksaDarrangUdalguriBiswanathCharaideoHojaiMajuliSouth SalmaraWest K AnglongAssam
DistrictSCs STs Others Total Women
27059238002605774115
183530181342
82052202887
78935116876032122802517676557057821
3290279234229096
7876937883
119982142791
4312552524
16301832503
16200383665
3742224148124075
16583-
2946176
7818801120
16595645537
16405875130
14281313555031329346
63293200215
3107089504
1782391360544
270980426721663818653
84591142821
1758302969631539
9036783934
1618762263929
695451397
412380991
-10983521
15786933187367
533716325264115490163013271246601434407861343514
8005191421265
567967804300
1272582210616
1872540466622441755
764637721219
10978221994020
6818826308371370966115217320214271010288
2660951821710
5032781080919
-48452988
23876323212287
725729337229318966043269743269087949991762751795
8754991681801
621839945571
15163911628981
29299543685682687489
862059767561
23606252312641
14100927149002437662118861038021921357882
276791209725510397331098493
-62382685
10592101303076
3277211332230
7582981236181114619124703931358983
382442821730278055430565647018786964108081
1178993908501200655304315
1121952856878
6078210188141204501
5204131713201
612954124108813352411666558058
-26056281
Employment Generated (Mandays) [in Nos.]
Note: In NREGASoft, the category-wise (SCs, STs, Others) nos. of persondays gener-ated by Men and Women separately is not available.

- 306 -
TABLE-23.07DISTRICT-WISE JOB CARDS ISSUED AND EMPLOYMENT PROVIDED
IN ASSAM, DURING 2019-20 (in Nos.)
1 2 3 4 5 6
KokrajharDhubriGoalparaBarpetaMorigaonNagaonSonitpurLakhimpurDhemajiTinsukiaDibrugarhSivasagarJorhatGolaghatKarbi AnglongDima HasaoCacharKarimganjHailakandiBongaigaonChirangKamrupKamrup MetroNalbariBaksaDarrangUdalguriBiswanathCharaideoHojaiMajuliSouth SalmaraWest K AnglongAssam
District
Job
Card
issu
ed
176577196010141782289452167904226394168494207404133994167648181378103473142985169835143291
30640248293192690121507113077106060
44308262367137200215931157212165878135702
64847102455
3668159668
-4811137
669949113037569
10915677062
11297888222
1134508485152545927973884352151779687492013450
128711101014
43129354895910688599
5052704849990345976
1042885569018669569292721734831
-2159173
6219779904319119835369224
10303677950
1063967632744800819733397243878711936888011235
1109518915135504315065631277703
4262644949186837110973445043816164497192440932255
-1930419
7921014
1191172
1021303
71310563
875224436121122515
998
1021762
78335
2080961
02118
330364
1307214
50574
1181500
-30053
305179101
2181108
5969
222198
50183
7655835510918434413583
240
15066
181537
33129
2018
-5478
Hou
seho
ldde
man
ded
empl
oym
ent
Hou
seho
ldpr
ovid
edem
ploy
men
t
Hou
seho
ldpr
ovid
ed10
0 da
ysem
ploy
men
t
Dis
able
dpe
rson
spr
ovid
edem
ploy
men
t
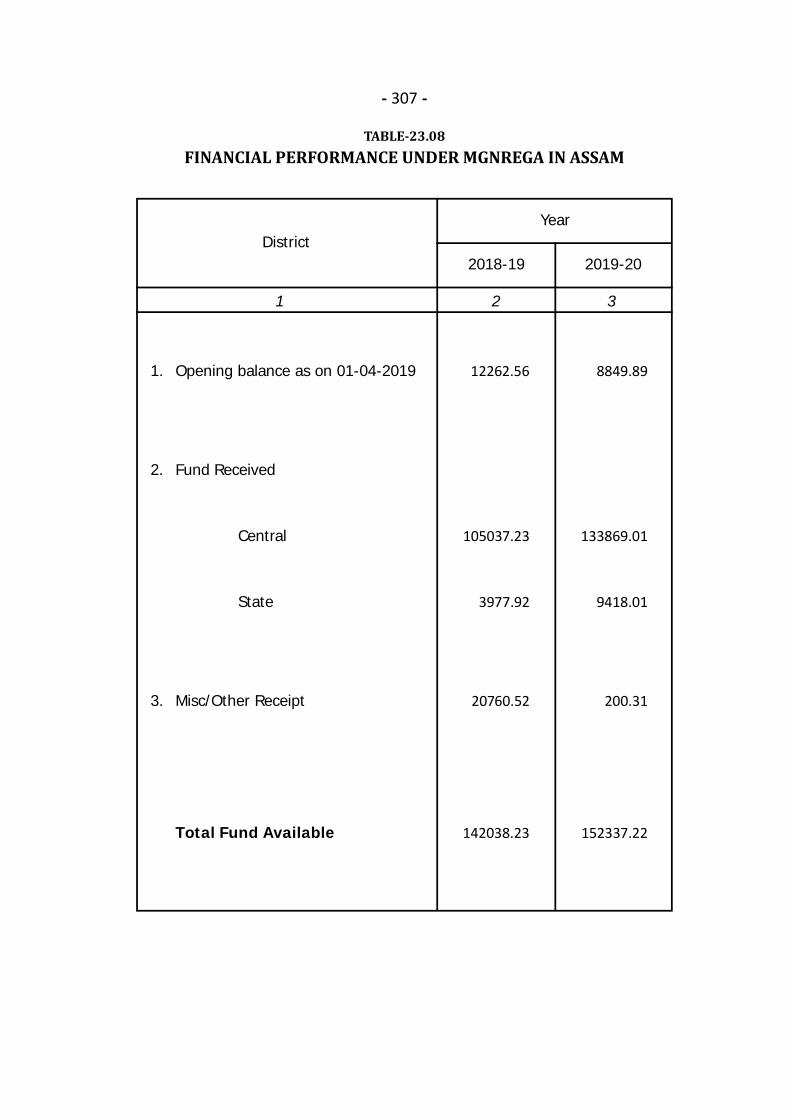
- 307 -
TABLE-23.08FINANCIAL PERFORMANCE UNDER MGNREGA IN ASSAM
1 2 3
Opening balance as on 01-04-2019
Fund Received
Central
State
Misc/Other Receipt
Total Fund Available
District2018-19 2019-20
Year
1.
2.
3.
12262.56
105037.23
3977.92
20760.52
142038.23
8849.89
133869.01
9418.01
200.31
152337.22

- 308 -
TABLE-23.09DISTRICT-WISE TARGET AND PHYSICAL ACHIEVEMENT UNDER
PMAY-G IN ASSAM, 2019-20 (as on 15-12-2020)
1 2 3 4 5
District Annual Target(No. of houses)
HouseCompleted
against TargetSanctioned
% ofachievementagainst target
KokrajharDhubriGoalparaBarpetaMorigaonNagaonSonitpurLakhimpurDhemajiTinsukiaDibrugarhSivasagarJorhatGolaghatKarbi AnglongDima HasaoCacharKarimganjHailakandiBongaigaonChirangKamrupKamrup MetroNalbariBaksaDarrangUdalguriBiswanathCharaideoHojaiMajuliSouth SalmaraWest K AnglongAssam
796410231
543111109
628318218
960573956394
1204111949
27222853
104215631
68311455
89702514267532769266
7983944
1018070015246457354007988
6632800
-215679
979112089
692611181
69532066711411
77316487
1535313627
31072943
1059580581571
1387512422
371831053400
1025710774017
117609970668859665854
11419663
3362-
256043
43314875316555403668
12107632756444862859194302088220271572808
433792870471619206823588274689
3065567848132952271535884308
639813
-141782
4440465053595573755669677568352857574467698164764848444661389624
-55

- 309 -
TABLE-23.10DISTRICT-WISE EXPENDITURE DETAILS IN ASSAM, FOR THE YEAR
2019-20 UNDER PMAY-G (Report as on 15 Dec 2020)
1 2
DistrictUtilization of funds(Amount in Lakh)
KokrajharDhubriGoalparaBarpetaMorigaonNagaonSonitpurLakhimpurDhemajiTinsukiaDibrugarhSivasagarJorhatGolaghatKarbi AnglongDima HasaoCacharKarimganjHailakandiBongaigaonChirangKamrupKamrup MetroNalbariBaksaDarrangUdalguriBiswanathCharaideoHojaiMajuliSouth SalmaraWest Karbi AnglongAssam
7106.486573.554816.016433.604530.47
16766.178712.219418.119109.13
10902.7411365.90
2827.962864.818986.747110.293130.60
13061.049814.032356.642205.813325.04
10244.461052.973154.329018.465845.685239.104034.524739.747319.36
994.271608.59
-204668.75
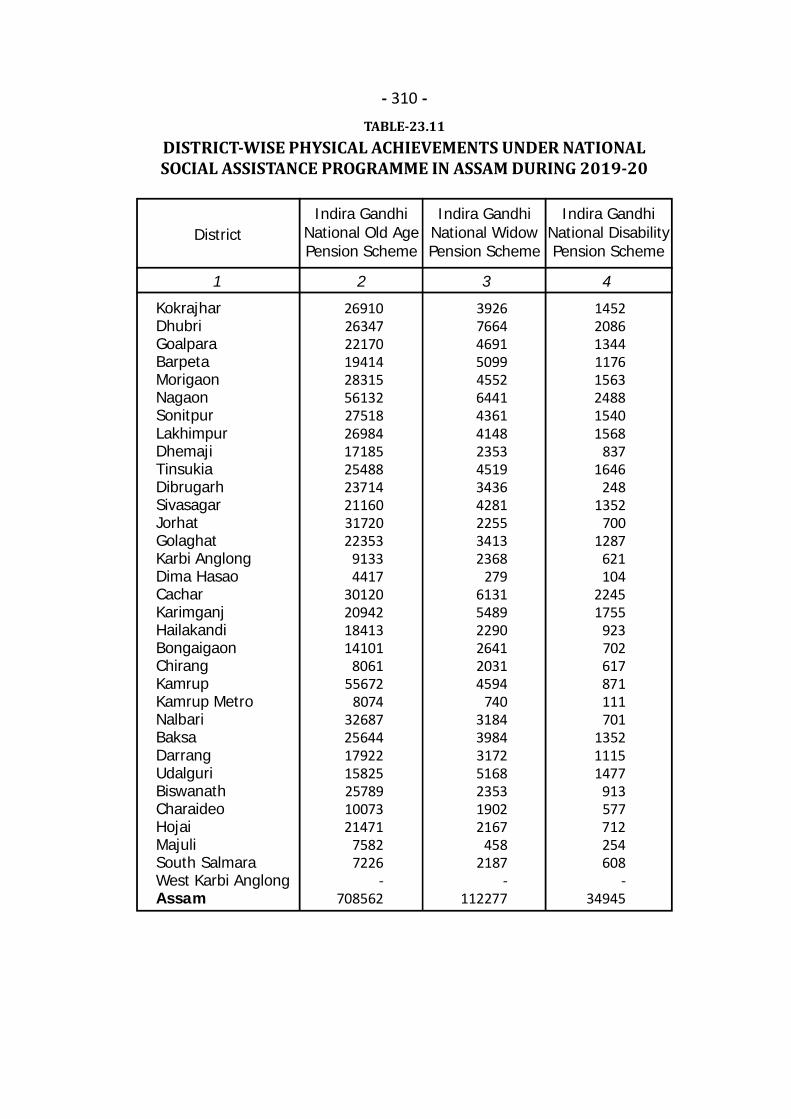
- 310 -TABLE-23.11
DISTRICT-WISE PHYSICAL ACHIEVEMENTS UNDER NATIONALSOCIAL ASSISTANCE PROGRAMME IN ASSAM DURING 2019-20
1 2 3 4
DistrictIndira Gandhi
National Old AgePension Scheme
KokrajharDhubriGoalparaBarpetaMorigaonNagaonSonitpurLakhimpurDhemajiTinsukiaDibrugarhSivasagarJorhatGolaghatKarbi AnglongDima HasaoCacharKarimganjHailakandiBongaigaonChirangKamrupKamrup MetroNalbariBaksaDarrangUdalguriBiswanathCharaideoHojaiMajuliSouth SalmaraWest Karbi AnglongAssam
2691026347221701941428315561322751826984171852548823714211603172022353
91334417
30120209421841314101
806155672
807432687256441792215825257891007321471
75827226
-708562
392676644691509945526441436141482353451934364281225534132368
279613154892290264120314594
7403184398431725168235319022167
4582187
-112277
14522086134411761563248815401568
8371646
2481352
7001287
621104
22451755
923702617871111701
135211151477
913577712254608
-34945
Indira GandhiNational WidowPension Scheme
Indira GandhiNational DisabilityPension Scheme
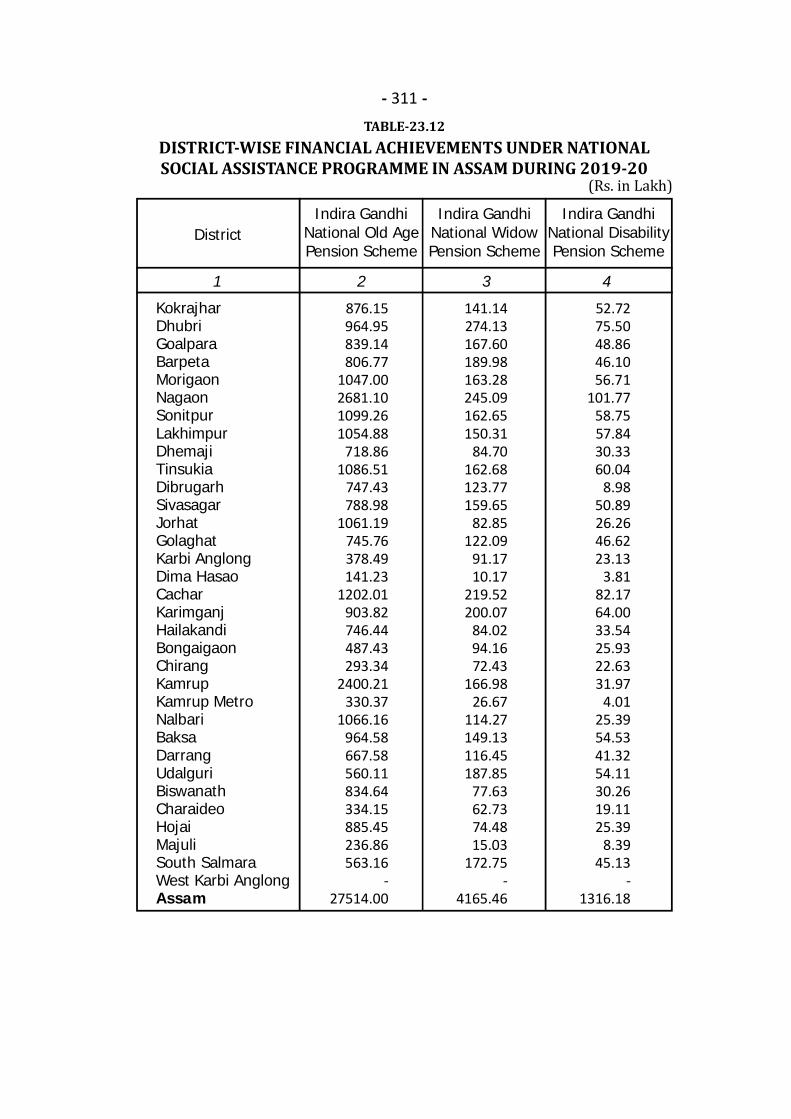
- 311 -TABLE-23.12
DISTRICT-WISE FINANCIAL ACHIEVEMENTS UNDER NATIONALSOCIAL ASSISTANCE PROGRAMME IN ASSAM DURING 2019-20
1 2 3 4
DistrictIndira Gandhi
National Old AgePension Scheme
KokrajharDhubriGoalparaBarpetaMorigaonNagaonSonitpurLakhimpurDhemajiTinsukiaDibrugarhSivasagarJorhatGolaghatKarbi AnglongDima HasaoCacharKarimganjHailakandiBongaigaonChirangKamrupKamrup MetroNalbariBaksaDarrangUdalguriBiswanathCharaideoHojaiMajuliSouth SalmaraWest Karbi AnglongAssam
876.15964.95839.14806.77
1047.002681.101099.261054.88
718.861086.51
747.43788.98
1061.19745.76378.49141.23
1202.01903.82746.44487.43293.34
2400.21330.37
1066.16964.58667.58560.11834.64334.15885.45236.86563.16
-27514.00
141.14274.13167.60189.98163.28245.09162.65150.31
84.70162.68123.77159.65
82.85122.09
91.1710.17
219.52200.07
84.0294.1672.43
166.9826.67
114.27149.13116.45187.85
77.6362.7374.4815.03
172.75-
4165.46
52.7275.5048.8646.1056.71
101.7758.7557.8430.3360.04
8.9850.8926.2646.6223.13
3.8182.1764.0033.5425.9322.6331.97
4.0125.3954.5341.3254.1130.2619.1125.39
8.3945.13
-1316.18
Indira GandhiNational WidowPension Scheme
Indira GandhiNational DisabilityPension Scheme
(Rs. in Lakh)
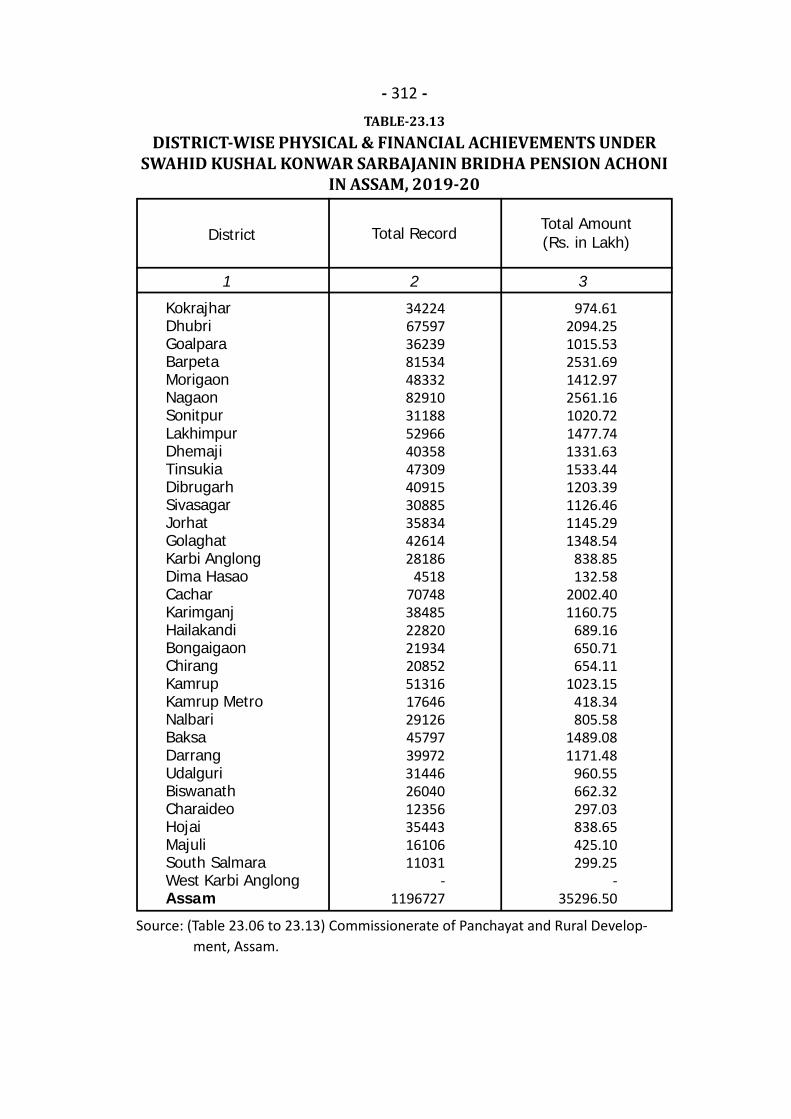
- 312 -TABLE-23.13
DISTRICT-WISE PHYSICAL & FINANCIAL ACHIEVEMENTS UNDERSWAHID KUSHAL KONWAR SARBAJANIN BRIDHA PENSION ACHONI
IN ASSAM, 2019-20
1 2 3
DistrictTotal Amount(Rs. in Lakh)
KokrajharDhubriGoalparaBarpetaMorigaonNagaonSonitpurLakhimpurDhemajiTinsukiaDibrugarhSivasagarJorhatGolaghatKarbi AnglongDima HasaoCacharKarimganjHailakandiBongaigaonChirangKamrupKamrup MetroNalbariBaksaDarrangUdalguriBiswanathCharaideoHojaiMajuliSouth SalmaraWest Karbi AnglongAssam
342246759736239815344833282910311885296640358473094091530885358344261428186
451870748384852282021934208525131617646291264579739972314462604012356354431610611031
-1196727
Total Record
974.612094.251015.532531.691412.972561.161020.721477.741331.631533.441203.391126.461145.291348.54
838.85132.58
2002.401160.75
689.16650.71654.11
1023.15418.34805.58
1489.081171.48
960.55662.32297.03838.65425.10299.25
-35296.50
Source: (Table 23.06 to 23.13) Commissionerate of Panchayat and Rural Develop- ment, Assam.

- 313 -TABLE-23.14
DISTRICT WISE TRAINING PROGRAMME CONDUCTED BY STATEINSTITUTE OF PANCHAYAT & RURAL DEVELOPMENT (SIPRD),
ASSAM, DURING 2019-20
1 2 3 4 5
DistrictTarget (in Nos.) Achievement (in Nos.)
KokrajharDhubriGoalparaBarpetaMorigaonNagaonSonitpurLakhimpurDhemajiTinsukiaDibrugarhSivasagarJorhatGolaghatKarbi AnglongDima HasaoCacharKarimganjHailakandiBongaigaonChirangKamrupKamrup MetroNalbariBaksaDarrangUdalguriBiswanathCharaideoHojaiMajuliSouth SalmaraWest K AnglongAssam
300360320350380400290310250300320290300260190290280300340300300400350300280300300290150300200280190
9770
19900165001760019300195002180016000170001400016200173001630016700145001030016000155001630018800165001650020900178001700015900164001640016000
850016300111001550010300
534600
190200297183253330298342275390414305165136156195289290270210156370325
9387
220209275178248115181157
7802
83301015817788
810021115148541330913767116601555016584136801390011310
72361001210580158541491010676
69452221019447
49044588
100301015412281
763111106
968392146798
394364
Programme Participant Programme Participant
Source: State Institute of Panchayat & Rural Development, Assam.

.
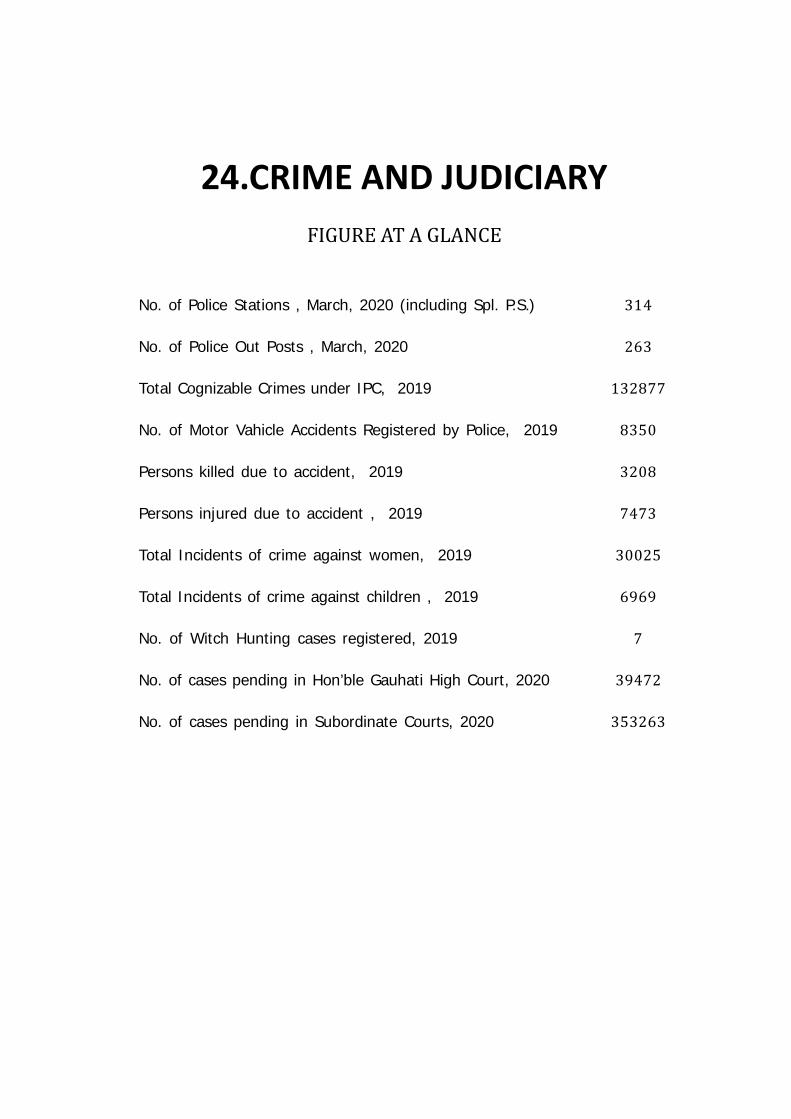
24.CRIME AND JUDICIARYFIGURE AT A GLANCENo. of Police Stations , March, 2020 (including Spl. P.S.)
No. of Police Out Posts , March, 2020
Total Cognizable Crimes under IPC, 2019
No. of Motor Vahicle Accidents Registered by Police, 2019
Persons killed due to accident, 2019
Persons injured due to accident , 2019
Total Incidents of crime against women, 2019
Total Incidents of crime against children , 2019
No. of Witch Hunting cases registered, 2019
No. of cases pending in Hon’ble Gauhati High Court, 2020
No. of cases pending in Subordinate Courts, 2020
314263132877835032087473300256969739472353263
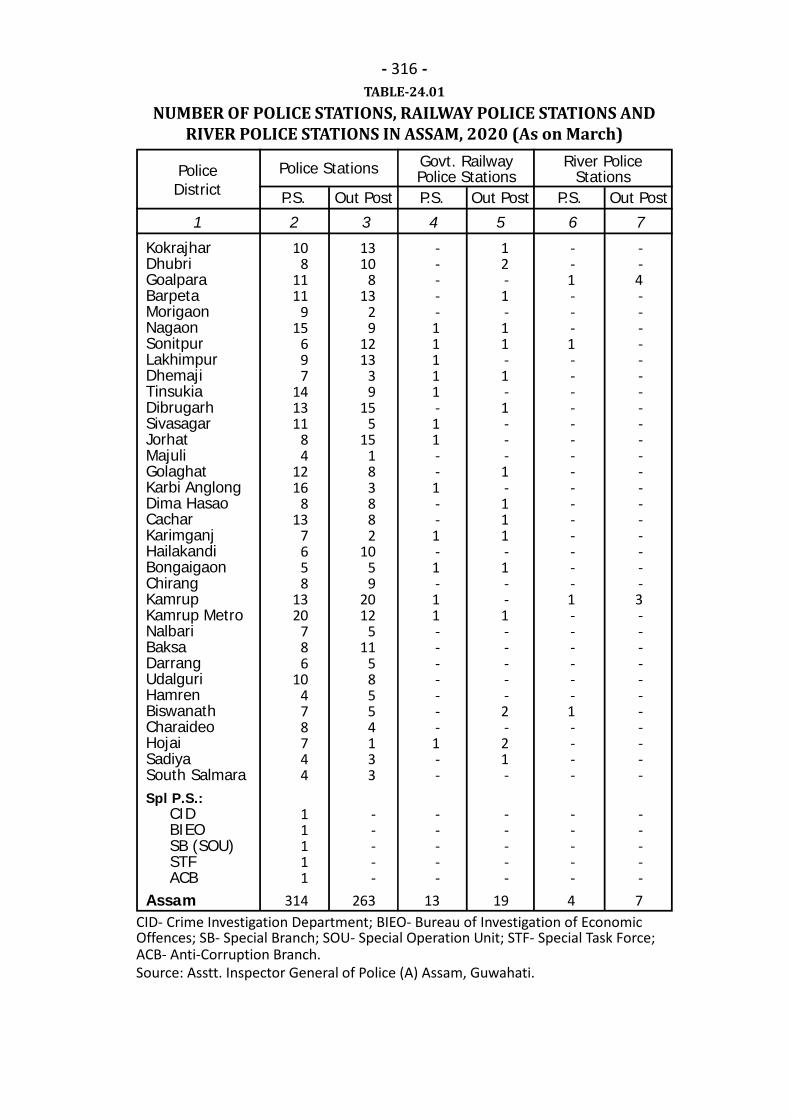
- 316 -TABLE-24.01
NUMBER OF POLICE STATIONS, RAILWAY POLICE STATIONS ANDRIVER POLICE STATIONS IN ASSAM, 2020 (As on March)
CID- Crime Investigation Department; BIEO- Bureau of Investigation of EconomicOffences; SB- Special Branch; SOU- Special Operation Unit; STF- Special Task Force;ACB- Anti-Corruption Branch.Source: Asstt. Inspector General of Police (A) Assam, Guwahati.
1 2 3 4 5 6 7
KokrajharDhubriGoalparaBarpetaMorigaonNagaonSonitpurLakhimpurDhemajiTinsukiaDibrugarhSivasagarJorhatMajuliGolaghatKarbi AnglongDima HasaoCacharKarimganjHailakandiBongaigaonChirangKamrupKamrup MetroNalbariBaksaDarrangUdalguriHamrenBiswanathCharaideoHojaiSadiyaSouth SalmaraSpl P.S.: CID BIEO SB (SOU) STF ACBAssam
PoliceDistrict P.S. Out Post P.S. Out Post P.S. Out Post
108
1111
915
697
141311
84
1216
813
7658
1320
786
10478744
11111
314
1310
813
29
1213
39
155
15183882
1059
2012
511
58554133
-----
263
-----11111-11--1--1-1-11-------1--
-----
13
12-1-11-1-1---1-111-1--1-----2-21-
-----
19
--1---1---------------1------1----
-----4
--4-------------------3-----------
-----7
Police Stations Govt. RailwayPolice Stations
River PoliceStations
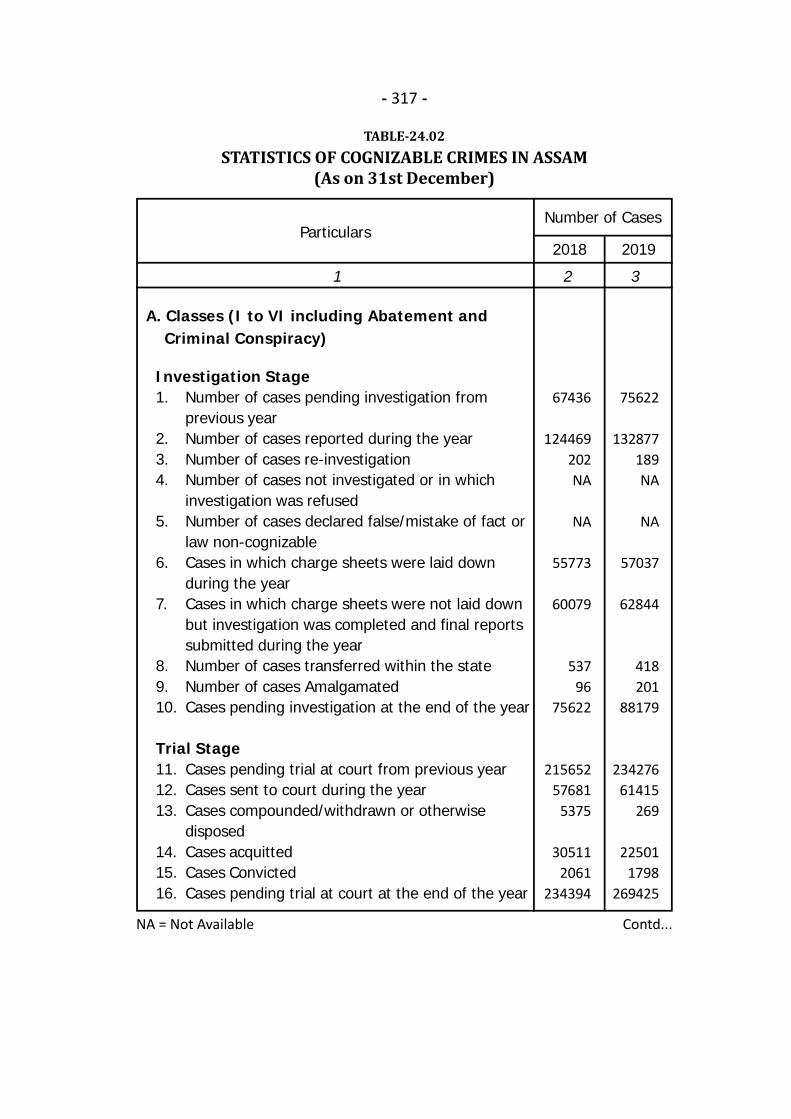
- 317 -
TABLE-24.02STATISTICS OF COGNIZABLE CRIMES IN ASSAM
(As on 31st December)
Contd...
1 2 3
A. Classes (I to VI including Abatement and Criminal Conspiracy)
2018 2019
Number of cases pending investigation fromprevious yearNumber of cases reported during the yearNumber of cases re-investigationNumber of cases not investigated or in whichinvestigation was refusedNumber of cases declared false/mistake of fact orlaw non-cognizableCases in which charge sheets were laid downduring the yearCases in which charge sheets were not laid downbut investigation was completed and final reportssubmitted during the yearNumber of cases transferred within the stateNumber of cases AmalgamatedCases pending investigation at the end of the year
Cases pending trial at court from previous yearCases sent to court during the yearCases compounded/withdrawn or otherwisedisposedCases acquittedCases ConvictedCases pending trial at court at the end of the year
67436
124469202NA
NA
55773
60079
53796
75622
21565257681
5375
305112061
234394
75622
132877189NA
NA
57037
62844
418201
88179
23427661415
269
225011798
269425
ParticularsNumber of Cases
Investigation Stage1.
2.3.4.
5.
6.
7.
8.9.10.
Trial Stage11.12.13.
14.15.16.
NA = Not Available
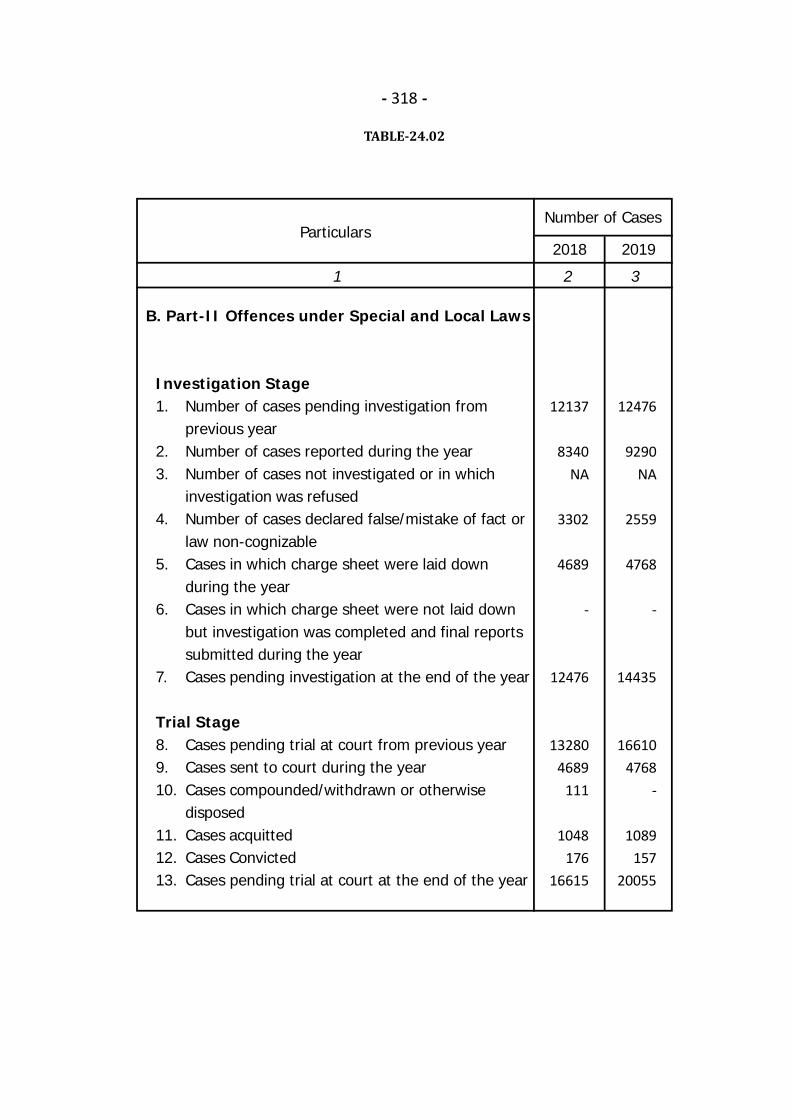
- 318 -
TABLE-24.02
1 2 3
B. Part-II Offences under Special and Local Laws
2018 2019
Number of cases pending investigation fromprevious yearNumber of cases reported during the yearNumber of cases not investigated or in whichinvestigation was refusedNumber of cases declared false/mistake of fact orlaw non-cognizableCases in which charge sheet were laid downduring the yearCases in which charge sheet were not laid downbut investigation was completed and final reportssubmitted during the yearCases pending investigation at the end of the year
Cases pending trial at court from previous yearCases sent to court during the yearCases compounded/withdrawn or otherwisedisposedCases acquittedCases ConvictedCases pending trial at court at the end of the year
12137
8340NA
3302
4689
-
12476
132804689
111
1048176
16615
12476
9290NA
2559
4768
-
14435
166104768
-
1089157
20055
ParticularsNumber of Cases
Investigation Stage1.
2.3.
4.
5.
6.
7.
Trial Stage8.9.10.
11.12.13.
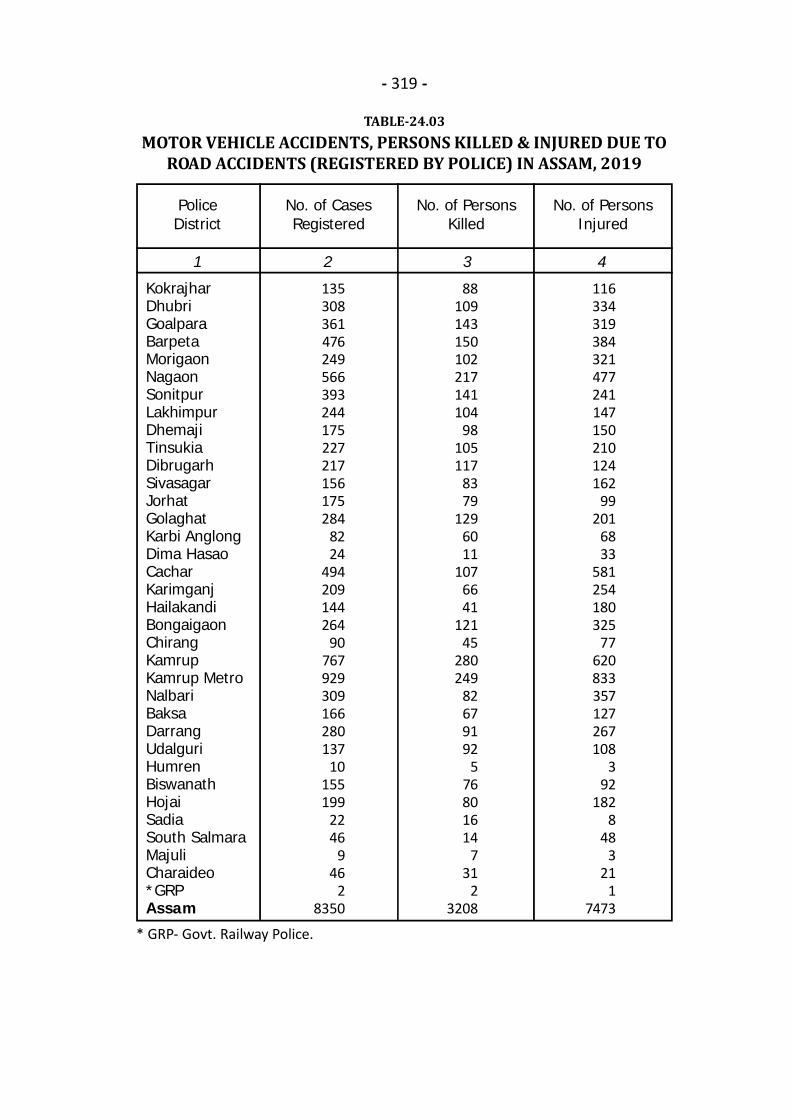
- 319 -
TABLE-24.03MOTOR VEHICLE ACCIDENTS, PERSONS KILLED & INJURED DUE TO
ROAD ACCIDENTS (REGISTERED BY POLICE) IN ASSAM, 2019
1 2 3 4
KokrajharDhubriGoalparaBarpetaMorigaonNagaonSonitpurLakhimpurDhemajiTinsukiaDibrugarhSivasagarJorhatGolaghatKarbi AnglongDima HasaoCacharKarimganjHailakandiBongaigaonChirangKamrupKamrup MetroNalbariBaksaDarrangUdalguriHumrenBiswanathHojaiSadiaSouth SalmaraMajuliCharaideo*GRPAssam
PoliceDistrict
135308361476249566393244175227217156175284
8224
494209144264
90767929309166280137
10155199
2246
946
28350
88109143150102217141104
98105117
8379
1296011
1076641
12145
280249
82679192
576801614
731
23208
116334319384321477241147150210124162
99201
6833
581254180325
77620833357127267108
392
1828
483
211
7473
No. of CasesRegistered
No. of PersonsKilled
No. of PersonsInjured
* GRP- Govt. Railway Police.
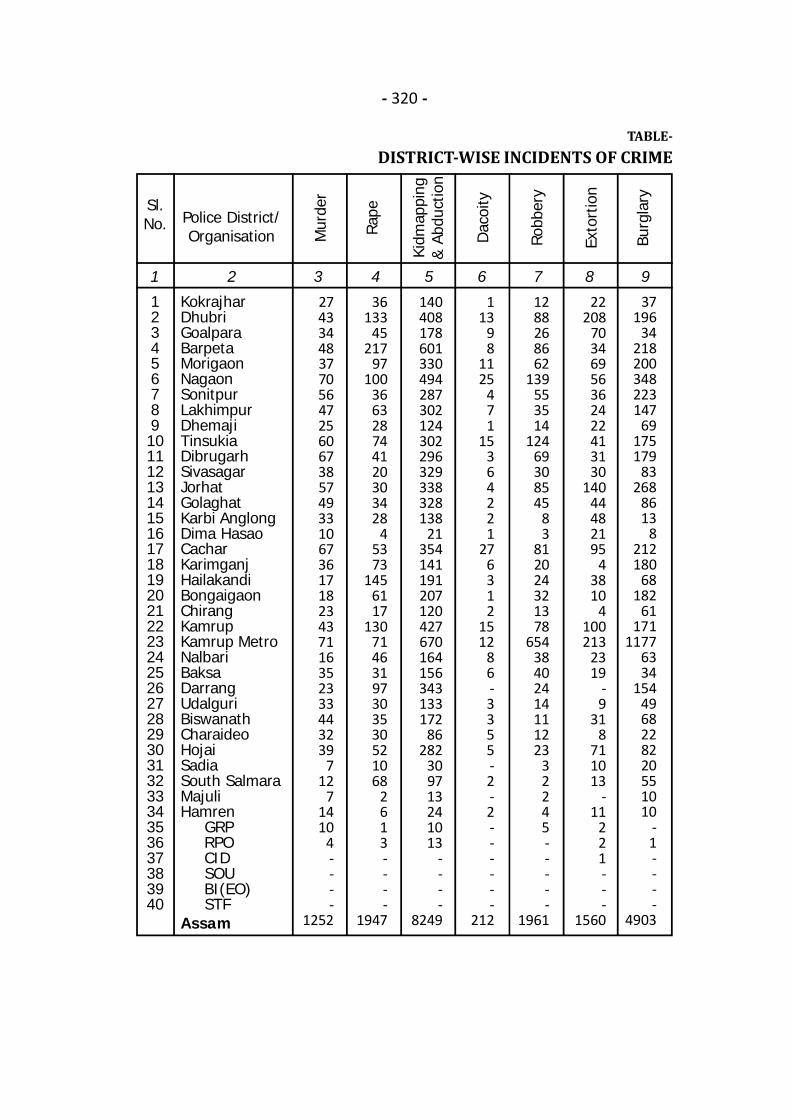
- 320 -
TABLE-DISTRICT-WISE INCIDENTS OF CRIME
1 2 3 4 5 6 7 8 9
KokrajharDhubriGoalparaBarpetaMorigaonNagaonSonitpurLakhimpurDhemajiTinsukiaDibrugarhSivasagarJorhatGolaghatKarbi AnglongDima HasaoCacharKarimganjHailakandiBongaigaonChirangKamrupKamrup MetroNalbariBaksaDarrangUdalguriBiswanathCharaideoHojaiSadiaSouth SalmaraMajuliHamren GRP RPO CID SOU BI(EO) STFAssam
Sl.No. Police District/
Organisation Mur
der
Rape
Kidm
appi
ng&
Abd
uctio
n
Dac
oity
Robb
ery
Exto
rtio
n
12345678910111213141516171819202122232425262728293031323334353637383940
274334483770564725606738574933106736171823437116352333443239
712
71410
4----
1252
36133
45217
97100
366328744120303428
45373
1456117
13071463197303530521068
2613----
1947
140408178601330494287302124302296329338328138
21354141191207120427670164156343133172
86282
309713241013
----
8249
113
98
1125
471
15364221
276312
1512
86-3355-2-2------
212
1288268662
139553514
12469308545
83
812024321378
65438402414111223
32245-----
1961
22208
70346956362422413130
14044482195
43810
4100213
2319
-9
318
711013
-11
221---
1560
37196
34218200348223147
69175179
83268
8613
8212180
68182
61171
11776334
1544968228220551010
-1----
4903
Burg
lary

- 321 -
24.04UNDER I.P.C. IN ASSAM, 2019
10 11 12 13 14 15 16 17 18 1
Sl.No.Ri
ot
211728174308335595181200
93211548195339300143
41528136
97196137258
1374137163253117
9597
1405
56101475
410
-2-
8506
2731016
348730329853399308187675710461871388188
471057
351224329
88586
4328260167215181169
85181
57156
1633
36011
4---
16641
51178
375125
1811326
-84
16339
3791548
4110
3210
57
91608
601922
825
146
-33
-11
--3-7-
2392
66380142317248303228213
97295228179278197
523464
14290
16045
2442265
8666
230465530
220151813
622
-3---
7077
1-1214------1-3-111214
42222---1----------
72
9244720196049222397526026712203
96221792959189734962189
457152
4689217522321740
659526591781756
9812854
7251030
4342089
1771176
161150
733210
-12
576951
159575628295731938557914403033921549409947643116595233771019
305689431883149275010447236
1935425291556398912421643
7523183
3301696
224261492
7121
-19
5129771
12345678910111213141516171819202122232425262728293031323334353637383940
Crim
inal
Brea
ch T
rust
Chea
ting
Thef
t
Coun
ter
feiti
ng
Oth
er I
PC
Tota
l Cog
.un
der
IPC
Min
or A
ct.
5179
118549812212207518
45-1-
8427
10614
9765
7-
2511
-7
891
63--95----
1168
180682908469762741908509421135921642431053123311629136771162
346742233243246294611817494
2072826661719424213591738
8493323
3351752
234275567
7531
-21
5138277
Tota
l Cog
.Cr
ime

- 322 -
TABLE-24.05INCIDENCE OF CRIMES COMMITTED AGAINST WOMEN AND
CHILDREN IN ASSAM
1 2 3
2018 2019
CRIME AGAINST WOMAN
Rape
Kidnapping and Abduction
Dowry Death
Cruelty by Husband
Molestation
Sexual Harassment
Importation of Girls
Immoral Traffic Prevention Act.
Indecent Representation of Woman
Dowry Prohibition Act.
Other Crimes Against Woman
CRIME AGAINST CHILDREN
Murder
Prevention of Child Sexual Offence Act,2012
Kidnapping and Abduction (Children)
Procuration of Minor Giris
Selling of Girls for Prostitution
Others
1648
6359
174
11136
4180
811
-
37
-
1138
2508
39
1721
2865
1109
8
-
1773
6989
156
11943
4619
781
-
12
-
1377
2375
31
1779
3742
1415
2
-
Heads
A.
(1)
(2)
(3)
(4)
(5)
(6)
(7)
(8)
(9)
(10)
(11)
B.
(1)
(2)
(3)
(4)
(5)
(6)
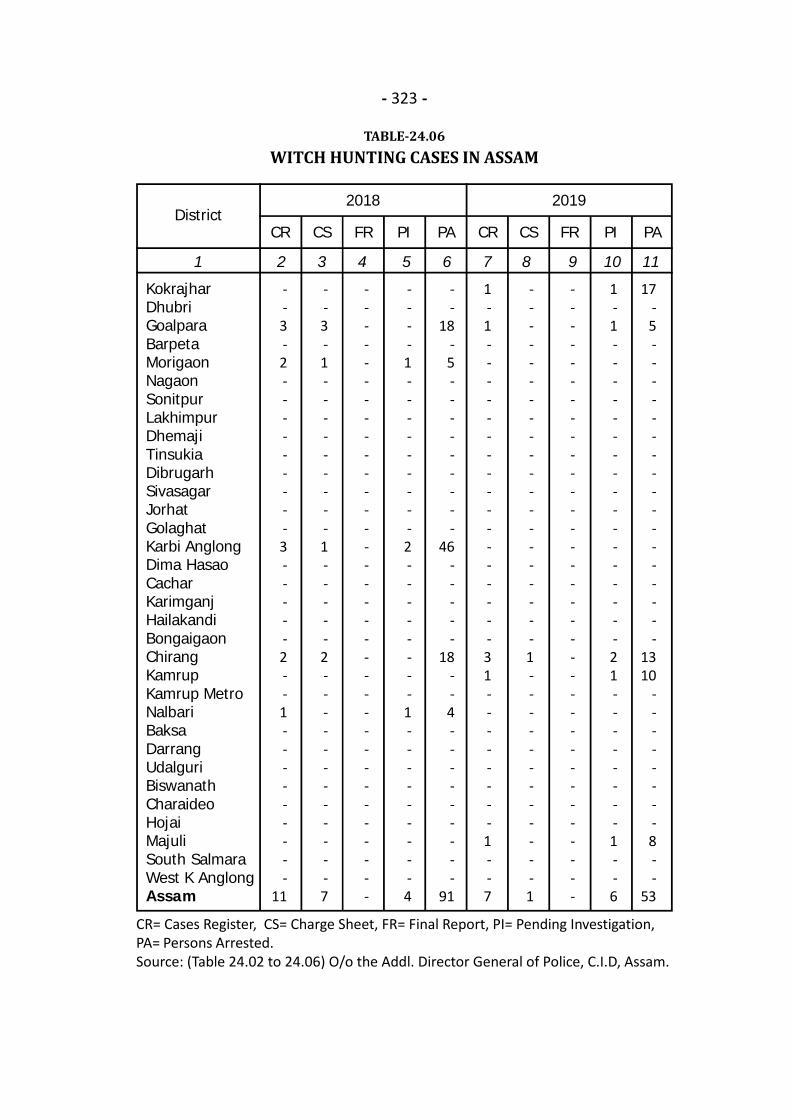
- 323 -
TABLE-24.06WITCH HUNTING CASES IN ASSAM
CR= Cases Register, CS= Charge Sheet, FR= Final Report, PI= Pending Investigation,PA= Persons Arrested.Source: (Table 24.02 to 24.06) O/o the Addl. Director General of Police, C.I.D, Assam.
1 2 3 4 5 6 7 8 9 10 11
KokrajharDhubriGoalparaBarpetaMorigaonNagaonSonitpurLakhimpurDhemajiTinsukiaDibrugarhSivasagarJorhatGolaghatKarbi AnglongDima HasaoCacharKarimganjHailakandiBongaigaonChirangKamrupKamrup MetroNalbariBaksaDarrangUdalguriBiswanathCharaideoHojaiMajuliSouth SalmaraWest K AnglongAssam
DistrictFR PI PA CR CS FR PI PA
--3-2---------3-----2--1---------
11
--3-1---------1-----2------------7
----------------------------------
----1---------2--------1---------4
--
18-5---------
46-----
18--4---------
91
1-1-----------------31--------1--7
17-5-----------------
1310
--------8--
53
CR CS
20192018
--------------------1------------1
----------------------------------
1-1-----------------21--------1--6
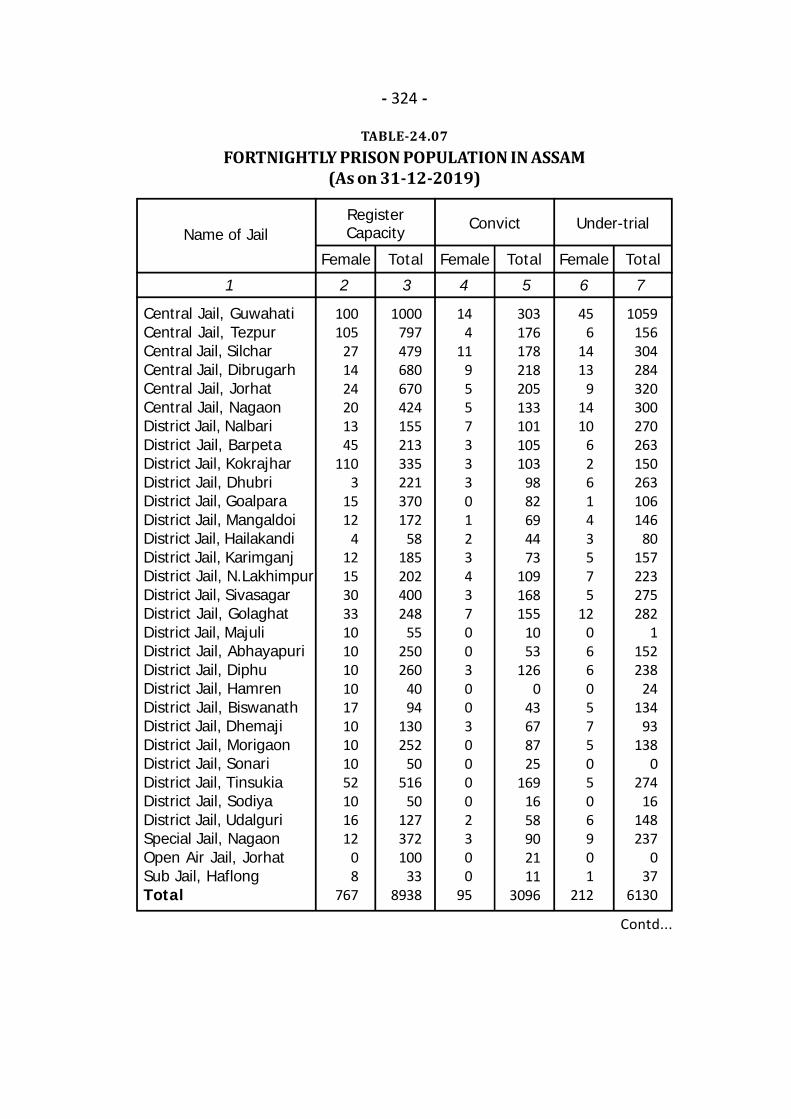
- 324 -
TABLE-24.07FORTNIGHTLY PRISON POPULATION IN ASSAM
(As on 31-12-2019)
1 2 3 4 5 6 7
Total Female Total FemaleFemale
Name of Jail
Total
Central Jail, GuwahatiCentral Jail, TezpurCentral Jail, SilcharCentral Jail, DibrugarhCentral Jail, JorhatCentral Jail, NagaonDistrict Jail, NalbariDistrict Jail, BarpetaDistrict Jail, KokrajharDistrict Jail, DhubriDistrict Jail, GoalparaDistrict Jail, MangaldoiDistrict Jail, HailakandiDistrict Jail, KarimganjDistrict Jail, N.LakhimpurDistrict Jail, SivasagarDistrict Jail, GolaghatDistrict Jail, MajuliDistrict Jail, AbhayapuriDistrict Jail, DiphuDistrict Jail, HamrenDistrict Jail, BiswanathDistrict Jail, DhemajiDistrict Jail, MorigaonDistrict Jail, SonariDistrict Jail, TinsukiaDistrict Jail, SodiyaDistrict Jail, UdalguriSpecial Jail, NagaonOpen Air Jail, JorhatSub Jail, HaflongTotal
100105
271424201345
1103
1512
412153033101010101710101052101612
08
767
1000797479680670424155213335221370172
58185202400248
55250260
4094
130252
50516
50127372100
338938
144
119557333012343700300300002300
95
303176178218205133101105103
9882694473
109168155
1053
1260
43678725
1691658902111
3096
456
1413
91410
626143575
1206605750506901
212
1059156304284320300270263150263106146
80157223275282
1152238
24134
93138
0274
16148237
037
6130
Convict Under-trialRegisterCapacity
Contd...
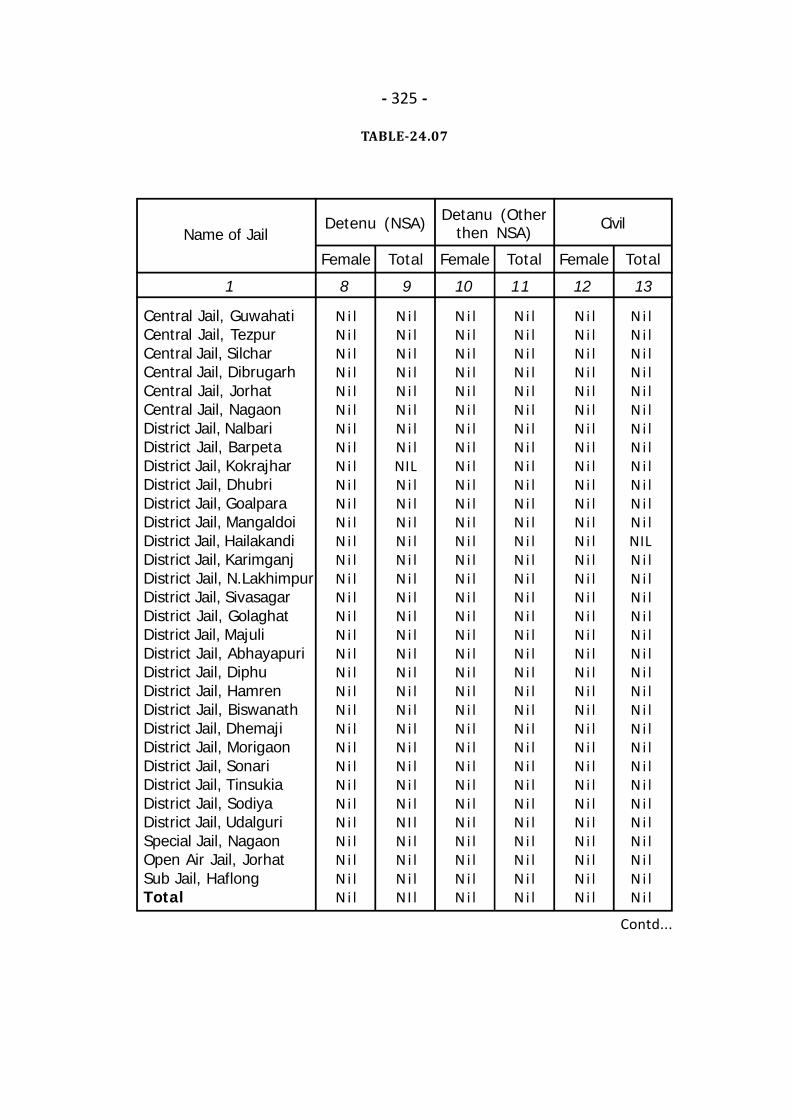
- 325 -
TABLE-24.07
1 8 9 10 11 12 13
Total Female Total FemaleFemale
Name of Jail
Total
Central Jail, GuwahatiCentral Jail, TezpurCentral Jail, SilcharCentral Jail, DibrugarhCentral Jail, JorhatCentral Jail, NagaonDistrict Jail, NalbariDistrict Jail, BarpetaDistrict Jail, KokrajharDistrict Jail, DhubriDistrict Jail, GoalparaDistrict Jail, MangaldoiDistrict Jail, HailakandiDistrict Jail, KarimganjDistrict Jail, N.LakhimpurDistrict Jail, SivasagarDistrict Jail, GolaghatDistrict Jail, MajuliDistrict Jail, AbhayapuriDistrict Jail, DiphuDistrict Jail, HamrenDistrict Jail, BiswanathDistrict Jail, DhemajiDistrict Jail, MorigaonDistrict Jail, SonariDistrict Jail, TinsukiaDistrict Jail, SodiyaDistrict Jail, UdalguriSpecial Jail, NagaonOpen Air Jail, JorhatSub Jail, HaflongTotal
N i lN i lN i lN i lN i lN i lN i lN i lN i lN i lN i lN i lN i lN i lN i lN i lN i lN i lN i lN i lN i lN i lN i lN i lN i lN i lN i lN i lN i lN i lN i lN i l
N i lN i lN i lN i lN i lN i lN i lN i lNILN i lN i lN i lN i lN i lN i lN i lN i lN i lN i lN i lN i lN i lN i lN i lN i lN i lN i lNI lN i lN i lN i lNI l
N i lN i lN i lN i lN i lN i lN i lN i lN i lN i lN i lN i lN i lN i lN i lN i lN i lN i lN i lN i lN i lN i lN i lN i lN i lN i lN i lN i lN i lN i lN i lN i l
N i lN i lN i lN i lN i lN i lN i lN i lN i lN i lN i lN i lN i lN i lN i lN i lN i lN i lN i lN i lN i lN i lN i lN i lN i lN i lN i lN i lN i lN i lN i lN i l
N i lN i lN i lN i lN i lN i lN i lN i lN i lN i lN i lN i lN i lN i lN i lN i lN i lN i lN i lN i lN i lN i lN i lN i lN i lN i lN i lN i lN i lN i lN i lN i l
N i lN i lN i lN i lN i lN i lN i lN i lN i lN i lN i lN i lNILN i lN i lN i lN i lN i lN i lN i lN i lN i lN i lN i lN i lN i lN i lN i lN i lN i lN i lN i l
Detanu (Otherthen NSA) CivilDetenu (NSA)
Contd...
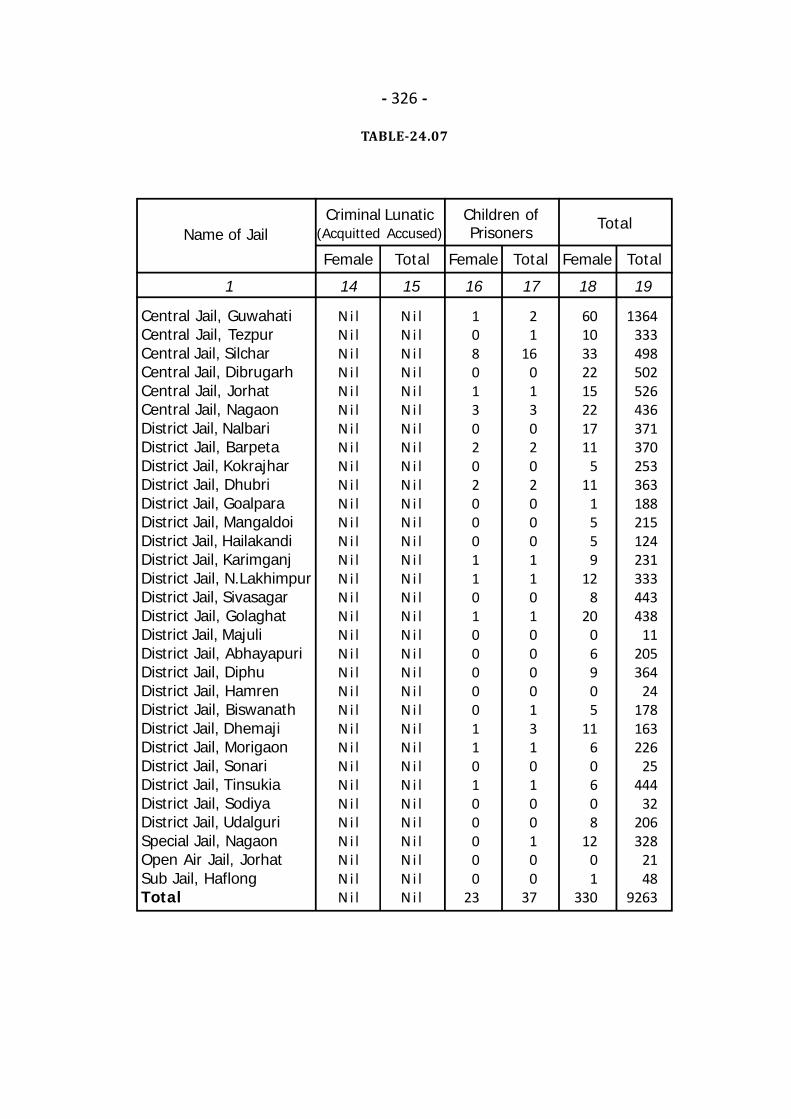
- 326 -
TABLE-24.07
1 14 15 16 17 18 19
Total Female Total FemaleFemale
Name of Jail
Total
Central Jail, GuwahatiCentral Jail, TezpurCentral Jail, SilcharCentral Jail, DibrugarhCentral Jail, JorhatCentral Jail, NagaonDistrict Jail, NalbariDistrict Jail, BarpetaDistrict Jail, KokrajharDistrict Jail, DhubriDistrict Jail, GoalparaDistrict Jail, MangaldoiDistrict Jail, HailakandiDistrict Jail, KarimganjDistrict Jail, N.LakhimpurDistrict Jail, SivasagarDistrict Jail, GolaghatDistrict Jail, MajuliDistrict Jail, AbhayapuriDistrict Jail, DiphuDistrict Jail, HamrenDistrict Jail, BiswanathDistrict Jail, DhemajiDistrict Jail, MorigaonDistrict Jail, SonariDistrict Jail, TinsukiaDistrict Jail, SodiyaDistrict Jail, UdalguriSpecial Jail, NagaonOpen Air Jail, JorhatSub Jail, HaflongTotal
N i lN i lN i lN i lN i lN i lN i lN i lN i lN i lN i lN i lN i lN i lN i lN i lN i lN i lN i lN i lN i lN i lN i lN i lN i lN i lN i lN i lN i lN i lN i lN i l
N i lN i lN i lN i lN i lN i lN i lN i lN i lN i lN i lN i lN i lN i lN i lN i lN i lN i lN i lN i lN i lN i lN i lN i lN i lN i lN i lN i lN i lN i lN i lN i l
1080130202000110100000110100000
23
21
160130202000110100001310100100
37
6010332215221711
511
1559
128
2006905
1160608
1201
330
1364333498502526436371370253363188215124231333443438
11205364
24178163226
25444
32206328
2148
9263
Children ofPrisoners TotalCriminal Lunatic
(Acquitted Accused)
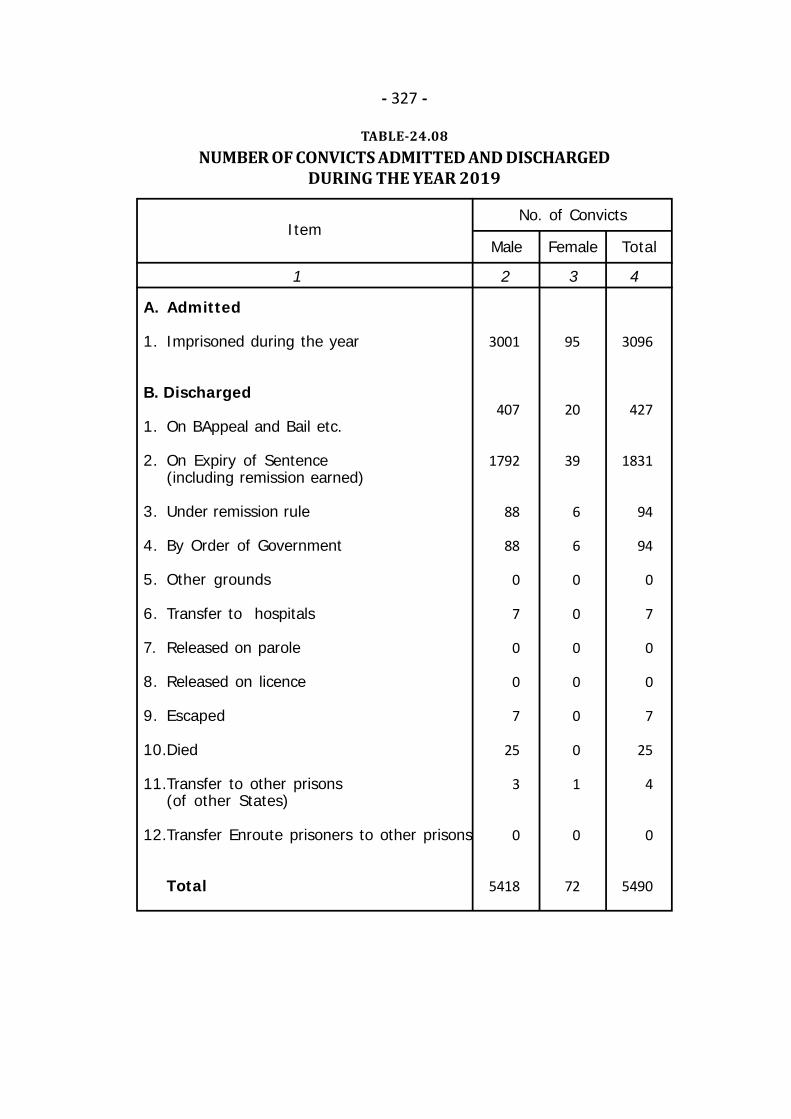
- 327 -
TABLE-24.08NUMBER OF CONVICTS ADMITTED AND DISCHARGED
DURING THE YEAR 2019
1 2 3 4
Male Female TotalItem
A. Admitted
1.
B. Discharged
1.
2.
3.
4.
5.
6.
7.
8.
9.
10.
11.
12.
Imprisoned during the year
On BAppeal and Bail etc.
On Expiry of Sentence(including remission earned)
Under remission rule
By Order of Government
Other grounds
Transfer to hospitals
Released on parole
Released on licence
Escaped
Died
Transfer to other prisons(of other States)
Transfer Enroute prisoners to other prisons
Total
3001
407
1792
88
88
0
7
0
0
7
25
3
0
5418
95
20
39
6
6
0
0
0
0
0
0
1
0
72
3096
427
1831
94
94
0
7
0
0
7
25
4
0
5490
No. of Convicts
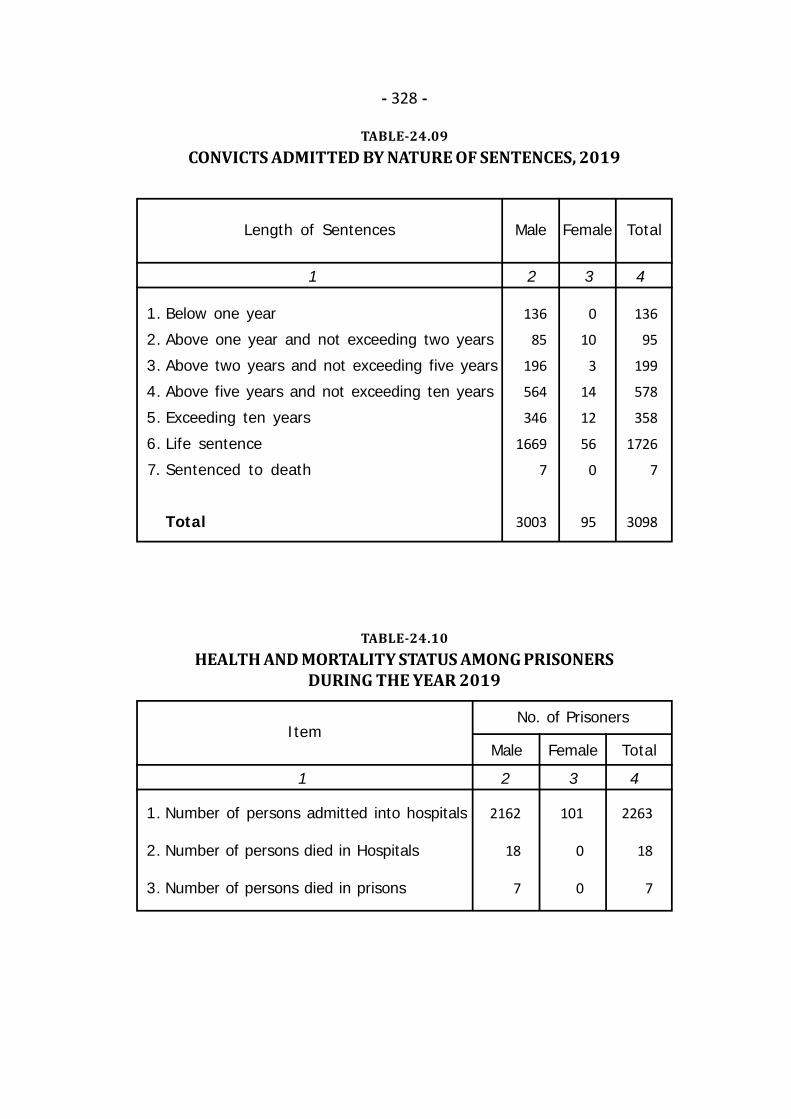
- 328 -
TABLE-24.09CONVICTS ADMITTED BY NATURE OF SENTENCES, 2019
1 2 3 4
Male Female TotalLength of Sentences
1.
2.
3.
4.
5.
6.
7.
Below one year
Above one year and not exceeding two years
Above two years and not exceeding five years
Above five years and not exceeding ten years
Exceeding ten years
Life sentence
Sentenced to death
Total
136
85
196
564
346
1669
7
3003
0
10
3
14
12
56
0
95
136
95
199
578
358
1726
7
3098
TABLE-24.10HEALTH AND MORTALITY STATUS AMONG PRISONERS
DURING THE YEAR 2019
1 2 3 4
Male Female TotalItem
1.
2.
3.
Number of persons admitted into hospitals
Number of persons died in Hospitals
Number of persons died in prisons
2162
18
7
101
0
0
2263
18
7
No. of Prisoners
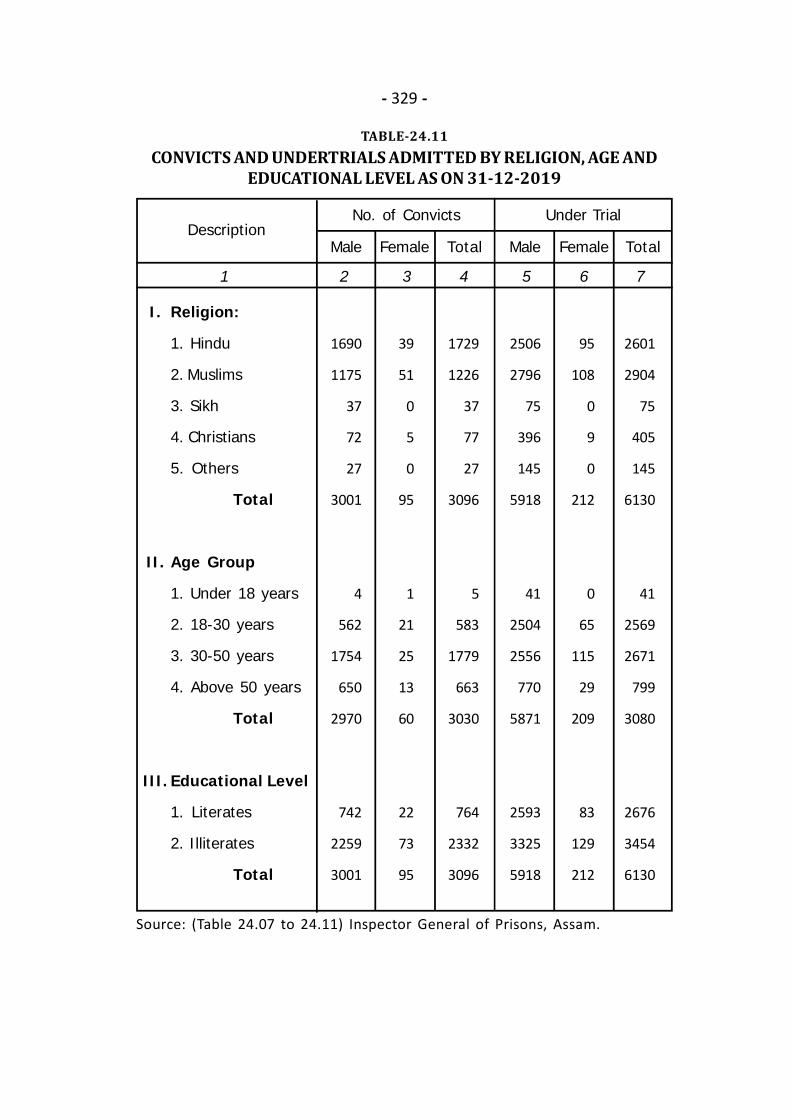
- 329 -
TABLE-24.11CONVICTS AND UNDERTRIALS ADMITTED BY RELIGION, AGE AND
EDUCATIONAL LEVEL AS ON 31-12-2019
1 2 3 4 5 6 7
Under Trial
Female Total Male FemaleMaleDescription
No. of Convicts
Total
Religion:
1. Hindu
2. Muslims
3. Sikh
4. Christians
5. Others
Total
Age Group
1. Under 18 years
2. 18-30 years
3. 30-50 years
4. Above 50 years
Total
Educational Level
1. Literates
2. Illiterates
Total
I.
II.
III.
1690
1175
37
72
27
3001
4
562
1754
650
2970
742
2259
3001
39
51
0
5
0
95
1
21
25
13
60
22
73
95
1729
1226
37
77
27
3096
5
583
1779
663
3030
764
2332
3096
2506
2796
75
396
145
5918
41
2504
2556
770
5871
2593
3325
5918
95
108
0
9
0
212
0
65
115
29
209
83
129
212
2601
2904
75
405
145
6130
41
2569
2671
799
3080
2676
3454
6130
Source: (Table 24.07 to 24.11) Inspector General of Prisons, Assam.

- 330 -
TABLE-24.12NUMBER OF JUDICIAL OFFICERS IN ASSAM
1 2 3 4 5
Male Female Male Female
Category
High Court Judges
District & Session Judges
Addl. Dist. & Session Judges(Including FTC)
Sr. Civil Judges & Asstt. SessionJudges
Chief Judicial Magistrates
Addl. Chief Judl.Magistrates
Judicial Magistrates(Class-I)
Spl. Judicial Magistrate (1st Class)
Spl. Rly. Magistrate (1st Class)
Munsiffs
SDJMs
16
21
26
18
19
13
16
1
1
31
19
1
6
11
7
8
10
22
-
1
28
22
20
21
24
18
18
13
16
1
1
33
20
1
1
12
8
9
12
35
-
1
40
24
2018 2019
Officers in Position (Nos.)

- 331 -
TABLE-24.13NUMBER OF CASES INSTITUTED, DISPOSED AND PENDING IN THE
GAUHATI HIGH COURT, ASSAM
1 2 3 4 5 6 7 8 9 10
2019
2019
2020
2019
2020
2020
Nam
e of
the
Cou
rt
Nat
ure
of C
ases
2020
PrincipalSeat
KohimaBench
AizawlBench
ItanagarBench
AllTotal
CivilCriminal
Total
CivilCriminal
Total
CivilCriminal
Total
CivilCriminal
Total
CivilCriminal
Total
253315970
31301
39639
435
29443
337
1205167
1372
272266219
33445
281296994
35123
40940
449
37280
452
1042177
1219
299527291
37243
133842727
16111
40546
451
34767
414
796180
976
149323020
17952
4866902
5768
18138
219
11126
137
28455
339
54421021
6463
105861703
12289
39245
437
26930
299
959170
1129
122061948
14154
3013681
3694
1139
122
10620
126
23458
292
3466768
4234
299827215
37197
47769
546
37786
463
1092174
1266
319287544
39472
Brought forwardfrom the
previous year
281296994
35123
40940
449
37280
452
1042177
1219
299527291
37243
2019
Freshlyinstituted Disposed Pending
Cases
Nos. of Cases (as on 1st January)
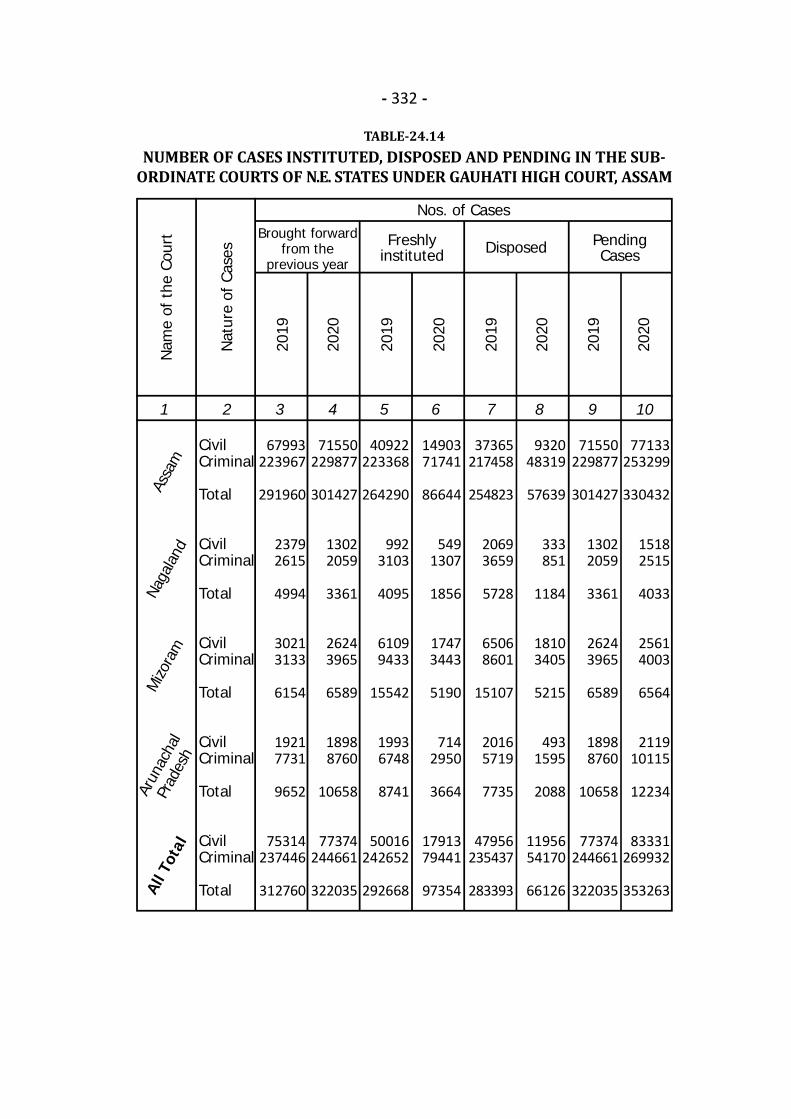
- 332 -
TABLE-24.14NUMBER OF CASES INSTITUTED, DISPOSED AND PENDING IN THE SUB-
ORDINATE COURTS OF N.E. STATES UNDER GAUHATI HIGH COURT, ASSAM
1 2 3 4 5 6 7 8 9 10
Nam
e of
the
Cou
rt
Nat
ure
of C
ases
CivilCriminal
Total
CivilCriminal
Total
CivilCriminal
Total
CivilCriminal
Total
CivilCriminal
Total
67993223967
291960
23792615
4994
30213133
6154
19217731
9652
75314237446
312760
71550229877
301427
13022059
3361
26243965
6589
18988760
10658
77374244661
322035
40922223368
264290
9923103
4095
61099433
15542
19936748
8741
50016242652
292668
1490371741
86644
5491307
1856
17473443
5190
7142950
3664
1791379441
97354
37365217458
254823
20693659
5728
65068601
15107
20165719
7735
47956235437
283393
932048319
57639
333851
1184
18103405
5215
4931595
2088
1195654170
66126
77133253299
330432
15182515
4033
25614003
6564
211910115
12234
83331269932
353263
Brought forwardfrom the
previous year
71550229877
301427
13022059
3361
26243965
6589
18988760
10658
77374244661
322035
Freshlyinstituted Disposed Pending
Cases
Nos. of Cases
Assa
mNa
gala
nd
Mizo
ram
Arun
acha
lPr
ades
h
All T
otal
2019
2019
2020
2019
2020
2020
2020
2019
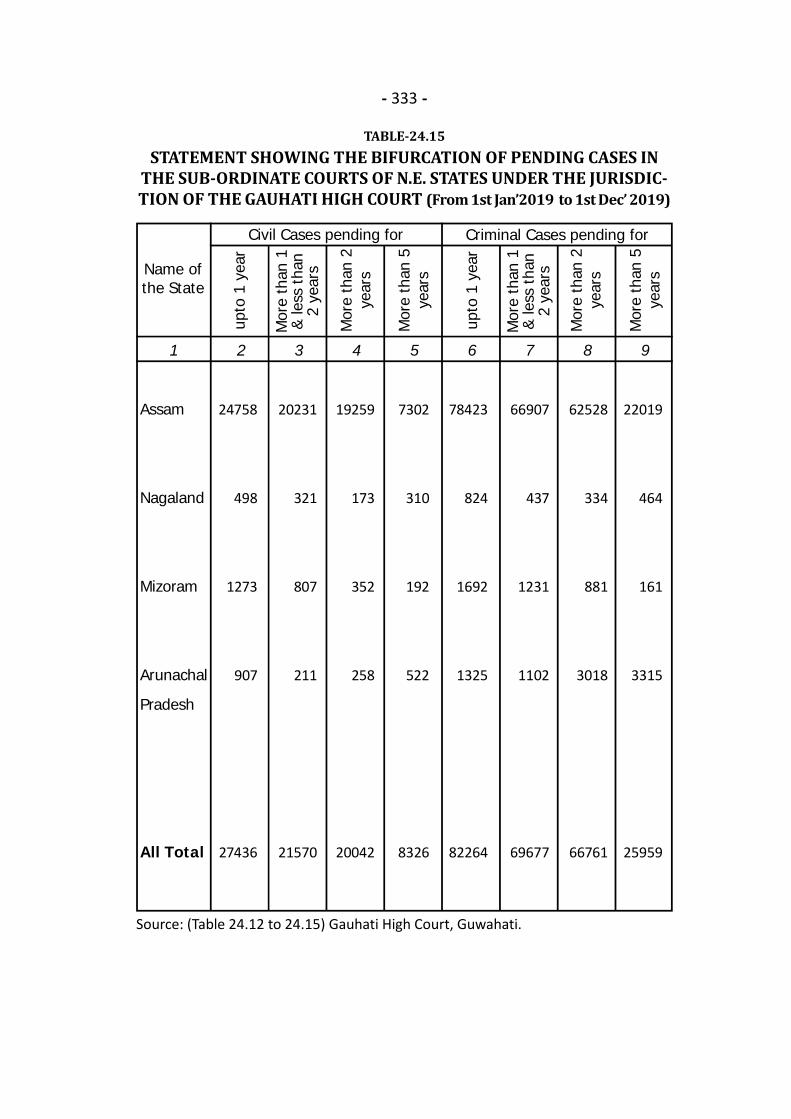
- 333 -
TABLE-24.15STATEMENT SHOWING THE BIFURCATION OF PENDING CASES IN
THE SUB-ORDINATE COURTS OF N.E. STATES UNDER THE JURISDIC-TION OF THE GAUHATI HIGH COURT (From 1st Jan’2019 to 1st Dec’ 2019)
Source: (Table 24.12 to 24.15) Gauhati High Court, Guwahati.
1 2 3 4 5 6 7 8 9
Criminal Cases pending for
Name ofthe State
Civil Cases pending for
Assam
Nagaland
Mizoram
Arunachal
Pradesh
All Total
24758
498
1273
907
27436
20231
321
807
211
21570
19259
173
352
258
20042
7302
310
192
522
8326
78423
824
1692
1325
82264
66907
437
1231
1102
69677
62528
334
881
3018
66761
22019
464
161
3315
25959
upto
1 y
ear
Mor
e th
an 1
& le
ss t
han
2 ye
ars
Mor
e th
an 2
year
s
Mor
e th
an 5
year
s
upto
1 y
ear
Mor
e th
an 1
& le
ss t
han
2 ye
ars
Mor
e th
an 2
year
s
Mor
e th
an 5
year
s

.
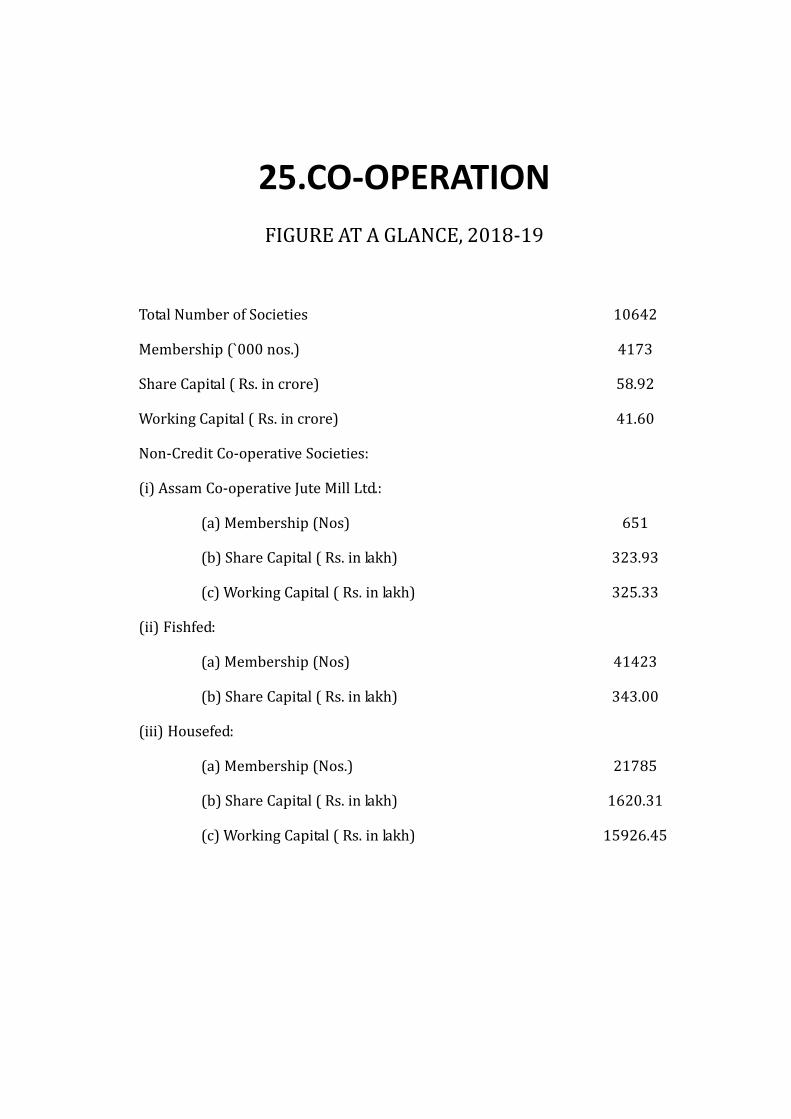
25.CO-OPERATIONFIGURE AT A GLANCE, 2018-19Total Number of SocietiesMembership (`000 nos.)Share Capital ( Rs. in crore)Working Capital ( Rs. in crore)Non-Credit Co-operative Societies:(i) Assam Co-operative Jute Mill Ltd.:(a) Membership (Nos)(b) Share Capital ( Rs. in lakh)(c) Working Capital ( Rs. in lakh)(ii) Fishfed:(a) Membership (Nos)(b) Share Capital ( Rs. in lakh)(iii) Housefed:(a) Membership (Nos.)(b) Share Capital ( Rs. in lakh)(c) Working Capital ( Rs. in lakh)
10642417358.9241.60651323.93325.33
41423343.00217851620.3115926.45

- 336 -
TABLE-25.01NUMBER OF DIFFERENT TYPES OF CO-OPERATIVE SOCIETIES
IN ASSAM, 2017-18
Contd...
1 2 3 4 5 6
Tota
l
Mem
bers
hip
(Nos
.)
No. of Societies
Type
Apex Bank
Urban Bank
ASCARD Bank
Thrift and Credit
Co-operative
GPSS
LAMPS
Primary Marketing
Sugar Mills
Jute Mills
Spinning Mills
Rice Mills
Cotton Ginning Mills
Agro Industry (Solvent
Extraction plant)
Milk Union
Primary Milk Societies
Dairy Co-operatives
Poultry Societies
Piggery Co-operatives
Firming Co-operatives
Fishfed
1
8
1
895
2202
86
104
1
1
-
1
-
120
3
222
340
263
555
468
1
1
8
1
555
1111
67
32
1
1
-
1
-
54
1
135
127
64
116
221
1
100556
62252
48208
61729
3084633
61991
18462
1424
652
-
27
-
5574
6628
12489
11685
6798
16452
26538
41423
1486.00
1774.00
660.00
296.72
1672.30
197.02
107.33
40.68
323.93
-
0.80
-
1.97
92.40
12.58
45.47
7.52
5.38
47.53
343.00
313699.00
60027.00
14224.00
4108.63
16640.64
1527.60
337.86
163.11
957.82
-
0.37
-
23.72
467.85
67.53
80.06
26.27
34.75
210.48
-
(1)
(2)
(3)
(4)
(5)
(6)
(7)
(8)
(9)
(10)
(11)
(12)
(13)
(14)
(15)
(16)
(17)
(18)
(19)
(20)
Func
tioni
ng
Shar
e Ca
pita
l(R
s. in
Lak
hs)
Wor
king
Capi
tal
(Rs.
in L
akhs
)

- 337 -
TABLE-25.01
1 2 3 4 5 6
Tota
l
Mem
bers
hip
(Nos
.)
No. of Societies
Type
Primary FisheriesPisiculture Co-operativesWholesale ConsumersPrimary ConsumersHousefedPrimary Housing Co-operativesIndustrial Co-operativesTransport Co-operativesLabour Contract &ConstructionState Co-operative UnionDistrict Co-operativeUnionCadre Management Co-operativeWomen Co-operativesProcessing Co-operativeFruit Growers Co-operativesSchool Co-operativesCollege Co-operativesOthers
Total:
461129
38274
1199
5264086
116
1
232978
-
29-
2065
10642
3295136
2041
51
1952219
114
-
188654
-
18-
961
5778
698478255
338798358821785
9368
2732623582874
-1418
-
5307586010
-
4235-
76516
4172999
121.6789.18
318.72143.15
1626.34126.72
51.8310.92
2.93
--
-
159.4757.48
-
1.92-
275.77
5892.01
477.612650.58
284.721154.16
14023.1289.46
763.0825.4849.72
--
-
617.3968.92
-
--
846.64
41598.94
(21)(22)(23)(24)(25)(26)
(27)(28)(29)
(30)(31)
(32)
(33)(34)(35)
(36)(37)(38)
Func
tioni
ng
Shar
e Ca
pita
l(R
s. in
Lak
hs)
Wor
king
Capi
tal
(Rs.
in L
akhs
)
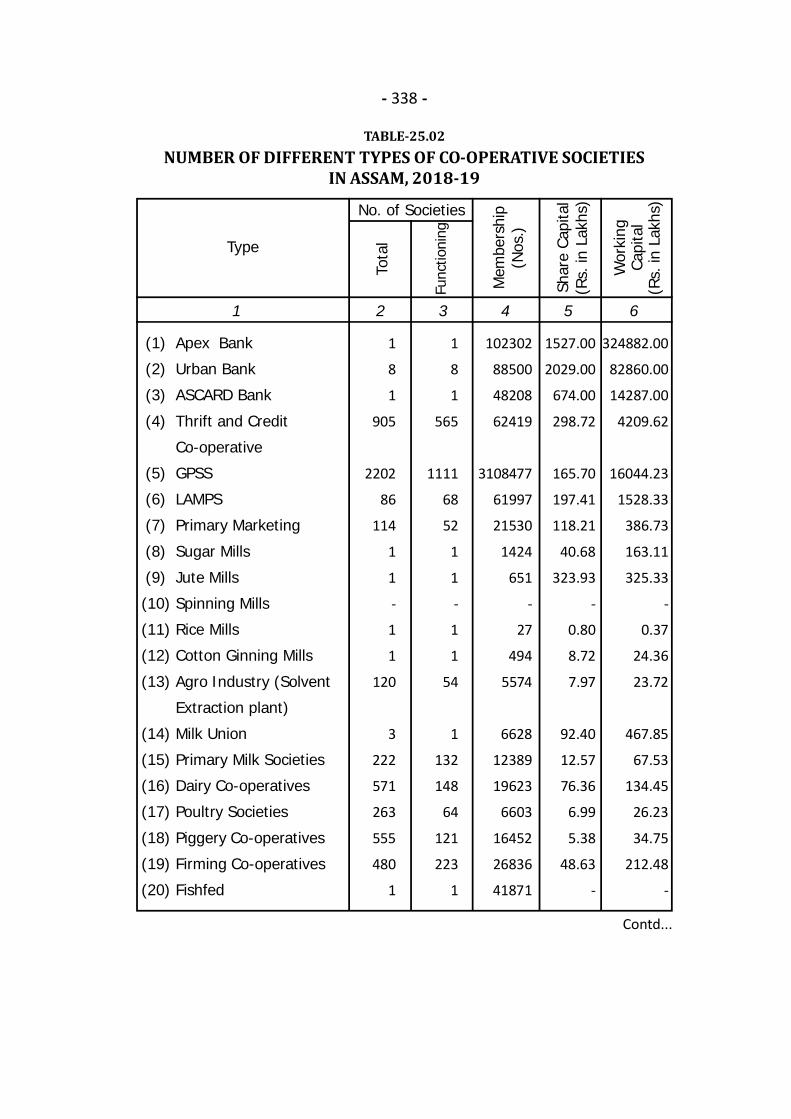
- 338 -
TABLE-25.02NUMBER OF DIFFERENT TYPES OF CO-OPERATIVE SOCIETIES
IN ASSAM, 2018-19
Contd...
1 2 3 4 5 6
Tota
l
Mem
bers
hip
(Nos
.)
No. of Societies
Type
Apex Bank
Urban Bank
ASCARD Bank
Thrift and Credit
Co-operative
GPSS
LAMPS
Primary Marketing
Sugar Mills
Jute Mills
Spinning Mills
Rice Mills
Cotton Ginning Mills
Agro Industry (Solvent
Extraction plant)
Milk Union
Primary Milk Societies
Dairy Co-operatives
Poultry Societies
Piggery Co-operatives
Firming Co-operatives
Fishfed
1
8
1
905
2202
86
114
1
1
-
1
1
120
3
222
571
263
555
480
1
1
8
1
565
1111
68
52
1
1
-
1
1
54
1
132
148
64
121
223
1
102302
88500
48208
62419
3108477
61997
21530
1424
651
-
27
494
5574
6628
12389
19623
6603
16452
26836
41871
1527.00
2029.00
674.00
298.72
165.70
197.41
118.21
40.68
323.93
-
0.80
8.72
7.97
92.40
12.57
76.36
6.99
5.38
48.63
-
324882.00
82860.00
14287.00
4209.62
16044.23
1528.33
386.73
163.11
325.33
-
0.37
24.36
23.72
467.85
67.53
134.45
26.23
34.75
212.48
-
(1)
(2)
(3)
(4)
(5)
(6)
(7)
(8)
(9)
(10)
(11)
(12)
(13)
(14)
(15)
(16)
(17)
(18)
(19)
(20)
Func
tioni
ng
Shar
e Ca
pita
l(R
s. in
Lak
hs)
Wor
king
Capi
tal
(Rs.
in L
akhs
)
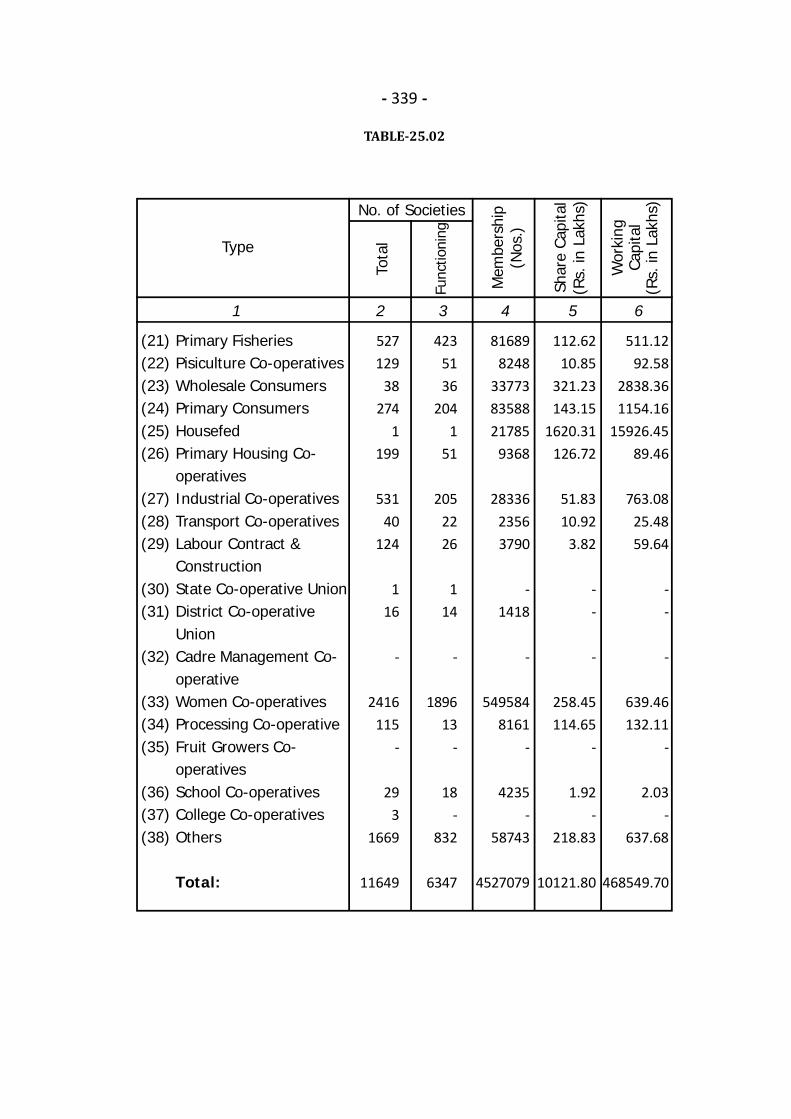
- 339 -
TABLE-25.02
1 2 3 4 5 6
Tota
l
Mem
bers
hip
(Nos
.)
No. of Societies
Type
Primary FisheriesPisiculture Co-operativesWholesale ConsumersPrimary ConsumersHousefedPrimary Housing Co-operativesIndustrial Co-operativesTransport Co-operativesLabour Contract &ConstructionState Co-operative UnionDistrict Co-operativeUnionCadre Management Co-operativeWomen Co-operativesProcessing Co-operativeFruit Growers Co-operativesSchool Co-operativesCollege Co-operativesOthers
Total:
527129
38274
1199
53140
124
116
-
2416115
-
293
1669
11649
4235136
2041
51
2052226
114
-
189613
-
18-
832
6347
816898248
337738358821785
9368
2833623563790
-1418
-
5495848161
-
4235-
58743
4527079
112.6210.85
321.23143.15
1620.31126.72
51.8310.92
3.82
--
-
258.45114.65
-
1.92-
218.83
10121.80
511.1292.58
2838.361154.16
15926.4589.46
763.0825.4859.64
--
-
639.46132.11
-
2.03-
637.68
468549.70
(21)(22)(23)(24)(25)(26)
(27)(28)(29)
(30)(31)
(32)
(33)(34)(35)
(36)(37)(38)
Func
tioni
ng
Shar
e Ca
pita
l(R
s. in
Lak
hs)
Wor
king
Capi
tal
(Rs.
in L
akhs
)
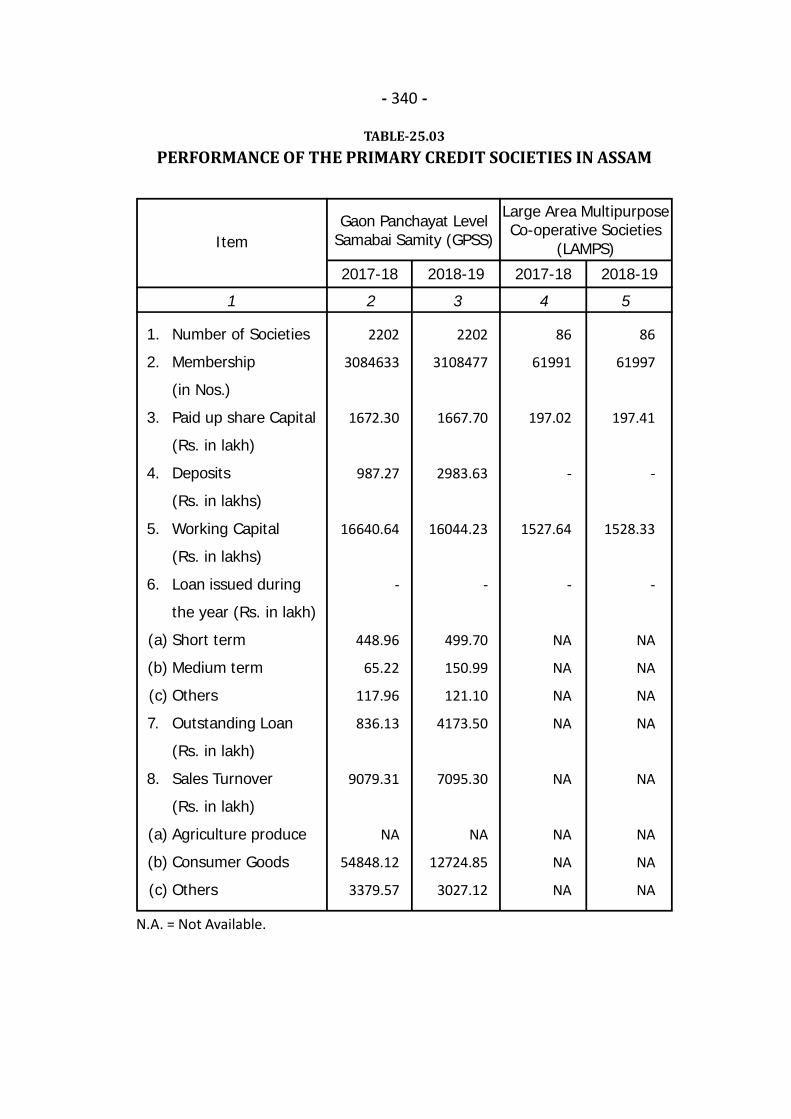
- 340 -
TABLE-25.03PERFORMANCE OF THE PRIMARY CREDIT SOCIETIES IN ASSAM
1 2 3 4 5
2017-18 2018-19 2017-18 2018-19
Item
1.
2.
3.
4.
5.
6.
(a)
(b)
(c)
7.
8.
(a)
(b)
(c)
Number of Societies
Membership
(in Nos.)
Paid up share Capital
(Rs. in lakh)
Deposits
(Rs. in lakhs)
Working Capital
(Rs. in lakhs)
Loan issued during
the year (Rs. in lakh)
Short term
Medium term
Others
Outstanding Loan
(Rs. in lakh)
Sales Turnover
(Rs. in lakh)
Agriculture produce
Consumer Goods
Others
2202
3084633
1672.30
987.27
16640.64
-
448.96
65.22
117.96
836.13
9079.31
NA
54848.12
3379.57
2202
3108477
1667.70
2983.63
16044.23
-
499.70
150.99
121.10
4173.50
7095.30
NA
12724.85
3027.12
86
61991
197.02
-
1527.64
-
NA
NA
NA
NA
NA
NA
NA
NA
86
61997
197.41
-
1528.33
-
NA
NA
NA
NA
NA
NA
NA
NA
Gaon Panchayat LevelSamabai Samity (GPSS)
Large Area MultipurposeCo-operative Societies
(LAMPS)
N.A. = Not Available.
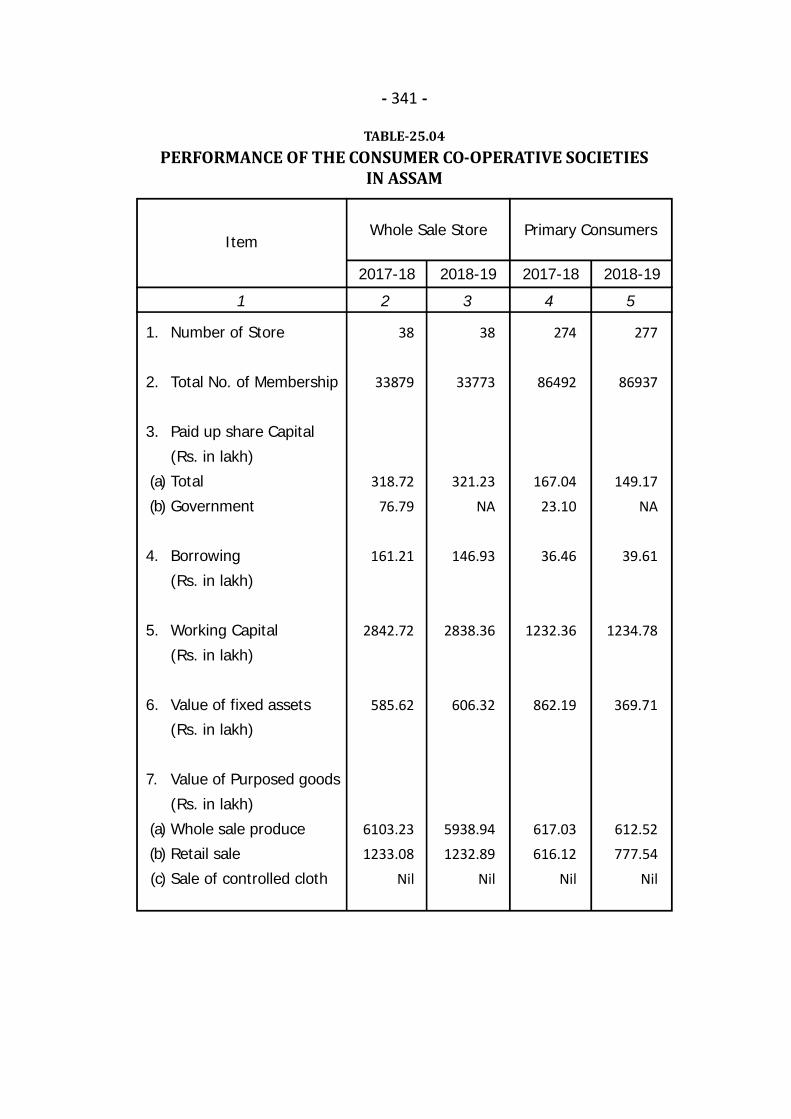
- 341 -
TABLE-25.04PERFORMANCE OF THE CONSUMER CO-OPERATIVE SOCIETIES
IN ASSAM
1 2 3 4 5
2017-18 2018-19 2017-18 2018-19
Item
1.
2.
3.
(a)
(b)
4.
5.
6.
7.
(a)
(b)
(c)
Number of Store
Total No. of Membership
Paid up share Capital
(Rs. in lakh)
Total
Government
Borrowing
(Rs. in lakh)
Working Capital
(Rs. in lakh)
Value of fixed assets
(Rs. in lakh)
Value of Purposed goods
(Rs. in lakh)
Whole sale produce
Retail sale
Sale of controlled cloth
38
33879
318.72
76.79
161.21
2842.72
585.62
6103.231233.08
Nil
38
33773
321.23
NA
146.93
2838.36
606.32
5938.941232.89
Nil
274
86492
167.04
23.10
36.46
1232.36
862.19
617.03616.12
Nil
277
86937
149.17
NA
39.61
1234.78
369.71
612.52777.54
Nil
Whole Sale Store Primary Consumers
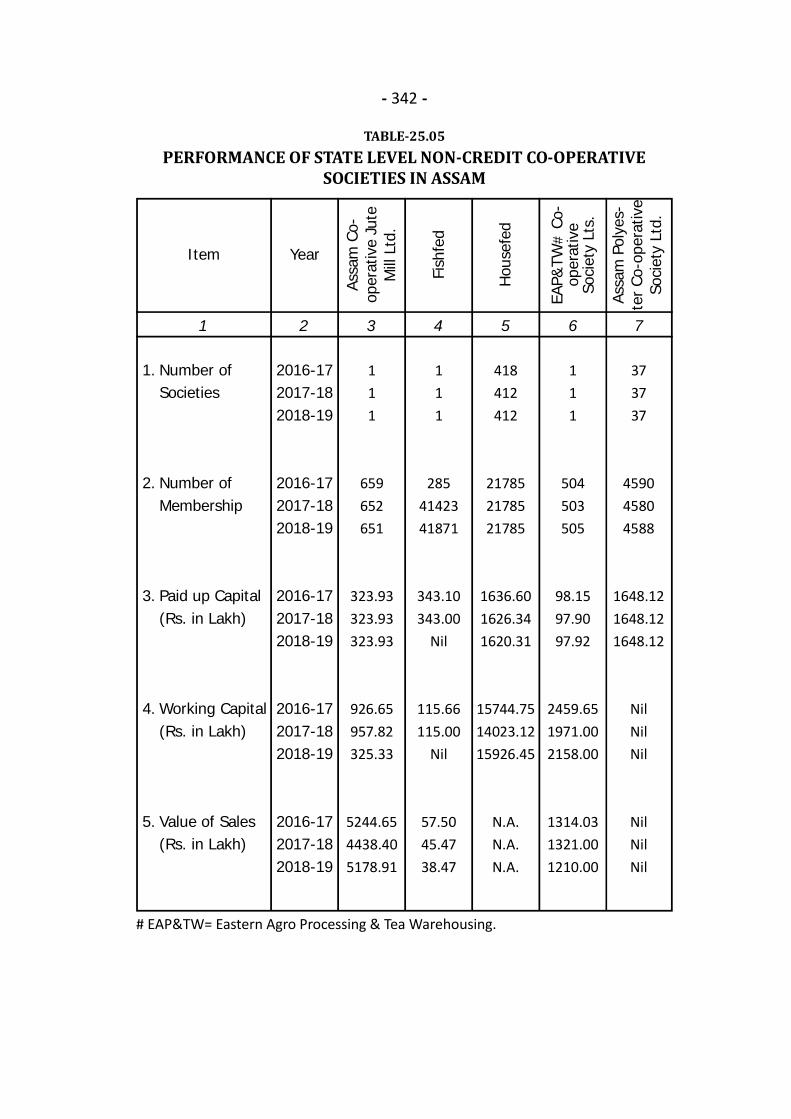
- 342 -
TABLE-25.05PERFORMANCE OF STATE LEVEL NON-CREDIT CO-OPERATIVE
SOCIETIES IN ASSAM
# EAP&TW= Eastern Agro Processing & Tea Warehousing.
1 2 3 4 5 6 7
Year
Fish
fed
Assa
m C
o-op
erat
ive
Jute
Mill
Ltd
.
Item
1.
2.
3.
4.
5.
Number ofSocieties
Number ofMembership
Paid up Capital(Rs. in Lakh)
Working Capital(Rs. in Lakh)
Value of Sales(Rs. in Lakh)
2016-172017-182018-19
2016-172017-182018-19
2016-172017-182018-19
2016-172017-182018-19
2016-172017-182018-19
111
659652651
323.93323.93323.93
926.65957.82325.33
5244.654438.405178.91
111
2854142341871
343.10343.00
Nil
115.66115.00
Nil
57.5045.4738.47
418412412
217852178521785
1636.601626.341620.31
15744.7514023.1215926.45
N.A.N.A.N.A.
111
504503505
98.1597.9097.92
2459.651971.002158.00
1314.031321.001210.00
373737
459045804588
1648.121648.121648.12
NilNilNil
NilNilNil
Hou
sefe
d
EAP&
TW#
Co-
oper
ativ
eSo
ciet
y Lt
s.
Assa
m P
olye
s-te
r Co
-ope
rativ
eSo
ciet
y Lt
d.
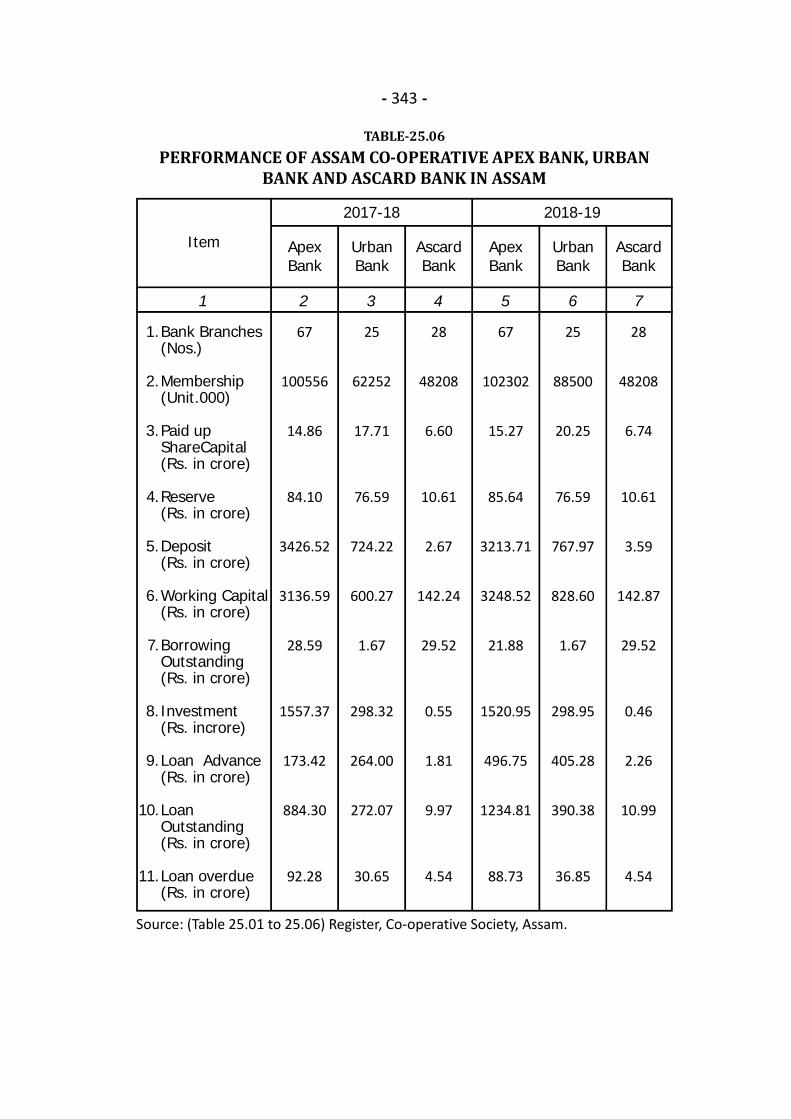
- 343 -
TABLE-25.06PERFORMANCE OF ASSAM CO-OPERATIVE APEX BANK, URBAN
BANK AND ASCARD BANK IN ASSAM
Source: (Table 25.01 to 25.06) Register, Co-operative Society, Assam.
1 2 3 4 5 6 7
ApexBank
UrbanBank
Item
1.
2.
3.
4.
5.
6.
7.
8.
9.
10.
11.
Bank Branches(Nos.)
Membership(Unit.000)
Paid upShareCapital(Rs. in crore)
Reserve(Rs. in crore)
Deposit(Rs. in crore)
Working Capital(Rs. in crore)
BorrowingOutstanding(Rs. in crore)
Investment(Rs. incrore)
Loan Advance(Rs. in crore)
LoanOutstanding(Rs. in crore)
Loan overdue(Rs. in crore)
67
100556
14.86
84.10
3426.52
3136.59
28.59
1557.37
173.42
884.30
92.28
25
62252
17.71
76.59
724.22
600.27
1.67
298.32
264.00
272.07
30.65
28
48208
6.60
10.61
2.67
142.24
29.52
0.55
1.81
9.97
4.54
67
102302
15.27
85.64
3213.71
3248.52
21.88
1520.95
496.75
1234.81
88.73
25
88500
20.25
76.59
767.97
828.60
1.67
298.95
405.28
390.38
36.85
28
48208
6.74
10.61
3.59
142.87
29.52
0.46
2.26
10.99
4.54
AscardBank
ApexBank
UrbanBank
AscardBank
2017-18 2018-19

.

26.LABOUR AND EMPLOYMENTFIGURE AT A GLANCE, 2019Employment in Organised Sector:
Public SectorPrivate SectorTotal
Employment Exchange:
No. of Employment Exchanges (including E.I & A.B) Total No. in the Live Register Total No. of Registration Educated Unemployed Registered during the year
479164628981
1108145
812047195156248
2047195
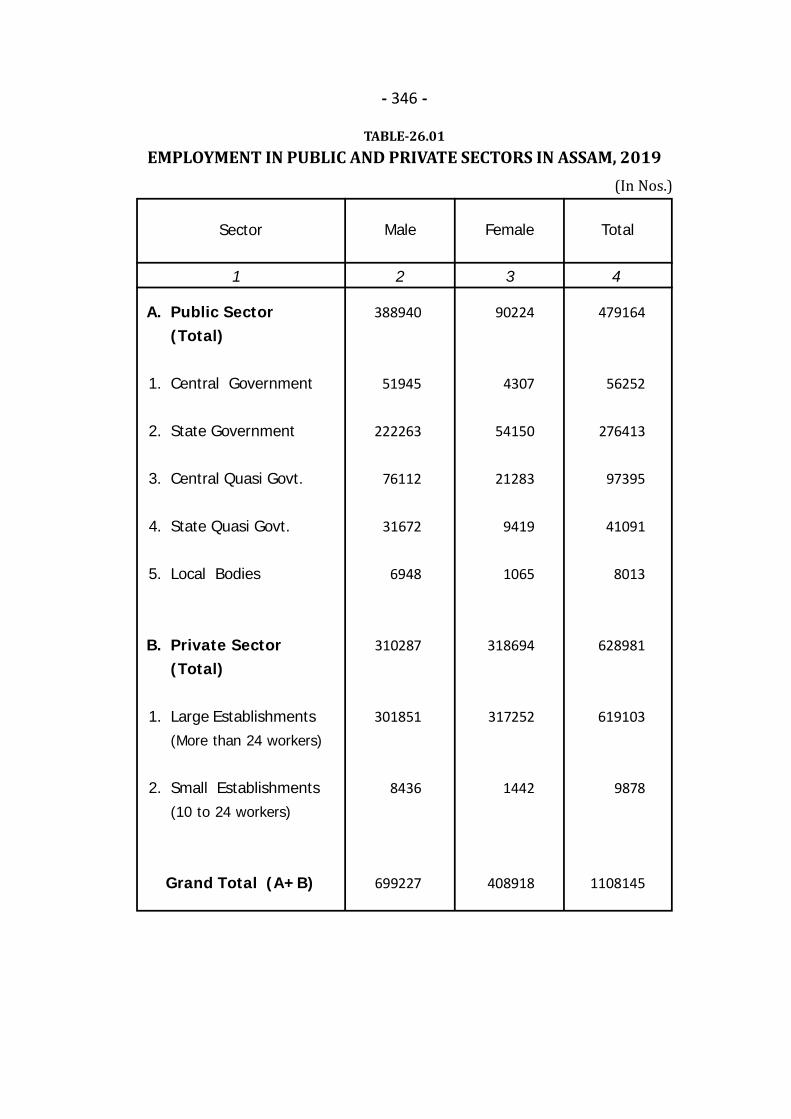
- 346 -
TABLE-26.01EMPLOYMENT IN PUBLIC AND PRIVATE SECTORS IN ASSAM, 2019
1 2 3 4
Sector
A.
1.
2.
3.
4.
5.
B.
1.
2.
Public Sector(Total)
Central Government
State Government
Central Quasi Govt.
State Quasi Govt.
Local Bodies
Private Sector(Total)
Large Establishments(More than 24 workers)
Small Establishments(10 to 24 workers)
388940
51945
222263
76112
31672
6948
310287
301851
8436
699227
90224
4307
54150
21283
9419
1065
318694
317252
1442
408918
479164
56252
276413
97395
41091
8013
628981
619103
9878
1108145
Female TotalMale
Grand Total (A+B)
(In Nos.)
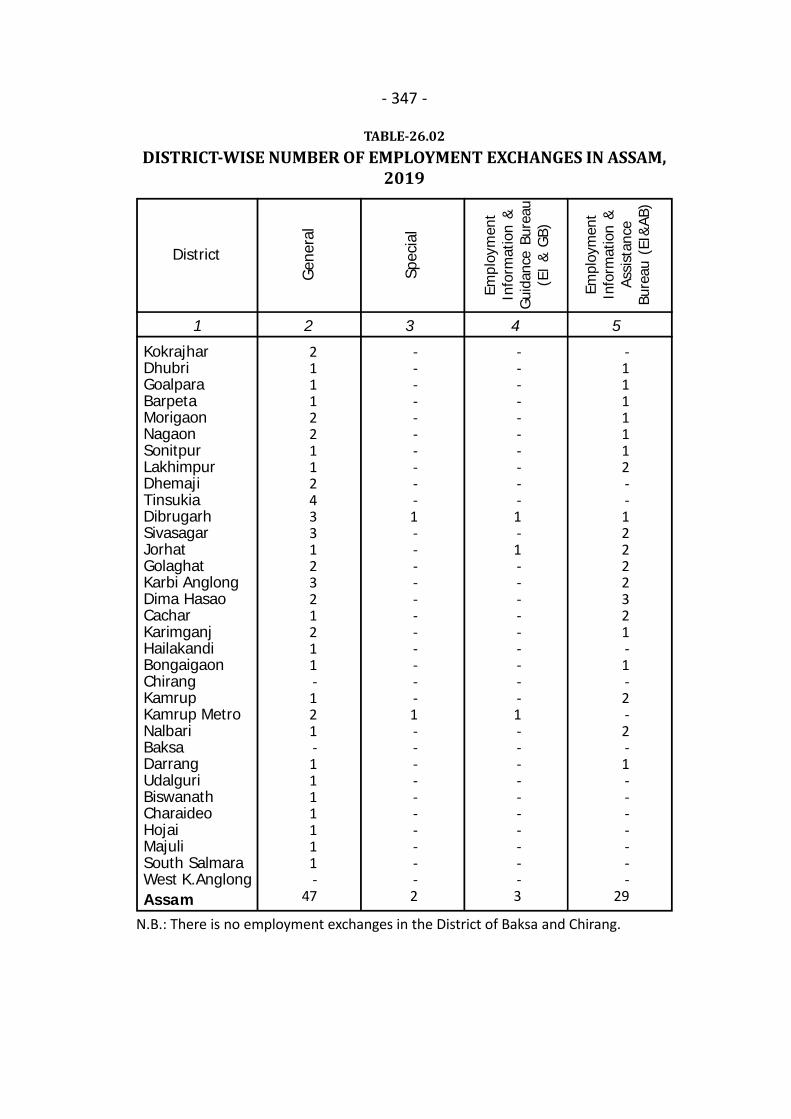
- 347 -
TABLE-26.02DISTRICT-WISE NUMBER OF EMPLOYMENT EXCHANGES IN ASSAM,
2019
1 2 3 4 5
KokrajharDhubriGoalparaBarpetaMorigaonNagaonSonitpurLakhimpurDhemajiTinsukiaDibrugarhSivasagarJorhatGolaghatKarbi AnglongDima HasaoCacharKarimganjHailakandiBongaigaonChirangKamrupKamrup MetroNalbariBaksaDarrangUdalguriBiswanathCharaideoHojaiMajuliSouth SalmaraWest K.AnglongAssam
District
Gen
eral
Spec
ial
Empl
oym
ent
Info
rmat
ion
&G
uida
nce
Bure
au(E
I &
GB)
Empl
oym
ent
Info
rmat
ion
&As
sist
ance
Bure
au (
EI&
AB)
21112211243312321211-121-1111111-
47
----------1-----------1----------2
----------1-1---------1----------3
-1111112--12222321-1-2-2-1-------
29
N.B.: There is no employment exchanges in the District of Baksa and Chirang.
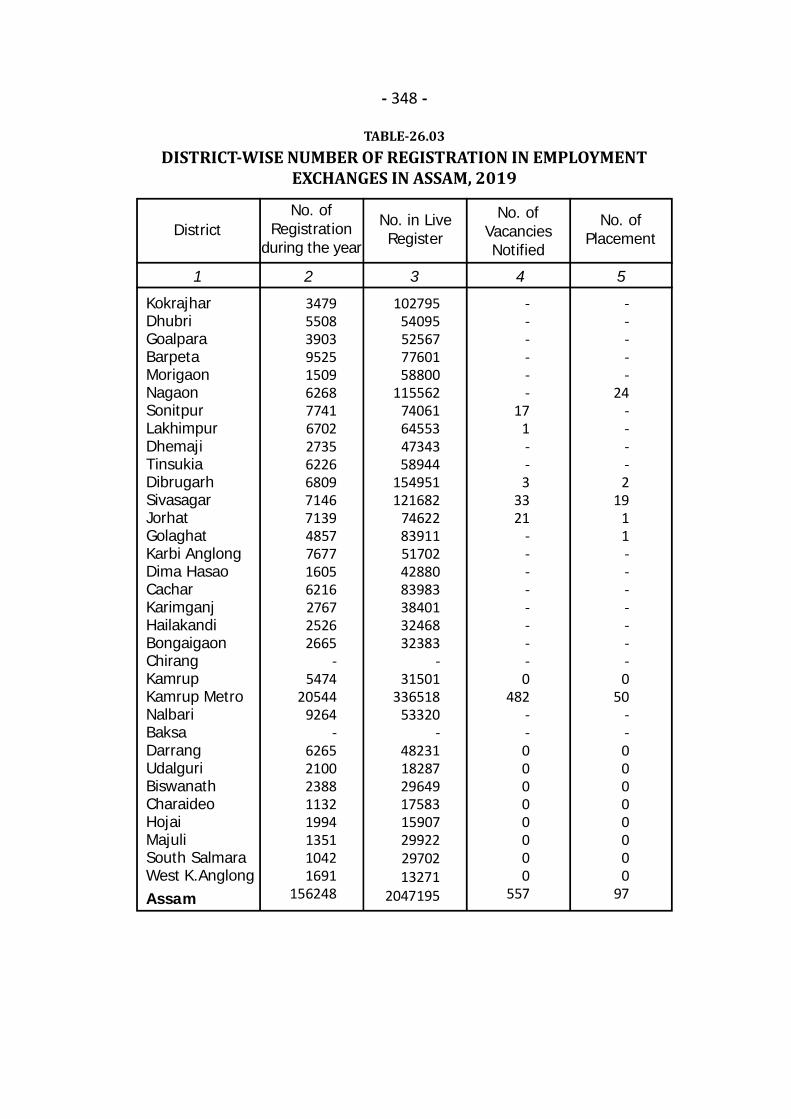
- 348 -
TABLE-26.03DISTRICT-WISE NUMBER OF REGISTRATION IN EMPLOYMENT
EXCHANGES IN ASSAM, 2019
1 2 3 4 5
DistrictNo. of
Registrationduring the year
No. in LiveRegister
No. ofVacanciesNotified
No. ofPlacement
KokrajharDhubriGoalparaBarpetaMorigaonNagaonSonitpurLakhimpurDhemajiTinsukiaDibrugarhSivasagarJorhatGolaghatKarbi AnglongDima HasaoCacharKarimganjHailakandiBongaigaonChirangKamrupKamrup MetroNalbariBaksaDarrangUdalguriBiswanathCharaideoHojaiMajuliSouth SalmaraWest K.AnglongAssam
34795508390395251509626877416702273562266809714671394857767716056216276725262665
-5474
205449264
-62652100238811321994135110421691
156248
10279554095525677760158800
11556274061645534734358944
154951121682
7462283911517024288083983384013246832383
-31501
33651853320
-4823118287296491758315907299222970213271
2047195
------
171--3
3321
--------0
482--00000000
557
-----
24----2
1911-------0
50--00000000
97
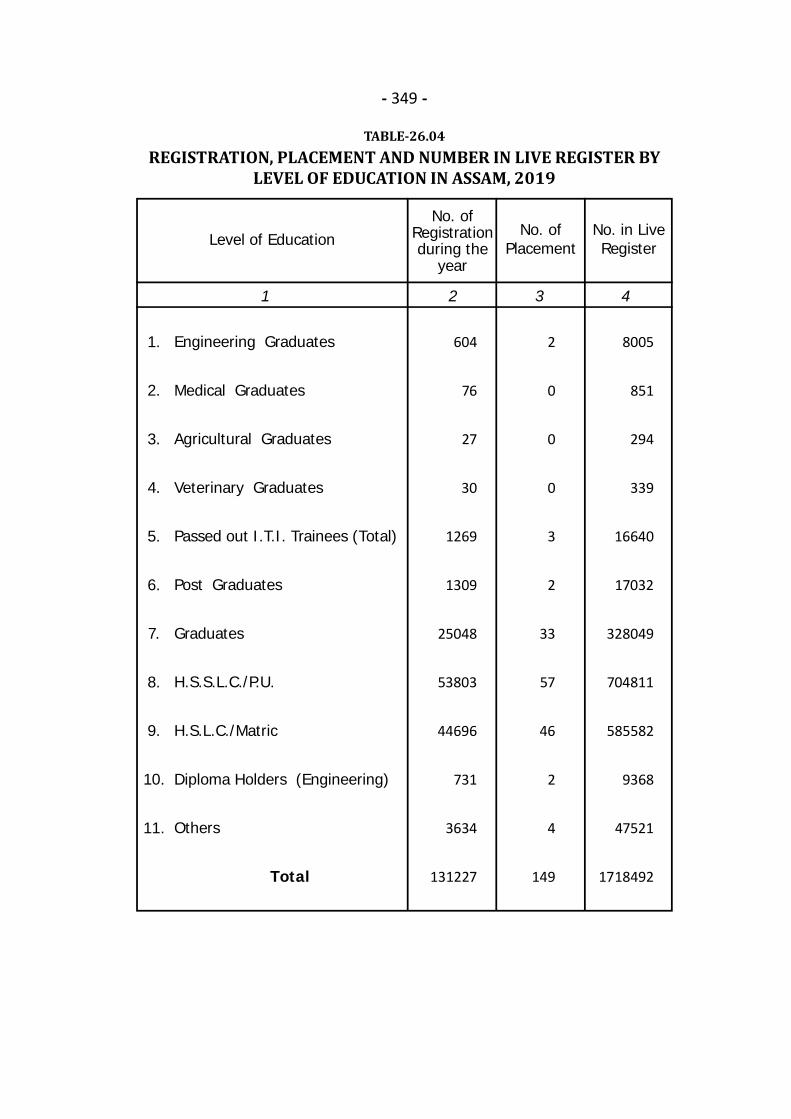
- 349 -
TABLE-26.04REGISTRATION, PLACEMENT AND NUMBER IN LIVE REGISTER BY
LEVEL OF EDUCATION IN ASSAM, 2019
1 2 3 4
Level of EducationNo. of
PlacementNo. in LiveRegister
Engineering Graduates
Medical Graduates
Agricultural Graduates
Veterinary Graduates
Passed out I.T.I. Trainees (Total)
Post Graduates
Graduates
H.S.S.L.C./P.U.
H.S.L.C./Matric
Diploma Holders (Engineering)
Others
Total
1.
2.
3.
4.
5.
6.
7.
8.
9.
10.
11.
604
76
27
30
1269
1309
25048
53803
44696
731
3634
131227
2
0
0
0
3
2
33
57
46
2
4
149
8005
851
294
339
16640
17032
328049
704811
585582
9368
47521
1718492
No. ofRegistrationduring the
year
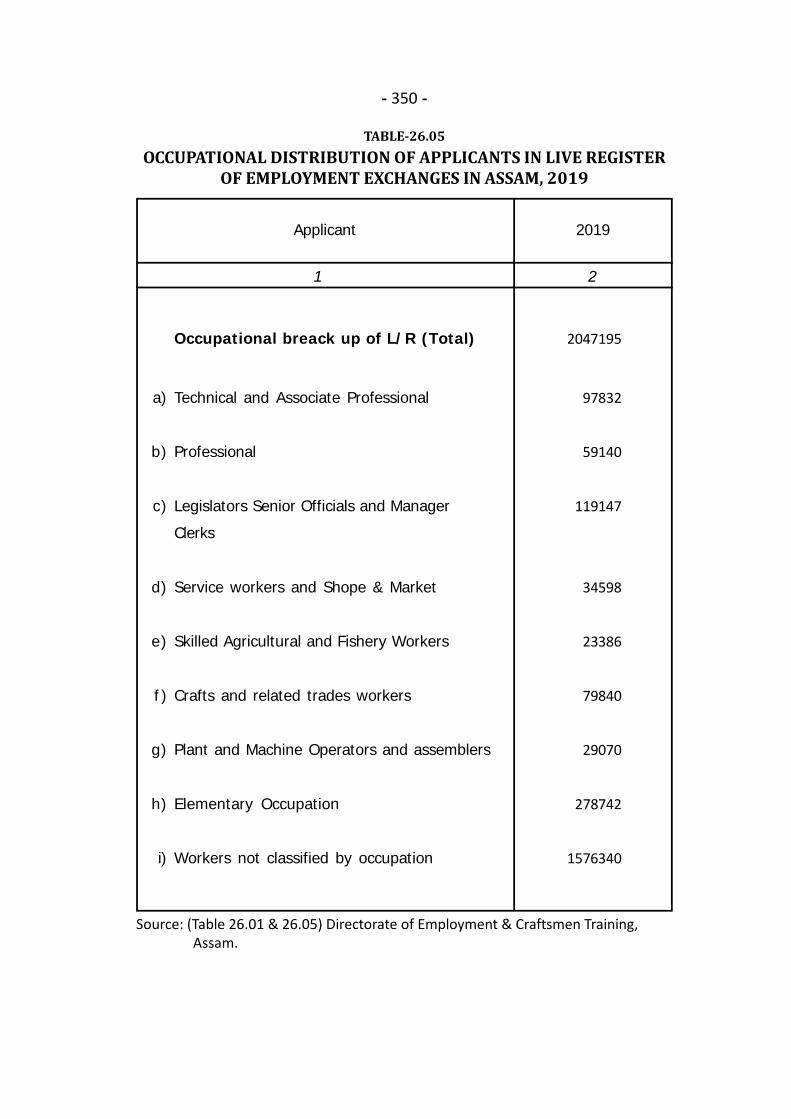
- 350 -
TABLE-26.05OCCUPATIONAL DISTRIBUTION OF APPLICANTS IN LIVE REGISTER
OF EMPLOYMENT EXCHANGES IN ASSAM, 2019
1 2
Applicant 2019
Occupational breack up of L/R (Total)
Technical and Associate Professional
Professional
Legislators Senior Officials and Manager
Clerks
Service workers and Shope & Market
Skilled Agricultural and Fishery Workers
Crafts and related trades workers
Plant and Machine Operators and assemblers
Elementary Occupation
Workers not classified by occupation
a)
b)
c)
d)
e)
f )
g)
h)
i)
2047195
97832
59140
119147
34598
23386
79840
29070
278742
1576340
Source: (Table 26.01 & 26.05) Directorate of Employment & Craftsmen Training, Assam.
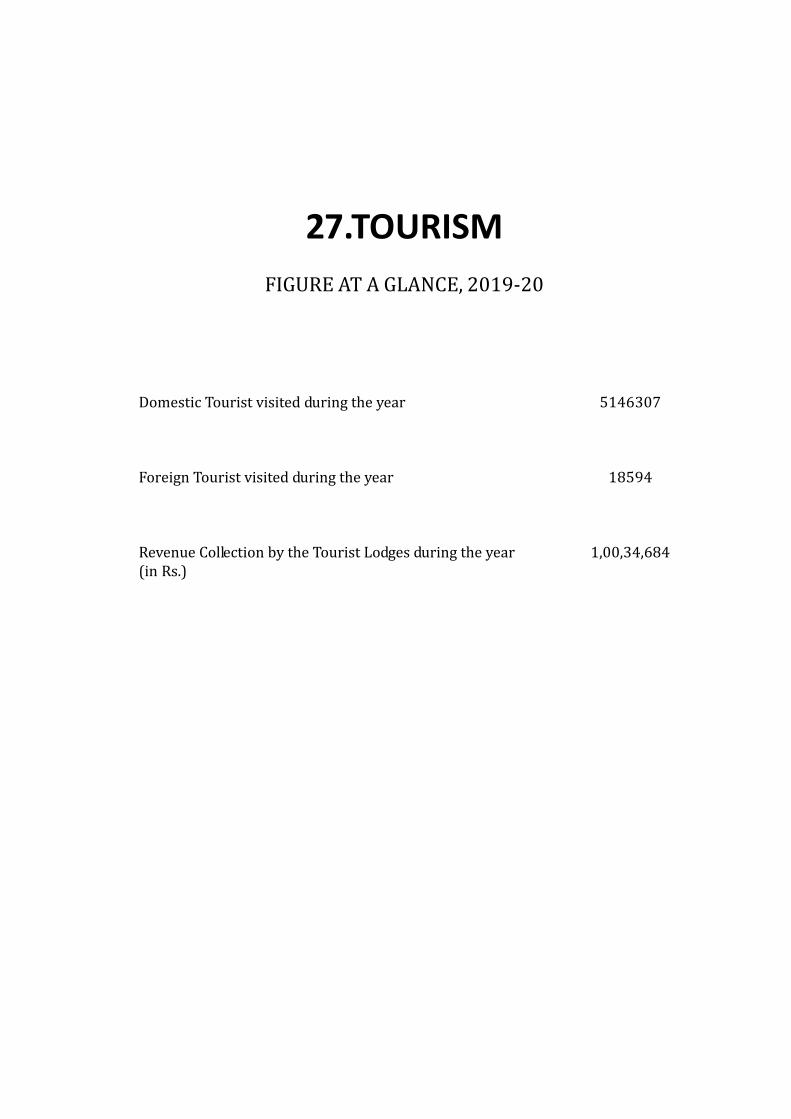
27.TOURISMFIGURE AT A GLANCE, 2019-20Domestic Tourist visited during the yearForeign Tourist visited during the yearRevenue Collection by the Tourist Lodges during the year(in Rs.)
514630718594
1,00,34,684
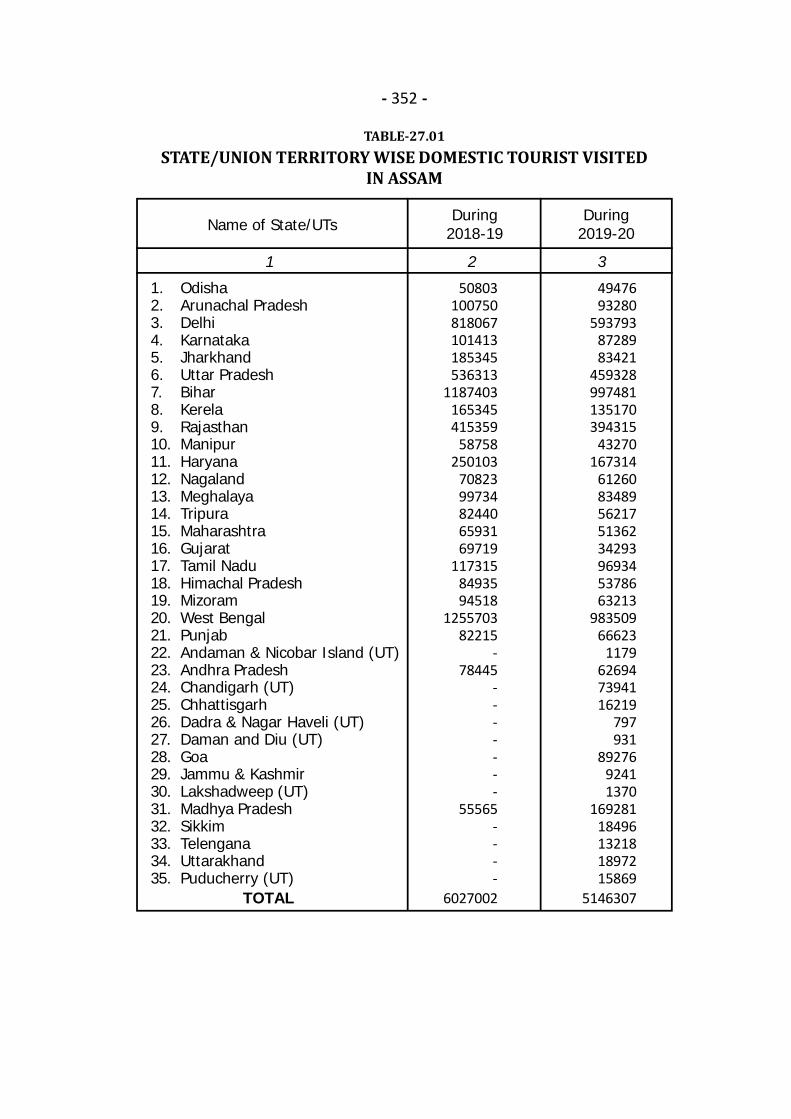
- 352 -
TABLE-27.01STATE/UNION TERRITORY WISE DOMESTIC TOURIST VISITED
IN ASSAM
1 2 3
Name of State/UTs
OdishaArunachal PradeshDelhiKarnatakaJharkhandUttar PradeshBiharKerelaRajasthanManipurHaryanaNagalandMeghalayaTripuraMaharashtraGujaratTamil NaduHimachal PradeshMizoramWest BengalPunjabAndaman & Nicobar Island (UT)Andhra PradeshChandigarh (UT)ChhattisgarhDadra & Nagar Haveli (UT)Daman and Diu (UT)GoaJammu & KashmirLakshadweep (UT)Madhya PradeshSikkimTelenganaUttarakhandPuducherry (UT)
TOTAL
50803100750818067101413185345536313
1187403165345415359
58758250103
7082399734824406593169719
1173158493594518
125570382215
-78445
-------
55565----
6027002
4947693280
5937938728983421
459328997481135170394315
43270167314
6126083489562175136234293969345378663213
98350966623
1179626947394116219
797931
8927692411370
16928118496132181897215869
5146307
During2018-19
During2019-20
1.2.3.4.5.6.7.8.9.10.11.12.13.14.15.16.17.18.19.20.21.22.23.24.25.26.27.28.29.30.31.32.33.34.35.

- 353 -
TABLE-27.02COUNTRY WISE FOREIGN TOURIST VISITED IN ASSAM
1 2 3
Name of Country
United Kingdom
France
UAE
Netherland
Australia
USA
Germany
Switzerland
Nepal
Bangladesh
Canada
Sri Lanka
Japan
Spain
Singapore
Austria
Belgium
Portugal
Czech Rep.
Lebanan
Israel
Others
Total
1935
3105
1115
370
1354
3763
4907
1015
2075
3420
985
275
997
948
103
92
149
793
242
170
789
12607
41209
78
64
-
-
59
123
39
4
496
248
1
54
12
17
-
34
-
-
-
-
-
17365
18594
During2018-19
During2019-20
1.
2.
3.
4.
5.
6.
7.
8.
9.
10.
11.
12.
13.
14.
15.
16.
17.
18.
19.
20.
21.
22.
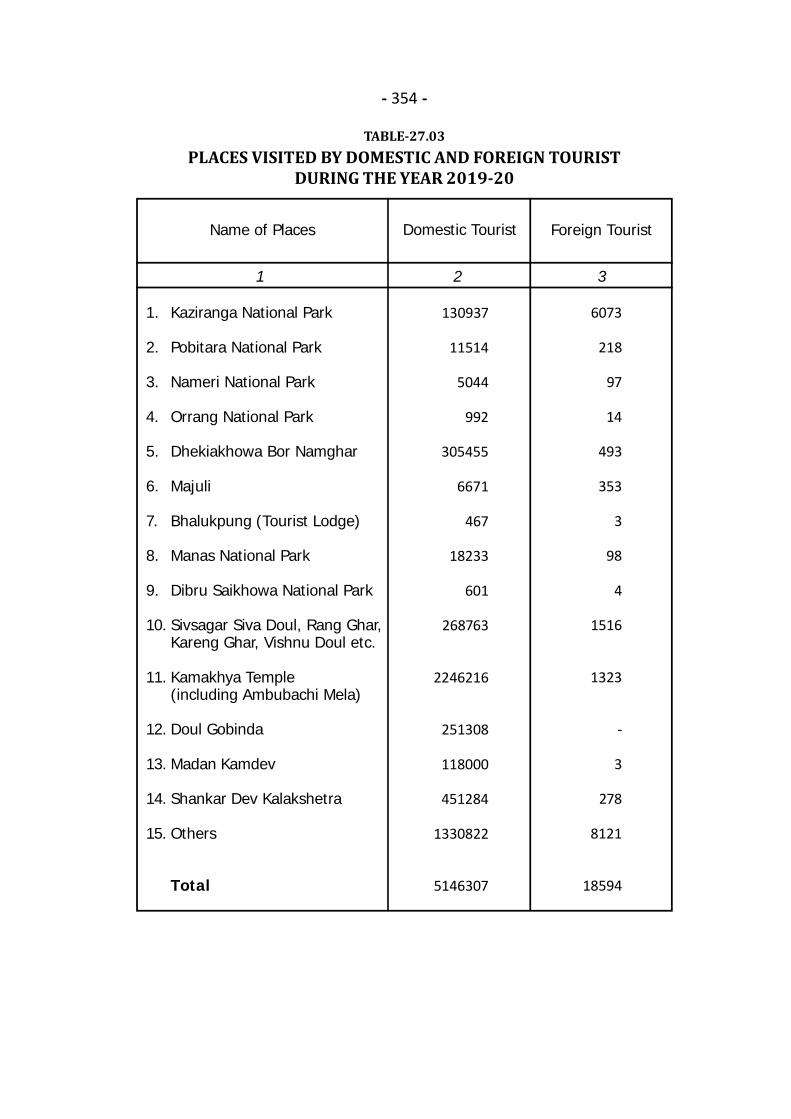
- 354 -
TABLE-27.03PLACES VISITED BY DOMESTIC AND FOREIGN TOURIST
DURING THE YEAR 2019-20
1 2 3
Name of Places
130937
11514
5044
992
305455
6671
467
18233
601
268763
2246216
251308
118000
451284
1330822
5146307
6073
218
97
14
493
353
3
98
4
1516
1323
-
3
278
8121
18594
Domestic Tourist Foreign Tourist
Kaziranga National Park
Pobitara National Park
Nameri National Park
Orrang National Park
Dhekiakhowa Bor Namghar
Majuli
Bhalukpung (Tourist Lodge)
Manas National Park
Dibru Saikhowa National Park
Sivsagar Siva Doul, Rang Ghar,Kareng Ghar, Vishnu Doul etc.
Kamakhya Temple(including Ambubachi Mela)
Doul Gobinda
Madan Kamdev
Shankar Dev Kalakshetra
Others
Total
1.
2.
3.
4.
5.
6.
7.
8.
9.
10.
11.
12.
13.
14.
15.

- 355 -
TABLE-27.04PURPOSE OF VISIT OF DOMESTIC TOURIST IN ASSAM
DURING THE YEAR 2019-20
1 2 3 4 5 6 7 8 9
Name of States/UTs
Busi
ness
3049251273
1623702981037200
233219581267
9216145917
86754563
1723112539
92173890264332164310
12372234912
3619-
1396793584
--
56303210
-58931
234012367691
-1679762
13243481
5892151
-890
325015628
327614975
87618939274189012831091
723896
1589618585
712-
3621----
2161--
392118291720
--
111935
-526
---------------------------------
526
757131820
3448851336619069
145173313363
83136236572
10718112263
2339329659399373638316663890463236525698
70626755642
676487396850011893
471674
7180123461123
1019101102710024
728213180
2722635
Purpose of VisitNo. ofTouristArrived
OdishaArunachal PradeshDelhiKarnatakaJharkhandUttar PradeshBiharKerelaRajasthanManipurHaryanaNagalandMeghalayaTripuraMaharashtraGujaratTamil NaduHimachal PradeshMizoramWest BengalPunjabA&Nikobar IslandAndhra PradeshChandigarh*ChhattisgarhDadra & N Haveli*Daman & Diu*GoaJammu & KashmirLakshadweep*Madhya PradeshSikkimTelenganaUttarakhandPuducherry*Total
1.2.3.4.5.6.7.8.9.10.11.12.13.14.15.16.17.18.19.20.21.22.23.24.25.26.27.28.29.30.31.32.33.34.35.
4947693280
5937938728983421
459328997481135170394315
43270167314
6126083489562175136234293969345378663213
98350966623
1179626947394116219
797931
8927692411370
16928118496132181897215869
5146307
Educ
atio
nal
Spor
ts
Med
ical
Nat
ural
Cultu
ral
Oth
ers
112936191670
641976
17552341321949213490
39518703210
760590678328925
124821553021
238219328453326257397470247578430238370513
44005
-2561
-------
2196-
361214978
792----
36832314
---------------
30136
8960-
842794132126176782919726023971
36293216
492171326113829
36219216
132183621
152904316
192763629
265871943203289
--
92873215
-39412870
-36292176
557308* Union Territory
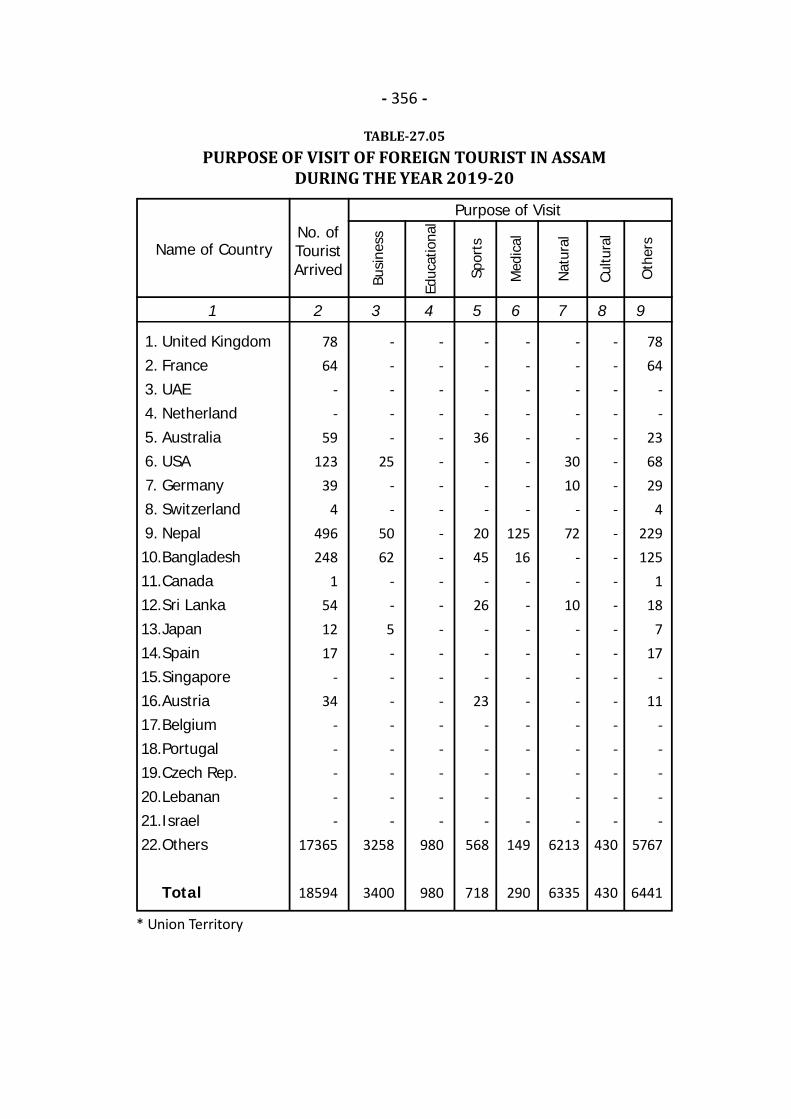
- 356 -
TABLE-27.05PURPOSE OF VISIT OF FOREIGN TOURIST IN ASSAM
DURING THE YEAR 2019-20
1 2 3 4 5 6 7 8 9
Name of Country
Busi
ness
-----
25--
5062
--5--------
3258
3400
---------------------
980
980
---------------------
430
430
7864
--
236829
4229125
118
717
-11
-----
5767
6441
Purpose of VisitNo. ofTouristArrived
United KingdomFranceUAENetherlandAustraliaUSAGermanySwitzerlandNepalBangladeshCanadaSri LankaJapanSpainSingaporeAustriaBelgiumPortugalCzech Rep.LebananIsraelOthers
Total
1.2.3.4.5.6.7.8.9.10.11.12.13.14.15.16.17.18.19.20.21.22.
7864
--
59123
394
496248
1541217
-34
-----
17365
18594
Educ
atio
nal
Spor
ts
Med
ical
Nat
ural
Cultu
ral
Oth
ers
----
36---
2045
-26
---
23-----
568
718
--------
12516
-----------
149
290
-----
3010
-72
--
10---------
6213
6335
* Union Territory

- 357 -
TABLE-27.06NUMBER OF TOURISTS VISITED TO THE POPULAR TOURIST
PLACES/CENTRALLY PROTECTED MONUMENTS IN THE STATESDURING THE YEAR 2019-20
1 2 3
Name of Tourist PlacesForeign
Ahom Raja’s Palace, SivasagarKarangghar Palace, SivasagarRangghar Pavilion, SivasagarVishnu Dol, JoysagarGroup of Maidan, Charaideu
Total
1.2.3.4.5.
180639665
4170
1595
Domestic
45248133832
844838012
16520
288095
Tourist/Visitors (in Nos.)
TABLE-27.07REVENUE COLLECTION BY THE TOURIST LODGES IN ASSAM,
2019-20
1 2
Lodge/Year
KazirangaSivasagarBhalukpungChandubiBarpeta RoadGuwahatiJorhatTezpurSilcharNagaonHajo
TOTAL
1.2.3.4.5.6.7.8.9.10.11.
833900892834124800409000400764
4371079989263
1021373NA
991671NA
10034684
Revenue (in Rs.)
Source: (Table 27.01 to 27.07) Directorate of Tourism, Assam.

.
28.ENVIRONMENT

- 360 -
TABLE-AMBIENT AIR QUALITY (ANNUAL AVERAGE) AT
(Based on 24 hrs. Daily Average Data
1 2 3 4
Bamunimaidam, Guwahati-21
ITI Building, Gopinath Nagar
Santipur (Near Pragjyotish College)
Khanapara (Central Dairy campus,
Guwahati)
Gauhati University (Deptt. of Env.
Sc. campus, Guwahati)
Boragaon (IASST campus,
Guwahati)
Station/Location
Range(Min-Max) Mean
150
135
154
147
137
133
7 - 24
5 - 12
5 - 11
5 - 15
5 - 11
5 - 12
11
7
7
7
7
7
SO2
SO2=Sulphur Dioxide; NO2=Nitrogen Dioxide; PM10=Particulate Matter of size 10 micron;
No. of obs.(in days)
Annual National Standard for Residential areas
(in µg m-3)50
Parameters (µg m-3)
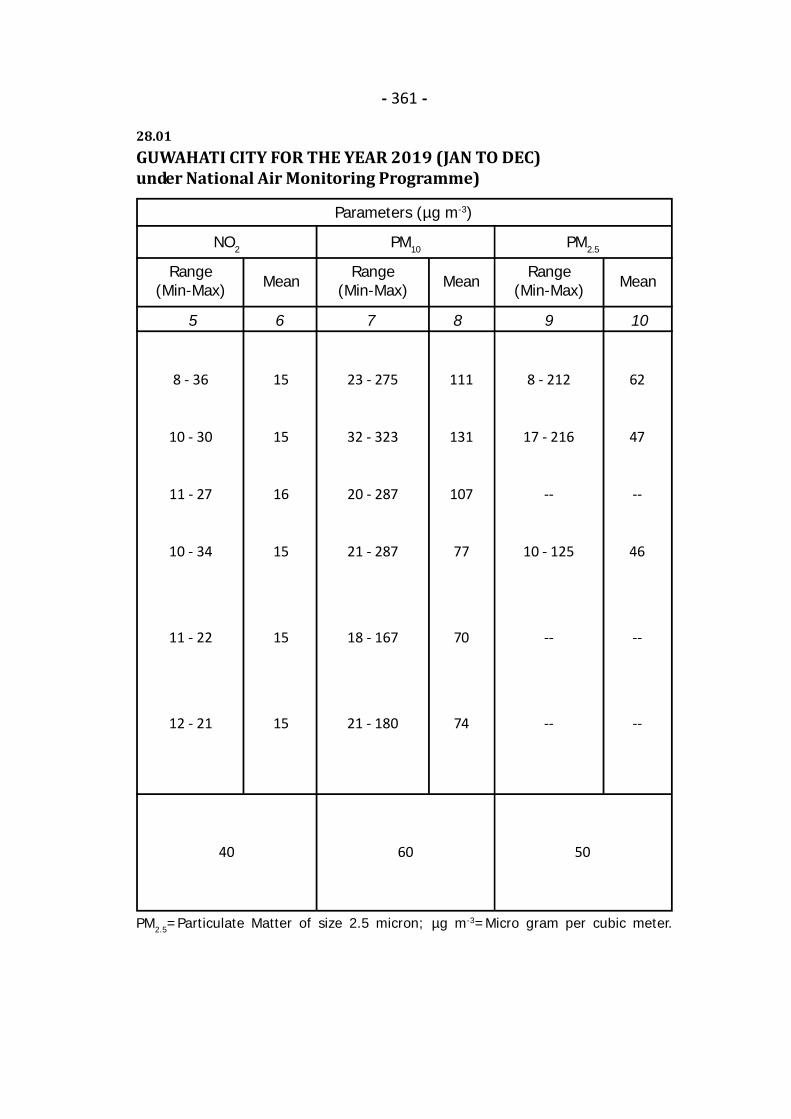
- 361 -
28.01GUWAHATI CITY FOR THE YEAR 2019 (JAN TO DEC)under National Air Monitoring Programme)
5 6 7 8 9 10
Range(Min-Max) Mean
NO2 PM10
PM2.5=Particulate Matter of size 2.5 micron; µg m-3=Micro gram per cubic meter.
PM2.5
Range(Min-Max) Mean
Range(Min-Max) Mean
8 - 36
10 - 30
11 - 27
10 - 34
11 - 22
12 - 21
15
15
16
15
15
15
23 - 275
32 - 323
20 - 287
21 - 287
18 - 167
21 - 180
111
131
107
77
70
74
8 - 212
17 - 216
--
10 - 125
--
--
62
47
--
46
--
--
5040 60
Parameters (µg m-3)
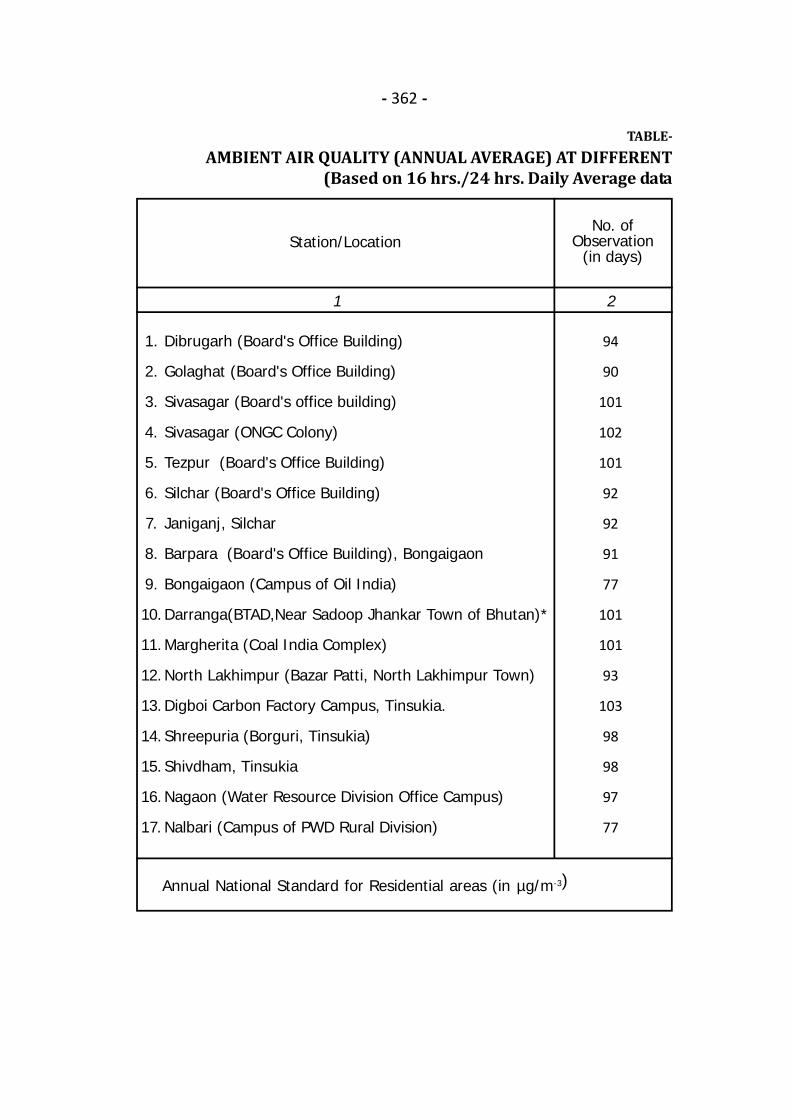
- 362 -
TABLE-AMBIENT AIR QUALITY (ANNUAL AVERAGE) AT DIFFERENT
(Based on 16 hrs./24 hrs. Daily Average data
1 2
Station/LocationNo. of
Observation(in days)
1.
2.
3.
4.
5.
6.
7.
8.
9.
10.
11.
12.
13.
14.
15.
16.
17.
Dibrugarh (Board's Office Building)
Golaghat (Board's Office Building)
Sivasagar (Board's office building)
Sivasagar (ONGC Colony)
Tezpur (Board's Office Building)
Silchar (Board's Office Building)
Janiganj, Silchar
Barpara (Board's Office Building), Bongaigaon
Bongaigaon (Campus of Oil India)
Darranga(BTAD,Near Sadoop Jhankar Town of Bhutan)*
Margherita (Coal India Complex)
North Lakhimpur (Bazar Patti, North Lakhimpur Town)
Digboi Carbon Factory Campus, Tinsukia.
Shreepuria (Borguri, Tinsukia)
Shivdham, Tinsukia
Nagaon (Water Resource Division Office Campus)
Nalbari (Campus of PWD Rural Division)
94
90
101
102
101
92
92
91
77
101
101
93
103
98
98
97
77
Annual National Standard for Residential areas (in µg/m-3)

- 363 -
28.02LOCATIONS IN ASSAM OTHER THAN GUWAHATI, 2019 (Jan to Dec)under National Air Monitoring Programme)
3 4 5 6 7 8
Range(Min-Max)
Range(Min-Max) Mean
Range(Min-Max) MeanMean
4 - 9
4 - 8
4 - 8
5 - 9
6 - 10
5 - 9
5 - 8
3 - 11
3 - 12
4 - 11
4 - 9
5 - 10
4 - 8
4 - 8
4 - 9
5 - 10
4 - 10
5
6
6
7
7
7
6
4
4
7
6
7
5
6
6
7
7
9 - 18
9 - 16
9 - 17
10 - 18
11 - 20
8 - 13
9 - 14
10 - 18
10 - 20
10 - 21
9 - 18
11 - 17
6 - 15
9 - 17
9 - 18
11 - 20
11 - 18
11
12
12
14
15
10
11
12
12
14
12
14
11
12
13
15
14
15 - 125
17 - 85
16 - 116
20 - 115
24 - 189
32 - 57
39 - 59
22 - 140
31 - 112
15 - 134
16 - 93
18 - 131
15 - 100
17 - 96
19 - 98
35 - 269
37 - 184
36
45
49
63
98
42
51
47
52
52
46
54
39
48
59
105
87
NO2 PM10
Parameters (Figure in µg/m-3)
50 40 60
SO2 = Sulphur Dioxide; NO2 = Nitrogen Dioxide; PM10 = Particulate Matter ofsize 10 micron; µg m-3 = Micro gram per cubic meter.
SO2
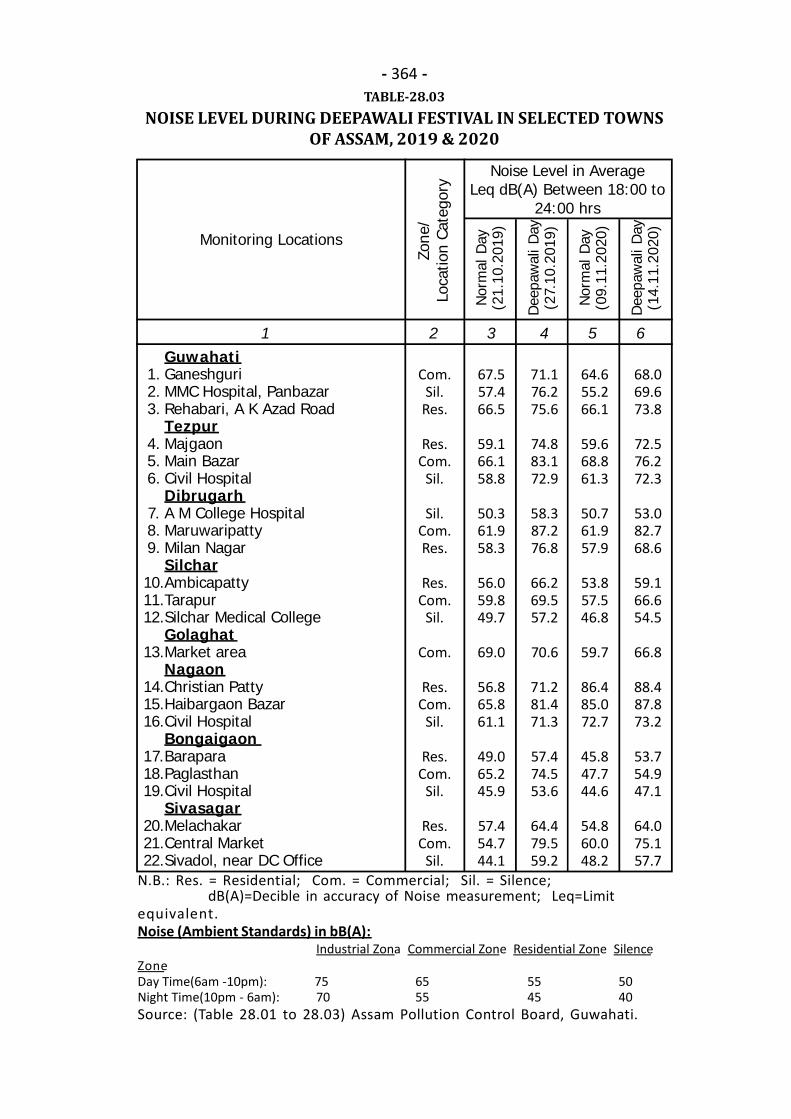
- 364 -TABLE-28.03
NOISE LEVEL DURING DEEPAWALI FESTIVAL IN SELECTED TOWNSOF ASSAM, 2019 & 2020
1 2 3 4 5 6
Monitoring Locations
Nor
mal
Day
(21.
10.2
019)
Dee
paw
ali D
ay(2
7.10
.201
9)
Noise Level in AverageLeq dB(A) Between 18:00 to
24:00 hrs
Zone
/Lo
catio
n Ca
tego
ry
GuwahatiGaneshguriMMC Hospital, PanbazarRehabari, A K Azad RoadTezpurMajgaonMain BazarCivil HospitalDibrugarhA M College HospitalMaruwaripattyMilan NagarSilcharAmbicapattyTarapurSilchar Medical CollegeGolaghatMarket areaNagaonChristian PattyHaibargaon BazarCivil HospitalBongaigaonBaraparaPaglasthanCivil HospitalSivasagarMelachakarCentral MarketSivadol, near DC Office
1.2.3.
4.5.6.
7.8.9.
10.11.12.
13.
14.15.16.
17.18.19.
20.21.22.
Com.Sil.
Res.
Res.Com.
Sil.
Sil.Com.Res.
Res.Com.
Sil.
Com.
Res.Com.
Sil.
Res.Com.
Sil.
Res.Com.
Sil.
Nor
mal
Day
(09.
11.2
020)
Dee
paw
ali D
ay(1
4.11
.202
0)
N.B.: Res. = Residential; Com. = Commercial; Sil. = Silence; dB(A)=Decible in accuracy of Noise measurement; Leq=Limitequivalent.Noise (Ambient Standards) in bB(A):
Industrial Zona Commercial Zone Residential Zone SilenceZoneDay Time(6am -10pm): 75 65 55 50Night Time(10pm - 6am): 70 55 45 40Source: (Table 28.01 to 28.03) Assam Pollution Control Board, Guwahati.
67.557.466.5
59.166.158.8
50.361.958.3
56.059.849.7
69.0
56.865.861.1
49.065.245.9
57.454.744.1
71.176.275.6
74.883.172.9
58.387.276.8
66.269.557.2
70.6
71.281.471.3
57.474.553.6
64.479.559.2
64.655.266.1
59.668.861.3
50.761.957.9
53.857.546.8
59.7
86.485.072.7
45.847.744.6
54.860.048.2
68.069.673.8
72.576.272.3
53.082.768.6
59.166.654.5
66.8
88.487.873.2
53.754.947.1
64.075.157.7
29.MISCELLANEOUS
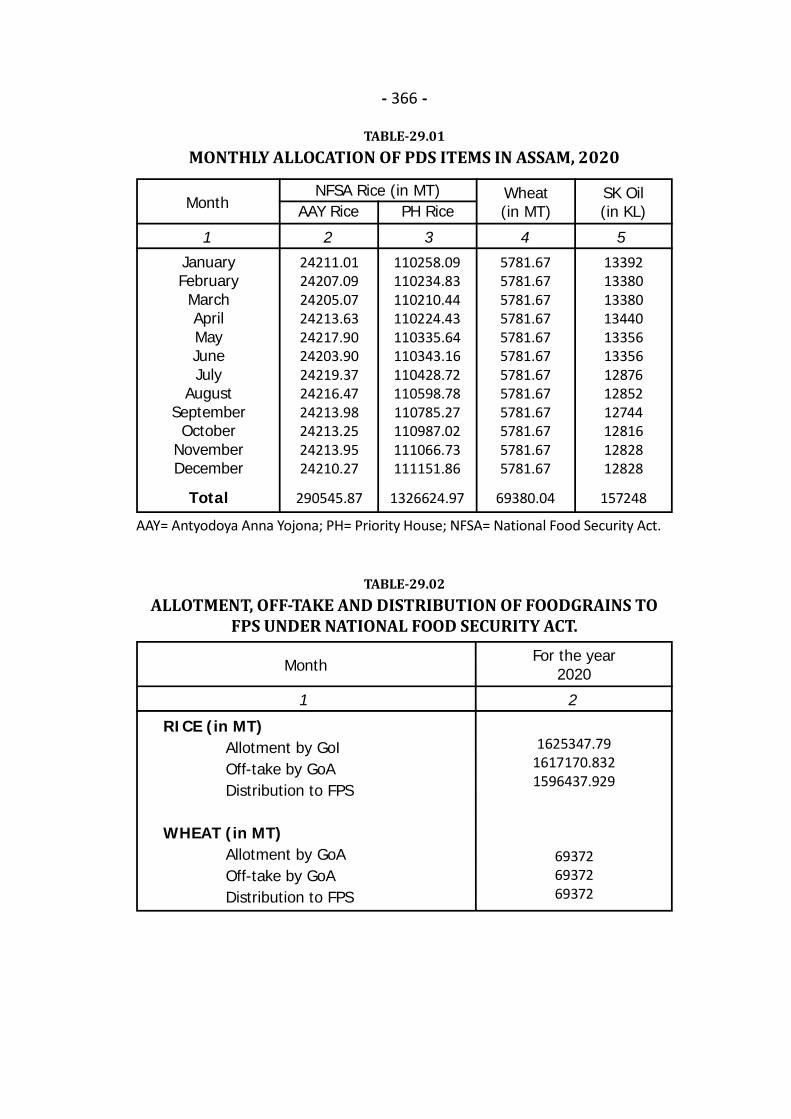
- 366 -
TABLE-29.01MONTHLY ALLOCATION OF PDS ITEMS IN ASSAM, 2020
AAY= Antyodoya Anna Yojona; PH= Priority House; NFSA= National Food Security Act.
1 2 3 4 5
Month AAY Rice PH RiceWheat(in MT)
SK Oil(in KL)
JanuaryFebruaryMarchAprilMayJuneJuly
AugustSeptember
OctoberNovemberDecember
Total
24211.0124207.0924205.0724213.6324217.9024203.9024219.3724216.4724213.9824213.2524213.9524210.27
290545.87
110258.09110234.83110210.44110224.43110335.64110343.16110428.72110598.78110785.27110987.02111066.73111151.86
1326624.97
5781.675781.675781.675781.675781.675781.675781.675781.675781.675781.675781.675781.67
69380.04
133921338013380134401335613356128761285212744128161282812828
157248
NFSA Rice (in MT)
TABLE-29.02ALLOTMENT, OFF-TAKE AND DISTRIBUTION OF FOODGRAINS TO
FPS UNDER NATIONAL FOOD SECURITY ACT.
1 2
MonthFor the year
2020
RICE (in MT)Allotment by GoIOff-take by GoADistribution to FPS
WHEAT (in MT)Allotment by GoAOff-take by GoADistribution to FPS
1625347.791617170.8321596437.929
693726937269372
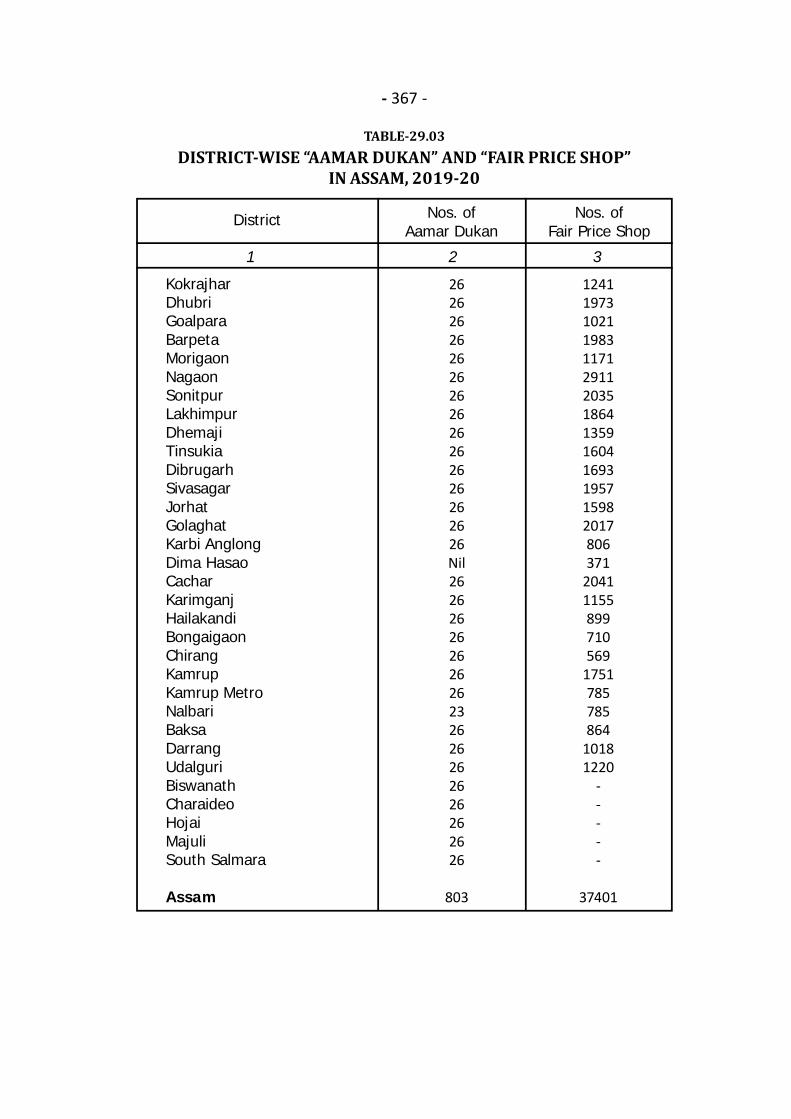
- 367 -
TABLE-29.03DISTRICT-WISE “AAMAR DUKAN” AND “FAIR PRICE SHOP”
IN ASSAM, 2019-20
1 2 3
KokrajharDhubriGoalparaBarpetaMorigaonNagaonSonitpurLakhimpurDhemajiTinsukiaDibrugarhSivasagarJorhatGolaghatKarbi AnglongDima HasaoCacharKarimganjHailakandiBongaigaonChirangKamrupKamrup MetroNalbariBaksaDarrangUdalguriBiswanathCharaideoHojaiMajuliSouth Salmara
Assam
District
12411973102119831171291120351864135916041693195715982017806371
20411155899710569
1751785785864
10181220
-----
37401
Nos. ofAamar Dukan
262626262626262626262626262626Nil26262626262626232626262626262626
803
Nos. ofFair Price Shop
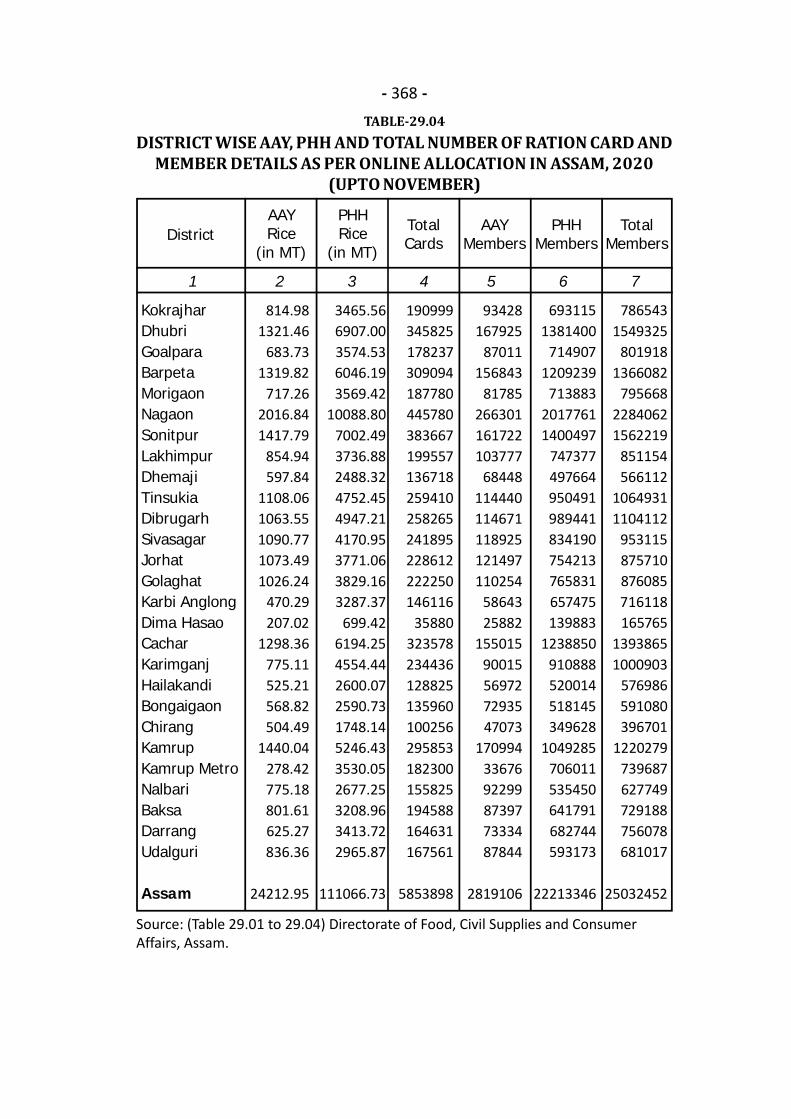
- 368 -TABLE-29.04
DISTRICT WISE AAY, PHH AND TOTAL NUMBER OF RATION CARD ANDMEMBER DETAILS AS PER ONLINE ALLOCATION IN ASSAM, 2020
(UPTO NOVEMBER)
1 2 3 4 5 6 7
DistrictAAYRice
(in MT)
PHHRice
(in MT)
TotalCards
AAYMembers
KokrajharDhubriGoalparaBarpetaMorigaonNagaonSonitpurLakhimpurDhemajiTinsukiaDibrugarhSivasagarJorhatGolaghatKarbi AnglongDima HasaoCacharKarimganjHailakandiBongaigaonChirangKamrupKamrup MetroNalbariBaksaDarrangUdalguri
Assam
814.981321.46
683.731319.82
717.262016.841417.79
854.94597.84
1108.061063.551090.771073.491026.24
470.29207.02
1298.36775.11525.21568.82504.49
1440.04278.42775.18801.61625.27836.36
24212.95
3465.566907.003574.536046.193569.42
10088.807002.493736.882488.324752.454947.214170.953771.063829.163287.37
699.426194.254554.442600.072590.731748.145246.433530.052677.253208.963413.722965.87
111066.73
190999345825178237309094187780445780383667199557136718259410258265241895228612222250146116
35880323578234436128825135960100256295853182300155825194588164631167561
5853898
93428167925
87011156843
81785266301161722103777
68448114440114671118925121497110254
5864325882
15501590015569727293547073
1709943367692299873977333487844
2819106
PHHMembers
TotalMembers
6931151381400
7149071209239
71388320177611400497
747377497664950491989441834190754213765831657475139883
1238850910888520014518145349628
1049285706011535450641791682744593173
22213346
7865431549325
8019181366082
79566822840621562219
851154566112
10649311104112
953115875710876085716118165765
13938651000903
576986591080396701
1220279739687627749729188756078681017
25032452
Source: (Table 29.01 to 29.04) Directorate of Food, Civil Supplies and ConsumerAffairs, Assam.
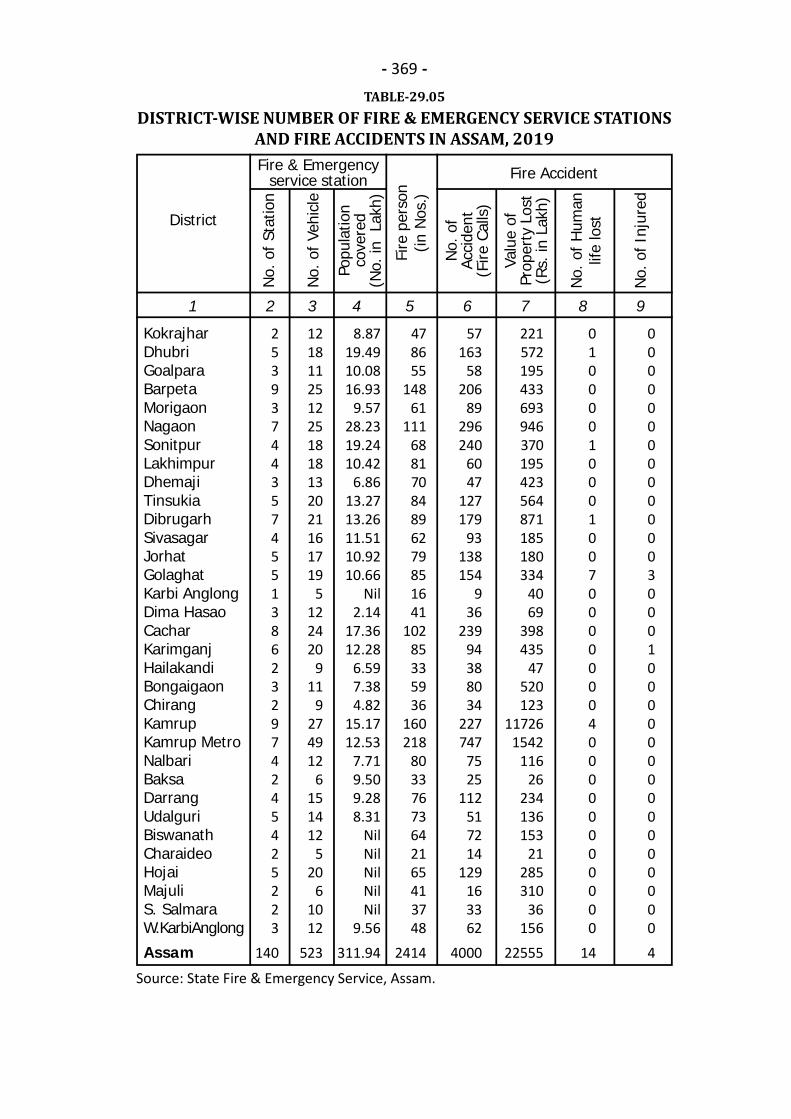
- 369 -TABLE-29.05
DISTRICT-WISE NUMBER OF FIRE & EMERGENCY SERVICE STATIONSAND FIRE ACCIDENTS IN ASSAM, 2019
Source: State Fire & Emergency Service, Assam.
1 2 3 4 5 6 7 8 9
KokrajharDhubriGoalparaBarpetaMorigaonNagaonSonitpurLakhimpurDhemajiTinsukiaDibrugarhSivasagarJorhatGolaghatKarbi AnglongDima HasaoCacharKarimganjHailakandiBongaigaonChirangKamrupKamrup MetroNalbariBaksaDarrangUdalguriBiswanathCharaideoHojaiMajuliS. SalmaraW.KarbiAnglong
Assam
District
Fire & Emergencyservice station
No.
of
Stat
ion
Fire Accident
253937443574551386232974245425223
140
8.8719.4910.0816.93
9.5728.2319.2410.42
6.8613.2713.2611.5110.9210.66
Nil2.14
17.3612.28
6.597.384.82
15.1712.53
7.719.509.288.31
NilNilNilNilNil
9.56311.94
478655
14861
11168817084896279851641
10285335936
160218
80337673642165413748
2414
57163
58206
89296240
6047
127179
93138154
936
23994388034
227747
7525
112517214
129163362
4000
221572195433693946370195423564871185180334
4069
398435
47520123
117261542
11626
234136153
21285310
36156
22555
010000100010070000000400000000000
14
0000000000000300010000000000000004
Popu
latio
nco
vere
d(N
o. in
Lak
h)
No.
of
Acci
dent
(Fire
Cal
ls)
Valu
e of
Prop
erty
Los
t(R
s. in
Lak
h)
No.
of
Hum
anlif
e lo
st
No.
of I
njur
ed
Fire
per
son
(in N
os.)
No.
of
Vehi
cle
1218112512251818132021161719
5122420
911
9274912
6151412
520
61012
523

- 370 -
TABLE-29.06DISTRICT-WISE STATISTICS OF WAREHOUSE CENTRES OF THE
ASSAM STATE WAREHOUSING CORPORATION IN ASSAM, 2019-20
Source: Assam State Warehousing Corporation.
1 2 3 4 5 6 7
District OwnConst
TempShed
HiredGodown Total
KokrajharDhubriGoalparaBarpetaMorigaonNagaonSonitpurLakhimpurDhemajiTinsukiaDibrugarhSivasagarJorhatGolaghatKarbi AnglongDima HasaoCacharKarimganjHailakandiBongaigaonChirangKamrupKamrup MetroNalbariBaksaDarrangUdalguriBiswanathCharaideoHojaiMajuliSouth SalmaraWest K.Anglong
Assam
2000Nil
14211NilNil
1673044333177
11632818457509845
Nil51706032
Nil14502450
Nil20010
Nil1983326019
NilNil
46606100
495Nil
15462NilNilNil
183643
NilNilNilNilNilNilNilNilNilNilNilNilNilNilNilNilNilNilNilNilNilNilNilNilNilNilNilNilNilNilNilNilNil
Nil
NilNilNil
8079NilNilNilNilNilNilNilNilNilNilNilNil
4455NilNilNilNil
3276417NilNil
200NilNilNilNilNilNilNil
16427
2000Nil
142118079
Nil16730
44333177
11632818457509845
Nil51706032
Nil59052450
Nil20010
Nil2310926436
NilNil
48606100
495Nil
15462NilNilNil
200070
Capacity (in M.T.)Nos. ofCentres
RevenueReceived(IN Rs.)
1Nil
31
Nil3115211
Nil22
Nil11
Nil1
Nil63
NilNil
221
Nil3
NilNilNil
43
NilNil
134897339446502
Nil14866730
1815052535647705970
982445113523077917571
Nil20093212114314
Nil64316001805083
Nil16003511
Nil2257460718543059
NilNil
3040372173723121080
Nil7366027
NilNilNil
140136660
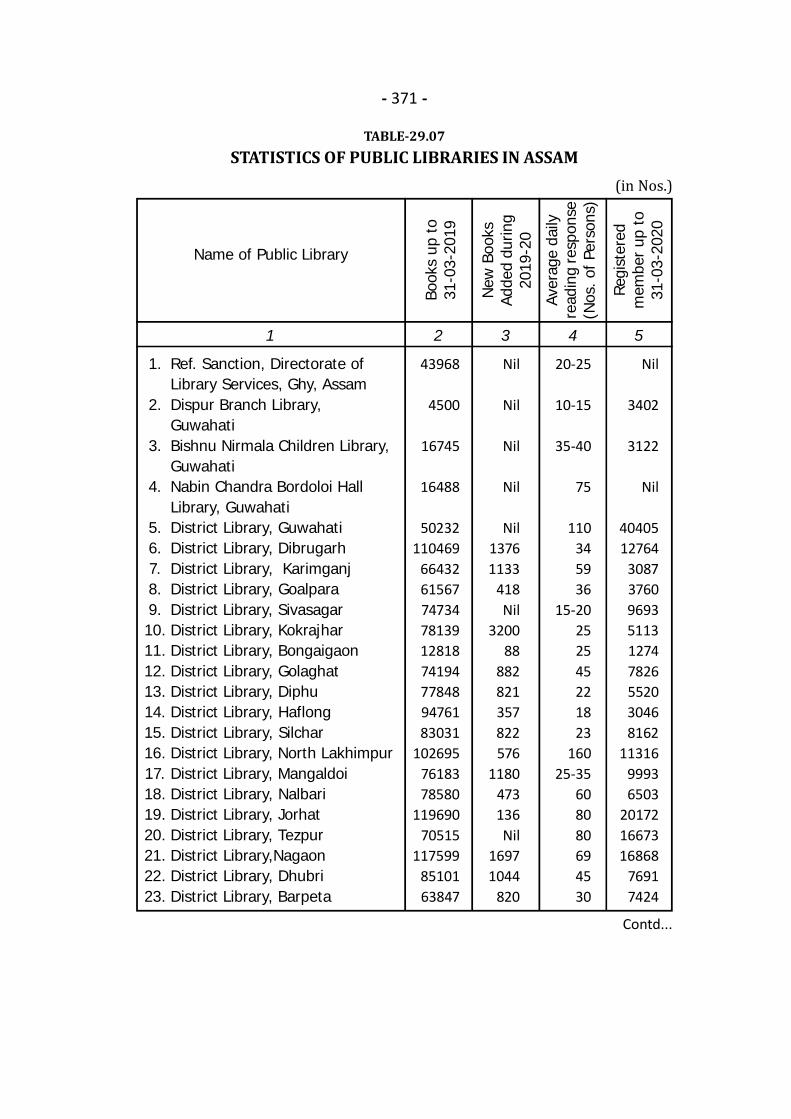
- 371 -
TABLE-29.07STATISTICS OF PUBLIC LIBRARIES IN ASSAM
Contd...
1 2 3 4 5
Book
s up
to
31-0
3-20
19
Name of Public Library
1.
2.
3.
4.
5.6.7.8.9.10.11.12.13.14.15.16.17.18.19.20.21.22.23.
Ref. Sanction, Directorate ofLibrary Services, Ghy, AssamDispur Branch Library,GuwahatiBishnu Nirmala Children Library,GuwahatiNabin Chandra Bordoloi HallLibrary, GuwahatiDistrict Library, GuwahatiDistrict Library, DibrugarhDistrict Library, KarimganjDistrict Library, GoalparaDistrict Library, SivasagarDistrict Library, KokrajharDistrict Library, BongaigaonDistrict Library, GolaghatDistrict Library, DiphuDistrict Library, HaflongDistrict Library, SilcharDistrict Library, North LakhimpurDistrict Library, MangaldoiDistrict Library, NalbariDistrict Library, JorhatDistrict Library, TezpurDistrict Library,NagaonDistrict Library, DhubriDistrict Library, Barpeta
43968
4500
16745
16488
50232110469
664326156774734781391281874194778489476183031
1026957618378580
11969070515
1175998510163847
Nil
Nil
Nil
Nil
Nil13761133
418Nil
320088
882821357822576
1180473136Nil
16971044
820
20-25
10-15
35-40
75
110345936
15-20252545221823
16025-35
608080694530
Nil
3402
3122
Nil
4040512764
308737609693511312747826552030468162
1131699936503
201721667316868
76917424
New
Boo
ksAd
ded
durin
g20
19-2
0
Aver
age
daily
read
ing
resp
onse
(Nos
. of P
erso
ns)
Regi
ster
edm
embe
r up
to
31-0
3-20
20
(in Nos.)
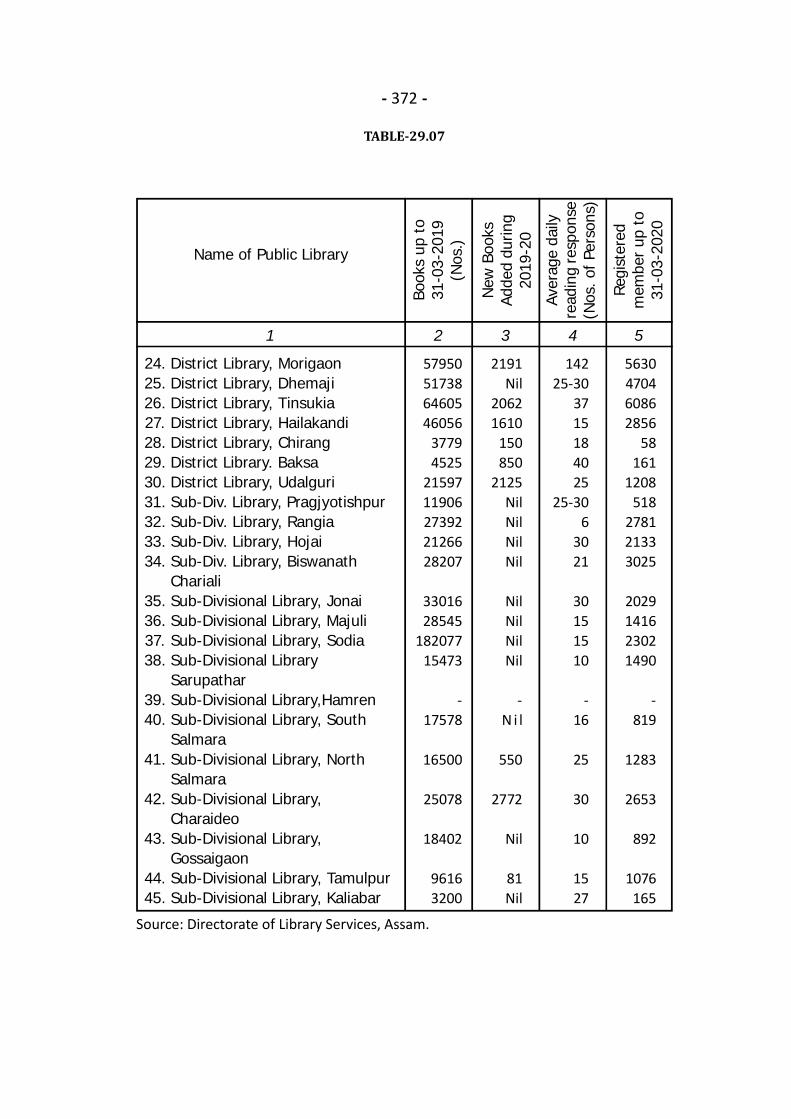
- 372 -
TABLE-29.07
Source: Directorate of Library Services, Assam.
1 2 3 4 5
Name of Public Library
24.25.26.27.28.29.30.31.32.33.34.
35.36.37.38.
39.40.
41.
42.
43.
44.45.
District Library, MorigaonDistrict Library, DhemajiDistrict Library, TinsukiaDistrict Library, HailakandiDistrict Library, ChirangDistrict Library. BaksaDistrict Library, UdalguriSub-Div. Library, PragjyotishpurSub-Div. Library, RangiaSub-Div. Library, HojaiSub-Div. Library, BiswanathCharialiSub-Divisional Library, JonaiSub-Divisional Library, MajuliSub-Divisional Library, SodiaSub-Divisional LibrarySarupatharSub-Divisional Library,HamrenSub-Divisional Library, SouthSalmaraSub-Divisional Library, NorthSalmaraSub-Divisional Library,CharaideoSub-Divisional Library,GossaigaonSub-Divisional Library, TamulpurSub-Divisional Library, Kaliabar
57950517386460546056
37794525
2159711906273922126628207
3301628545
18207715473
-17578
16500
25078
18402
96163200
2191Nil
20621610
150850
2125NilNilNilNil
NilNilNilNil
-N i l
550
2772
Nil
81Nil
14225-30
3715184025
25-306
3021
30151510
-16
25
30
10
1527
5630470460862856
58161
1208518
278121333025
2029141623021490
-819
1283
2653
892
1076165
Book
s up
to
31-0
3-20
19(N
os.)
New
Boo
ksAd
ded
durin
g20
19-2
0
Aver
age
daily
read
ing
resp
onse
(Nos
. of P
erso
ns)
Regi
ster
edm
embe
r up
to
31-0
3-20
20

- 373 -
TABLE-29.08LOSS DUE TO DISASTER IN ASSAM DURING 2019
1 2 3 4 5 6 7 8 9 10 11
KokrajharDhubriGoalparaBarpetaMorigaonNagaonSonitpurLakhimpurDhemajiTinsukiaDibrugarhSivasagarJorhatGolaghatKarbi AnglongDima HasaoCacharKarimganjHailakandiBongaigaonChirangKamrupKamrup MetroNalbariBaksaDarrangUdalguriBiswanathCharaideoHojaiMajuliSouth SalmaraW K AnglongAssam
District
Human Live Lost(in Nos.)
Floo
d
1123
16263307000251120110122503500000
102
000100000240010011001000000000000
11
0000000000000000000000100000000001
660335041001100051001400002200000
45
0000000000000000000000000000000000
0000
3100400600
11400070
35000
45080000000
250
30.121232.88
291.903874.46
42.76630.40
89.604.23
18.830
125.611.75
55.71344.23
0.292077.27
9.025.74
46.18361.20341.78410.66
5.66258.46
27.5763.9022.7114.33
010.3418.73
327.720.26
10744.30
Thun
der-
stor
m
Ligh
teni
ng
Land
Slid
e
Catt
le
Agric
ultu
re L
ost
in F
lood
(Rs.
in L
akh)
Prop
oert
y lo
st(H
ouse
dam
aged
in F
lood
)(R
s. in
Lak
h)
Oth
ers
Poul
try
0000000000000
55600000
10000000000000000
1556
222.451042.611189.331976.241854.70
510.16463.56606.61769.54
77.04297.84
62.06307.54395.72
00
3.06406.46
79.22396.91415.21350.16
39.61640.17799.62
1934.22227.36317.97
40.5390.59
238.1100
15754.60
0000
3.5800
0.8300
1.5100
26.65000
2.050
5.33000
2.160
2.160000000
44.27
Live
stoc
k Lo
st in
Floo
d(R
s. in
Lak
h)Livestock lostin Flood (No.)
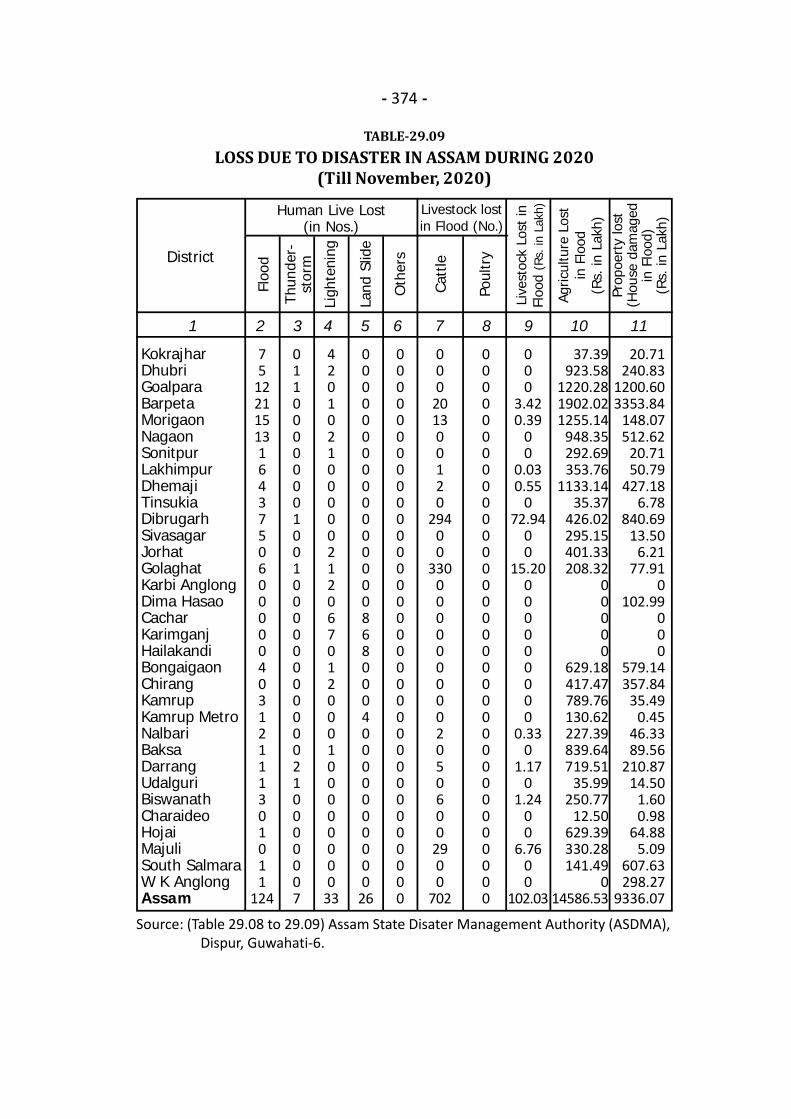
Source: (Table 29.08 to 29.09) Assam State Disater Management Authority (ASDMA), Dispur, Guwahati-6.
.- 374 -
TABLE-29.09LOSS DUE TO DISASTER IN ASSAM DURING 2020
(Till November, 2020)
1 2 3 4 5 6 7 8 9 10 11
KokrajharDhubriGoalparaBarpetaMorigaonNagaonSonitpurLakhimpurDhemajiTinsukiaDibrugarhSivasagarJorhatGolaghatKarbi AnglongDima HasaoCacharKarimganjHailakandiBongaigaonChirangKamrupKamrup MetroNalbariBaksaDarrangUdalguriBiswanathCharaideoHojaiMajuliSouth SalmaraW K AnglongAssam
District
Human Live Lost(in Nos.)
Floo
d
75
12211513164375060000040312111301011
124
0110000000100100000000000210000007
000000000000000086800040000000000
26
420102100000212067012000100000000
33
0000000000000000000000000000000000
000
201300120
29400
3300000000002050600
2900
702
20.71240.83
1200.603353.84
148.07512.62
20.7150.79
427.186.78
840.6913.50
6.2177.91
0102.99
000
579.14357.84
35.490.45
46.3389.56
210.8714.50
1.600.98
64.885.09
607.63298.27
9336.07
Thun
der-
stor
m
Ligh
teni
ng
Land
Slid
e
Catt
le
Agric
ultu
re L
ost
in F
lood
(Rs.
in L
akh)
Prop
oert
y lo
st(H
ouse
dam
aged
in F
lood
)(R
s. in
Lak
h)
Oth
ers
Poul
try
0000000000000000000000000000000000
37.39923.58
1220.281902.021255.14
948.35292.69353.76
1133.1435.37
426.02295.15401.33208.32
00000
629.18417.47789.76130.62227.39839.64719.51
35.99250.77
12.50629.39330.28141.49
014586.53
000
3.420.39
00
0.030.55
072.94
00
15.20000000000
0.330
1.170
1.2400
6.7600
102.03
Live
stoc
k Lo
st in
Floo
d(R
s. in
Lak
h)Livestock lostin Flood (No.)
30.INTER STATE COMPARISON
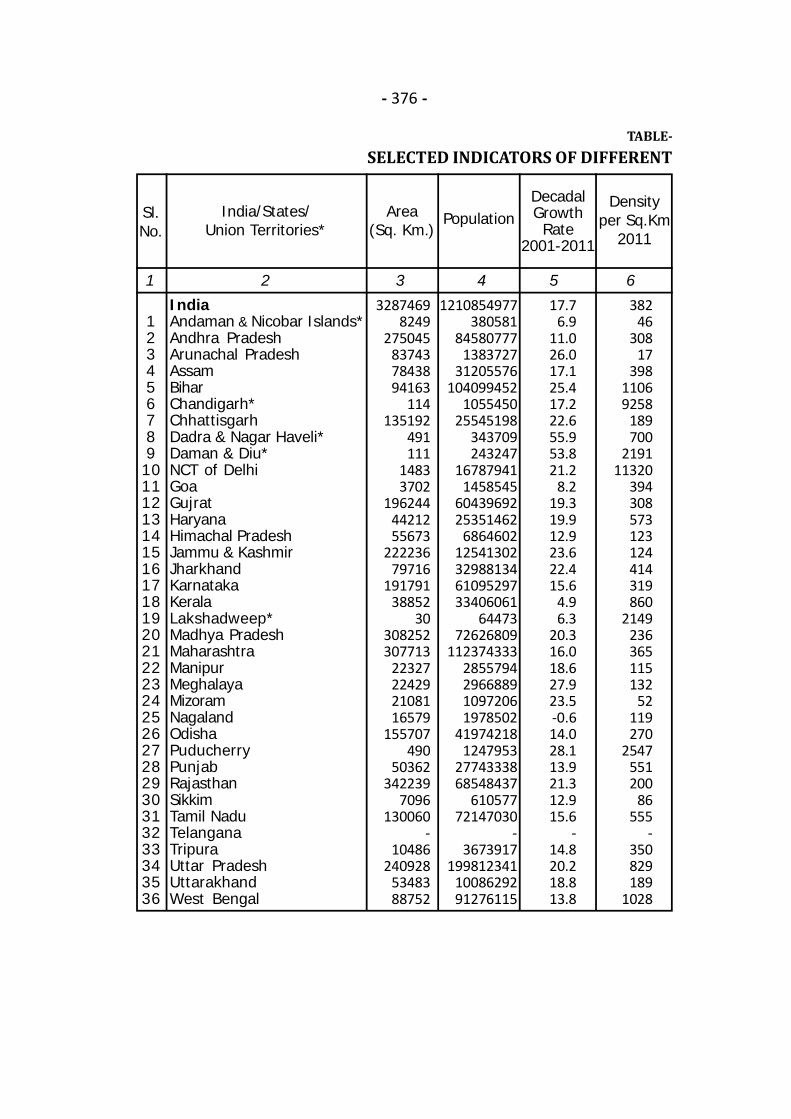
- 376 -
TABLE-SELECTED INDICATORS OF DIFFERENT
1 2 3 4 5 6
India/States/Union Territories*
Area(Sq. Km.)
PopulationDecadalGrowthRate
2001-2011
Densityper Sq.Km
2011
Sl.No.
123456789101112131415161718192021222324252627282930313233343536
IndiaAndaman & Nicobar Islands*Andhra PradeshArunachal PradeshAssamBiharChandigarh*ChhattisgarhDadra & Nagar Haveli*Daman & Diu*NCT of DelhiGoaGujratHaryanaHimachal PradeshJammu & KashmirJharkhandKarnatakaKeralaLakshadweep*Madhya PradeshMaharashtraManipurMeghalayaMizoramNagalandOdishaPuducherryPunjabRajasthanSikkimTamil NaduTelanganaTripuraUttar PradeshUttarakhandWest Bengal
32874698249
275045837437843894163
114135192
491111
14833702
1962444421255673
22223679716
19179138852
30308252307713
22327224292108116579
155707490
50362342239
7096130060
-10486
2409285348388752
1210854977380581
845807771383727
31205576104099452
105545025545198
343709243247
167879411458545
6043969225351462
686460212541302329881346109529733406061
6447372626809
1123743332855794296688910972061978502
419742181247953
2774333868548437
61057772147030
-3673917
1998123411008629291276115
17.76.9
11.026.017.125.417.222.655.953.821.2
8.219.319.912.923.622.415.6
4.96.3
20.316.018.627.923.5-0.614.028.113.921.312.915.6
-14.820.218.813.8
38246
30817
39811069258
189700
219111320
394308573123124414319860
2149236365115132
52119270
2547551200
86555
-350829189
1028
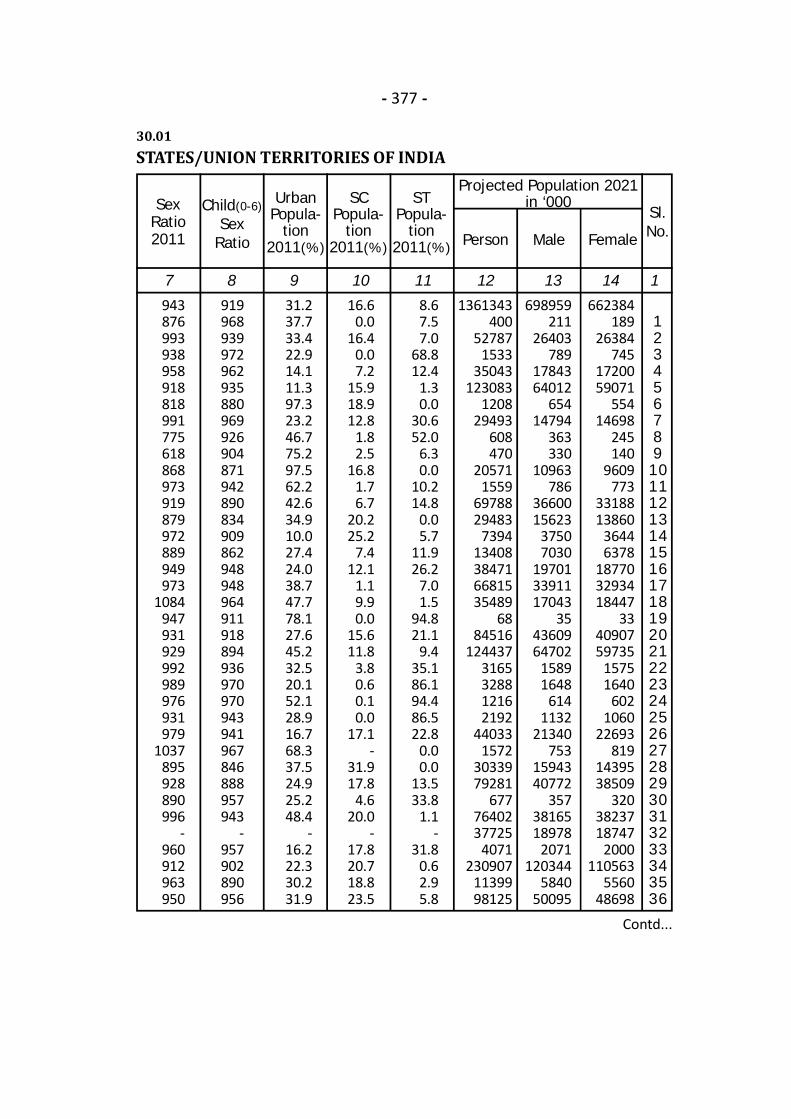
- 377 -
30.01STATES/UNION TERRITORIES OF INDIA
7 8 9 10 11 12 13 14 1
UrbanPopula-
tion2011(%)
STPopula-
tion2011(%) Person Male
Sl.No.
SCPopula-
tion2011(%)
SexRatio2011
Child(0-6)Sex
Ratio
943876993938958918818991775618868973919879972889949973
1084947931929992989976931979
1037895928890996
-960912963950
919968939972962935880969926904871942890834909862948948964911918894936970970943941967846888957943
-957902890956
31.237.733.422.914.111.397.323.246.775.297.562.242.634.910.027.424.038.747.778.127.645.232.520.152.128.916.768.337.524.925.248.4
-16.222.330.231.9
16.60.0
16.40.07.2
15.918.912.8
1.82.5
16.81.76.7
20.225.2
7.412.1
1.19.90.0
15.611.8
3.80.60.10.0
17.1-
31.917.8
4.620.0
-17.820.718.823.5
8.67.57.0
68.812.4
1.30.0
30.652.0
6.30.0
10.214.8
0.05.7
11.926.2
7.01.5
94.821.1
9.435.186.194.486.522.8
0.00.0
13.533.8
1.1-
31.80.62.95.8
1361343400
527871533
35043123083
120829493
608470
205711559
6978829483
739413408384716681535489
6884516
1244373165328812162192
440331572
3033979281
6777640237725
4071230907
1139998125
698959211
26403789
1784364012
65414794
363330
10963786
3660015623
37507030
197013391117043
354360964702
15891648
6141132
21340753
1594340772
3573816518978
2071120344
584050095
662384189
26384745
1720059071
55414698
245140
9609773
3318813860
36446378
187703293418447
334090759735
15751640
6021060
22693819
1439538509
3203823718747
2000110563
556048698
123456789101112131415161718192021222324252627282930313233343536
Female
Projected Population 2021in ‘000
Contd...

- 378 -
TABLE-
Source: (Col.3 to Col.21) Census of India, 2011.
1 2 15 16 17 18
India/States/Union Territories*
House-holds(Nos.)Person Male Female
Sl.No.
123456789101112131415161718192021222324252627282930313233343536
IndiaAndaman & Nicobar Islands*Andhra PradeshArunachal PradeshAssamBiharChandigarh*ChhattisgarhDadra & Nagar Haveli*Daman & Diu*NCT of DelhiGoaGujratHaryanaHimachal PradeshJammu & KashmirJharkhandKarnatakaKeralaLakshadweep*Madhya PradeshMaharashtraManipurMeghalayaMizoramNagalandOdishaPuducherryPunjabRajasthanSikkimTamil NaduTelanganaTripuraUttar PradeshUttarakhandWest Bengal
24945425294551
21022588270577
640647118913565
2411735650724
7645860956
3435999343611
122484284857524148328021197186254781
133570277853754
115741509325624421519
510448548059222853396002
6937820302450
551307112711146
12900618524982
-855556
334480352056975
20380315
72.9986.6376.0265.3872.1961.8085.0570.2876.2487.1086.2188.7078.0375.5582.8067.1666.4175.3694.0091.8569.3282.3479.2174.4391.3379.5572.8785.8575.8466.1181.4280.09
-87.2267.6878.8276.26
80.8990.2774.8872.5577.8571.2089.9980.2785.1791.5490.9492.6585.7584.0689.5376.7581.6982.4796.1195.5678.7388.3886.0675.9593.3582.7581.5991.2680.4479.1986.5586.77
-91.5377.2887.4081.69
64.6482.4359.1557.7066.2751.5081.1960.2464.3279.5580.7684.6669.6865.9475.9356.4355.4268.0892.0787.9559.2475.8772.3772.8989.2776.1164.0180.6770.7352.1275.6173.44
-82.7357.1870.0170.54
Literacy Rate (2011)
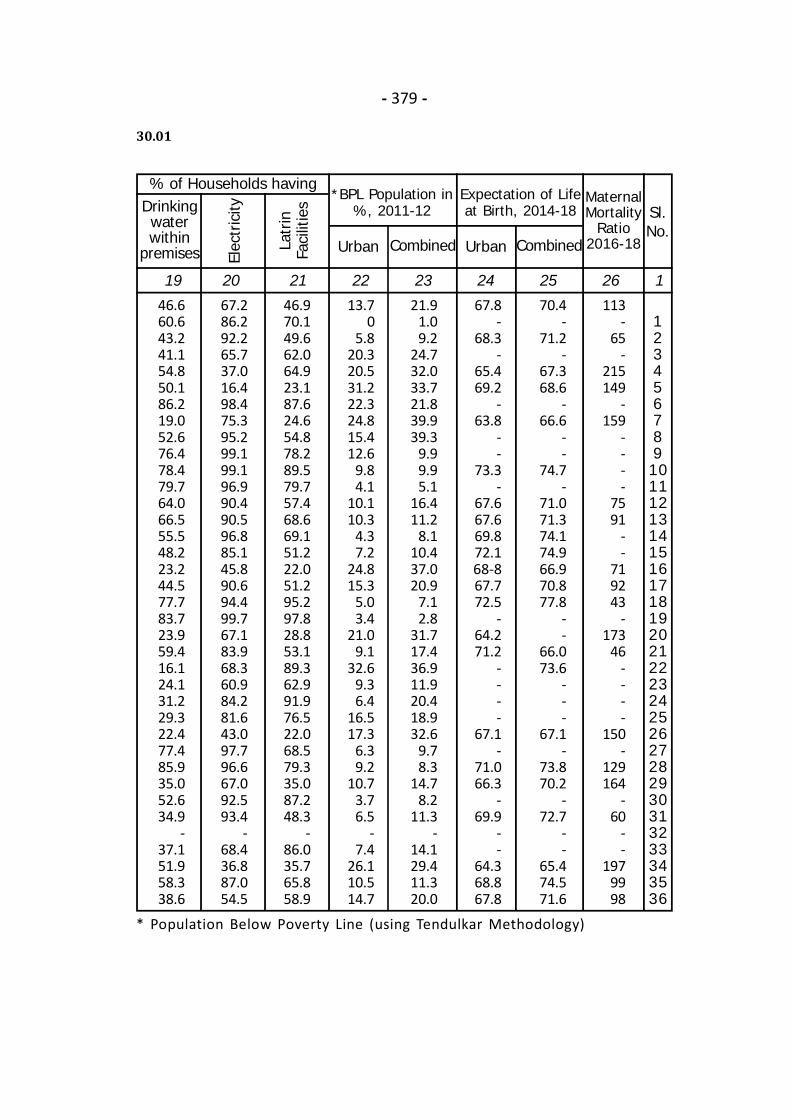
- 379 -
30.01
* Population Below Poverty Line (using Tendulkar Methodology)
19 20 21 22 23 24 25 26 1
Drinkingwaterwithin
premises Elec
tric
ity
Latr
inFa
cilit
ies Sl.
No.
123456789101112131415161718192021222324252627282930313233343536
46.660.643.241.154.850.186.219.052.676.478.479.764.066.555.548.223.244.577.783.723.959.416.124.131.229.322.477.485.935.052.634.9
-37.151.958.338.6
67.286.292.265.737.016.498.475.395.299.199.196.990.490.596.885.145.890.694.499.767.183.968.360.984.281.643.097.796.667.092.593.4
-68.436.887.054.5
46.970.149.662.064.923.187.624.654.878.289.579.757.468.669.151.222.051.295.297.828.853.189.362.991.976.522.068.579.335.087.248.3
-86.035.765.858.9
% of Households having
Urban
MaternalMortality
Ratio2016-18Combined
*BPL Population in%, 2011-12
Expectation of Lifeat Birth, 2014-18
Urban Combined
13.70
5.820.320.531.222.324.815.412.6
9.84.1
10.110.3
4.37.2
24.815.3
5.03.4
21.09.1
32.69.36.4
16.517.3
6.39.2
10.73.76.5
-7.4
26.110.514.7
21.91.09.2
24.732.033.721.839.939.3
9.99.95.1
16.411.2
8.110.437.020.9
7.12.8
31.717.436.911.920.418.932.6
9.78.3
14.78.2
11.3-
14.129.411.320.0
67.8-
68.3-
65.469.2
-63.8
--
73.3-
67.667.669.872.168-867.772.5
-64.271.2
----
67.1-
71.066.3
-69.9
--
64.368.867.8
70.4-
71.2-
67.368.6
-66.6
--
74.7-
71.071.374.174.966.970.877.8
--
66.073.6
---
67.1-
73.870.2
-72.7
--
65.474.571.6
113-
65-
215149
-159
----
7591
--
719243
-173
46----
150-
129164
-60
--
1979998
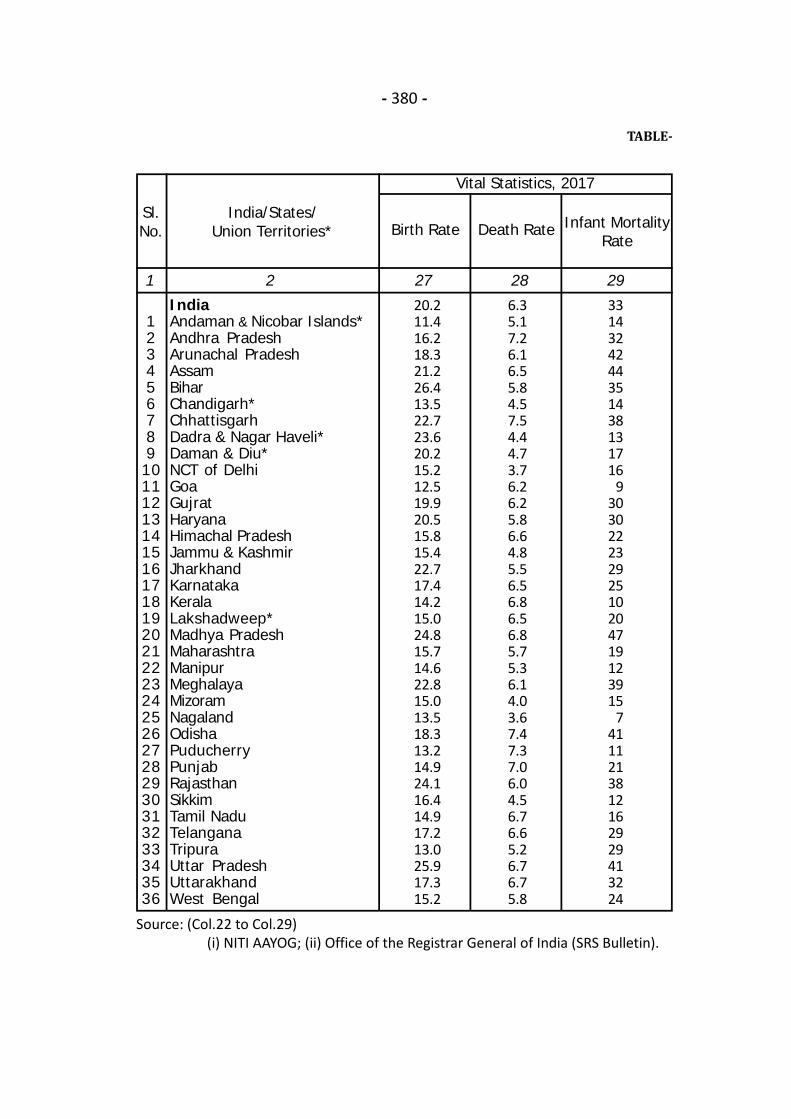
- 380 -
TABLE-
Source: (Col.22 to Col.29) (i) NITI AAYOG; (ii) Office of the Registrar General of India (SRS Bulletin).
1 2 27 28 29
India/States/Union Territories* Birth Rate Death Rate Infant Mortality
Rate
Sl.No.
123456789101112131415161718192021222324252627282930313233343536
IndiaAndaman & Nicobar Islands*Andhra PradeshArunachal PradeshAssamBiharChandigarh*ChhattisgarhDadra & Nagar Haveli*Daman & Diu*NCT of DelhiGoaGujratHaryanaHimachal PradeshJammu & KashmirJharkhandKarnatakaKeralaLakshadweep*Madhya PradeshMaharashtraManipurMeghalayaMizoramNagalandOdishaPuducherryPunjabRajasthanSikkimTamil NaduTelanganaTripuraUttar PradeshUttarakhandWest Bengal
20.211.416.218.321.226.413.522.723.620.215.212.519.920.515.815.422.717.414.215.024.815.714.622.815.013.518.313.214.924.116.414.917.213.025.917.315.2
6.35.17.26.16.55.84.57.54.44.73.76.26.25.86.64.85.56.56.86.56.85.75.36.14.03.67.47.37.06.04.56.76.65.26.76.75.8
3314324244351438131716
930302223292510204719123915
74111213812162929413224
Vital Statistics, 2017
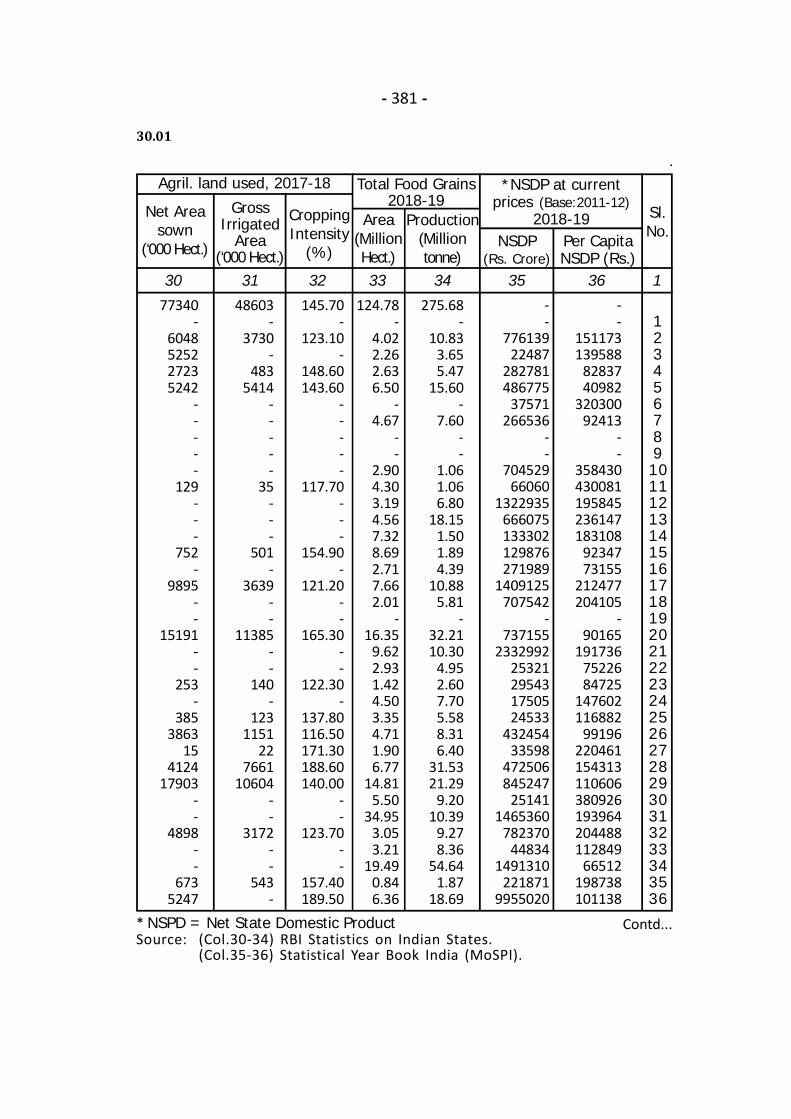
- 381 -
30.01 .
30 31 32 33 34 35 36 1
GrossIrrigated
Area(‘000 Hect.)
CroppingIntensity
(%)
Area(MillionHect.)
Sl.No.
Net Areasown
(‘000 Hect.)
77340-
6048525227235242
-----
129---
752-
9895--
15191--
253-
3853863
154124
17903--
4898--
6735247
48603-
3730-
4835414
-----
35---
501-
3639--
11385--
140-
1231151
227661
10604--
3172--
543-
145.70-
123.10-
148.60143.60
-----
117.70---
154.90-
121.20--
165.30--
122.30-
137.80116.50171.30188.60140.00
--
123.70--
157.40189.50
124.78-
4.022.262.636.50
-4.67
--
2.904.303.194.567.328.692.717.662.01
-16.35
9.622.931.424.503.354.711.906.77
14.815.50
34.953.053.21
19.490.846.36
275.68-
10.833.655.47
15.60-
7.60--
1.061.066.80
18.151.501.894.39
10.885.81
-32.2110.30
4.952.607.705.588.316.40
31.5321.29
9.2010.39
9.278.36
54.641.87
18.69
123456789101112131415161718192021222324252627282930313233343536
Production(Milliontonne)
Total Food Grains2018-19
Contd...* NSPD = Net State Domestic ProductSource: (Col.30-34) RBI Statistics on Indian States.
(Col.35-36) Statistical Year Book India (MoSPI).
Agril. land used, 2017-18
--
77613922487
282781486775
37571266536
--
70452966060
1322935666075133302129876271989
1409125707542
-737155
233299225321295431750524533
43245433598
472506845247
251411465360
78237044834
1491310221871
9955020
--
151173139588
8283740982
32030092413
--
358430430081195845236147183108
9234773155
212477204105
-90165
1917367522684725
147602116882
99196220461154313110606380926193964204488112849
66512198738101138
Per CapitaNSDP (Rs.)
NSDP(Rs. Crore)
*NSDP at currentprices (Base:2011-12)
2018-19

- 382 -
TABLE-
1 2 37 38 39
Contd...Source: (Col.37-39) Reserve Bank of India.
Deposit(Rs. in crore)
Credit(Rs. in crore)
14537469
7087155
24046917
4422634
5947
3716697
81505008163518303051
102856622
136747
12943192346192164
4914253
66147391
14311206
5227463
1746221268170
126390095186
30045216659
147091353169
68300142656
39945055
121010871135
674922409974
95529118122218585934364485762
1096368951
26078459927
240639255
11183309554
17818379577379008
9632798738458581
248801041507
137040779291
98975952181
3735723869
67360124996
7795694404
27091490
131416519416
591533278875
303325428263245
701678334847
90262105
24269204946744838373991
12764612363
236211325240
2921891030518518
10463470245
53036403677
Distribution of All Scheduled CommercialBanks (Reporting) as on March, 2019
Offices(in Nos.)
India/States/Union Territories*
Sl.No.
123456789101112131415161718192021222324252627282930313233343536
IndiaAndaman & Nicobar Islands*Andhra PradeshArunachal PradeshAssamBiharChandigarh*ChhattisgarhDadra & Nagar Haveli*Daman & Diu*NCT of DelhiGoaGujratHaryanaHimachal PradeshJammu & KashmirJharkhandKarnatakaKeralaLakshadweep*Madhya PradeshMaharashtraManipurMeghalayaMizoramNagalandOdishaPuducherryPunjabRajasthanSikkimTamil NaduTelanganaTripuraUttar PradeshUttarakhandWest Bengal
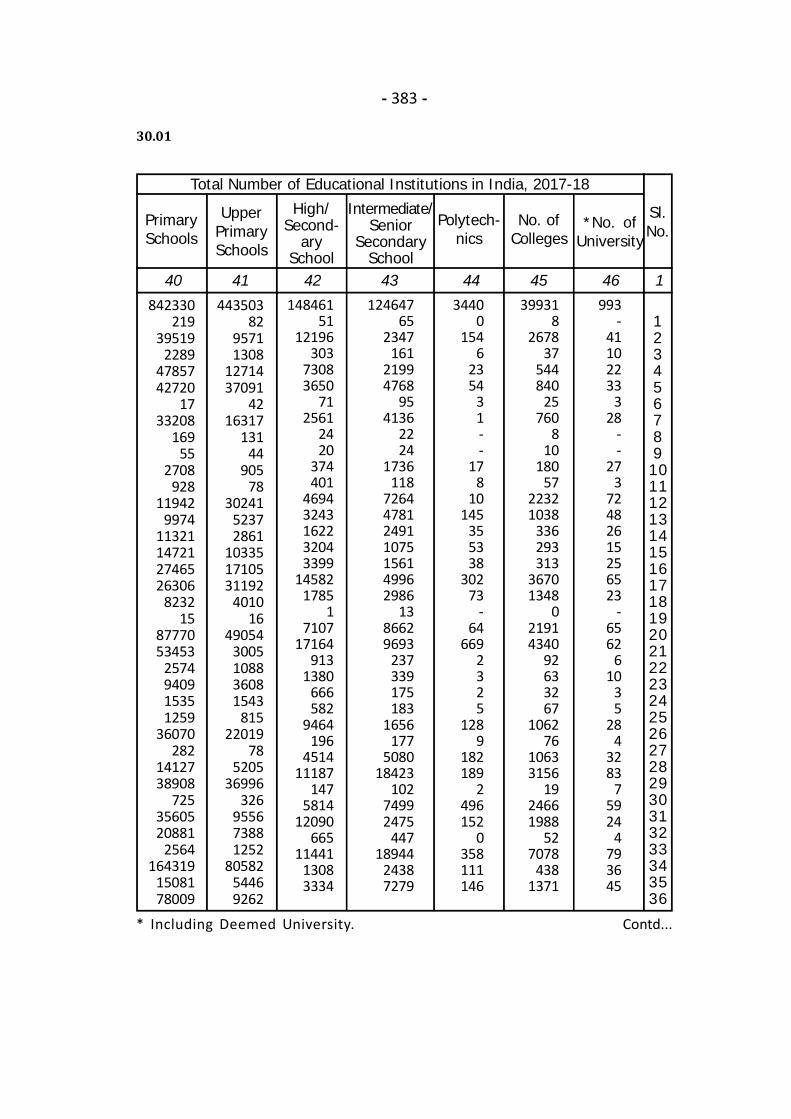
- 383 -
30.01
40 41 42 43 44 45 46 1
Sl.No.
PrimarySchools
842330219
395192289
4785742720
1733208
16955
2708928
119429974
11321147212746526306
823215
8777053453
2574940915351259
36070282
1412738908
7253560520881
2564164319
1508178009
44350382
95711308
1271437091
4216317
13144
90578
3024152372861
103351710531192
401016
490543005108836081543
81522019
785205
36996326
955673881252
8058254469262
14846151
12196303
73083650
712561
2420
374401
46943243162232043399
145821785
17107
17164913
1380666582
9464196
451411187
1475814
12090665
1144113083334
12464765
2347161
21994768
954136
2224
1736118
7264478124911075156149962986
1386629693
237339175183
1656177
508018423
10274992475
44718944
24387279
34400
1546
2354
31--
178
10145
355338
30273
-64
6692325
1289
182189
2496152
0358111146
399318
267837
544840
25760
810
18057
22321038
336293313
36701348
021914340
92633267
106276
10633156
1924661988
527078
4381371
123456789101112131415161718192021222324252627282930313233343536
*No. ofUniversity
Total Number of Educational Institutions in India, 2017-18
UpperPrimarySchools
High/Second-
arySchool
Intermediate/Senior
SecondarySchool
Polytech-nics
Contd...
993-
41102233
328
--
273
72482615256523
-6562
610
35
284
3283
75924
4793645
No. ofColleges
* Including Deemed University.
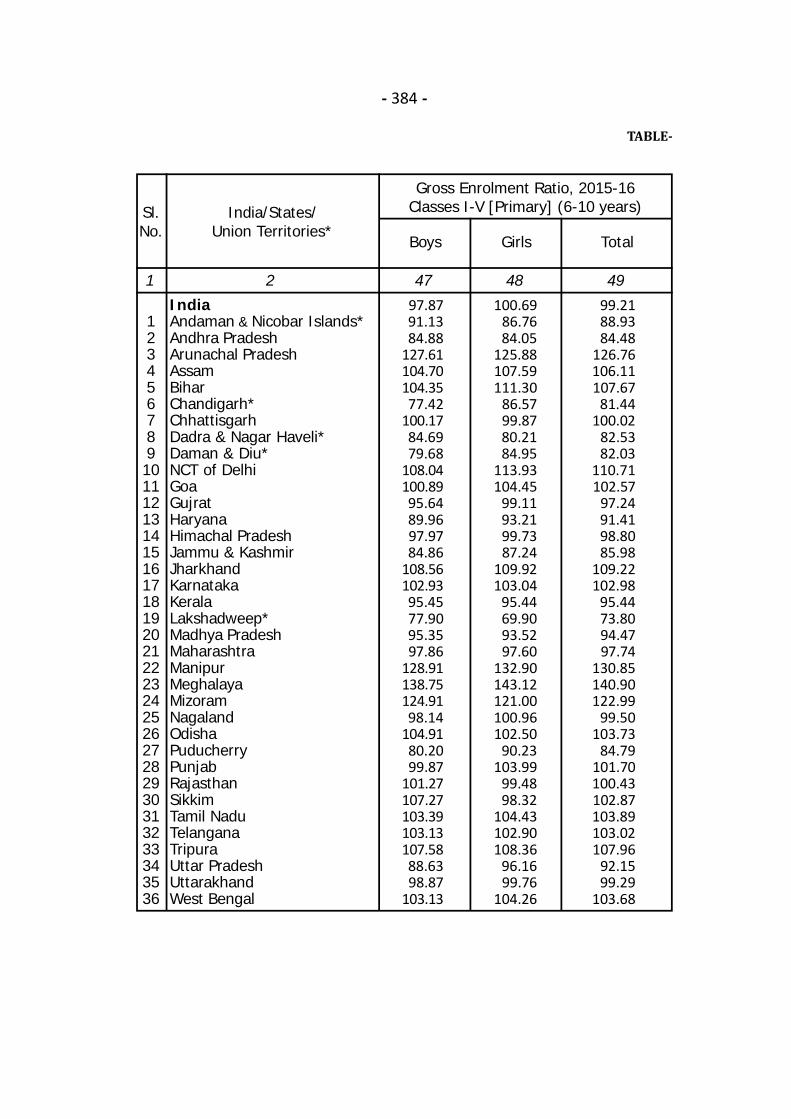
- 384 -
TABLE-
1 2 47 48 49
India/States/Union Territories*
Boys Girls Total
Sl.No.
123456789101112131415161718192021222324252627282930313233343536
IndiaAndaman & Nicobar Islands*Andhra PradeshArunachal PradeshAssamBiharChandigarh*ChhattisgarhDadra & Nagar Haveli*Daman & Diu*NCT of DelhiGoaGujratHaryanaHimachal PradeshJammu & KashmirJharkhandKarnatakaKeralaLakshadweep*Madhya PradeshMaharashtraManipurMeghalayaMizoramNagalandOdishaPuducherryPunjabRajasthanSikkimTamil NaduTelanganaTripuraUttar PradeshUttarakhandWest Bengal
97.8791.1384.88
127.61104.70104.3577.42
100.1784.6979.68
108.04100.8995.6489.9697.9784.86
108.56102.9395.4577.9095.3597.86
128.91138.75124.9198.14
104.9180.2099.87
101.27107.27103.39103.13107.5888.6398.87
103.13
100.6986.7684.05
125.88107.59111.30
86.5799.8780.2184.95
113.93104.45
99.1193.2199.7387.24
109.92103.04
95.4469.9093.5297.60
132.90143.12121.00100.96102.50
90.23103.99
99.4898.32
104.43102.90108.36
96.1699.76
104.26
99.2188.9384.48
126.76106.11107.67
81.44100.02
82.5382.03
110.71102.57
97.2491.4198.8085.98
109.22102.98
95.4473.8094.4797.74
130.85140.90122.99
99.50103.73
84.79101.70100.43102.87103.89103.02107.96
92.1599.29
103.68
Gross Enrolment Ratio, 2015-16Classes I-V [Primary] (6-10 years)
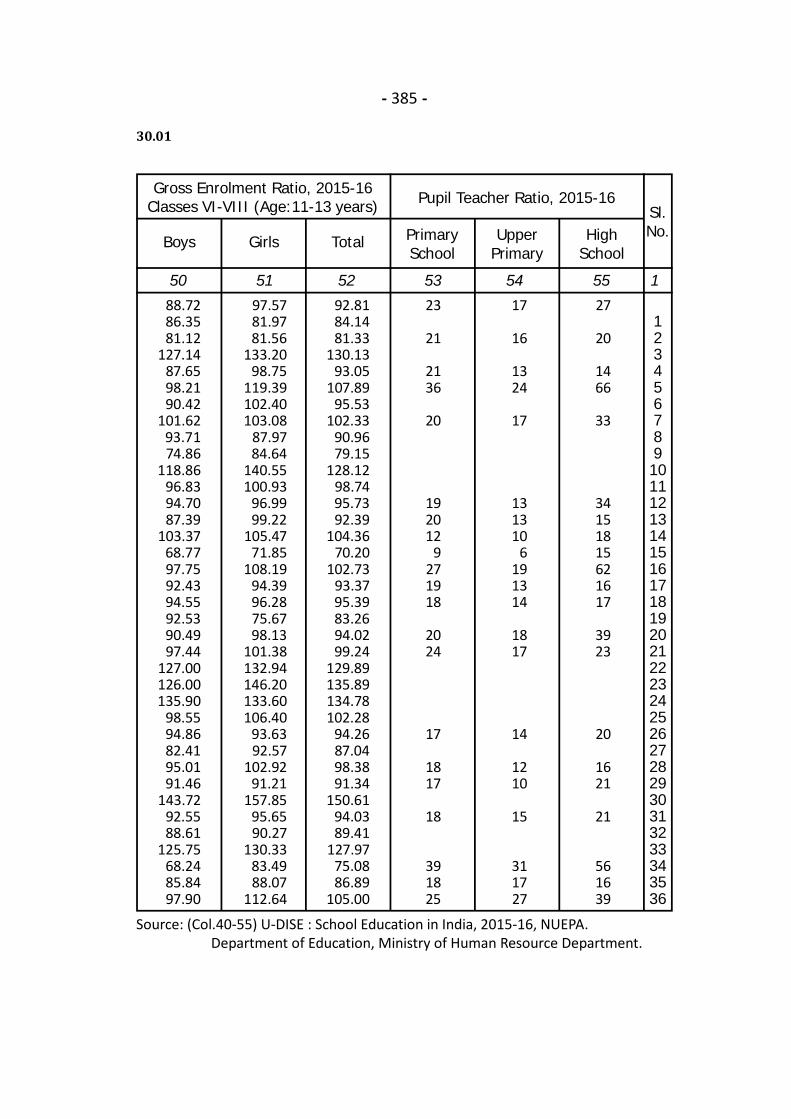
- 385 -
30.01
50 51 52 53 54 55 1
Sl.No.
Boys
88.7286.3581.12
127.1487.6598.2190.42
101.6293.7174.86
118.8696.8394.7087.39
103.3768.7797.7592.4394.5592.5390.4997.44
127.00126.00135.90
98.5594.8682.4195.0191.46
143.7292.5588.61
125.7568.2485.8497.90
97.5781.9781.56
133.2098.75
119.39102.40103.08
87.9784.64
140.55100.93
96.9999.22
105.4771.85
108.1994.3996.2875.6798.13
101.38132.94146.20133.60106.40
93.6392.57
102.9291.21
157.8595.6590.27
130.3383.4988.07
112.64
92.8184.1481.33
130.1393.05
107.8995.53
102.3390.9679.15
128.1298.7495.7392.39
104.3670.20
102.7393.3795.3983.2694.0299.24
129.89135.89134.78102.28
94.2687.0498.3891.34
150.6194.0389.41
127.9775.0886.89
105.00
23
21
2136
20
192012
9271918
2024
17
1817
18
391825
17
16
1324
17
131310
6191314
1817
14
1210
15
311727
27
20
1466
33
34151815621617
3923
20
1621
21
561639
123456789101112131415161718192021222324252627282930313233343536
HighSchool
Gross Enrolment Ratio, 2015-16Classes VI-VIII (Age:11-13 years)
Girls Total PrimarySchool
UpperPrimary
Pupil Teacher Ratio, 2015-16
Source: (Col.40-55) U-DISE : School Education in India, 2015-16, NUEPA. Department of Education, Ministry of Human Resource Department.

.- 386 -
TABLE-
1 2 56 57 58 59
India/States/Union Territories*
Estimatednumber ofEnterprises(in Lakh) Male Female Total
Sl.No.
123456789101112131415161718192021222324252627282930313233343536
IndiaAndaman & Nicobar Islands*Andhra PradeshArunachal PradeshAssamBiharChandigarh*ChhattisgarhDadra & Nagar Haveli*Daman & Diu*NCT of DelhiGoaGujratHaryanaHimachal PradeshJammu & KashmirJharkhandKarnatakaKeralaLakshadweep*Madhya PradeshMaharashtraManipurMeghalayaMizoramNagalandOdishaPuducherryPunjabRajasthanSikkimTamil NaduTelanganaTripuraUttar PradeshUttarakhandWest Bengal
633.880.190.23
18.9012.1434.46
0.568.480.160.089.360.70
33.169.703.927.09
15.8838.3423.79
0.0226.7447.78
1.801.120.350.91
19.840.96
14.6526.87
0.2649.4826.05
2.1189.99
4.1788.70
844.680.29
34.980.29
16.3748.26
1.1712.79
0.290.12
20.591.20
47.4416.27
5.299.37
19.8451.1130.86
0.0238.6172.77
1.521.190.341.18
24.871.27
20.5538.81
0.3164.4524.91
2.51137.92
5.9191.95
264.920.10
21.010.111.784.790.124.090.070.022.410.41
13.712.781.131.505.57
19.7313.77
0.0110.1317.97
1.400.720.280.598.370.574.248.010.14
32.2715.24
0.4427.27
0.6943.51
1109.890.39
55.990.41
18.1553.07
1.2916.86
0.360.14
23.001.60
61.1619.06
6.4310.8824.9170.8444.64
0.0348.8090.77
2.921.910.621.77
33.261.84
24.8046.33
0.4596.7340.16
2.95165.26
6.60135.52
Employment
Source: (Col.56-59) Ministry of Micro, Small and Medium Enterprises, Govt. of India.
Number of Enterprises and Employeesunder MSME (Year: 2015-16)

- 387 -
30.01
60 61 62 63 64 1
Sl.No.
132499.5330.7
6913.52537.43908.55357.6
15.33605.8
31.022.0
157.1292.9
6635.03135.72606.92432.23366.87334.81781.6
-8772.3
17756.61750.31155.61422.51547.75761.5
26.93274.1
10341.8463.0
6741.53795.5
853.811736.8
2949.33664.5
175036266
6485-
25304006
1844438
30--
27917201
1801827130
133919556
4342-
1138939000
715772170722
413989
110315019
66312095
2553329
720143293262
49976711617
17547437026
337777209549
282197845
1187426
1788216659
18092781386628126338669871
361041240562
212342654623972
27612229391101236239
3036693242
139492265599
11386261436126135
42925428055
69777322067
123456789101112131415161718192021222324252627282930313233343536
NationalHighways
(Sept’2019)
StateHighways
(March’2017)
Length ofRoads(2017)
Road Length (in Km.)Railway route
as onMar’2017
Telephonesper 100
Population ason Mar’2017
67415-
382212
25193720
161212
--
18369
53201703
312298
257135401045
-48995819
1392
112622
2222655937
-40311823
2268823
3414230
88.81-
97.48-
70.3559.27
----
237.72-
103.7797.43
148.8177.39
-108.52124.65
-69.2991.99
----
76.53-
124.2486.15
-115.93
----
68.53
Source: (Col.60-64) Ministry of Road Transport and Highways, Govt. of India.

.
31.KEY STATISTICS
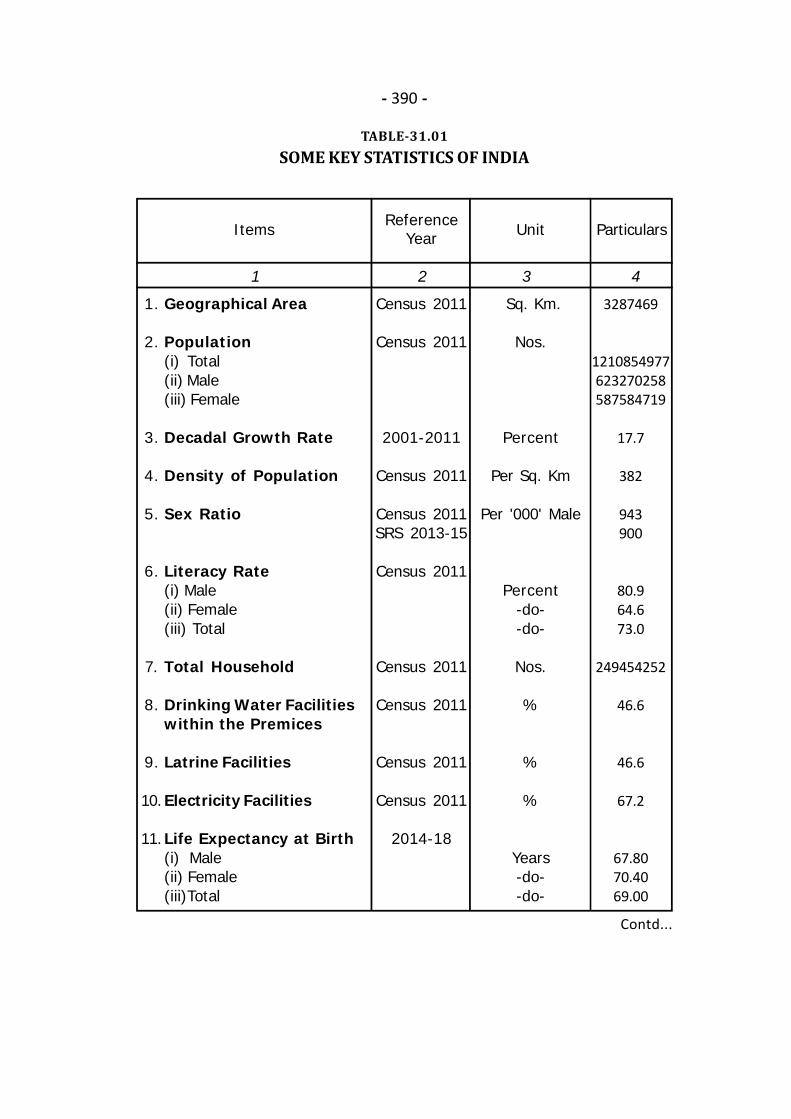
- 390 -
TABLE-31.01SOME KEY STATISTICS OF INDIA
Contd...
1 2 3 4
Items ReferenceYear Unit Particulars
1.
2.
3.
4.
5.
6.
7.
8.
9.
10.
11.
Geographical Area
Population(i) Total(ii) Male(iii) Female
Decadal Growth Rate
Density of Population
Sex Ratio
Literacy Rate(i) Male(ii) Female(iii) Total
Total Household
Drinking Water Facilitieswithin the Premices
Latrine Facilities
Electricity Facilities
Life Expectancy at Birth(i) Male(ii) Female(iii)Total
Census 2011
Census 2011
2001-2011
Census 2011
Census 2011SRS 2013-15
Census 2011
Census 2011
Census 2011
Census 2011
Census 2011
2014-18
Sq. Km.
Nos.
Percent
Per Sq. Km
Per '000' Male
Percent-do--do-
Nos.
%
%
%
Years-do--do-
3287469
1210854977623270258587584719
17.7
382
943900
80.964.673.0
249454252
46.6
46.6
67.2
67.8070.4069.00
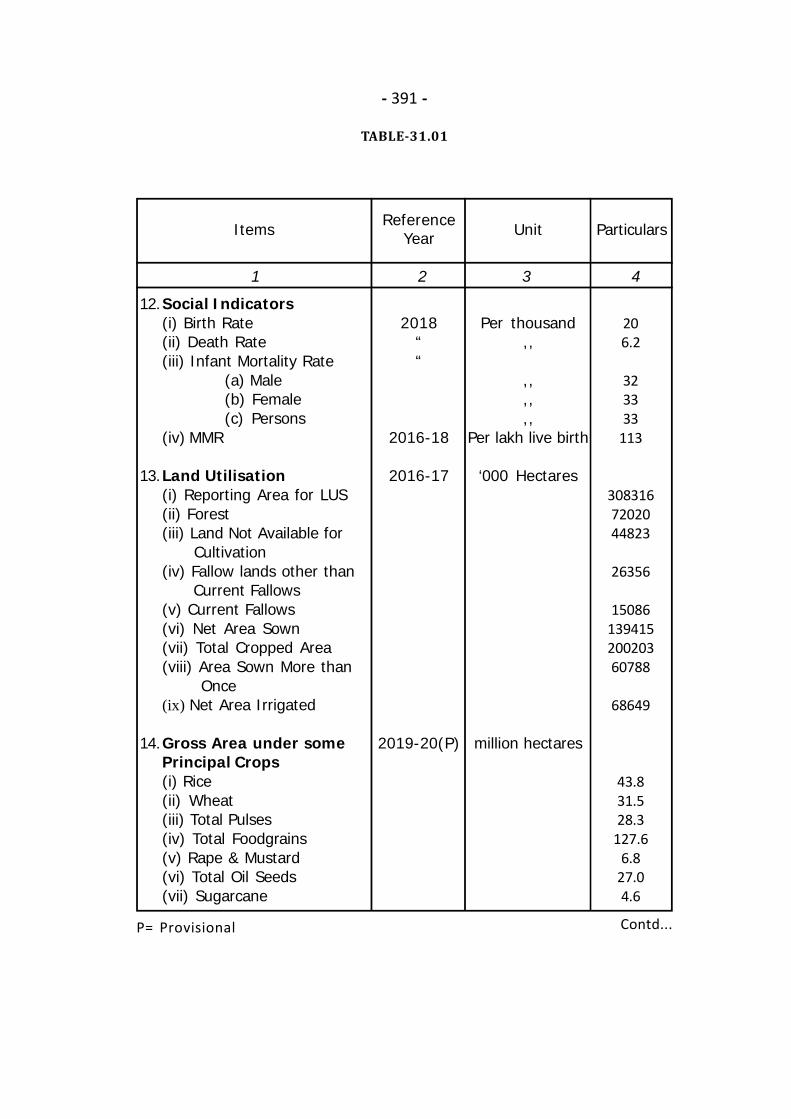
- 391 -
TABLE-31.01
Contd...
1 2 3 4
Items ReferenceYear Unit Particulars
12.
13.
14.
Social Indicators(i) Birth Rate(ii) Death Rate(iii) Infant Mortality Rate
(a) Male(b) Female(c) Persons
(iv) MMR
Land Utilisation(i) Reporting Area for LUS(ii) Forest(iii) Land Not Available for Cultivation(iv) Fallow lands other than Current Fallows(v) Current Fallows(vi) Net Area Sown(vii) Total Cropped Area(viii) Area Sown More than Once(ix) Net Area Irrigated
Gross Area under somePrincipal Crops(i) Rice(ii) Wheat(iii) Total Pulses(iv) Total Foodgrains(v) Rape & Mustard(vi) Total Oil Seeds(vii) Sugarcane
2018““
2016-18
2016-17
2019-20(P)
Per thousand,,
,,,,,,
Per lakh live birth
‘000 Hectares
million hectares
206.2
323333
113
3083167202044823
26356
1508613941520020360788
68649
43.831.528.3
127.66.8
27.04.6
P= Provisional

- 392 -
TABLE-31.01
Contd...
1 2 3 4
Items ReferenceYear Unit Particulars
15.
16.
17.
18.
Production of somePrincipal Crops(i) Rice(ii) Wheat(iii) Total Pulses(iv) Total Foodgrains(v) Rape & Mustard(vi) Total Oil Seeds(vii) Sugarcane
Average Yield of somePrincipal Crops(i) Rice(ii) Wheat(iii) Total Pulses(iv) Total Foodgrains(v) Rape & Mustard(vi) Total Oil Seeds(vii) Sugarcane
Gross Irrigated Area ofsome Principal Crops(i) Rice(ii) Wheat(iii) Total Cereals(iv) Total Pulses(v) Total Foodgrains(vi) Sugarcane
Consumption of Chemi-cal Fertilisers (N+P+K)
2019-20(P)
2019-20(P)
2015-16
2019-20
million tonnes
qntl/hect.,,,,,,,,,,
tonne/hect.
in percentage
'000' tonnes
118.4107.623.2
296.79.1
33.4355.7
2734.28.1723.313.512.478
60.1394.2217.4419.0852.6295.8
29369
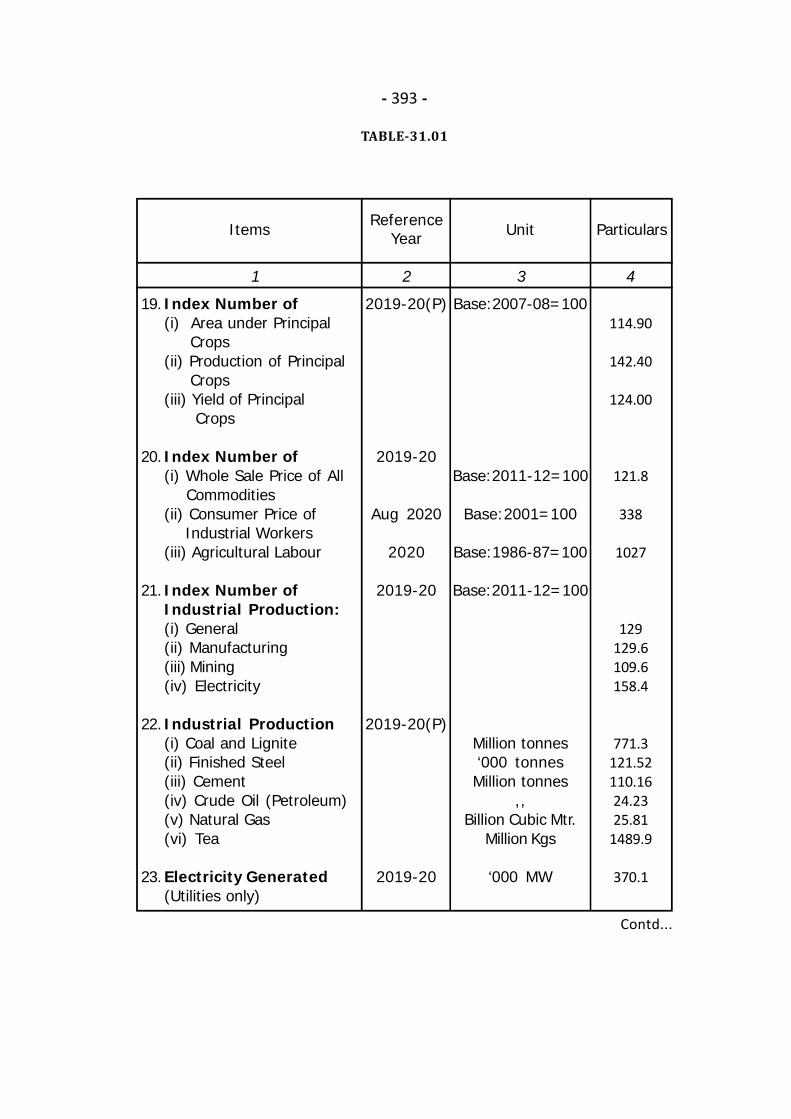
- 393 -
TABLE-31.01
Contd...
1 2 3 4
Items ReferenceYear Unit Particulars
19.
20.
21.
22.
23.
Index Number of(i) Area under Principal Crops(ii) Production of Principal Crops(iii) Yield of Principal Crops
Index Number of(i) Whole Sale Price of All Commodities(ii) Consumer Price of Industrial Workers(iii) Agricultural Labour
Index Number ofIndustrial Production:(i) General(ii) Manufacturing(iii) Mining(iv) Electricity
Industrial Production(i) Coal and Lignite(ii) Finished Steel(iii) Cement(iv) Crude Oil (Petroleum)(v) Natural Gas(vi) Tea
Electricity Generated(Utilities only)
2019-20(P)
2019-20
Aug 2020
2020
2019-20
2019-20(P)
2019-20
Base:2007-08=100
Base:2011-12=100
Base:2001=100
Base:1986-87=100
Base:2011-12=100
Million tonnes‘000 tonnesMillion tonnes
,,Billion Cubic Mtr.
Million Kgs
‘000 MW
114.90
142.40
124.00
121.8
338
1027
129129.6109.6158.4
771.3121.52110.1624.2325.81
1489.9
370.1
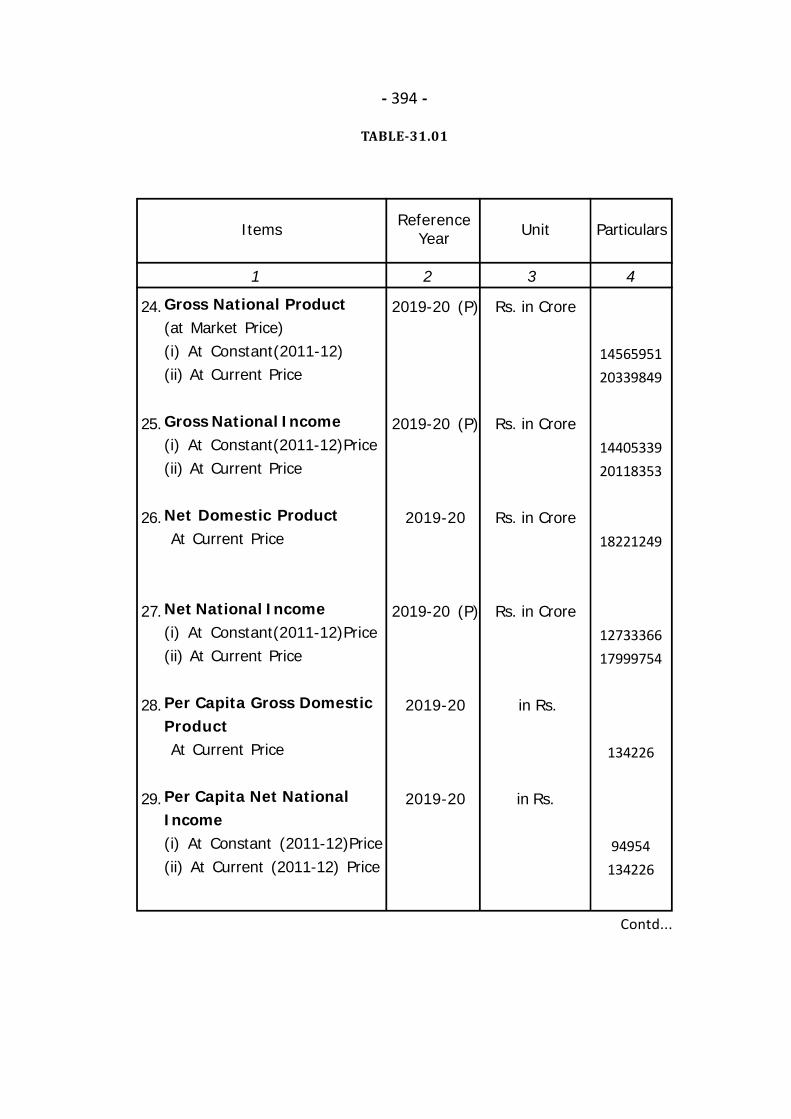
- 394 -
TABLE-31.01
1 2 3 4
Items ReferenceYear Unit Particulars
24.
25.
26.
27.
28.
29.
Gross National Product(at Market Price)(i) At Constant(2011-12)(ii) At Current Price
Gross National Income(i) At Constant(2011-12)Price(ii) At Current Price
Net Domestic Product At Current Price
Net National Income(i) At Constant(2011-12)Price(ii) At Current Price
Per Capita Gross DomesticProduct At Current Price
Per Capita Net NationalIncome(i) At Constant (2011-12)Price(ii) At Current (2011-12) Price
2019-20 (P)
2019-20 (P)
2019-20
2019-20 (P)
2019-20
2019-20
Rs. in Crore
Rs. in Crore
Rs. in Crore
Rs. in Crore
in Rs.
in Rs.
1456595120339849
1440533920118353
18221249
1273336617999754
134226
94954134226
Contd...

- 395 -
TABLE-31.01
1 2 3 4
Items ReferenceYear Unit Particulars
30.
31.
Road and Transport
(i) Total Road Length
(ii) No. of Redg Motor Vehicles
(Passenger Vehicles)
(iii) No. of Goods Vessels
(iv) No. of Buses
(v) RailwayRoute Length
(Metro Route)
BG Route
MG Route
NG Route
Health & Family Welfare
(i) No. of Government
Hospitals under Allopathic
System
(ii) No. of Beds in Govt.
Hospital under Allopathic
System
(iii) Average population served
per Govt. Hospital bed.
2019-20
2017
“
“
2019-20
2017
,,
,,
'000' Km
'000' Nos.
,,
,,
Km
in Nos.
,,
,,
6940
253311
12256
1864
67956
63950
2402
1604
23582
710761
1844
Contd...
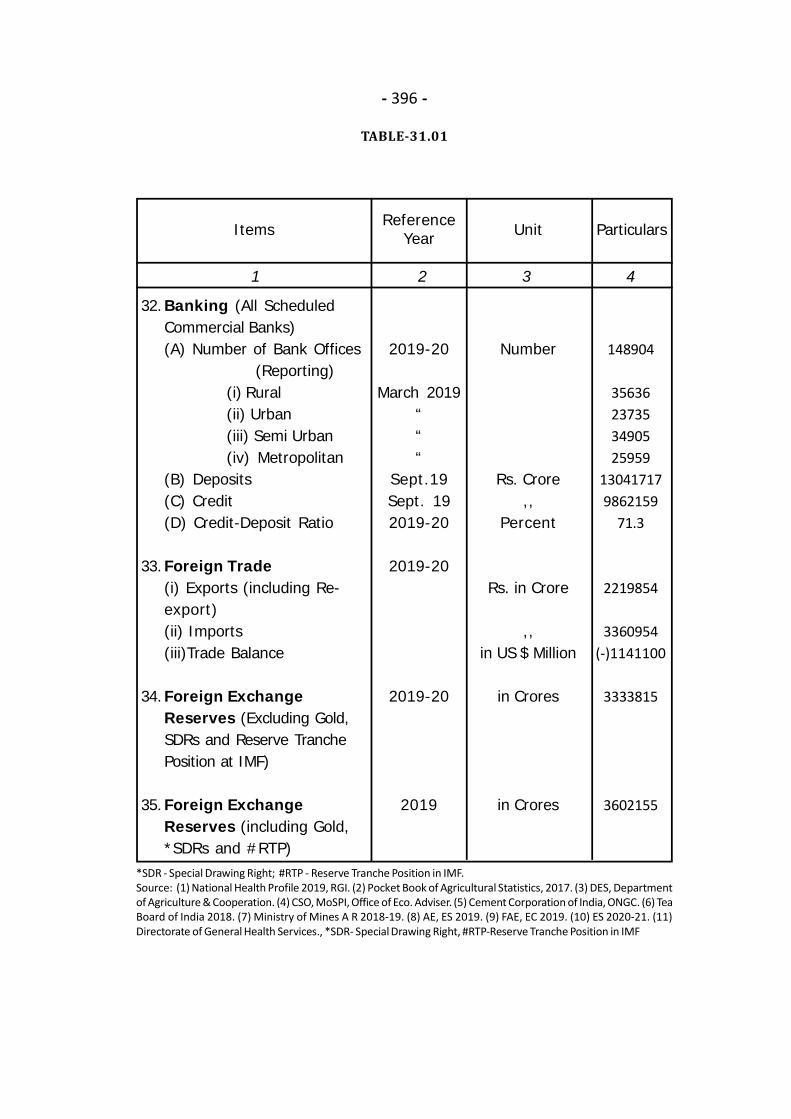
- 396 -
TABLE-31.01
*SDR - Special Drawing Right; #RTP - Reserve Tranche Position in IMF.Source: (1) National Health Profile 2019, RGI. (2) Pocket Book of Agricultural Statistics, 2017. (3) DES, Departmentof Agriculture & Cooperation. (4) CSO, MoSPI, Office of Eco. Adviser. (5) Cement Corporation of India, ONGC. (6) TeaBoard of India 2018. (7) Ministry of Mines A R 2018-19. (8) AE, ES 2019. (9) FAE, EC 2019. (10) ES 2020-21. (11)Directorate of General Health Services., *SDR- Special Drawing Right, #RTP-Reserve Tranche Position in IMF
1 2 3 4
Items ReferenceYear Unit Particulars
32.
33.
34.
35.
Banking (All ScheduledCommercial Banks)(A) Number of Bank Offices
(Reporting)(i) Rural(ii) Urban(iii) Semi Urban(iv) Metropolitan
(B) Deposits(C) Credit(D) Credit-Deposit Ratio
Foreign Trade(i) Exports (including Re-export)(ii) Imports(iii)Trade Balance
Foreign ExchangeReserves (Excluding Gold,SDRs and Reserve TranchePosition at IMF)
Foreign ExchangeReserves (including Gold,*SDRs and #RTP)
2019-20
March 2019“““
Sept.19Sept. 192019-20
2019-20
2019-20
2019
Number
Rs. Crore,,
Percent
Rs. in Crore
,,in US $ Million
in Crores
in Crores
148904
35636237353490525959
130417179862159
71.3
2219854
3360954(-)1141100
3333815
3602155