Embed Size (px)
Citation preview
METHODSpublished: 07 April 2016
doi: 10.3389/fncom.2016.00029
Frontiers in Computational Neuroscience | www.frontiersin.org 1 April 2016 | Volume 10 | Article 29
Edited by:
John Suckling,
University of Cambridge, UK
Reviewed by:
Dranreb Earl Juanico,
Technological Institute of the
Philippines, Philippines
Alex Hansen,
Norwegian University of Science and
Technology, Norway
*Correspondence:
Jean-Philippe Thivierge
Received: 19 November 2015
Accepted: 21 March 2016
Published: 07 April 2016
Citation:
Shaukat A and Thivierge J-P (2016)
Statistical Evaluation of Waveform
Collapse Reveals Scale-Free
Properties of Neuronal Avalanches.
Front. Comput. Neurosci. 10:29.
doi: 10.3389/fncom.2016.00029
Statistical Evaluation of WaveformCollapse Reveals Scale-FreeProperties of Neuronal AvalanchesAleena Shaukat 1 and Jean-Philippe Thivierge 1, 2*
1 School of Psychology, University of Ottawa, Ottawa, ON, Canada, 2Center for Neural Dynamics, University of Ottawa,
Ottawa, ON, Canada
Neural avalanches are a prominent form of brain activity characterized by network-wide
bursts whose statistics follow a power-law distribution with a slope near 3/2. Recent
work suggests that avalanches of different durations can be rescaled and thus collapsed
together. This collapse mirrors work in statistical physics where it is proposed to form
a signature of systems evolving in a critical state. However, no rigorous statistical test
has been proposed to examine the degree to which neuronal avalanches collapse
together. Here, we describe a statistical test based on functional data analysis, where raw
avalanches are first smoothed with a Fourier basis, then rescaled using a time-warping
function. Finally, an F ratio test combined with a bootstrap permutation is employed to
determine if avalanches collapse together in a statistically reliable fashion. To illustrate this
approach, we recorded avalanches from cortical cultures on multielectrode arrays as in
previous work. Analyses show that avalanches of various durations can be collapsed
together in a statistically robust fashion. However, a principal components analysis
revealed that the offset of avalanches resulted in marked variance in the time-warping
function, thus arguing for limitations to the strict fractal nature of avalanche dynamics. We
compared these results with those obtained from cultures treated with an AMPA/NMDA
receptor antagonist (APV/DNQX), which yield a power-law of avalanche durations with
a slope greater than 3/2. When collapsed together, these avalanches showed marked
misalignments both at onset and offset time-points. In sum, the proposed statistical
evaluation suggests the presence of scale-free avalanche waveforms and constitutes
an avenue for examining critical dynamics in neuronal systems.
Keywords: neuronal avalanches, in vitro, bursts, network dynamics, cultured neuronal networks, multi-electrode
array, criticality
INTRODUCTION
Neural avalanches are a form of brain dynamics observed both in vivo and in vitro and characterizedby bursts of activity whose statistics follow a power-law distribution (Plenz and Thiagarajan,2007). Several physical systems that evolve in a critical state exhibit power-law scaling (Bak et al.,1987).Whether such power-law scaling reflects criticality in neuronal recordings, however, remainsdebated (Touboul and Destexhe, 2010; Klaus et al., 2011; Beggs and Timme, 2012). This debateis fueled by the presence of power-law scaling in stochastic systems that are not in a criticalstate (Benayoun et al., 2010). Addressing this question has fundamental implications in neural

Shaukat and Thivierge Waveform Collapse in Neuronal Avalanches
systems, as theoretical work associates the critical state withoptimal information processing, optimal storage, and flexibleresponses (Beggs and Plenz, 2003; Shew et al., 2009, 2011).
One aspect of physical systems that weighs in favor ofcriticality is the presence of fractal relations at different timesscales (Sethna et al., 2001). Preliminary work has tested thisidea by taking avalanches of different durations, and rescalingthe amplitude and timescale of their mean activity over time(Friedman et al., 2012). As a result, avalanches of differentdurations show a strikingly similar profile of activation. Thisscaling property suggests the presence of similar avalanchedynamics across a range of temporal scales.
However, no statistical test has been proposed to examine thereliability of this temporal scaling. Such test is not only necessaryto quantify this phenomenon under normal recordings, butalso its potential breakdown in neural activity altered bypharmacology (Vincent et al., 2013).
Here, we address this question with a technique of functionaldata analysis applied to recordings of cultured cortical neuronsplated on multielectrode arrays (Ramsay and Silverman, 2005).The aim of this technique is to transform a set of data into smoothdifferentiable functions. This is done by approximating the databy a weighted sum of basis functions. The resulting functionscan then be rescaled using a time-warping function, and analyzedusing a generalized linear model (GLM).
This paper is structured as follows. First, we describesome basic aspects of neuronal avalanches, including scale-freedistributions of time durations and counts of active neurons.Second, we describe how data can be collapsed using a time-warping function that rescales avalanches using their totalduration and mean amplitude. Third, we test the statisticalsignificance of the data collapse by combining a GLM andpermutation test. Finally, we examine the time-warping functionusing a principal components analysis. We compare data collapseobtained from control and pharmacologically altered activityunder APV/DNQX, an AMPA/NMDA receptor antagonistknown to disrupt avalanches by markedly increasing the slope ofthe best-fitting power-law describing their distribution (Vincentet al., 2012). Results show conditions that lead to a statisticallyrobust collapse of avalanches and carry implications for theinvestigation of criticality in neuronal systems.
METHODS
Experiments were performed as previously described followingapproval from the Human Health Therapeutics Animal CareCommittee at the National Research Council Canada. Cultureswere inspected to ensure that neurons exhibited a densehomogeneous monolayer. Recordings were performed between14 and 19 days in vitro, an age when cultures have sufficientlymatured to produce maximal firing rates and most channelsare active (Tauskela et al., 2008; Vincent et al., 2013).Pharmacological agents were added directly to the mediumof cultures (AVP/DNQX = (2R)-amino-5-phosphonovalericacid + 6,7-dinitroquinoxaline-2,3-dione). Drugs were preparedfrom stock solutions, with final bath concentrations of 2µM
DNQX, and 20µM APV. A 10min wash-in period preceded allrecordings.
Recordings were performed at 37◦C with 64-channelmultielectrode arrays using MCRack software (Multi ChannelSystems, Reutlingen, Germany). All recordings were carriedout for 20min duration. Signals were acquired at 5 kHz, thendownsampled to 1 kHz and high-pass filtered using a cut-offfrequency of 200Hz. Online extracellular spike detect wasperformed using MCS software.
All offline analyses were performed with custom scriptsin Matlab (Mathworks, Natick, MA). Neural avalanches wereidentified using non-overlapping time bins of fixed size (10ms).An avalanche was defined as a series of consecutive bins whereall bins have at least one spike. An avalanche must be precededand followed by at least one time bin without spikes. Source codeon functional data analysis is freely available online (http://www.functionaldata.org).
RESULTS
Neuronal AvalanchesA total of 6 control cultures were analyzed (see Figure 1A for anillustration of multielectrode array). These data exhibited burstsof activity characteristic of neuronal avalanches (Figures 1B,C).A full analysis of avalanches for these data is available elsewhere,and shows that the duration of avalanches follows a power-lawwith slope close to 3/2 (Figure 2A; Vincent et al., 2012; Thivierge,2014). A rigorous maximum likelihood method was employed toshow that a power-law offered a closer fit than an exponentialfunction (Langlois et al., 2014).
Individual avalanches were characterized by a sharp increasein neural activity between the onset and peak amplitude, followedby a more gradual offset (Figure 1C). The mean rate of increasein neural activity from the onset of an avalanche to its maximalamplitude was 1.28 spikes/ms (s.d. 0.16), which is close toboth experimental (Eytan and Marom, 2006) and theoretical(Thivierge and Cisek, 2008) reports. The total duration ofavalanches varied between 20 and 580ms (mean of 40.89, s.d. of8.03). Both the duration of avalanches and the number of cellsactivated followed a power-law distribution (Figures 2A,B), withscaling exponents α = 1.59 (s.d. 0.17) and τ = 1.53 (s.d. 0.09),respectively (Table 1). In turn, avalanche durations and cell countwere related to each other by a power-lawwith exponent 1.09 (s.d.0.004) (Figure 2C). In keeping with previous work, we refer tothe latter exponent using the notation 1/σνz (Mehta et al., 2002).These exponents are slightly outside those predicted by meanfield values (τ = 3/2, α = 2.0, and 1/σνz = 2.0). In spite ofthis finding, the exponent relation for critical systems
α − 1
τ − 1=
1
σνz(1)
is approximated here, with 1/σνz being slightly overestimated(the lefthand side of Equation 1 yields 1.11).
An alternative means of estimating the above exponents isto consider the maximum number of spikes generated duringa given time-bin of avalanches. For this analysis, we first used
Frontiers in Computational Neuroscience | www.frontiersin.org 2 April 2016 | Volume 10 | Article 29

Shaukat and Thivierge Waveform Collapse in Neuronal Avalanches
FIGURE 1 | Neuronal avalanches obtained from cortical cultures plated on multielectrode arrays. (A) Cortical neurons on multielectrode array. Only 4 of the
64 electrodes are shown. (B) Spike raster obtained from a control culture. (C) A single avalanche, showing spike raster (bottom panel) and peri-stimulus time
histogram relative to avalanche onset (top panel).
FIGURE 2 | Avalanche distributions and scaling relations. (A) Distribution
of avalanche duration (black dots) and best-fitting slope of power-law obtained
by maximum likelihood estimation (Langlois et al., 2014). Gray dots,
distribution obtained in cultures treated with APV/DNQX. (B) Distribution of the
number of cells activated per avalanche. (C) Relation between the duration of
avalanches and cell count. (D) Relation between the maximum spikes per
time-bin in average avalanches of different durations vs. the duration of
avalanches.
bins of 25ms to average avalanches of similar duration together.In this way, an individual mean was obtained for avalanchesbetween 20 and 45ms, 45 and 70ms, and so on until we reachedthe maximum avalanche duration of 580ms. The distributionof maximum spikes per time-bin for these mean avalanchesfollowed a power-law with exponent µ = 1.44 (s.d. 0.12). Therelation between this exponent and α = 1.59 (obtained fromthe duration of avalanches) is described by the exponent ρ/vz(LeBlanc et al., 2013). From mean-field theory, we expect the
TABLE 1 | Summary of scaling exponents and mean-field theory.
Description Exponent Mean-field theory
Duration distribution α = 1.59 (s.d. 0.17) α = 2.0
Size distribution (# of cells) τ = 1.53 (s.d. 0.09) τ = 1.5
Duration vs. size 1/σνz = 1.09 (s.d. 0.004) 1/σνz = 2.0
Max. spikes per time-bin µ = 1.44 (s.d. 0.12) µ = 2
following relation
α − 1
µ − 1=
ρ
vz, (2)
to be approximated here, with the value (α − 1) /(µ − 1) = 1.34being close to ρ/vz = 1.35 (Figure 2D).
In previous work, the exponents α, τ , and 1/σνz arecombined with a universal scaling function (a set of orthonormalpolynomials) to examine whether avalanches of differentduration can be collapsed together (Sethna et al., 2001; Friedmanet al., 2012). Here, however, we take a different approach thatoffers a statistical criterion for testing the collapse of avalanches,as described next.
Avalanche CollapseWe employed a technique termed functional data analysisto examine the degree to which mean avalanches of variousdurations could be rescaled and collapsed onto each other.First, mean avalanches were filtered with a 2nd order low-passButterworth filter with a cut-off frequency of 100Hz. Then, werepresented mean avalanches of a given duration by a continuousvariable xj corresponding to the spike rate over time, sampled at1 kHz. Each mean avalanche was smoothed by a linear mixture ofFourier basis φk, where k = 1,. . . ,K,
y (t) =
K∑
k= 1
ckφk (t) , (3)
Frontiers in Computational Neuroscience | www.frontiersin.org 3 April 2016 | Volume 10 | Article 29

Shaukat and Thivierge Waveform Collapse in Neuronal Avalanches
given ck coefficients and K number of basis functions defined byφ0 (t) = 1, φ2r−1 (t) = sin rωt, and φ2r (t) = cos rωt, where tindexes time within the interval T corresponding to the lengthof a given mean avalanche. The parameter ω defines the period2πω and is set such that this period is equal to T. By allowing then × K matrix 8 =
{
φk
(
tj)}
of basis functions to be of full rank,we obtained a close approximation y(tj) ≈ xj for each j when K= n by fitting the coefficients ck. These coefficients were adjustedto minimize a sum of squared errors between data points xj andbasis 8
SSE (x | c) = (x− 8c)′
(x− 8c) , (4)
where the vector c contains the coefficients ck. To avoidoverfitting the data, we added a regularization term to Equation(4) that penalizes the second order derivative of y(t),
R(
y)
=
∫
[
∂2y (t) / (∂t)2]2dt, (5)
thus yielding
SSEλ (x | c) = (x− 8c)′
(x− 8c) + λR(
y)
, (6)
where λ = 0.001 controls the amount of regularization applied.The target precision for Equation (6) is 0.0001. Equation (6) canbe optimized in linear O(n) time using a least squares methoddescribed elsewhere in full detail (Green and Silverman, 1994).One assumption is that the noise is of higher frequency thanthe signal. This is justified because neuronal avalanches representpopulation-wide fluctuations in signals and have a time-coursethat is much slower than high-frequency “jitter” induced bysingle spikes.
Examples of smoothed avalanches are shown in Figure 3A
(left panel). To confirm that our choice of parameter λ inEquation (6) yielded low SSE, we tested a range of valuesbetween λ = 0.001 and λ = 0.1 (Figure 3B). Despite thesmoothed avalanches having different durations, their overallshape was strikingly similar. It may thus be possible to rescalethese avalanches in time such that their activity aligns with eachother. This was achieved by computing a time-warping functionfor each mean avalanche. An advantage of this approach is thatit allows us to devise a statistical analysis based on principalcomponents analysis and GLM to examine the degree to whichavalanches collapse together (see below).
The time-warping transformation of y(t) is defined as
y∗ (t) = yi[
hi (t)]
, (7)
given the time-warping function hi (t), where i indexes individualavalanches. Here, h implements a transformation
hi (t) = 1(
D−1 expD−1w)
(t) , (8)
where
1 = T/[
D−1 expD−1w (t)]
(9)
FIGURE 3 | The shape of mean avalanches of different durations
shows a statistically reliable collapse. (A) Left panel: example of
avalanches of different durations. These avalanches were smoothed using a
Fourier basis (Equation 3). Right panel: avalanches registered using a
time-warping function (Equation 7). Avalanches are rescaled by their maximum
amplitude for ease of visualization. (B) Sum of squared errors (SSE) obtained
from Equation (6) as a function of the regularization parameter λ. (C) F ratio
obtained from a functional linear model. Dashed line, critical F-value. Each of
1000 bootstrap permutations is displayed by a solid black line.
andD−1 is an integration operator with lower limit of zero. Thesetime-warping functions are fitted with a least-squares criterionusing a Newton-Raphson algorithm as described elsewhere(Ramsay and Silverman, 2005).
The above warping functions allowed for avalanches to becollapsed onto each other (Figure 2A, right panel). The collapseof avalanches was particularly accurate around the peak ofavalanches, but less so toward the offset. To evaluate the degree towhich avalanches collapsed together, we employed a combinationof GLM and bootstrap permutation. This procedure allowed us toidentify time-points where avalanches collapsed in a statisticallyrobust manner, as described next.
Generalized Linear ModelingFirst, we randomly divided all mean avalanches of variousdurations into two surrogate groups of equal size. Then, we fittedthe resulting data set using the linear model
ykg (t) = µ (t) + αg (t) + εkg (t) , (10)
where µ (t) is the grand mean of the data (i.e., the averageavalanche shape over all groups), αg (t) is the deviation of theaverage avalanche shape in a given surrogate group from thegrand mean, and εkg (t) is the residual deviation of the kthavalanche in group g from the mean avalanche profile. Weconstrained αg (t) such that
∑
g αg (t) = 0 for all t. This
constraint is necessary to insure that αg (t) can be identifieduniquely as belonging to a given surrogate group. To fit thismodel, we designed a matrix Z of size N (avalanche) × G+1
Frontiers in Computational Neuroscience | www.frontiersin.org 4 April 2016 | Volume 10 | Article 29

Shaukat and Thivierge Waveform Collapse in Neuronal Avalanches
(surrogate groups). We indexed the rows and columns of Z using(k,g), corresponding to mean avalanche k in group g. Row g ofmatrix Z had a one in the first column, a one in column g + 1,and zeroes elsewhere. For instance, with N = 4 avalanches andG = 2 groups, and assuming that the first two rows are assignedto group 1 and the remaining 2 rows are assigned to group 2, theZmatrix would be
Z =
1 1 01 1 01 0 11 0 1
.
The linear model of Equation (10) can then be rewritten as
y (t) =
N∑
j= 1
z(k,g)jϕj (t) + εkg (t) , (11)
where ϕj (t) are a set of N regression functions, ϕj, ϕ1 = µ,ϕ2 = α1, and so on, up to ϕN = αN−1, yielding the vectorϕ = [µ, α1, α2, . . . , αN]. This model can be fitted with a leastsquares criterion,
SSE (ϕ) =∑
g
∑
k
∫
[
ykg (t) − (Zϕ)kg
]2dt, (12)
where
(Zϕ)kg =
N∑
j= 1
z(k,g)ϕj (t) ,
minimized subject to constraint∑N
j= 1 ϕj = µ. We assessed the
fit of Equation (11) at each time point t using
SSE (t) =∑
k,g
[
ykg (t) −(
Zϕ)
kg(t)
]2(13)
evaluated at the fitted values of ϕ obtained by minimizing(Equation 12). We then tested for statistical robustness using anF ratio,
Fratio(t) =
∑
k,g
[
ykg (t) − µ (t)]2
−∑
k,g
[
ykg (t) −(
Zϕ)
kg(t)
]2/dfmodel
∑
k,g
[
ykg (t) −(
Zϕ)
kg(t)
]2/dferror
(14)
where dfmodel = G−1 and dferror = N−2 are the degrees offreedom associated with the linear model and error, respectively.Values of Fratio(t) obtained by Equation (14) were compared toa critical value from the F distribution. We repeated the aboveprocedure (Equations 10–14) 1000 times, each time using arandom assignment of avalanches to each of the two surrogategroups in Equation (10). Finally, we identified time-points ofFratio(t) where >1% of all 1000 random permutations were above
the critical F-value in Equation (14), corresponding to pointswhere data did not collapse reliably.
Using the above procedure, we found that despite slightmisalignments at the offset of avalanches, all time points werecollapsed above chance levels (Figure 3C; time-points that arerobustly aligned are shown by solid black lines). Similar resultsare found when considering only a subset of 30 channels(Figure 4A) and when altering the duration of time bins fordetecting avalanches (Figure 4B, see Methods).
We compared the above results with those of cultures treatedwith APV/DNQX. Distributions of avalanche duration, cellcount, as well as the relation between these measures are shownin Figures 2A-C, respectively. In previous work, we showed thatAPV/DNQX cultures yield avalanches with power-laws greaterthan 3/2 (Vincent et al., 2012). Smoothed mean avalanchesrecorded in this condition displayed a variety of shapes(Figure 4C, left panel). Attempts to collapse these shapes togetherresulted inmarked discrepancies both before and after the peak ofavalanches (Figure 4C, middle panel). These discrepancies werereflected in an F ratio test (Figure 4C, right panel). These resultsdiffer sharply from those of control cultures, which displayeda robust collapse at all time-points of avalanches. Importantly,while the poor collapse of APV/DNQX data may be anticipatedby observation of the original avalanche shapes (Figure 4C, leftpanel), results of the F ratio test provide a benchmark for theadequate behavior of the proposed framework.
In sum, the above analysis shows that control cultures generateavalanches across a range of different durations. These avalanchesshow a striking similarity as highlighted by a time-warpingfunction that robustly collapsed them together. By comparison,cultures treated with APV/DNQX, an AMPA/NMDA antagonistthat disrupts the scale-free distribution of avalanches, yieldedactivity that could not be collapsed to the same degree.
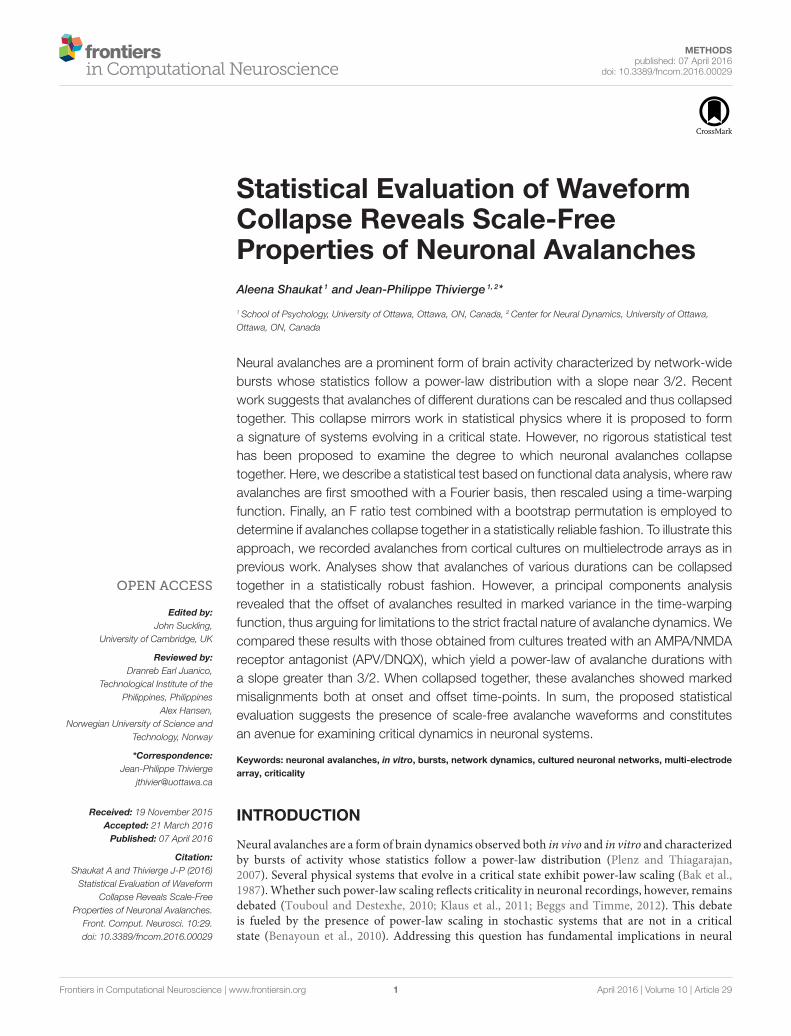
Principal Components AnalysisWhile the above results are consistent with the idea thatavalanches in a critical state of activity can be reliably collapsedtogether (Sethna et al., 2001; Friedman et al., 2012), they failto characterize the linear time-warping transformation thatmakes this possible. Examples of time-warping functions formean avalanches of different durations are shown in Figure 5A.Departures from a line of unity (Figure 5A, dashed line) areobserved predominantly at the onset and offset of avalanches.To further examine this effect, we entered the time-warpingfunctions hi(t) in a principal components analysis (PCA). ThisPCA performs a linear approximation of the time-warpingfunctions as follows:
hi (t) =
K∑
k= 1
fikξk (t) , (15)
where ξk are a set of orthonormal functions and
fik =
∫ T
0xi (t) ξk (t) dt. (16)
Frontiers in Computational Neuroscience | www.frontiersin.org 5 April 2016 | Volume 10 | Article 29

Shaukat and Thivierge Waveform Collapse in Neuronal Avalanches
FIGURE 4 | Avalanche collapse under various conditions. (A) Avalanche collapse with a random subsample of 30 channels. (B) Detecting avalanches with a bin
size of 5ms (instead of the 10ms default). (C) Avalanches in cultures treated with APV/DNQX. Times when F ratio exceeded the critical value in at least 1% of all
bootstrap realizations are shown in red.
The fitting criterion for Equation (15) is an integrated sum ofsquared errors,
SSE =
N∑
i=1
∥
∥
∥hi − hi
∥
∥
∥
2, (17)
where ‖·‖ is a norm operator. To minimize the above criterion,we sought a set of functions ξk by finding the solution with largesteigenvalue e of the eigenvector problem,
Vξ = eξ, (18)
where V is the variance-covariance matrix of the time-warpingfunctions hi (t). In order to visualize the results of the PCA,we plotted the mean time-warping function, plus or minus amultiple of the PCA function. To choose an adequate multipleto use, we defined a constant C to be the root-mean-squaredifference between the estimated mean function (µ) and theoverall time average (µ):
C2 = T−1∥
∥µ − µ∥
∥
2, (19)
where
µ = T−1
∫
µ (t) dt. (20)
We then plotted µ and µ ± 0.2Chi, where the constant 0.2 givesresults that are easy to interpret.
In control cultures, the largest principal component showsstronger values toward the offset of the time-warping function(Figure 5B, left panel). This is consistent with time-warpingbeing more variable in that time window, because avalanchecollapse is weaker (Figure 4A, middle panel). The second largestprincipal component shows divergence from the mean bothat the onset and offset of avalanches (Figure 5B, right panel).Together, the two largest principal components account for93% of variance across time-warping functions. We comparedthese results with those obtained from time-warping functionsfor the APV/DNQX data (Figure 5C). As with controls, thelargest principal component was associated with the offset ofavalanches (Figure 5D, left panel), while the second largestprincipal component covered most of the avalanche duration(Figure 5D, right panel).
In sum, analyses of the time-warping functions revealthat misalignments arise most strongly toward the offset ofavalanches, with slight misalignments also arising between theonset and peak of avalanches.
DISCUSSION
In this paper, we examined whether neuronal avalanches ofdifferent durations can be collapsed together (Sethna et al., 2001;Friedman et al., 2012). One implication of avalanche collapseis that they form a key signature of criticality in neuronal
Frontiers in Computational Neuroscience | www.frontiersin.org 6 April 2016 | Volume 10 | Article 29
Shaukat and Thivierge Waveform Collapse in Neuronal Avalanches
FIGURE 5 | Warping functions employed to collapse the avalanches. (A) Solid gray lines, examples of warping functions for mean avalanches of different
durations. Dashed black line is a line of unity. (B) Largest two principal components (PCs) of the warping functions from (A). Solid gray lines, perturbations around the
mean induced by each principal component (Equations 19–20). Solid black line, mean time-warping function of avalanches over time. (C) Warping functions for mean
avalanches under APV/DNQX. (D) Largest two principal components of the warping functions in (C).
systems, as they reflect a fractal property of activity at differenttimescales (Beggs and Timme, 2012). We tested this idea usinga statistical evaluation of avalanche collapse based on functionaldata analysis (Ramsay and Silverman, 2005). Our results showthat avalanches could be collapsed together in a statisticallyrobust fashion. By comparison, recordings under APV/DNQX,which alter the scale-free distribution of avalanches, yielded anunreliable collapse of avalanches at both the onset and offsettime-points.
These results thus support the collapse of neuronal avalanchesand highlight experimental conditions under which it may bedisrupted. A follow-up examination of the time-warping functionemployed to collapse avalanches, however, showed variationsacross avalanches, particularly near their offset, thus calling intoquestion the strict fractal nature of this activity.
The proposed framework for evaluating avalanche collapsemay serve to discern amongst different classes of models thatgenerate power-law distributions of avalanches (Levina et al.,2007; Thivierge and Cisek, 2008; Benayoun et al., 2010; Rubinovet al., 2011). While these models may successfully reproducepower-law statistics of avalanches observed experimentally, itis unclear whether they would also capture avalanche collapse.One crucial factor in generating avalanche collapse may bethe connectivity of neural models (Friedman et al., 2012). Afull examination of this hypothesis, however, remains to beperformed. Further work is also required to examine the collapseof neuronal avalanches in other datasets where power-lawdistributions have been reported, including in vivo activity(Petermann et al., 2009).
While the framework described here relies on functionaldata analysis, alternatives are possible, including the use ofdynamic time warping (Theodoridis and Koutroumbas, 2009).As with functional data analysis, dynamic time warping uses atime transformation to compare time-series that vary in speed.However, a disadvantage of dynamic time warping is that it doesnot guarantee that the warped time-series will result in smoothlydifferentiable functions, which prevents further analyses such asthe identification of peaks (Thivierge, 2009) as well as a functionalPCA (Figure 5).
It remains unclear whether the statistical collapse ofavalanches provides a definitive signature of critical dynamics inneural systems. Crucially, stochastic systems have been shownto capture power-law distributions of avalanches (Touboul andDestexhe, 2010). It remains to be shown whether such systemsalso exhibit an avalanche collapse in conditions that mimicnormal and pharmacologically-altered states. Analyses of suchsystems could test a further prediction of critical phenomena notaddressed here, namely that the size distribution of avalanchesshould scale as
s−τL(
s(
b− d)1/σ
)
(21)
where L (·) is a universal scaling function and b is a parametertuned away from the critical value d.
One limitation of the approach proposed here is that we areconstrained to collapsing avalanche shapes along the time axis,and not along their amplitudes. Thus, the more general problemof data collapse remained to be addressed. However, our current
Frontiers in Computational Neuroscience | www.frontiersin.org 7 April 2016 | Volume 10 | Article 29

Shaukat and Thivierge Waveform Collapse in Neuronal Avalanches
work offers an important step in this direction by proposing astatistical framework to evaluate the quality of scaling collapse inavalanche data, and may be expanded upon in future studies.
AUTHOR CONTRIBUTIONS
JT designed the experiments; AS and JT performed data analysis;AS and JT wrote the manuscript.
ACKNOWLEDGMENTS
This work was supported by a Discovery grant from the
Natural Sciences and Engineering Council of Canada (NSERC
Grant No. 210977 and No. 210989), operating funds from
the Canadian Institutes of Health Research (CIHR Grant No.
6105509), and the University of Ottawa Brain and Mind Institute
(uOBMI).
REFERENCES
Bak, P., Tang, C., and Wiesenfeld, K. (1987). Self-organized criticality:
an explanation of the 1/f noise. Phys. Rev. Lett. 59, 381–384. doi:
10.1103/PhysRevLett.59.381
Beggs, J. M., and Plenz, D. (2003). Neuronal avalanches in neocortical circuits.
J. Neurosci. 23, 11167–11177.
Beggs, J. M., and Timme, N. (2012). Being critical of criticality in the brain. Front.
Physiol. 3:163. doi: 10.3389/fphys.2012.00163
Benayoun, M., Cowan, J. D., Van Drongelen, W., and Wallace, E. (2010).
Avalanches in a stochastic model of spiking neurons. PLoS Comput. Biol.
6:e1000846. doi: 10.1371/journal.pcbi.1000846
Eytan, D., and Marom, S. (2006). Dynamics and effective topology underlying
synchronization in networks of cortical neurons. J. Neurosci. 26, 8465–8476.
doi: 10.1523/JNEUROSCI.1627-06.2006
Friedman, N., Ito, S., Brinkman, B. A., Shimono, M., Deville, R. E., Dahmen, K. A.,
et al. (2012). Universal critical dynamics in high resolution neuronal avalanche
data. Phys. Rev. Lett. 108, 208102. doi: 10.1103/PhysRevLett.108.208102
Green, P. J., and Silverman, B. W. (1994). Nonparametric Regression and
Generalized Linear Models: A Roughness Penalty Approach. London: Chapman
and Hall. doi: 10.1007/978-1-4899-4473-3
Klaus, A., Yu, S., and Plenz, D. (2011). Statistical analyses support power
law distributions found in neuronal avalanches. PLoS ONE 6:e19779. doi:
10.1371/journal.pone.0019779
Langlois, D., Cousineau, D., and Thivierge, J. P. (2014). Maximum likelihood
estimators for truncated and censored power-law distributions show how
neuronal avalanches may be misevaluated. Phys. Rev. E Stat. Nonlin. Soft Matter
Phys. 89:012709. doi: 10.1103/PhysRevE.89.012709
LeBlanc, M., Angheluta, L., Dahmen, K., and Goldenfeld, N. (2013). Universal
fluctuations and extreme statistics of avalanches near the depinning
transition. Phys. Rev. E Stat. Nonlin. Soft Matter Phys. 87:022126. doi:
10.1103/PhysRevE.87.022126
Levina, A., Herrmann, J. M., and Geisel, T. (2007). Dynamical synapses causing
self-organized criticality in neural networks. Nat. Phys. 3, 857–860. doi:
10.1038/nphys758
Mehta, A. P., Mills, A. C., Dahmen, K. A., and Sethna, J. P. (2002). Universal pulse
shape scaling function and exponents: critical test for avalanche models applied
to Barkhausen noise. Phys. Rev. E Stat. Nonlin. Soft Matter Phys. 65:046139. doi:
10.1103/PhysRevE.65.046139
Petermann, T., Thiagarajan, T. C., Lebedev, M. A., Nicolelis, M. A., Chialvo,
D. R., and Plenz, D. (2009). Spontaneous cortical activity in awake
monkeys composed of neuronal avalanches. Proc. Natl. Acad. Sci. U.S.A. 106,
15921–15926. doi: 10.1073/pnas.0904089106
Plenz, D., and Thiagarajan, T. C. (2007). The organizing principles of neuronal
avalanches: cell assemblies in the cortex? Trends Neurosci. 30, 101–110. doi:
10.1016/j.tins.2007.01.005
Ramsay, J. O., and Silverman, B. W. (2005). Functional Data Analysis.
New York, NY: Springer. doi: 10.1002/0470013192.bsa239
Rubinov, M., Sporns, O., Thivierge, J. P., and Breakspear, M. (2011).
Neurobiologically realistic determinants of self-organized criticality
in networks of spiking neurons. PLoS Comput. Biol. 7:e1002038. doi:
10.1371/journal.pcbi.1002038
Sethna, J. P., Dahmen, K. A., and Myers, C. R. (2001). Crackling noise. Nature 410,
242–250. doi: 10.1038/35065675
Shew, W. L., Yang, H., Petermann, T., Roy, R., and Plenz, D. (2009).
Neuronal avalanches imply maximum dynamic range in cortical networks
at criticality. J. Neurosci. 29, 15595–15600. doi: 10.1523/JNEUROSCI.3864-
09.2009
Shew, W. L., Yang, H., Yu, S., Roy, R., and Plenz, D. (2011). Information
capacity and transmission are maximized in balanced cortical networks with
neuronal avalanches. J. Neurosci. 31, 55–63. doi: 10.1523/JNEUROSCI.4637-
10.2011
Tauskela, J. S., Fang, H., Hewitt, M., Brunette, E., Ahuja, T., Thivierge, J.
P., et al. (2008). Elevated synaptic activity preconditions neurons against
an in vitro model of ischemia. J. Biol. Chem. 283, 34667–34676. doi:
10.1074/jbc.M805624200
Theodoridis, S., and Koutroumbas, K. (2009). Pattern Recognition. San Diego, CA:
Academic Press.
Thivierge, J. P. (2009). Higher derivatives of ERP responses to cross-modality
processing. Neuroinformatics 6, 35–46. doi: 10.1007/s12021-007-9007-5
Thivierge, J. P. (2014). Scale-free and economical features of functional
connectivity in neuronal networks. Phys. Rev. E Stat. Nonlin. Soft Matter Phys.
90:022721. doi: 10.1103/PhysRevE.90.022721
Thivierge, J. P., and Cisek, P. (2008). Nonperiodic synchronization in
heterogeneous networks of spiking neurons. J. Neurosci. 28, 7968–7978. doi:
10.1523/JNEUROSCI.0870-08.2008
Touboul, J., and Destexhe, A. (2010). Can power-law scaling and neuronal
avalanches arise from stochastic dynamics? PLoS ONE 5:e8982. doi:
10.1371/journal.pone.0008982
Vincent, K., Tauskela, J. S., Mealing, G. A., and Thivierge, J. P. (2013). Altered
network communication following a neuroprotective drug treatment. PLoS
ONE 8:e54478. doi: 10.1371/journal.pone.0054478
Vincent, K., Tauskela, J. S., and Thivierge, J. P. (2012). Extracting functionally
feedforward networks from a population of spiking neurons. Front. Comput.
Neurosci. 6:86. doi: 10.3389/fncom.2012.00086
Conflict of Interest Statement: The authors declare that the research was
conducted in the absence of any commercial or financial relationships that could
be construed as a potential conflict of interest.
Copyright © 2016 Shaukat and Thivierge. This is an open-access article distributed
under the terms of the Creative Commons Attribution License (CC BY). The use,
distribution or reproduction in other forums is permitted, provided the original
author(s) or licensor are credited and that the original publication in this journal
is cited, in accordance with accepted academic practice. No use, distribution or
reproduction is permitted which does not comply with these terms.
Frontiers in Computational Neuroscience | www.frontiersin.org 8 April 2016 | Volume 10 | Article 29