Embed Size (px)
Citation preview

Statistical Analysis of the Blowfish Algorithm
Vinayak Sasikumar
[email protected] Graduate Student, Computer Science Department.
Rochester Institute of Technology.
Fall, 2013.
Project Advisor: Prof. Alan Kaminsky
Introduction
Block Ciphers are deterministic algorithms which when given a fixed-length input plaintext and a fixed
length key, produces a fixed-length output ciphertext. One way to evaluate the strength of the algorithm
is to study the mapping of input bits (plaintext-key) to output bits. Seemingly random mappings are
considered to be ideal for a good cryptographic function. The randomness of this mapping can be
explored by making use of statistical tests, which are inherently designed to make a decision about a
particular hypothesis being studied; the decision being whether the hypothesis matches with the
observed data, hence making it true, or otherwise.
More commonly used statistical test suites for performing such evaluations such as the NIST test suite
have certain deficiencies in their approach, which have been covered briefly as part of the background
study. Professor Alan Kaminsky has been working on a new approach to perform such statistical tests,
which overcome these deficiencies. The goal of this project is to implement one such statistical test
namely the Nonlinearity Test, along with a block cipher to run the test on, to be integrated into the
existing test framework, called CryptoStat.
Background
As mentioned previously, commonly used statistical test suites for evaluating the randomness of block
ciphers, such as the NIST test suite [6], are not well-suited for evaluating block ciphers. The deficiencies,
which are outlined in detail in the paper on the Coincidence Test [1], are summarized below:
The test suites are designed as generalized tests for evaluating the randomness of an arbitrarily
long sequence of bits. To apply the test suite, the block ciphers have to be modified to function
as a pseudo-random number generator (PRNG). The effect of doing so is that the tests would be
evaluating the randomness of the PRNG, and not that of the block cipher itself.
Most test suites make use of a frequentist approach to statistical testing which produces a single
decision value for each trial of a test. Each test is run for multiple trials, leading to multiple
independent decision values for multiple runs of a single test, of which some may be in favor of,
and other against the hypothesis. There is no specified procedure for aggregating the obtained
decision values into a single decision value, hence requiring a further layer of evaluation of the
multiple decision values.
The paper introduces the Coincidence test, a statistical test which makes use of the Bayesian approach.
The Bayesian Model Selection methodology leverages the rules of probability theory to select from
amongst different hypotheses, by computing a single value termed the posterior odds ratio. The
Bayesian approach is based on making an assumption about the probability ratio with which a
hypothesis and its complement occurs (prior odds ratio) and modifying that assumption depending on
the actual observed bias (Bayes Factor). The adjusted ratio is referred to as the posterior odds ratio.
Figure 1 - The Coincidence Test [1]
The relation between the posterior odds ratio and the prior odds ratio has been covered in depth in the
paper on the coincidence test [1]. The following is an attempt at summarization of this relationship:

Let H1 and H2 be two assumed hypotheses from some sample data D. Let pr(D|H1) be the conditional
probability of the data given the hypothesis H1, pr(D) be the probability of the data, and pr(H) be the
probability of the hypothesis. Bayes’ Theorem defines the probability of the hypothesis, given some
observed sample data as:
(1)
This can be now extended to find the ratio between two hypotheses H1 and H2, given the same data D
as:
(2)
Here the prior odds ratio is simply pr(H1) /pr(H2) i.e. the assumed probability ratio of the two hypotheses
prior to observing the sample data; the term pr(D|H1) / pr(D|H2) is called the Bayes Factor, which is
essentially the ratio of the observed probability ratio to the assumed probability ratio.
This ratio can now be extended to represent two experiments with two sets of distinct data D1 and D2,
as:
(3)
This can now be extended to a number of samples, wherein the final posterior odds ratio is the initial
prior odds ratio times all the sample data’s Bayes Factors.
The paper goes on to describe a parameterized version of the formula (3) for a binomial model, i.e. a
model which will be successful with a certain fixed probability, as follows:
(4)
∫
Where pr(D|θ,H) is the probability with which the sample D will be observed given the model H with θ
as a parameter, π(θ|H) is the probability density of θ for the model H.
Let n be the number of Bernoulli trials conducted having a success probability of θ and k be the actual
observed successes for a given sample data D. Then,
(5)
(
)
The Bayes Factor for two parameterized hypotheses H1 and H2 with parameters θ1 and θ2, in the
equation (2) can be written as follows, using equation (4):
(6)
∫
∫
The coincidence test deals with computing the odds ratio between two binomial models. One of which,
H1, represents a model for which θ1 (the success probability that the model is assumed to have) is a
value p. As mentioned in the paper on the coincidence test [1], the probability density for θ1 can be
pr(H|D) =

expressed as a delta function, π(θ1|H) = δ(θ1 – p). Plugging this value in the numerator for equation (5)
gives:
(7)
H2 is a model having an unknown success probability θ2 having a density value π(θ2|H2) = 1 within the
range 0≤ θ2≤1, and a value π(θ2|H2) = 0, otherwise. Plugging this into the denominator of equation (6),
along with the value of equation (5) yields (see Appendix A of [1]):
(8)
pr(D|H2) =
Replacing equations (7) and (8) as the numerator and denominator, respectively, of equation (6) we get
the Log Bayes Factor as:
(9)
The factorial can be represented as a gamma function as follows:
This is an important replacement since, although we cannot contain the gamma function’s value in a
computer program’s floating point number, the logarithm of a gamma function can be easily computed
and stored. The logarithm of the above equation yields the Log Bayes Factor equation as follows:
(10)
As discussed earlier as part of equation (3), multiple runs of the same experiments with independent
data samples will lead to a series of Bayes Factor values. On taking a logarithm on both sides of equation
(3) will give us multiple Log Bayes Factors, for each run of the test, which can be simply add to one
another and finally added to the log prior odds ratio, to give us the Log Posterior Odds Ratio
(abbreviated as L.O.R.). The assumption is that H1 and H2 are equally probable to start off with, implying
that the prior odds ratio will be 1 and the log of which will be 0. The LOR will hence be the sum of all the
computed Log Bayes Factor.
This is the calculation required as part of each test run and will be further covered as part of the section
covering the Non-Linearity Test.

System
This section covers the software that was implemented as part of the project, namely the Java
implementation of the Blowfish algorithm and a new statistical test, the Non-Linearity test, which was
added as part of the existing CrytoStat Library.
Block Cipher – Blowfish
Blowfish is a symmetric block-cipher which has a variable-length key, from 32 bits to 448 bits, and
produces a 64-bit output ciphertext. It was designed by Bruce Schneier in 1993, as a fast and free
alternative to existing algorithms [3].
The algorithm consists of two parts: a key-expansion part and a data- encryption part. Key expansion
converts a key of at most 448 bits into several sub-key arrays totaling 4168 bytes. Data encryption
occurs in 16-rounds of a Feistel network, each comprising of permutations and substitutions which are
key dependent and key- data-dependent respectively. The operations used are mainly XORs and
additions on 32-bit words, apart from the 4 array lookups per round.
Blowfish uses a large number of sub-keys, which have to be pre-computed before the actual encryption
of data, namely the P-array, and 4 S-boxes. The P-array consists of 18 32-bit sub-keys, one of which is
used every round and after the final round one each half of the intermediate output is XORed with one
of the two remaining P-entries. Each S-box is 256-entry S-boxes which acts as a mapping of an 8-bit
input to a 32-bit output entry. The P-array and the 4 S-boxes are initialized, in order, with a fixed string.
The string consists of the hexadecimal digits of pi (barring the initial 3). The actual key schedule
algorithm is as follows:
1. Initialize the P-array and the 4 S-boxes as described above.
2. XOR P1 with the first 32-bits of the key, XOR P2 with the second 32 bits of the key, and so on,
until the entire key is used (only possible till P14 at max), repeatedly cycling through the key bits
until all of them are consumed.
3. Encrypt an all 0’s input with the Blowfish algorithm, using all the created sub-keys.
4. Replace P1 and P2 with the output of step (3).
5. Encrypt the output of step (3) using the Blowfish algorithm with the modified sub-keys.
Key
(Fixed/Variable
Length)
Ciphertext (Fixed Length
Block Cipher
PlainText (Fixed Length Input)
Figure 2 - Generalized Block Cipher

6. Replace P3 and P4 with the output of step (5).
7. Repeat this process of replacing all the entries of the P-array and then S1, S2, S3 and S4, in that
order.
In total, 521 iterations are required to generate all required sub-keys. In order to eliminate the need to
re-compute the sub-keys for repeated keys, modifications had to be made to separate out the key-
injection into the algorithm, allowing callers to make multiple runs of the algorithm, just by setting the
key for the first run, reusing the computed sub-keys for the subsequent calls to the cipher’s encryption.
The working of the actual Blowfish algorithm is shown in Figure 3.
Figure 3.1 - Blowfish Feistel Structure[3]
Figure 3.3 – Blowfish round function F [3]
Divide x into two 32-bit halves: xL, xR Run for round i = 1 to 16: xL = xL XOR Pi xR = F(xL) XOR xR Swap xL and xR Increment i Swap xL and xR (Undo the last swap.) xR = xR XOR P17 xL = xL XOR P18 Recombine xL and xR
Figure 3.2 - Blowfish Algorithm [4]
Function F (see Figure 2.1): Divide xL into four eight-bit sections:
a, b, c, and d
F(xL) = ( ( ( S1[a] +32-bit S2[b] ) XOR
S3[c] ) +32-bit S[d] )
Figure 3.4 - Operations in F [4]

The CryptoStat Library
The CryptoStat library runs a series of statistical tests on a block cipher or MAC, to test the randomness
of the cryptographic function’s mappings. It leverages the Parallel Java 2 (PJ2) library1 to run multiple
statistical tests, on a chosen cryptographic function, in parallel on a cluster. Detailed information on the
framework can be found here [5].
The parameters that the library needs to function are as follows:
Function (F) – Cryptographic function to perform the tests on.
T – Number of trials to perform for each test.
N – Number of samples on which to run each test.
B – Number of bit-groups to choose, for each bit-group size.
W – Number of worker tasks which perform the actual runs.
Random File – Source of Random bytes.
Output File – Name of the output file.
Each trial computes the cryptographic function on 5N samples of input data, namely
N samples — All-0s plaintext, random key
N samples — All-1s plaintext, random key
N samples — Random plaintext, all-0s key
N samples — Random plaintext, all-1s key
N samples — Random plaintext, random key
The input data assembly and storage allocation for the output data is performed by the FunctionData
class, which is instantiated by the CryptoStatWorker instances. This data consists of the above
mentioned input samples, along with any extra input data that the tests might require. The ciphertext
for all of the generated input data, as well as extra input, is computed and stored. The workers pass this
computed plaintext, ciphertext and key data to the test objects, which in turn performs the required
test operations on the data and compute the Log Odds Raito for the given input.
The test framework currently comprises of the following statistical tests:
UniformityTest
CiphertextIndependenceTest
ComplementTest
InputOutputIndependenceTest
StrongAvalancheTest
NonLinearityTest
1 PJ2 is an API for running parallel programs on Shared Memory Multi-processor machines, cluster
parallel machines and hybrid SMP cluster machines.

Non-Linearity Test
This section covers the details of the Non-Linearity Test, which was implemented as part of this project,
to extend the existing test framework.
To be secure, every cipher must contain operations which introduce nonlinearity. Performing only linear
operations in a cipher would cause it to be reduced to a series of linear equations and be open to
algebraic attacks. The general methods to introduce nonlinearity into the cipher, at relatively low cost,
are:
1. S-boxes: They are “boxes” which map an n-bit input to an m-bit output based on some source
of nonlinearity. They can be either pre-determined, as in the case of DES or dynamically
generated based on the key, as in Blowfish.
2. Mixing operations from different algebras: This involves performing Boolean operations in
conjunction with arithmetic operations, such as the round function of the Blowfish algorithm:
((S1[a] + S2[b]) XOR S3[c]) + S4[d])
3. Rotation operations: Also known as circular shifts, are nonlinear in normal algebra.
Modern block ciphers generally make use of all these methods in tandem to introduce nonlinearity into
the mapping from input to output.
A function F is said to be linear if:
F(A) + F(B) = F(A+B)
In the context of a cipher, the function F is the cipher itself in the form of a function, which takes as
input the plaintext and/or key, and gives the ciphertext as the output; A and B would be fixed length bits
thus modifying the addition to be modulo 232. For testing nonlinearity, we must check for inequality of
the expression, hence yielding the expression for nonlinearity as:
F(A) ⊕ F(B) ≠ F(A ⊕ B)
For brevity, let the left side of the inequality be C1 and the right side be C2.
The Nonlinearity test has a number of subtests for which it runs. Each of the subtests runs on data
comprising of C1 and C2 which it checks for inequality. The data for each subtest is created by splitting
the ciphertext into multiple bit groups as follows; assuming the ciphertext is 64-bits:
Bit groups of size, g =1: 0, 1, 2, 3, …, 63.
Bit groups of size, g =2: Any two bits; e.g. (0, 1), (3, 45), (4, 17) etc. Total possible: ( )
Bit groups of size, g =4: Any four bits; e.g. (0, 4, 6, 57), (1, 12, 17, 60) etc. Total possible: ( )
Bit groups of size, g =8: Any eight bits; e.g. (0, 2, 25, 28, 37, 42, 55, 60) etc. Total possible: ( )
Until g = 64
The test would ideally check each possible combination of bit groups in C1 with the corresponding bit
groups in C2. This would, however lead to too many possible combinations to consider. More precisely,
Let g be the size of the bit group; n is the number of bits in the ciphertext output; S is the total number
of subtests.

For g = 1, There will be n number of ways of choosing single bit groups and hence S = n
For g = k, There will be possible ways of selecting k-bit groups and hence S =
To put this value into perspective, let us choose n = 64, as in the case of Blowfish, and k = 8, we get the
number of subtests, S = 4,426,165,368.
Clearly, it is not possible to consider so many combinations. Hence, a fixed number of such
combinations are chosen, at random, from amongst the total, per bit-group iteration. The
value, B, is inputted as a parameter to the test suite. For the tests that were run, the value
for B was fixed at 50.
Each subtest is run as follows:
1. For each trial of subtests, a random fixed-length string of bits, B, is chosen.
2. The fixed-length bit stream, A, are provided by the CryptoStat framework (the 5N samples
specified in the section The CrytpoStat Library).
3. The three bit streams A, B and A ⊕ B are passed to the library as input to the ciphers along with
a key, which is pre-determined for that particular trial, to compute the corresponding F(A), F(B)
and F(A ⊕ B).
4. The XOR of F(A) and F(B) are checked for equality with F(A ⊕ B)
5. A count is maintained for the number of times they turn out to be equal and is inputted into the
Log Bayes Factor computation, at the end of each trial.
Figure 4 - Evaluation done by a single subtest of the Non-Linearity Test
The following is an example run of the Non-Linearity Test: Let F be a cryptographic function which
outputs a 8-bit string. Let F(A) = 10011001; F(B) = 01110010; F(A ⊕ B) = 11010011
Let the number of bit positions selected per bit group, B = 2; Let g be the size of a bit group.
Bit positions for g = 1 will be B selections of single bits between 0 and 7, say bits 3 and 5.
Now F(A)3 = 1 ; F(B)3 = 1;
F(A ⊕ B)3 = 1. (1)
Compute F(A) ⊕ F(B) = 1 ⊕ 1 = 0 (2)
We now check whether F(A) ⊕ F(B) = F(A ⊕ B); i.e. whether (1) and (2) are equal, which they are not in
this case.

The same step is repeated for bit position 5;
F(A)5 = 0 ; F(B)5 = 0;
F(A ⊕ B)5 = 0. (3)
Compute F(A) ⊕ F(B) = 1 ⊕ 1 = 0 (4)
We now check whether F(A) ⊕ F(B) = F(A ⊕ B); (3) and (4) are equal in this case so we increase a count;
This is the end of the subtest for g = 1, for a SINGLE data sample. This can now be run for N samples of
different data, summing up the count as we run each of the subtests.
We can now compute the Log Bayes Factor for g = 1 as specified in the equation (10) in the Background
section, having values of n = N; k as the count maintained for every equality; p is the assumed
probability of the number of times the equality occurs, which as mentioned in [1] is
The same procedure can be followed for g = 2
Bit positions for g = 2 will be B selections of 2 bits between 0 and 7, say (1,2) and (3,5)
F(A)1,2 = 00 ; F(B)1,2 = 11;
F(A ⊕ B)1,2 = 10. (1)
Compute F(A) ⊕ F(B) = 00 ⊕ 11 = 11 (2)
We now check whether F(A) ⊕ F(B) = F(A ⊕ B); i.e. whether (1) and (2) are equal, which they are not in
this case.
F(A)3,5 = 10 ; F(B)3,5 = 10;
F(A ⊕ B)3,5 = 10. (1)
Compute F(A) ⊕ F(B) = 10 ⊕ 10 = 00 (2)
We now check whether F(A) ⊕ F(B) = F(A ⊕ B); i.e. whether (1) and (2) are equal, which they are not in
this case.
This is the end of the subtest for g = 2, for a SINGLE data sample. This can now be run for N samples of
different data, summing up the count as we run the subtest on different sample data.
We can now compute the Log Odds Raito for g = 2, as specified in equation (10) with the same
parameters as mentioned above.
This procedure can be followed for g = 4 and 8.
NOTE: for g = 8, we will not need B selections as we can choose 8 bits from 8 bits in only 1 way.
i.e. ( ) = 1.
The computed Log Bayes Factors can be added up for each of the run of the test into the final Log Odds
Ratio. The section on the Results will cover the criteria for the Log Odds Ratio, based on which the
pass/fail verdict is computed.
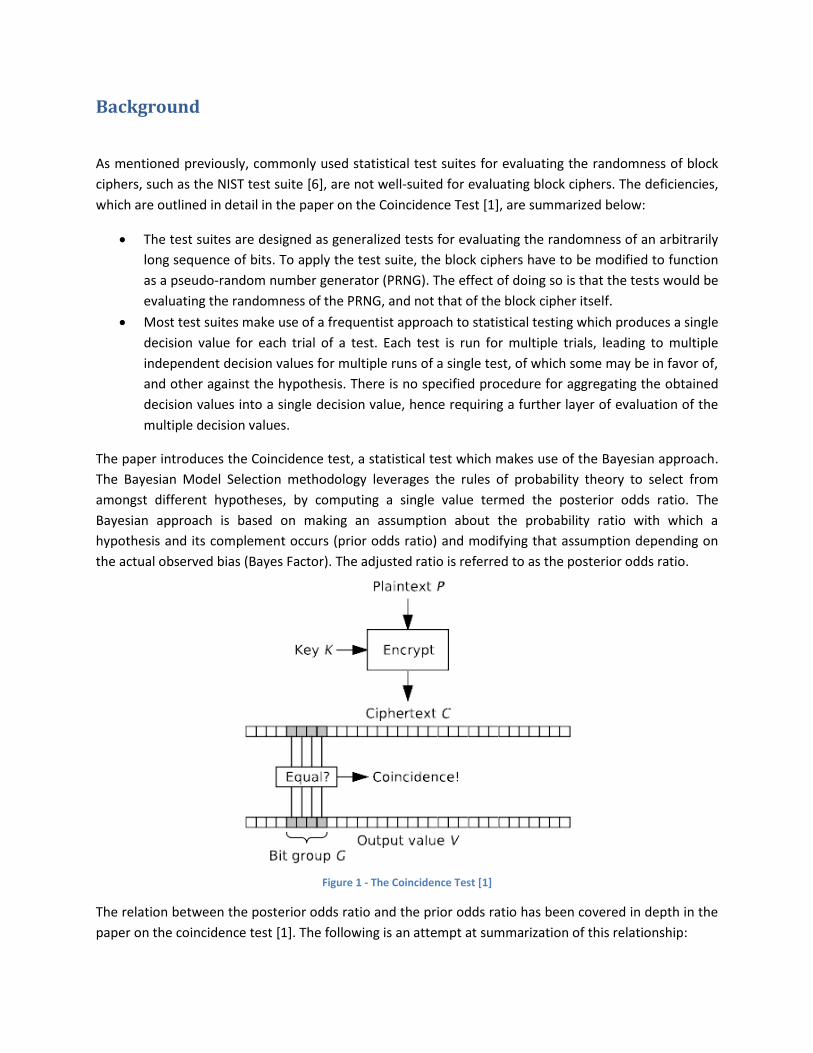
Results The following tables summarize worst case values of the Log Odds Raito for each round of the Blowfish
algorithm for test runs. The parameters of the test runs were as follows:
Number of trials to perform for each test (T) = 200
Number of samples on which to run each test (N) = 1000
Number of bit-groups to choose, for each bit-group size (B) = 50
Number of worker tasks which perform the actual runs (W )= 8
This test was run on 8 machines which are part of a cluster of parallel machines.
The total time taken to run the test was 71502466 msec = 19.8 hours
The following graph gives the worst case values of the Log Odds Ratio for each of the statistical tests per
round of the Blowfish algorithm. The pass/fail verdict can be calculated as follows, where ln(x) is the
natural log of x:
Log Odds Ratio Verdict
<= -ln(100) Fail
> -ln(100) and <= 0 Maybe Fail
> 0 and < ln(100) Maybe Pass
>= ln (100) Pass
The complete set of values, along with the bit group for which they were computed and the pass/fail
verdict has been tabulated in the Appendix.
Figure 5 - Run for T=200; n=1000; B=50
It is clearly visible from the above graph that any fail verdicts, if any, occur in rounds < 3 for the Blowfish
cipher. Rounds 3 and above pass all the tests, which is as expected. The Non-Linearity tests, for instance,
-4.00E+03
-3.00E+03
-2.00E+03
-1.00E+03
0.00E+00
1.00E+03
2.00E+03
3.00E+03
4.00E+03
1 2 3 4 5 6 7 8 9 10 11 12 13 14 15 16
Log
Od
ds
Rat
io
Rounds
Worst case L.O.R. per round of Blowfish
Non-Linearity Test
Strong Avalanche Test
Input-OutputIndependence Test
Complement Test
CiphertextIndependence Test
Uniformity Test

looks for non-linearity between the input and the output after a particular round. The Blowfish cipher
introduces non-linearity into the ciphertext by performing mixing operations and making use of S-boxes
which possibly require multiple iterations to take effect, hence showing “weakness” in the lower rounds.
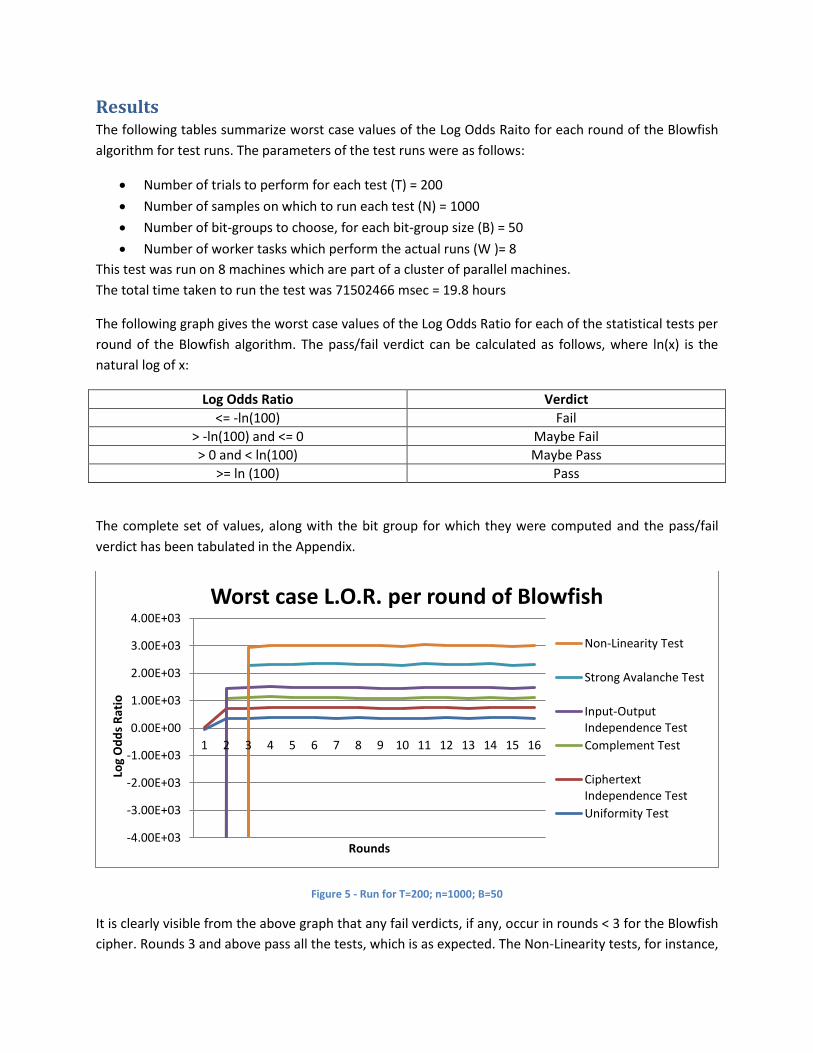
The chart below gives the randomness margin for each of the statistical test on the Blowfish Algorithm,
for the above mentioned run parameters. The randomness margin is a value which describes the ratio of
the rounds for which a given cipher displays randomness to the total number rounds for which it is run.
It is defined as (1 – r/R) where ‘r’ is the maximum round for which non-randomness was detected in the
cipher, for a particular test; ‘R’ is the total number of rounds for which the cipher runs.
Figure 6 - Randomness margin for the Blowfish Algorithm across all tests.
0.8 0.85 0.9 0.95 1 1.05
Uniformity Test
Cipher-Independence Test
Complement Test
Input-Output Independence…
Strong Avalanche Test
Non-Linearity Test
Randomness Margin (1-r/R) Tests run for: Function (F) = Blowfish
No. of Samples (N) = 1000
No. of Trials (T) = 200
Bits per bit group (B) = 50
No. of Workers (W) = 8
Running Time = 19.7 Hours
r - Max Non-random Rounds
R - Total Rounds

Future Work
This section outlines the future work that can augment and extend the work already done in this field.
Expand test suite: Currently the test suite contains 6 statistical tests, as mentioned in the
section CrytoStat Library, which can be run on a cryptographic algorithm. Addition of further
statistical tests will provide better coverage of various properties of cryptographic functions
being tested.
Test Cryptographic Hash functions: CryptoStat currently only contains block ciphers and MACs
on which the statistical tests are run. Enabling Hash functions to be tested will require some
way to eliminate dependence on a “key” in the framework, since most hash functions are not
keyed.
Run greater number of trials: The number of trials run as part of this project was 200. Although
this is a fairly large number of trials, performing further trials would result in a more uniform
distribution of the randomness which is was introduced by the test framework itself i.e. the
random selection of the bit in a bit group and the random bit-streams used as plaintext and key
values.
Run tests for a greater number of bits per bit group: For a cipher which outputs an n bit cipher,
bit group of size g will have ( ) possible combinations with which g bits can be selected. For n =
64 and g= 8, the total number of combinations is 4,426,165,368. For the run of the tests for this
project, the chosen value for B (bit combinations to choose per bit group) = 50. Clearly, this is
scope for running the tests with a much higher value of B. However, it must be noted a higher
value of B would result in a larger amount of memory which the framework will require to run.
This has to be managed in some way to ensure the Java JVM does not exceed its allocated heap.
Leverage GPUs for further speed-up: The CryptoStat framework achieves parallelism by
making use of a cluster of parallel machines. Another way of achieving speed-up is to make use
of GPUs on a particular machine. A further enhancement to the speedup can achieved by
splitting trials on multiple machines of a parallel cluster, and locally making use of a GPU on
those machines.

References
1. The Coincidence Test - Kaminsky, Alan. "CryptoStat — Bayesian Statistical Analysis of
Cryptographic Functions." CryptoStat — Bayesian Statistical Analysis of Cryptographic Functions.
N.p., n.d. Web. 06 Dec. 2013.
2. Bayes Factor - Kass, R., Raftery, A.: Bayes factors. Journal of the American Statistical Association
90, 773–795 (1995)
3. "Blowfish (cipher)." Wikipedia. Wikimedia Foundation, 29 Nov. 2013. Web. 06 Dec. 2013.
4. Blowfish - Schneier, Bruce. "Description of a New Variable-Length Key, 64-Bit Block Cipher
(Blowfish). “ Blowfish Paper. N.p., n.d. Web. 06 Dec. 2013.
5. Kaminsky, Alan. "CryptoStat — Bayesian Statistical Analysis of Cryptographic
Functions."CryptoStat — Bayesian Statistical Analysis of Cryptographic Functions. N.p., n.d.
Web. 13 Dec. 2013. http://www.cs.rit.edu/~ark/parallelcrypto/cryptostat/
6. Rukhin, A., Soto, J., Nechvatal, J., Smid, M., Barker, E., Leigh, S., Levenson, M.,Vangel, M., Banks, D., Heckert, A., Dray, J., Vo, S., Bassham, L.: A statistical test suite for random and pseudorandom number generators for cryptographic applications. NIST Special Publication 800-22. http://csrc.nist.gov/groups/ST/toolkit/rng/documents/SP800-22rev1a.pdf
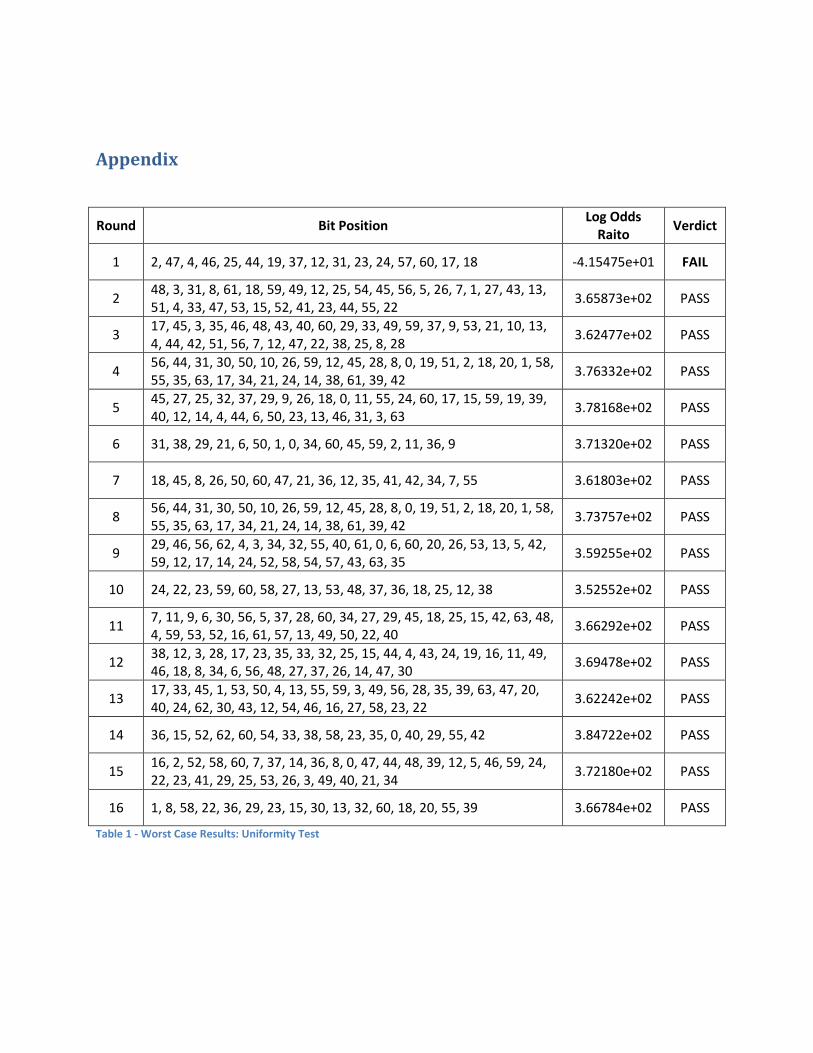
Appendix
Round Bit Position Log Odds
Raito Verdict
1 2, 47, 4, 46, 25, 44, 19, 37, 12, 31, 23, 24, 57, 60, 17, 18 -4.15475e+01 FAIL
2 48, 3, 31, 8, 61, 18, 59, 49, 12, 25, 54, 45, 56, 5, 26, 7, 1, 27, 43, 13, 51, 4, 33, 47, 53, 15, 52, 41, 23, 44, 55, 22
3.65873e+02 PASS
3 17, 45, 3, 35, 46, 48, 43, 40, 60, 29, 33, 49, 59, 37, 9, 53, 21, 10, 13, 4, 44, 42, 51, 56, 7, 12, 47, 22, 38, 25, 8, 28
3.62477e+02 PASS
4 56, 44, 31, 30, 50, 10, 26, 59, 12, 45, 28, 8, 0, 19, 51, 2, 18, 20, 1, 58, 55, 35, 63, 17, 34, 21, 24, 14, 38, 61, 39, 42
3.76332e+02 PASS
5 45, 27, 25, 32, 37, 29, 9, 26, 18, 0, 11, 55, 24, 60, 17, 15, 59, 19, 39, 40, 12, 14, 4, 44, 6, 50, 23, 13, 46, 31, 3, 63
3.78168e+02 PASS
6 31, 38, 29, 21, 6, 50, 1, 0, 34, 60, 45, 59, 2, 11, 36, 9 3.71320e+02 PASS
7 18, 45, 8, 26, 50, 60, 47, 21, 36, 12, 35, 41, 42, 34, 7, 55 3.61803e+02 PASS
8 56, 44, 31, 30, 50, 10, 26, 59, 12, 45, 28, 8, 0, 19, 51, 2, 18, 20, 1, 58, 55, 35, 63, 17, 34, 21, 24, 14, 38, 61, 39, 42
3.73757e+02 PASS
9 29, 46, 56, 62, 4, 3, 34, 32, 55, 40, 61, 0, 6, 60, 20, 26, 53, 13, 5, 42, 59, 12, 17, 14, 24, 52, 58, 54, 57, 43, 63, 35
3.59255e+02 PASS
10 24, 22, 23, 59, 60, 58, 27, 13, 53, 48, 37, 36, 18, 25, 12, 38 3.52552e+02 PASS
11 7, 11, 9, 6, 30, 56, 5, 37, 28, 60, 34, 27, 29, 45, 18, 25, 15, 42, 63, 48, 4, 59, 53, 52, 16, 61, 57, 13, 49, 50, 22, 40
3.66292e+02 PASS
12 38, 12, 3, 28, 17, 23, 35, 33, 32, 25, 15, 44, 4, 43, 24, 19, 16, 11, 49, 46, 18, 8, 34, 6, 56, 48, 27, 37, 26, 14, 47, 30
3.69478e+02 PASS
13 17, 33, 45, 1, 53, 50, 4, 13, 55, 59, 3, 49, 56, 28, 35, 39, 63, 47, 20, 40, 24, 62, 30, 43, 12, 54, 46, 16, 27, 58, 23, 22
3.62242e+02 PASS
14 36, 15, 52, 62, 60, 54, 33, 38, 58, 23, 35, 0, 40, 29, 55, 42 3.84722e+02 PASS
15 16, 2, 52, 58, 60, 7, 37, 14, 36, 8, 0, 47, 44, 48, 39, 12, 5, 46, 59, 24, 22, 23, 41, 29, 25, 53, 26, 3, 49, 40, 21, 34
3.72180e+02 PASS
16 1, 8, 58, 22, 36, 29, 23, 15, 30, 13, 32, 60, 18, 20, 55, 39 3.66784e+02 PASS
Table 1 - Worst Case Results: Uniformity Test

Table 2 - Worst Case: Ciphertext Independence Test
Round Bit Position Log Odds
Raito Verdict
1 27, 30, 61, 20, 45, 40, 63, 9/ 41, 6, 25, 60, 49, 29, 37, 18 4.94E+01 PASS
2 45, 63, 34, 12, 9, 19, 31, 24, 30, 51, 21, 48, 26, 61, 52, 32/ 33, 17, 15, 8, 57, 41, 13, 5, 40, 43, 56, 14, 27, 62, 11, 49
3.66E+02 PASS
3 1, 5, 4, 38, 19, 29, 9, 34, 40, 0, 37, 28, 42, 23, 6, 52/ 16, 59, 41, 10, 49, 53, 39, 20, 44, 54, 43, 31, 27, 14, 58, 57
3.70E+02 PASS
4 33, 20, 36, 15, 49, 17, 37, 11, 45, 9, 50, 14, 3, 19, 7, 0/ 18, 56, 38, 31, 61, 34, 44, 43, 32, 13, 2, 23, 46, 27, 42, 39
3.82E+02 PASS
5 1, 5, 4, 38, 19, 29, 9, 34, 40, 0, 37, 28, 42, 23, 6, 52/ 16, 59, 41, 10, 49, 53, 39, 20, 44, 54, 43, 31, 27, 14, 58, 57
3.82E+02 PASS
6 13, 56, 22, 12, 3, 59, 41, 62, 32, 37, 51, 24, 26, 31, 54, 48/ 10, 60, 18, 27, 45, 61, 57, 25, 16, 34, 43, 19, 15, 63, 4, 53
3.77E+02 PASS
7 46, 58, 50, 0, 20, 42, 6, 12, 38, 4, 28, 63, 29, 31, 17, 34/ 25, 41, 49, 37, 52, 15, 33, 47, 35, 11, 2, 60, 30, 13, 54, 57
3.80E+02 PASS
8 39, 16, 0, 49, 28, 59, 56, 6, 54, 46, 14, 17, 40, 22, 29, 36/ 43, 3, 9, 58, 42, 27, 61, 1, 25, 20, 37, 35, 52, 31, 15, 63
3.75E+02 PASS
9 35, 43, 51, 26, 22, 12, 38, 48, 13, 0, 15, 3, 31, 41, 46, 54/ 60, 4, 34, 36, 58, 11, 18, 8, 59, 7, 57, 9, 45, 37, 23, 5
3.68E+02 PASS
10 53, 10, 2, 6, 38, 8, 34, 31, 37, 39, 26, 45, 62, 12, 46, 21/ 20, 61, 41, 0, 52, 58, 23, 36, 7, 33, 29, 5, 15, 42, 35, 50
3.73E+02 PASS
11 15, 20, 23, 37, 55, 35, 22, 41, 28, 36, 7, 56, 49, 53, 10, 25/ 50, 2, 39, 8, 9, 44, 27, 5, 11, 43, 54, 63, 51, 16, 12, 33
3.80E+02 PASS
12 39, 37, 61, 26, 33, 17, 52, 42, 11, 3, 55, 53, 45, 1, 5, 29/ 43, 18, 48, 46, 0, 35, 6, 8, 12, 50, 25, 34, 47, 57, 54, 36
3.76E+02 PASS
13 33, 38, 30, 50, 39, 60, 5, 40, 18, 56, 57, 15, 32, 53, 51, 19/ 36, 25, 34, 27, 14, 26, 46, 35, 9, 8, 29, 48, 55, 16, 31, 47
3.66E+02 PASS
14 54, 37, 2, 55, 42, 61, 58, 40, 38, 18, 13, 10, 4, 26, 51, 0/ 21, 15, 41, 27, 45, 60, 9, 46, 19, 7, 33, 1, 25, 12, 3, 39
3.84E+02 PASS
15 36, 19, 31, 29, 18, 20, 38, 4, 30, 35, 45, 3, 57, 58, 39, 53/ 49, 9, 0, 25, 1, 13, 17, 22, 42, 6, 60, 15, 7, 24, 32, 62
3.76E+02 PASS
16 34, 25, 11, 26, 49, 39, 16, 9, 43, 46, 54, 42, 31, 6, 24, 28/ 61, 14, 63, 60, 23, 37, 15, 30, 51, 52, 20, 53, 41, 44, 2, 45
3.67E+02 PASS

Table 3 - Worst Case: Complement Test
Round Bit Position Log Bayes
Factor Verdict
1 13, 28, 5, 42, 2, 9, 3, 8 -6.27E+05 FAIL
2 58, 0, 24, 2, 39, 36, 26, 3, 62, 23, 49, 53, 45, 11, 30, 37, 1, 32, 47, 28, 12, 14, 40, 63, 27, 8, 42, 43, 41, 15, 51, 38
3.53E+02 PASS
3 15, 52, 5, 58, 38, 36, 47, 20, 18, 19, 9, 57, 45, 0, 50, 16 3.85E+02 PASS
4 11, 17, 33, 2, 13, 63, 21, 24, 0, 22, 40, 36, 28, 4, 60, 29, 61, 34, 53, 42, 26, 52, 8, 51, 12, 32, 10, 1, 44, 38, 48, 54
3.80E+02 PASS
5 22, 61, 3, 7, 16, 47, 50, 13, 34, 46, 48, 52, 14, 10, 53, 38 3.74E+02 PASS
6 15, 52, 5, 58, 38, 36, 47, 20, 18, 19, 9, 57, 45, 0, 50, 16 3.76E+02 PASS
7 54, 19, 56, 53, 40, 17, 38, 14, 28, 43, 20, 52, 33, 59, 46, 37, 23, 6, 48, 22, 1, 5, 39, 34, 26, 13, 12, 11, 32, 25, 58, 60
3.75E+02 PASS
8 31, 34, 30, 11, 13, 10, 15, 53, 58, 62, 0, 22, 63, 4, 45, 26 3.47E+02 PASS
9 52, 8, 32, 5, 50, 26, 38, 7, 54, 55, 9, 39, 58, 51, 46, 17 3.71E+02 PASS
10 40, 58, 59, 3, 15, 46, 7, 14, 60, 8, 36, 34, 49, 29, 42, 32, 2, 18, 53, 62, 55, 6, 54, 56, 22, 61, 10, 41, 30, 11, 45, 48
3.74E+02 PASS
11 8, 57, 19, 56, 49, 61, 14, 30, 10, 35, 54, 3, 22, 36, 40, 13 3.72E+02 PASS
12 22, 61, 3, 7, 16, 47, 50, 13, 34, 46, 48, 52, 14, 10, 53, 38 3.69E+02 PASS
13 45, 25, 28, 42, 51, 18, 5, 4, 12, 11, 62, 13, 58, 55, 26, 57, 43, 54, 39, 56, 6, 49, 60, 36, 24, 31, 48, 21, 34, 2, 40, 15
3.71E+02 PASS
14 8, 57, 19, 56, 49, 61, 14, 30, 10, 35, 54, 3, 22, 36, 40, 13 3.60E+02 PASS
15 43, 15, 12, 37, 36, 25, 24, 26, 48, 62, 18, 50, 32, 4, 1, 41, 49, 3, 51, 39, 47, 33, 10, 34, 2, 11, 22, 21, 9, 28, 42, 56
3.29E+02 PASS
16 4, 29, 5, 9, 17, 30, 51, 25, 13, 39, 48, 14, 33, 22, 27, 56 3.73E+02 PASS

Table 4 - Worst Case: Input-output Independence Test
Round Bit Position (Input bits / Output bits) Log Odds
Raito Verdict
1 89, 71, 99, 82, 123, 90, 104, 39, 5, 88, 51, 120, 50, 41, 24, 80/30, 58, 51, 49, 17, 13, 19, 2, 44, 42, 10, 50, 27, 46, 52, 16
-8.18E+04 FAIL
2
63, 84, 3, 36, 32, 109, 40, 121, 117, 75, 38, 60, 107, 50, 118, 27, 104, 58, 51, 67, 25, 22, 81, 114, 12, 6, 127, 48, 65, 18, 111, 119/34, 37, 60, 32, 1, 0, 16, 4, 35, 45, 44, 33, 52, 9, 50, 10, 42, 30, 29, 22, 57, 61, 47, 58, 20, 36, 25, 5, 23, 27, 38, 39
3.72E+02 PASS
3 50, 35, 18, 44, 64, 46, 24, 14, 1, 100, 6, 48, 126, 103, 70, 87/32, 24, 12, 37, 34, 35, 15, 10, 4, 61, 11, 14, 18, 39, 52, 53
3.77E+02 PASS
4
13, 26, 114, 87, 91, 119, 68, 23, 58, 63, 72, 25, 88, 79, 127, 17, 122, 83, 66, 40, 42, 123, 56, 82, 39, 27, 1, 32, 92, 111, 5, 46/43, 45, 34, 24, 56, 19, 61, 9, 63, 28, 51, 0, 46, 59, 2, 5, 33, 10, 32, 20, 25, 53, 54, 14, 39, 38, 6, 47, 4, 57, 55, 15
3.70E+02 PASS
5
21, 16, 58, 32, 94, 86, 26, 27, 112, 85, 72, 67, 56, 15, 71, 23, 120, 124, 96, 10, 31, 77, 43, 82, 81, 83, 69, 105, 121, 57, 80, 91/23, 52, 14, 62, 47, 32, 4, 13, 12, 60, 1, 18, 26, 43, 55, 61, 22, 36, 53, 8, 7, 41, 29, 20, 21, 17, 45, 2, 11, 58, 28, 46
3.62E+02 PASS
6
0, 44, 31, 37, 29, 9, 71, 24, 53, 61, 43, 30, 124, 80, 20, 57, 83, 100, 107, 74, 56, 6, 41, 97, 34, 64, 12, 109, 38, 89, 25, 92, 54, 108, 3, 112, 27, 14, 105, 104, 93, 49, 2, 110, 91, 39, 70, 59, 42, 75, 77, 82, 4, 125, 122, 17, 95, 10, 118, 22, 8, 85, 98, 87/0-63
3.62E+02 PASS
7 51, 42, 86, 16, 125, 68, 104, 41, 36, 64, 92, 99, 62, 2, 111, 22/17, 53, 34, 13, 48, 42, 63, 46, 9, 57, 10, 51, 59, 15, 37, 38
3.59E+02 PASS
8 45, 119, 71, 42, 103, 0, 28, 114, 69, 4, 81, 24, 109, 74, 97, 51/56, 12, 36, 28, 21, 41, 15, 27, 37, 49, 5, 4, 18, 6, 31, 23
3.70E+02 PASS
9 91, 61, 83, 40, 56, 29, 103, 98, 89, 73, 6, 97, 82, 21, 38, 12/60, 41, 55, 16, 50, 12, 48, 7, 27, 17, 24, 13, 38, 10, 45, 40
3.61E+02 PASS
10
19, 125, 67, 123, 38, 70, 43, 4, 113, 61, 59, 3, 107, 93, 97, 25, 47, 77, 69, 8, 112, 11, 80, 35, 20, 122, 48, 75, 66, 108, 2, 76, 78, 87, 111, 63, 72, 23, 64, 127, 102, 50, 9, 124, 5, 73, 101, 32, 74, 110, 117, 7, 105, 109, 99, 82, 106, 84, 40, 39, 96, 45, 1, 71/0-63
3.51E+02 PASS

11
119, 85, 27, 35, 20, 43, 94, 18, 31, 59, 58, 64, 21, 28, 108, 75, 37, 53, 14, 13, 91, 101, 109, 82, 47, 62, 12, 114, 55, 121, 34, 111/39, 49, 44, 61, 6, 63, 22, 0, 18, 26, 20, 24, 4, 59, 23, 21, 35, 1, 58, 16, 38, 43, 27, 11, 54, 5, 53, 15, 51, 29, 40, 60
3.76E+02 PASS
12
45, 124, 74, 120, 83, 95, 1, 109, 99, 104, 61, 73, 116, 93, 70, 10, 77, 44, 123, 64, 100, 89, 9, 114, 60, 39, 23, 18, 63, 22, 79, 121, 76, 40, 4, 53, 51, 48, 35, 38, 122, 106, 0, 21, 57, 81, 127, 3, 71, 80, 52, 107, 117, 84, 66, 90, 118, 91, 19, 47, 7, 55, 86, 13/0-63
3.62E+02 PASS
13 93, 98, 119, 15, 111, 41, 45, 46, 56, 103, 104, 55, 23, 114, 97, 86/22, 4, 33, 21, 39, 59, 2, 48, 38, 47, 6, 29, 45, 35, 34, 5
3.74E+02 PASS
14
55, 113, 112, 82, 5, 30, 63, 116, 126, 31, 108, 17, 24, 118, 21, 44, 72, 101, 1, 109, 90, 20, 100, 127, 70, 15, 110, 76, 33, 11, 64, 59/15, 37, 25, 63, 23, 18, 12, 13, 1, 16, 61, 9, 40, 20, 2, 54, 32, 28, 59, 30, 3, 53, 11, 60, 62, 56, 6, 4, 38, 7, 33, 48
3.72E+02 PASS
15
18, 20, 33, 56, 108, 103, 46, 45, 64, 51, 14, 32, 5, 29, 87, 38, 2, 117, 127, 62, 12, 104, 102, 107, 99, 40, 92, 52, 126, 59, 124, 25, 10, 67, 63, 73, 37, 21, 28, 48, 109, 97, 100, 111, 3, 9, 8, 110, 31, 68, 50, 119, 80, 47, 1, 120, 106, 93, 35, 121, 36, 74, 43, 105/0-63
3.60E+02 PASS
16
15, 62, 105, 9, 101, 40, 102, 81, 25, 3, 31, 17, 26, 90, 120, 113, 21, 121, 56, 71, 20, 91, 69, 72, 28, 68, 36, 41, 109, 94, 59, 27, 8, 76, 79, 84, 75, 11, 112, 98, 32, 54, 115, 10, 122, 14, 55, 57, 118, 43, 119, 48, 67, 45, 124, 103, 100, 70, 63, 60, 82, 47, 46, 125/0-63
3.61E+02 PASS
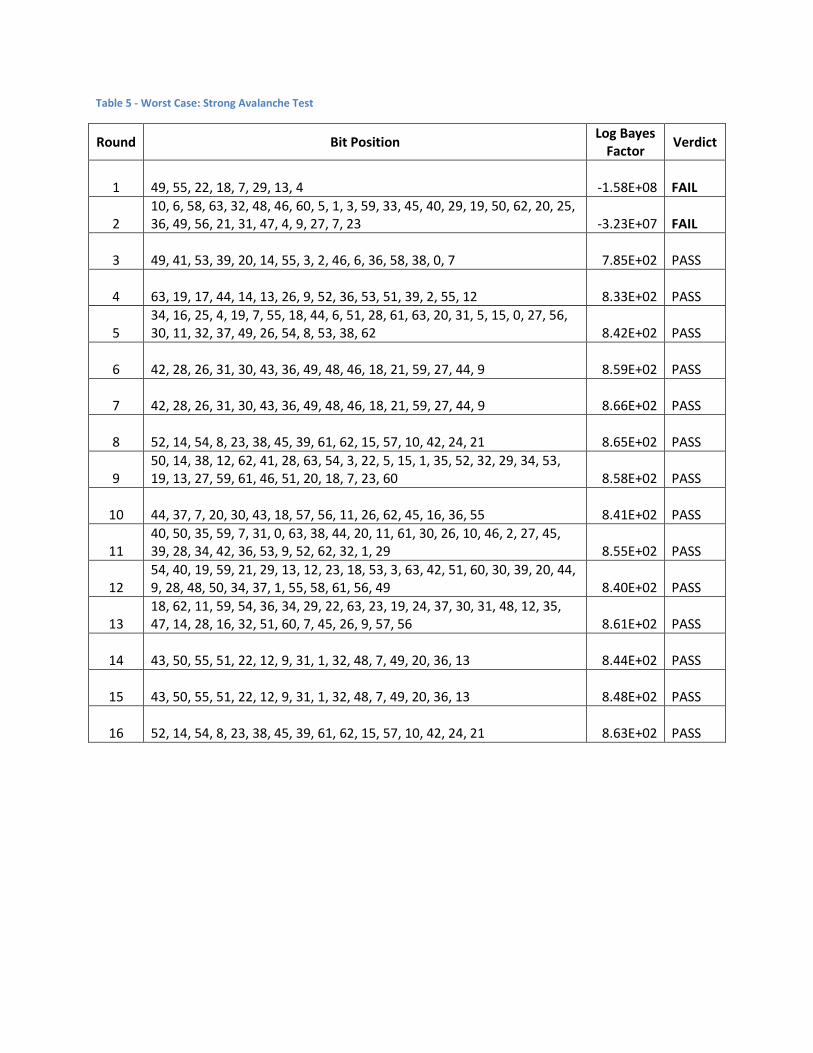
Table 5 - Worst Case: Strong Avalanche Test
Round Bit Position Log Bayes
Factor Verdict
1 49, 55, 22, 18, 7, 29, 13, 4 -1.58E+08 FAIL
2 10, 6, 58, 63, 32, 48, 46, 60, 5, 1, 3, 59, 33, 45, 40, 29, 19, 50, 62, 20, 25, 36, 49, 56, 21, 31, 47, 4, 9, 27, 7, 23 -3.23E+07 FAIL
3 49, 41, 53, 39, 20, 14, 55, 3, 2, 46, 6, 36, 58, 38, 0, 7 7.85E+02 PASS
4 63, 19, 17, 44, 14, 13, 26, 9, 52, 36, 53, 51, 39, 2, 55, 12 8.33E+02 PASS
5 34, 16, 25, 4, 19, 7, 55, 18, 44, 6, 51, 28, 61, 63, 20, 31, 5, 15, 0, 27, 56, 30, 11, 32, 37, 49, 26, 54, 8, 53, 38, 62 8.42E+02 PASS
6 42, 28, 26, 31, 30, 43, 36, 49, 48, 46, 18, 21, 59, 27, 44, 9 8.59E+02 PASS
7 42, 28, 26, 31, 30, 43, 36, 49, 48, 46, 18, 21, 59, 27, 44, 9 8.66E+02 PASS
8 52, 14, 54, 8, 23, 38, 45, 39, 61, 62, 15, 57, 10, 42, 24, 21 8.65E+02 PASS
9 50, 14, 38, 12, 62, 41, 28, 63, 54, 3, 22, 5, 15, 1, 35, 52, 32, 29, 34, 53, 19, 13, 27, 59, 61, 46, 51, 20, 18, 7, 23, 60 8.58E+02 PASS
10 44, 37, 7, 20, 30, 43, 18, 57, 56, 11, 26, 62, 45, 16, 36, 55 8.41E+02 PASS
11 40, 50, 35, 59, 7, 31, 0, 63, 38, 44, 20, 11, 61, 30, 26, 10, 46, 2, 27, 45, 39, 28, 34, 42, 36, 53, 9, 52, 62, 32, 1, 29 8.55E+02 PASS
12 54, 40, 19, 59, 21, 29, 13, 12, 23, 18, 53, 3, 63, 42, 51, 60, 30, 39, 20, 44, 9, 28, 48, 50, 34, 37, 1, 55, 58, 61, 56, 49 8.40E+02 PASS
13 18, 62, 11, 59, 54, 36, 34, 29, 22, 63, 23, 19, 24, 37, 30, 31, 48, 12, 35, 47, 14, 28, 16, 32, 51, 60, 7, 45, 26, 9, 57, 56 8.61E+02 PASS
14 43, 50, 55, 51, 22, 12, 9, 31, 1, 32, 48, 7, 49, 20, 36, 13 8.44E+02 PASS
15 43, 50, 55, 51, 22, 12, 9, 31, 1, 32, 48, 7, 49, 20, 36, 13 8.48E+02 PASS
16 52, 14, 54, 8, 23, 38, 45, 39, 61, 62, 15, 57, 10, 42, 24, 21 8.63E+02 PASS

Table 6 - Worst Case: Non-Linearity Test
Round Bit Position Log Odds
Raito Verdict
1 21 -8.24E+04 FAIL
2 24 6.81E+02 PASS
3 35 6.74E+02 PASS
4 19 6.87E+02 PASS
5 44 6.75E+02 PASS
6 29 6.77E+02 PASS
7 10 6.82E+02 PASS
8 20 6.76E+02 PASS
9 22 6.83E+02 PASS
10 15 6.84E+02 PASS
11 47 6.84E+02 PASS
12 38 6.88E+02 PASS
13 56 6.85E+02 PASS
14 47 6.80E+02 PASS
15 17 6.77E+02 PASS
16 1 6.85E+02 PASS