Embed Size (px)
Citation preview

STATIC AND DYNAMIC MECHANICAL PROPERTIES AND
STRAIN RATE SENSITIVITY OF THERMOPLASTIC BASED
POLYMERS AND COMPOSITES USING SPLIT HOPKINSON
PRESSURE BAR APPARATUS
by
MOHD FIRDAUS BIN OMAR
Thesis submitted in fulfillment of the requirements
for the degree of
Doctor of Philosophy
April 2013

ii
DECLARATION
I hereby declare that I have conducted, completed the research work and written the
dissertation entitled “ Static And Dynamic Mechanical Properties And Strain Rate
Sensitivity Of Thermoplastic Based Polymers And Composites Using Split
Hopkinson Pressure Bar Apparatus ”. I also declare that it has not been previously
submitted for the award for any degree or diploma or other similar title for any other
examining body or university.
Name of student: MOHD FIRDAUS BIN OMAR Signature:
Date:
Witness by
Supervisor: PROFESSOR HAZIZAN BIN MD AKIL Signature:
Date:

iii
ACKNOWLEDGEMENTS
Alhamdulillah, all praises to Allah for the strength and His blessing in
completing this thesis. A special appreciation goes to the Universiti Malaysia Perlis
(UniMAP) and Ministry of Higher Education (MOHE) for sponsoring and providing
the financial scholarship for this research work.
It is with immense gratitude that I acknowledge the support and help of my
supervisor, Professor Hazizan Md Akil, for his guidance and constant support in my
academic work and daily life. His invaluable help, constructive comments and
suggestions throughout the experimental stage of this thesis have contributed to the
success of this research. Not only that, his humble attitude in life has inspired me to
be a better person like him. Special appreciation is expressed to Professor Takashi
Yokoyama from the Okayama University of Science, Department of Mechanical
Engineering, for his valuable suggestions, during several discussions, regarding this
research effort. I also wish to express my deepest gratitude to Professor Zainal Arifin
Bin Ahmad for his encouragement and advice, which he offered from time to time.
Correspondingly, my special thanks to Professor Hanafi Bin Ismail (Dean)
and all the technical staff of the School of Materials and Mineral Resources,
Universiti Sains Malaysia for their continual support and technical advice, especially
in handling the research facilities. I owe my deepest appreciation to Mr Shahrul, Mr
Segar, Mr Helmi, Mr Kemuridan, Mr Shahid, Mr Khairi, Mr Shahril, Mr Syafiq, Mr
Shahrizol, Mr Faizal, Mr Mokhtar, Mr Halim and Mr Farid for their kindness and
help during this research effort. Without them, I believe that the research will not be

iv
completed on time. I would also like to express my utmost gratitude to Universiti
Sains Malaysia for providing me with a personal short term grant (USM-RU-PGRS)
which was very helpful throughout my three years of research.
I am indebted to my many colleagues especially Firdaus Nazeri, Rashid,
Bisyrul, Dr. Nik Nuriman, Hafiz, Fadli, Chang Boon Peng, Helmi, Helfy, Kahar,
Nabil and Amin for their moral support and motivation whenever I needed it. In
addition, my acknowledgement goes to the assistance and inspiration of all those
who contributed directly or indirectly to this research effort.
Last but not least, I would like to dedicate this thesis to my parents, Haji
Omar bin Zanion and Hjh Saliah Binti Lazem, and my wife, Annurin ’Ainulhidayah,
who have always stood by me especially during my hard time. Their love,
understanding and encouragement are always appreciated.
v
TABLE OF CONTENTS
Declaration……………………………………………………………………. ii
Acknowledgements……………………………………………………………... iii
Table of Contents……………………………………………………………….. v
List of Tables…………………………………………………………………… xi
List of Figures…………………………………………………………………... xiii
List of Symbols…………………………………………………………………. xix
List of Abbreviations…………………………………………………………… xxi
Abstrak………………………………………………………………………….. xxiii
Abstract…………………………………………………………………………. xxv
CHAPTER ONE: INTRODUCTION
1.1 Static and dynamic mechanical properties of materials 1
1.2 Development of dynamic testing 1
1.3 Static/dynamic mechanical behaviour of thermoplastic polymers 3
1.4 Static/dynamic mechanical behaviour of polypropylene based composites 5
1.5 Problem statements 6
1.6 Objectives of study 7
1.7 Organisation of thesis
8
CHAPTER TWO: LITERATURE REVIEWS
2.1 Introduction 10
2.2 Polymers 10
2.2.1 Thermoplastic polymers 10
2.2.1.1 Characteristics of thermoplastics 10
2.2.1.2 Semi-crystalline versus amorphous thermoplastics 11
2.3 Composite material 13
2.4 Polymer matrix reinforced composites (PMCs) 14
2.4.1 Benefits and drawbacks of PMCs 16
2.5 Particulate filled polymer composites 17

vi
2.5.1 Cost 17
2.5.2 Particle size 18
2.5.3 Particle shape 20
2.6 Particulate filled thermoplastic composites (PFTCs) 22
2.7 Static and dynamic mechanical testing 26
2.7.1 Dynamic mechanical testing 27
2.7.2 Drop weight impact 27
2.7.3 Taylor impact 30
2.7.4 Expanding ring 31
2.7.5 Split Hopkinson pressure bar apparatus (SHPBA) 33
2.7.5.1 History and development of SHPBA 37
2.7.5.2 Theory behind the conventional SHPBA 40
2.7.5.3 Specimen’s geometry consideration 45
2.7.5.4 SHPB testing on soft materials 45
2.8 Static/dynamic mechanical behaviour of thermoplastic polymers and
their composites
47
2.9 Strain rate sensitivity of thermoplastic polymers and their composites 51
2.10 Summary
53
CHAPTER THREE: MATERIALS AND METHODS
3.1 Introduction 55
3.2 Materials 55
3.2.1 Thermoplastic polymers 55
3.2.1.1 Polypropylene homopolymer (PP) 55
3.2.1.2 Polyethylene (PE) 56
3.2.1.3 Polycarbonate (PC) 57
3.2.2 Particulate fillers 58
3.2.2.1 Zinc oxide (ZnO) 58
3.2.2.2 Mica 58
3.2.2.3 Silica (SiO2) 59
3.3 Fabrication of polymer specimens 59
3.3.1 Compression moulding 59
vii
3.4 Fabrication of polymer composite specimens 60
3.4.1 Compounding process 60
3.4.2 Compression moulding 61
3.4.3 Specimen cutting 61
3.5 Material characterisations 62
3.5.1 Particle size analyser 62
3.5.2 High resolution transmission electron microscopy (HRTEM) 62
3.5.3 Density measurement 63
3.5.4 Differential scanning calometry (DSC) 63
3.5.5 Dynamic mechanical analysis (DMA) 64
3.6 Mechanical tests 65
3.6.1 Static compression testing 65
3.6.2 Dynamic compression testing 66
3.6.2.1 Split Hopkinson Pressure Bar Apparatus (SHPBA) 66
3.6.3 Static tensile testing 67
3.7 Post damage analysis 68
3.7.1 Field emission scanning electron microscopy (FESEM) 68
3.7.2 Energy dispersive X-ray spectroscopy (EDXS) 68
3.8 Experimental chart
69
CHAPTER FOUR: CALIBRATIONS AND VERIFICATIONS OF THE SHPB
RESULTS
4.1 Introduction 70
4.2 Mechanical impedance 72
4.3 Dynamic stress equilibrium 75
4.4 Specimen’s slenderness ratio 78
4.5 Calibration of the SHPB set-up 82
4.6 Verification of the average strain rate 85
4.7 Summary
87

viii
CHAPTER FIVE: MEASUREMENT AND PREDICITION ON STATIC AND
DYNAMIC COMPRESSIVE PROPERTIES OF THERMOPLASTIC
POLYMERS
5.1 Introduction 88
5.2 Material characterisations 90
5.2.1 Dynamic Mechanical Analysis (DMA) 90
5.3 Stress/strain characteristic 96
5.4 Stiffness and strength properties 101
5.5 Strain rate sensitivity, thermal activation volume and strain energy 103
5.6 The solution in the numerical equations 107
5.7 Summary
110
CHAPTER SIX : EFFECT OF MOLECULAR STRUCTURE ON STATIC
AND DYNAMIC COMPRESSIVE PROPERTIES OF THERMOPLASTIC
POLYMER
6.1 Introduction 112
6.2 Material characterisations 113
6.2.1 Density analysis 113
6.2.2 Crystallinity measurement 114
6.3 Stress/strain characteristic 116
6.4 Yield behaviour 120
6.5 Stiffness and strength properties 123
6.6 Strain rate sensitivity, thermal activation volume and strain energy 125
6.7 The solution in the numerical equations 128
6.8 Summary
130
CHAPTER SEVEN: MEASUREMENT ON STATIC AND DYNAMIC
COMPRESSIVE PROPERTIES OF POLYPROPYLENE BASED
COMPOSITES USING NANO AND MICRO FILLERS
7.1 Introduction
132
ix
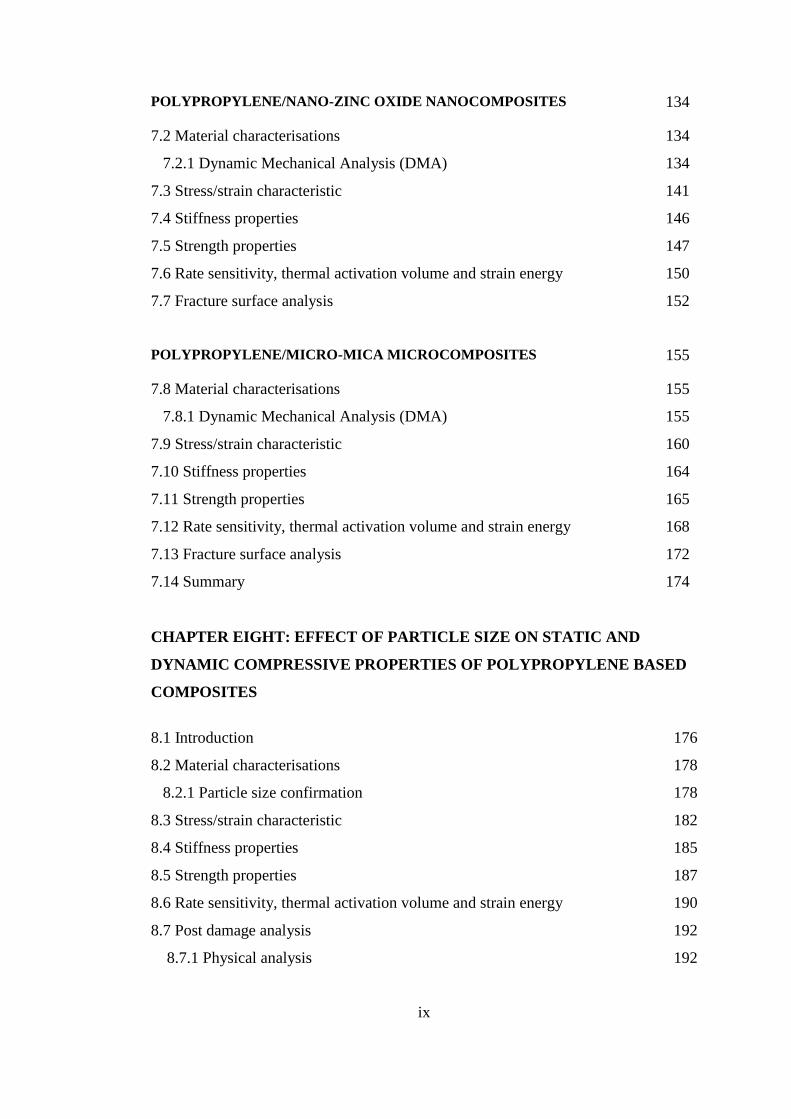
POLYPROPYLENE/NANO-ZINC OXIDE NANOCOMPOSITES
134
7.2 Material characterisations 134
7.2.1 Dynamic Mechanical Analysis (DMA) 134
7.3 Stress/strain characteristic 141
7.4 Stiffness properties 146
7.5 Strength properties 147
7.6 Rate sensitivity, thermal activation volume and strain energy 150
7.7 Fracture surface analysis
152
POLYPROPYLENE/MICRO-MICA MICROCOMPOSITES
155
7.8 Material characterisations 155
7.8.1 Dynamic Mechanical Analysis (DMA) 155
7.9 Stress/strain characteristic 160
7.10 Stiffness properties 164
7.11 Strength properties 165
7.12 Rate sensitivity, thermal activation volume and strain energy 168
7.13 Fracture surface analysis 172
7.14 Summary
174
CHAPTER EIGHT: EFFECT OF PARTICLE SIZE ON STATIC AND
DYNAMIC COMPRESSIVE PROPERTIES OF POLYPROPYLENE BASED
COMPOSITES
8.1 Introduction 176
8.2 Material characterisations 178
8.2.1 Particle size confirmation 178
8.3 Stress/strain characteristic 182
8.4 Stiffness properties 185
8.5 Strength properties 187
8.6 Rate sensitivity, thermal activation volume and strain energy 190
8.7 Post damage analysis 192
8.7.1 Physical analysis 192

x
8.7.2 Fracture surface analysis 193
8.8 Summary
196
CHAPTER NINE: CONCLUSIONS AND SUGGESTIONS FOR
FURTHER WORK
9.1 Conclusions 198
9.2 Suggestions for further work 200
REFERENCES 202
APPENDICES 221
Appendix A (List of International and National Journal) 221
Appendix B (List of Attended Conferences) 232
Appendix C (Example of calculation) 238

xi
LIST OF TABLES
Table 2.1
Example of both semi-crystalline thermoplastics and
amorphous thermoplastics and their characteristics
Pages
12
Table 2.2 The current development of the SHPB apparatus
40
Table 3.1 The properties of polypropylene homopolymer 55
Table 3.2 The properties of three different types of polyethylene 56
Table 3.3 The properties of polycarbonate polymer used in this study 57
Table 3.4 The typical properties of ZnO nanoparticles
58
Table 3.5 The typical properties of Mica microparticles 58
Table 3.6 The typical properties of SiO2 particles 59
Table 3.7 The recipes used and identifications for PP/nano-ZnO
composites and PP/micro-Mica composites
60
Table 4.1 The mechanical impedance characteristic of all tested
specimens
74
Table 5.1 The overall properties of various thermoplastic polymers
under both static and dynamic loadings
100
Table 5.2 The strain rate sensitivity and thermal activation volume of
various polymeric materials under different region of strain
rates
106
Table 5.3 The parameters used for the numerical equations
108
Table 6.1 Measured density values of various types of polyethylene
specimens
114
Table 6.2 DSC characterisation of polyethylene specimens
116
Table 6.3
Typical properties of PE specimens under a wide range of
strain rate investigated
119
Table 6.4
The strain rate sensitivities and thermal activation volumes of
various types of PE under different region of strain rates
investigated
126

xii
Table 6.5
The parameters used for the numerical equations 128
Table 7.1 The rate sensitivity and the thermal activation volume of the
neat PP and the PP/nano-ZnO composites under static and
dynamic regions
150
Table 7.2 The rate sensitivity and the thermal activation volume of the
neat PP and the PP/micro-Mica composites under static and
dynamic regions
170
Table 7.3 The comparison of energy absorbing capacity between
PP/micro-Mica composites and PP/nano-ZnO composites
under a wide range of strain rate investigated
171
Table 8.1 The rate sensitivities and thermal activation volume of the
PP/SiO2 (as function of particle sizes) measured under static
and dynamic regions
191

xiii
LIST OF FIGURES
Figure 2.1
Molecular arrangement of amorphous and semi-crystalline
thermoplastics
Pages
11
Figure 2.2 The classification of PMCs
15
Figure 2.3 Idealised view of the way filler particles disperse and of the
different forms of particle types that might be encountered
19
Figure 2.4 Complex particle dispersion behaviour, as often encountered
with fine, precipitated fillers
20
Figure 2.5 Some types of common particle shapes in particulate-filled
composites
21
Figure 2.6 Schematic diagram of strain rate regimes (in reciprocal
seconds) and the techniques that are suitable for obtaining
them
27
Figure 2.7 Schematic diagram of drop weight impact machine
29
Figure 2.8 Sequence of deformation after impact of cylindrical
projectile against rigid wall
31
Figure 2.9 Principle of expanding ring technique ; (a) steel block with
explosive in core ; (b) steel block with explosive in core ; (c)
section of ring
32
Figure 2.10 Schematic diagram of conventional SHPBA
34
Figure 2.11 The Lagrangian x-t diagram illustrating wave movement in
the Hopkinson Bars
34
Figure 2.12 Schematic diagram of SHPB output signal
36
Figure 2.13 Schematic diagram of traditional SHPB device in 1914
38
Figure 2.14 The usage and development of SHPB apparatus from 1940
to 1998
39
Figure 2.15 Typical diagram of the Hopkinson Bars
44
Figure 2.16 The compressive stress/strain curves of (A) HDPE, (B) PP
and (PC) under a wide range of strain rate investigated
48
xiv
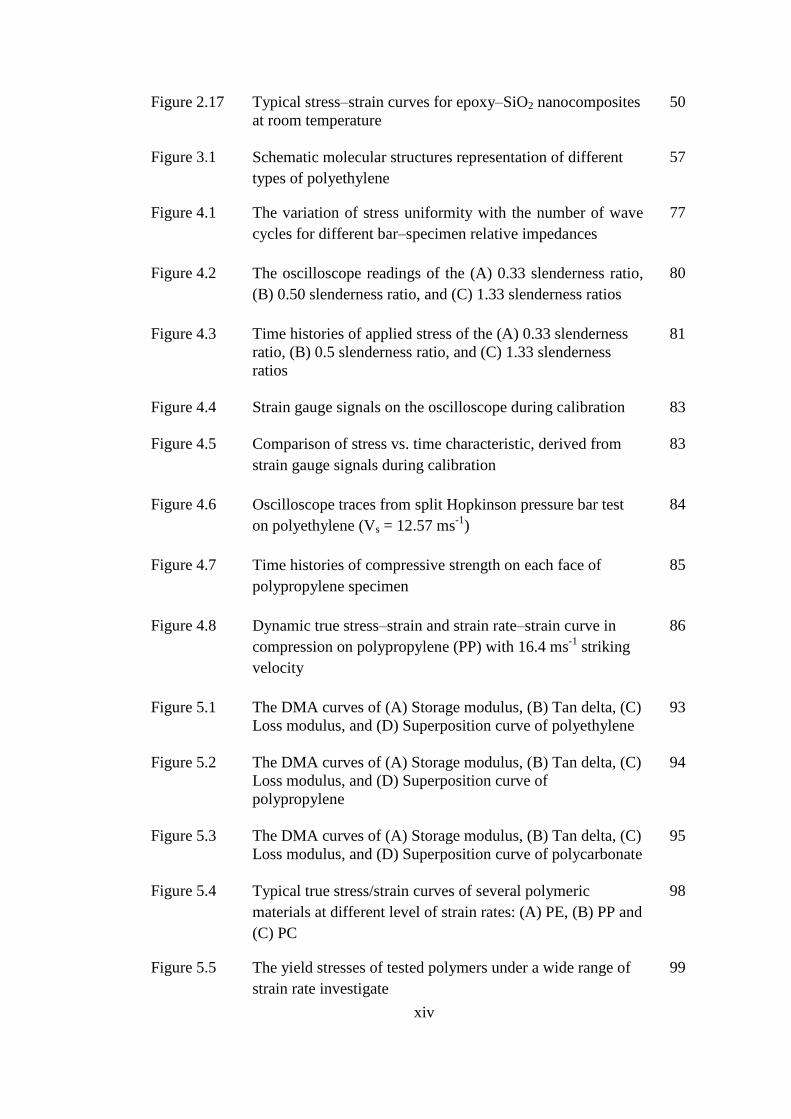
Figure 2.17 Typical stress–strain curves for epoxy–SiO2 nanocomposites
at room temperature
50
Figure 3.1 Schematic molecular structures representation of different
types of polyethylene
57
Figure 4.1 The variation of stress uniformity with the number of wave
cycles for different bar–specimen relative impedances
77
Figure 4.2 The oscilloscope readings of the (A) 0.33 slenderness ratio,
(B) 0.50 slenderness ratio, and (C) 1.33 slenderness ratios
80
Figure 4.3 Time histories of applied stress of the (A) 0.33 slenderness
ratio, (B) 0.5 slenderness ratio, and (C) 1.33 slenderness
ratios
81
Figure 4.4 Strain gauge signals on the oscilloscope during calibration 83
Figure 4.5 Comparison of stress vs. time characteristic, derived from
strain gauge signals during calibration
83
Figure 4.6 Oscilloscope traces from split Hopkinson pressure bar test
on polyethylene (Vs = 12.57 ms-1
)
84
Figure 4.7 Time histories of compressive strength on each face of
polypropylene specimen
85
Figure 4.8 Dynamic true stress–strain and strain rate–strain curve in
compression on polypropylene (PP) with 16.4 ms-1
striking
velocity
86
Figure 5.1 The DMA curves of (A) Storage modulus, (B) Tan delta, (C)
Loss modulus, and (D) Superposition curve of polyethylene
93
Figure 5.2 The DMA curves of (A) Storage modulus, (B) Tan delta, (C)
Loss modulus, and (D) Superposition curve of
polypropylene
94
Figure 5.3 The DMA curves of (A) Storage modulus, (B) Tan delta, (C)
Loss modulus, and (D) Superposition curve of polycarbonate
95
Figure 5.4 Typical true stress/strain curves of several polymeric
materials at different level of strain rates: (A) PE, (B) PP and
(C) PC
98
Figure 5.5
The yield stresses of tested polymers under a wide range of
strain rate investigate
99

xv
Figure 5.6 The yield strains of tested polymers under a wide range of
strain rate investigated
100
Figure 5.7 The compression modulus of tested polymers under various
loading rates
102
Figure 5.8 The ultimate compressive strength of tested polymers under
various loading rates
102
Figure 5.9 The strain energy of various polymers under a wide range of
strain rate (strain, ε = 0.025)
106
Figure 5.10 The relationship between experimental and numerical values
of yield stress for various polymeric materials. The
experimental values are from the curves in Figure 5.5
109
Figure 5.11 The relationship between experimental and numerical values
of unstable strain for various polymeric materials
110
Figure 6.1 DSC thermograms represent melting region of various
polyethylene specimens
115
Figure 6.2 DSC thermograms represent crystalline region of various
polyethylene specimens
116
Figure 6.3 The typical stress/strain curves for (A) LDPE, (B) LLDPE
and (C) HDPE under various loading rates
119
Figure 6.4 The yield stress values of LDPE, LLDPE and HDPE
specimens under various strain rates
121
Figure 6.5 The yield strain values of LDPE, LLDPE and HDPE
specimens under various strain rates
122
Figure 6.6
A schematic diagram illustrating a polymer crystalline
spherulite
122
Figure 6.7 The compression modulus of PE specimens of LDPE,
LLDPE and HDPE over a wide range of strain rates
124
Figure 6.8 The ultimate compressive strength (UCS) of LDPE, LLDPE
and HDPE over a wide range of strain rates
125
Figure 6.9 The strain energy of LDPE, LLDPE and HDPE specimens
under static and dynamic loadings
127

xvi
Figure 6.10 The relationship between experimental and numerical values
of yield stress for PE specimens. The experimental values
(yield stress) are from the curves in Figure 6.4
129
Figure 6.11 The relationship between experimental and numerical values
of unstable strain for PE specimens
130
Figure 7.1 The DMA curves of (A) Storage modulus and tan delta, (B)
Loss modulus, and (C) Superposition curve of PP/1% ZnO
composite
138
Figure 7.2 The DMA curves of (A) Storage modulus and tan delta, (B)
Loss modulus, and (C) Superposition curve of PP/3% ZnO
composite
139
Figure 7.3 The DMA curves of (A) Storage modulus and tan delta, (B)
Loss modulus, and (C) Superposition curve of PP/5% ZnO
composite
140
Figure 7.4 True compression stress/strain curves of the (A) PP neat, (B)
PP/1% ZnO, (C) PP/3% ZnO and (D) PP/5% ZnO
composites under a wide range of strain rate investigated
144
Figure 7.5 The typical features of stress/strain curves of PP/nano-ZnO
composites under dynamic loading
145
Figure 7.6 Toughening mechanism with rigid particle under
compression loading
145
Figure 7.7 The compression modulus of the pure PP and the PP/nano-
ZnO composites under various levels of strain rates
investigated
147
Figure 7.8 The yield strength and the ultimate strength values of the
pure PP and the PP/nano-ZnO composites under a wide
range of strain rate investigated
149
Figure 7.9 The strain energy of the pure PP and the PP/nano-ZnO
composites under various loading rates
152
Figure 7.10 The FESEM micrographs of the fractured surface of (A)
PP/1% ZnO, (B) PP/3% ZnO, and (C) PP/5% ZnO
composites at 16.47 s-1
of striking velocity
154
Figure 7.11 The DMA curves of (A) Storage modulus and tan delta, (B)
Loss modulus, and (C) Superposition curve of PP/10% Mica
composite
157
xvii
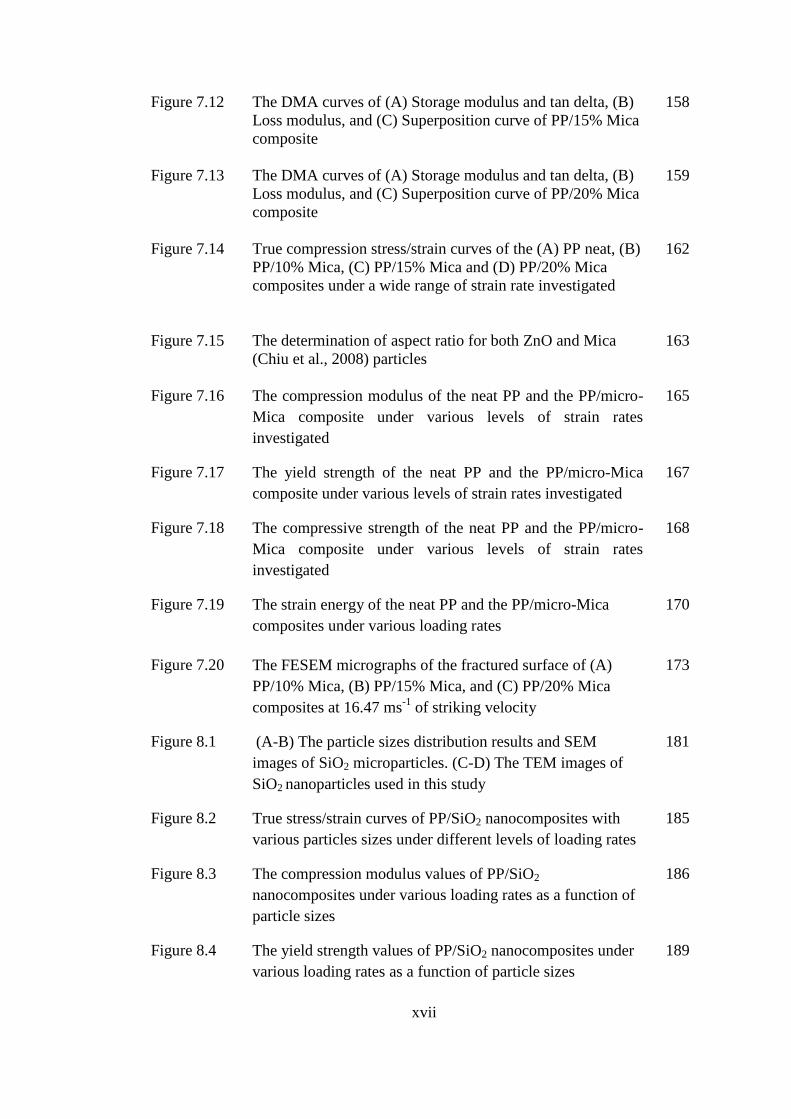
Figure 7.12 The DMA curves of (A) Storage modulus and tan delta, (B)
Loss modulus, and (C) Superposition curve of PP/15% Mica
composite
158
Figure 7.13 The DMA curves of (A) Storage modulus and tan delta, (B)
Loss modulus, and (C) Superposition curve of PP/20% Mica
composite
159
Figure 7.14 True compression stress/strain curves of the (A) PP neat, (B)
PP/10% Mica, (C) PP/15% Mica and (D) PP/20% Mica
composites under a wide range of strain rate investigated
162
Figure 7.15 The determination of aspect ratio for both ZnO and Mica
(Chiu et al., 2008) particles
163
Figure 7.16 The compression modulus of the neat PP and the PP/micro-
Mica composite under various levels of strain rates
investigated
165
Figure 7.17 The yield strength of the neat PP and the PP/micro-Mica
composite under various levels of strain rates investigated
167
Figure 7.18 The compressive strength of the neat PP and the PP/micro-
Mica composite under various levels of strain rates
investigated
168
Figure 7.19 The strain energy of the neat PP and the PP/micro-Mica
composites under various loading rates
170
Figure 7.20 The FESEM micrographs of the fractured surface of (A)
PP/10% Mica, (B) PP/15% Mica, and (C) PP/20% Mica
composites at 16.47 ms-1
of striking velocity
173
Figure 8.1 (A-B) The particle sizes distribution results and SEM
images of SiO2 microparticles. (C-D) The TEM images of
SiO2 nanoparticles used in this study
181
Figure 8.2 True stress/strain curves of PP/SiO2 nanocomposites with
various particles sizes under different levels of loading rates
185
Figure 8.3 The compression modulus values of PP/SiO2
nanocomposites under various loading rates as a function of
particle sizes
186
Figure 8.4 The yield strength values of PP/SiO2 nanocomposites under
various loading rates as a function of particle sizes
189

xviii
Figure 8.5 The ultimate compressive strength values of PP/SiO2
nanocomposites under various loading rates as a function of
particle sizes
189
Figure 8.6 The strain energy of PP/SiO2 composites as a function of
particle sizes under a wide range of strain rate investigated
(ε: 0.025)
192
Figure 8.7 The photographs of PP/SiO2 composites specimen under (A)
static loading (0.1 s-1
) and (B) dynamic loading (650 s-1
) as a
function of particle sizes
193
Figure 8.8 The fracture surface of PP/SiO2 composites with various
particle sizes (A) 3 µm, (B) 1 µm, (C) 20 nm (D) 11 nm
under 1100s-1
of strain rate
196

xix
LIST OF SYMBOLS
Strain rate
mH Melting Heat of The Sample
0H Melting Heat of 100% Crystalline Thermoplastic
Test Frequency
*V Thermal Activation Volume
Density
Tan Delta
Bragg Angle
“k” Number of Wave Cycles
Ab Cross-Sectional Area of Bar
As Cross-Sectional Area of Specimen
Co Wave Velocity
dhkl Distance Between Adjacent Planes
do Displacement Amplitude
E Bridge Voltage
E Young Modulus
E’ Storage Modulus
E’’ Loss Modulus
eo Voltage Change In The Bridge
G Amplifier Gain Factor
k Boltzmann Constant
lg Specimen Gauge Length
lo Initial Length of The Specimen
n Interger Number
sg Strain Gage Factor
T Absolute Temperature
V Mechanical Impedance Value
v Velocity of Deformation
β Strain Rate Sensitivity Parameter

xx
ε Strain Pulse
εi Incident Strain Pulse
εr Reflected Strain Pulse
εt Transmitted Strain Pulse
λ Wavelength of X-ray Beam
σ Stress
σ average Average Stress
σ back Back Stress
σ front Front Stress
σi Internal Stress
σy Yield Stress

xxi
LIST OF ABBREVIATIONS
ABS Acrylonitrile Butadiene Styrene
ASTM American Society For Testing and Materials
CaCO3 Calcium Carbonate
CMCs Ceramic Matrix Composites
DMA Dynamic Mechanical Analysis
DSC Differential Scanning Calometry
EDX Energy Dispersive X-ray
FESEM Field Emission Scanning Electron Microscopy
FT-IR Fourier Transform Infrared Spectroscopy
GFRC Glass Fiber Reinforced Composite
HDPE High Density Polyethylene
HRTEM High Resolution Transmission Electron Microscopy
KBr Potassium Bromide
LDPE Low Density Polyethylene
LLDPE Linear Low-Density Polyethylene
MMCs Metal Matrix Composites
PA-6 Nylon 6
PA-66 Nylon 66
PC Polycarbonate
PE Polyethylene
PEEK Polyether Ether Ketone
PET Polyethylene Terephthalate
PFTCs Particulate Filled Thermoplastic Composites
PMCs Polymer Matrix Reinforced Composites
PMMA Polymethyl Methacrylate
POM Polyoxymethylene
PP Polypropylene
PS Polystyrene
PTFE Polytetrafluoroethylene
PVC Polyvinyl Chloride

xxii
SHPBA Split Hopkinson Pressure Bar Apparatus
SiO2 Silica
TGA Thermogravimetric Analysis
UCS Ultimate Compressive Strength
UHMWPE Ultra High Molecular Weight Polyethylene
UTM Universal Testing Machine
XRD X-ray Diffraction
ZnO Zinc Oxide

xxiii
SIFAT-SIFAT MEKANIKAL STATIK DAN DINAMIK DAN KEPEKAAN
KADAR TERIKAN BAGI POLIMER BERASASKAN THERMOPLASTIK
DAN KOMPOSIT MENGGUNAKAN ALAT PECAHAN HOPKINSON
TEKANAN BAR
ABSTRAK
Dalam kajian ini, teknik eksperimen, berasaskan pemampatan pecahan
Hopkinson tekanan bar (SHPB), telah diperkenalkan untuk menjalankan ujian
mampatan dinamik manakala mesin ujian konvensional sejagat telah digunakan
untuk menjalankan ujian mampatan statik. Kedua-dua teknik digunakan untuk secara
eksperimennya menyiasat kesan interaktif kadar terikan terhadap sifat-sifat
mampatan pelbagai bahan berasaskan termoplastik. Semua bahan-bahan berasaskan
termoplastik yang digunakan dalam kajian ini telah dihasilkan menggunakan proses
penekanan panas. Keputusan SHPB pada awalnya telah disahkan dan ditentukur.
Hasil kajian menunjukkan bahawa semua spesimen termoplastik yang diuji (iaitu PP,
PE, dan PC) mempamerkan pergantungan besar pada kadar terikan yang dikenakan;
dimana tegasan alah, modulus mampatan dan kekuatan mampatan, semuanya telah
meningkat dengan peningkatan kadar terikan. Menariknya, kedua-dua persamaan
Eyring dan persamaan hukum kuasa asas hampir selari dengan keputusan uji kaji
bagi keseluruhan kadar terikan yang disiasat. Kesan struktur molekul, terhadap sifat-
sifat mekanikal statik dan dinamik bagi termoplastik polimer, juga telah ditentukan
menggunakan spesimen polietilena dengan struktur molekul yang berbeza (iaitu
LDPE, LLDPE and HDPE). Keputusan menunjukkan bahawa struktur molekul
polietilena telah memberi kesan kepada sifat-sifat mekanikal dari segi takat alah,
kekakuan, kekuatan, kadar kepekaan, isipadu pengaktifan, dan tenaga yang diserap.

xxiv
Bagi komposit berasaskan termoplastik, dua jenis partikel pengisi telah ditambah ke
dalam matrik polipropilena; iaitu zink oksida dan mika. Ia boleh dilihat secara jelas
bahawa pengenalan pengisi meningkatkan sifat-sifat mampatan komposit, termasuk
modulus mampatan, serta kekuatan alahnya. Kajian juga telah mendapati bahawa
kandungan partikel mempamerkan hubungan yang tidak ketara dengan sensitiviti
kadar tekanan dan isipadu haba pengaktifan, bagi kedua-dua polipropilena diperkuat
sistem komposit. Bagi kesan ciri-ciri partikel-matrik, serbuk partikel silika telah
dimanipulasi untuk menyiasat secara eksperimen mengenai hubungan antara saiz
partikel dan sifat-sifat mekanikal komposit di bawah pelbagai kadar terikan yang di
kenakan. Menariknya, saiz partikel-partikel silika memberikan kesan yang jelas ke
atas sifat-sifat mampatan komposit berasaskan polipropilena. Secara kuantitatifnya,
komposit dengan silika bersaiz nano mencatatkan sifat-sifat mampatan yang lebih
tinggi, dari segi kekuatan alah, kekuatan muktamad dan kekakuan berbanding
komposit dengan silika besaiz mikro, untuk semua kadar terikan yang di siasat.

xxv
STATIC AND DYNAMIC MECHANICAL PROPERTIES AND STRAIN
RATE SENSITIVITY OF THERMOPLASTIC BASED POLYMERS AND
COMPOSITES USING SPLIT HOPKINSON PRESSURE BAR APPARATUS
ABSTRACT
In this study, an experimental technique, based on the compression Split
Hopkinson Pressure Bar (SHPB), was introduced to perform dynamic compression
testing whereas a conventional universal testing machine was used to perform static
compression testing. These two techniques were used to experimentally investigate
the interactive effect of strain rates towards the compressive properties of various
thermoplastic-based materials. All of the thermoplastic-based materials used in this
study were fabricated using a hot press process. The SHPB results were initially
verified and calibrated. The results indicated that all tested thermoplastic specimens
(i.e. PP, PE, and PC) showed a great dependency on the strain rate applied; where the
yield stress, compression modulus, and compressive strength, were all proportionally
increased as the strain rate was increased. Interestingly, both Eyring and basic power
law equations were almost agreed with the experimental results over a wide range of
strain rates investigated. The effect of molecular structure, on the static and dynamic
mechanical properties of thermoplastic polymer, was also determined using
polyethylene specimens with different molecular structures (i.e. LDPE, LLDPE, and
HDPE). The results indicated that the molecular structure of polyethylene did affect
its mechanical properties in terms of yield behaviour, stiffness, strength, rate
sensitivity, activation volume, and absorbed energy. For thermoplastic based
reinforced composites, two types of particulate fillers were added into the
polypropylene matrix namely zinc oxide and mica. It can be clearly seen that the

xxvi
introduction of filler increased the composites’ compressive properties, including
their compression modulus, as well as their yield strength. It was also found that the
particle content showed an insignificant relationship with strain rate sensitivity and
thermal activation volume, for both polypropylene reinforced composite systems. As
for the effect of particle-matrix characteristics, silica particles were manipulated to
experimentally investigate the correlation between particle size and the mechanical
properties of composites under a wide range of strain rates investigated.
Interestingly, the size of the silica particles gave significant effects on the
compressive properties of the polypropylene-based composites. Quantitatively,
composites with nano-sized silica recorded higher compressive properties, in terms
of yield strength, ultimate strength and stiffness as compared to composites with
micro-sized, for all strain rates investigated.

1
CHAPTER 1
INTRODUCTION
1.1 Static and dynamic mechanical properties of materials
The mechanical performance of materials is determined by their static and
dynamic mechanical characteristics. Unfortunately, the majority of scientists only
focus on the static rather than on the dynamic mechanical behaviour of materials.
This is attributed to the limited number of dynamic facilities, as well as the difficulty
in performing dynamic testing. Intensive efforts should be carried out in the future in
order to gain a better understanding of the dynamic perspective of the behaviour of
materials.
1.2 Development of dynamic testing
The knowledge of the characteristics of a material at dynamic loading is
becoming ever more essential with the desire to produce products or structures that
are capable of withstanding high velocity impacts. Based on this, several
conventional mechanical tests have been developed over the years to obtain the
mechanical characteristics of materials at high strain rates, using screw or hydraulic
loading systems (Hamouda and Hashmi, 1998; Field et al., 2004). For example, a
pendulum impact machine, such as the Charpy or Izod, can yield a strain rate of up to
100 s-1
, but only provide the absorbed energy information up to fracture. Meanwhile,
other common high strain rate facilities are the drop-weight impact and the servo-
hydraulic tester. Although a drop-weight impact test can give both impressive and

2
convenient results, but the test is still limited by several factors, such as the
sensitivity towards contact conditions between the impactor and the specimen (Hsiao
et al., 1999). In addition, the drop-weight test is also restricted to lower strain rate
conditions (i.e. between 1 to 10 ms-1
) (Richardson and Wisheart, 1996). On the other
hand, the servo-hydraulic test also has a similar restriction with the drop-weight
impact test, where it is only credible for intermediate strain rates (Othman et al.,
2009).
A desire to scrutinize the characteristics of materials at very high strain rates
revealed a most promising technique, namely the Split Hopkinson Pressure Bar
(SHPB) technique. The SHPB technique was initiated by Kolsky (1949) and
developed by Hauser (1966), where a stress pulse travelled through an elastic input
bar, through a short sample, and finally into an elastic output bar. The important
characterisation of the SHPB technique is that it is highly dependent on the capability
of the technique to obtain a stress–strain curve as the output, which holds useful
information as to the characteristics of materials. Even though Kolsky introduced this
technique almost five decades ago, it was only intensively used by researchers during
the early 1970s. More recently, the SHPB technique has become the standard method
for measuring the dynamic mechanical properties of materials in the range of 102 s
-1
to 104 s
-1 strain rates. (Evora and Shukla, 2003; Field et al., 2004). In the SHPB set-
up, a semiconductor strain gauge is mounted on each Hopkinson bar. Meanwhile, the
stress and strain within the specimen are obtained from an analysis of the signals
from these two gauges. One of the basic and fundamental assumptions of the SHPB
technique is the stress homogeneity within the sample. The technique assumes that
the stress field is homogenous within the sample and that the propagating waves in

3
the bar have a negligible attenuation and dispersion. However, a conventional SHPB
is not suitable for low impedance materials, such as polymers, polymeric foams and
rubbers, because the transmitted signal is too small to be captured by the strain gauge
mounted on the transmitter bar (Song and Chen, 2005; Van Sligtenhorst et al., 2006).
Besides that, the equilibrium state is reached slowly when testing soft materials.
Based on this limitation, the conventional theory of the SHPB technique will be
invalid, and other solutions must be found. Lately, two common approaches have
emerged to overcome this dilemma. In the first method, the application of a pulse
shaper was used to induce a faster dynamic equilibrium achievement (Frew et al.,
2005; Vecchio and Jiang, 2007). On the other hand, the second method was to use a
low-impedance pressure bar, e.g. a polymer bar, which has an impedance value
closer to that of the materials being tested (Johnson et al., 2010). It is believed that a
closer impedance mismatch will significantly enhance the propagation of the
transmitted pulse. Based on this concern, it is convenient to say that the SHPB test is
still reliable for the performance of dynamic testing on soft specimens, especially
polymeric based materials.
1.3 Static and dynamic mechanical behaviour of thermoplastic polymers
Thermoplastic polymers have been extensively used as engineering
components that are purposefully designed to resist impact, ranging from bottles and
pipes to helmets and body armours. Among the many types of thermoplastic
polymers, polyethylene (PE), polypropylene (PP) and polycarbonate (PC) have
attracted much interest from scientists as well as industry sectors. Based on this,
many studies have been conducted to investigate their overall characteristics,

4
especially their mechanical performances (Li et al., 1995; Karian, 2003; Nitta and
Maeda, 2010). Unfortunately, most of the previous researches were only focused on
their static mechanical behaviour. Since the applications of these thermoplastic
polymers have been extended from conservative to various engineering applications,
the strain rate factor should not be neglected and requires extra precaution from the
researcher.
Based on this consideration, some of the researchers have taken the initiative
to experimentally investigate the mechanical properties of PE, PP, as well as PC at
various levels of strain rates (Walley and Field, 1994; Mulliken and Boyce, 2006;
Cao and Wang, 2012). Walley and Field (1994) reported that PE and PP show
different patterns in terms of the rate sensitivity (i.e. maximum stress) as a function
of the applied strain rate. It was experimentally proven that the PP specimen exhibits
a bilinear relationship, where the rate sensitivity of stress increases sharply at a strain
rate of about 103 s
-1. Conversely, the PE specimen does not unambiguously show a
change of slope over a wide range of strain rates. Apart from that, Mulliken and
Boyce (2006) found that the PC specimen shows a different magnitude of increment
in terms of yield stress under both static and dynamic loading. They also reported
that the slope of the yield stress increment is much greater under dynamic loading
than that of static loading. Based on the recorded results, it is believed that the
knowledge of the dynamic mechanical characteristic of these thermoplastic polymers
(i.e. PE, PP, and PC) is still presently unclear. Therefore, it is believed that a more
detailed and systematic study should be carried out in the future in order to achieve a
conclusive explanation on the highlighted issues.

5
1.4 Static and dynamic mechanical behaviour of polypropylene based composites
In general, polypropylene (PP) is renowned as a high volume commodity
plastic, with a remarkable cost/performance balance, which has contributed to its
commercial success. Regrettably, this thermoplastic polymer is still referred to as a
low cost engineering plastic and is inappropriate for crucial engineering applications.
It is widely accepted that the incorporation of fillers into a PP matrix has shown great
potential in increasing the longevity and durability of PP, fulfilling various
requirements of engineering applications. For the past few years, many studies have
been carried out on polypropylene-based composites using micro and nano-sized
particulate reinforcement (Balasuriya et al., 2001; Alcock et al., 2007). They found
that PP composites that are reinforced with nano-sized particles exhibit greater
properties compared to their micro-scale reinforced counterparts (Jeong et al., 2005;
Thostenson et al., 2005). Furthermore, it was also found that nanocomposites, with a
good dispersion of fillers, show significant improvements in terms of their
mechanical, thermal, electrical, optical, and physical-chemical properties, even at
relatively low filler contents (Javni et al., 2002; Friedrich et al., 2005; Cho et al.,
2006).
Zinc oxide (ZnO) and mica particles are promising fillers for reinforcing the
PP matrix due to their outstanding properties as compared to other conventional
fillers of a similar nature (Chiang et al., 2005; Cheng et al., 2007; Rashid et al., 2008;
Rashid et al., 2011). Apart from that, it is believed that both composite systems have
great potential as engineering products due to their capability to provide a good
balance between impact resistance, production cost, and weight. Typically, the

6
majority of engineering products are mainly subjected to dynamic loading and
therefore it is critical to investigate the dynamic behaviours of these two composite
systems in order to avoid any mishaps during service. As with virgin polymers,
existing works are highly focused on their static mechanical behaviour (i.e. PP
reinforced with ZnO and mica particles). Unfortunately, the influence of fillers on
strain rate sensitivity and the dynamic behaviour of both composite systems have
often not been considered. This phenomenon might be attributed to the nature of the
composite, which can complicate the specimen’s geometrical design for dynamic
testing (Hamouda and Hashmi, 1998). Nevertheless, several researchers have come
out with an optimised specimen’s geometry to overcome this drawback and claim
that the dynamic facilities are also suitable and reliable for composite materials,
especially polymer matrix composites (PMCs) (Hao et al., 2005; Guo and Li, 2007).
Therefore, this is a great opportunity to discover the capabilities and possibilities of
these composites to replace conventional materials, especially in dynamic loading
applications.
1.5 Problem statements
It is generally acknowledged that the applications of thermoplastic-based
products have been extended from conservative to more challenging applications like
engineering components, constructions, load-bearing applications, etc. Hence, the
strain rate effect should be the first priority factor to be investigated, since almost all
of the highlighted applications are mainly involved with both static and dynamic
conditions. In addition, the knowledge of rate sensitivity is also important during
material selection in order to estimate the magnitude of changes in material’s

7
properties. Without this knowledge, it is almost impossible to predict and prevent the
unexpected failure during service. Recently, there is a very limited number of works
that are concerned with the dynamic behaviour as well as the rate sensitivity of
thermoplastic-based materials. In addition, numerical studies on the dynamic
mechanical properties of these composites are also infrequently reported and need an
additional effort to further clarify the relationship between the experimental and
numerical results, which is important for engineering design and simulation
purposes. Based on the highlighted issues, we believe that a systematic study is
necessary to fulfil the lack of information in this area.
Apart from external factors like the strain rate effect, it was also believed that
the internal structures of polymer (Liu and Baker, 1992; Wood-Adams et al., 2000;
Wood-Adams, 2001) and the filler-matrix related characteristics of the polymer
composites (i.e. as particle size, particle–matrix interface adhesion, particle shape
and geometry) may also influence the mechanical properties of the polymeric
specimens. However, we recognize that a similar kind of study under a dynamic
range of strain rates has never been reported in the past and remains a major
challenge in the development of a better understanding on the mechanical behaviour
of thermoplastic-based products under various loading conditions.
1.6 Objectives of study
The objectives of this study are:
1) To compare the static and dynamic mechanical properties of several
thermoplastic polymers

8
2) To examine the effect of molecular structures on the static and dynamic
compressive properties of thermoplastic polymers.
3) To measure the static and dynamic mechanical properties of polypropylene
based composites using nano and micro fillers.
4) To investigate the effect of particle size on the static and dynamic
compressive properties of polypropylene-based composites.
1.7 Organisation of thesis
This thesis has been divided into altogether nine chapters. Each chapter gives
the information about the research interest as mentioned in the objectives earlier.
Chapter 1 covers the introduction of the thesis. It contains a general
overview on the development of static and dynamic testing and a brief
introduction about dynamic studies on polymeric materials, a problem
statement, objectives of the project and organisation of the thesis.
Chapter 2 contains some fundamental concepts of the split Hopkinson
pressure bar technique, together with some reviews of related works reported
in previous literature.
Chapter 3 explains the material specifications, research methodology, and
experimental procedures which are carried out in this study.
Chapter 4 discusses the calibrations and verifications of the SHPB results.

9
Chapter 5 discusses the effect of the strain rate on several thermoplastic
polymers (i.e. PE, PP and PC). In addition, in this chapter, the experimental
results were also compared with two established equations namely the Eyring
and power basic equations.
Chapter 6 discusses the effect of molecular structure on the static and
dynamic compressive properties of the thermoplastic polymer, PE. As with
Chapter 5, both the experimental and numerical results were validated using
two established equations namely the Eyring and power basic equations.
Chapter 7 discusses the effect of the strain rate and particle content on the
static and dynamic compressive properties of polypropylene-based
composites (i.e. PP/nano-ZnO composites and PP/micro-Mica composites).
Chapter 8 discusses the effect of particle size on the static and dynamic
compressive properties of polypropylene-based composites (i.e. PP/SiO2
composites).
Chapter 9 concludes the findings of the project and the evaluation that has
been made in order to assess the achievements of the objectives. Some of the
suggestions for further study have been explained.
10
CHAPTER 2
LITERATURE REVIEWS
2.1 Introduction
This chapter summarises the principle of thermoplastic polymers followed by
a brief overview of thermoplastic-based composites, explaining their increasing use
in a wide range of engineering applications. In addition, a literature survey was
carried out on the development of the dynamic facilities, especially a Split-
Hopkinson pressure bar apparatus (SHPBA). Works on the static and dynamic
behaviours of thermoplastic polymers and their composites were also extensively
reviewed.
2.2 Polymers
Basically, the word polymer is derived from two different Greek roots which
are ‘poly-‘, meaning many, and ‘mer’, meaning part or segment. Therefore, a
polymer can be defined as the repetition of many similar segments (i.e. mer) that are
connected together to form a long chain. In general, polymers are classified into three
different classes which are thermoplastics, thermosets and elastomers (Harper, 2002).
Among those classes, thermoplastic polymers have been widely used in both
conservative and extreme applications.
2.2.1 Thermoplastic polymers
2.2.1.1 Characteristics of thermoplastics

11
A thermoplastic polymer usually begins in the form of a pellet, and then
becomes softer (i.e. pliable and plastic) with increasing heat. As it cools, it will
reversely transform back to the solid state without any cross-linked formation. This
process (i.e. heating and cooling) can be repeated over and over, though continual
recycling will ultimately degrade the polymer. In general, a thermoplastic polymer is
subdivided into two distinct classes of molecular arrangement, which are semi-
crystalline and amorphous as can be seen in Figure 2.1. These differences will
significantly affect the behaviour of the thermoplastic material, especially during
processing.
Figure 2.1: Molecular arrangement of amorphous and semi-crystalline thermoplastics
(http://www.azom.com/article.aspx?ArticleID=83)
2.2.1.2 Semi-crystalline versus amorphous thermoplastics
Thermoplastic polymers like polypropylene (PP), polyethylene (PE), nylons
(PA), polyacetal (POM), and thermoplastic polyesters (PET) are referred to as semi-
crystalline thermoplastics where in the solid state, a great proportion of their
molecular chains are structurally ordered and closely packed in certain specific

12
alignments. Meanwhile, polycarbonates (PC), polystyrene (PS), polyvinyl chloride
(PVC) and acrylics (PMMA) are examples of amorphous thermoplastics. This
indicates that in the solid state, their molecular chains are randomly arranged and this
is attributed to the complex entanglement. It should be noted that at very high
temperatures (i.e. melting state), both types of thermoplastic polymers will portray
similar features of amorphous molecular structures. The key characteristics of semi-
crystalline thermoplastics are translucent or opaque white colour, sharp melting
point, good resistance to stress cracking and good fatigue resistance. Meanwhile,
most amorphous thermoplastics tend to be naturally transparent, soften over a broad
range of temperatures, prone to stress cracking and poor fatigue resistance. Table 2.1
shows the common examples for both types of thermoplastic polymers and their
specific characteristics.
Table 2.1: Example of both semi-crystalline thermoplastics and amorphous
thermoplastics and their characteristics
(http://www.slideshare.net/Annie05/amorphous-and-semi-crystalline-presentation)

13
2.3 Composite material
A composite material is a material system that consists of two or more
constituent materials with significant differences in terms of their physical or
chemical properties, and which remain separate at the macroscopic or microscopic
scale within the finished structure. The history of composite materials started in the
early 20th
century. During that time, fibreglass was first introduced to reinforce
several high performance thermoset resins, such as polyester and epoxy resins. After
a few years, the composites industry evolved from thermosets to plastic resins in
order to fulfil a wide range of light weight applications. It was reported that the
earliest applications of glass fibre reinforced composite (GFRC) products were in the
marine industry (Strong, 2002). In 1943, the first plane with a GFRC fuse ledge was
flown at the Wright-Patterson Air Force base. Although this composite system was
introduced almost seven decades ago but the GFRCs still dominate the recent
composites market (i.e. covering approximately 90% of the composites market).
The rapid development of composite systems has revealed numerous types of
newer and stronger reinforcements. Not only that, the alternative materials from
metals and ceramics have also been manipulated as competitive matrix materials. To
avoid confusion, composite families are divided into three distinct classes depending
on the nature of their matrix. The most promising composites in recent industries is
polymer matrix reinforced composites (PMCs). This composites system is based on
the polymer matrix in either thermosets or thermoplastics. Although most of the
PMCs are reinforced with fibre, but recently particulate fillers have started to gain
much attention from researchers as well as industries. Other types of composites

14
systems are called metal matrix composites (MMCs) and ceramic matrix composites
(CMCs) (Callister Jr, 1994).
2.4 Polymer matrix reinforced composites (PMCs)
According to Othman (2007), PMCs are classified into two major groups
which are thermoplastics and thermosets. The thermoplastic group is subdivided into
four other groups, i.e. glass mat, fibre reinforced, natural fibre thermoplastic
composites and mineral reinforced thermoplastics. Meanwhile, the thermoset group
is subdivided into two groups, i.e. carbon reinforced and natural/synthetic fibre
reinforced. The detailed classifications of the polymer matrix composites are
depicted in Figure 2.2.
A different classification of PMCs was made by Alger (1997). He classified
PMCs into three major groups which are:
Polymer-polymer combinations (i.e. polymer blends),
Polymer-gas combination (i.e. expended, cellular or foamed
polymers),
Polymer-stiff filler combinations (i.e. polymer-fibre or polymer
particulate composites).
Among these highlighted PMCs, the polymer-stiff filler combinations have
attracted much attention from both researchers and industries due to their outstanding
end properties.

15
Figure 2.2: The classification of PMCs (Othman, 2007)

16
2.4.1 Benefits and drawbacks of PMCs
Polymer matrix composites (PMCs) offer a range of potential benefits over
conventional neat polymers especially for high-end applications. The most common
reason why PMCs are implemented in many critical applications like structural
components is related with their capability to provide outstanding stiffness at lower
weight than that of neat polymers (Callister Jr, 1994). Apart from that, other
additional benefits offered by PMCs can be summarised as follows:
Mechanical properties are outstanding
Processing of PMCs does not involve high pressure and high
temperature
High abrasion resistance can be achieved
Corrosion resistance is remarkable
Low thermal expansion can be achieved
Impact and damage tolerance characteristics are excellent
Low production cost
However, it is important to realise that these highlighted benefits can be only
achieved with the proper selection of the constituent materials and manufacturing
techniques. Otherwise, the end results might be different or lesser. It is easy to be
impressed with the potential benefits offered by PMCs but their drawbacks must also
be considered. Normally, PMCs that contain natural fillers tend to absorb moisture,
thus decreasing their overall performance, especially their mechanical properties
(Dhakal et al., 2007; Mazuki et al., 2010). Apart from that, PMCs may also

17
encounter obscurity with a high coefficient of thermal expansion characteristic which
results in dimensional instability. The anisotropic nature of PMCs may also
contribute to difficulties in the design process (Mallick, 1993). In terms of their
thermal resistance ability, PMCs show inferior performance at elevated temperatures.
These disadvantages might restrict their utilization in some fields of application.
2.5 Particulate-filled polymer composites
As defined by the word “particulate”, the reinforcing phase for this kind of
composites are normally spherical or at least has dimensions of similar order in all
directions (Lin, 2010). The introduction of particulate fillers into polymer matrices
will significantly improve nearly every property of the virgin polymers, including
their processing ability, dimensional stability, chemical resistance, strength, stiffness,
etc. However, to achieve optimum properties, several factors should be considered
carefully at the beginning stage of the filler selection. According to Rothon (2003),
important filler characteristics such as cost, particle size, particle shape and geometry
are the main elements that require extra consideration during the implementation of
particulate fillers into a polymer matrix. Therefore, brief descriptions of each factor
will be discussed in the following subtopics.
2.5.1 Cost
Initially, the main reason for using filled composites is to reduce the cost of
the raw materials. It is generally known that the polymer is more expensive than the
particulate filler. However, it is inappropriate to directly compare filled composites

18
with their raw materials in terms of cost saving criteria due to several principal
reasons. Firstly, filled composites undergo more complex fabrication stages like the
compounding process, which requires a bigger capital investment, more manpower
as well as energy. Secondly, the prices of the raw materials (i.e. the filler and matrix)
are normally quoted according to their weight, whilst those of their composites are
based on their volume. Therefore, it will be more suitable if the comparison is made
based on their cost-property performance, where the composite will definitely beat
the original material (i.e. the filler and matrix).
2.5.2 Particle size
Particulate size is another factor that affects the end properties of filled
composites. For synthetic fillers, the particulate size is highly dependent on the
conditions during the synthesis process (i.e. precipitation) and possibly by any
additional coating process. Meanwhile, for natural fillers, the particulate size is
determined by the extraction process from the raw deposits, including the mining and
separation stages. Until recently, numerous methods have been implemented to
measure the particle size including optical scattering, diffraction from particulate
suspensions and sieving.
Theoretically, particle size can be divided into three distinct categories
namely primary particles, agglomerates and aggregates. The term “agglomerates”
refers to a collection of weakly bonded particles, whereas the term “aggregates”
refers to a collection of strongly bonded particles. For a better understanding of the

19
highlighted issues, Rothon (2003) has suggested an idealised view of particle types
and their breakdown during the composite formation as illustrated in Figure 2.3.
Figure 2.3: Idealised view of the way filler particles disperse and of the different
forms of particle types that might be encountered (Rothon, 2003)
In most cases, filler systems do not follow the trend shown in Figure 2.3
where the steps shown are often less sharp and overlap. The majority of them exhibit
more complicated profiles as depicted in Figure 2.4. From the recorded profile in
Figure 2.4, it can be seen that those agglomerates, sometimes referred to as flocs, can
arise due to the loss of colloidal stability in the polymerising systems, or to
reticulation (filler network formation) above the glass transition, especially in cured
elastomers, an effect often observed with carbon blacks. This phenomenon becomes
more difficult and serious for synthetic products, especially those formed by

20
precipitation. For this kind of filler system, strong and complex aggregates are
present. Normally, these aggregates will break down slowly and thus alter the ideal
particle dispersion profile in Figure 2.3
Figure 2.4: Complex particle dispersion behaviour, as often encountered with fine,
precipitated fillers (Rothon, 2003)
2.5.3 Particle shape
As with particle size, the particle shape is an additional factor that influences
the properties of the final product. The shape of the particle is often determined by
the genesis of the filler, the crystal structure and processes it has undergone. Previous
researchers have proposed several terms that describe the shape of a particle
including spherical, flaky, platy, blocky, irregular, acicular, needle, etc. Therefore,

21
some typical particle shapes that are likely to be found in most particulate-filled
composites are illustrated in Figure 2.5.
Figure 2.5: Some types of common particle shapes in particulate-filled composites
(Rothon, 2003)
For synthetic fillers, their shape depends on both the production conditions
and the chemical composition. For example, precipitated calcium carbonate (CaCO3)
can be produced in various forms including aragonite, calcite or vaterite by merely
changing the precipitation conditions. These precipitation conditions can be
manipulated (i.e. during drying and milling) to either produce single crystals or
complicated aggregates. Meanwhile, the external shape of the mineral fillers is
determined by their crystal structures as well as by the environmental conditions in
which the mineral was formed. If permitted to grow without restraint, then the
particle will be bounded by crystal faces in a regular way which is derived from

22
regular atomic arrangement. Nevertheless, under certain critical circumstances like
under pressure, temperature or the effects of impurities, the crystal may adopt
different shapes or habits such as cubic, fibrous (i.e. fine, long, needles), acicular (i.e.
needle-like), lamellar (i.e. plate-like) and prismatic. Although, it is almost impossible
to form perfect crystals, but even poorly formed ones will always show evidence of
their intrinsic symmetry.
2.6 Particulate-filled thermoplastic composites (PFTCs)
As discussed in the previous section, thermoplastic polymers tend to soften
appreciably as they are heated, thus decreasing their mechanical performance. Even
worse, they start to lose their shape at elevated temperatures. Therefore, for the past
few years, rapid and progressive efforts have been developed to overcome this
dilemma. This can be seen in the early work on reinforced thermoplastic matrices by
Leong and his co-workers (Leong et al., 2004b). Surprisingly, they found that the
addition of mineral fillers (i.e. talc and CaCO3) increases the modulus and
crystallization temperature of unfilled thermoplastics.
The incorporation of mineral fillers including kaolin, talc, calcium carbonate
and mica into thermoplastic polymers has become a common practice in the plastic
industry. The main purpose for this kind of action is related to the cost reduction of
moulded products. Apart from the cost reduction, fillers are also used to improve the
mechanical properties of thermoplastics, such as strength, rigidity, hardness and
durability (Katz and Milewski, 1987; Rusu et al., 2001; Chan et al., 2002). However,
the optimum filler loading should be determined carefully since excessive fillers may

23
adversely affect the ductility, processability and strength properties of composites
(Premalal et al., 2002; Fu et al., 2008). Lately, PE and PP are the most popular semi-
crystalline thermoplastic polymers to be used as matrices in compounding with
fillers. Meanwhile, polystyrene (PS) and polycarbonates (PC) have recorded a
similar popularity trend for amorphous thermoplastic polymers.
Many studies have been demonstrated on particulate-filled polyethylene
composites in order to fully characterise their overall performance. As pointed out by
Zhao et al. (2005), the strength and modulus of PE/clay composites have been found
to increase perpendicularly with increasing clay loading, whereas the notched impact
strength shows a contrary trend. In addition, the thermal stability of PE/clay
composites is far better than that of unfilled PE up to certain clay loadings. It is
believed that organoclay can play two conflicting functions in the thermal stability of
polymer/clay nanocomposites. At low clay loading, the clay layers become effective
barriers, thus significantly increasing the thermal stability of the PE/clay composites.
However, with increasing clay loading, the catalysing effect rapidly rises and
becomes dominant, so that the thermal stability is decreased. The addition of metallic
filler into the PE matrix is believed to increase the thermal conductivity properties of
the neat PE as previously reported by Kumlutas et al. (2003). They proved that the
addition of conductive particles (i.e. aluminium) into the HDPE matrix gradually
increased the thermal conductivity of the composites as compared to unfilled HDPE.
Another common commodity plastic is PP. Progressive attention has been
specifically made in order to extend its applications from conservative to more
challenging applications. For this reason, several researchers have been intensively
24
involved in works that are related with reinforced PP. For example, Svoboda et al.
(2001), reported that the presence of clay filler increases the tensile modulus but
decreases the elongation up to a certain extent. Typically, the pure PP and the
PP/clay composites with a low clay content exhibit yielding behaviour in the stress-
strain characteristic with a maximum elongation of up to 200%. Meanwhile, PP/clay
composites that had been reinforced with a clay content higher than 7% did not show
any yielding behaviour, where samples were immediately broken after reaching the
maximum loading (i.e. stress). More recently, a study by Manchado et al. (2005)
investigated the effect of different fillers (i.e. single-walled carbon nanotubes and
carbon black) on both the thermal and mechanical properties of reinforced PP
composites. Initially, it was found that the introduction of both reinforcements
significantly increased the Young’s modulus of the composites up to a certain extent.
However, the increment trend was somehow different between these two fillers.
They mentioned that a further increase in single-wall carbon nanotubes proportion in
the composites (i.e. 1 wt %) provided a marked decrease in the tensile modulus,
whereas carbon black fillers recorded an increment pattern with increasing filler
content. The difference is mainly attributed to the morphology of both fillers. For a
similar interface area, carbon blacks with more isometric particles may induce a
significant difference in their aspect ratio, meaning that the former are able to
entangle and interconnect more easily and more often than that of the latter.
Meanwhile, increasing the single-walled carbon nanotubes concentration in the
composites may encourage the formation of aggregates. It is assumed that the
aggregates of nanotube ropes will significantly reduce the aspect ratio
(length/diameter) of the reinforcement, hence reducing the rigidity of the composites.