Embed Size (px)
Citation preview

SUPPORTING INFORMATION
Removal of fluorescent dissolved organic matter in biologically
treated textile effluents by NDMP anion exchange process: efficiency
and mechanism
Wen-Tao Lia, Zi-Xiao Xua, Chen-Dong Shuanga, Qing Zhoua, Hai-Bo Lia, Ai-Min Lia,*
a State Key Laboratory of Pollution Control and Resources Reuse, Collaborative
Innovation Center for Advanced Water Pollution Control Technology and Equipment,
School of the Environment, Nanjing University, Nanjing, 210023, China
CORRESPONDING AUTHOR FOOTNOTE
Prof. Ai-Min Li
School of the Environment, Nanjing University, Nanjing, 210023, China
Fax: +86 25 86269876; Phone: +86 25 83318402
E-mail: [email protected]

SUPPORTING INFORMATION
Table S1- The gradient elution program of preparative HPLC system
Time (min) Solvent A (%) Solvent B (%) Flow rate (ml/min)
0.00 85.0 15.0 20
3.00 70.0 30.0 20
5.5 30.0 70.0 20
7 20.0 80.0 20
8 10.0 90.0 20
10 10.0 90.0 20
Solvent A: Water; Solvent B: Methanol

SUPPORTING INFORMATION
Table S2- Reproducibility of HPLC fluorescence signal integration
Em 340 Em 460
Ex230 Ex280 Ex250 Ex310 Ex370
QY Sample
3083.3 1191.1 635.8 132.3 96.4
3080.6 1198.1 636.1 132.7 97.5
3080.3 1194.3 635.1 133.0 97.6
AVG a 3081.40 1194.50 635.67 132.67 97.17
SD b 1.65 3.50 0.51 0.35 0.67
RSD c 0.05% 0.29% 0.08% 0.26% 0.69%a Average; b Standard Deviation; c Relative Standard Deviation
The same QY sample was measure by HPLC multi-excitation scan for 6 times: 3
times with parameters of Em340/Ex220~300 nm and 3 times with parameters of
Em460/Ex230~400 nm. Then fluorescence signals at 5 selected pairs were integrated
to assess the reproducibility.

SUPPORTING INFORMATION
Table S3- Linearity of HPLC fluorescence signal integration
Sample DOC
(mg/L)
Em 340 Em 460
Ex230 Ex280 Ex250 Ex310 Ex370
QY_1 8.31 607.1 239.5 129.1 129.1 18.2
QY_2 16.62 1222.8 481.5 257.0 52.1 37.6
QY_3 24.92 1815.9 715.6 383.7 78.1 56.5
QY_4 33.23 2445.2 951.9 508.0 104.8 77.2
QY_5 41.54 3080.3 1194.3 635.7 132.7 97.2
R2 0.9998 1 1 0.9998 0.9997
QY_1~5 are diluted solutions of QY textile effluent. The fluorescence signals at the
selected pairs were integrated and used the linear regression analysis to assess its
accuracy in quantitative analysis. Additionally, the good linear regression suggests
that the inner-filtering effect was avoided.

SUPPORTING INFORMATION
Table S4 Estimation of NDMP operation cost
Treatment capacity 24 (h/d)* 80 (m3/h) = 1920 m3/d
Electricity cost The electricity consumed about 300 (kW·h / d) one day. With
the price of 0.9 (CNY/kW·h), the electricity cost per m3 is
estimated as ~0.14 CNY, calculated as:
300*0.9/1920.
Chemical cost for
regeneration
The NaCl solution for regeneration is assumed as 12 m3, i.e.,
the treatment of about 150 m3 wastewater needs 1 m3 NaCl
solution for regeneration.
The price of NaCl is assumed as 600 CNY/ton.
If the concentration of NaCl solution is ~15%, the
regeneration chemical cost is about 0.56 CNY, calculated as:
12 *0.15*600/1920.
If the concentration of NaCl solution is ~10%, the
regeneration chemical cost is about 0.37 CNY, calculated as:
12 *0.10*600/1920.
Note: the treatment of brine wastewater or the reclamation of NaCl are not considered in this estimation. The NaCl price might also vary across regions.

SUPPORTING INFORMATION
Fig. S1 NDMP pilot-scale engineering cases
For TQ, the NDMP process used the 1st generation reactor, which is a horizontal
flow tank; For QY, FZY and LF, the NDMP process used the 2nd generation reactor,
which is an up-flow cylinder.

SUPPORTING INFORMATION
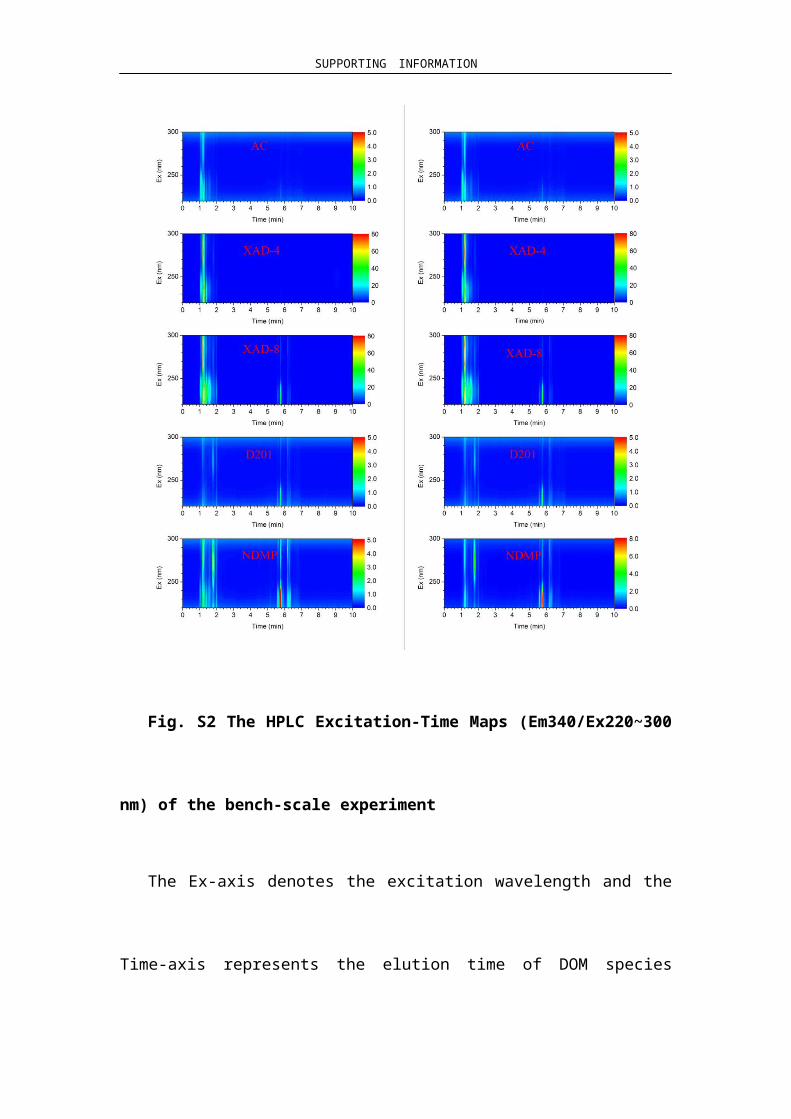
Fig. S2 The HPLC Excitation-Time Maps (Em340/Ex220~300 nm) of the
bench-scale experiment
The Ex-axis denotes the excitation wavelength and the Time-axis represents the
elution time of DOM species containing aniline-like fluorophores. The color
variation represents the fluorescence intensity in arbitrary units.
The two columns represent the duplicate results of 5 anion exchange and
adsorption material.

SUPPORTING INFORMATION
Fig. S3 The HPLC Excitation-Time Maps (Em460/Ex230~400 nm) of the
bench-scale experiment
The Ex-axis denotes the excitation wavelength and the Time-axis represents the
elution time of humic-like species. The color variation represents the fluorescence
intensity in arbitrary units.
The two columns represent the duplicate results of 5 anion exchange and
adsorption material.

SUPPORTING INFORMATION
Fig. S4 The HPLC Excitation-Time Maps of humic fractions.
The fluorescence parameters were set at: Em460/Ex220~400 nm for HS-Em460-Ex3
fractions from TQ and QY; Em430/Ex220~400 nm for HS-Em430-Ex2 fractions from
TQ and QY.

SUPPORTING INFORMATION
Fig. S5 The acid-base titration curves of humic fractions
The DOC concentration of sample solutions is as follows:
TQ HS-Em460-Ex3: 6.933 mg/L; TQ HS-Em430-Ex2: 10.163 mg/L;
QY HS-Em46-Ex3: 19.837 mg/L; QY HS-Em430-Ex2: 23.489 mg/L.
SUPPORTING INFORMATION
Fig. S6 The performance of the pilot-scale NDMP process in TQ: (a) the COD
concentration before and after NDMP treatment; (b) the UV254 absorbance
before and after NDMP treatment; (c) the EEM spectra before NDMP treatment
(diluted by 25 times); (d) the EEM spectra after NDMP treatment (diluted by 25
times)

SUPPORTING INFORMATION
Fig. S7 The performance of the pilot-scale NDMP process in FZY: (a) the COD
concentration before and after NDMP treatment; (b) the UV254 absorbance
before and after NDMP treatment; (c) the EEM spectra before NDMP
treatment; (d) the EEM spectra after NDMP treatment

SUPPORTING INFORMATION
Fig. S8 The performance of the pilot-scale NDMP process in LF: (a) the COD
concentration before and after NDMP treatment; (b) the Color Degree before
and after NDMP treatment

SUPPORTING INFORMATION
Fig. S9 Photographs of textile effluents: before NDMP treatment VS after NDMP
treatment