Embed Size (px)
Citation preview

No42
STATENS GEOTEKNISKA INSTITUT I SWEDISH GEOTECHNICAL INSTITUTE
SARTRYCK OCH PRELIMINARA RAPPORTER
REPRINTS AND PRELIMINARY REPORTS
Supplement to the Proceedings and Meddelanden of the Institute
Contributions to the Seventh International Conference on Soil Mechanics and Foundation Engineering Mexico 1969
1 Negative Skin Friction for Long Piles Driven in Clay With Discussions Bengt Fellenlus amp Bengt Broms
l Negative Skin Friction on Piles in Clay -a Literature Survey Bengt Fellenlus
3 Nuclear Radiation in Construction Control of Earth and Rockfill Dams Lennart Bernell amp Karl Arthur Scherman
4 Stability of Natural Slopes and Embankment Foundations (Gota River Valley) Bengt Broms
5 Vibratory Compaction of Cohesionless Soils Bengt Broms amp Lars Forssblad
STOCKHOLM 1971
STATENS GEOTEKNISKA INSTITUT
SWEDISH GEOTECHNICAL INSTITUTE
No42
SARTRYCK OCH PRELIMINARA RAPPORTER
REPRINTS AND PRELIMINARY REPORTS
Supplement to the Proceedings and Meddelanden of the Institute
Contributions to the Seventh International
Conference on Soil Mechanics and
Foundation Engineering Mexico 1969
1 Negative Skin Friction for Long Piles Driven in Clay With Discussions Bengt Fellenius amp Bengt Broms
2 Negative Skin Friction on Piles in Clayshya Literature Survey Bengt Fellenius
3 Nuclear Radiation in Construction Control of Earth and Rockfi 11 Dams Lennart Bernell amp Karl Arthur Scherman
4 Stability of Natural Slopes and Embankment Foundations (Gota River Valley) Bengt Broms
5 Vibratory Compaction of Cohesionless Soils Bengt Broms amp Lars Forssblad
Reprinted from Proceedings of the Seventh International Conference on Soil Mechanics and Foundation Engineering Mexico 1969 and from Proceedings of Specialty Sessions Nos 2 and 8
STOCKHOLM 1971
PREFACE
The Swedish contributions to the Seventh International Conference
on Soil Mechanics and Foundation Engineering in Mexico 1969 are
collected in this publication To the first paper are added the
Swedish contributions to the discussions at the Specialty Session
on negative skin friction on piles in clay
The Institute wants to thank Mr LBernell and Mr KAScherman
Swedish State Power Board for the possibility to include their
paper in the publication
Stockholm May 1971
SWEDISH GEOTECHNICAL INSTITUTE
NEGATIVE SKIN FRICTION FOR LONG PILES DRIVEN IN CLAY LE FROTTEMENT NEGATIF POUR DE LONGS PEUX ENFONCES DANS LARGLE
BEN GT H FELLENUS Civ Eng
BENGT B BRO MS PhD
Swedish Geotechnical lnstitute Stockholm Sweden
SYNOPSIS The paper describes the load distribution in two instrumented pre-cast concrete piles which have been driven through 40 m of clay 13 m of silt and 15 m of sand The load is caused by negative skin fricti6n due to reconsolidation of the remoulded clay around the piles after the driving The soil consists at the test site of homogeneous normally consolidated clay with a water content of around 80 and an undrained shear strength at the surface of about 2 tonsm2 and 7 tonsm2 at the depth of 40 m Piezometers and settlement gauges were installed in the soil prior to the driving A new accurate pile-force gauge has heen developed for this project which makes it possible to measure the load and the moment distribution in a pile after driving Measurements showed that the load in the pile immediately after driving was roughly equal to the weight of the pile itself During the five months period following the driving the load in the pile increased by about 30 tons at the bottom of the clay layer This load increase corresponds to a negative skin friction which increases linearly from O at the ground surface to about 1 4 tonsm2 at the bottom of the clay layer The negative skin friction is equal to 17 of the undrained shear strength or to 5 of the average effective overburden pressure
INTRODUCTION TEST PROGRAM
Thick deposits of soft normally consolidated clays The test program consists of tliree phases The first cover large areas in the middle and south western phase concerns the distribution of negative skin parts of Sweden Building in these areas are genershy friction and bending moments during and after the ally supported by end bearing piles which are driven driving of two long unloaded piles which have been through a soft clay to moraine or rock However driven through a normally consolidated clay into silt the general lowering of the ground water table which and sand In the second phase an axial load of 80 occurs in the central parts of the large cities causes tons will be placed on the two piles and its effects on settlements and an increase of the load in the end the negative skin friction of this load will be studied bearing piles due to negative skin friction Great In the third phase a 2 meter high gravel fill will be uncertainty exists about the magnitude of the negashy placed over an area 40 by 40 meters around the two tive skin friction with respect to the undrained shear test piles This will cause settlements in the clay strength of the soil or the effective overburden and thus negative skin friction along the two piles pressure the relationship between settlements and It is anticipated that phase three of this investigation negative skin frictioa and the effect of pile driving will be completed in 1973 on the negative skin friction An investigation was therefore initiated in 1966 in order to answer some of these questions SITE CONDITIONS
A robust and accurate pile force gauge has been The test site is located at the River G5ta Alv approxshydeveloped for this project The pile force gauge imately 20 km northeast of Gothenburg in the southshywas designed to resist the stress conditions during western part of Sweden The soil consists of 40 m of the driving 6pound a pile The conventional system to normally consolidated clay which is underlain by silt measure the negative skin with a series of steel and sand At 35 m depth the clay contains silt layers rods has the disadvantage that only the changes The undrained shear strength water content liquid which take place after the driving can be measured and plastic limits fineness number and unit weight Thus the stress conditions in the pile immediately are shown in Fig 1 The natural water content of after the driving are unknown An additional unshy the clay exceeded the liquid limit down to a depth of certainty in the caiculations is that the value of the about 23 m The undrained shear strength increasGd modulus of elasticity for concrete is uncertain and from about 1 5 tonsm2 at the ground surface to may vary appreciably These variations affect the about 5 0 tonsm2 35 m below the ground surface accuracy of the results Two instrumented reshy The ground water table is located at the ground swrshyinforced concrete piles were driven in June 1968 face The percentage of clay size particles smaller The pore water pressures the soil movements and than 0 002 mm in the clay is about 80 down to a the negative skin friction which develop during the depth of 20 m Between 20 and 30 m the percentage driving and during a five month period after the of clay size particles decreases to about 55 The driving are described in this paper sensitivity of the clay varies between 15 and 20
93
FELL ENUS and BR OMS
SOIL Ii - ~ UNORAINED SHEAR STRENG1H tJfm2 ~ no
CLAY
r- Jr
00
A Natural wotorconhnt ~ ~ Yonbull bon bull ~AnbullnuJ numbbullr bull ~ Swbulldlbullh fol canbull to~t -~Pla1o limit -uLiqud limt
Fig 1 Soil description
PILE TYPE AND DRIVING DATA
Two precaat hexagonal Herkulea pilea of reinfo[ced concrete with a cross aectional area of 800 cm and a circuznference of 106 cm were used for the experishyments Each pile was composed of 11 2 m long segments The bottom segment was provided with a rock point of hardened steel The piles were also provided with a center pipe a thin wall steel pipe with 42 mm diaineter inside dianieter in which deformation gauges were inserted after the driving Also special cable pipes (DB mm) were placed in the piles for the electrical cables leading from the pile fore gauges to the head of the pile
The nominal concrete cube strength was 500 kgcm2 bull The average measured cube strength was 607 kgcm2 28 days after the casting The reinforceshyment consisted of six bars with 16 mm diameter and a yield strength of 60 kgmm2 bull The failure bending moment of the pile section exceeded 8 5 tonm The segments were fastened together in the field by rigid steel joints ae the driving proceeded The strength of the joints exceeded that of the pile eegment
Test pile PI was composed of five pile segments and three pile force gauges and test pile PI of six segments and four gauges The length of the upper
segment of pile PI wae Z 0 m In this pile the lowest gauge was placed right at the pile tip as illustrated in Fig 2 The location of the uile forc-P gauges are shown in Fig 3
Fig 2 Photo of pile-force gauge placed at the pile tip The pile tip is provided with a rock point of hardened steel
The piles were driven with a 4 2 tons drop hammer The height of fall was O 3 m when the piles were driven down to a depth of 40 m Below this depth the height of fall was increased to 0 5 m The total number of blows required for the driving was about 5000 for pile PI and 4000 for pile PII The driving of the first pile (PI) was terminated at a depth of 53 1 m when the penetration resistance of the pile was 8 cm per 50 blows The second pile (PII) had to be driven to a depth of 55 1 m to reach the same final penetration resistance as pile PI (The penetrashytion resistance at 53 m depth was low and therefore an additional 2 m long pile segment had to be added) The driving data indicated that the piles acted as combined friction and end bearing piles
Pile PI was relatively straight after the driving Inclinometer measurements (Kallatenius and Bergau 1961) indicated that the pile tip deviated laterally 1 4 m from its intended position The minimum radius of curvature of the displaced pile was 340 m Pile PI was not as straight as pile PI The pile tip after driving had been displaced 6 2 m away from its intended location The minimum radius of the pile axis close to the pile point was 170 m Laboratory tests have indicated that failure by bending will occur at a radius of 50 to 100 m
INSTRUMENTATION OF PILES
The pile-force gauge used in this project was developed by the A Johnson Institute for Industrial Research The gauge is composed of three load cells which are placed between two rigid steel plates
94
I
LONG PILES IN CLAY
The load in each cell is measured separately by a system of vibrating wire gauges This makes it possible to determine the total axial force and b~nding moment in the test pile at the level of the force gauge The O 4 m long force gauges were corinected to a pile in the same manner as the pile segments The pile force gauge was designed to resist the stress conditions which develop during the driving Laboratory and field teats have indishycated that the maximUin error in the imiddotecorded forces ia less than 2 of the design load The gauges were designed to resist a tension load of 50 tons and a compression load of 150 tons These values can however be exceeded three times withshyout impairing the function of the gauges (Fellenius and Haagen 1969)
INSTRUMENTATION OF SOIL
Piezometers and settlement gauges were installed two months prior to the driving of the pilea All piezometers but one were type SGI which ace providshyed with a closed oil system Pore water pressures are read directly on a manometer (Kallstenius md Wallgren 1956) To measure the pore pressure in the permeable bottom layers an open pipe witn a filter tip was used Each settlement gauge consisted of a number of Z m sections of flexible steel spring reinforced rubber hoses with 32 mm inside diashymeter The steel spring reinforcement allowed the hose to change its length axially but prevented the hose from collapsing when subjected to lateral earth pressure The hose sections were connected by brass rings The settlement gauges were placed vertically in pre-drilled holes in the soil The flexible settlement gauges and the brass rings followed the moVements of the soil It was possible to determine the settlements of the soil from the location of the brass rings vlith respect to a refershyence point at the ground surface by lowering a plumb bob inside the hose When the plumb bob came in contact with the brass rings an electrical circuit was closed which could be observed at the ground surface With this method it was possible to determine the settlements every 2 0 m with an accuracy ofplusmn 2 mm (Wager 1969)
Two settlement gauges were installed next to each pile An additional gauge was installed at some distance away from the pile The gauges were brought down to a depth of 36 m The location of the gauges are shoWTI in Fig 3 The various gauges could not be installed absolutely vertically Howshyever the deviations were small down to a depth of 10 m
Three piezometers were installed next to the preshydetermined pile locations at the depths 9 0 22 3 and 30 5 m below the ground surface One additional piezometer was installed at a depth of 28 6 m some distance aw~y from the two pile At about the same distance from the piles an open pipe with a filter tip was installed at a depth of 45 0 m
Wl W2 ~Q-
PI ~ Pil [ p E IE3 ~2smI
0
0
W3 Pvf1E P~t 2E f oltgtmiddot PLAN 1-JllITI_ gtI - __pvt 1
PI P Il
Id Pvt 3 at Pl Pil10
M3 M7
bi Pvt 2 ot PT Pil
25 bi Pvt 2 E
M2 cl Pvt 1 ot PIPII M6
ij Depth of W1 W2
MS lI Pvt1E open pipe)
gtshy~
u
6 zi M4lt(sst u
601 fi Pile joint
bull =Pile - force gouge (Ml
DEPTH bi Piezometer (Pvt
lJ Settlement gouge (W)
Fig 3 Location of piles and instrumentation
BEHAVIOUR DURING AND IMMEDIATELY AFTER DRIVING
The driving of the two test piles caused movements in the soil These were measured close to the two piles and at some distance away from the piles Also high excess pore pressures were measured
Settlements The driving caused the ground surface to heave 20 mm close to the pile as shown in Fig 4 The heave decreased however with increasing
95
FELL ENUS and BR OMS
depth SCttkrnc-nts were measured belOV a depth of S to 6 m The maximum settlement (50 mm) was mcmiddotlttsurcd close to pile PII at a depth of 11 m The obstmiddotrimiddotccl heave was caused by upward displacements of tlH soil above the pile tip and the observed settleshyments ]Hobably by downwards displacements at and btgtlow the pile tip
W1 AT PI W3 JC laquol Sil SpoundTllEHElff 1E 20 JO 0
)
U I I LJ
~ J-
~J Rocdng l ond en takm dring dtmng pllo PI Oltld p_n ~ 11d~1 7 oro lltgtkor bofoo drorg ~lo PQbullobullz R1Ddu11 1 ond15 ltlrbull toaon Gfer dtvin~ p1
~g lloltgtdn~ ll ~ bktn aUor ro mon1h
~~ w ~-alt DEPTH
Fig 4 Vertical movements in the clay during and after driving
The coritinued driving caused the soil to heave about 10 to 15 mm At gauge WIII located 5 and 11 m
away from the test piles the driving caused a heave or 5 mm at the ground surface The heave deshycreased howevermiddot with depth The displacements of the soil shown in Fig 4 have been evaluated from the assumption that the soil at the lowest measuring point did not move The reported values thus represent relative movements within the clay layer A precision levelling before and after the driving indicated however that the lowest measured point of gauge WI had settled 9 mm The corresponding settlements of gauges WI and WIII were 7 mm and 5 mm respectively These settlements are primashyrily caused by compaction of the silt and sand layers below the clay The two test piles were driven 13 and 15 m into the bottom layers
Pore Water Pressure The pore water pressures measured by all piezometers corresponded prior to the- driving of the two test piles to a ground water table at the ground The driving caused however a large increase of the pore water pressure at the
gauges located at a depth of 20 3 m below the ground surface The pore pressure increase at the gauges located at 30 5 m depth was small since these gauges were located several meters away from the two piles Also the pore pressure increase observed at a depth of 9 0 m was small All piezometers have aftershywards been checked and are functioning properly The excess pore pressure caused by the pile driving and the dissipation of the excess pore pressures with time are shown in Fig 5 for the two gauges located close to piles PI and PII at a depth of 20 3 m The maximum total pore pressure was 40 tonsm2 at this level The correspondin~ total vertical overshyburden pressure is 32 9 tonsm2 at the same level Thus the measured pore pressure exceeded locally the total overburden pressure by 20
Gauge depth 223 meter Original pore pressure 221 lonsrr Gauge Pvl 2 at pile PI and Pll
Fig 5 Excess pore pressure caused by pile driving and its dissipation with time
Forces and bending moments The force gauges in the piles were read each time a new pile segment was added
Measurements indicate that the force in the two piles immediately after the driving was roughly equal to or slightly less than the weight of the pile above the gauge Thus the driving did not cause any axial forces to be locked11 into the piles
The bending moments in the straight pile PI were small These varied between O 4 and 1 3 tonm Larger values were measured in the bent pile PII Gauge MS located 12 m from the pile tip at the boundary between the clay and the underlaying silt and sand indicated a bending moment of 3 2 tonm This bending moment corresponds to about 35 of the failure value The corresponding radius of curvature was 170 m over the length of the gauge
96
--- --
LONG PILES IN Cl A Y
Gauges M6 and M7 indicated a bending moment of 0 9 and 2 4 tonm respectively The corresponding radii were 220 and 190 meters
BEHAVIOUR AFTER DRIVING
The driving disturbed the clay around the piles It was anticipated that reconsolidation of the clay would cause settlementgt of the soil and drag forces in the piles To study this phenomenon the various instruments were read regularly during the five months period which followed the driving
Settlements The settlement gauges indicated that the movements of the soil were small The recordshyed settlements varied between one and three millishymeters
Pore water pressure High excess pore water pressures developed around the driven pile in the clay as indicated by the gauges located at a depth of 20 3 m The excess pore watta1 pressures dissipated with time No excess pore water pressures remained 150 days after the driving as can be seen in Fig 5
Forces and bending mvments The axial force distribution with time is shown in Fig 6 At first the axial load in the two test piles increased rapidly at the different measuring levels Two or three weeks after the driving the rate of the load increase slowed down After about eight weeks the load inshycrease was very small at the upper levels
PI Pll
= ltMlt --
t-5 bulld
~ s
MS --- I _----
----=-middotn-b l ~__------- v __ bull -~- I~--~
7 1--~- -r-_= M
1
c -bull Ml-~
- I jJ
Fig 6 Recorded forces in piles PI and PII
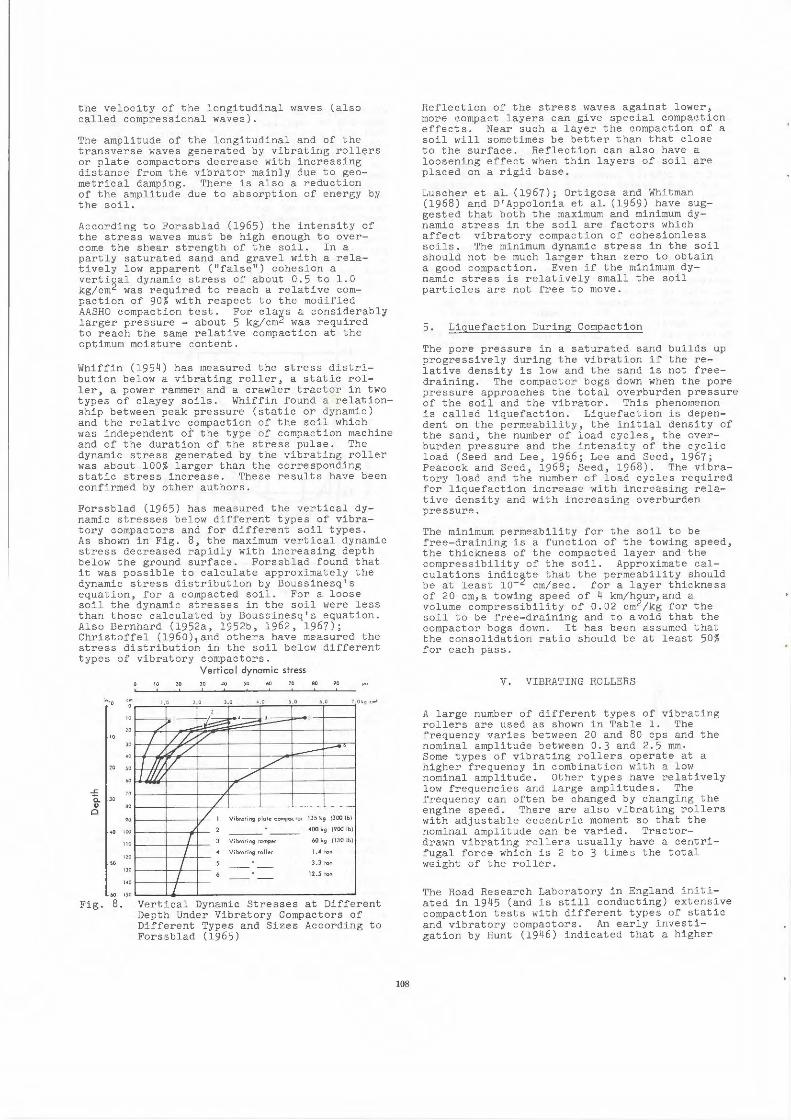
In Fig 7 the m~asured loads have been plotted at different time intervals after the driving The dotted line in this figure represents the WPight of the pile The line marked O represents the load distribution immediately after the driving It can be seen from Fig 7 that the axial load in both piles was less than theweight of the pile immediately after the driving down to a depth of nearly 40 m The load in the piles increased with time and 144
97
days after the driving the pile load exceeded the weight of the pile by 25 to 30 tons at the level of the interface between the clay layers and the undershylaying silt and clay layer This load is still inshycreasing five months after the driving Gauge M 4 in pile PII indicates that most of the load due to negative skin friction along the pile is resisted as positive skin friction in the underlaying silt and sand layers The average skin friction can be calculated from the load distributions It is proportional to the load difference between adjacent levels In Fig 8 is shown the average skin friction resistance for the two piles The points which on the same occasion represent the average skin friction have been connected The measurements indicate that the sltin friction resistance increases approximatelv linearly from zero at the ground surface to 14 tm2
at a depth of 40 m The skin friction resistance below this depth was positive The negative skin friction corresponds to 17 of the undrained shear strength of the clay or to 5 of the effective overshyburden pressure of the soil
PI Pll
---Whlclplbull
-- too~ dtribbulltbullon
M Pile-lore 1r1u~o
61
iho iurbull rbullftrs o 11 do) orto
-~----
-r 1 S 1530 63100 14ay~M5 I I I I
m
Fig 7 Vertical distribution of load in the piles at different times after driving
The recorded bending moments increased after the driving However the increase was small The bending moment at gauge MS which immediately after the driving recorded 3 2 tonm increased by 12 to 3 6 tonm five months after the driving This relative increase was the largest recorded by any of the gauges
FELLENIUS and BRO MS
PI PU
M Plo-lo gugt
0r11~middot~ Tho flure rofbull to
~ ~ut~~~~~ltgtylt
P05JTIVE SKlI FIIICIION bull IIEGATIVE SKIii FRICTION
S~CA-LE_ _----t---~c-------e-- tonoimZ +10 +0 -10 -20
Fig 8 Calcmiddotulated average skin friction at different times after driving
CONCLUSO~S
The test results indicate that negative skin friction can be caused by the remoulding of the clay around driven piles and the subsequent reconsolidation of the soil even if the settlements of the soil are very sinall The measured negative skin friction after
a period of five months corresponded to 17 of the average undrained shear strength of the clay or to 5 of the average effective overburden pressure The resulting axial forces in the piles were resisted by positive friction in the silt and sand layers at the lower parts of the piles Considerably higher values of the skin friction resistance will undoubtly develop when a fill is placed over the area
ACKNOWLEDGEMENTS
This project which is carried out in co- operation with the A Johnson Institute for Industrial Research has been supported financially by the National Council of Building Research (Statens Rild poundcir Byggnadsforskning)
REFERENCES
Fellenius B H amp Haagen T 1969 11A New Pile Force Gauge 11 (To be published)
Kallstenius T amp Bergau W 1961 1In Situ Determination of Horizontal Ground Moveshyments11 Proc 5th Int Conf on Soil Mech a Found Eng Paris Vol I pp 481-485
5allstenius T amp Wallgren A 1956 11 Pore Water Pressure Measurements in Field Investigation Swedish Geotech Inst Stockholm Proc No 13 58 p
Wager O 1969 11 A New Device for Measuring Vertical Distribution of Settlements 11 (To be published)
98
-----
---
-------- -
Contribution to the discussion in the Specialty Session on Negative Skin Friction and Settlements of Piled Foundations
Negative Skin Friction for Long Piles Driven in Clay
by Bengt H FeUenius Swedish Geotechnical Institute Stockholm Sweden
The aim of this discussion is to inform about further developments of the test program that is presented in the paper 11 Negative Skin Fri~tion for Long Piles Driven in Clay11 by myself and Dr Bengt B Broms
The paper shows that driving of displacement type piles in clay causes remoulding of the surrounding clay and excess pore pressures The excess pore pressures dissipated after about 150 days The recorded further settlements 150 days after the pile driving were within the accuracy of the settlement gauges i e 1 mm
The loads in the piles increased almost linearily with time (Fig 1) There is however a slight decrease of the loading rate The loads at the bottom of the clay layer were 52 and 56 tons in piles P I and P II respectively 420 days afterthe installation Fig 2 shows the load distribution in the piles Gauge M 4 in pile P II indicates that the load is resisted by positive friction in the silt and sand layers below the clay Of the 46 tons which has been the load increase since the installation only 10 tons reached the pile tip
The negative friction after 420 days corresponds to 28 of the average original undrained shear strength of the clay or to 9 of the average effective overshyburden pressure
FORCE tonbull
~ ~00~
oo-- M~ ~
lt-- ~
-~------- _ - _----
In the next phase of this investigation which will begin smiddot10rtly a dead load of 80 tons will be placed on each test pile In phase three (after further six or ten months) a 2 m high gravel fill will be placed around the two test piles over an area 40 by 40 meters The results of the various test phases will be published by the Swedish Geotechnical Institute
LEGEND ---WbullM o pio ( bull1 -- Ld dltt~von
1-1 Plo-lmo10i Pbull 1gt1bull rololaquo b n~ u of ltWtbull otlor drn
bull
-1 - I
7 bull
Fig 2 Vertical distribution of load at different times after driving
- --- ~------middot--- bull-- __-_-___ I-______ [____ _bull---- C------------------~-----------l---_j-____j_____j______j__ OJYS AFTER - 50 lOO 150 200 250 lOO 350 lOO 511 $00 DRIVING
Fig Recorded loads in piles P I and P II
Contribution to the discussion in the Specialty Session on Negative Skin Friction and Settlements of Piled Foundations
Design of Pile Groups middotwith Respect to Negative Skin Friction
by Bengt B Brems Swedish Geotechnical Institute Stockholtn Sweden
This review is concerned with the methods which are used in Sweden to design pile groups with respect to negative skin friction Measurements have shown that drag forces negative skin friction) develop along single piles or pile groups when the soil settles with respect to the piles The settlement of the soil may be caused by the placement of a fill around the piles a lowering of the ground water table or by remolding of the soil during the driving The load increase due to negative skin friction often approaches the allowshyable load on the pile when the pile length exceeds 20 to 30 m The negative skin friction can be large even if the settlements are small (a few millimeters) Three different cases are gcinerally recognized as illustrated in Figs ia ib and 1c
Fill ~ E bull cV ~middot II I II =-- ------- ---
Clay I --1 -----~- ~~aJlo51 I _cru19 _cnu9sc I
I I I I
~_permoler ~ aroo
(o)Olso I (t Cose II (cJ Caso m
Fig i Calculation of negative skin friction
Case 1 The piles in the pile group shown in Fig ia are assumed to be widely spaced The height of the fill placed around the pile group or the lowering of the ground water table is large enough to develop the maximum skin friction along all the piles in the pile group It is assumed furthermore that the piles are point bearing and that the pile points do not move when the load in the piles is increased by negative skin friction This is generally the case in Sweden where most piles are driven to rock The neutral point is often assumed to be located close to the pile point since the compression of the pile is generally neglected The negative skin friction resistance will be overestimated by this method if the settlements are small or the pile points move
There are two different methods to calculate the negative skin friction which is assumed to act along the full length of the pile The first method is generally used when the liquid limit of the soil is less than about 50 The negative skin friction c is according to this method calculated from the neg equation cneg = a (f J where a 11 is a coefficient and
ltfi is the effective overburden pressure includingV
the weight of the fill In this case it is thus assumed that negative skin friction is propertional to the effective overburden pressure (f i The values of the coefficient a1 which vary befween O 2 to 0 3 are based on test results reported by Johannesen and Bjerrum (1965) These values have 1e_~n derived from pile load tests in a clay with a relashytively low cp-ratio and a low liquid limit
In the second method which is often used when the liquid limit of the clay exceeds approximately 50 it is assumed that the negative skin friction c is equal to the adhesion of the surrounding neg soil with respect to the pile surface The values which are used to calculate the negative skin friction are generally the same as those which are used to calculate the bearing capacity of single piles in clay as indicated by the following table
Table I Evaluation of the unit skin friction resistance ca
(a) cult 0 5 kpcm2
Skin-friction resistance C a
Steel piles 05 C u
Concrete piles 08 C u
Timber piles 10 C u
(b) cgt 0 5 kpcm2
2Steel piles 0 1 kpcm Concrete piles o 3 Timber piles 05
One may question if the same values of the unit adhesions should be used to calculate the negative skin friction as those used in the calculations of the bearing capacity The maximum value of the adhesion governs the negative skin-friction resistance while the minimum value is of interest when the bearing capacity is calculated It may be argued that all piles which are affectetj by negashytive skin friction smiddothould be designed to resist a drag load which corresponds to the full undrained shear strength of the soil as measured by e g vane tests unconfined compression tests or fallshycone tests instead of a reduced value which correshysponds to a lower limit of the adhesion
Case II It is assumed in Fig 1b that the piles are closely spaced and that the height of the fill or the lowering of the ground water table are sufficiently large to mobilize the full skin friction resistance or the full shear strength of the soil along the perimeter area of the pile group The average skin friction cneg piobably will be less than the undrained shear
strength of the soil The perimeter of the pile group partly follows the pile surfaces The undrained shear strength of the soil is generally used for the perimeter area which follows the undisturbed soil while reduced values are used for the area which follows the surfaces of the piles The pile group carries also the weight of the fill which is located immediately above the piles or the increase of the boyant weight of th_e soil within the pile group when the ground water table has been lowered It is thus assumed in the calculations that the vertical effective stress in the soil within the- pile group will not at the level of the rock surface be affected by a lowering of the ground water table The total drag force is as~umed to be equal to the sum of the negative skin friction along the perimeter area and the weight of the fill within the pile group This total drag force is distributed equally among all the piles in the pile group It may however be argued that the change of the boyant weight of the soil within the pile group should not be included in the calculations since the total weight of the soil is not affected This is frequently done by many designers
Case III The piles in Fig 1c are relatively closely spaced and the height of the fill or the lowering of the ground water table is moderate to small In this case it is assumed that the pile group carries a load which corresponds to the weight of the fill within the area indicated in Fig 1c The sides of the inverted truncated soil cone have a slope of 1 3 to 1 5 The proceedures used by different designers differ due to lack of test data If settlem~nts are caused by a lowering of the ground water table it is often assumed that the total drag force corresponds to the change of the boyant weight of the soil below the area indicated in Fig 1c The pile group will in this case carry a load which is equal to the weight of a column of water with a height equal to a lowering of the ground water table
It should be pointed out that the available test data are extremely limited that measurements primarily have been made on single piles and that the settleshyments which have occured around the instrumented piles have been relatively large When additional test data become available it is likely that the presently (1969) used design methods will be changed It should however also be pointed out that these design methods generally do not take illto account the increase of negative skin friction which is caused by remoulding of the soil during driving middotThis inshycrease of the pile loads can be very large in Cases II and III For these cases the calculated negative skin friction is normally moderate
There are several methods to calculate the allowshyable load for a pile group allow as indicated below
group0 group ult Qneg
( I)Qallow F
Qgroup group ult
0 --p-- Qneg (2)allow
In the first case the safety factor Fis -applied on both the calculated ultimate bearing capacity of the pile group as well as on the negative skin friction Qnegmiddot In the second case the factor of safety is
only applied on the calculated ultimate capacity The first method which is normally used in Sweden gives a higher allowable load than the second method
The consequenses of exceeding the ultimate capacity of the pile group are often not serious since excessive pile loads caused by the negative skin friction will generally not cause collapse of the supported strucshyture If a pile group settles then the negative skin friction changes into positive skin friction which will contribute to the bearing capacity of the pile group Thus a relatively low safety factor can be used with respect to negative skin friction
References
Johannessen IJ and Bjerrum L (1965) Measureshyment of the compression of a steel pile to rock due to the settlement of the surrounding clay Proc 6 Int Conpound Soil Mech a Found Engng Vol Z pp 261-264
NEGATIVE SKIN FRICTION ON PILES IN CLAY-A LITERATURE SURVEY
Bengt H Fellenius Swedish Geotechnical Institute Stockholm Sweden
Introduction
In 1965 lhe Axel Johnson Institute for Industrial Research in cooperation with the Swedish Geotechnishycal Institute initiated an investigation on negative skin friction on piles in clay The work is supported financially by the Swedish Council for Building Research
The first step in this investigation was a literature survey This article is a survey of papers which have been published on negative skin friction in clay up to the end of 1968
Contents
1 Statement of the problem
2 Previous investigations
2 1 Structural damage caused by drag forces
2 2 Cases where drag forces have been
considered
2 3 Research on drag forces on piles
2 4 Comments on section 2
3 Calculation of drag forces
3 1 Terzaghi and Peck
3 2 Zeevaert
3 3 Buisson Ahu and Habib
34 Elmasry
3 5 Johannessen and Bjerrum
3 6 Brinch Hansen
3 7 Others
4 Comments and conclusions
5 Literature index
6 List of symbols
1 Statement of the problem
When the soil around a pile settles shear forces are induced along the pile surface and the load in the pile is increased Usually this phenomenon is called negative skin friction In cohesive materials the terms 11 negative skin cohesion and 1negative skin adhesion 11 are sometimes used
2 Previous investigations
Under this heading some cases where negative skin friction has caused structural damage (2 1) are deshyscribed as well as cases where negative skinfriction has been taken into account in the design (2 2) Also the research on drag forces in piles is reviewed (2 3)
2 _Structural damag~ caused 1Y dras-forces
McKay_(1938Jx) describes how a fill around a buildshying which had been founded on concrete piles caused large settlements around the piles The piles were not designed to carry the resulting drag forces and the piles failed No calculations were given by McKay McKay also describes how piles for a river quay in 10 m depth of water were damaged by drag forces caused by a fill of a silty material which had been deposited around the piles Negative skin friction developed both in the silty fill and in the underlying materials through which the piles had been driven
Florentin and l~Heriteau (1948~ describe a case where concrete piles with 0 8 m diameter were driven through a 4 m thick fill and through undershylying layers of very soft clay into a dense sand sublayer The piles settled 30 cm in three yearsmiddot which according to Florentin and lHeriteau 11 can only be explained by negative skin friction on the piles 11 The settlement of the piles was indirectlybull
caused by unsatisfactory pile driving The settleshyment stopped when the pile tips reached the undershylying dense sand
Moore (1949) describes a case where a wooden pile had been driven through a stony fill and underlying compressible soils down tc firm layer The thickshyness of the fill was 13 m and the compressible soils
x) See literature index in section middot5
2
consisted of a 9 m thick layer of mud and 6 m of clay The settlements of the fill and of the compressible layers caused drag forces of such magnitude that the pile pulled loose from the supported structure The design pile load had been determined from i dynamic pile formula The pile might have been damaged during the driving) The drag forces as estimated by Moore were 170 tons for the fill and 12 tons for the mud and clay
Milner (1957) describes a tunnel which was founded on 40 cm diameter cast-in-place concrete piles The piles were driven through 8 m of soft clay into an underlying layer of mica An 8 m thick fill caused settlements in the clay which resulted in estimated drag forces of 80 tons Because of this additional load the piles were pushed down into the mica and the tunnel walls cracked
lt-pp_ (~i~~)_ relates in a letter that settlements of about 2 m caused drag forces of such magnitude around unreinforced concrete piles under the floor of a hangar building at La Guardia Airport New York that some piles were pulled loose from the floor Attempts were made at La Guardia to measshyure the drag force by measuring the force that was required to prevent the pile from sinking When this force reached 30 tons the pile failed in tension
Further examples are given by Chellis (1951)
2 2_ Cases_ where drag forces have been considered in the desipoundn
Golder and 5pence t1960) mention that piles for a bridge where large drag forces were expected were covered with half an inch thick layer of asphalh The piles were put down in predrilled holes in the ground to protect the asphalt
Resendiz_l1964 a[ describes a case where concrete piles of variable diameter were used one upper part (~ 35 cm of about 30 m length) and one lower part (lt6 20 cm of about 3 m length) The piles were driven to a firm sand layer The allowable pile load was the estimated ultimate bearing capacity of the pile tip i e the safety factor against soil failure was equal to 1 When drag forces on the piles were caused by the settlement of the ground the pile tips were pressed down into the sand layer and thus the building on the piles settled at the rate of the ground surface The tests have been described in detail by Resendiz (1964 b)
Girault ( 1964) describes the difficult pile foundation problems in Mexico City These problems are caused by the lowering of the ground water level and the resulting large regional settlements Buildshyings which are founded on end-bearing piles appear to rise with respect to the ground and buildings on friction piles settle unevenly because of large drag forces on the piles Girault has proposed a comshybination of friction piles and end bearing piles (See fig 2 2 1) When the friction piles (A) sink load is transfered through the soil between section oC - cl and section (3 - (3 on to the end bearing piles (B) A building founded on this piling system will accordshying to Girault settle evenly at the same rate as the ground surface
Further examples can be studied in papers by f-e_ev-)5_lJp]_~ )_c(~ 7)_b_)_~~i _(tJJ 2_s_O_ea_ ~196_1 _and Locher_ 1965
--middot
Firm rond subloy(r
Fig 2 2 1 Combination of friction and end bearing piles A= friction pile B = end bearing pile
2 3 _Research on draG forces on p-les
GantL St~pbens and Moulton (19581 describe tests on steel pipe piles which were equipped with electrical strain gauges The purpose of the tests was to determine the allowable pile load for a bridge foundation The soil consisted of 7 m of sandy fill 10 m of silt and a sublayer of sand The piles were of 30 m length and were thus driven about 12 m down into the sand Drag loads of about 90 tons were measured four months after the driving of the piles
Tchebotarioff_li 958) in the discussion following the article by Gant et al indicated a few possible errors in the measurements and pointed out that only a part of the measured axial pile forces could have been caused by drag forces
Weele t1964) describes a case where the drag forces acting along wooden piles of different lengths have been determined Three piles were driven at a spacing of 4 m down to a depth of 13 3 m (No 1) 15 5 m (No 2) and 17 5 m (No 3) The soil consisted of 6 m of sand 7 m of clay and a sand sublayer which at a depth of 17 m was very firm The ground water level in the area was initially 1 m below ground surface In an initial phase the ground water level was lowered 6 m and in a second phase an additional 3 m This caused settlements in the soil and the piles were dragged down See fig 2 3 i
Along the upper part of the piles the settlement in the soil was larger than the settlement of the piles and drag forces were developed along this part of the piles In the lower part the settlements were smaller than those of the piles and thus positive skin friction was obtained along the surface of the piles
----------------------------------
-----------------
3
TIME IN DAYS1~s~RPbbJo~se~l~~ollldllpgtbb~o5er~~===~--ae-
10 10
os 1 O
-20 ___
~ ~
30 - TESTPI LE 3
1-1-1-1 1
o I I I I TEST PILE 1
u 50 ~ I I -r-1 z
60 TESTPI LE 1
-k I 70 ROIINn CURFAC - 80 I-
90
Fig 2 3 1 Settlement-time relation for the ground surface and the 3 test piles during the two stages of the ground-water lowering (After Weele 1964)
From pulling tests on concrete piles the average shear stress along the pile surface were determined as a fW1ction of the pile displacement The maxishymum resistance was obtained at a displacement of about 10 mm The magnitude varied for the three types ot soil
In the upper sand layer 3 tm2
In the clay 1 5 tm2
In the sand under the clay 20 tm2
From these results the drag forces on the piles were calculated The total drag load on pile No was estimated to 24 tons
2 4 Comments on the reviewed cases
Drag forces on piles can be large and cause piles to settle This may damage the supported structures However in the literature on drag forces on piles no reference has been found of the influence of negative skin friction on piles which have been driven to a very firm layer Severinsson_(1965) reportes that no settlement has been observed for 300 structures in Sweden founded on long high quality precast concrete piles driven to rock or to similar layers through settling soil layers
The magnitude of the negative skin friction given by Weele may be compared with the values reshycommended by Tomlinson (1963) for the calculashytion of drag forces along piles
Clay and sitt o 7 3 tm2
Very stiff clay 5 20 tm2
Loose sand 4 tm2
Dense sand 3 7 tm2
In the same paper Tomlinson mentiones that drag forces middotsan be caused by the remoulding and heave of sensitive clays during E]e driving as is shown in Fig 2 4 1 This effect has also been discussed by among others ~~S~S~1-9~ (1_9_3_2J 931Il]1_i1-g_S_l~a_l _lf 9_4_8)2 _ _s_cp_e_~~~fj_(_1J1J] and Zeevaert 1949 1
Heaved-up soil reconsolidating under own weight causing dra o n on piles
Fig 2 4 1 Effects of ground heave on groups of driven piles in clay
3 Calculation of drag forces
Under this heading the existing theories for detershymining drag forces are reviewed
3 1_ Terza_ghi and Peck Ji948 recommend the following method for determining drag forces on pile groups The soil around the piles consists of a compressible layer of clay and a surcharge causes the clay layer to settle The axial force (F) on a pile group is then the sum of the structural load (F ) and the drag force (F ) The drag force itself0is equal to the sum of the 1ampeight of the fill within the pile group (F~) and the skin friction F~) along
the perimeter of the pile group F~ is divided equally between the piles can according toF 11
Terzaghi and Peck vary bet~een zero and the maximum value calculated from equation 3 1 3
F = F + F t F 11 x) 3 1 1Q n n
Structional load on the pile
Weight of fill carried by one pile
F =~bullmiddotHF 3 1 2 n n
A Area of the pile group
n Number of piles
HF= Thickness of fill
Y Unit weight of the surcharge material
F 11 = load caused by settling of the surshyn rounding clay
F11~ S 3 1 3 n n
c Circumference of pile group
HL = Thickness of clay layer
T Average shear strength of clay
4
To reduce of the magnitude of the negative skin fricshytion Terzaghi and Peck recommend that the distance between the piles should not exceed Z 5 pile diashymeters
3 2_Zeevaert_(_1959J states that the ultimate point bearing capacity of piles which have been driven through compressible soil to firm sand layers can be calculated from the equation
3 2 1
Failure load (soil failure)
A factor which is a function of the angle of internal friction (-p) and the relative density of the sand (Dr)
N = N middot (D + O 1)r q r
Nq is a function of ltP It is assumed that the shearing strength is fully mobilized on the surface of failure
a Pile area
p h = Effective vertical soil0
pressure in the sand at the pile tip
The failure load F B depends on the effectiwovershyburden soil pressure at the pile tip When the soil settles the vertical pressure poh is reduced to
pvh by load being transfered to the pile (Fig 3 2 1)
Thus the failure load FB is reduced to F~
z
fig 32 1 Reductionmiddot of th~ effective vertical pre~sure
The middotshear force in the soil along the pile is accordshying to Zeevaert a_function of p
0
3 2 2
is the ratio between the horizontal anq the vertical pressuie in the soil at the pile surface and
tanip is the bullratio between the horizontal pressure against themiddot pile and the shear force along the pile
When p is reduced to p the shear strength is also0
reduced This is a basi~ assumption for Zeevaeres ~athemtical d~riv~ng of the following formulas
The total drag force is derived at
3 2 3
where n= Number of piles per unit area
i_ e-mz)= ( 1 - 3 2 4Pv m
i (1 - e-mh) 3 2 5Pvh = m
m= n UK tanip 3 2 6 0
This approach to negative skin friction is mainly dependant on the validity of Eq (3 2 1) and (3 2 2) These equations do on some occasions not agree with experimental facts as shown for example by Vesic_l1964J Furthermore it is doubtful whether Eq 322 is valid in clay
Zeevaert s approach refers to large pile groups of piles The equations can not be used for a single pile without making certain assumptions about the load distribution around the pile
de _Beer _lt 967) has developed Zeevaert s approach and has published nomograms that simplify the use of the equations In the case of a surcharge on the ground surface de Beer assumes that the area ffecting the single pile is equal to the base area
a 90deg cone with the height equal to the depth of the settling layer
3 3 Buisson Ahu and Habib 1960) have studied theoretically the stress distribution along a pile which has been driven into a compressible clay Settlements of the compressible layer are caused by a fill placed on the ground surface The pile tip rests on sand
The following equation is given (See Fig 3 3 1)
F point F Q + F~ + r middot V middot Z - r V middot H-Z) 3 3 1
where FQ F and F t are defined in Fig 3 3 1 n po1n
u 3 3 2F~ = O 30 2
the term 0 30 is a 11friction coefficient11
which can be compared with K bull tanip0
unit weight of fill
u perimeter of pile
T shear strength of clay
z depth to the neutral point i e the depth along which the dr~g forces act
5
settlement z difference
pile-soil H
_neutral point
Fig 3 3 1
The distance Z to the neutral point can be detershymined by calculating the pile compression and the soil compression separately by iteration procedure The tip of a pile which has been driven to bedrock or to a similar very firm layer does not move when loaded The neutral point must in this case be very close to the pile tip due to the low compressibility of the pile Thus the last term in the equation (3 3 1) is small and can be neglected
34 Elmasry (1963-has tested 80 cm long model Steeff)ffeS~-WhlCh-were provided with strain gauges The piles were driven through a 50 cm thick layer of silty clay which was mixed in a soil mixer beshyfore it was placed in the test cylinder The pile tips were located in a sand layer A load was applied on the cla)- surface through a plate The forces in the model piles were measured for different loading conditions Elmasry derived from the test results an equation to calculate the drag force The maxishymum value of the drag force was found to be proshyportional to
the consolidation pressure from the surface load (pc)
the pile perimeter (U)
the thickness of the clay layer (H)
the ratio between the dry weight of soil per horizontal unit area and the consolidation pressure
the natural water content (w)
The maxilnum value of the drag force was a linear function of these parameters taken separately Comshybining these functions Elmamiddotsry derived the following formula
Fn=Fn-s+0416middot (2middot pcmiddot Hmiddot U 2
O 70 middot middot
w p3 ___c) 3 4 1
15 1d
F is the drag force due to the consolidashyn-s tion of the clay under its own weight This dr1g force can be calculated from the following equation
H T bull dH = U middot H middotTFn-s=JUmiddot -middotp-s p-smean0
is given as 30 of the shear strength of the clay at the final stage of consolidation Elmasry referes to Zeevaert (1957 a)
3 5 Johannessen and Bjerrum (1965) describe reSUlfitfiOffi-teSfs-oii-tWOSteeipliis 47 cm in diashymeter with a length of about 60 m which were driven to bedrock through a layer of clay of about 50 m thickness
After the piles were installed a fill with a height of about 10 m was placed around the piles A slide in the underlying clay disturbed the tests and results were obtained from only one of the two test piles The deformations caused by drag forces were measured on this pile through a system of rods Since the modulus of elasticity of the steel material was known the average shear stress s along the pile surface could be calculated The shear stress corresponded to the equation s = p bull K bull tanP
0
The measured drag load at the pile tip exceeded the ultimate bearing capacity of the pile tip
The tip penetrated 6 cm into the underlying rock This penetration occured slowly and in short steps At each increment the pile was partly unshyloaded The drag force decreased momentarily
The largest calculated value of K bull tanP was O 20 which corresponded to a total pilf shortening of 2 5 cm The calculated total maximum drag load was 300 tons On the basis of these results Bjerrum and Johannessen recommend that the calculated drag loads on piles in loose marine clays should correspond to 20 of the final effektive vertical pressure in the clay i e
K bull tanO = 0 20 0
F = 4-u Sbull dz= o20Ju- pmiddot dz 3 5 1 n J
0 0
3 6_Brinch Hansen_(1968) has investigated thellretishycally the skin friction on piles in general and applied the results on negative skin friction Brinch Hansen derived the following equation
3 6 1s -47 +6~-1Jii-n=bc-
s = shear force (negative)
p surface load per unit area andor pore pressure d~crease in the soil
D pile diameter
b distance between piles in a group
----------------
6
Equation (3 6 1) gives an upper limit of the negative skin friction Brinch Hansen states that the maxishymum negative friction is also governed by the maxishymum pull out resistance of the pile The theoretical expressions for the pull out resistance are given in the paper
Brinch Hansen applied Eq (3 6 i) on the pile tests reported by Johannessen and Bjerrum Chapter 3 5 above) An extremely good agreement was obtained between measured and calculated drag load This agreement may only be a coincident as is pointed out in the paper
3 7 Other studies
Other theoretical studies of negative skin friction have been published by Yokowo et al (1968) and p_op~~~-ltsectL~_l1J_6_8J It is assume_cf in these studies however that both the soil and the pile material are purely elastic These assumptions limit themiddotpractical application of the theories as soil and especially the soft clays in Sweden do not behave elastically These studies have therefore not been cited here
4 Comments and conclusion
Certain assumptions and extensive simplifications must be made as to the soil conditions when applyshying the equations bymiddotBuisson et al and Elmasry on practical cases Since the calculated drag forces are to a large extent dependent of these assumpshytions it is difficult to estimate the accuracy of the proposed methods
When tr1e negative skin friction is calculated according to the method proposed by Terzaghi and Peck it is difficult to choose the value of to be used in the calculation of F It is far from certain that shear is fully developJld along the full perimeter area of a pile or a pile group The value of T deshypends also on the remoulding of the soil during the pile driving and on the resulting reconsolidation of the soil
In Zeevaert s theory the shear force along the pile depends on the resulting overburden pressure in the soil after unloading Part of the overburden is transferred to the pile and will depend on the coefficient K middot tanlp These factors vary with the soil conditioJgts and the method of pile installation However very little is known about how negative skin friction is affected by these factors
Johannessen and Bjerrum base their recommendashytion on the results from a single test pile in loose marine clays in Norway Their equation (Eq 3 51) is simple and can easily be applied on practical cases As mentioned above the general validity of this equation remains to be proved However the equation is the only one that is derived from an actual field test
Before any definite recommendations can be given the parameters which affect the skin friction such as soil conditions soil characteristics and magnishytude of the consolidating pressure must be evalushyated in the field and in laboratory Especially full scale tests should be of value Furthermore it
will be essential to investigate the effects of pile driving and the rate of soil settlement upon the magnitude of the shear forces
Once the maximum drag load can be evaluated the important question of how this drag load affects the behaviour of the pile and how it can be taken into account when designing the actual pile founda tion remains to be answered Fellenius (1964) has proposed for a point bearing concrete pile driven in underconsolidated clay (in southern Sweden) that a drag force corresponding to the original undrained shear strength of the clay should be assumed to act along the pile surface down to a maximum depth of 20 m or for piles shorter than 40 m only along half the length of the pile The sum of the drag load calshyculated in this way the maximum design load and the weight of any fill located within a pile group should not exceed the ultimate strength of the pile section i e about O 65 of the cube strength
This literature survey indicates that drag forces can cause piles to sink with fatal results when the piles are supported by sand strata or any material in which the piles can penetrate Local experience will on many occasions indicate whether a proposed design will be safe or not When high design loads are used or the driving conditions are severe a more thorough penetration of the problems will be required
5 Literature index
Brinch Hansen J (1968) 11A theory for skin friction on piles 11 bull Danish Geotechnical Institute Bulletin No 25 pp 5-20
Buisson M Ahu J and Habib P 1960) 11 Le frottement negatipound 11 Annales de Institute Techshybull
nique de Batitment et des Travaux Publics No 145 Paris 18 pp
Casagrande A 1932) 11 The Structure of Clay and Its Importance in Foundation Engineering 11 Procbull
of the Boston Soc of Civil Eng Val 19 No 4
bullChellis RD (1951) npile foundations 11 McGraw Hill Book Co New York 1951
Correa JJ (1961) uThe Application of Negative Friction Piles to the Reduction of Settlement11
bull
Proc Fifth International Conference on Soil Mechanics and Foundation Engineering Paris Vol II pp41-44
Cummings A E Kerkhoff G D and Peck R B (1948) 11 Effects of Driving Piles into Soft Clay 11
bull
Proc ASCE Val 74 pp 1553-1563
de Beer E (1966) 11 Berekening van de negatieve wrijving op palen 11 bull Tijdschrift der openbaren werken van Belgie No 6 1966 p -29
Elmasry MA 1963) 11 The Negative Skin Fricshytion of Bearing Piles 11 bull Ph D Thesis at Swiss Federal Institute of Technology Ztirich 115 pp
Fellenius Bror (1964) 11Aktuella pcllningsproblem 11 bull
Nordisk J~rnbanetidskrift nr 6 1964 pp 156- 162
7
Florentin J and 1-Heriteau G (1948) 11 About an Observed Case of Negative Friction on Piles 11
bull
Proc Second International Conference on Soil Mechanics and Foundation Engineering Rotterdam Val V pp 155-156
Gant E Stephens J and Moulton L (1958) 1Measurement of Forces Produced in Piles by Settlement of Adjacent Soi1 11 bull Highway Research Board Bulletin 173 Washington D C pp 20-37
Girault P (1964) 11 A New Type of Pile Foundashytion11 Proc Conference of Deep Foundation Mexico City dee 1964 16 pp
Golder H Q and Spence RA (1960) 11 Engineershying Properties of the Marine Clay at Port Man B C 11 bull Proc 14th Canadian Soil Mechanics Conshyference 1960 p 133
Johannes_sen IJ and Bjerrum L (1965) 11 Measurement of the Compression of a Steel Pile to Rock due to Settlement of the Surrounding Clay 11
bull
Proc Sixth International Conference on Soil Mechanics and Foundation Engineering 48 pp 261-264
Kapp M S (1965) Letter to the author dated Nov 1st 1965
Locher H G (1965 ncombined Cast-In-Place and Precast Piles for the Reduction of Negative Skin Friction Caused by Embankment Fill 11
Proc Sixth Int Conpound on Soil Mech a Found Eng 414 pp 290-294
McKay GA (1938) 11 Discussion on Soil Reactions 11 bull Trans ASCE Val 103 p 1220
Meyerhof G G (1959) 11 Compaction of Sand and Bearing Capacity of Piles 11 bull Proc ASCE Val 85 SM No 6 pp 1-30
Milner R P 1957) Discussion on Session 6 Proc Fourth International Conference on Soil Mechanics and Foundation Engineering London Part 3 pp 201-202
Moore WW (1949) 11 Experiences with Preshydetermining Pile Lengths 11 Trans ASCE Val 114bull
pp 366- 367
Poulos H G and Mattes N E (1968) 11 The anashylysis of downdrag in end- bearing piles due to negashytive friction 11 bull Univ of Sydney Australia Research Report No 91 p 16
Severinsson S (1965) 11 Praktiska erfarenheter av rationell stodpllning med prefabricerade beshytongpillar11 Tidning for Byggnadskonst Arg 57 nr 12 p 565
Restlndiz D (1964 a) 11 Estudio de campo sabre pilotes de concreto reforzado 11 Rev Ingenieriabull
Val 34 No 1 pp 101-110
Resendiz D (1964 b) On a Type Point-bearing Pile through Sinking Subsoi1 11 bull Proc Conference on Deep Foundations Mexico City dee 1964
Terzaghi K and Peck R B (1948) 11 Soi1 Mechashynics in Engineering Practice 11
New York 1948 pp 473-474
Tomlinson MJ (1963) 11 Foundation Design and CorlStruction 11 Pitman amp Sons Ltd London ppbull
308 376 and 394
Tschebotarioff G (1949) 11 Discussion middoton Effects on Driving Piles in Soft Clay 11 Proc ASCE Valbull
75 pp 671-676
Tschebotarioff G 1958) 11 Discussion of Measureshyment of Forces Produced in Piles by Settlement of adjacent Soi1 11
bull HRB Bull 173 pp 37-43
Weele A (1964) 11 Negative Skin Friction on Pile Foundation in Holland 1 bull Proc Symposium on Bearing Capacity of Piles Roorkee India febr 1964 10 pp
Yokowo Y Yamagata K and Nagaoka H (1968) non negative skin friction acting on a pile-group11
bull
Trans of the Architectural Institute of Japan No 150 August 1968 pp 51-57
Vesic A S (1964) 11 Investigations of bearing capacity of piles in sand Proc North Am Conpound on Deep Foundations Mexico City
Zeevaert L (1949) 11 Discussion on Effects of Driving Piles in Soft Clay 11
bull Proc ASCE pp 661-668
Zeevaert L (1957 a) 11 Compensated Friction-pile Foundation to Reduce Settlement of Buildings on the Highly Compressible Volcanic Clay of Mexico City11
bull
Proc Fourth International Conference on Soil Mechanics and Foundation Engineering London Val II pp 81-86
Zeevaert L 1957 b) 11 Foundation Design and Behaviour of Tower Latino Americana in Mexico City ceotechnique Val VII Sept 1957 pp 115-133
Zeevaert L 1959) 11 Reduction of Point-bearing Capacity of Piles Because of Negative Friction Proc First Panamerican Conference on Soil Mechanics and Foundation Engineering Sept 1959 Val III pp 1145-1152
Zeevaert L (1963) 11 Foundation Problems Related to Ground Surface Subsidence in Mexido City11 Fieldbull
Testing of Soils ASTM Special Technical Publ No 322 pp 57-66
----------------
----------------
8
7 Symbols
General
volume
weight
safety factor
Stress and strain
p effective vertical soil pressure
original effective vertical soil pressure
decreased effective vershytical soil pressure
consolidating pressure callsed by overburden
5 shear force
T shear strength
shear strength after conshysolidation
T = 0 30 middot (p-s s
Soil classification
w water content in of dry weight
Y unit weight
1 effective unit weight
Y unit weight of solid particles5
Yd dry unit weight
p angle of internal friction
Dimensions
B width
L length
H depth thickness of soil layer
z depth coordinate A certain value of z writes h
Pile symbols
D pile diameter (side)
u pile perimeter
a pile area
Z depth to the neutral point
axial force in pile
structure load
failure load
drag force
F~ drag force in or from fill
F drag force caused by soil settling around a pile
C perimeter of the polyhedron surrounding a pile group
A area of the polyhedron surrounding a pile group or the fill area affecting the pile
n number of piles in a pile group
n number of piles in a pile group per unit area
the ratio between the vertical and the horizontal soil pressure
m = n U bull K tanip0
acc to eq 3 2 6
NUCLEAR RADATION IN CONSTRUCTION CONTROL OF EARTH AND ROCKFLL DAMS RADATONS NUCLEARES DANS LE CONTROLE
DE LA CONSTRUCTION DES BARRAGES
l BERNELL CE and KASCHERMANCE Swedish State Power Board Stockholm Sweden
SYNOPSIS
During the later years the nuclear radiation technique has been widely used in soil investigation in order to deshy
termine certain characteristic properties of soils Principally the development in this field has been concenshy
trated on methods for determining the moisture content in soils and the density conditions in situ and in comshy
pacted embankments whereas very little attention has been devoted to the possibility to apply the new techshy
nique to other fields of soil- and rock mechanics (Bernell and Lindbo 1 1965) In connection with the design and
construction of several earth and rockfill dams the Swedish State Power Board has developed the nuclear radiashy
tion technique for solving many problems in the construction control The experiences thus obtained have reshy
sulted in reliable and simple methods for determining settlem~nts in earth and rockfill embankments and for
controlling the effect of grouting 10 soil and rock These applications of the nuclear method are briefly deshy
scribed in the following
USE OF NUCLEAR METHODS FOR MEASURING
SETT FMENTS
For determining the vertical movements in compacshy
ted earth and rockiills the telescoping pipe device
ith the horLrnntal crossarms is often used This
measuring method has also been applied to Sv edish
dams but experience has shown that it has many
disadvantages (Bernell 1964) In ~mbankments
which have been filled according to the wet-compacshy
tion method the horiLontal movements often become
so large that the pipes break off Another drav -back
is that the pipes and the crossarms must be installed
during the construction periods ltnd thus frequently
cause trouble during the filling operations
In most of the dams constructed by the State Power
Board as rell as by other poer companies in Sweshy
den during the later years the nuclear method was
chosen for determining the simultaneous settlements
at different elevations in the fills (Bernell 1967) 60According to this method a radioactive isotope Co
is placed in the measuring point and the radiation
from the isotope is determined by means of a Geiger-
Milller detector Generally the measurements are
carried out in a steel pipe protected from the surshy
rounding soil by an elastic pipe casing The location
of the isotope is indicated by a peak value in the rashy
diation intensity and thus the elevation of the meashy
suring point can be determined
xperience has shown that the nuclear method can
asily be applied to settlement measurements in
both soil and rockfill embankments Generally the
isotopes are placed in the fill close to the pipe and at
different elevations Fig l shows a typical diagram
from settlement measurements in an earth and rockshy
fill dam In this case the measuring section included
both the core and the rockfill zones Long term meashy
surements in this and many other dams have proved
that the method is very simple and reliable The
accuracy in the results is also very good about 1 cm
at a depth of 100 metres
285
BERNELL and SHERMAN
Upstream rockfill Moraine core Pipe I Pipe II
+215 - - II I I
1-- ~Measuring pipe 1 ~
11 5
I I f
-I I I I
I --210
Height of fill
I
I -Reservoir level
110 I I
I I I
205 -Isotope I
I I I I
105 I I I I
I r I I I
E 200 C
I I I I
I I -
100 I I I I
C 0-
r-- J
I r bull J 0 gt bull
w 195 ~
Igtlt--I I
I I
195
I I
I -- ~
I
I I I
190
185
-
I I
J
I I I I I
---- 190
185
Ilt
I I I -I
I I
I -I I -I -~ -
I I
I
I
i I
----7
-- ---
I I I -~ _J I
I L - -1
180 1965 1966 1967 1968
1N I 1965 1966 1967 1968
II 220E
C Upstream
200rC
~
1aoL bull 0 gt
w 160L e
Fig 1 Settlements in an earth and rockfill dam determined
by means of nuclear measurements
286
NUCLEAR RADIATION IN CONSTRUCTION CONTROL
Since themiddot installation and the maintenance of the
pipes often cause difficulties with regard to the filling
works a modified method for performing the meashy
surer9-ents has successfully been applied The meshy
thod is based on the fact that the range for the radiashy
tion in a soil is relatively large also for very small
quantities of the isotope In a recently completed 60
dam small quantities of Co were placed directly
on the compacted surface within an area of 2 x Z
metres and with a spacing of o 25 metres After
completion of the filling works measuring holes
were drilled down to the surface with the isotopes
Although the holes had to be drilled to a depth of
about 30 metres the measurements could be
successfully executed
The nuclear method is also of great value for detershy
mining additional settlements in natural soil strata
beneath supporting foundations
In this case the isotope is placed in a mechanical
shot-device which is inserted in the pipe after
drilling of the hole By means of the shot-device the
isOtope can be placed in the soil at any desired depth
This method can be applied to many cases in foundashy
tion engineering1 where it may be of special interest
to obtain reliable data concerning the compressibishy
lity and the settlement conditions in the underground
middotrn construction control it is often desirable to arshy
range the measurements in such a way that both the
vertical and the horizontal movements can be detershy
mined by using the same installations For measurshy
ing horizontal movements the strain gauge inclinoshy
meter is generally used (Kallstenius and Bergau
1961) By choosing the diameter of the pipe so that
the pendelum can be inserted in it the same pipe
can be used for both vertical a1d horizontal meashy
surements This combination of measurements has
successfully been applied to the control of the stashy
bility oi slopes
USE OF NUCLEAR RADIATION IN GROUTING
CONTROL
Most of the dams constructed in Sweden during the
later years are situated within the mountain region
in the northern part of Sweden The soils in this
area commonly consist of moraine deposits from the
last ice age Because of geological processes the
composition of these deposits is very irregular and
generally they contain both impervious moraines
and lenses of pervious sediments Therefore conshy
struction of dams in this region often involves diffishy
cult foundation problems especially in cases where
the dam has to be founded on partly permeable deposhy
sits
Because of the erratic soil conditions1 foundation
grouting in the dam site is almost always need-ed in
order to reduce the underseepage after the rise of
the reservoir level But very often it may be a mashy
jor problem during the construction stage to decide
the extension of the gIouting works Sometimes the
need for grouting becomes apparent only ater the
reservoir has been filled and in such cases the founshy
dation must be grouted through the dam embankment
This method has certain advantages but evidently
the grouting operation must be carefully controlled
because of the risk of cracking and eroding the soil
in the foundation Ir order to eliminate this risk the
State Power Board has applied the nuclear radiation
method to the control of grouting operations The
method is based on investigations of the radiation
in soils compacted to various porosities
At a recently completed dam founded on natural
moraine deposits leakage occurred under the founshy
dation after the rise of the reservoir level The seashy
ling measures included the performance of a grout
curtain extending through the existing pervious soil
layers beneath the foundation and down into the undershy
lying faulty rock The thickness of the permeable
layers was about 5-6 metres and in order to reach
these layers the bore holes had to be drilled from
the crest and through the dam core to a depth of
about 20 metres It was also conside1middoted necessary
to protect the bottom layers from possible erosion
caused by leakage water flowing through cracks in
the rock For this purpose the grout curtain had to
be extended to a depth of 10 metres below the rock
surface after completion of the soil grouting
After drilling the grout holes the nuclear density
probe was used for determining the initial porosity
of the soil strata overlying the rock From these
287
BERNELL and SHERMAN
15-----------------~---~--------------
-------- ====o~
en shy+shya
E 20-+-----~----=-----+---------+-------t c v Ground water level
c ~ Q a
0
Rock
CD Radiation curve before grouting __ -middotmiddot- after 1st grouting __ __ _ __ _ 2nd
25---------------_______________ so 1QQ 1so 200
Radioti on in countssec
middotFig 2 Radiation curves measured in foundation
soils under a dam
288
NUCLEAR RADIATION IN CONSTRUCTION CONTROL investigations it was found that the soils located
immediately above the rock surface were pervious
and contained cavities whereas the overlying soils
in the contact zone against the dam foundation conshy
sisted of impervious moraines As a result of this
investigation it was decided to grout the holes in
stages from the rock surface up to the bottom of
the dam
After completion of the soil grouting secondary
holes were drilled through the foundation to a depth
of 5 metres in the rock Before the rock grouting
was begun these holes were measured with the nushy
clear density probe for controlling the effect of the
soil grouting From the measurements combined
with the results of the conventional water pressure
testing valuable informations were obtained conshy
cerning the effect of grouting and also on many
other factors which influence the grouting procedure
in soils
Fig 2 shows a typical radiation diagram for a bore
holeJ drilled for grouting the foundation soils beshy
neath the dam I~ this case both the bottom layers
and therock were so pervious that the first grouting
did not stop the flow of ground water into the bore
hole Therefore additional grouting was needed for
sealing the pervious zones
The same method was used for controlling the rock
grouting and also in this case interesting results
were obtained concerning the grouting procedure
Therefore it is believed that the nuclear method
will be as valuable in the grouting technic as it is
in many other fields of soil and rock mechanics
REFERENCES
1) BERNELLJ L and LINDBO T Test of air
leakage in Rock for Underground Reactor Conshy
tainment Nuclear Safety 1965 V0l 6 No 3
2 BERNELL L Measurements in the Messaure
Dam a Rockfill Structure with Wet-Compacted
Core Eighth Congress on Large Dams Edinshy
burgh 19~4 Vol II Page 317
3) BERNELL L Construction of Rockfill Dams unshy
der Winter Conditions Ninth Congress on Large
Dams Istanbul 1967 Vol IV Page 161
4) KALLSTENIUS T and BERGAU W In Situ Deshy
termination of Horizontal Ground Movements
Proc Fifth Intern Conpound on Soil Mechanics and
Foundation Engineering Paris 1961 Vol 1
Page 481
289
MAIN SESSION 5 SEANCE PLENIERE 5
STABILITY OF NATURAL SLOPES AND EMBANKMENT FOUNDATIONS STABIUTE DES TALUS NATURELS ET DES FONDATIONS DE REMBLAIS
ChairmanPr4ident D H TROLLOPE (Australia GenClal Reporter Rapporteur G6n~el A W SKEMPTON (ElIQ1ahd1 Auociata RoportuRapportcur Adjoint J HUTCHINSON (England)
Members of the PanclMembros du Groupe do Discuuion L 8JERRUM (Norway
H BOROWICKA (Aut1ralia) B BROMS ISwodenl
R C HIRSCHFELD (U S A) C KENNEY (Canadol
Panelist B BROMS
lntroduction
Several large landslides have occurred during the last 20 1ears in the densely populated GtHa River Valley located in the southwestern part of Sweden (Fig 1) Among these the landsUdes at Surte (Jakobson 1952) and at Gtita (Odenstad 1958) can be mentioned In the G6ta River Valley flows the Gtita River which is one of the largest rivers in Sweden The G6ta River is also an important waterway Approximately 4 milj tons oi freight is annually transported on the river In the river valley are located several hydroshyelectric plants The river servea ilao aa water supply for Gothenburg the main seaport of S y-den with approximately 500000 people Two main high~ ways follow the G6ta River Valley The highways are in many places located close to the river Also one railroad line ia located in the valley and baa in some cases been affected by landslides
385
SEANCE PLENIERE 5
Ps wh~re art5a11 prusur1 hobull bH11 oburvet
~) ArtaJ w1 quck clays
SeVert bullrcs011
~ rorEBORG
Fig 1 The Glaa River between Trollhattan and Gothenburg Gtsteborg)
Landslides in the Gtsta River Valley can have Vfry serious consequences A landslide canfor examplP disrupt the boat traffic in the river iriferfere with the operation ofthe hydroelectric plants and pollute the river water (Several large chemical plants are located at the river and oil storage tanks have been built close to the river Two oil tanks collapsed e g during the slide at G6ta)
Landslides in the G0ta River Valley
Scars after old landslides can be seen almost along the whole river especially in the northern part of the valley above Lilla Edet In Fig 2 is shown scars after landslides at Utby (Fig 1)
About 20 slides have here taken place within a distance of about 2 km Several slides have also occurred along the Slump River a tributary to the G6ta River
Scars after a large old landslide can also be seen at Jordfallet (in English 11 Earth fall) located about 2 km upstream of Surte (Fig 1) The scar has a length of about 300 m and reaches iliout 1000 m from the river
One of the largest recorded landslides occurred in 1648 at Intagan located approximately 4 km south-
River
Seo le 0 1000 m L-1-1-LJLJ
Scar otter londsl1de
Fig 2 Landslides at Utby
west of Troilhattan (Fig 1) About 54 acres were affected by the slide and at least 85 people lost their lives Another relatively large landslide which probably was triggered by an earth quake took place in 1759 at Bondestr5m when approximately 400000 m 3 slid into the Gtsta River
The landslide at Surte occurred in 1950 The direct cause of the slide is uncertain but the vibrations from the pile-driving for a small house have been dicussed as one possible factor as well as the vibrations from a train which passed the aren just before the slide The length of the slide area was about 600 m and the width about 400 m The total
3volume was 4 million m Within the slide area lived about 375 people in 31 houses One person lost his life during the slide A major highway and a railroad line which crossed the slide area were damaged The total damage caused by the slide was estimated in 1952 to $ 2 000 000
The landslide at Gtita occurred in 1957 Several large buildings belonging to a paper mill were located within the slide area which was about 1500 m long and 300 m wide Three workers were killed of the 200 which were within the slide area The total cost to restore the river channel after the slide was approximately $ 2 000 000
Geologic History
The Gtlta River Valley was formed by erosion during several glaciations along prequaternary fissured zones in the underlaying bed rock of gneiss The bottom of the valley which is filled with loose sediments is located up to 100 m below the present sea level The maximum thickness of the sediments is about 100 m (at Gothenburg) The thickness of the sediments in general increases downstream The area was covered during the last glaciation by ice with a total thickness of 2 000 to 3 000 m During the last glaciation the valley floor was partly covered by a thin layer of heavily preconsolidated moraine (till) with a total thickness less than 1 to 2 m The moraines are generally covered by glacifluvial and marine sediments The average grain size of the sediments decreases generally towards the ground surface and downstream the river The glacifluvial sediments (sand silt and clay) and the moraines have in many places been reworked by waves
386
MAIN SESSION 5 ~----~--~h--u---rn-----h---~s----~w-------0
Soil m ) stre19th tf tvty conlbulln1 frac14
Btuegroy to groy clay wrootholes
Dork gray
mottltd
clay (stght- 1 ly bonded l
2~ I
Gray cloy
Dork groy mottled cloy
legend -
-
6 O 0 80
28
30
115
deg 27
165
Swldish 192 tall-cone tlsl 205
135
332
3D
190
130
122
Swedish lollmiddot cone tnt I--- Plostc lmt
Field vone tut --1 Lqud tmt
Wotor ccntent
Fig 3 Soil conditions at Utby
The location of the shore line has changed considerashybly since the last glaciation due to changes of the sea level and the general land uplift At the end of the glaciation the sea level at Gothenburg was located 95 m above the present sea level and 128 mat Lake Vanern The present rate of land uplift is 2 mm year downstream at Gothenburg and 2 5 to 3 mm year upstream at the Lake Vanern The gradient of the G6ta River is thus increasing by about 1 mm year A typical soil profile of the clay layer at Utby (Fig 1) is shown in Fig 3 (The clay is underlaid by sand with a thickness of more than 10 m)
Th~ lower parts of the marine clay sediments which generally are stratified are of glacial age The clay middotcontent varies generally between 50 and 60 Organic content of the glacial clay is low Varved silt can frequently be found close to the bottom layer of sand
The upper parts of the marine sediments consist of late- or postglacial clays The particle size is smaller than that of the underlaying glacial clay The clay content varies generally between 60 and 70 The dominating clay mineral is illite The organic content (11 gyttja and organic sulphides) is relatively low but increases downstream the river The glacial as well as the late- and the postglacia1 clays are located just above Casagrandes 11A 1-Jine
The post-gl~cial clays have a stiff upper crust with a total thickness of 1 to 1 5 m The thickness i~creases upstream the river The dry crust is d1sected by vertical desiccation cracks with a thickshyness varying between 1 and 6 mm
Alluvial sediments can frequently be found close to the river The silt and organic contents of these sediments are generally high Their maximum
thickness is about 7 m
High artesian pressures have been measured in many places in the sand and silt layers as shown in Fig 1 The water pressures are related to the amount of rain fall in the area Seasonal variations of the ground water table of 1 to 2 m are not unusual (Pore overpressures of 7 m with respect to the present ground surface has been observed) The pore overpressures are generally highest in the bottom layers and decrease towards the ground surface
The glacial and post-glacial clays are generally normally consolidated except for the stiff dry crust at the ground surface The shear strength increases generally linearly with depth Just below the dry crust the shear strength varies between O 5 and 1 O metric tonsm2 in the downstream fart of the valley and between 3 and 4 metric tonsm in the upstream part of the valley
The following relationship has been found for Swedish clays between undrained shear strength Cu liquid limit wL or fineness number wF (Karlsson 1961) and effective overburden pressure a~ (Hansbo 1957)
cu = 045 wLov
Thus the shear strength increases as a rule linearly with increasing liquid limit (or fineness number) and with increasing effective overburden pressure The shear strength of the normally consolidated clays in the Gota River Valley is in some places higher than that predicted by the relationship proposed by Skempton (1954) or by Hansbo 1957 when the sensitivity of the clay is high (Karlsson amp Viberg 1967)
The angle of internal friction as determined by _drained direct shear tests is approximately 22 a 23deg A higher angle of internal friction is generally obtained with drained triaxial tests than with drained direct shear tests (Osterman 1960 Brink 967) The true angle of internal friction (Gibson 1953) varies generally between 18deg and zoo (Karlsson amp Pusch 1967)
The sensitivity of the clay in the GOta River Valley is frequently high The sensitivity of the Swedish clays is normally about 10 to 20 but the sensitivity ratios as high as 500- 700 has been measured by the fall-cone test (Karlsson 1963) north of Utby Often a relatively large amount of work is required to remould the clays from the GOta River Valley Clays from the GOta River Valley are therefore not as sensitive to vibrations or other mechanical disturbances as clays which can be remoulded easily
S6derblom (1969) has suggested to distinguish between rapid quick middotclays and slow quick clays (a clay is classified as rapid quick when a relatively small amount of work is required to remould the clay while the term slow quick is used when the amount of work is relatively large) Clays with a sensitivity ratio larger than 50 are in Sweden defined as quick clays if the fall-cone test is used to detershymine the undisturbed and the remoulded shear strength of the soil
The high sensitivity of the clays in the GOta River Valley can partly be explained by a reduction of the
387
------- ----
SEANCE PLENIEAE 5 salt content due to leaching and diffusion However infiltration of organic substances (e g humus) hav~ probably also cortributed to the high sensitivity of
the clays The salt content of quick clays is always low but the salt content Of clays with low sensitivity ~ay ~~ry between wide limits Sl5derblom ( 1969) has 1denhfaed a large number of organic substances in pore water with dispersing properties
I- ~ig 4 is shown the relationship betweeio conducshytivity (vt) and the sensitivity (S ) of a clay from a bore hole located close to Utby Fig 1)
- lmmodolbullI) alrr tArr01 --- Ac towotaon lo lobdol)
Srsmly Hyfi m 2()Q JOO co
_ lt
middot ----- I ( -
vr--
) s t OoNn
Fig 4 Relationship between conductivity and sensitivity
The conductivity which is directly proportional to the salt content was determined with a salt sounding tool (Saderblom 1957) The shear strength of the undisturbed and of the remoulded soil was determined by the Swedish fall-cone test in the field immediately after the sampling and in the laboratoshyry approximately two weeks after the sampling It can be seen that no relationship exists in this case between conductivity (salt content) and sensitivity when the salt content is low In fact the highest sensitivities were found at the levels where the salt content was the highest
The sensitivity is however affected by the time after sampling The sensitivity determined two weeks after the sampling was approximately half the sensitivity immediately after the sampling The reduction of the sensitivity was caused mainly by a reduction of the undisturbed shear strength of the clay
In Fig 5 is shown a microphotograph of a quick clay ~ram Lilla Ed~t The shear strength of the clay 1s about 2 tm and the sensitivity about 150 The thickness of the section is 500 A Investigashytions have shown that the microstructure of quick clays is characterized by an extremely open three dimensional network of particles and particleshygroups (Karlsson amp Pusch 1967)
Soil Exploration
The stability conditions in the G5ta River Valley has
0 SA Sealbull
Fig 5 Microphotograph of a quick clay from Lilla Edet (R Pusch)
been investigated extensively The sounding machine type SGI (Fig 6) and the Swedish weight sounding device have been used to determine the thickness of the individual soil layers and the depth to the firm bottom layers
Fig 6 Sounding machine type SGI
The sounding machine type SGI (Kallstenius 1961) records automatically the penetration resistance of a 10 cm2 cone as a function of depth as the cone ismiddot pushed down into the soil The skin friction resisshytance is automatically subtracted from the total resistance and only the point resistance is recorded by the machine This type of penetrometer is much more rapid than for instance the weight sounding test and can be used to detect e g sand and silt seams as shown in Fig 7
The undisturbed shear strength of the clay has been determined in situ with the so-called iskymeter (Kallstenius 1961) and with vane tests and in the laboratory by the Swedish fall-cone (Hanabo 1957) or by unconfined compression tests The iakymeter records the pull-out resistance of a foldable anchor plate which is pulled out of the ground by a wire The anchor plate is driven into the soil folded and unfolds when the plate is pulled With the iskymeter sand or silt seams can be detected as shown in Fig 8
388
MAIN SESSION 5
Storie
M3 Noom stopped
Fig 7 Penetrometer record
I SurfaiesiJ
C-ycrus I
-
----==--Coy orid s11 1
-middot--- ---i
Ckiy I melrl
1000 kg = Fig 8 Iskymeter record
The shear strength determined by the iskymeter agrees relatively close with the results from vane teats in clays with normal sensitivity (Osterman 1960) A good agreement has also been found beshytween fall-cone and field vane tests except when the sensitivity of the soil is high
The vane type SGI is provided with shield or with a shroud which protects the vane blades during drishyving The shield also prevents clay from adhering to
the blades when the vane is driven through the stiff dry crust The test results indicate that clay which adhere-a to the vane blades can appreciably lower the measured shear strength especially when the sensishytivity of the clay is relatively high
Soil samples have been taken with sampler SGI type IV (Kallstenius 1958) and by the Swedish standard piston sampler (Swedish Committee on Piston Sampling 1961) The area ratio of the Swedish standard piston sampler is low Samples have been taken every or every second meter in depth
The Swedish foil sampler has been used in a few cases to check the layer sequence and to locate slip ~urface in slides In Fig 9 is shown two cores from the slide at GOta The location of the slip surfaces can clearly be seen on the photograph
Fig 9 Location of slip surfaces in cores
Pore pressures have been measured hydraulically by pore pressure gauges of type SGI (Kallstenius amp Wallgren 1956) The coupling device of the gauge makes it possible to check the functioning and the accuracy of the gauges cturing long time mtasureshyments These gauges are therefore especially suited for control of pore pressures The gauges along the GOta River are as a rule read every second month
Lateral displacements (creep) have been measured with an inclinometer of type SGI (Kallstenius amp Bergau 1961) at locations where the slope stability has been especially low With this device it is often possible to measure lateral displacements with an accuracy of about 1 to 2 mm for a length of 10 m
The salt content of the clays has been determined at a large number of places by measuring in situ the electrical resistance of the soil with a salt sounding tool as mentioned above (Soderblom 1957 1958)
389
SEANCE PLENIEAE 5 Tlie electrical resistance is measured between two isolated steel rings which are placed at the tip of a sounding rod The tool is driven into the ground with standard equipment The salt contentwhich generally is low close to the ground surface increases with depth and reaches often a maximum value at the middle of the profile The salt content at the bottom layers is generally low due to leaching It has been possible in many cases to locate slip surfaces with this device In Fig 10 is shown the record from a salt sounding at Glita which was carried out 14 days after the slide (S6derblom 1969)
$1p ~rtraquon lthKJltod 1~ ffl mpi
Jsl---1--+----lt
~1----gt-+-------j
Fig 10 Location of slip surface with the salt sounding tool
A sudden jump in the resistivity curve shows the location of the slip surface The actual location was later checked with cores obtained with the Swedish foil sampler
Attempts have also been made to locate slip surshyfaces in quick clays with field vane tests This method has not been successful since the thickness of the disturbed zone where the shear strength in the soil is reduced by remoulding has been small (less than a few centimeters)
Slide Mechanisms
The large slides in the G5ta River Valley are generally retrogressive rotational or retrogressive translational They have as a rule been triggered by a relatively small initial local slide A number of parallel ridges can often be Seen within the area after a slide The landslide at Glita started as a small local slip close to the river In the morning of the slide a crack which was 130 m long was observed approximately 20 to 30 m from the river The crack widened slowly and the final slip occurred 3 hours after the crack first was detected The slide spread upstream the river and in the direction from the river (Odenstad 1958) The slide at Surte initiated however at some distance from the river and the slide then spread gradually towards the river and backwards to the side of the
valley The duration of the slide was at Surte about 3 minutes and the maximum speed of the slide was less than o 9 msec
A number of local slide can be seen in Fig 11
Fig 11 Local slides along the Glita River
The small initial slide is generally caused by erosion of the river bank and by changes of the ground water level by vibrations from traffic pile driving or by earth quakes The small local slides are mainly confined to the part of the river located above L6d6se (Fig 1) where the height of the river banks exceeds several meters
The erosion processes have accelerated during the last 50 years partly by the construction of dams and hydroelectric plants along the river and partly by the heavy ship traffic on the river The erosion of the river banks seems to increase rapidly with the size and speed of the ships Some bottom erosion has taken place downstream of Lilla Edet at the places where the river bottom consists of cohesionless soils Of course a certain erosion has also been caused by the general land uplift (2 mmyear at Gothenburg) This erosion is relashytively small since the land uplift is small Over a very long time period this bottom erosion can however be appreciable and contribute to the general lowering of the stability of the slopes
Method of Analysis
It is not possible to predict accurately with presentshyly available methods if a small local slide will develop into av large catastrophical slide The stability of a number of small local slides have been analysed by the total stress method(~= 0-analysis) and by the effective stress method (c ff -analysis) (Bishop 1955) The total stress anSlysis which is based on results from field vane tests gave nominal safety factors which are close to one with respect to available and mobilized shear strength of the soil (G6taHvkommittCn 1962) Safety factors of the same magnitude were obtained from an effective stress analysis if the results from drained direct shear tests and triaxial tests are used in the analysis The cohesion c determined by drained direct shear test has not been reduced in the calculation Both circular and other shapes of the failure surfaces have been investigated
390
MAIN SESSION 5
Also sections where slides have not occurred have been analysed by the total and the effective stress methods The results from these calculations are shown in Table 1
Table 1 Safety factors calculated by total and effective stress analysis
Location Total stress Effective stress analysis analysis
Intagan - Torp
2345 1 18 1 30 23 72 1 02 1 03 23 82 107 103 2688 - 2752 - 1 1 - 1 1
StrBms Lock
3701 1 0 I 0 37 11 1 1 10 3733 1 0 10
Lilla Edet
34 5 - 35 8 14-15 I 3 1 5
Agnesberg - neberg - 1 5 1 3 1 5
Also in this case a good agreement was obtained between the two methods
The stability of the normally consolidated clay in the GOta River Valley is generally evaluated by the total stress method (~ = 0-analysis) mainly due to the simplicity of this method A total stress analysis reflects the stability of a slope with respect to sudden changes of the applied load and to gradual changes of the undrained shear strength of the soil by e g leaching It is believed that a total stress analysis to a certain extent can be used to investishygate if a small slide will cause a large secondary slide (The initial slide causes a sudden change of the stress conditions in the remaining soil without a change of the water content) Erosion of the river banks often occurs rapidly due to large variations of the water level and the heavy boat traffic in the GBta River The change of the stress conditions by the erosion will generally cause an increase of the pore pressures in the slope due to the high senstivi~ ty of the clay and the high value of the pore pressure coefficient A Dissipation of excess pore pressures and changes of the water content of the clay take place verg slowly due to the low permeability of the clay (10- to 10-10 cmsec) It is believed that changes of the stability conditions by such rapid changes of the stress conditions is better reflected by a total stress analysis than by an effective stress analysis In this case a total stress analysis will give a lower safety factor than an effective stress analysis The limitation of a total stress analysis is however the evaluation of the average undrained shear strength of the soil It ia known that anisotroshypy and the direction of the stress increase (Bjershyrum amp Kenney 1967) and thus the test method will affect the measured shear strengths
The undrained shear strength determined by the field vane or by the Swedish fall-cone test are used in the calculations as mentioned above The shear strength determined by vane tests agrees as a rule closely with the cone values because the cone test has been calibrated against the vane teat If the
sensitivity of the soil is high and the sampling depth is large the vane shear strength is however frequently higher than the cone strength because of the disturbance of the soil samples
The actual shear strength is probably higher than the vane or cone values For normally consolidated clays the shear strength along horizontal planes is often higher than along vertical planes This differshyence in shear strength is probably compensated by the strength decrease caused by time
The shear strength used in the calculations is reduced when the liquid limit or fineness number of the clay is larger than 80 or the soil is organic A reduction coefficient of O 9 is often used for slightly
organic clays O 8 for organic clays and silts O 7 for clayey or silty 11 gyttja and 0 6 for peat and 11gyttja 11
( 11 Gyttja 11 is an organic soil of post-
glacial or recent age) Analysis of old slides which have occurred in organic soils with a high liquid limit has indicated that a reduction is required
In Sweden normally a safety factor of at least 1 4 to 1 5 is required with respect to the undrained reduced shearing strength of the soil in areas where the stability conditions can be changed by the construction of e g buildings and roads close to the river or by erosion In areas in the GCgtta River Valley where the stability conditions are supposed not to change in the future and where structures are not located close to the river a nominal spfety factor of 1 3 is generally considered satisfactory In some cases a safety factor as low as 1 2 has been allowed I safety factors of 1 3 to 1 2 are found it is important to protect the slopes from erosion and to prevent buildings to be constructed near the river or to deepen the river channel by e g dredging Where the factor is lower than the above mentioned the actual stability has been increased by about ten per cent through unloading of the river bank by excavation
An effective stress analysis (cff-analysis) is espeshycially valuable to check the stability conditions in the Gata River Valley when gradual changes of the loading conditions or of the pore pressures are expected It is often difficult to predict the magnishytude of these changes Furthermore there are some difficulties in the evaluation of the coefficients ~- and c which are used in an effective stress analysis These coefficients are affected by volume changes during the drained triaxial and the direct shear testsby rotation of the principal stress directions and to a minor extent by the intermediate principal stress There are also some questions about the value of the parameter c to be used in the analysis The parameter c is not reduced at present since a reduction leads to unreasonable results (If a reduced value is used in the calculations then large parts of the Gata River Valley are not stable according to the calculations)
Slope Protection
The slopes along large parts of the GCgtta River do not satisfy the safety requirements mentioned above Therefore extensively remedial works have been or are being carried out along the river By protecting the alopea from local slides it is believed that the
391
SEANCE PLEN1EAE 5
o Excovotion ot top of
slope
Excavation
d Driving of piles
piles
b Flattening of slope
e lowering of ground water level
c Fill ot toe of slope
-
Fig
f Erosion
12 Stabilizatior of slopes
protection
slopes will also be safe against large landslides
The remedial works can be separated into three major groups To the first group belong all methods which tend to decrease the nominal average shear stress along potential slip or failure surfaces The average shear stress can be decreased e g by excavating the soil at top of a slope by flattening the slope by placement of a fill at the toe of a slope or by raising the water level in the river as illusshytrated in Fig 12 a through c To this group belongs also strengthening of the slope with piles (Fig 12 d)
The second group includes methods which tend to increase the shear strength of the soil along potential slip surfaces The shear strength of the soil can be increased e g by lowering the pore pressures by drainage or by pumping (Fig 12 e To the third group belong methods which prevent a decrease of the slope stability by e g erosion Erosion can be prevented by a reversed filter at the toe of the slope as illustrated in Fig 12 f
The method chosen at a particular location is dependent of the local conditions such as the height and the slope of the river banks the presence of permeable layers in the soil the average shear strength of the soil and of the erosion
It is generally much more effective to remove part
of the soil at the top of the slope as shown in Fig 13 than to flatten the slope or to place a fill at the toe of the slope
A fill at the toe of the slope is often partly located below the water level where only the boyant weight of the fill is effe_ctive
13 Increase of slope stability by excavation at top of slope
392
MA1N
Fig 14 Slide caused by the driving of pile~
Piles are seldom used to increase the slope stability except when the space at the top of the slope is restricted by an adjacent road or by buildings However the driving of piles may temporarily decrease the slope stability by the remoulding of the soil or by the lateral displacement of the slope towards the river A slide caused by pile driving is shown in Fig 14 In this case the lateral displaceshyments and the resulting shear deformations of the soil were sufficiently large so that the peak strength of the soil was exceeded Broms amp Bennershymark 1968)
If the sensitivity of the soil is high the reduction of the shear strength at large lateral displacements can be large However due to the relatively high clay content of the clay in the G5ta River Valley the reduction of the shearing strength is generally moderate Experience has showlil that the lateral displacement and the strength reduction is decreased if the row of piles located close to the river are driven first
The ground water pressure can generally only be middotlowered where silt or sand layers are present in the soil In areas with artesian pressures the ground water pressure can be lowered with bleeder wells In all other cases the ground water pressure can only be lowered by pumping However a lowering of the ground water pressure causes settlements and may cause wells in the area to go dry
The erosion protection is often combined with a flattening of the slopes to prevent local failures as mentioned previously An erosion protection consists generally of a 2 m thick layer of rock fill which is placed by dumping (Fig 15)
SESSION 5 The fill is not compacted The maximum particle size is at least 15 cm Only the sections where the erosion at present is very active is protected However a change of the local conditions (e g a change of the maximum water flow or of the ship traffic) may change the areas affected by erosion
Slide warning systems have been installed by the Swedish State Railways (s J ) The warning system consists of a thin electric wire with a tensile strength less than 110 lb which is placed in the ground in a zig- zag pattern as illustrated in Fig 16 at a depth of 1 0 m The train traffic is stopped automatically when the cable oreaks
r 30m f JOm 30m I 30m 30m 1 30m j 30m
Eloctrnol conlocl
Eleetr~ coble (ma~imum hniale slre11glh of 10 lb)
Post wh1et1 1gtrou11ts -----gt-u d1s1gtlacombulllll cf
lht cohto Whf-11 slrbullkhod
Fig 16 Slide warning system type Swedish State Railways
Twice each year the G5ta River Valley is inspected by personal from the Swedish Geotechnical Institute The erosion of the river banks is followed with aerial photographs The erosion of the river bottom is checked by soundings Also the construction of new buildings storage tanks the placement of fills etc cloa-e to the river is controlled by the Institute
REFERENCES
Bishop A W 1955 11 The Use of Slip Circles in the Stability Analysis of Slopes Geoshytechnique Vol 5 No 1 pp 7-17
Bjerrum L amp Kenney T C 1967 0 Effect of Structure on the Behaviour of Normally Consolidated Clay11 Proc Geotechn Conpound Oslo Vol 2 pp 19-27
Broms BB amp Bennermark H 1967 11 Shear Strength of Soft Clay 11 Discussion Proc Geotechn Conpound Oslo 1967 Vol 2 pp 118- 120
Gibson R E 1953 Experimental Determination of the True Cohesion and True Angle of Internal Friction in Clays Proc 3 Int Conpound Soil Mech a Found Engng Vol 1 pp 126- 130
GBtatilvkommittfn 1962 11 Rasriskerna i G5tatilvshydalen11 Statena Offentliga Utredningar 1962 48 Inrikesdepartementet Stockholm 160 pp
Hansbo S 1957 11A New Approach to the Determishynation of the Shear Strength of Clay by the Fall-Cone Test11
bull Proc Swedish Geotechn Institute No 14 Stockholm 47 ppFig 15 Erosion protection
393
SEANCE PLENIERE 5 Jakobson Bbull 19~2 The Landslide at Surte on the Ftirhandlingar Vol 80 No 1 Stockholm
GOta River 11 bull Proc Swedish Geotechn pp 87-96 Institute No 5 121 pp
Soderblom R 1969 Salt in Swedish Clays and Kallstenius T 1958 11 Mechanical Disturbances in ta Importance for Quick Clay Formation
Clay Samples Taken with Piston Satnplerz 11 Results from eome Field and Laboratorybull
Proc Swedish Geotechn Institute No 16 Studies 1 Proc Swedish Geotechn
75 pp Institute No 22 (in press)
Kallstenius T 1961 11 Development of Two Modern Osterman J 1960 Notes on the Shearing Continuous Sounding Methods 1 Proc 5 Int Resistance of Soft Clay Acta Polyshy1
Conf Soil Mech a Found Engng Vol technica Scandinavia Ci2 2631959 22 pp 1 pp 475-480
Swedish Committee on Piston Sampling 1961 11 Standard Piston Sampling Proc SwedishKallstenius T 1963 Studies on Clay Samples Geotechn Institute No 19 StockholmTaken with Standard Piston Sampler 11
bull Proc Swedish Geotechn Institute No 21 p 195 45 pp
Kallstenius T amp Bergau W 1961 11 In Situ Detershymination of Horizontal Ground Movements 11
Proc 5 lnt Conf Soil Mech a Found Engng Vol 1 pp 481-485
Kallstenius T amp Wallgren A 1956 11 Pore Water Pressure Measurement in Field Investigashytions11 Proc Swedish Geotechn Institute No 13 Stockholm 58 pp
Karlsson R 1961 Suggested Improvements in the Liquid Limit Test with Reference to Flow Properties of Remoulded Clays 11
Proc 5 Int Conpound Soil Mech a Found Engng Vol 1 pp 17 1- 184
Karlsson R 1963 11 0n Cohesive Soils and Their Flow Properties Swedish Geotechn lnatitute Reprints and Preliminary Reporta No 5 24 pp
Karlsson R amp Puoch R 1967 Shear Strength Parameters and Microstructure Characshyteriotico of a Quick Clay of Extremely High Water Content Geotechn Conf Oslo 1967 Vol 1 pp 35-42
Karlsson R amp Viberg L 1967 11 Ratio cp in Relation to Liquid Limit and Plasticity Index with Special Reference to Swedish Clays 11
Proc Geotechn Con Oslo 196( Vol 1 pp 43-47
Kjellman W Kallstenius T amp Wager 0 1950 11Soil Sampler with Metal Foila 11 Proc Swedish Geotechn Institute No 1 76 pp
Odenstad S 1958 11 Jordskredet i GOta den 7 juni 1957 11
Geologiska Ftireningens i Stockholm F6rhandlingar Vol 80 No 1 Stockholm pp 76-86
Skempton A W 1954 11 Discussion of the Structure of Inorganic Soil1 1
bull J Soil Mech a Found Div Proc ASCE Vol 80 Sep No 478 pp 19-22
S6derblom R 1957 11Some Investigationa Conshycerning Salt in Clay 11
Proc 4 Int Conf Soil Mech a Found Engng Vol 1 pp 111-115
S6derblom R 1958 11 Saltaonden och desa anvindshyning vid beatamning av skredbottnen vid GOta bull Geologiska FOreningens i Stockholm
394
VIBRATORY COMPACTION OF COHESIONLESS SOILS
by Bengt B Broms and Lars Forssblad
reprinted from
Proceedings of Specialty Session 2 Soil Dynamics
Seventh International Conference on Soil Mechanics and Foundation Engineering
Mexico City Mexico August 1969
VIBRATORY COMPACTION OF COHESIONLESS SOILS
Bengt B Broms and Lars Forssblad
Bengt B Broms is Director of the Swedish Geotechnical Institute
A graduate of Chalmers Institute of Techshynology in Gothenburg Sweden he received his MS and Ph D degrees from the University of Illinois
From 1959- 1964 he was Associate Professor at Cornell University and he now lectures at the Royal Institute of Technology
He has published widely on the properties and behavior of reinforced concrete members and concrete piles characteristics of soils and soil-structure interaction
He has served on the American Concrete Instishytute Committee on Concrete Piles and the ACI- ASCE Committee on Reinforced Concrete Columns He is presently a member of the Swedish Geotechnical Society committees on Laboratory Testing and on Soil Exploration Bengt B Broms
Lars Forssblad is Research Manager of AB Vibro- Verken in Solna Sweden
He received the degrees of Civil Engishyneer and Doctor of Technology from the Royal Institute of Technology in Stockholm
I~ Before joining AB Vibro-Verken he was active for ten years in design and supervision of dam and water power construction in Sweden
He is author of the publication Invesshytigations of Soil Compaction 21_ Vibrashytion
Lars Forssblad
I INTRODUCTION tons was developed by Losenhausenwerk as early as 1933 This vibrator had a variable frequency between 10 and 25 cps and a maximum depth effect
Vibratory soil compaction was first studied and of 2 0 to 25 m (Muller amp Ramspeck 1935 applied in Germany during the 1930 s (Loos 1936) Ramspeck 1937) Losenhausenwerk also designed A self-propelled caterpillar- type vibrating at about the same time a self-propelled 1 5 plate compactor with a total weight of about 25 ton vibrating plate compactor
101
The vibroflotation method where heavy internal vibrators in combination with jetting are used to compact cohesionless soils to large depths was also developed in Germany during the 1930 s (Schneider 1938)
Other types of vibratory soil compactors were developed during the 1940amp such as tractorshydrawn and self- propelled vibrating rollers multiple plate compactors and vibrating tampers (rammers) as described eg by Garbotz (1958
Table 1 Different types of vibratory soil compactors
Surface vibrators
Type of machine Weight Frequency
Vibratine tampers (rammers)
tHand- guided 50- 150 kg about 10 cps (100-300 lb)
Vibratine plate compactors
Self-propelled hand-guided 50- 3 000 kg 12 - 80 cps (1 00-6000 lb )
Multiple-type mounted on 200- 300 kg 30 - 70 cps tractors etc (400- 600 lb)
Crane-mounted1) up to 20 ton 10 - 15 cps
Vibrating rollers
Self- propelled hand-guided 250- 1500 kg 40 - 80 cps (one or two drums) (500-3000 le) Self-propelled tandem- type 0 7- 10 ton 30 - 80 cps
Self-propelled driving 4 - 25 ton 20 - 40 cps rubber - tires
Tractor-drawn 1 5- 15 ton 20 - 50 cps
1) Used on a limited scal e
Self- propelled vibrating rollers are of three main types - hand- guided vibrating tandem rollers and vibrating rollers with two driving rubber- tires Tractor-drawn vibrating rollers with weights up to 15 tons and vibrating rollers with driving rubber- tires with total weights up to 25 tons are nowadays used
The use of vibratory soil compaction has inshycreased considerably during the last 5 to 10 years Vibratory soil compaction was initially used only for cohesionless soils (Lange 1940 Leussink 1951) Nowadays vibrator y compactors are also used to compact cohesive soils and asphalt surfaces The main applications are given in Table 2
The knowledge of the factors affecting vibratory compaction of soil i s still incomplete in spite of the extensive investigations which have been carried out all over the world s ince the 1930s The compaction of cohesionless soils is affected
102
1959) Erl enbach (1959) Kronenberger (1960) Leussink (1960) and Forssblad (1965)
Vibratory soil compactors can be classified as indicated in Table 1 Vibrating tampers are light hand- guided machines operating at a low frequency about 10 cps and with a large amplitude The types of self- propelled vibrating plate compactors which are most commonly used today weigh between 100 and 500 kg
Internal vibrators
Type of machine Diameter Frequency
Concrete vibrators
Manually operated or 5 - 15 cm 100 - 200 cps tractor-mounted (2 - 6 in)
Vibroflotation eguipm
Crane-mounted 23 - 38 cm about 30 cps ( 9 - 15 in)
eg by average grain size grain size distrishybution shape of particles water content pershymeability compressibility shear strength etc Also the properties of the vibratory compact or such as frequency nominal amplitude centrishyfugal force and total weight affect the comshypaction The descriptions of the soil and of the compactor in test reports and technical articles are usually very schematic
The many factors which affect the vibratory comshypaction make it difficult to draw general conclusions It is therefore important to study carefully the actual test and soil conditions before test r esults are applied to other conshyditions than those under which the tests were carried out
This report deals mainly with vibratory compacshytion of cohesionl ess soils but some data and results from investigations on rock fills and cohesive soils are given for comparisons
Table 2 Applications of vibratory soil compaction
Type of machine
Vibrating tampers rammers)
Vibrating plate compactors
Self-propelled hand-guided
Multiple - type
Vibrating rollers
Self- propelled hand- guided
Self-p ropelled tandem type
Self-propelled driving rubber-tires
Tractor-drawn
II ELEMENTS OF SOI L COMPACTION
The purpose of compaction is to improve the strength and deformation properties of soils The shear strength of cohesionless soils inshycrease while the compressibility and the pershymeability decrease with increasing density For example the angle of internal friction of sand or gravel increases with up to 12deg when the relative density increases from loose to dense
The compressibility of cohesionless soils is also affected by small changes of the density Compaction of a soil will often increase the equivalent modulus of elasticity as determined by plate load tests 5 to 10 times
The permeability is also affected appreciably by the relative density When the relative density increases from loose to dense the permeability of a uniform sand or gravel deshycreases by about 50 to 60 The change of the permeability increases with increasing coefshyficient of uniformity and with decreasing grain size (Taylor 1948)
The compaction of a soil is in most cases exshypressed by the relative compaction or by the relative density The relative compaction or the degree of compaction RD() is defined by
Applications
Street repair Fills behind bridge abutments retaining and basement walls etc Trench fills
Base and subbase compaction for streets side-walks etc Street repair Fills behind bridge abutments retaining and basement walls etc Fills below floors Trench fills
Base and subbase compaction for highways
Base subbase and asphalt compaction fo r streets sideshywalks parki ng areas garage dri veways etc Fills behind bridge abutments and re ta ining walls F i lls below floors T rench fi lls
Base subbase and asphalt compac tion for highways streets s i de-walks parking areas garage dr iveways etc Fills below floors
Base subbase and embankment compaction for highways stree ts parking areas air fields etc Rock fill dams Fills soil or rock) used as foundations for residenti al and industrial buildings
Base subbase and embankment compaction on highways streets parking areas air fields etc Earth- and rock fill dams Fills (soil or rock) used as foundations for residential and industrial buildings Deep compaction of natural deposits of sand
the equation
R = ~ x 100 (1)D Yd max
where y is the actual dry density (dry unit weight)dand yd maxis the maximum dry density determined by ~he Proctor compaction tests (standard AASHO modified AASHO etc ) or byshyvibratory compaction methods as illustrated in Fig 1
a b C
middot- -middotlt middotmiddotmiddot
Fig 1 Laboratory Compaction Methods a) Proctor Compaction Test b) Vibratory Compaction Test with Vibrating Table and Surcharge Load c) Vibratory Compaction Test with Vibrating Tamper or Hammer
103
--
The compactjon of cohesionless soils is often expressed by the relative density The relative density ID() of a soil with the void ratio e is definea by
X 100 ( 2)
In this equation emax and emin are the maximum and the minimum void ratio of the soil respectshyively The relative density is equal to zero when the soil is loose (e = emax) and 100 when the soil is dense (e = e in) For a soil with the dry density yd Eq (~J can be rewritten as
Ydmax (yd- Yd minl - X 100 (3)
Yd (yd max- Ydmin)
where Ydmax and Ydmin are the maximum and minimum dry density of the soil respectively
A vibratory compaction method for cohesionless free- draining soi l s has been developed by the Bureau of Reclamation (1963) This method has been approved as ASTM Standard D 2049 The maximum dry density is determined by vibrating the soil either saturated or completely dry for 8 minutes in a test mould under a surcharge load (Fig 1 b) The volume of the mould is 0 1 cu ft alternatively 0 5 cu ft
The maximum void ratio emax and the minimum density yd min are usually determined by pouring dry soil through a funnel into a Pr octor mould The funnel is generall y held 25 mm above the soil surface Soils with particles larger than 10 mm are generally placed with a scoop (Bureau of Rec l amation 1963)
The maximum density can also be determined by laboratory compaction tests using a vibrating hammer or a vibrating tamper working on the surface of the material (Fig 1 c) The method using a vibrating hammer nas been developed by the Road Research Laboratory in England (Parsons 1964 Odubanjo 1968)
The vibrating tamper method has been developed by Vibro- Verken (Forssblad 1965 1967) Accordshying to this method the soil is compacted in two layer s in a mould with 15 cm diameter Each layer is vibrated for 2 min The resulting maximum dry density is for saturated cohesionless soils about the same as that determined by the modi fied AASHO compaction test
The compaction water content has a different effect on the compaction of cohesionless free shydraining soils than on fine-drained cohesive soil s The water content of a free - draining soil decreases during the compaction if the initial water content is high while the water content does not change for fine-grained soils As a result the Proctor curve of f r ee-draining soils terminates near the maximum value (Fig 2) If a sandy or gravelly soil contains some silt or clay it is not free-draining and excess water does not drain out during the compaction The resulting compaction curve is regular as shown in Fig 2 by Curve 2 Cohesionless freeshydraining soil s very often have comparatively flat compaction curves as illustrated in Fig 2 by Curves 1 3 and 4 In some cases two maxima are obtained probably because of capillary
104
forces in the partially saturated soil
pcf tm
24 23
140 10 ~ 22 Ii- V~
2 1130 ~ 2J Icopy V ~ ii 120
[- --V ~ 19 ~ lltD middotc 18 I110
~ 17 - 0 Icopy
100 16 ~i-- -
15
90 14
1380
12 0 8 10 12 14 16 18 20 22 24
Water content percent
US standard sieve size 34 middotn Nobull No 40 N e 100 No 200 - Il 1-I- I I0i Ibull-0 iv-bull I I
I
~ ~T I1 II I
I
i I II 1 1 i I
II 1 I I I I~ 0_ III I-
I I I
I r- I 11 ~ 1 -r-- II I ~ I
II ~ lv 10 10 01 0 01
Groin size in millimeters
Fig 2 Compaction Curves Obtained with the Modified AASHO Method and Grain Size Distr ibutions for Different Types of Sandy Soils
Due to the compar atively flat compaction curves for free-draining soils and the fact that excess water can drain out during the compaction the water content of the soil is not as imshyportant for cohesionless free-draining soil s as for fine- grained soils The best compactionof sand and gravel is usually obtained when the soil is saturated or completely drybut a comparat i vely good compaction can frequently be obtained also when the soi l is part i ally saturated
Investigations by Bureau of Reclamation (1963) and others as well as practical experience indishycate that a soil usually can be characterized as free-draining if the content of fines ( soil particles with a diameter smaller than 0 06 or 0 074 mm) is less than 5 to 10 In special
cases soils can act as free- draining when the content of fines is as high as 15 to 20
However well-graded sandy and gravelly soils (silty sand clayey gravel etc ) with more than 5 to 10 of fines are as a rule not free shydraining These soils have certain cohesive properties and the control of the compaction water content is essential (Fig 2)
The relevance of the Proctor compaction tests to vi bratory compaction of cohesionless soils has been questioned by many investigators (Lane 19ll8 Felt 1958 Morris amp Cochrane 1965) It has been suggested that vibratory soil comshypaction should be correlated with laboratory compaction tests based on vibration
Impact compaction tests such as the Proctor compaction tests are generally time consuming in comparison with vibratory compaction tests In addition impact tests are to a certain extent affected by the manual performance
A further advantage with vibratory compaction tests is that such tests can be adapted to test moulds with large diameters and can ther efore be carried out on samples containing stones
III TECHNICAL DATA OF VIBRATORY COMPACTORS
There are no accepted rules regarding the techshynical data which should be specified or given for vibratory compactors in specifications technical reports etc Sometimes such more or less undefined terms as dynamic force dynamic load compaction effort in tons impulse in tons per second equivalent static weight are used
The vibrations of the drum of a vibrating rolshyler or of the bottomplate of a vibrating plate compactor are usually generated by one or several rotating eccentrics The frequency amplitude velocity and acceleration of a sinushysoidal oscillation are defined in Fig 3 The frequency expressed in cycles per minute (cpm) or cycles per second (cps or Hz) is determined by the rotational velocity of the eccentric(s) The amplitude of the drum or the bottomplate is a function of the eccentric moment of the ecshycentric as shown in Fig 4 and of the mass of the vibrating system
The so-called nominal amplitude can be calcushylated from the following equation
t _ Eccentric moment1Nominal amp l ude - Mass of drum or bottorqilate ( 4)
The actual amplitude can for certain frequency ranges be up to 50 to 100 larger than the nominal amplitude due to resonance
The rotating eccentric initiates a centrifugal force which is a function of the frequency and the eccentric moment as shown in Fig 4 (Due to the oscillati ons of the drum or bottomplate there will be a small difference between the real centrifugal force and that calculated from Fig 4 The difference is usually less than 1)
The centrifugal force acts inside the drum or bottomplate Its magnitude is not equal to the dynamic force transmitted to the underlying soil as is sometimes assumed
c ~ Amplitude
J____________1--------lt-
Time
Time T for full cycle
Frequency (number of eye les per sec (1T) ) = f cps or Hz
Amplitude (maximum deviation from position at rest) = s cm (in)
Maximum velocity = vmox = 21C-fmiddots cms (insec)
Maximum acceleration = omax = 4Ttf s cms2(insec)
Fig 3 Definition of Frequency Amplitude Velocity and Acceleration for a Sinushysoidal Oscillation
Weight of eccentric = m kg (lb)
Eccentricity = r cm in)
Eccentric moment = m r kgcm (lb in)
Centrifugal force 41 F - ~ kg (lb) g
= =g = occelerotion due to gravity 981 cm sZ 386 insec
Fig 4 Definition of Eccentric Moment and Centrifugal Force
Through the oscillations defined by their freshyquency and amplitude the vibrating drum or bottomplate affects the surface of the ground with a rapid succession of dynamic loads or impacts Each load cycle generates a stress wave as illustrated in Fig 4 It i s i mportant to make a clear distinction between the vibrashytions of the compactor and the characteristics of the stress waves in the soil The charactershyistics of the stress waves are to a large exshytent dependent on the properties of the soil
The static weight of vibratory compactors has a
105
large influence on the compaction effect since the kinetic energy as well as the momentum (mass x velocity) of the vibrating drum or bottom plate are directly proportional to the weight if the amplitude and the frequency are constant Test results indicate for example that the maximum depth to which a soil can be compacted is depending on the total static weight of the compactor However the compaction close to the surface is for vibrating rollers also to a large extent influenced by the static weight per linear inch of drum width
The ratio of drum and frame weight is also of importance with respect to the compaction efshyfect However this weight ratio is given in specifications technical reports etc for vishybrating rollers and vibrating plate compactors
It is proposed that at least the technical data in Table 3 should be given in specifications technical reports etc for vibrating rollers and vibrating plate compactors
TABLE 3 -- TECHNICAL DATA FOR VIBRATING ROLLERS AND VIBRATING PLATE COMPACTORS
Vibrating rollers Vibrating plate compactors
Total weight Total weight
Static load per Static load per unit area of inch of drum width bottom plate
Drum width Width of bottom plate
Drum diameter Length of bottom plate
Frequency Frequency
Nominal amplitude Nominal amplitude
Eccentric moment Eccentric moment
Centrifugal force1 ) Centrifugal force1 )
Working speed Working speed
l) Can be misleading if compactors with two different frequencies are compared
IV COMPACTION MECHANISMS
A large number of factors affect the vibratory compaction of cohesionless soils According to Lorenz (1955 1960) the most important of these factors are the resonant frequency of the comshypactor - soil system (Hertwig 1931 1933) the number of load cycles (Tschebotarioff and McAlpin 1947) and the shear strength during the vibration (Mogami and Kubo 1953)
Whiffin (1954) Forssblad (1965 ) and others have pointed out however that also the magnishytude of the dynamic stresses generated in the soil by the vibrator is of great importance for the results of the compaction
1 Resonance
According to Hertwig (1931 1935) the highest
density of a soil is obtained at the resonant frequency of the vibrator - soil system where the amplitude reaches a maximum Also Terzaghi (1943) Bernhard (1952a 1959) Converse (1954 1957)and others recommend that the compaction should be done at the resonant frequency
The resonant frequency varies with the soil type and with the characteristics of the comshypactor Sung (1954) Viering (1957) and Lorenz (1960) for example have pointed out that the resonant frequency depends on the eccentric moment the weight and dimensions of the vibrator and on the properties of the soil Also Barkan (1960) and others have discussed the factors affecting the resonant frequency of the vibrator - soil system
Compaction tests and practical experience do not indicate however that vibratory compaction at the resonant frequency will give a higher density than at other frequencies (eg Lorenz 1955 1960 Forssblad 1955 1965 Kutzner 1962 Usually the density of compacted soil will increase with increasing frequency even at frequencies exceeding the natural frequency of the vibrator - soil system One reason as pointed out by Forssblad (1965) is that the centrifugal force and the momentum and thus the 11 intensity 11 of the vibrations also increase with increasing frequency The resonance effects of the vibrator - soil system will in this case be combined with the effects of an increase of the 11 intensity11 of the vibrations as graphically illustrated in Fig 5 The resonance effect is in this case 11 hidden 11 bull Due to this reason medium and heavy-weight vibrating rollers often are designed with a frequency just above the resonance frequency of the vibrator - soil system
Nominal o litude 2 s
sect Nominal a itude s
C
~l-----j-ft--i-----1-------j
1 u _____ ----g_
0 tvbgnificot
amplitude n of nominal e to resonance
10 20 30 Frequency
Fig 5 Effect of Frequency and Amplitude on Vibratory Compaction of Soil
2 Number of Load Cycles
According to Tschebotarioff and McAlpin (1947) the number of load cycles and the centrifugal force govern the density of the compacted soil when the frequency is low About 10000 cycles were required to reach the maximum density of a sand when the centrifugal force was 9 and 187 kg The maximum density increased with inshycreasing centrifugal force When the centrifugal force was 37 and 75 kg approximately 30000
106
load cycles were required These tests were carried out at f r equencies between 1 0 and 25 cps
Kutzner (1962) also f ound from vibratory comshypaction tests with glass beads and dry sand that the density increased with increasing numshyber of load cycles or wi th increasing vibr ation time For the glass beads the increase was small after 500 load cycles About 9 000 load cycles were required to reach the maximum denshysity of the dry sand at a frequency of 50 cps
Tests by Whitman and Ortigosa (1968) indicate that the density of a compacted cohesionless soil at accelerations less than 1 g is primarily governed not only by the number of load cycles but also by the stress increase in the soil The density increased as the logarithm of the number of cycles The increase of the density was however smal l when the initial relative density was larger than 70 and the ratio of the maximum and the mi nimum cyclic stress from the vibration was less than 5
The test results thus indicate that the number of load cycles is of special importance at low accel erations The number of load cycles reshyquired to reach a given relative density is also influenced by the gradation of the soil
3 Shear Strength During Vibration
Mogami and Kubo (1953) observed that the shear strength of dry sand decreased with increasing acceleration They investigated two types of dry sand in a direct shear apparatus (Fig 6) at frequencies ranging from 10 to 50 cps and at accelerations which varied up to 20 g The test results indicated that the shear strength decreased approximately linearly when the acceleration increased from 0 5 to 1 0 or 2 0 g
The shear strength of sands under vibratory loading has also been investigated by Linger (1963) with direct shear and triaxial tests The vibratory tests gave a lower shear strength than the static tests The superimposed vibrashytory loads caused a reduction of the normal load for the direct shear tests and of the confining pressure for the triaxial tests
11 175~ JJ7
Fig 6 Test Equipment for Determination of Soil Shear Strength Wi th and Without Vibrations Used by Mogami amp Kubo (1953)
The degree of saturation and the water content
affect appreciably the compaction properties of sand due to capillary forces between the indivishydual soil particles ( false cohesion) In Fig 7 is shown the dr y density of uniform coarse medium and fine sands as a function of the water content (Kutzner 1962) It can be seen that the dry density of the soil compacted either dry or saturated was approximately the same The lowest density was obtained when the water content was 5 to 10 Kutzner also carried out compaction tests where a wetting agent had been added to the pore water In this case the dry density of the coarse sand after compaction was approximately independent of the water content (Fig 7) These tests indicate that the compaction of partly saturated cohesionshyless soils is appreciably affected by capillaryforces
~ ~18 0~
17 L
~-0-
r
1 16
c 15 f = 50cps0
middot S= 085 mm3
middotc O= 85g~
~ Cl
13 I ---wetfin agent
)C
)C
120 5 10 15 20 25 Water content percent
Fi g 7 Vibratory Compaction of Sand at Difshyferent Water Contents After Kutzner (1962)
Forssblad (1965) used the vane test to study the shear strength of mainly cohesionless soils with and without vibrations at different water conshytents The test data indicated that the vibrashytory shear strength varied between 1 to 6 of the static shear strength The lowest value was obtained for gravel sand gravelly silt or crushed stone when the soil was either dry or saturated The vibratory shear strength of all investigated soils was about the same
4 Dynamic Stresses
The compaction of a soil is to a large extent dependent on the type and the intensity of the stress waves generated by the vibrator Longshyitudinal and transverse waves are transmitted through the soil while Rayleigh and Love waves follow the ground surface In a transverse wave the soil particles move in a plane pershypendi cular to the direction of wave propagation while in the longitudinal waves the particles move in the direction of the wave propagation The transverse waves propagate with about half
107
the velocity of the longitudinal waves (also called compressional waves)
The amplitude of the longitudinal and of the transverse waves gener ated by vibrating roll~rs or plate compactors decrease with increasing di stance from the vibrator mainly due to geoshymetrical damping There is a l so a reduction of the amplitude due to absorption of energy by the soil
According to Forssblad (1965) the intensity of the stress waves must be high enough to overshycome the shear strength of the soil In a partly saturated sand and grave l with a relashytively low apparent ( false) cohesi on a verti~al dynamic stress of about 0 5 to 1 0 kgcm was required to reach a relative comshypaction of 90 with respect to the modified AASHO c ompaction test For clays a considerably larger pressur e - about 5 kgcm2 was required to reach the same r elat i ve compaction at the optimum moistur e content
Whiffin (1954) has measured the stress distrishybution bel ow a vibrating roller a static rolshyler a power r ammer and a crawler tractor in two types of clayey soils Whiffin found a relationshyship between peak pressure (static or dynami c) and the relative compaction of the soil whi ch was independent of the type of compaction machine and of the duration of the stress pulse The dynamic str ess gener ated by the vibrating r oller was about 100 l arger than the corr esponding static stress increase These results have been confirmed by other authors
For ssblad (1965) has measured the vertical dyshynamic stresses below different types of vibrashytory compactors and for di fferent soil types As shown in Fig 8 the maximum vertical dynamic stress decreased rapidly with increasing depth below the gr ound surface Forssblad found that it was possible to calcul ate approximately the dynamic stress distribution by Boussinesq s equation for a compacted soil For a loose soil the dynamic stresses in the soil were less than those calculated by Boussinesq s equation Also Ber nhar d (1952a 1952b 1962 1967) Christoffel (1960) and others have measur ed the stress distribution in the soil below different types of vibratory compactors
Vertical dynamic stress 10 20 JO ~o ~o o0 10 eo 90 middoto 10 20 JO bull 0 0
o 1
10 ___ JI _ l= 20 ~-
10 I 1JO J ---i----
10 II
llh
s o JO0 80 - - - -
0 Vibro1ing p loiit compoctOI 13S lrg (300 lb)
-iOO kg (900 lb)100 ~v 2 - -- - -r 3 Vibt01ing tamper 60 lrg (130 lb)IIC
I vaoillg roller 1i ton 120 s 3 3 lo1I - - -IJ O I bull - - - 12 5 IOfI
I 10
Fig 8 Vertical Dynami c St ress es at Different Depth Under Vibrator y Compactor s of Di fferent Types a nd Sizes According to Forssblad (1965)
Reflection of the stress waves against lower more compact layers can give special compaction effects Near such a layer the compaction of a soil will sometimes be better than that close to the surface Reflection can also have a loosening effect when thin layers of soil are placed on a rigid base
Luscher et al (1967) Ortigosa and Whitman (1968) and D Appolonia et al (1969) have sugshygested that both the maximum and minimum dyshynamic stress in the soil are factors which affect vibratory compaction of cohesionless soils The minimum dynamic stress in the soil should not be much larger than zero to obtain a good compaction Even if the minimum dyshynamic stress is relatively small the soil particles are not free to move
5 Liquefaction During Compaction
The pore pr essur e in a saturated sand builds up progressive l y during the vibrat i on if the re shylative density is low and the sand is not freeshydraining The compactor bogs down when the pore pressure approaches the total overburden pr essure of the soil and the vibrator This phenomenon is called liquefaction Li quefaction is depenshydent on the permeability the initial density of the sand the number of load cycles the over shyburden pressure and the intensity of the cyclic load (Seed and Lee 1966 Lee and Seed 1967 Peacock and Seed 1968 Seed 1968) The vibrashytory load and the number of load cycles required for liquefaction increase with increasing r elashytive density and with increasing overburden pressure
The minimum permeability for the soil to be free - draining is a function of the towing speed the thickness of the compacted layer and the compressibility of the soil Approximate calshyculations indic~te that the permeability should be at least 10- cmsec for a layer thickness of 20 cm a towing speed of 4 kmhour and a volume compressibility of 0 02 cm2kg for the soil to be free - draining and to avoid that the compactor bogs down It has been assumed that the consolidation ratio should be at least 50 for each pass
V VIBRATING ROLLERS
A large number of differ ent types of vibrating rollers a r e used as shown in Table 1 The frequency varies between 20 and 80 cps and the nominal amplitude between 0 3 and 2 5 mm Some types of vibrating rollers operate at a higher frequency in combination with a l ow nominal amplitude Other types have relatively low frequencies and l arge amplitudes The frequency can often be changed by changing the engine speed There are a l so v i br ating rollers with adjustable eccentric moment so that the nomi nal amplitude can be varied Tractorshydrawn vibrating rol l ers usually have a centrishyfugal force which is 2 to 3 times the total weight of the roller
The Road Research Laborator y i n England initishyated in 1945 (and is still conducting) ext ensi ve compaction tests with different types of static and vibratory compactors An early investishygation by Hunt (1946) i ndicated that a higher
108
density was obtained for a coarse sand by a 215 kg vibrating roller than by a 12 ton rubber tired roller or by an 8 ton static smooth wheel roller The layer thickness was 22 cm Later compaction tests were carried out on a number of standardized soils (gravel- sand-clay wellshygraded sand uniformly graded fine sand sandy clay and heavy clay) The first three of these soils contained about 15 of fines Detailed results from the compaction tests are available in a number of special reports The test reshysults have been summarized and discussed by Lewis (1954 1960 1961 1967) According to Lewis (1967) vibrating rollers with weights up to 1 ton could only be used to compact granular soils Tractor- drawn vibrating rollers with weights between 3- 34 and 8-12 tons were suitshyable for all soil types also clays The reshyquired number of passes for vibratory rollers were 4 to 6 The maximum layer thicknesses which were recommended for the test vibratory compactors are relatively low The main reason is probably the comparatively high content of fines in the tested soils Lewis (1961) has published results which show a relationship beshy~ween the dry density of the compacted soil and the frequency of the vibrations (Fig 9) In the tested frequency range the effect of changes in frequency was significant only with the granular soils ( Compare also Fig 9 with Fig 5)
Lewis (1961) has also reported results from compaction tests on a well- graded sand with a 3- 34 ton tractor-drawn roller at different towing speeds and different number of passes These test results indicated that a larger towing speed must be compensated by a larger number of passes in order to reach a given reshylative compaction It was found that the reshylative compaction was mainly dependent on the total vibration time on a given surface area
The test results obtained at the Road Research Laboratory have been discussed and analyzed by Johnson and Sallberg (1960) Morris and Cochrane (1964)and others Johnson and Sallberg (1960) pointed out that a good correlation was obtained for vibrating rollers between the degree of comshypaction and the static weight per cm of roll width
Compaction tests have also been carried out at the National Swedish Road Research Institute (Bruzelius 1954) Typical Swedish soils (coarse gravel sand silt and moraine) were compacted in 06 m to 10 m lifts A considerably higher relative compaction was obtained by a 3 ton tractor- drawn vibrating roller and also by a 1 5 ton vibrating plate compactor than by static rollers The maximum effective compaction depth ranged from 05 to 10 m for the vibratory comshypactors The surface density of the soil was generally lower than the density at some depth below the surface The maximum dry density was obtained at a depth of 10 to 30 cm
Two manually- guided vibrating rol l e r s weighing 250 kg and 16 tons have been tested at the Central Road Research Laboratory in India The f r equency was one of the factors which was varied during the tests (Gokhale and Rao 1957)
Garbotz and Theiner (1959) at the Technische Hochschule Aachen Germany have carried out extensive compaction tests with static smooth wheel rollers vibrating rollers and vibrating
l5r-------------Goe-coy
10
- IJS A Wtllbullgroded sand
0
110 - o-tr~
c
l 15
0 ~ -
10 ___t_middot d 115 -- -------------
- - - 13 - Ion troctor drown roller 110 -- Jfrac34 -ton loncJbullm rollbullr
~Havy clay
95---~-- ~--~--~ JO JS o 50
Frequency cps
Fig 9 Relationship Between Dry Density of the Compacted Soils and Frequency of Two Types of Vibrating Roller According to Lewis (1961)
plate compactors Garbotz and Theiner found that uniformly graded cohesionless materials could not be compacted to a higher density by vibrating rollers than by static smooth wheel rollers The depth effect of vibratory comshypactors however was considerably larger than for static smooth rollers Vibratory compacshytion gave the highest degree of compaction for well- graded cohesionless soils
Garbotz and Theiner also found that the degree of compaction of gravel increased when the frequency of a 165 ton tractor-drawn vibrating roller was increased from 23 to 37 cps A further increase in frequency up to 50 cps caused a small decrease of the density For the comshypaction of cohesionless soils Garbotz (1964) recommends for vibrating rollers the combinashytion of a relatively high frequency and a low amplitude
Johnson and Sallberg (1960) have reviewed the factors influencing the field compaction of soils In this report are summarized results from compaction tests available up to that time
Forssblad (1965) has published results from compaction tests on sand with 14 and 3-3 ton tractor-drawn vibrating rollers and with vibrashyting plate compactors weighing 40 120 and 400 kg The influence of the towing speed and of the number of passes was investigated for the 33 ton tractor- drawn roller The required number of passes to reach a specified density increased with increasing towing velocity Test results indicated that the s urface capacity was approximately independent of the rolling speed between 3 and 6 kmh Lower speeds than normal are recommended when the layer thickness is large and when a very high degree of comshypaction is required
Tynan and Morris (1968) have investigated six types of tractor-drawn vibrating rollers weighshying from 3 2 to 9 - 9 tons The compaction tests were carried out on crus~ed rock uniform dune
109
sand and on medium clay at different water conshytents The layer thickness was about 25 cm before the compacti on In the weight class 32 to 5 tons the roller with the largest nominal ampl itude (1 7 mm) and lowest frequency (24 cps) gave for all soil types higher densities than the rollers with a frequency of about 40 cps and a relatively small amplitude For crushed rock and clay the density increased with increasing number of passes up to 16 For the dune sand the increase of the density was small after 2 passes
The optimum water content for the field comshypaction tests was for the crushed rock 1 to 2 higher than the optimum moisture content de shytermined by the modified AASHO compaction test No signifi cant crushing effect was observed for this material For the dune sand the opshytimum moisture content was the same for the field as for the laboratory compaction tests
D Appolonia Whitman and D Appolonia (1969 ) have i nvestigated the compaction of a unifor m dune sand by a 5 ton and by a 3 ton vibrating roller The layer thickness was large Two passes of the 5 ton roller gave the specified compaction (75 relative density) down to a depth of about 60 cm The compaction was not sufficient however close to the surface down to a depth of about 25 cm The density at depths larger than about 25 cm increased substantially with inshycreasing number of passes D Appolonia et al recognized three different compaction zones The soil near the surface was considered to be overcompacted Below this zone to a depth of 60 cm the compaction was believed to be detershymined by the maximum and the minimum dynamic stress generated in the soil by the roller The minimum dynamic stress must be low enough to allow the particles to move The compaction of the soil below a depth of about 60 cm was conshysidered to be caused mainly by the repetitions of str ess (number of load cycles)
The problem with a low surface density of unishyform cohesionless soils has also been discussed by Bruzelius (1954) Garbotz and Theiner (1959) Wiklund (1960) Forssblad (1965) and others Overcompaction can be caused by heavy static rollers as well as by medium and heavy weight vibrating rollers and plate compactors Heavy vibrating rollers can cause overcompaction down to a depth of 40 to 50 cm as indicated by Baker and Moorhouse (1968) The best surface compaction is obtained with light vibrating rollers light and medium weight plate compactors or with light and medium weight static rollers To increase the surface density it is also advantageous to compact the soil at a high water content
Tynan and Morris (1968) observed that the surshyface density of a well- graded crushed rock was low particularly when a heavy high frequency roller was used and the compaction water conshytent was l ow In this case reflection of stress waves against the underlying rigid sub shybase could have contributed to the observed effect
Hall (1968) carried out compaction tests on crushed limestone sand and lean clay The sand contained 8 of material smaller than 0 06 mm The following types of rollers were investigated
a Tractor- drawn vibrating roller weight
32 tons low frequency
b Tractor- drawn vibrating roller weight 1 4 tons high frequency
c Self-propelled vibr ating roller weight 24 tons low frequency
d Rubber- tired static roller weight 50 tons
Rollers a and d gave for the crushed lime shystone and the clay the highest relative comshypaction The compaction by the two rol l ers was similar On sand compactor c gave the best overall results Roller b gave satisfactory results only on the sand
The relationship between technical data and the performance of vibratory rollers has been disshycussed by Tope (1967)
Heavy vibrating rollers are often used to comshypact rock fill and granular soils containing large stones and boulders Field compaction tests indicate that rock fill can be efficiently compacted in thicker layers than sand and gravel The large depth effects which are obshytained with vibrating rollers on rock fill is probably due to the high impact forces which are generated when the vibrating drum comes in contact with large stones Also the damping in rock fill is relatively low
Vibratory compaction of rock fill usually causes a reduction of the volume by 5 to 7 Field exshyperience indicates that 10 to 15 ton vibrating rollers with 5 to 10 passes can compact rock fill in 1 0 to 2 0 m lifts Vibrating rollers with weights between 3 and 5 tons are used to compact rock fill in 0 5 to 10 m lifts
Heavy vibrating rollers are also used to comshypact natural sand deposits with a low initial density in order to increase the bearing capashycity and to reduce the settlements The sand may either be fully or partly saturated If the depth is relatively large up to 20 to 30 passes may be required Boringe and other measurements have indicated a maximum depth effect of 25 to 3 m for 10 to 15 ton vibrating rollers (Baker and Moorhouse 1968)
Winter compaction of soil and rock fill has been investigated in Canada Sweden Norway Finland USA and other countries Frozen soils except clean and dry gravel crushed rock and rock fill can generally not be compacted to the same dry density as unfrozen soils The difficulties with winter compaction increase with increasing water content and with decreasing grain size and temperature (Bernell 1965) Vibrating sheepsshyfoot rollers have been used successfully to compact gravel during the winter Due to the high contact pressures lumps of frozen soil can be crushed Test results indicate however that also with this method the dry density of compacted gravel is about 10 lower than that of the same soil compacted during the summer (Bernell 1965)
During the winter unfrozen soil can often be obtained from excavations When the unfrozen soil is spread out in cold weather the surface freezes rapidly It is therefore important to compact the soil immediately after it has been placed
110
VI VIBRATING PLATE COMPACTORS
The most commonly used plate compactors weigh between 100 and 500 kg With two eccentrics working synchronously it is possible to obtain a directed vibratory force and to move the vibrator during the compaction By adjusting the eccentric element the velocity and the direction of motion can be varied A plate vibrator can also be moved with only one rotating eccentric if the eccentric is placed at the front end of the bottomplate
The frequency of heavy self-propelled vibrating plate compactors is usually between 12 and 20 cps while the frequency of small vibrating plate compactors can be as high as 70 to Bo cps (Table I) The amplitudes vary between 05 and 5 mm The centrifugal force is usually 5 to 10 times the total static weight of the vibrator
The action of plate vibrators have been reviewed by Converse (1954) Bernhard and Finelli (1954) Lorentz (1960) and others Siedenburg (1957) has calculated for inelastic soils the motion of a vibrating plate compactor without a springshysupported engine bed plate Calculations for plate compactors with spring-supported engine bed plates have been made by Bathelt (1956) and by Bathelt and Kock (1956) Bathelt used a mechanical model consisting of three springs to analyze the behavior Two of the springs could not expand after they once have been comshypressed The calculations showed that the centrifugal force for a self-propelled vibrator should be between three to ten times the total weight of the vibrator Similar calculations have also been carried out by Ephremidis (1959) and Weber (1965)
Also Jurecka (1965) has calculated the motion of vibratory compactors and the energy distrishybution in the soil
Compaction tests with vibrating plate compactors have been carried out in Germany during the 1930 1 s as mentioned in the introduction (MUller and Ramspeck 1935 and Ramspeck 1937)
Bernhard (1952a) has carried out compaction tests with a 15 ton vibrating plate compactor and a multiple-plate compactor A relative compaction of 95 with respect to the standard AASHO comshypaction test was obtained for a uniform silty sand by the 15 ton vibrator down to a depth of 75 cm
Converse (1952 1954) has investigated the comshypaction of a uniform beach sand by a vibrating plate compactor with a weight of about 5 tons The dry density of the beach sand was at least 95 with respect to the modified AASHO compaction test down to a depth of 045 to 060 m and 93 to 96 between 060 to 150 m below the ground surshyface
Greenman (1948) has investigated the vibratory compaction of sand and gravel The soil could be compacted satisfactorily to a depth of 30 cm with a light plate compactor The relative compaction was higher than that which could be obtained by internal vibrators or by pneumatishycally operated tampers
Aldous and Wills (1952) have investigated the vibratory compaction of crushed rock gravel and sand The soils were compacted in 15 to 30 cm
lifts by vibrating plate compactors weighing either 70 or 170 kg The maximum density of the gravel was reached after two passes The unit weight of the soil in the lower half of the 30 cm lifts was less than in the upper half
Plantema (1954) used a 15 ton vibrating plate compactor to compact a 5 meter thick sand fill The highest relative compaction was obtained at a frequency of 20 cps The compaction was checked by soundings with a Dutch cone penetroshymeter An appreciable increase of the peneshytration resistance was observed after the comshypaction down to a depth of 20 m The velocity did not affect appreciably the compaction With a light compactor the best compaction was obshytained at a velocity of 4 mmin
Compaction tests with l1J8 ton 140 kg and 40 kg plate compactors have been carried out by Streck and Schmidtbauer (1951J) It was possible to compact a sand to a relative density of 85 within a depth of 60 to 80 cm with the 148 ton plate compactor within a depth of 20 to 30 cm with the 140 kg compactor and within a depth of 20 to 25 cm with the 40 kg compactor
Weiss (1956) has investigated the compaction of sandy gravel and gravel with a 78 ton vibrating plate compactor A relative density exceeding 50 with respect to the modified Proctor comshypaction test was obtained down to a depth of 12 m for the sandy gravel and 17 m for the gravel
Schaeffer (1958) has investigated the effects of frequency and velocity for a light vibrating plate compactor on the compaction of sandy gravel The frequencies 25 33 and 40 cps and the velocities 1J3mmin 7-~ mmin and 105 mmin were investigated The highest density was obtained with the l01middotrest frequency and with the lowest velocity
Garbotz and Theiner (1959) tested a 225 ton vibrating plate compactor The most favorable frequency range was 12 to 17 cps
Garbotz and Christoffel (1964) have carried out tests with vibrating plate compactors and vibshyrating rollers on crushed rock (ballast material)
Kronenberger (1960) has investigated the comshypaction of vibrating plate compactors without spring supported engine bed plates The vibrashyting characteristics and the weight of the comshypactors were varied The maximum dry unit weight and the maximum equivalent modulus of elasticity of the compacted soil were reached at a frequency of about 40 cps Also Lammlein (1953) and Weber (1965) have investigated the performance of vibrating plate compactors Comshypaction of sand by plate compactors has also been discussed by Hoppman (1962)
The Road Research Laboratory in England has made comprehensive investigations of vibrating plate compactors (Lewis 1961) The depth to which soils could be compacted increased with inshycreasing weight and with increasing contact area of the vibrators It was possible to compact satisfactorily a well graded sand to a depth of 30 to 45 cm with a 15 ton or a 2 ton plate comshypactor The depth effect at the same weight was larger for the plate compactors than for the vibrating rollers Lewis found also that fewer passes were required for a plate compactor than
111
for a vibrating roller to reach a given density The surface and the volume capacities given by Lewis ( 1967) for plate compactors were however much lower than those for vibrating rollers
Forssblad (1965) has reported results from exshytensive series of compaction tests with vibrating rollers and plate compactors A relative comshypaction of at least 90 with respect to the modified AASHO compaction test was reached for the layer thicknesses given in Table 4
TABLE 4 -- NORMAL LAYER THICKNESS FOR VIBRATION OF COHESIONLESS SOILS WITH LESS THAN 5 TO 10
OF THE MATERIAL SMALLER THAN 0 06 MM
Vibrating plate compactor 100 to 200 kg 20 cm
Vibrating roller 1 to 2 tons 30 cm
Vibrating plate compactor 400 to 600 kg 40 cm
Vibrating roller tractor drawn 3 to 4 tons 50 cm
Tests and practical experience indicate that it is possible to compact sand and gravel to a high relative density even in high lifts Also relatively fine sand with an average grain size between 006 and 02 mm can efficiently be comshypacted in high lifts by vibrating rollers or plate compactors However comparatively small amounts of fines (silt or clay size particles) will increase considerably the compaction efshyfort required to reach a certain relative comshypaction Also the layer thickness must be deshycreased with increasing content of fines
VII VIBROFLOTATION
Vibroflotation has been used since about 1935 to compact saturated cohesionless soils The method has been described in a number of publications (e g Schneider 1938 Steuerman 1939 1948 Tschebotarioff 1946 Schneider 1948 Rappert 1952 Cassel 1956 D Appolonia et al 1953 Mobus 1959 Watanabe 1963 Thorburn and MacVicar 1968)
Vibroflotation has been developed and applied by the firms J Keller Germany Vibr ofl otation Foundation Co USA Cementation Co England The method has also been used in USSR and Japan Project s where vibroflotation has been used have been described by Schneidig (1940) Leussink (1948) Fruhauf (1949) DAppolonia (1954) D Appolonia and Miller (1955) Plannerer (1965) Hansbo et al (1968) and by Doscher (1968)
The especially designed large internal vibrators (vibrofloats) have generally a diameter of 37 -5 cm and operate at a frequency of 30 cps The nominal amplitude is about 10 mm and the centrishyfugal force is up to 10 tons The vibrators are provided with jetting devices which facilitate the insertion and the withdrawal of the vibrashytors Sand or gravel is added during the vibration to compensate for the subsidence at the ground surface as the soil around the vibro-
112
floats is compacted With this method the soil can be compacted down to a depth of 20 to 30 m Vibroflotation has mainly been used to compact natural strata of sandy soils with a relatively high permeability A maximum amount of 8 to 16 of particl es smaller than 0 06 mm can gener-allybe allowed
Test results by DAppolonia et al (1953) indishycated that the relative density of a fine unishyform sand is at least 70 to a distance of 1 m from the vibrofloats A spacing of 2 m between the insertion points gave a minimum relative density of 70 throughout the compacted area The distance from the vibrofloats to which the soi l can be compacted appears to increase with increasing grain size and with increasing unishyformity of the soil
Abu- Wata and Said (1958) used vibrofl otation to compact a uniform dune sand which had been placed under water The spacing of the insertion points varied between 165 and 2 5 m The compaction of the soil was checked by soundings with a Dutch cone penetrometer A subst antial inshycrease in the measured penetration resistance was observed close to the insertion points The average initial penetration resistance before the compaction was about 60 kgcm2 while the minimum penetration resistance after compaction at a spacing of the vibrofloats of 2 5 m was 120 kgcm2 below a depth of 4 5 m The peneshytration resistance increased with decreasing spacing of the vibrofloats The increase in penetration resistance and of the compaction was smal l close to the surface
Scheelhaase (1959) has described a project where vibroflotation was used to compact a uniform coarse to fine sand for a turbine foundation The compaction was checked by static penetration tests The point resistance varied between 0 to 150 kgcm2 before the compaction and beshytween 250 and 500 kgcm2 after the compaction The penetration tests indicated that the soil was compacted to a distance of 1 0 to 11 m from the insertion points
Hansbo et al (1968) has used the vibroflotation method to compact a uniform sand with an avershyage grain size of 0 5 mm to a depth of 8 to 10 m The compaction was determined by pressiometer tests plate load tests and penetrometer tests A substantial increase of the penetration resisshytance was observed to a distance of 0 6 to 0 7 m from the insertion points
Internal vibrators which are normally intended for concrete have also been used to compact saturated cohesionless soils (Wenner and Saare 1954 and Bureau of Reclamation 1963) According to Wenner and Saare (1954) sand and gravel can be compacted to 90 to 100 with resshypect to the modified AASHO compaction test to a distance of 0 25 to 0 50 m from the insertion points
Forssblad (1965) has repor ted results from comshypaction tests on sand and gravel with internal concrete vibrators The size of the vibrator the frequency and the amplitude were varied A density between 90 and 100 of the modified AASHO maximum dry density was obtained The radius of action of the vibrators was found to be smaller and the required vibr a tion time was found to be longer than in concrete
The vibration of sand silt l oess and clay
with internal vibrators has been investigated theoretically and experimentally by Poteur (1968) 165
VIII LABORATORY COMPACTION TESTS
Laboratory compaction of cohesionless soils by vibration has been studied by many The soil has in the laboratory tests usually been comshypacted in a Proctor mould placed on a vibrating table The influence of frequency amplitude and acceleration of the vibrating table as well as the influence of surcharge load soil gradashytion and moisture content have been studied
Schaffner (1962) has investigated the vibratory compaction of dry sand Typical test results are shown in Fig 10 It can be seen that the void ratio decreased with increasing accelerashytion The highest density was obtained at frequencies up to 100 cps probably due to the very small amplitude at high frequencies Schnaffner has derived an empirical equation which relates the void ratio of a sand with frequency and amplitude
Kutzner (1962) has investigated the vibratory compaction of glass beads The experiments were carried out on a vibrating table at fre-
0 100 200 300 Frequency f (cps)
Fig 10 Compaction of Dry Coarse Sand After Schaffner (1962)
quencies which varied between 5 and 100 cps Test results are shown in Fig 11 At freshyquenc i es between 40 and 100 cps the density inshycreased rapidly as the acceleration approached 1 g A further incr ease of the acceleration did not cause a further increase of the density The large amplitudes combined with impacts at low frequencies may explain the relatively good compaction within this frequency range
~ 5mm
tSOo----= L-L--08LO L 10 L-------eo -oL10=---cUIJ (16(1 --oo--L--deg LfO - 1oo-shy
Acce Ieration 0 9
Fig 11 Influence of Acceleration on the Vibshyratory Compaction of Gl ass Beads After Kutzner (1962)
Selig (1963) has studied the effects of fre shyquency acceleration and surcharge load on the vibratory compaction of a uniform dry sand Test results indicated that the density increase was small (less than 1) after two minutes of vibrashytion The maximum density was obtained at an acceleration between 1 to 2 g The acceleration required to reach a certain density increased with increasing overburden pressure
Ortigosa (1968) and Whitman and Ortigosa (1968) found from vibratory compaction tests that the acceleration without surcharge should for a dry fine sand be at least 1 g The maximum density was obtained at 2 g When the acceleration was larger than 2 g the density decreased due to overcompaction With surcharge load the reshyquired acceleration was 1 to 3 g depending on the intensity of the overburden pressure Also Dunglas (1967) has investigated the vibratory compaction of sand Dunglas used a special test mould where water pressure was used as surcharge load
Forssblad (1965) found that the dry unit weight increased for a dry sand with increasing accelershyation up to 2 g and up to 3 g when the same sand was compacted partially or fully saturated The dry unit weight was approximately constant when the acceleration exceeded these limiting values No surcharge was used during the experishyments Forssblad also found that the dry unit weight of the compacted soil was independent of the direction of the vibrations
Laboratory compaction tests on sand crushed limestone and crushed quartzite have also been carried out by Gomes and Graves (1962) and by Honigs Valente and Graves (1963) These matershyials were compacted in a Proctor mould by a surface vibrator consisting of a loud- speaker attached to an aluminum plate The frequency could be var ied Test results indicated that the stress waves generated by the loud- speaker affected the compaction of the soil The maxishymum density occurred at some distance below the soil surface
Standardized vibratory compaction tests have been mentioned in the Chapter Elements of soil comshypaction The development of test procedures have been discussed by e g Kolbuszewski (1948) Burmister (1950) Pauls and Goode (1950) Felt (1958) Leussink and Kutzner (1962) Johnson and Sallberg (1962) and by Pettibone and Hardin (1964)
113
A vibrating table and a surcharge load or a vibrating tamper or hammer are used in the standshyardized vibratory test methods as illustrated in Fig 1 Pettibone and Hardin (1964) have found for the first mentioned method that- the density of the compacted soil at a frequency of 60 cps increased with increased amplitude of the vibrating table The increase in density was insignificant when the vibration time was longer than 6 minutes
IX DAMAGE CAUSED BY VIBRATIONS
Vibratory soil compactors as well as blasting pile driving and heavy road traffic may damage adjacent structures Surface waves generated by medium and heavy weight vibratory compactors can often by observed a~ large distances from the vibrator Since also vibrations of very low intensity can be felt by man the risk of damage to buildings and other structures is often exaggerated
Measurements indicate that the damage is mainly dependent on the maximum velocity of the vibrashytions (Fig 3) The risk of damaging adjacent buildings is small if this velocity is less than 03 to 10 cms as indicated by Scheelshyhaase (1962) Susstrunk (1959) Reiher and Soden (1961) and others The risk of damage is also dependent on the quality of the buildshying and the type of the foundation
Ground oscillations from vibratory compactors have been measured by Susstrunk (1959) and Forssblad (1965) An oscillation velocity of 10 cmsec was observed by Forssblad at a maximum distance of 55 m from a 33 ton tractor-shydrawn vibrating roller There were large variashytions of the ground oscillations due to differshyences in the soil conditions Additional inshyvestigations will be of interest
Due to large variations in the soil conditions in the quality of buildings and in size and type of the compactors it is difficult toesshytablish general rules about the risk of damage by vibratory compactors This risk must howshyever be carefully considered especially when heavy vibratory compactors are used
Buried pipes can also be damaged during vibrashytory compaction of trench-fills Minimum thickness of the soil layer above the pipes during compaction by vibration or tamping are given in German specifications (Forschungsgeshysellschaft filr das Strassenwesen 1964)
Retaining walls abutments and basement walls are sometimes damaged by the high lateral presshysures which develop during the compaction of the backfill Measurements indicate that these pressures can be several times larger than those used in the design (Sowers et al 1957 Broms1967and Brems and Ingelson 1967) Also the lateral earth pressures which remain after the compaction are often high and can approach the Rankine passive earth pressure close to the ground surface Further studies are recommended
X FURTHER RESEARCH
This report on the state-of-the-art of vibratory soil compaction indicates that there is need for further research in this field The followshying important points can be mentioned
1 Compaction Mechanism
Transmission of the vibrations from vibrator to underlying or surrounding soil Propagation of stress waves in the soil Damping propershyties of soils at different frequencies amplishytudes gradations water contents etc
2 Special Features of Vibratory Compaction
Rational relationships between suitable layer thickness and number of passes for different types of soils and vibratory compactors Crushing of soil and roelt particles during vibratory compaction Winter compaction of soil and rock fill
3 Compaction Control
Development of efficient and rapid methods for compaction control of thick layers and for soils containing large stones Development of improved laboratory compaction methods based on vibrations
4 Damage to Structures
Damage to buildings by surface oscillations produced by vibratory compactors Lateral earth pressures on retaining walls abutment and basement walls during and after vibratory comshypaction of soils
5 Technical Data
Recommendations about the technical data of vibratory compactors which should be included in specifications technical reports etc
114
REFERENCES United States Department of the Interior 783 pp
Abu- Wata T and Said A (1958) Compaction Tests of Dune Sand Fill under Water by Deep Internal Vibrat i on Transations 6th Int Congress on Large Dams New York pp 467 - 483
Aldous W M and Wills H W (1952) Field Equipment for Vibratory Compaction of Soils and Base Courses Civil Aeronautics Administration Techn Div Repor t No 186 15 pp Indianapolis
Baker G L and Moorhouse D C (1968) Sand Densification by a Heavy Vibratory Comshypactor ASCE Specialty Conference on Placement and Improvement of Soil Structures MIT Camshybridge 13 pp
Barkan D D (1960) Dynamics of Bases and Foundations McGraw- Hill Book Co New Yor k 434 pp
Bathelt U ( 1956) Das Arbeitsverhalten des Rlittelverdichters auf plastisch- elastischem Undergrund Bautechnik- Archiv No 12 Berlin Ernst and Sohn 52 pp
Bathelt U and Koch H W (1956) Zur Frage der Arbeits- und Wirkungsweise von Rilttelverdichtern Baumaschine und Bautechnik Vo l 3 No 12 pp 373- 377
Bernell L 1965) Properties of Frozen Granshyular Soils and Their Use in Dam Construction Proceedings 6th Int Conf Soil Mech and Found Engng Vol 2 Montreal pp 451- 455
Bernhard R K (1952a) Study on Static and Dynamic Compaction of Soils Proceedings Highway Research Board Vol 31 pp 563- 591
Bernhard R K (1952b) Dynamic Compaction of Soil Rutgers University Engineering Research Bulletin No 37 23 pp
Bernhard R K (1962) On Biaxial Stress Field on Non- Cohesive Soils Subjected to Vibrashytory Loads Symposium on Soil Dynamics Am Soc Testing Materials Special Technical Publication No 305 pp 3-12
Burmister D M ( 1950) Suggested Method of Test for Maximum and Minimum Densities of Granular Soils Procedures for Testing Soil s Am Soc Testing Materials pp 111- 113
Cassel F L (1956) Use of Vibration for the Deep Compaction of Granular Soil Civil Engineering and Public Works Review Vol 51 No 599 pp 532- 536
Christoffel H (1960) Prllfung und Forsshychungs- ergebnisse an Rllttelverdichtern Strassen- und Tiefbau Vol 14 No 2 pp 76-80
Converse J ( 1952) Vibration - Compaction of Sand California Institute of Technology January 1952
Converse F J ( 1954) Compaction of Sand at Resonant Frequency Symposium Dynamic Testing of Soils Am Soc Testing Materials Special Technical Publication No 156 pp 124- 137
Converse F J (1957) Compaction of Coheshysive Soils by Low Frequency Vibration Am Soc Testing Materials Special Technical Publication No 206
D Appolonia E (1954) Loose Sands Their Compaction by Vibroflotation Symposium Dynamic Testing of Soils Am Soc for Testing Materials Special Technical Publication No 156 pp 138-154
D Appolonia E Miller C E and Ware T M (1953) Sand Compaction by Vibroflotation Proc Am Soc Civil Engng Vol 79 Separate No 200 23 pp
DAppolonia E and Miller C E Jr (1955) Sand Compaction by Vibroflotation Transshyactions Amer Soc Civil Engineers Vol 120 pp 154- 168
DAppolonia D J Whitman R V and D Appolshyoni a E (1969) Sand Compaction with Vibrashytory Rollers Proc Am Soc Civil Engineers Soil Mech and Found D V Vol 95 No SM 1
Bernhard R K (1967) Stress and Wave Patterns in Soils Subjected to Dynamic Loads Cold Regions Research and Engineering Laboratory No 120 Hanover New Hampshire 52 pp
Bernhard R K and Finelli J (1954) Pilot Studies on Soil Dynamics Symposium Dynamic Testing Materials Am Soc Testing Materials Special Technical Publication No 156 pp 211- 253
Broms B (1967) Jordtryck mot oeftergivliga konstruktioner Swedish Geotechnical Institute Reprints and Preliminary Reports No 22 Stockholm 29 pp
Broms B and Ingelson I (1967) Resultat frlln matningar av jordtryck mot brolandf1ste Swedish Geotechnical Institute Reprints and Preliminary Reports No 11 Stockholm 16 pp
Bruzelius N G (1954) A Study of the Comshypaction of Soil Statens Vlginstitut Meddeshylande 87 Stockholm 69 pp
Bureau of Reclamation (1963) Earth Manual
Paper 6366 pp 263-284
Doscher H D (1968) Vibroflotation Journal Soil Mech and Found Engng Vol 7 No 3 New Delhi pp 365-385
Dunglas J (1967) Le compactage par vibration des milieux granuleux Travaux Vol 50 No 392 pp 495-503 No 393 pp 563- 572
Ephremidis C (1959) Die mathematische Erfassung der Vorgange bei der Rlittelverdichshytung von Boden VDI- Zeitschrift 101 p 277
Erlenbach L (1959) Verdichtung i m Erdbau Strassen- Asphal t - und Tiefbau- Technik Vol 12 No 1 pp 68- 72
Felt E J (1958) Laboratory Methods of Compacting Granular Materials Am Soc fo r Testing Materials Special Technical Publishycation No 239 pp 89- 108
Forschungsgesellschaft fu~ das Strassenwesen (1964) Merkblatt uber das Zufull en im
115
Schaeffer H (1958) Vberprilfung der Vershydichtungsleistung eines RUttelverdichters auf Kiestragschichten Strasse und Autobahn Vol 9 No 4 pp 145- 148
Schiffner H J (1962) Umlagerung Rolliger Erdstoffe durch Vibration Mitteilunger der Forschungsanstalt fur Schiffahrt Wasser- und Grundbau Berlin No 6
Scheelhaase K (1959) Bodenverdichtungsshyarbeiten mittels RUtteldruckverfahren beim Bau eines Kraftwerkes in Berlin- Spandau Baushymachine und Bautecknik Vol 6 No 12 pp 449- 451
Scheelhaase K (1962) Ergebnisse van Proshyberammungen unter Verwendung eines Vibrashytionsbaren und e ines Frei fallbaren Baushymaschine und Bautechnik Vol 9 No 11 pp 453-4 58
Scheidig A (1940) Speichergriindung auf Riittelfusspfaehlen Die Bautechnik Vol 18 No 25 pp 277-282
Schneider H (1938) Das Riitteldruckvershyfahren und seine Anwendung im Erd- und Betonshybau Beton und Eisen Vol 37 No 1 pp 1-7
Seed H B (1968) Landslides During Earthshyquakes due to Soil Liquefact i on Journal of the Soil Mechanics and Foundations Division ASCE Vol 94 No SM5 Paper 6110 pp 1055-1122
Seed H B and Lee K L (1966) Liqueshyfaction of Saturated Sands During Cycl ic Loading Journal of the Soil Mechanics and Foundations Division ASCE Vol 92 No SM6 Proc Paper 4972 pp 105- 134
Selig E T (1963) Effect of Vibration on Density of Sand Proc 2 Panamerican Conshyference on Soil Mechanics and Foundation Engishyneering Vol 1 pp 129-144
Siedenburg R (1957) Unwuchtschwingerreger mit Selbsttatiger Fortbewegung Die Bautecknik No 9
Sowers G C Robb B D Mullis C H and Glenn A J (1957) The Residual Lateral Pressures Produced by Compacting Soils Proc 4 Int Conf Soil Mechanics and Found EngVol 2 pp 243-247
Stewerman S (1939) A New Soil Compaction Device Engineering News-Record July 20 1939 pp 63- 64
Steuerman S (1948) Silt Consolidation by Vibrofl otation Proceedings 2nd Int Conf Soil Mechanics and Found Eng Vol 2 pp 297-301
Streck and Schmidtbauer (1954) Bodenverdichshytungsversuche mit Schwingungs- und RUttelvershydi chtern Strasse und Autobahn Vol 5 No 12 pp 400- 406
Sung T Y ( 1954) Vibrations in Semi- Infinshyite Solids Due to Periodic Surface Loading Symp Dynamic Testing Soils Am Soc Testing Materials Special Technical Publication No 156 pp 35-63
Silsstrunk A E 0959) Schwingungsmessungen Untersuchungen Uber das dynamische Verhalten des Strassendammes bei ungunstigen Baugrundshyverhaltnissen Strasse und Verkehr Vol 45 No 4 pp 11- 14
Taylor D W (1948) Fundamentals of Soil Mechanics John Wiley amp Sons New York 700 pp
Terzaghi K (1943) Theoretical Soil Mechshyanics John Wiley amp Sons New York 510 pp
Thorburn S and MacVicar R S L (1968) Soil Stabilization Employing Surface and Depth Vibrators The Structural Engineer Vol 46 No 10 pp 309- 316
Tope A R (1967) Technical Aspects of Vibrating Rollers in Relation to Performance Australian Road Research Vol 3 No 4 pp 56- 66
Tschebotarioff G P (1946) Vi bratory Impact Compaction of Soils Am Road Builders Association Technical Bullet in No 109 pp 12 - 31
Tschebotarioff G P and McAlpin G W (1947) The Effect of Vibratory and Slow Repetitional Forces on the Bearing Properties of Soils Civil Aeronautics Administration Technical Development Report No 57 Washington D C 70 pp
Tynan A E and Morris P 0 (1968) The Evaluation of a Range of Vibrating Rollers in Compacting Road Materials Australian Road Research Vol 3 No 5 pp 7-53 Viering G (1965) The Vibrational Behavior of Soil in Relation to its Properties Proc 5th Int Conf on Soil Mechanics and Found Eng Vol 1 pp 547-552
Watanabe T (1963) Compaction of Sandy Ground by Vibration-Vibroflotation and Related Problems Proceedings 2 Asian Regional Conf Soil Mechanics and Found Engng Vol 1 Tokyo pp 406- 410
Weber G ( 1965) Untersuchung Uber Vorgange bei der statischen und dynamischen Verdichtung des Bodens Curt-Risch- Institut fur Schwingshyungs- und Messtechnik der T H Hannover Mitteilunger No 5 Hannover 97 pp
Whitman R V and Ortigosa P (1968) Densishyfication of Sand by Vertical Vibrations MIT Technical Paper No T68-5 7 pp
Weiss H (1956) Verdichtung grobk5rnigen SchUttmaterials mit einem schweren Ruttelshyverdichter Baumaschine Lind Bautechnik Vol 3 Heft 6
Wenner C G and Saare E (1954) Grundshyf6rstlrkning genom vibrering under vatten Byggmastaren Vol 33 No Bll pp 201- 210
Whiffin A C (1954) The Pressures Generat~ in Soil by Compaction Equipment Symp Dynamic Testing Soils Am Soc Testing Materials Special Technical Publication No 156 pp 186-210
Wiklund J A (1960) Synpunkter pa packning och sittning vid Arlandabygget 11 Svenska Vagforeningens Tidskrift Vol 47 No 5 pp 203-206
118
STATENS GEOTEKNISKA INSTITUT Swedish Geotechnical Institute
SARTRYCK OCH PRELIMINARA RAPPORTER Reprints and preliminary reports
Pris kr (Sw crs)
No
1 Views on the Stability of Clay Slopes J Osterman 1960 Out of print
2 Aspects on Some Problems of Geotechnical Chemistry R Soderblom
1960
3 Contributions to the Fifth International Conference on Soil Mechanics and Foundation Engineering Paris 1961 Part I
1961
1 Research on the Texture of Granular Masses T Kalstenius amp W Bergau
2 Relationship between Apparent Angle of Friction with Effective Stresses as Parameters - in Drained and in Consolidated-Undrained Triaxial Tests on Satushyrated Clay Normally-Consolidated Clay S Odenstad
3 Development of two Modern Continuous Sounding Meshythods T Kallstenius
4 In Situ Determination of Horizontal Ground Movements T Kalstenius amp W Bergau
4 Contributions to the Fifth International Conference on Soil Mechanics and Foundation Engineering Paris 1961 Part II
1961 5-
Suggested Improvements in the Liquid Limit Test with Reference to Flow Properties of Remoulded Clays R Karlsson
5 On Cohesive Soils and Their Flow Properties R Karlsson 1963 10-
6 Erosion Problems from Different Aspects 1964 10-
1 Unorthodox Thoughts about Filter Criteria W Kjellman
2 Fiters as Protection against Erosion P A Hedar
3 Stability of Armour Layer of Uniform Stones in Running Water S Andersson
4 Some Laboratory Experiments on the Dispersion and Erosion of Clay Mnteriafs R SOderblom
7 Settlement Studies of Clay 1964 10-
1 Influence of Lateral Movement in Clay Upon Settleshyments in Some Test Areas J Osterman amp G Lindskog
2 Consolidation Tests on Clay Subjected and Thawing J G Stuart
to Freezing
8 Studies on the Properties and J Osterman
Formation of Quick Clays 1965 5-
9 Ber8lming B Broms
av p8ar vid olika belastningsforhSlanden 1965 30 -
1 Berakningsmetoder for sidobelastade p8lar
2 Brottlast for snett beastade pAlar
3 Ber8kning av vertikaa pftlars barf6rm8ga
10 Triaxial Tests on Thin-Walled Tubular Samples 1965 5-
1 Effects of Rotation of the Principal Stress Axes and of the Intermediate Principal Stress on the Shear Strength B Broms amp A 0 Casbarian
2 Analysis of the Triaxial B Broms amp A K Jamal
Test-Cohesionless Soils
11 Nftgot om svensk geoteknisk forskning B Broms 1966 5-
12 88rf6rmftga hos pftlar slagna mot sliintberg B Broms 1966 15-
13 F0rankring av ledningar i jord B Broms amp 0 Orrje 1966 5-
14 Ultrasonic Dispersion of Clay Suspensions R Pusch 1966 5-
15 Investigation of Clay Sections R Pusch
Microstructure by Using Ultra-Thin 1966 10 -
16 Stability of Bennermark
Clay at Vertical Openings B Broms amp H 1967 10 -
Pris kr No (Sw crs)
17 Orn palslagning och palbiirighet 1967 5-1 Dragsprickor i armerade betongpalar S Sahlin
2 Sprickbildning och utmattning vid slagning av armeshyrade modellpalar av belong BmiddotG Heifers
3 88righet hos slantberg vid statisk belastning av bergshyspets Resultat av modellf6rs0k S-E Rehnman
4 Negativ mantelfriktion B H Fellenius
5 Grundl8ggning pa korta pi3lar Redog0relse for en f6rshys6ksserie pa NABO-palar G Fjekner
6 Krokiga pftlars b8rf0rmAga B Brems
18 Palgruppers biirformaga B Broms 1967 10-
19 Orn stoppslagning av stodpalar L Hellman 1967 5-
20 Contributions to the First Congress of the International 1967 5 -Society of Rock Mechanics Lisbon 1966
1 A Note on Strength Properties of Rock B Broms
2 Tensile Strength of Rock Materials B Broms
21 Recent Quick-Clay Studies 1967 10-1 Recent Quick-Clay Studies an Introduction R Pusch
2 Chemical Aspects of Quick-Clay Formation R Soderblom
3 Quick-Clay Microstructure R Pusch
22 Jordtryck vid friktionsmaterial 1967 30-
1 Resultat frEm matning av jordtryck mot brolandfilste B Broms amp I Ingeson
2 Jordtryck mot oeftergivliga konstruktioner B Broms
3 Meted f0r berakning av sambandet mellan jordtryck och deformation hos framst st0dmurar och f0rankringsshyplattor i friktionsmaterial B Broms
4 Berakning av stolpfundament B Broms
23 Contributions to the Geotechnical Conference on Shear 1968 10 -Strength Properties of Natural Soils and Rocks Oslo 1967
1 Effective Angle of Friction for a Normally Consolidated Clay R Brink
2 Shear Strength Parameters and Microstructure Characshyteristics of a Quick Clay of Extremely High Water Content R Karlsson amp R Pusch
3 Ratio cp in Relation to Liquid Limit and Plasticity Index with Special Reference to Swedish Clays R Karlsson amp L Viberg
24 A Technique for Investigation of Clay Microstructure R 1968 22 -Pusch
25 A New Settlement Gauge Pile Driving Effects and Pile 1968 10-Resistance Measurements
1 New Method of Measuring in-situ Settlements U Bergdah amp B Broms
2 Effects of Pile Driving on Soil Properties 0 Orrje amp B Broms
3 End Bearing and Skin Friction Resistance of Piles B Broms amp L Hellman
26 sattningar vid vagbyggnad 1968 20-
F0redrag vid Nordiska Vagtekniska F0rbundets konferens I Voksenasen Oslo 25-26 mars 1968
1 Geotekniska unders0kningar vld bed6mning av s8ttshyningar B Broms
2 Teknisk-ekonomisk 0versikt Over anliiggningsmetoder for reducering av sattningar i vagar A Ekstrom
3 sattning av verkstadsbyggnad I Stenungsund uppford p8 normalkonsoliderad era B Broms amp O Orrje
27 B8rf6rm8ga hos sliintberg vid statisk belastning av 1968 15-bergspets Resultat frAn modellf6rs6k S-E Rehnman
No
28 Bidrag till Nordiska Geoteknikerm6tet 1 GOteborg den 5-7 september 1968
1 Nordiskt geotekniskt samarbete och nordiska geotekshynikerm6ten N Flodin
1968
Pris kr (Sw crs) 15-
2 Nflgra resultat av belastningsf6rs6k pl lerterrang speciellt med avseende pa sekunctar konsolidering G Lindskog
3 sattningar vid grundl8ggning med platter pA moranshylera i Lund S Hansbo H Bennermark amp U Kihfbom
4 Stabilitetsf6rb8ttrande spontkonstruktion ningar 0 Wager
for bankfyllshy
5 Grundvattenproblem I Stockholms city G Lindskog amp U Bergdahl
6 Aktuell svensk geoteknisk forskning B Broms
29 Classification of Soils with Reference to Compaction 8 Broms amp L Forssblad
1968 5-
30 Flygbildstolkning som hjiilpmedel vid oversiktliga grundundersOkningar
1969 10-
1 Flygbildstolkning f6r jordartsbestamning vid samh811sshyplanering 1-2 U Kihlblom L Viberg amp A Heiner
2 ldentifiering av berg och bed6mnlng av jorddjup med hjalp av flygbilder U Kihlblom
31 Nordisk sonderingsmote i Stockholm den 5-6 oktober 1967 FOredrag och diskussioner
1969 30-
32 Contributions to the 3rd Budapest Conference on Soil Mechanics and Foundation Engineering Budapest 1968
1969 10-
1 Swedish Tie-Back Systems for Sheet Pile Walls B Brems
2 Stability of Cohesive Soils behind Vertical Openings in Sheet Pile Walls Analysis of a Recent Failure B Broms amp H Bennermark
33 Seismikdag 1969 Symposium anordnat av Svenska Geotek-niska FOreningen den 22 april 1969
1970 20 -
34 NAgot om geotekniken i Sverige samt dess roll i plane-rings- och byggprocessen NAgra debattinl8gg och allm8nna artiklar
1970 15 -
T Kallstenius 1 Geoteknikern i det specialiserade samhallet B Broms 2 Diskussionsinl8gg vid konferens om geovetenskaperna
7 mars 1969 3 Geoteknik i Sverige
denser - utveckling och utvecklingstenshy
4 Geotekniska unders6kningar och grundl8ggningsmetoshyder
5 Grundlaggning pA platter - en allm8n Oversikt
35 Piles - a New Force Gauge and Bearing Capacity Cacu-lations
1970 10 -
1 New Pile Force Gauge for Accurate Measurements of Pile Behavior during and Following Driving B Fellenius amp Th Haagen
2 Methods of Calculating the city of Piles A Summary B Broms
Ultimate Bearing Capashy
36 P8lslagning Materialegenskaper hos berg och betong 1970 10 -
1 Bergets b8rf6rmAga vid punktbelastning s-E Rehnman
2 Deformationsegenskaper hos slagna betongpAlar B Fellenius amp T Eriksson
37 Jordtryck mot grundmurar 1970 10-
1 Jordtryck mot grundmurar av Lecablock s-E Rehnman amp B Brems
2 Ber8kning B Broms
av jordtryck met k8llarv8ggar
38 Provtagningsdag 1969 Symposium anordnat av Geotekniska FOreningen den 28 oktober 1969
Svenska 1970 25 -
No
39 Mor8ndag 1969 Symposium anordnat av Svenska 1970 Geotekniska F6reningen den 3 december 1969
40 Stability and Strengthening of Rock Tunnels in Scandinavia 1971 1 Correlation of Seismic Refraction Velocities and Rock
Support Requirements in Swedish Tunnels 0 S Cecil 2 Problems with Swelling Clays in Norwegian Undershy
ground Constructions in Hard-Rocks R Selmer-Olsen
41 Stalp8lars biirf6rm8ga Resultat av faltfOrsOk med 18tta 1971 slagdon G Fjefkner
42 Contributions to the Seventh International Conference on 1971 Soil Mechanics and Foundation Engineering Mexico 1969
Pris kr (Sw crs)
25-
25-
30-
15-

STATENS GEOTEKNISKA INSTITUT
SWEDISH GEOTECHNICAL INSTITUTE
No42
SARTRYCK OCH PRELIMINARA RAPPORTER
REPRINTS AND PRELIMINARY REPORTS
Supplement to the Proceedings and Meddelanden of the Institute
Contributions to the Seventh International
Conference on Soil Mechanics and
Foundation Engineering Mexico 1969
1 Negative Skin Friction for Long Piles Driven in Clay With Discussions Bengt Fellenius amp Bengt Broms
2 Negative Skin Friction on Piles in Clayshya Literature Survey Bengt Fellenius
3 Nuclear Radiation in Construction Control of Earth and Rockfi 11 Dams Lennart Bernell amp Karl Arthur Scherman
4 Stability of Natural Slopes and Embankment Foundations (Gota River Valley) Bengt Broms
5 Vibratory Compaction of Cohesionless Soils Bengt Broms amp Lars Forssblad
Reprinted from Proceedings of the Seventh International Conference on Soil Mechanics and Foundation Engineering Mexico 1969 and from Proceedings of Specialty Sessions Nos 2 and 8
STOCKHOLM 1971
PREFACE
The Swedish contributions to the Seventh International Conference
on Soil Mechanics and Foundation Engineering in Mexico 1969 are
collected in this publication To the first paper are added the
Swedish contributions to the discussions at the Specialty Session
on negative skin friction on piles in clay
The Institute wants to thank Mr LBernell and Mr KAScherman
Swedish State Power Board for the possibility to include their
paper in the publication
Stockholm May 1971
SWEDISH GEOTECHNICAL INSTITUTE
NEGATIVE SKIN FRICTION FOR LONG PILES DRIVEN IN CLAY LE FROTTEMENT NEGATIF POUR DE LONGS PEUX ENFONCES DANS LARGLE
BEN GT H FELLENUS Civ Eng
BENGT B BRO MS PhD
Swedish Geotechnical lnstitute Stockholm Sweden
SYNOPSIS The paper describes the load distribution in two instrumented pre-cast concrete piles which have been driven through 40 m of clay 13 m of silt and 15 m of sand The load is caused by negative skin fricti6n due to reconsolidation of the remoulded clay around the piles after the driving The soil consists at the test site of homogeneous normally consolidated clay with a water content of around 80 and an undrained shear strength at the surface of about 2 tonsm2 and 7 tonsm2 at the depth of 40 m Piezometers and settlement gauges were installed in the soil prior to the driving A new accurate pile-force gauge has heen developed for this project which makes it possible to measure the load and the moment distribution in a pile after driving Measurements showed that the load in the pile immediately after driving was roughly equal to the weight of the pile itself During the five months period following the driving the load in the pile increased by about 30 tons at the bottom of the clay layer This load increase corresponds to a negative skin friction which increases linearly from O at the ground surface to about 1 4 tonsm2 at the bottom of the clay layer The negative skin friction is equal to 17 of the undrained shear strength or to 5 of the average effective overburden pressure
INTRODUCTION TEST PROGRAM
Thick deposits of soft normally consolidated clays The test program consists of tliree phases The first cover large areas in the middle and south western phase concerns the distribution of negative skin parts of Sweden Building in these areas are genershy friction and bending moments during and after the ally supported by end bearing piles which are driven driving of two long unloaded piles which have been through a soft clay to moraine or rock However driven through a normally consolidated clay into silt the general lowering of the ground water table which and sand In the second phase an axial load of 80 occurs in the central parts of the large cities causes tons will be placed on the two piles and its effects on settlements and an increase of the load in the end the negative skin friction of this load will be studied bearing piles due to negative skin friction Great In the third phase a 2 meter high gravel fill will be uncertainty exists about the magnitude of the negashy placed over an area 40 by 40 meters around the two tive skin friction with respect to the undrained shear test piles This will cause settlements in the clay strength of the soil or the effective overburden and thus negative skin friction along the two piles pressure the relationship between settlements and It is anticipated that phase three of this investigation negative skin frictioa and the effect of pile driving will be completed in 1973 on the negative skin friction An investigation was therefore initiated in 1966 in order to answer some of these questions SITE CONDITIONS
A robust and accurate pile force gauge has been The test site is located at the River G5ta Alv approxshydeveloped for this project The pile force gauge imately 20 km northeast of Gothenburg in the southshywas designed to resist the stress conditions during western part of Sweden The soil consists of 40 m of the driving 6pound a pile The conventional system to normally consolidated clay which is underlain by silt measure the negative skin with a series of steel and sand At 35 m depth the clay contains silt layers rods has the disadvantage that only the changes The undrained shear strength water content liquid which take place after the driving can be measured and plastic limits fineness number and unit weight Thus the stress conditions in the pile immediately are shown in Fig 1 The natural water content of after the driving are unknown An additional unshy the clay exceeded the liquid limit down to a depth of certainty in the caiculations is that the value of the about 23 m The undrained shear strength increasGd modulus of elasticity for concrete is uncertain and from about 1 5 tonsm2 at the ground surface to may vary appreciably These variations affect the about 5 0 tonsm2 35 m below the ground surface accuracy of the results Two instrumented reshy The ground water table is located at the ground swrshyinforced concrete piles were driven in June 1968 face The percentage of clay size particles smaller The pore water pressures the soil movements and than 0 002 mm in the clay is about 80 down to a the negative skin friction which develop during the depth of 20 m Between 20 and 30 m the percentage driving and during a five month period after the of clay size particles decreases to about 55 The driving are described in this paper sensitivity of the clay varies between 15 and 20
93
FELL ENUS and BR OMS
SOIL Ii - ~ UNORAINED SHEAR STRENG1H tJfm2 ~ no
CLAY
r- Jr
00
A Natural wotorconhnt ~ ~ Yonbull bon bull ~AnbullnuJ numbbullr bull ~ Swbulldlbullh fol canbull to~t -~Pla1o limit -uLiqud limt
Fig 1 Soil description
PILE TYPE AND DRIVING DATA
Two precaat hexagonal Herkulea pilea of reinfo[ced concrete with a cross aectional area of 800 cm and a circuznference of 106 cm were used for the experishyments Each pile was composed of 11 2 m long segments The bottom segment was provided with a rock point of hardened steel The piles were also provided with a center pipe a thin wall steel pipe with 42 mm diaineter inside dianieter in which deformation gauges were inserted after the driving Also special cable pipes (DB mm) were placed in the piles for the electrical cables leading from the pile fore gauges to the head of the pile
The nominal concrete cube strength was 500 kgcm2 bull The average measured cube strength was 607 kgcm2 28 days after the casting The reinforceshyment consisted of six bars with 16 mm diameter and a yield strength of 60 kgmm2 bull The failure bending moment of the pile section exceeded 8 5 tonm The segments were fastened together in the field by rigid steel joints ae the driving proceeded The strength of the joints exceeded that of the pile eegment
Test pile PI was composed of five pile segments and three pile force gauges and test pile PI of six segments and four gauges The length of the upper
segment of pile PI wae Z 0 m In this pile the lowest gauge was placed right at the pile tip as illustrated in Fig 2 The location of the uile forc-P gauges are shown in Fig 3
Fig 2 Photo of pile-force gauge placed at the pile tip The pile tip is provided with a rock point of hardened steel
The piles were driven with a 4 2 tons drop hammer The height of fall was O 3 m when the piles were driven down to a depth of 40 m Below this depth the height of fall was increased to 0 5 m The total number of blows required for the driving was about 5000 for pile PI and 4000 for pile PII The driving of the first pile (PI) was terminated at a depth of 53 1 m when the penetration resistance of the pile was 8 cm per 50 blows The second pile (PII) had to be driven to a depth of 55 1 m to reach the same final penetration resistance as pile PI (The penetrashytion resistance at 53 m depth was low and therefore an additional 2 m long pile segment had to be added) The driving data indicated that the piles acted as combined friction and end bearing piles
Pile PI was relatively straight after the driving Inclinometer measurements (Kallatenius and Bergau 1961) indicated that the pile tip deviated laterally 1 4 m from its intended position The minimum radius of curvature of the displaced pile was 340 m Pile PI was not as straight as pile PI The pile tip after driving had been displaced 6 2 m away from its intended location The minimum radius of the pile axis close to the pile point was 170 m Laboratory tests have indicated that failure by bending will occur at a radius of 50 to 100 m
INSTRUMENTATION OF PILES
The pile-force gauge used in this project was developed by the A Johnson Institute for Industrial Research The gauge is composed of three load cells which are placed between two rigid steel plates
94
I
LONG PILES IN CLAY
The load in each cell is measured separately by a system of vibrating wire gauges This makes it possible to determine the total axial force and b~nding moment in the test pile at the level of the force gauge The O 4 m long force gauges were corinected to a pile in the same manner as the pile segments The pile force gauge was designed to resist the stress conditions which develop during the driving Laboratory and field teats have indishycated that the maximUin error in the imiddotecorded forces ia less than 2 of the design load The gauges were designed to resist a tension load of 50 tons and a compression load of 150 tons These values can however be exceeded three times withshyout impairing the function of the gauges (Fellenius and Haagen 1969)
INSTRUMENTATION OF SOIL
Piezometers and settlement gauges were installed two months prior to the driving of the pilea All piezometers but one were type SGI which ace providshyed with a closed oil system Pore water pressures are read directly on a manometer (Kallstenius md Wallgren 1956) To measure the pore pressure in the permeable bottom layers an open pipe witn a filter tip was used Each settlement gauge consisted of a number of Z m sections of flexible steel spring reinforced rubber hoses with 32 mm inside diashymeter The steel spring reinforcement allowed the hose to change its length axially but prevented the hose from collapsing when subjected to lateral earth pressure The hose sections were connected by brass rings The settlement gauges were placed vertically in pre-drilled holes in the soil The flexible settlement gauges and the brass rings followed the moVements of the soil It was possible to determine the settlements of the soil from the location of the brass rings vlith respect to a refershyence point at the ground surface by lowering a plumb bob inside the hose When the plumb bob came in contact with the brass rings an electrical circuit was closed which could be observed at the ground surface With this method it was possible to determine the settlements every 2 0 m with an accuracy ofplusmn 2 mm (Wager 1969)
Two settlement gauges were installed next to each pile An additional gauge was installed at some distance away from the pile The gauges were brought down to a depth of 36 m The location of the gauges are shoWTI in Fig 3 The various gauges could not be installed absolutely vertically Howshyever the deviations were small down to a depth of 10 m
Three piezometers were installed next to the preshydetermined pile locations at the depths 9 0 22 3 and 30 5 m below the ground surface One additional piezometer was installed at a depth of 28 6 m some distance aw~y from the two pile At about the same distance from the piles an open pipe with a filter tip was installed at a depth of 45 0 m
Wl W2 ~Q-
PI ~ Pil [ p E IE3 ~2smI
0
0
W3 Pvf1E P~t 2E f oltgtmiddot PLAN 1-JllITI_ gtI - __pvt 1
PI P Il
Id Pvt 3 at Pl Pil10
M3 M7
bi Pvt 2 ot PT Pil
25 bi Pvt 2 E
M2 cl Pvt 1 ot PIPII M6
ij Depth of W1 W2
MS lI Pvt1E open pipe)
gtshy~
u
6 zi M4lt(sst u
601 fi Pile joint
bull =Pile - force gouge (Ml
DEPTH bi Piezometer (Pvt
lJ Settlement gouge (W)
Fig 3 Location of piles and instrumentation
BEHAVIOUR DURING AND IMMEDIATELY AFTER DRIVING
The driving of the two test piles caused movements in the soil These were measured close to the two piles and at some distance away from the piles Also high excess pore pressures were measured
Settlements The driving caused the ground surface to heave 20 mm close to the pile as shown in Fig 4 The heave decreased however with increasing
95
FELL ENUS and BR OMS
depth SCttkrnc-nts were measured belOV a depth of S to 6 m The maximum settlement (50 mm) was mcmiddotlttsurcd close to pile PII at a depth of 11 m The obstmiddotrimiddotccl heave was caused by upward displacements of tlH soil above the pile tip and the observed settleshyments ]Hobably by downwards displacements at and btgtlow the pile tip
W1 AT PI W3 JC laquol Sil SpoundTllEHElff 1E 20 JO 0
)
U I I LJ
~ J-
~J Rocdng l ond en takm dring dtmng pllo PI Oltld p_n ~ 11d~1 7 oro lltgtkor bofoo drorg ~lo PQbullobullz R1Ddu11 1 ond15 ltlrbull toaon Gfer dtvin~ p1
~g lloltgtdn~ ll ~ bktn aUor ro mon1h
~~ w ~-alt DEPTH
Fig 4 Vertical movements in the clay during and after driving
The coritinued driving caused the soil to heave about 10 to 15 mm At gauge WIII located 5 and 11 m
away from the test piles the driving caused a heave or 5 mm at the ground surface The heave deshycreased howevermiddot with depth The displacements of the soil shown in Fig 4 have been evaluated from the assumption that the soil at the lowest measuring point did not move The reported values thus represent relative movements within the clay layer A precision levelling before and after the driving indicated however that the lowest measured point of gauge WI had settled 9 mm The corresponding settlements of gauges WI and WIII were 7 mm and 5 mm respectively These settlements are primashyrily caused by compaction of the silt and sand layers below the clay The two test piles were driven 13 and 15 m into the bottom layers
Pore Water Pressure The pore water pressures measured by all piezometers corresponded prior to the- driving of the two test piles to a ground water table at the ground The driving caused however a large increase of the pore water pressure at the
gauges located at a depth of 20 3 m below the ground surface The pore pressure increase at the gauges located at 30 5 m depth was small since these gauges were located several meters away from the two piles Also the pore pressure increase observed at a depth of 9 0 m was small All piezometers have aftershywards been checked and are functioning properly The excess pore pressure caused by the pile driving and the dissipation of the excess pore pressures with time are shown in Fig 5 for the two gauges located close to piles PI and PII at a depth of 20 3 m The maximum total pore pressure was 40 tonsm2 at this level The correspondin~ total vertical overshyburden pressure is 32 9 tonsm2 at the same level Thus the measured pore pressure exceeded locally the total overburden pressure by 20
Gauge depth 223 meter Original pore pressure 221 lonsrr Gauge Pvl 2 at pile PI and Pll
Fig 5 Excess pore pressure caused by pile driving and its dissipation with time
Forces and bending moments The force gauges in the piles were read each time a new pile segment was added
Measurements indicate that the force in the two piles immediately after the driving was roughly equal to or slightly less than the weight of the pile above the gauge Thus the driving did not cause any axial forces to be locked11 into the piles
The bending moments in the straight pile PI were small These varied between O 4 and 1 3 tonm Larger values were measured in the bent pile PII Gauge MS located 12 m from the pile tip at the boundary between the clay and the underlaying silt and sand indicated a bending moment of 3 2 tonm This bending moment corresponds to about 35 of the failure value The corresponding radius of curvature was 170 m over the length of the gauge
96
--- --
LONG PILES IN Cl A Y
Gauges M6 and M7 indicated a bending moment of 0 9 and 2 4 tonm respectively The corresponding radii were 220 and 190 meters
BEHAVIOUR AFTER DRIVING
The driving disturbed the clay around the piles It was anticipated that reconsolidation of the clay would cause settlementgt of the soil and drag forces in the piles To study this phenomenon the various instruments were read regularly during the five months period which followed the driving
Settlements The settlement gauges indicated that the movements of the soil were small The recordshyed settlements varied between one and three millishymeters
Pore water pressure High excess pore water pressures developed around the driven pile in the clay as indicated by the gauges located at a depth of 20 3 m The excess pore watta1 pressures dissipated with time No excess pore water pressures remained 150 days after the driving as can be seen in Fig 5
Forces and bending mvments The axial force distribution with time is shown in Fig 6 At first the axial load in the two test piles increased rapidly at the different measuring levels Two or three weeks after the driving the rate of the load increase slowed down After about eight weeks the load inshycrease was very small at the upper levels
PI Pll
= ltMlt --
t-5 bulld
~ s
MS --- I _----
----=-middotn-b l ~__------- v __ bull -~- I~--~
7 1--~- -r-_= M
1
c -bull Ml-~
- I jJ
Fig 6 Recorded forces in piles PI and PII
In Fig 7 the m~asured loads have been plotted at different time intervals after the driving The dotted line in this figure represents the WPight of the pile The line marked O represents the load distribution immediately after the driving It can be seen from Fig 7 that the axial load in both piles was less than theweight of the pile immediately after the driving down to a depth of nearly 40 m The load in the piles increased with time and 144
97
days after the driving the pile load exceeded the weight of the pile by 25 to 30 tons at the level of the interface between the clay layers and the undershylaying silt and clay layer This load is still inshycreasing five months after the driving Gauge M 4 in pile PII indicates that most of the load due to negative skin friction along the pile is resisted as positive skin friction in the underlaying silt and sand layers The average skin friction can be calculated from the load distributions It is proportional to the load difference between adjacent levels In Fig 8 is shown the average skin friction resistance for the two piles The points which on the same occasion represent the average skin friction have been connected The measurements indicate that the sltin friction resistance increases approximatelv linearly from zero at the ground surface to 14 tm2
at a depth of 40 m The skin friction resistance below this depth was positive The negative skin friction corresponds to 17 of the undrained shear strength of the clay or to 5 of the effective overshyburden pressure of the soil
PI Pll
---Whlclplbull
-- too~ dtribbulltbullon
M Pile-lore 1r1u~o
61
iho iurbull rbullftrs o 11 do) orto
-~----
-r 1 S 1530 63100 14ay~M5 I I I I
m
Fig 7 Vertical distribution of load in the piles at different times after driving
The recorded bending moments increased after the driving However the increase was small The bending moment at gauge MS which immediately after the driving recorded 3 2 tonm increased by 12 to 3 6 tonm five months after the driving This relative increase was the largest recorded by any of the gauges
FELLENIUS and BRO MS
PI PU
M Plo-lo gugt
0r11~middot~ Tho flure rofbull to
~ ~ut~~~~~ltgtylt
P05JTIVE SKlI FIIICIION bull IIEGATIVE SKIii FRICTION
S~CA-LE_ _----t---~c-------e-- tonoimZ +10 +0 -10 -20
Fig 8 Calcmiddotulated average skin friction at different times after driving
CONCLUSO~S
The test results indicate that negative skin friction can be caused by the remoulding of the clay around driven piles and the subsequent reconsolidation of the soil even if the settlements of the soil are very sinall The measured negative skin friction after
a period of five months corresponded to 17 of the average undrained shear strength of the clay or to 5 of the average effective overburden pressure The resulting axial forces in the piles were resisted by positive friction in the silt and sand layers at the lower parts of the piles Considerably higher values of the skin friction resistance will undoubtly develop when a fill is placed over the area
ACKNOWLEDGEMENTS
This project which is carried out in co- operation with the A Johnson Institute for Industrial Research has been supported financially by the National Council of Building Research (Statens Rild poundcir Byggnadsforskning)
REFERENCES
Fellenius B H amp Haagen T 1969 11A New Pile Force Gauge 11 (To be published)
Kallstenius T amp Bergau W 1961 1In Situ Determination of Horizontal Ground Moveshyments11 Proc 5th Int Conf on Soil Mech a Found Eng Paris Vol I pp 481-485
5allstenius T amp Wallgren A 1956 11 Pore Water Pressure Measurements in Field Investigation Swedish Geotech Inst Stockholm Proc No 13 58 p
Wager O 1969 11 A New Device for Measuring Vertical Distribution of Settlements 11 (To be published)
98
-----
---
-------- -
Contribution to the discussion in the Specialty Session on Negative Skin Friction and Settlements of Piled Foundations
Negative Skin Friction for Long Piles Driven in Clay
by Bengt H FeUenius Swedish Geotechnical Institute Stockholm Sweden
The aim of this discussion is to inform about further developments of the test program that is presented in the paper 11 Negative Skin Fri~tion for Long Piles Driven in Clay11 by myself and Dr Bengt B Broms
The paper shows that driving of displacement type piles in clay causes remoulding of the surrounding clay and excess pore pressures The excess pore pressures dissipated after about 150 days The recorded further settlements 150 days after the pile driving were within the accuracy of the settlement gauges i e 1 mm
The loads in the piles increased almost linearily with time (Fig 1) There is however a slight decrease of the loading rate The loads at the bottom of the clay layer were 52 and 56 tons in piles P I and P II respectively 420 days afterthe installation Fig 2 shows the load distribution in the piles Gauge M 4 in pile P II indicates that the load is resisted by positive friction in the silt and sand layers below the clay Of the 46 tons which has been the load increase since the installation only 10 tons reached the pile tip
The negative friction after 420 days corresponds to 28 of the average original undrained shear strength of the clay or to 9 of the average effective overshyburden pressure
FORCE tonbull
~ ~00~
oo-- M~ ~
lt-- ~
-~------- _ - _----
In the next phase of this investigation which will begin smiddot10rtly a dead load of 80 tons will be placed on each test pile In phase three (after further six or ten months) a 2 m high gravel fill will be placed around the two test piles over an area 40 by 40 meters The results of the various test phases will be published by the Swedish Geotechnical Institute
LEGEND ---WbullM o pio ( bull1 -- Ld dltt~von
1-1 Plo-lmo10i Pbull 1gt1bull rololaquo b n~ u of ltWtbull otlor drn
bull
-1 - I
7 bull
Fig 2 Vertical distribution of load at different times after driving
- --- ~------middot--- bull-- __-_-___ I-______ [____ _bull---- C------------------~-----------l---_j-____j_____j______j__ OJYS AFTER - 50 lOO 150 200 250 lOO 350 lOO 511 $00 DRIVING
Fig Recorded loads in piles P I and P II
Contribution to the discussion in the Specialty Session on Negative Skin Friction and Settlements of Piled Foundations
Design of Pile Groups middotwith Respect to Negative Skin Friction
by Bengt B Brems Swedish Geotechnical Institute Stockholtn Sweden
This review is concerned with the methods which are used in Sweden to design pile groups with respect to negative skin friction Measurements have shown that drag forces negative skin friction) develop along single piles or pile groups when the soil settles with respect to the piles The settlement of the soil may be caused by the placement of a fill around the piles a lowering of the ground water table or by remolding of the soil during the driving The load increase due to negative skin friction often approaches the allowshyable load on the pile when the pile length exceeds 20 to 30 m The negative skin friction can be large even if the settlements are small (a few millimeters) Three different cases are gcinerally recognized as illustrated in Figs ia ib and 1c
Fill ~ E bull cV ~middot II I II =-- ------- ---
Clay I --1 -----~- ~~aJlo51 I _cru19 _cnu9sc I
I I I I
~_permoler ~ aroo
(o)Olso I (t Cose II (cJ Caso m
Fig i Calculation of negative skin friction
Case 1 The piles in the pile group shown in Fig ia are assumed to be widely spaced The height of the fill placed around the pile group or the lowering of the ground water table is large enough to develop the maximum skin friction along all the piles in the pile group It is assumed furthermore that the piles are point bearing and that the pile points do not move when the load in the piles is increased by negative skin friction This is generally the case in Sweden where most piles are driven to rock The neutral point is often assumed to be located close to the pile point since the compression of the pile is generally neglected The negative skin friction resistance will be overestimated by this method if the settlements are small or the pile points move
There are two different methods to calculate the negative skin friction which is assumed to act along the full length of the pile The first method is generally used when the liquid limit of the soil is less than about 50 The negative skin friction c is according to this method calculated from the neg equation cneg = a (f J where a 11 is a coefficient and
ltfi is the effective overburden pressure includingV
the weight of the fill In this case it is thus assumed that negative skin friction is propertional to the effective overburden pressure (f i The values of the coefficient a1 which vary befween O 2 to 0 3 are based on test results reported by Johannesen and Bjerrum (1965) These values have 1e_~n derived from pile load tests in a clay with a relashytively low cp-ratio and a low liquid limit
In the second method which is often used when the liquid limit of the clay exceeds approximately 50 it is assumed that the negative skin friction c is equal to the adhesion of the surrounding neg soil with respect to the pile surface The values which are used to calculate the negative skin friction are generally the same as those which are used to calculate the bearing capacity of single piles in clay as indicated by the following table
Table I Evaluation of the unit skin friction resistance ca
(a) cult 0 5 kpcm2
Skin-friction resistance C a
Steel piles 05 C u
Concrete piles 08 C u
Timber piles 10 C u
(b) cgt 0 5 kpcm2
2Steel piles 0 1 kpcm Concrete piles o 3 Timber piles 05
One may question if the same values of the unit adhesions should be used to calculate the negative skin friction as those used in the calculations of the bearing capacity The maximum value of the adhesion governs the negative skin-friction resistance while the minimum value is of interest when the bearing capacity is calculated It may be argued that all piles which are affectetj by negashytive skin friction smiddothould be designed to resist a drag load which corresponds to the full undrained shear strength of the soil as measured by e g vane tests unconfined compression tests or fallshycone tests instead of a reduced value which correshysponds to a lower limit of the adhesion
Case II It is assumed in Fig 1b that the piles are closely spaced and that the height of the fill or the lowering of the ground water table are sufficiently large to mobilize the full skin friction resistance or the full shear strength of the soil along the perimeter area of the pile group The average skin friction cneg piobably will be less than the undrained shear
strength of the soil The perimeter of the pile group partly follows the pile surfaces The undrained shear strength of the soil is generally used for the perimeter area which follows the undisturbed soil while reduced values are used for the area which follows the surfaces of the piles The pile group carries also the weight of the fill which is located immediately above the piles or the increase of the boyant weight of th_e soil within the pile group when the ground water table has been lowered It is thus assumed in the calculations that the vertical effective stress in the soil within the- pile group will not at the level of the rock surface be affected by a lowering of the ground water table The total drag force is as~umed to be equal to the sum of the negative skin friction along the perimeter area and the weight of the fill within the pile group This total drag force is distributed equally among all the piles in the pile group It may however be argued that the change of the boyant weight of the soil within the pile group should not be included in the calculations since the total weight of the soil is not affected This is frequently done by many designers
Case III The piles in Fig 1c are relatively closely spaced and the height of the fill or the lowering of the ground water table is moderate to small In this case it is assumed that the pile group carries a load which corresponds to the weight of the fill within the area indicated in Fig 1c The sides of the inverted truncated soil cone have a slope of 1 3 to 1 5 The proceedures used by different designers differ due to lack of test data If settlem~nts are caused by a lowering of the ground water table it is often assumed that the total drag force corresponds to the change of the boyant weight of the soil below the area indicated in Fig 1c The pile group will in this case carry a load which is equal to the weight of a column of water with a height equal to a lowering of the ground water table
It should be pointed out that the available test data are extremely limited that measurements primarily have been made on single piles and that the settleshyments which have occured around the instrumented piles have been relatively large When additional test data become available it is likely that the presently (1969) used design methods will be changed It should however also be pointed out that these design methods generally do not take illto account the increase of negative skin friction which is caused by remoulding of the soil during driving middotThis inshycrease of the pile loads can be very large in Cases II and III For these cases the calculated negative skin friction is normally moderate
There are several methods to calculate the allowshyable load for a pile group allow as indicated below
group0 group ult Qneg
( I)Qallow F
Qgroup group ult
0 --p-- Qneg (2)allow
In the first case the safety factor Fis -applied on both the calculated ultimate bearing capacity of the pile group as well as on the negative skin friction Qnegmiddot In the second case the factor of safety is
only applied on the calculated ultimate capacity The first method which is normally used in Sweden gives a higher allowable load than the second method
The consequenses of exceeding the ultimate capacity of the pile group are often not serious since excessive pile loads caused by the negative skin friction will generally not cause collapse of the supported strucshyture If a pile group settles then the negative skin friction changes into positive skin friction which will contribute to the bearing capacity of the pile group Thus a relatively low safety factor can be used with respect to negative skin friction
References
Johannessen IJ and Bjerrum L (1965) Measureshyment of the compression of a steel pile to rock due to the settlement of the surrounding clay Proc 6 Int Conpound Soil Mech a Found Engng Vol Z pp 261-264
NEGATIVE SKIN FRICTION ON PILES IN CLAY-A LITERATURE SURVEY
Bengt H Fellenius Swedish Geotechnical Institute Stockholm Sweden
Introduction
In 1965 lhe Axel Johnson Institute for Industrial Research in cooperation with the Swedish Geotechnishycal Institute initiated an investigation on negative skin friction on piles in clay The work is supported financially by the Swedish Council for Building Research
The first step in this investigation was a literature survey This article is a survey of papers which have been published on negative skin friction in clay up to the end of 1968
Contents
1 Statement of the problem
2 Previous investigations
2 1 Structural damage caused by drag forces
2 2 Cases where drag forces have been
considered
2 3 Research on drag forces on piles
2 4 Comments on section 2
3 Calculation of drag forces
3 1 Terzaghi and Peck
3 2 Zeevaert
3 3 Buisson Ahu and Habib
34 Elmasry
3 5 Johannessen and Bjerrum
3 6 Brinch Hansen
3 7 Others
4 Comments and conclusions
5 Literature index
6 List of symbols
1 Statement of the problem
When the soil around a pile settles shear forces are induced along the pile surface and the load in the pile is increased Usually this phenomenon is called negative skin friction In cohesive materials the terms 11 negative skin cohesion and 1negative skin adhesion 11 are sometimes used
2 Previous investigations
Under this heading some cases where negative skin friction has caused structural damage (2 1) are deshyscribed as well as cases where negative skinfriction has been taken into account in the design (2 2) Also the research on drag forces in piles is reviewed (2 3)
2 _Structural damag~ caused 1Y dras-forces
McKay_(1938Jx) describes how a fill around a buildshying which had been founded on concrete piles caused large settlements around the piles The piles were not designed to carry the resulting drag forces and the piles failed No calculations were given by McKay McKay also describes how piles for a river quay in 10 m depth of water were damaged by drag forces caused by a fill of a silty material which had been deposited around the piles Negative skin friction developed both in the silty fill and in the underlying materials through which the piles had been driven
Florentin and l~Heriteau (1948~ describe a case where concrete piles with 0 8 m diameter were driven through a 4 m thick fill and through undershylying layers of very soft clay into a dense sand sublayer The piles settled 30 cm in three yearsmiddot which according to Florentin and lHeriteau 11 can only be explained by negative skin friction on the piles 11 The settlement of the piles was indirectlybull
caused by unsatisfactory pile driving The settleshyment stopped when the pile tips reached the undershylying dense sand
Moore (1949) describes a case where a wooden pile had been driven through a stony fill and underlying compressible soils down tc firm layer The thickshyness of the fill was 13 m and the compressible soils
x) See literature index in section middot5
2
consisted of a 9 m thick layer of mud and 6 m of clay The settlements of the fill and of the compressible layers caused drag forces of such magnitude that the pile pulled loose from the supported structure The design pile load had been determined from i dynamic pile formula The pile might have been damaged during the driving) The drag forces as estimated by Moore were 170 tons for the fill and 12 tons for the mud and clay
Milner (1957) describes a tunnel which was founded on 40 cm diameter cast-in-place concrete piles The piles were driven through 8 m of soft clay into an underlying layer of mica An 8 m thick fill caused settlements in the clay which resulted in estimated drag forces of 80 tons Because of this additional load the piles were pushed down into the mica and the tunnel walls cracked
lt-pp_ (~i~~)_ relates in a letter that settlements of about 2 m caused drag forces of such magnitude around unreinforced concrete piles under the floor of a hangar building at La Guardia Airport New York that some piles were pulled loose from the floor Attempts were made at La Guardia to measshyure the drag force by measuring the force that was required to prevent the pile from sinking When this force reached 30 tons the pile failed in tension
Further examples are given by Chellis (1951)
2 2_ Cases_ where drag forces have been considered in the desipoundn
Golder and 5pence t1960) mention that piles for a bridge where large drag forces were expected were covered with half an inch thick layer of asphalh The piles were put down in predrilled holes in the ground to protect the asphalt
Resendiz_l1964 a[ describes a case where concrete piles of variable diameter were used one upper part (~ 35 cm of about 30 m length) and one lower part (lt6 20 cm of about 3 m length) The piles were driven to a firm sand layer The allowable pile load was the estimated ultimate bearing capacity of the pile tip i e the safety factor against soil failure was equal to 1 When drag forces on the piles were caused by the settlement of the ground the pile tips were pressed down into the sand layer and thus the building on the piles settled at the rate of the ground surface The tests have been described in detail by Resendiz (1964 b)
Girault ( 1964) describes the difficult pile foundation problems in Mexico City These problems are caused by the lowering of the ground water level and the resulting large regional settlements Buildshyings which are founded on end-bearing piles appear to rise with respect to the ground and buildings on friction piles settle unevenly because of large drag forces on the piles Girault has proposed a comshybination of friction piles and end bearing piles (See fig 2 2 1) When the friction piles (A) sink load is transfered through the soil between section oC - cl and section (3 - (3 on to the end bearing piles (B) A building founded on this piling system will accordshying to Girault settle evenly at the same rate as the ground surface
Further examples can be studied in papers by f-e_ev-)5_lJp]_~ )_c(~ 7)_b_)_~~i _(tJJ 2_s_O_ea_ ~196_1 _and Locher_ 1965
--middot
Firm rond subloy(r
Fig 2 2 1 Combination of friction and end bearing piles A= friction pile B = end bearing pile
2 3 _Research on draG forces on p-les
GantL St~pbens and Moulton (19581 describe tests on steel pipe piles which were equipped with electrical strain gauges The purpose of the tests was to determine the allowable pile load for a bridge foundation The soil consisted of 7 m of sandy fill 10 m of silt and a sublayer of sand The piles were of 30 m length and were thus driven about 12 m down into the sand Drag loads of about 90 tons were measured four months after the driving of the piles
Tchebotarioff_li 958) in the discussion following the article by Gant et al indicated a few possible errors in the measurements and pointed out that only a part of the measured axial pile forces could have been caused by drag forces
Weele t1964) describes a case where the drag forces acting along wooden piles of different lengths have been determined Three piles were driven at a spacing of 4 m down to a depth of 13 3 m (No 1) 15 5 m (No 2) and 17 5 m (No 3) The soil consisted of 6 m of sand 7 m of clay and a sand sublayer which at a depth of 17 m was very firm The ground water level in the area was initially 1 m below ground surface In an initial phase the ground water level was lowered 6 m and in a second phase an additional 3 m This caused settlements in the soil and the piles were dragged down See fig 2 3 i
Along the upper part of the piles the settlement in the soil was larger than the settlement of the piles and drag forces were developed along this part of the piles In the lower part the settlements were smaller than those of the piles and thus positive skin friction was obtained along the surface of the piles
----------------------------------
-----------------
3
TIME IN DAYS1~s~RPbbJo~se~l~~ollldllpgtbb~o5er~~===~--ae-
10 10
os 1 O
-20 ___
~ ~
30 - TESTPI LE 3
1-1-1-1 1
o I I I I TEST PILE 1
u 50 ~ I I -r-1 z
60 TESTPI LE 1
-k I 70 ROIINn CURFAC - 80 I-
90
Fig 2 3 1 Settlement-time relation for the ground surface and the 3 test piles during the two stages of the ground-water lowering (After Weele 1964)
From pulling tests on concrete piles the average shear stress along the pile surface were determined as a fW1ction of the pile displacement The maxishymum resistance was obtained at a displacement of about 10 mm The magnitude varied for the three types ot soil
In the upper sand layer 3 tm2
In the clay 1 5 tm2
In the sand under the clay 20 tm2
From these results the drag forces on the piles were calculated The total drag load on pile No was estimated to 24 tons
2 4 Comments on the reviewed cases
Drag forces on piles can be large and cause piles to settle This may damage the supported structures However in the literature on drag forces on piles no reference has been found of the influence of negative skin friction on piles which have been driven to a very firm layer Severinsson_(1965) reportes that no settlement has been observed for 300 structures in Sweden founded on long high quality precast concrete piles driven to rock or to similar layers through settling soil layers
The magnitude of the negative skin friction given by Weele may be compared with the values reshycommended by Tomlinson (1963) for the calculashytion of drag forces along piles
Clay and sitt o 7 3 tm2
Very stiff clay 5 20 tm2
Loose sand 4 tm2
Dense sand 3 7 tm2
In the same paper Tomlinson mentiones that drag forces middotsan be caused by the remoulding and heave of sensitive clays during E]e driving as is shown in Fig 2 4 1 This effect has also been discussed by among others ~~S~S~1-9~ (1_9_3_2J 931Il]1_i1-g_S_l~a_l _lf 9_4_8)2 _ _s_cp_e_~~~fj_(_1J1J] and Zeevaert 1949 1
Heaved-up soil reconsolidating under own weight causing dra o n on piles
Fig 2 4 1 Effects of ground heave on groups of driven piles in clay
3 Calculation of drag forces
Under this heading the existing theories for detershymining drag forces are reviewed
3 1_ Terza_ghi and Peck Ji948 recommend the following method for determining drag forces on pile groups The soil around the piles consists of a compressible layer of clay and a surcharge causes the clay layer to settle The axial force (F) on a pile group is then the sum of the structural load (F ) and the drag force (F ) The drag force itself0is equal to the sum of the 1ampeight of the fill within the pile group (F~) and the skin friction F~) along
the perimeter of the pile group F~ is divided equally between the piles can according toF 11
Terzaghi and Peck vary bet~een zero and the maximum value calculated from equation 3 1 3
F = F + F t F 11 x) 3 1 1Q n n
Structional load on the pile
Weight of fill carried by one pile
F =~bullmiddotHF 3 1 2 n n
A Area of the pile group
n Number of piles
HF= Thickness of fill
Y Unit weight of the surcharge material
F 11 = load caused by settling of the surshyn rounding clay
F11~ S 3 1 3 n n
c Circumference of pile group
HL = Thickness of clay layer
T Average shear strength of clay
4
To reduce of the magnitude of the negative skin fricshytion Terzaghi and Peck recommend that the distance between the piles should not exceed Z 5 pile diashymeters
3 2_Zeevaert_(_1959J states that the ultimate point bearing capacity of piles which have been driven through compressible soil to firm sand layers can be calculated from the equation
3 2 1
Failure load (soil failure)
A factor which is a function of the angle of internal friction (-p) and the relative density of the sand (Dr)
N = N middot (D + O 1)r q r
Nq is a function of ltP It is assumed that the shearing strength is fully mobilized on the surface of failure
a Pile area
p h = Effective vertical soil0
pressure in the sand at the pile tip
The failure load F B depends on the effectiwovershyburden soil pressure at the pile tip When the soil settles the vertical pressure poh is reduced to
pvh by load being transfered to the pile (Fig 3 2 1)
Thus the failure load FB is reduced to F~
z
fig 32 1 Reductionmiddot of th~ effective vertical pre~sure
The middotshear force in the soil along the pile is accordshying to Zeevaert a_function of p
0
3 2 2
is the ratio between the horizontal anq the vertical pressuie in the soil at the pile surface and
tanip is the bullratio between the horizontal pressure against themiddot pile and the shear force along the pile
When p is reduced to p the shear strength is also0
reduced This is a basi~ assumption for Zeevaeres ~athemtical d~riv~ng of the following formulas
The total drag force is derived at
3 2 3
where n= Number of piles per unit area
i_ e-mz)= ( 1 - 3 2 4Pv m
i (1 - e-mh) 3 2 5Pvh = m
m= n UK tanip 3 2 6 0
This approach to negative skin friction is mainly dependant on the validity of Eq (3 2 1) and (3 2 2) These equations do on some occasions not agree with experimental facts as shown for example by Vesic_l1964J Furthermore it is doubtful whether Eq 322 is valid in clay
Zeevaert s approach refers to large pile groups of piles The equations can not be used for a single pile without making certain assumptions about the load distribution around the pile
de _Beer _lt 967) has developed Zeevaert s approach and has published nomograms that simplify the use of the equations In the case of a surcharge on the ground surface de Beer assumes that the area ffecting the single pile is equal to the base area
a 90deg cone with the height equal to the depth of the settling layer
3 3 Buisson Ahu and Habib 1960) have studied theoretically the stress distribution along a pile which has been driven into a compressible clay Settlements of the compressible layer are caused by a fill placed on the ground surface The pile tip rests on sand
The following equation is given (See Fig 3 3 1)
F point F Q + F~ + r middot V middot Z - r V middot H-Z) 3 3 1
where FQ F and F t are defined in Fig 3 3 1 n po1n
u 3 3 2F~ = O 30 2
the term 0 30 is a 11friction coefficient11
which can be compared with K bull tanip0
unit weight of fill
u perimeter of pile
T shear strength of clay
z depth to the neutral point i e the depth along which the dr~g forces act
5
settlement z difference
pile-soil H
_neutral point
Fig 3 3 1
The distance Z to the neutral point can be detershymined by calculating the pile compression and the soil compression separately by iteration procedure The tip of a pile which has been driven to bedrock or to a similar very firm layer does not move when loaded The neutral point must in this case be very close to the pile tip due to the low compressibility of the pile Thus the last term in the equation (3 3 1) is small and can be neglected
34 Elmasry (1963-has tested 80 cm long model Steeff)ffeS~-WhlCh-were provided with strain gauges The piles were driven through a 50 cm thick layer of silty clay which was mixed in a soil mixer beshyfore it was placed in the test cylinder The pile tips were located in a sand layer A load was applied on the cla)- surface through a plate The forces in the model piles were measured for different loading conditions Elmasry derived from the test results an equation to calculate the drag force The maxishymum value of the drag force was found to be proshyportional to
the consolidation pressure from the surface load (pc)
the pile perimeter (U)
the thickness of the clay layer (H)
the ratio between the dry weight of soil per horizontal unit area and the consolidation pressure
the natural water content (w)
The maxilnum value of the drag force was a linear function of these parameters taken separately Comshybining these functions Elmamiddotsry derived the following formula
Fn=Fn-s+0416middot (2middot pcmiddot Hmiddot U 2
O 70 middot middot
w p3 ___c) 3 4 1
15 1d
F is the drag force due to the consolidashyn-s tion of the clay under its own weight This dr1g force can be calculated from the following equation
H T bull dH = U middot H middotTFn-s=JUmiddot -middotp-s p-smean0
is given as 30 of the shear strength of the clay at the final stage of consolidation Elmasry referes to Zeevaert (1957 a)
3 5 Johannessen and Bjerrum (1965) describe reSUlfitfiOffi-teSfs-oii-tWOSteeipliis 47 cm in diashymeter with a length of about 60 m which were driven to bedrock through a layer of clay of about 50 m thickness
After the piles were installed a fill with a height of about 10 m was placed around the piles A slide in the underlying clay disturbed the tests and results were obtained from only one of the two test piles The deformations caused by drag forces were measured on this pile through a system of rods Since the modulus of elasticity of the steel material was known the average shear stress s along the pile surface could be calculated The shear stress corresponded to the equation s = p bull K bull tanP
0
The measured drag load at the pile tip exceeded the ultimate bearing capacity of the pile tip
The tip penetrated 6 cm into the underlying rock This penetration occured slowly and in short steps At each increment the pile was partly unshyloaded The drag force decreased momentarily
The largest calculated value of K bull tanP was O 20 which corresponded to a total pilf shortening of 2 5 cm The calculated total maximum drag load was 300 tons On the basis of these results Bjerrum and Johannessen recommend that the calculated drag loads on piles in loose marine clays should correspond to 20 of the final effektive vertical pressure in the clay i e
K bull tanO = 0 20 0
F = 4-u Sbull dz= o20Ju- pmiddot dz 3 5 1 n J
0 0
3 6_Brinch Hansen_(1968) has investigated thellretishycally the skin friction on piles in general and applied the results on negative skin friction Brinch Hansen derived the following equation
3 6 1s -47 +6~-1Jii-n=bc-
s = shear force (negative)
p surface load per unit area andor pore pressure d~crease in the soil
D pile diameter
b distance between piles in a group
----------------
6
Equation (3 6 1) gives an upper limit of the negative skin friction Brinch Hansen states that the maxishymum negative friction is also governed by the maxishymum pull out resistance of the pile The theoretical expressions for the pull out resistance are given in the paper
Brinch Hansen applied Eq (3 6 i) on the pile tests reported by Johannessen and Bjerrum Chapter 3 5 above) An extremely good agreement was obtained between measured and calculated drag load This agreement may only be a coincident as is pointed out in the paper
3 7 Other studies
Other theoretical studies of negative skin friction have been published by Yokowo et al (1968) and p_op~~~-ltsectL~_l1J_6_8J It is assume_cf in these studies however that both the soil and the pile material are purely elastic These assumptions limit themiddotpractical application of the theories as soil and especially the soft clays in Sweden do not behave elastically These studies have therefore not been cited here
4 Comments and conclusion
Certain assumptions and extensive simplifications must be made as to the soil conditions when applyshying the equations bymiddotBuisson et al and Elmasry on practical cases Since the calculated drag forces are to a large extent dependent of these assumpshytions it is difficult to estimate the accuracy of the proposed methods
When tr1e negative skin friction is calculated according to the method proposed by Terzaghi and Peck it is difficult to choose the value of to be used in the calculation of F It is far from certain that shear is fully developJld along the full perimeter area of a pile or a pile group The value of T deshypends also on the remoulding of the soil during the pile driving and on the resulting reconsolidation of the soil
In Zeevaert s theory the shear force along the pile depends on the resulting overburden pressure in the soil after unloading Part of the overburden is transferred to the pile and will depend on the coefficient K middot tanlp These factors vary with the soil conditioJgts and the method of pile installation However very little is known about how negative skin friction is affected by these factors
Johannessen and Bjerrum base their recommendashytion on the results from a single test pile in loose marine clays in Norway Their equation (Eq 3 51) is simple and can easily be applied on practical cases As mentioned above the general validity of this equation remains to be proved However the equation is the only one that is derived from an actual field test
Before any definite recommendations can be given the parameters which affect the skin friction such as soil conditions soil characteristics and magnishytude of the consolidating pressure must be evalushyated in the field and in laboratory Especially full scale tests should be of value Furthermore it
will be essential to investigate the effects of pile driving and the rate of soil settlement upon the magnitude of the shear forces
Once the maximum drag load can be evaluated the important question of how this drag load affects the behaviour of the pile and how it can be taken into account when designing the actual pile founda tion remains to be answered Fellenius (1964) has proposed for a point bearing concrete pile driven in underconsolidated clay (in southern Sweden) that a drag force corresponding to the original undrained shear strength of the clay should be assumed to act along the pile surface down to a maximum depth of 20 m or for piles shorter than 40 m only along half the length of the pile The sum of the drag load calshyculated in this way the maximum design load and the weight of any fill located within a pile group should not exceed the ultimate strength of the pile section i e about O 65 of the cube strength
This literature survey indicates that drag forces can cause piles to sink with fatal results when the piles are supported by sand strata or any material in which the piles can penetrate Local experience will on many occasions indicate whether a proposed design will be safe or not When high design loads are used or the driving conditions are severe a more thorough penetration of the problems will be required
5 Literature index
Brinch Hansen J (1968) 11A theory for skin friction on piles 11 bull Danish Geotechnical Institute Bulletin No 25 pp 5-20
Buisson M Ahu J and Habib P 1960) 11 Le frottement negatipound 11 Annales de Institute Techshybull
nique de Batitment et des Travaux Publics No 145 Paris 18 pp
Casagrande A 1932) 11 The Structure of Clay and Its Importance in Foundation Engineering 11 Procbull
of the Boston Soc of Civil Eng Val 19 No 4
bullChellis RD (1951) npile foundations 11 McGraw Hill Book Co New York 1951
Correa JJ (1961) uThe Application of Negative Friction Piles to the Reduction of Settlement11
bull
Proc Fifth International Conference on Soil Mechanics and Foundation Engineering Paris Vol II pp41-44
Cummings A E Kerkhoff G D and Peck R B (1948) 11 Effects of Driving Piles into Soft Clay 11
bull
Proc ASCE Val 74 pp 1553-1563
de Beer E (1966) 11 Berekening van de negatieve wrijving op palen 11 bull Tijdschrift der openbaren werken van Belgie No 6 1966 p -29
Elmasry MA 1963) 11 The Negative Skin Fricshytion of Bearing Piles 11 bull Ph D Thesis at Swiss Federal Institute of Technology Ztirich 115 pp
Fellenius Bror (1964) 11Aktuella pcllningsproblem 11 bull
Nordisk J~rnbanetidskrift nr 6 1964 pp 156- 162
7
Florentin J and 1-Heriteau G (1948) 11 About an Observed Case of Negative Friction on Piles 11
bull
Proc Second International Conference on Soil Mechanics and Foundation Engineering Rotterdam Val V pp 155-156
Gant E Stephens J and Moulton L (1958) 1Measurement of Forces Produced in Piles by Settlement of Adjacent Soi1 11 bull Highway Research Board Bulletin 173 Washington D C pp 20-37
Girault P (1964) 11 A New Type of Pile Foundashytion11 Proc Conference of Deep Foundation Mexico City dee 1964 16 pp
Golder H Q and Spence RA (1960) 11 Engineershying Properties of the Marine Clay at Port Man B C 11 bull Proc 14th Canadian Soil Mechanics Conshyference 1960 p 133
Johannes_sen IJ and Bjerrum L (1965) 11 Measurement of the Compression of a Steel Pile to Rock due to Settlement of the Surrounding Clay 11
bull
Proc Sixth International Conference on Soil Mechanics and Foundation Engineering 48 pp 261-264
Kapp M S (1965) Letter to the author dated Nov 1st 1965
Locher H G (1965 ncombined Cast-In-Place and Precast Piles for the Reduction of Negative Skin Friction Caused by Embankment Fill 11
Proc Sixth Int Conpound on Soil Mech a Found Eng 414 pp 290-294
McKay GA (1938) 11 Discussion on Soil Reactions 11 bull Trans ASCE Val 103 p 1220
Meyerhof G G (1959) 11 Compaction of Sand and Bearing Capacity of Piles 11 bull Proc ASCE Val 85 SM No 6 pp 1-30
Milner R P 1957) Discussion on Session 6 Proc Fourth International Conference on Soil Mechanics and Foundation Engineering London Part 3 pp 201-202
Moore WW (1949) 11 Experiences with Preshydetermining Pile Lengths 11 Trans ASCE Val 114bull
pp 366- 367
Poulos H G and Mattes N E (1968) 11 The anashylysis of downdrag in end- bearing piles due to negashytive friction 11 bull Univ of Sydney Australia Research Report No 91 p 16
Severinsson S (1965) 11 Praktiska erfarenheter av rationell stodpllning med prefabricerade beshytongpillar11 Tidning for Byggnadskonst Arg 57 nr 12 p 565
Restlndiz D (1964 a) 11 Estudio de campo sabre pilotes de concreto reforzado 11 Rev Ingenieriabull
Val 34 No 1 pp 101-110
Resendiz D (1964 b) On a Type Point-bearing Pile through Sinking Subsoi1 11 bull Proc Conference on Deep Foundations Mexico City dee 1964
Terzaghi K and Peck R B (1948) 11 Soi1 Mechashynics in Engineering Practice 11
New York 1948 pp 473-474
Tomlinson MJ (1963) 11 Foundation Design and CorlStruction 11 Pitman amp Sons Ltd London ppbull
308 376 and 394
Tschebotarioff G (1949) 11 Discussion middoton Effects on Driving Piles in Soft Clay 11 Proc ASCE Valbull
75 pp 671-676
Tschebotarioff G 1958) 11 Discussion of Measureshyment of Forces Produced in Piles by Settlement of adjacent Soi1 11
bull HRB Bull 173 pp 37-43
Weele A (1964) 11 Negative Skin Friction on Pile Foundation in Holland 1 bull Proc Symposium on Bearing Capacity of Piles Roorkee India febr 1964 10 pp
Yokowo Y Yamagata K and Nagaoka H (1968) non negative skin friction acting on a pile-group11
bull
Trans of the Architectural Institute of Japan No 150 August 1968 pp 51-57
Vesic A S (1964) 11 Investigations of bearing capacity of piles in sand Proc North Am Conpound on Deep Foundations Mexico City
Zeevaert L (1949) 11 Discussion on Effects of Driving Piles in Soft Clay 11
bull Proc ASCE pp 661-668
Zeevaert L (1957 a) 11 Compensated Friction-pile Foundation to Reduce Settlement of Buildings on the Highly Compressible Volcanic Clay of Mexico City11
bull
Proc Fourth International Conference on Soil Mechanics and Foundation Engineering London Val II pp 81-86
Zeevaert L 1957 b) 11 Foundation Design and Behaviour of Tower Latino Americana in Mexico City ceotechnique Val VII Sept 1957 pp 115-133
Zeevaert L 1959) 11 Reduction of Point-bearing Capacity of Piles Because of Negative Friction Proc First Panamerican Conference on Soil Mechanics and Foundation Engineering Sept 1959 Val III pp 1145-1152
Zeevaert L (1963) 11 Foundation Problems Related to Ground Surface Subsidence in Mexido City11 Fieldbull
Testing of Soils ASTM Special Technical Publ No 322 pp 57-66
----------------
----------------
8
7 Symbols
General
volume
weight
safety factor
Stress and strain
p effective vertical soil pressure
original effective vertical soil pressure
decreased effective vershytical soil pressure
consolidating pressure callsed by overburden
5 shear force
T shear strength
shear strength after conshysolidation
T = 0 30 middot (p-s s
Soil classification
w water content in of dry weight
Y unit weight
1 effective unit weight
Y unit weight of solid particles5
Yd dry unit weight
p angle of internal friction
Dimensions
B width
L length
H depth thickness of soil layer
z depth coordinate A certain value of z writes h
Pile symbols
D pile diameter (side)
u pile perimeter
a pile area
Z depth to the neutral point
axial force in pile
structure load
failure load
drag force
F~ drag force in or from fill
F drag force caused by soil settling around a pile
C perimeter of the polyhedron surrounding a pile group
A area of the polyhedron surrounding a pile group or the fill area affecting the pile
n number of piles in a pile group
n number of piles in a pile group per unit area
the ratio between the vertical and the horizontal soil pressure
m = n U bull K tanip0
acc to eq 3 2 6
NUCLEAR RADATION IN CONSTRUCTION CONTROL OF EARTH AND ROCKFLL DAMS RADATONS NUCLEARES DANS LE CONTROLE
DE LA CONSTRUCTION DES BARRAGES
l BERNELL CE and KASCHERMANCE Swedish State Power Board Stockholm Sweden
SYNOPSIS
During the later years the nuclear radiation technique has been widely used in soil investigation in order to deshy
termine certain characteristic properties of soils Principally the development in this field has been concenshy
trated on methods for determining the moisture content in soils and the density conditions in situ and in comshy
pacted embankments whereas very little attention has been devoted to the possibility to apply the new techshy
nique to other fields of soil- and rock mechanics (Bernell and Lindbo 1 1965) In connection with the design and
construction of several earth and rockfill dams the Swedish State Power Board has developed the nuclear radiashy
tion technique for solving many problems in the construction control The experiences thus obtained have reshy
sulted in reliable and simple methods for determining settlem~nts in earth and rockfill embankments and for
controlling the effect of grouting 10 soil and rock These applications of the nuclear method are briefly deshy
scribed in the following
USE OF NUCLEAR METHODS FOR MEASURING
SETT FMENTS
For determining the vertical movements in compacshy
ted earth and rockiills the telescoping pipe device
ith the horLrnntal crossarms is often used This
measuring method has also been applied to Sv edish
dams but experience has shown that it has many
disadvantages (Bernell 1964) In ~mbankments
which have been filled according to the wet-compacshy
tion method the horiLontal movements often become
so large that the pipes break off Another drav -back
is that the pipes and the crossarms must be installed
during the construction periods ltnd thus frequently
cause trouble during the filling operations
In most of the dams constructed by the State Power
Board as rell as by other poer companies in Sweshy
den during the later years the nuclear method was
chosen for determining the simultaneous settlements
at different elevations in the fills (Bernell 1967) 60According to this method a radioactive isotope Co
is placed in the measuring point and the radiation
from the isotope is determined by means of a Geiger-
Milller detector Generally the measurements are
carried out in a steel pipe protected from the surshy
rounding soil by an elastic pipe casing The location
of the isotope is indicated by a peak value in the rashy
diation intensity and thus the elevation of the meashy
suring point can be determined
xperience has shown that the nuclear method can
asily be applied to settlement measurements in
both soil and rockfill embankments Generally the
isotopes are placed in the fill close to the pipe and at
different elevations Fig l shows a typical diagram
from settlement measurements in an earth and rockshy
fill dam In this case the measuring section included
both the core and the rockfill zones Long term meashy
surements in this and many other dams have proved
that the method is very simple and reliable The
accuracy in the results is also very good about 1 cm
at a depth of 100 metres
285
BERNELL and SHERMAN
Upstream rockfill Moraine core Pipe I Pipe II
+215 - - II I I
1-- ~Measuring pipe 1 ~
11 5
I I f
-I I I I
I --210
Height of fill
I
I -Reservoir level
110 I I
I I I
205 -Isotope I
I I I I
105 I I I I
I r I I I
E 200 C
I I I I
I I -
100 I I I I
C 0-
r-- J
I r bull J 0 gt bull
w 195 ~
Igtlt--I I
I I
195
I I
I -- ~
I
I I I
190
185
-
I I
J
I I I I I
---- 190
185
Ilt
I I I -I
I I
I -I I -I -~ -
I I
I
I
i I
----7
-- ---
I I I -~ _J I
I L - -1
180 1965 1966 1967 1968
1N I 1965 1966 1967 1968
II 220E
C Upstream
200rC
~
1aoL bull 0 gt
w 160L e
Fig 1 Settlements in an earth and rockfill dam determined
by means of nuclear measurements
286
NUCLEAR RADIATION IN CONSTRUCTION CONTROL
Since themiddot installation and the maintenance of the
pipes often cause difficulties with regard to the filling
works a modified method for performing the meashy
surer9-ents has successfully been applied The meshy
thod is based on the fact that the range for the radiashy
tion in a soil is relatively large also for very small
quantities of the isotope In a recently completed 60
dam small quantities of Co were placed directly
on the compacted surface within an area of 2 x Z
metres and with a spacing of o 25 metres After
completion of the filling works measuring holes
were drilled down to the surface with the isotopes
Although the holes had to be drilled to a depth of
about 30 metres the measurements could be
successfully executed
The nuclear method is also of great value for detershy
mining additional settlements in natural soil strata
beneath supporting foundations
In this case the isotope is placed in a mechanical
shot-device which is inserted in the pipe after
drilling of the hole By means of the shot-device the
isOtope can be placed in the soil at any desired depth
This method can be applied to many cases in foundashy
tion engineering1 where it may be of special interest
to obtain reliable data concerning the compressibishy
lity and the settlement conditions in the underground
middotrn construction control it is often desirable to arshy
range the measurements in such a way that both the
vertical and the horizontal movements can be detershy
mined by using the same installations For measurshy
ing horizontal movements the strain gauge inclinoshy
meter is generally used (Kallstenius and Bergau
1961) By choosing the diameter of the pipe so that
the pendelum can be inserted in it the same pipe
can be used for both vertical a1d horizontal meashy
surements This combination of measurements has
successfully been applied to the control of the stashy
bility oi slopes
USE OF NUCLEAR RADIATION IN GROUTING
CONTROL
Most of the dams constructed in Sweden during the
later years are situated within the mountain region
in the northern part of Sweden The soils in this
area commonly consist of moraine deposits from the
last ice age Because of geological processes the
composition of these deposits is very irregular and
generally they contain both impervious moraines
and lenses of pervious sediments Therefore conshy
struction of dams in this region often involves diffishy
cult foundation problems especially in cases where
the dam has to be founded on partly permeable deposhy
sits
Because of the erratic soil conditions1 foundation
grouting in the dam site is almost always need-ed in
order to reduce the underseepage after the rise of
the reservoir level But very often it may be a mashy
jor problem during the construction stage to decide
the extension of the gIouting works Sometimes the
need for grouting becomes apparent only ater the
reservoir has been filled and in such cases the founshy
dation must be grouted through the dam embankment
This method has certain advantages but evidently
the grouting operation must be carefully controlled
because of the risk of cracking and eroding the soil
in the foundation Ir order to eliminate this risk the
State Power Board has applied the nuclear radiation
method to the control of grouting operations The
method is based on investigations of the radiation
in soils compacted to various porosities
At a recently completed dam founded on natural
moraine deposits leakage occurred under the founshy
dation after the rise of the reservoir level The seashy
ling measures included the performance of a grout
curtain extending through the existing pervious soil
layers beneath the foundation and down into the undershy
lying faulty rock The thickness of the permeable
layers was about 5-6 metres and in order to reach
these layers the bore holes had to be drilled from
the crest and through the dam core to a depth of
about 20 metres It was also conside1middoted necessary
to protect the bottom layers from possible erosion
caused by leakage water flowing through cracks in
the rock For this purpose the grout curtain had to
be extended to a depth of 10 metres below the rock
surface after completion of the soil grouting
After drilling the grout holes the nuclear density
probe was used for determining the initial porosity
of the soil strata overlying the rock From these
287
BERNELL and SHERMAN
15-----------------~---~--------------
-------- ====o~
en shy+shya
E 20-+-----~----=-----+---------+-------t c v Ground water level
c ~ Q a
0
Rock
CD Radiation curve before grouting __ -middotmiddot- after 1st grouting __ __ _ __ _ 2nd
25---------------_______________ so 1QQ 1so 200
Radioti on in countssec
middotFig 2 Radiation curves measured in foundation
soils under a dam
288
NUCLEAR RADIATION IN CONSTRUCTION CONTROL investigations it was found that the soils located
immediately above the rock surface were pervious
and contained cavities whereas the overlying soils
in the contact zone against the dam foundation conshy
sisted of impervious moraines As a result of this
investigation it was decided to grout the holes in
stages from the rock surface up to the bottom of
the dam
After completion of the soil grouting secondary
holes were drilled through the foundation to a depth
of 5 metres in the rock Before the rock grouting
was begun these holes were measured with the nushy
clear density probe for controlling the effect of the
soil grouting From the measurements combined
with the results of the conventional water pressure
testing valuable informations were obtained conshy
cerning the effect of grouting and also on many
other factors which influence the grouting procedure
in soils
Fig 2 shows a typical radiation diagram for a bore
holeJ drilled for grouting the foundation soils beshy
neath the dam I~ this case both the bottom layers
and therock were so pervious that the first grouting
did not stop the flow of ground water into the bore
hole Therefore additional grouting was needed for
sealing the pervious zones
The same method was used for controlling the rock
grouting and also in this case interesting results
were obtained concerning the grouting procedure
Therefore it is believed that the nuclear method
will be as valuable in the grouting technic as it is
in many other fields of soil and rock mechanics
REFERENCES
1) BERNELLJ L and LINDBO T Test of air
leakage in Rock for Underground Reactor Conshy
tainment Nuclear Safety 1965 V0l 6 No 3
2 BERNELL L Measurements in the Messaure
Dam a Rockfill Structure with Wet-Compacted
Core Eighth Congress on Large Dams Edinshy
burgh 19~4 Vol II Page 317
3) BERNELL L Construction of Rockfill Dams unshy
der Winter Conditions Ninth Congress on Large
Dams Istanbul 1967 Vol IV Page 161
4) KALLSTENIUS T and BERGAU W In Situ Deshy
termination of Horizontal Ground Movements
Proc Fifth Intern Conpound on Soil Mechanics and
Foundation Engineering Paris 1961 Vol 1
Page 481
289
MAIN SESSION 5 SEANCE PLENIERE 5
STABILITY OF NATURAL SLOPES AND EMBANKMENT FOUNDATIONS STABIUTE DES TALUS NATURELS ET DES FONDATIONS DE REMBLAIS
ChairmanPr4ident D H TROLLOPE (Australia GenClal Reporter Rapporteur G6n~el A W SKEMPTON (ElIQ1ahd1 Auociata RoportuRapportcur Adjoint J HUTCHINSON (England)
Members of the PanclMembros du Groupe do Discuuion L 8JERRUM (Norway
H BOROWICKA (Aut1ralia) B BROMS ISwodenl
R C HIRSCHFELD (U S A) C KENNEY (Canadol
Panelist B BROMS
lntroduction
Several large landslides have occurred during the last 20 1ears in the densely populated GtHa River Valley located in the southwestern part of Sweden (Fig 1) Among these the landsUdes at Surte (Jakobson 1952) and at Gtita (Odenstad 1958) can be mentioned In the G6ta River Valley flows the Gtita River which is one of the largest rivers in Sweden The G6ta River is also an important waterway Approximately 4 milj tons oi freight is annually transported on the river In the river valley are located several hydroshyelectric plants The river servea ilao aa water supply for Gothenburg the main seaport of S y-den with approximately 500000 people Two main high~ ways follow the G6ta River Valley The highways are in many places located close to the river Also one railroad line ia located in the valley and baa in some cases been affected by landslides
385
SEANCE PLENIERE 5
Ps wh~re art5a11 prusur1 hobull bH11 oburvet
~) ArtaJ w1 quck clays
SeVert bullrcs011
~ rorEBORG
Fig 1 The Glaa River between Trollhattan and Gothenburg Gtsteborg)
Landslides in the Gtsta River Valley can have Vfry serious consequences A landslide canfor examplP disrupt the boat traffic in the river iriferfere with the operation ofthe hydroelectric plants and pollute the river water (Several large chemical plants are located at the river and oil storage tanks have been built close to the river Two oil tanks collapsed e g during the slide at G6ta)
Landslides in the G0ta River Valley
Scars after old landslides can be seen almost along the whole river especially in the northern part of the valley above Lilla Edet In Fig 2 is shown scars after landslides at Utby (Fig 1)
About 20 slides have here taken place within a distance of about 2 km Several slides have also occurred along the Slump River a tributary to the G6ta River
Scars after a large old landslide can also be seen at Jordfallet (in English 11 Earth fall) located about 2 km upstream of Surte (Fig 1) The scar has a length of about 300 m and reaches iliout 1000 m from the river
One of the largest recorded landslides occurred in 1648 at Intagan located approximately 4 km south-
River
Seo le 0 1000 m L-1-1-LJLJ
Scar otter londsl1de
Fig 2 Landslides at Utby
west of Troilhattan (Fig 1) About 54 acres were affected by the slide and at least 85 people lost their lives Another relatively large landslide which probably was triggered by an earth quake took place in 1759 at Bondestr5m when approximately 400000 m 3 slid into the Gtsta River
The landslide at Surte occurred in 1950 The direct cause of the slide is uncertain but the vibrations from the pile-driving for a small house have been dicussed as one possible factor as well as the vibrations from a train which passed the aren just before the slide The length of the slide area was about 600 m and the width about 400 m The total
3volume was 4 million m Within the slide area lived about 375 people in 31 houses One person lost his life during the slide A major highway and a railroad line which crossed the slide area were damaged The total damage caused by the slide was estimated in 1952 to $ 2 000 000
The landslide at Gtita occurred in 1957 Several large buildings belonging to a paper mill were located within the slide area which was about 1500 m long and 300 m wide Three workers were killed of the 200 which were within the slide area The total cost to restore the river channel after the slide was approximately $ 2 000 000
Geologic History
The Gtlta River Valley was formed by erosion during several glaciations along prequaternary fissured zones in the underlaying bed rock of gneiss The bottom of the valley which is filled with loose sediments is located up to 100 m below the present sea level The maximum thickness of the sediments is about 100 m (at Gothenburg) The thickness of the sediments in general increases downstream The area was covered during the last glaciation by ice with a total thickness of 2 000 to 3 000 m During the last glaciation the valley floor was partly covered by a thin layer of heavily preconsolidated moraine (till) with a total thickness less than 1 to 2 m The moraines are generally covered by glacifluvial and marine sediments The average grain size of the sediments decreases generally towards the ground surface and downstream the river The glacifluvial sediments (sand silt and clay) and the moraines have in many places been reworked by waves
386
MAIN SESSION 5 ~----~--~h--u---rn-----h---~s----~w-------0
Soil m ) stre19th tf tvty conlbulln1 frac14
Btuegroy to groy clay wrootholes
Dork gray
mottltd
clay (stght- 1 ly bonded l
2~ I
Gray cloy
Dork groy mottled cloy
legend -
-
6 O 0 80
28
30
115
deg 27
165
Swldish 192 tall-cone tlsl 205
135
332
3D
190
130
122
Swedish lollmiddot cone tnt I--- Plostc lmt
Field vone tut --1 Lqud tmt
Wotor ccntent
Fig 3 Soil conditions at Utby
The location of the shore line has changed considerashybly since the last glaciation due to changes of the sea level and the general land uplift At the end of the glaciation the sea level at Gothenburg was located 95 m above the present sea level and 128 mat Lake Vanern The present rate of land uplift is 2 mm year downstream at Gothenburg and 2 5 to 3 mm year upstream at the Lake Vanern The gradient of the G6ta River is thus increasing by about 1 mm year A typical soil profile of the clay layer at Utby (Fig 1) is shown in Fig 3 (The clay is underlaid by sand with a thickness of more than 10 m)
Th~ lower parts of the marine clay sediments which generally are stratified are of glacial age The clay middotcontent varies generally between 50 and 60 Organic content of the glacial clay is low Varved silt can frequently be found close to the bottom layer of sand
The upper parts of the marine sediments consist of late- or postglacial clays The particle size is smaller than that of the underlaying glacial clay The clay content varies generally between 60 and 70 The dominating clay mineral is illite The organic content (11 gyttja and organic sulphides) is relatively low but increases downstream the river The glacial as well as the late- and the postglacia1 clays are located just above Casagrandes 11A 1-Jine
The post-gl~cial clays have a stiff upper crust with a total thickness of 1 to 1 5 m The thickness i~creases upstream the river The dry crust is d1sected by vertical desiccation cracks with a thickshyness varying between 1 and 6 mm
Alluvial sediments can frequently be found close to the river The silt and organic contents of these sediments are generally high Their maximum
thickness is about 7 m
High artesian pressures have been measured in many places in the sand and silt layers as shown in Fig 1 The water pressures are related to the amount of rain fall in the area Seasonal variations of the ground water table of 1 to 2 m are not unusual (Pore overpressures of 7 m with respect to the present ground surface has been observed) The pore overpressures are generally highest in the bottom layers and decrease towards the ground surface
The glacial and post-glacial clays are generally normally consolidated except for the stiff dry crust at the ground surface The shear strength increases generally linearly with depth Just below the dry crust the shear strength varies between O 5 and 1 O metric tonsm2 in the downstream fart of the valley and between 3 and 4 metric tonsm in the upstream part of the valley
The following relationship has been found for Swedish clays between undrained shear strength Cu liquid limit wL or fineness number wF (Karlsson 1961) and effective overburden pressure a~ (Hansbo 1957)
cu = 045 wLov
Thus the shear strength increases as a rule linearly with increasing liquid limit (or fineness number) and with increasing effective overburden pressure The shear strength of the normally consolidated clays in the Gota River Valley is in some places higher than that predicted by the relationship proposed by Skempton (1954) or by Hansbo 1957 when the sensitivity of the clay is high (Karlsson amp Viberg 1967)
The angle of internal friction as determined by _drained direct shear tests is approximately 22 a 23deg A higher angle of internal friction is generally obtained with drained triaxial tests than with drained direct shear tests (Osterman 1960 Brink 967) The true angle of internal friction (Gibson 1953) varies generally between 18deg and zoo (Karlsson amp Pusch 1967)
The sensitivity of the clay in the GOta River Valley is frequently high The sensitivity of the Swedish clays is normally about 10 to 20 but the sensitivity ratios as high as 500- 700 has been measured by the fall-cone test (Karlsson 1963) north of Utby Often a relatively large amount of work is required to remould the clays from the GOta River Valley Clays from the GOta River Valley are therefore not as sensitive to vibrations or other mechanical disturbances as clays which can be remoulded easily
S6derblom (1969) has suggested to distinguish between rapid quick middotclays and slow quick clays (a clay is classified as rapid quick when a relatively small amount of work is required to remould the clay while the term slow quick is used when the amount of work is relatively large) Clays with a sensitivity ratio larger than 50 are in Sweden defined as quick clays if the fall-cone test is used to detershymine the undisturbed and the remoulded shear strength of the soil
The high sensitivity of the clays in the GOta River Valley can partly be explained by a reduction of the
387
------- ----
SEANCE PLENIEAE 5 salt content due to leaching and diffusion However infiltration of organic substances (e g humus) hav~ probably also cortributed to the high sensitivity of
the clays The salt content of quick clays is always low but the salt content Of clays with low sensitivity ~ay ~~ry between wide limits Sl5derblom ( 1969) has 1denhfaed a large number of organic substances in pore water with dispersing properties
I- ~ig 4 is shown the relationship betweeio conducshytivity (vt) and the sensitivity (S ) of a clay from a bore hole located close to Utby Fig 1)
- lmmodolbullI) alrr tArr01 --- Ac towotaon lo lobdol)
Srsmly Hyfi m 2()Q JOO co
_ lt
middot ----- I ( -
vr--
) s t OoNn
Fig 4 Relationship between conductivity and sensitivity
The conductivity which is directly proportional to the salt content was determined with a salt sounding tool (Saderblom 1957) The shear strength of the undisturbed and of the remoulded soil was determined by the Swedish fall-cone test in the field immediately after the sampling and in the laboratoshyry approximately two weeks after the sampling It can be seen that no relationship exists in this case between conductivity (salt content) and sensitivity when the salt content is low In fact the highest sensitivities were found at the levels where the salt content was the highest
The sensitivity is however affected by the time after sampling The sensitivity determined two weeks after the sampling was approximately half the sensitivity immediately after the sampling The reduction of the sensitivity was caused mainly by a reduction of the undisturbed shear strength of the clay
In Fig 5 is shown a microphotograph of a quick clay ~ram Lilla Ed~t The shear strength of the clay 1s about 2 tm and the sensitivity about 150 The thickness of the section is 500 A Investigashytions have shown that the microstructure of quick clays is characterized by an extremely open three dimensional network of particles and particleshygroups (Karlsson amp Pusch 1967)
Soil Exploration
The stability conditions in the G5ta River Valley has
0 SA Sealbull
Fig 5 Microphotograph of a quick clay from Lilla Edet (R Pusch)
been investigated extensively The sounding machine type SGI (Fig 6) and the Swedish weight sounding device have been used to determine the thickness of the individual soil layers and the depth to the firm bottom layers
Fig 6 Sounding machine type SGI
The sounding machine type SGI (Kallstenius 1961) records automatically the penetration resistance of a 10 cm2 cone as a function of depth as the cone ismiddot pushed down into the soil The skin friction resisshytance is automatically subtracted from the total resistance and only the point resistance is recorded by the machine This type of penetrometer is much more rapid than for instance the weight sounding test and can be used to detect e g sand and silt seams as shown in Fig 7
The undisturbed shear strength of the clay has been determined in situ with the so-called iskymeter (Kallstenius 1961) and with vane tests and in the laboratory by the Swedish fall-cone (Hanabo 1957) or by unconfined compression tests The iakymeter records the pull-out resistance of a foldable anchor plate which is pulled out of the ground by a wire The anchor plate is driven into the soil folded and unfolds when the plate is pulled With the iskymeter sand or silt seams can be detected as shown in Fig 8
388
MAIN SESSION 5
Storie
M3 Noom stopped
Fig 7 Penetrometer record
I SurfaiesiJ
C-ycrus I
-
----==--Coy orid s11 1
-middot--- ---i
Ckiy I melrl
1000 kg = Fig 8 Iskymeter record
The shear strength determined by the iskymeter agrees relatively close with the results from vane teats in clays with normal sensitivity (Osterman 1960) A good agreement has also been found beshytween fall-cone and field vane tests except when the sensitivity of the soil is high
The vane type SGI is provided with shield or with a shroud which protects the vane blades during drishyving The shield also prevents clay from adhering to
the blades when the vane is driven through the stiff dry crust The test results indicate that clay which adhere-a to the vane blades can appreciably lower the measured shear strength especially when the sensishytivity of the clay is relatively high
Soil samples have been taken with sampler SGI type IV (Kallstenius 1958) and by the Swedish standard piston sampler (Swedish Committee on Piston Sampling 1961) The area ratio of the Swedish standard piston sampler is low Samples have been taken every or every second meter in depth
The Swedish foil sampler has been used in a few cases to check the layer sequence and to locate slip ~urface in slides In Fig 9 is shown two cores from the slide at GOta The location of the slip surfaces can clearly be seen on the photograph
Fig 9 Location of slip surfaces in cores
Pore pressures have been measured hydraulically by pore pressure gauges of type SGI (Kallstenius amp Wallgren 1956) The coupling device of the gauge makes it possible to check the functioning and the accuracy of the gauges cturing long time mtasureshyments These gauges are therefore especially suited for control of pore pressures The gauges along the GOta River are as a rule read every second month
Lateral displacements (creep) have been measured with an inclinometer of type SGI (Kallstenius amp Bergau 1961) at locations where the slope stability has been especially low With this device it is often possible to measure lateral displacements with an accuracy of about 1 to 2 mm for a length of 10 m
The salt content of the clays has been determined at a large number of places by measuring in situ the electrical resistance of the soil with a salt sounding tool as mentioned above (Soderblom 1957 1958)
389
SEANCE PLENIEAE 5 Tlie electrical resistance is measured between two isolated steel rings which are placed at the tip of a sounding rod The tool is driven into the ground with standard equipment The salt contentwhich generally is low close to the ground surface increases with depth and reaches often a maximum value at the middle of the profile The salt content at the bottom layers is generally low due to leaching It has been possible in many cases to locate slip surfaces with this device In Fig 10 is shown the record from a salt sounding at Glita which was carried out 14 days after the slide (S6derblom 1969)
$1p ~rtraquon lthKJltod 1~ ffl mpi
Jsl---1--+----lt
~1----gt-+-------j
Fig 10 Location of slip surface with the salt sounding tool
A sudden jump in the resistivity curve shows the location of the slip surface The actual location was later checked with cores obtained with the Swedish foil sampler
Attempts have also been made to locate slip surshyfaces in quick clays with field vane tests This method has not been successful since the thickness of the disturbed zone where the shear strength in the soil is reduced by remoulding has been small (less than a few centimeters)
Slide Mechanisms
The large slides in the G5ta River Valley are generally retrogressive rotational or retrogressive translational They have as a rule been triggered by a relatively small initial local slide A number of parallel ridges can often be Seen within the area after a slide The landslide at Glita started as a small local slip close to the river In the morning of the slide a crack which was 130 m long was observed approximately 20 to 30 m from the river The crack widened slowly and the final slip occurred 3 hours after the crack first was detected The slide spread upstream the river and in the direction from the river (Odenstad 1958) The slide at Surte initiated however at some distance from the river and the slide then spread gradually towards the river and backwards to the side of the
valley The duration of the slide was at Surte about 3 minutes and the maximum speed of the slide was less than o 9 msec
A number of local slide can be seen in Fig 11
Fig 11 Local slides along the Glita River
The small initial slide is generally caused by erosion of the river bank and by changes of the ground water level by vibrations from traffic pile driving or by earth quakes The small local slides are mainly confined to the part of the river located above L6d6se (Fig 1) where the height of the river banks exceeds several meters
The erosion processes have accelerated during the last 50 years partly by the construction of dams and hydroelectric plants along the river and partly by the heavy ship traffic on the river The erosion of the river banks seems to increase rapidly with the size and speed of the ships Some bottom erosion has taken place downstream of Lilla Edet at the places where the river bottom consists of cohesionless soils Of course a certain erosion has also been caused by the general land uplift (2 mmyear at Gothenburg) This erosion is relashytively small since the land uplift is small Over a very long time period this bottom erosion can however be appreciable and contribute to the general lowering of the stability of the slopes
Method of Analysis
It is not possible to predict accurately with presentshyly available methods if a small local slide will develop into av large catastrophical slide The stability of a number of small local slides have been analysed by the total stress method(~= 0-analysis) and by the effective stress method (c ff -analysis) (Bishop 1955) The total stress anSlysis which is based on results from field vane tests gave nominal safety factors which are close to one with respect to available and mobilized shear strength of the soil (G6taHvkommittCn 1962) Safety factors of the same magnitude were obtained from an effective stress analysis if the results from drained direct shear tests and triaxial tests are used in the analysis The cohesion c determined by drained direct shear test has not been reduced in the calculation Both circular and other shapes of the failure surfaces have been investigated
390
MAIN SESSION 5
Also sections where slides have not occurred have been analysed by the total and the effective stress methods The results from these calculations are shown in Table 1
Table 1 Safety factors calculated by total and effective stress analysis
Location Total stress Effective stress analysis analysis
Intagan - Torp
2345 1 18 1 30 23 72 1 02 1 03 23 82 107 103 2688 - 2752 - 1 1 - 1 1
StrBms Lock
3701 1 0 I 0 37 11 1 1 10 3733 1 0 10
Lilla Edet
34 5 - 35 8 14-15 I 3 1 5
Agnesberg - neberg - 1 5 1 3 1 5
Also in this case a good agreement was obtained between the two methods
The stability of the normally consolidated clay in the GOta River Valley is generally evaluated by the total stress method (~ = 0-analysis) mainly due to the simplicity of this method A total stress analysis reflects the stability of a slope with respect to sudden changes of the applied load and to gradual changes of the undrained shear strength of the soil by e g leaching It is believed that a total stress analysis to a certain extent can be used to investishygate if a small slide will cause a large secondary slide (The initial slide causes a sudden change of the stress conditions in the remaining soil without a change of the water content) Erosion of the river banks often occurs rapidly due to large variations of the water level and the heavy boat traffic in the GBta River The change of the stress conditions by the erosion will generally cause an increase of the pore pressures in the slope due to the high senstivi~ ty of the clay and the high value of the pore pressure coefficient A Dissipation of excess pore pressures and changes of the water content of the clay take place verg slowly due to the low permeability of the clay (10- to 10-10 cmsec) It is believed that changes of the stability conditions by such rapid changes of the stress conditions is better reflected by a total stress analysis than by an effective stress analysis In this case a total stress analysis will give a lower safety factor than an effective stress analysis The limitation of a total stress analysis is however the evaluation of the average undrained shear strength of the soil It ia known that anisotroshypy and the direction of the stress increase (Bjershyrum amp Kenney 1967) and thus the test method will affect the measured shear strengths
The undrained shear strength determined by the field vane or by the Swedish fall-cone test are used in the calculations as mentioned above The shear strength determined by vane tests agrees as a rule closely with the cone values because the cone test has been calibrated against the vane teat If the
sensitivity of the soil is high and the sampling depth is large the vane shear strength is however frequently higher than the cone strength because of the disturbance of the soil samples
The actual shear strength is probably higher than the vane or cone values For normally consolidated clays the shear strength along horizontal planes is often higher than along vertical planes This differshyence in shear strength is probably compensated by the strength decrease caused by time
The shear strength used in the calculations is reduced when the liquid limit or fineness number of the clay is larger than 80 or the soil is organic A reduction coefficient of O 9 is often used for slightly
organic clays O 8 for organic clays and silts O 7 for clayey or silty 11 gyttja and 0 6 for peat and 11gyttja 11
( 11 Gyttja 11 is an organic soil of post-
glacial or recent age) Analysis of old slides which have occurred in organic soils with a high liquid limit has indicated that a reduction is required
In Sweden normally a safety factor of at least 1 4 to 1 5 is required with respect to the undrained reduced shearing strength of the soil in areas where the stability conditions can be changed by the construction of e g buildings and roads close to the river or by erosion In areas in the GCgtta River Valley where the stability conditions are supposed not to change in the future and where structures are not located close to the river a nominal spfety factor of 1 3 is generally considered satisfactory In some cases a safety factor as low as 1 2 has been allowed I safety factors of 1 3 to 1 2 are found it is important to protect the slopes from erosion and to prevent buildings to be constructed near the river or to deepen the river channel by e g dredging Where the factor is lower than the above mentioned the actual stability has been increased by about ten per cent through unloading of the river bank by excavation
An effective stress analysis (cff-analysis) is espeshycially valuable to check the stability conditions in the Gata River Valley when gradual changes of the loading conditions or of the pore pressures are expected It is often difficult to predict the magnishytude of these changes Furthermore there are some difficulties in the evaluation of the coefficients ~- and c which are used in an effective stress analysis These coefficients are affected by volume changes during the drained triaxial and the direct shear testsby rotation of the principal stress directions and to a minor extent by the intermediate principal stress There are also some questions about the value of the parameter c to be used in the analysis The parameter c is not reduced at present since a reduction leads to unreasonable results (If a reduced value is used in the calculations then large parts of the Gata River Valley are not stable according to the calculations)
Slope Protection
The slopes along large parts of the GCgtta River do not satisfy the safety requirements mentioned above Therefore extensively remedial works have been or are being carried out along the river By protecting the alopea from local slides it is believed that the
391
SEANCE PLEN1EAE 5
o Excovotion ot top of
slope
Excavation
d Driving of piles
piles
b Flattening of slope
e lowering of ground water level
c Fill ot toe of slope
-
Fig
f Erosion
12 Stabilizatior of slopes
protection
slopes will also be safe against large landslides
The remedial works can be separated into three major groups To the first group belong all methods which tend to decrease the nominal average shear stress along potential slip or failure surfaces The average shear stress can be decreased e g by excavating the soil at top of a slope by flattening the slope by placement of a fill at the toe of a slope or by raising the water level in the river as illusshytrated in Fig 12 a through c To this group belongs also strengthening of the slope with piles (Fig 12 d)
The second group includes methods which tend to increase the shear strength of the soil along potential slip surfaces The shear strength of the soil can be increased e g by lowering the pore pressures by drainage or by pumping (Fig 12 e To the third group belong methods which prevent a decrease of the slope stability by e g erosion Erosion can be prevented by a reversed filter at the toe of the slope as illustrated in Fig 12 f
The method chosen at a particular location is dependent of the local conditions such as the height and the slope of the river banks the presence of permeable layers in the soil the average shear strength of the soil and of the erosion
It is generally much more effective to remove part
of the soil at the top of the slope as shown in Fig 13 than to flatten the slope or to place a fill at the toe of the slope
A fill at the toe of the slope is often partly located below the water level where only the boyant weight of the fill is effe_ctive
13 Increase of slope stability by excavation at top of slope
392
MA1N
Fig 14 Slide caused by the driving of pile~
Piles are seldom used to increase the slope stability except when the space at the top of the slope is restricted by an adjacent road or by buildings However the driving of piles may temporarily decrease the slope stability by the remoulding of the soil or by the lateral displacement of the slope towards the river A slide caused by pile driving is shown in Fig 14 In this case the lateral displaceshyments and the resulting shear deformations of the soil were sufficiently large so that the peak strength of the soil was exceeded Broms amp Bennershymark 1968)
If the sensitivity of the soil is high the reduction of the shear strength at large lateral displacements can be large However due to the relatively high clay content of the clay in the G5ta River Valley the reduction of the shearing strength is generally moderate Experience has showlil that the lateral displacement and the strength reduction is decreased if the row of piles located close to the river are driven first
The ground water pressure can generally only be middotlowered where silt or sand layers are present in the soil In areas with artesian pressures the ground water pressure can be lowered with bleeder wells In all other cases the ground water pressure can only be lowered by pumping However a lowering of the ground water pressure causes settlements and may cause wells in the area to go dry
The erosion protection is often combined with a flattening of the slopes to prevent local failures as mentioned previously An erosion protection consists generally of a 2 m thick layer of rock fill which is placed by dumping (Fig 15)
SESSION 5 The fill is not compacted The maximum particle size is at least 15 cm Only the sections where the erosion at present is very active is protected However a change of the local conditions (e g a change of the maximum water flow or of the ship traffic) may change the areas affected by erosion
Slide warning systems have been installed by the Swedish State Railways (s J ) The warning system consists of a thin electric wire with a tensile strength less than 110 lb which is placed in the ground in a zig- zag pattern as illustrated in Fig 16 at a depth of 1 0 m The train traffic is stopped automatically when the cable oreaks
r 30m f JOm 30m I 30m 30m 1 30m j 30m
Eloctrnol conlocl
Eleetr~ coble (ma~imum hniale slre11glh of 10 lb)
Post wh1et1 1gtrou11ts -----gt-u d1s1gtlacombulllll cf
lht cohto Whf-11 slrbullkhod
Fig 16 Slide warning system type Swedish State Railways
Twice each year the G5ta River Valley is inspected by personal from the Swedish Geotechnical Institute The erosion of the river banks is followed with aerial photographs The erosion of the river bottom is checked by soundings Also the construction of new buildings storage tanks the placement of fills etc cloa-e to the river is controlled by the Institute
REFERENCES
Bishop A W 1955 11 The Use of Slip Circles in the Stability Analysis of Slopes Geoshytechnique Vol 5 No 1 pp 7-17
Bjerrum L amp Kenney T C 1967 0 Effect of Structure on the Behaviour of Normally Consolidated Clay11 Proc Geotechn Conpound Oslo Vol 2 pp 19-27
Broms BB amp Bennermark H 1967 11 Shear Strength of Soft Clay 11 Discussion Proc Geotechn Conpound Oslo 1967 Vol 2 pp 118- 120
Gibson R E 1953 Experimental Determination of the True Cohesion and True Angle of Internal Friction in Clays Proc 3 Int Conpound Soil Mech a Found Engng Vol 1 pp 126- 130
GBtatilvkommittfn 1962 11 Rasriskerna i G5tatilvshydalen11 Statena Offentliga Utredningar 1962 48 Inrikesdepartementet Stockholm 160 pp
Hansbo S 1957 11A New Approach to the Determishynation of the Shear Strength of Clay by the Fall-Cone Test11
bull Proc Swedish Geotechn Institute No 14 Stockholm 47 ppFig 15 Erosion protection
393
SEANCE PLENIERE 5 Jakobson Bbull 19~2 The Landslide at Surte on the Ftirhandlingar Vol 80 No 1 Stockholm
GOta River 11 bull Proc Swedish Geotechn pp 87-96 Institute No 5 121 pp
Soderblom R 1969 Salt in Swedish Clays and Kallstenius T 1958 11 Mechanical Disturbances in ta Importance for Quick Clay Formation
Clay Samples Taken with Piston Satnplerz 11 Results from eome Field and Laboratorybull
Proc Swedish Geotechn Institute No 16 Studies 1 Proc Swedish Geotechn
75 pp Institute No 22 (in press)
Kallstenius T 1961 11 Development of Two Modern Osterman J 1960 Notes on the Shearing Continuous Sounding Methods 1 Proc 5 Int Resistance of Soft Clay Acta Polyshy1
Conf Soil Mech a Found Engng Vol technica Scandinavia Ci2 2631959 22 pp 1 pp 475-480
Swedish Committee on Piston Sampling 1961 11 Standard Piston Sampling Proc SwedishKallstenius T 1963 Studies on Clay Samples Geotechn Institute No 19 StockholmTaken with Standard Piston Sampler 11
bull Proc Swedish Geotechn Institute No 21 p 195 45 pp
Kallstenius T amp Bergau W 1961 11 In Situ Detershymination of Horizontal Ground Movements 11
Proc 5 lnt Conf Soil Mech a Found Engng Vol 1 pp 481-485
Kallstenius T amp Wallgren A 1956 11 Pore Water Pressure Measurement in Field Investigashytions11 Proc Swedish Geotechn Institute No 13 Stockholm 58 pp
Karlsson R 1961 Suggested Improvements in the Liquid Limit Test with Reference to Flow Properties of Remoulded Clays 11
Proc 5 Int Conpound Soil Mech a Found Engng Vol 1 pp 17 1- 184
Karlsson R 1963 11 0n Cohesive Soils and Their Flow Properties Swedish Geotechn lnatitute Reprints and Preliminary Reporta No 5 24 pp
Karlsson R amp Puoch R 1967 Shear Strength Parameters and Microstructure Characshyteriotico of a Quick Clay of Extremely High Water Content Geotechn Conf Oslo 1967 Vol 1 pp 35-42
Karlsson R amp Viberg L 1967 11 Ratio cp in Relation to Liquid Limit and Plasticity Index with Special Reference to Swedish Clays 11
Proc Geotechn Con Oslo 196( Vol 1 pp 43-47
Kjellman W Kallstenius T amp Wager 0 1950 11Soil Sampler with Metal Foila 11 Proc Swedish Geotechn Institute No 1 76 pp
Odenstad S 1958 11 Jordskredet i GOta den 7 juni 1957 11
Geologiska Ftireningens i Stockholm F6rhandlingar Vol 80 No 1 Stockholm pp 76-86
Skempton A W 1954 11 Discussion of the Structure of Inorganic Soil1 1
bull J Soil Mech a Found Div Proc ASCE Vol 80 Sep No 478 pp 19-22
S6derblom R 1957 11Some Investigationa Conshycerning Salt in Clay 11
Proc 4 Int Conf Soil Mech a Found Engng Vol 1 pp 111-115
S6derblom R 1958 11 Saltaonden och desa anvindshyning vid beatamning av skredbottnen vid GOta bull Geologiska FOreningens i Stockholm
394
VIBRATORY COMPACTION OF COHESIONLESS SOILS
by Bengt B Broms and Lars Forssblad
reprinted from
Proceedings of Specialty Session 2 Soil Dynamics
Seventh International Conference on Soil Mechanics and Foundation Engineering
Mexico City Mexico August 1969
VIBRATORY COMPACTION OF COHESIONLESS SOILS
Bengt B Broms and Lars Forssblad
Bengt B Broms is Director of the Swedish Geotechnical Institute
A graduate of Chalmers Institute of Techshynology in Gothenburg Sweden he received his MS and Ph D degrees from the University of Illinois
From 1959- 1964 he was Associate Professor at Cornell University and he now lectures at the Royal Institute of Technology
He has published widely on the properties and behavior of reinforced concrete members and concrete piles characteristics of soils and soil-structure interaction
He has served on the American Concrete Instishytute Committee on Concrete Piles and the ACI- ASCE Committee on Reinforced Concrete Columns He is presently a member of the Swedish Geotechnical Society committees on Laboratory Testing and on Soil Exploration Bengt B Broms
Lars Forssblad is Research Manager of AB Vibro- Verken in Solna Sweden
He received the degrees of Civil Engishyneer and Doctor of Technology from the Royal Institute of Technology in Stockholm
I~ Before joining AB Vibro-Verken he was active for ten years in design and supervision of dam and water power construction in Sweden
He is author of the publication Invesshytigations of Soil Compaction 21_ Vibrashytion
Lars Forssblad
I INTRODUCTION tons was developed by Losenhausenwerk as early as 1933 This vibrator had a variable frequency between 10 and 25 cps and a maximum depth effect
Vibratory soil compaction was first studied and of 2 0 to 25 m (Muller amp Ramspeck 1935 applied in Germany during the 1930 s (Loos 1936) Ramspeck 1937) Losenhausenwerk also designed A self-propelled caterpillar- type vibrating at about the same time a self-propelled 1 5 plate compactor with a total weight of about 25 ton vibrating plate compactor
101
The vibroflotation method where heavy internal vibrators in combination with jetting are used to compact cohesionless soils to large depths was also developed in Germany during the 1930 s (Schneider 1938)
Other types of vibratory soil compactors were developed during the 1940amp such as tractorshydrawn and self- propelled vibrating rollers multiple plate compactors and vibrating tampers (rammers) as described eg by Garbotz (1958
Table 1 Different types of vibratory soil compactors
Surface vibrators
Type of machine Weight Frequency
Vibratine tampers (rammers)
tHand- guided 50- 150 kg about 10 cps (100-300 lb)
Vibratine plate compactors
Self-propelled hand-guided 50- 3 000 kg 12 - 80 cps (1 00-6000 lb )
Multiple-type mounted on 200- 300 kg 30 - 70 cps tractors etc (400- 600 lb)
Crane-mounted1) up to 20 ton 10 - 15 cps
Vibrating rollers
Self- propelled hand-guided 250- 1500 kg 40 - 80 cps (one or two drums) (500-3000 le) Self-propelled tandem- type 0 7- 10 ton 30 - 80 cps
Self-propelled driving 4 - 25 ton 20 - 40 cps rubber - tires
Tractor-drawn 1 5- 15 ton 20 - 50 cps
1) Used on a limited scal e
Self- propelled vibrating rollers are of three main types - hand- guided vibrating tandem rollers and vibrating rollers with two driving rubber- tires Tractor-drawn vibrating rollers with weights up to 15 tons and vibrating rollers with driving rubber- tires with total weights up to 25 tons are nowadays used
The use of vibratory soil compaction has inshycreased considerably during the last 5 to 10 years Vibratory soil compaction was initially used only for cohesionless soils (Lange 1940 Leussink 1951) Nowadays vibrator y compactors are also used to compact cohesive soils and asphalt surfaces The main applications are given in Table 2
The knowledge of the factors affecting vibratory compaction of soil i s still incomplete in spite of the extensive investigations which have been carried out all over the world s ince the 1930s The compaction of cohesionless soils is affected
102
1959) Erl enbach (1959) Kronenberger (1960) Leussink (1960) and Forssblad (1965)
Vibratory soil compactors can be classified as indicated in Table 1 Vibrating tampers are light hand- guided machines operating at a low frequency about 10 cps and with a large amplitude The types of self- propelled vibrating plate compactors which are most commonly used today weigh between 100 and 500 kg
Internal vibrators
Type of machine Diameter Frequency
Concrete vibrators
Manually operated or 5 - 15 cm 100 - 200 cps tractor-mounted (2 - 6 in)
Vibroflotation eguipm
Crane-mounted 23 - 38 cm about 30 cps ( 9 - 15 in)
eg by average grain size grain size distrishybution shape of particles water content pershymeability compressibility shear strength etc Also the properties of the vibratory compact or such as frequency nominal amplitude centrishyfugal force and total weight affect the comshypaction The descriptions of the soil and of the compactor in test reports and technical articles are usually very schematic
The many factors which affect the vibratory comshypaction make it difficult to draw general conclusions It is therefore important to study carefully the actual test and soil conditions before test r esults are applied to other conshyditions than those under which the tests were carried out
This report deals mainly with vibratory compacshytion of cohesionl ess soils but some data and results from investigations on rock fills and cohesive soils are given for comparisons
Table 2 Applications of vibratory soil compaction
Type of machine
Vibrating tampers rammers)
Vibrating plate compactors
Self-propelled hand-guided
Multiple - type
Vibrating rollers
Self- propelled hand- guided
Self-p ropelled tandem type
Self-propelled driving rubber-tires
Tractor-drawn
II ELEMENTS OF SOI L COMPACTION
The purpose of compaction is to improve the strength and deformation properties of soils The shear strength of cohesionless soils inshycrease while the compressibility and the pershymeability decrease with increasing density For example the angle of internal friction of sand or gravel increases with up to 12deg when the relative density increases from loose to dense
The compressibility of cohesionless soils is also affected by small changes of the density Compaction of a soil will often increase the equivalent modulus of elasticity as determined by plate load tests 5 to 10 times
The permeability is also affected appreciably by the relative density When the relative density increases from loose to dense the permeability of a uniform sand or gravel deshycreases by about 50 to 60 The change of the permeability increases with increasing coefshyficient of uniformity and with decreasing grain size (Taylor 1948)
The compaction of a soil is in most cases exshypressed by the relative compaction or by the relative density The relative compaction or the degree of compaction RD() is defined by
Applications
Street repair Fills behind bridge abutments retaining and basement walls etc Trench fills
Base and subbase compaction for streets side-walks etc Street repair Fills behind bridge abutments retaining and basement walls etc Fills below floors Trench fills
Base and subbase compaction for highways
Base subbase and asphalt compaction fo r streets sideshywalks parki ng areas garage dri veways etc Fills behind bridge abutments and re ta ining walls F i lls below floors T rench fi lls
Base subbase and asphalt compac tion for highways streets s i de-walks parking areas garage dr iveways etc Fills below floors
Base subbase and embankment compaction for highways stree ts parking areas air fields etc Rock fill dams Fills soil or rock) used as foundations for residenti al and industrial buildings
Base subbase and embankment compaction on highways streets parking areas air fields etc Earth- and rock fill dams Fills (soil or rock) used as foundations for residential and industrial buildings Deep compaction of natural deposits of sand
the equation
R = ~ x 100 (1)D Yd max
where y is the actual dry density (dry unit weight)dand yd maxis the maximum dry density determined by ~he Proctor compaction tests (standard AASHO modified AASHO etc ) or byshyvibratory compaction methods as illustrated in Fig 1
a b C
middot- -middotlt middotmiddotmiddot
Fig 1 Laboratory Compaction Methods a) Proctor Compaction Test b) Vibratory Compaction Test with Vibrating Table and Surcharge Load c) Vibratory Compaction Test with Vibrating Tamper or Hammer
103
--
The compactjon of cohesionless soils is often expressed by the relative density The relative density ID() of a soil with the void ratio e is definea by
X 100 ( 2)
In this equation emax and emin are the maximum and the minimum void ratio of the soil respectshyively The relative density is equal to zero when the soil is loose (e = emax) and 100 when the soil is dense (e = e in) For a soil with the dry density yd Eq (~J can be rewritten as
Ydmax (yd- Yd minl - X 100 (3)
Yd (yd max- Ydmin)
where Ydmax and Ydmin are the maximum and minimum dry density of the soil respectively
A vibratory compaction method for cohesionless free- draining soi l s has been developed by the Bureau of Reclamation (1963) This method has been approved as ASTM Standard D 2049 The maximum dry density is determined by vibrating the soil either saturated or completely dry for 8 minutes in a test mould under a surcharge load (Fig 1 b) The volume of the mould is 0 1 cu ft alternatively 0 5 cu ft
The maximum void ratio emax and the minimum density yd min are usually determined by pouring dry soil through a funnel into a Pr octor mould The funnel is generall y held 25 mm above the soil surface Soils with particles larger than 10 mm are generally placed with a scoop (Bureau of Rec l amation 1963)
The maximum density can also be determined by laboratory compaction tests using a vibrating hammer or a vibrating tamper working on the surface of the material (Fig 1 c) The method using a vibrating hammer nas been developed by the Road Research Laboratory in England (Parsons 1964 Odubanjo 1968)
The vibrating tamper method has been developed by Vibro- Verken (Forssblad 1965 1967) Accordshying to this method the soil is compacted in two layer s in a mould with 15 cm diameter Each layer is vibrated for 2 min The resulting maximum dry density is for saturated cohesionless soils about the same as that determined by the modi fied AASHO compaction test
The compaction water content has a different effect on the compaction of cohesionless free shydraining soils than on fine-drained cohesive soil s The water content of a free - draining soil decreases during the compaction if the initial water content is high while the water content does not change for fine-grained soils As a result the Proctor curve of f r ee-draining soils terminates near the maximum value (Fig 2) If a sandy or gravelly soil contains some silt or clay it is not free-draining and excess water does not drain out during the compaction The resulting compaction curve is regular as shown in Fig 2 by Curve 2 Cohesionless freeshydraining soil s very often have comparatively flat compaction curves as illustrated in Fig 2 by Curves 1 3 and 4 In some cases two maxima are obtained probably because of capillary
104
forces in the partially saturated soil
pcf tm
24 23
140 10 ~ 22 Ii- V~
2 1130 ~ 2J Icopy V ~ ii 120
[- --V ~ 19 ~ lltD middotc 18 I110
~ 17 - 0 Icopy
100 16 ~i-- -
15
90 14
1380
12 0 8 10 12 14 16 18 20 22 24
Water content percent
US standard sieve size 34 middotn Nobull No 40 N e 100 No 200 - Il 1-I- I I0i Ibull-0 iv-bull I I
I
~ ~T I1 II I
I
i I II 1 1 i I
II 1 I I I I~ 0_ III I-
I I I
I r- I 11 ~ 1 -r-- II I ~ I
II ~ lv 10 10 01 0 01
Groin size in millimeters
Fig 2 Compaction Curves Obtained with the Modified AASHO Method and Grain Size Distr ibutions for Different Types of Sandy Soils
Due to the compar atively flat compaction curves for free-draining soils and the fact that excess water can drain out during the compaction the water content of the soil is not as imshyportant for cohesionless free-draining soil s as for fine- grained soils The best compactionof sand and gravel is usually obtained when the soil is saturated or completely drybut a comparat i vely good compaction can frequently be obtained also when the soi l is part i ally saturated
Investigations by Bureau of Reclamation (1963) and others as well as practical experience indishycate that a soil usually can be characterized as free-draining if the content of fines ( soil particles with a diameter smaller than 0 06 or 0 074 mm) is less than 5 to 10 In special
cases soils can act as free- draining when the content of fines is as high as 15 to 20
However well-graded sandy and gravelly soils (silty sand clayey gravel etc ) with more than 5 to 10 of fines are as a rule not free shydraining These soils have certain cohesive properties and the control of the compaction water content is essential (Fig 2)
The relevance of the Proctor compaction tests to vi bratory compaction of cohesionless soils has been questioned by many investigators (Lane 19ll8 Felt 1958 Morris amp Cochrane 1965) It has been suggested that vibratory soil comshypaction should be correlated with laboratory compaction tests based on vibration
Impact compaction tests such as the Proctor compaction tests are generally time consuming in comparison with vibratory compaction tests In addition impact tests are to a certain extent affected by the manual performance
A further advantage with vibratory compaction tests is that such tests can be adapted to test moulds with large diameters and can ther efore be carried out on samples containing stones
III TECHNICAL DATA OF VIBRATORY COMPACTORS
There are no accepted rules regarding the techshynical data which should be specified or given for vibratory compactors in specifications technical reports etc Sometimes such more or less undefined terms as dynamic force dynamic load compaction effort in tons impulse in tons per second equivalent static weight are used
The vibrations of the drum of a vibrating rolshyler or of the bottomplate of a vibrating plate compactor are usually generated by one or several rotating eccentrics The frequency amplitude velocity and acceleration of a sinushysoidal oscillation are defined in Fig 3 The frequency expressed in cycles per minute (cpm) or cycles per second (cps or Hz) is determined by the rotational velocity of the eccentric(s) The amplitude of the drum or the bottomplate is a function of the eccentric moment of the ecshycentric as shown in Fig 4 and of the mass of the vibrating system
The so-called nominal amplitude can be calcushylated from the following equation
t _ Eccentric moment1Nominal amp l ude - Mass of drum or bottorqilate ( 4)
The actual amplitude can for certain frequency ranges be up to 50 to 100 larger than the nominal amplitude due to resonance
The rotating eccentric initiates a centrifugal force which is a function of the frequency and the eccentric moment as shown in Fig 4 (Due to the oscillati ons of the drum or bottomplate there will be a small difference between the real centrifugal force and that calculated from Fig 4 The difference is usually less than 1)
The centrifugal force acts inside the drum or bottomplate Its magnitude is not equal to the dynamic force transmitted to the underlying soil as is sometimes assumed
c ~ Amplitude
J____________1--------lt-
Time
Time T for full cycle
Frequency (number of eye les per sec (1T) ) = f cps or Hz
Amplitude (maximum deviation from position at rest) = s cm (in)
Maximum velocity = vmox = 21C-fmiddots cms (insec)
Maximum acceleration = omax = 4Ttf s cms2(insec)
Fig 3 Definition of Frequency Amplitude Velocity and Acceleration for a Sinushysoidal Oscillation
Weight of eccentric = m kg (lb)
Eccentricity = r cm in)
Eccentric moment = m r kgcm (lb in)
Centrifugal force 41 F - ~ kg (lb) g
= =g = occelerotion due to gravity 981 cm sZ 386 insec
Fig 4 Definition of Eccentric Moment and Centrifugal Force
Through the oscillations defined by their freshyquency and amplitude the vibrating drum or bottomplate affects the surface of the ground with a rapid succession of dynamic loads or impacts Each load cycle generates a stress wave as illustrated in Fig 4 It i s i mportant to make a clear distinction between the vibrashytions of the compactor and the characteristics of the stress waves in the soil The charactershyistics of the stress waves are to a large exshytent dependent on the properties of the soil
The static weight of vibratory compactors has a
105
large influence on the compaction effect since the kinetic energy as well as the momentum (mass x velocity) of the vibrating drum or bottom plate are directly proportional to the weight if the amplitude and the frequency are constant Test results indicate for example that the maximum depth to which a soil can be compacted is depending on the total static weight of the compactor However the compaction close to the surface is for vibrating rollers also to a large extent influenced by the static weight per linear inch of drum width
The ratio of drum and frame weight is also of importance with respect to the compaction efshyfect However this weight ratio is given in specifications technical reports etc for vishybrating rollers and vibrating plate compactors
It is proposed that at least the technical data in Table 3 should be given in specifications technical reports etc for vibrating rollers and vibrating plate compactors
TABLE 3 -- TECHNICAL DATA FOR VIBRATING ROLLERS AND VIBRATING PLATE COMPACTORS
Vibrating rollers Vibrating plate compactors
Total weight Total weight
Static load per Static load per unit area of inch of drum width bottom plate
Drum width Width of bottom plate
Drum diameter Length of bottom plate
Frequency Frequency
Nominal amplitude Nominal amplitude
Eccentric moment Eccentric moment
Centrifugal force1 ) Centrifugal force1 )
Working speed Working speed
l) Can be misleading if compactors with two different frequencies are compared
IV COMPACTION MECHANISMS
A large number of factors affect the vibratory compaction of cohesionless soils According to Lorenz (1955 1960) the most important of these factors are the resonant frequency of the comshypactor - soil system (Hertwig 1931 1933) the number of load cycles (Tschebotarioff and McAlpin 1947) and the shear strength during the vibration (Mogami and Kubo 1953)
Whiffin (1954) Forssblad (1965 ) and others have pointed out however that also the magnishytude of the dynamic stresses generated in the soil by the vibrator is of great importance for the results of the compaction
1 Resonance
According to Hertwig (1931 1935) the highest
density of a soil is obtained at the resonant frequency of the vibrator - soil system where the amplitude reaches a maximum Also Terzaghi (1943) Bernhard (1952a 1959) Converse (1954 1957)and others recommend that the compaction should be done at the resonant frequency
The resonant frequency varies with the soil type and with the characteristics of the comshypactor Sung (1954) Viering (1957) and Lorenz (1960) for example have pointed out that the resonant frequency depends on the eccentric moment the weight and dimensions of the vibrator and on the properties of the soil Also Barkan (1960) and others have discussed the factors affecting the resonant frequency of the vibrator - soil system
Compaction tests and practical experience do not indicate however that vibratory compaction at the resonant frequency will give a higher density than at other frequencies (eg Lorenz 1955 1960 Forssblad 1955 1965 Kutzner 1962 Usually the density of compacted soil will increase with increasing frequency even at frequencies exceeding the natural frequency of the vibrator - soil system One reason as pointed out by Forssblad (1965) is that the centrifugal force and the momentum and thus the 11 intensity 11 of the vibrations also increase with increasing frequency The resonance effects of the vibrator - soil system will in this case be combined with the effects of an increase of the 11 intensity11 of the vibrations as graphically illustrated in Fig 5 The resonance effect is in this case 11 hidden 11 bull Due to this reason medium and heavy-weight vibrating rollers often are designed with a frequency just above the resonance frequency of the vibrator - soil system
Nominal o litude 2 s
sect Nominal a itude s
C
~l-----j-ft--i-----1-------j
1 u _____ ----g_
0 tvbgnificot
amplitude n of nominal e to resonance
10 20 30 Frequency
Fig 5 Effect of Frequency and Amplitude on Vibratory Compaction of Soil
2 Number of Load Cycles
According to Tschebotarioff and McAlpin (1947) the number of load cycles and the centrifugal force govern the density of the compacted soil when the frequency is low About 10000 cycles were required to reach the maximum density of a sand when the centrifugal force was 9 and 187 kg The maximum density increased with inshycreasing centrifugal force When the centrifugal force was 37 and 75 kg approximately 30000
106
load cycles were required These tests were carried out at f r equencies between 1 0 and 25 cps
Kutzner (1962) also f ound from vibratory comshypaction tests with glass beads and dry sand that the density increased with increasing numshyber of load cycles or wi th increasing vibr ation time For the glass beads the increase was small after 500 load cycles About 9 000 load cycles were required to reach the maximum denshysity of the dry sand at a frequency of 50 cps
Tests by Whitman and Ortigosa (1968) indicate that the density of a compacted cohesionless soil at accelerations less than 1 g is primarily governed not only by the number of load cycles but also by the stress increase in the soil The density increased as the logarithm of the number of cycles The increase of the density was however smal l when the initial relative density was larger than 70 and the ratio of the maximum and the mi nimum cyclic stress from the vibration was less than 5
The test results thus indicate that the number of load cycles is of special importance at low accel erations The number of load cycles reshyquired to reach a given relative density is also influenced by the gradation of the soil
3 Shear Strength During Vibration
Mogami and Kubo (1953) observed that the shear strength of dry sand decreased with increasing acceleration They investigated two types of dry sand in a direct shear apparatus (Fig 6) at frequencies ranging from 10 to 50 cps and at accelerations which varied up to 20 g The test results indicated that the shear strength decreased approximately linearly when the acceleration increased from 0 5 to 1 0 or 2 0 g
The shear strength of sands under vibratory loading has also been investigated by Linger (1963) with direct shear and triaxial tests The vibratory tests gave a lower shear strength than the static tests The superimposed vibrashytory loads caused a reduction of the normal load for the direct shear tests and of the confining pressure for the triaxial tests
11 175~ JJ7
Fig 6 Test Equipment for Determination of Soil Shear Strength Wi th and Without Vibrations Used by Mogami amp Kubo (1953)
The degree of saturation and the water content
affect appreciably the compaction properties of sand due to capillary forces between the indivishydual soil particles ( false cohesion) In Fig 7 is shown the dr y density of uniform coarse medium and fine sands as a function of the water content (Kutzner 1962) It can be seen that the dry density of the soil compacted either dry or saturated was approximately the same The lowest density was obtained when the water content was 5 to 10 Kutzner also carried out compaction tests where a wetting agent had been added to the pore water In this case the dry density of the coarse sand after compaction was approximately independent of the water content (Fig 7) These tests indicate that the compaction of partly saturated cohesionshyless soils is appreciably affected by capillaryforces
~ ~18 0~
17 L
~-0-
r
1 16
c 15 f = 50cps0
middot S= 085 mm3
middotc O= 85g~
~ Cl
13 I ---wetfin agent
)C
)C
120 5 10 15 20 25 Water content percent
Fi g 7 Vibratory Compaction of Sand at Difshyferent Water Contents After Kutzner (1962)
Forssblad (1965) used the vane test to study the shear strength of mainly cohesionless soils with and without vibrations at different water conshytents The test data indicated that the vibrashytory shear strength varied between 1 to 6 of the static shear strength The lowest value was obtained for gravel sand gravelly silt or crushed stone when the soil was either dry or saturated The vibratory shear strength of all investigated soils was about the same
4 Dynamic Stresses
The compaction of a soil is to a large extent dependent on the type and the intensity of the stress waves generated by the vibrator Longshyitudinal and transverse waves are transmitted through the soil while Rayleigh and Love waves follow the ground surface In a transverse wave the soil particles move in a plane pershypendi cular to the direction of wave propagation while in the longitudinal waves the particles move in the direction of the wave propagation The transverse waves propagate with about half
107
the velocity of the longitudinal waves (also called compressional waves)
The amplitude of the longitudinal and of the transverse waves gener ated by vibrating roll~rs or plate compactors decrease with increasing di stance from the vibrator mainly due to geoshymetrical damping There is a l so a reduction of the amplitude due to absorption of energy by the soil
According to Forssblad (1965) the intensity of the stress waves must be high enough to overshycome the shear strength of the soil In a partly saturated sand and grave l with a relashytively low apparent ( false) cohesi on a verti~al dynamic stress of about 0 5 to 1 0 kgcm was required to reach a relative comshypaction of 90 with respect to the modified AASHO c ompaction test For clays a considerably larger pressur e - about 5 kgcm2 was required to reach the same r elat i ve compaction at the optimum moistur e content
Whiffin (1954) has measured the stress distrishybution bel ow a vibrating roller a static rolshyler a power r ammer and a crawler tractor in two types of clayey soils Whiffin found a relationshyship between peak pressure (static or dynami c) and the relative compaction of the soil whi ch was independent of the type of compaction machine and of the duration of the stress pulse The dynamic str ess gener ated by the vibrating r oller was about 100 l arger than the corr esponding static stress increase These results have been confirmed by other authors
For ssblad (1965) has measured the vertical dyshynamic stresses below different types of vibrashytory compactors and for di fferent soil types As shown in Fig 8 the maximum vertical dynamic stress decreased rapidly with increasing depth below the gr ound surface Forssblad found that it was possible to calcul ate approximately the dynamic stress distribution by Boussinesq s equation for a compacted soil For a loose soil the dynamic stresses in the soil were less than those calculated by Boussinesq s equation Also Ber nhar d (1952a 1952b 1962 1967) Christoffel (1960) and others have measur ed the stress distribution in the soil below different types of vibratory compactors
Vertical dynamic stress 10 20 JO ~o ~o o0 10 eo 90 middoto 10 20 JO bull 0 0
o 1
10 ___ JI _ l= 20 ~-
10 I 1JO J ---i----
10 II
llh
s o JO0 80 - - - -
0 Vibro1ing p loiit compoctOI 13S lrg (300 lb)
-iOO kg (900 lb)100 ~v 2 - -- - -r 3 Vibt01ing tamper 60 lrg (130 lb)IIC
I vaoillg roller 1i ton 120 s 3 3 lo1I - - -IJ O I bull - - - 12 5 IOfI
I 10
Fig 8 Vertical Dynami c St ress es at Different Depth Under Vibrator y Compactor s of Di fferent Types a nd Sizes According to Forssblad (1965)
Reflection of the stress waves against lower more compact layers can give special compaction effects Near such a layer the compaction of a soil will sometimes be better than that close to the surface Reflection can also have a loosening effect when thin layers of soil are placed on a rigid base
Luscher et al (1967) Ortigosa and Whitman (1968) and D Appolonia et al (1969) have sugshygested that both the maximum and minimum dyshynamic stress in the soil are factors which affect vibratory compaction of cohesionless soils The minimum dynamic stress in the soil should not be much larger than zero to obtain a good compaction Even if the minimum dyshynamic stress is relatively small the soil particles are not free to move
5 Liquefaction During Compaction
The pore pr essur e in a saturated sand builds up progressive l y during the vibrat i on if the re shylative density is low and the sand is not freeshydraining The compactor bogs down when the pore pressure approaches the total overburden pr essure of the soil and the vibrator This phenomenon is called liquefaction Li quefaction is depenshydent on the permeability the initial density of the sand the number of load cycles the over shyburden pressure and the intensity of the cyclic load (Seed and Lee 1966 Lee and Seed 1967 Peacock and Seed 1968 Seed 1968) The vibrashytory load and the number of load cycles required for liquefaction increase with increasing r elashytive density and with increasing overburden pressure
The minimum permeability for the soil to be free - draining is a function of the towing speed the thickness of the compacted layer and the compressibility of the soil Approximate calshyculations indic~te that the permeability should be at least 10- cmsec for a layer thickness of 20 cm a towing speed of 4 kmhour and a volume compressibility of 0 02 cm2kg for the soil to be free - draining and to avoid that the compactor bogs down It has been assumed that the consolidation ratio should be at least 50 for each pass
V VIBRATING ROLLERS
A large number of differ ent types of vibrating rollers a r e used as shown in Table 1 The frequency varies between 20 and 80 cps and the nominal amplitude between 0 3 and 2 5 mm Some types of vibrating rollers operate at a higher frequency in combination with a l ow nominal amplitude Other types have relatively low frequencies and l arge amplitudes The frequency can often be changed by changing the engine speed There are a l so v i br ating rollers with adjustable eccentric moment so that the nomi nal amplitude can be varied Tractorshydrawn vibrating rol l ers usually have a centrishyfugal force which is 2 to 3 times the total weight of the roller
The Road Research Laborator y i n England initishyated in 1945 (and is still conducting) ext ensi ve compaction tests with different types of static and vibratory compactors An early investishygation by Hunt (1946) i ndicated that a higher
108
density was obtained for a coarse sand by a 215 kg vibrating roller than by a 12 ton rubber tired roller or by an 8 ton static smooth wheel roller The layer thickness was 22 cm Later compaction tests were carried out on a number of standardized soils (gravel- sand-clay wellshygraded sand uniformly graded fine sand sandy clay and heavy clay) The first three of these soils contained about 15 of fines Detailed results from the compaction tests are available in a number of special reports The test reshysults have been summarized and discussed by Lewis (1954 1960 1961 1967) According to Lewis (1967) vibrating rollers with weights up to 1 ton could only be used to compact granular soils Tractor- drawn vibrating rollers with weights between 3- 34 and 8-12 tons were suitshyable for all soil types also clays The reshyquired number of passes for vibratory rollers were 4 to 6 The maximum layer thicknesses which were recommended for the test vibratory compactors are relatively low The main reason is probably the comparatively high content of fines in the tested soils Lewis (1961) has published results which show a relationship beshy~ween the dry density of the compacted soil and the frequency of the vibrations (Fig 9) In the tested frequency range the effect of changes in frequency was significant only with the granular soils ( Compare also Fig 9 with Fig 5)
Lewis (1961) has also reported results from compaction tests on a well- graded sand with a 3- 34 ton tractor-drawn roller at different towing speeds and different number of passes These test results indicated that a larger towing speed must be compensated by a larger number of passes in order to reach a given reshylative compaction It was found that the reshylative compaction was mainly dependent on the total vibration time on a given surface area
The test results obtained at the Road Research Laboratory have been discussed and analyzed by Johnson and Sallberg (1960) Morris and Cochrane (1964)and others Johnson and Sallberg (1960) pointed out that a good correlation was obtained for vibrating rollers between the degree of comshypaction and the static weight per cm of roll width
Compaction tests have also been carried out at the National Swedish Road Research Institute (Bruzelius 1954) Typical Swedish soils (coarse gravel sand silt and moraine) were compacted in 06 m to 10 m lifts A considerably higher relative compaction was obtained by a 3 ton tractor- drawn vibrating roller and also by a 1 5 ton vibrating plate compactor than by static rollers The maximum effective compaction depth ranged from 05 to 10 m for the vibratory comshypactors The surface density of the soil was generally lower than the density at some depth below the surface The maximum dry density was obtained at a depth of 10 to 30 cm
Two manually- guided vibrating rol l e r s weighing 250 kg and 16 tons have been tested at the Central Road Research Laboratory in India The f r equency was one of the factors which was varied during the tests (Gokhale and Rao 1957)
Garbotz and Theiner (1959) at the Technische Hochschule Aachen Germany have carried out extensive compaction tests with static smooth wheel rollers vibrating rollers and vibrating
l5r-------------Goe-coy
10
- IJS A Wtllbullgroded sand
0
110 - o-tr~
c
l 15
0 ~ -
10 ___t_middot d 115 -- -------------
- - - 13 - Ion troctor drown roller 110 -- Jfrac34 -ton loncJbullm rollbullr
~Havy clay
95---~-- ~--~--~ JO JS o 50
Frequency cps
Fig 9 Relationship Between Dry Density of the Compacted Soils and Frequency of Two Types of Vibrating Roller According to Lewis (1961)
plate compactors Garbotz and Theiner found that uniformly graded cohesionless materials could not be compacted to a higher density by vibrating rollers than by static smooth wheel rollers The depth effect of vibratory comshypactors however was considerably larger than for static smooth rollers Vibratory compacshytion gave the highest degree of compaction for well- graded cohesionless soils
Garbotz and Theiner also found that the degree of compaction of gravel increased when the frequency of a 165 ton tractor-drawn vibrating roller was increased from 23 to 37 cps A further increase in frequency up to 50 cps caused a small decrease of the density For the comshypaction of cohesionless soils Garbotz (1964) recommends for vibrating rollers the combinashytion of a relatively high frequency and a low amplitude
Johnson and Sallberg (1960) have reviewed the factors influencing the field compaction of soils In this report are summarized results from compaction tests available up to that time
Forssblad (1965) has published results from compaction tests on sand with 14 and 3-3 ton tractor-drawn vibrating rollers and with vibrashyting plate compactors weighing 40 120 and 400 kg The influence of the towing speed and of the number of passes was investigated for the 33 ton tractor- drawn roller The required number of passes to reach a specified density increased with increasing towing velocity Test results indicated that the s urface capacity was approximately independent of the rolling speed between 3 and 6 kmh Lower speeds than normal are recommended when the layer thickness is large and when a very high degree of comshypaction is required
Tynan and Morris (1968) have investigated six types of tractor-drawn vibrating rollers weighshying from 3 2 to 9 - 9 tons The compaction tests were carried out on crus~ed rock uniform dune
109
sand and on medium clay at different water conshytents The layer thickness was about 25 cm before the compacti on In the weight class 32 to 5 tons the roller with the largest nominal ampl itude (1 7 mm) and lowest frequency (24 cps) gave for all soil types higher densities than the rollers with a frequency of about 40 cps and a relatively small amplitude For crushed rock and clay the density increased with increasing number of passes up to 16 For the dune sand the increase of the density was small after 2 passes
The optimum water content for the field comshypaction tests was for the crushed rock 1 to 2 higher than the optimum moisture content de shytermined by the modified AASHO compaction test No signifi cant crushing effect was observed for this material For the dune sand the opshytimum moisture content was the same for the field as for the laboratory compaction tests
D Appolonia Whitman and D Appolonia (1969 ) have i nvestigated the compaction of a unifor m dune sand by a 5 ton and by a 3 ton vibrating roller The layer thickness was large Two passes of the 5 ton roller gave the specified compaction (75 relative density) down to a depth of about 60 cm The compaction was not sufficient however close to the surface down to a depth of about 25 cm The density at depths larger than about 25 cm increased substantially with inshycreasing number of passes D Appolonia et al recognized three different compaction zones The soil near the surface was considered to be overcompacted Below this zone to a depth of 60 cm the compaction was believed to be detershymined by the maximum and the minimum dynamic stress generated in the soil by the roller The minimum dynamic stress must be low enough to allow the particles to move The compaction of the soil below a depth of about 60 cm was conshysidered to be caused mainly by the repetitions of str ess (number of load cycles)
The problem with a low surface density of unishyform cohesionless soils has also been discussed by Bruzelius (1954) Garbotz and Theiner (1959) Wiklund (1960) Forssblad (1965) and others Overcompaction can be caused by heavy static rollers as well as by medium and heavy weight vibrating rollers and plate compactors Heavy vibrating rollers can cause overcompaction down to a depth of 40 to 50 cm as indicated by Baker and Moorhouse (1968) The best surface compaction is obtained with light vibrating rollers light and medium weight plate compactors or with light and medium weight static rollers To increase the surface density it is also advantageous to compact the soil at a high water content
Tynan and Morris (1968) observed that the surshyface density of a well- graded crushed rock was low particularly when a heavy high frequency roller was used and the compaction water conshytent was l ow In this case reflection of stress waves against the underlying rigid sub shybase could have contributed to the observed effect
Hall (1968) carried out compaction tests on crushed limestone sand and lean clay The sand contained 8 of material smaller than 0 06 mm The following types of rollers were investigated
a Tractor- drawn vibrating roller weight
32 tons low frequency
b Tractor- drawn vibrating roller weight 1 4 tons high frequency
c Self-propelled vibr ating roller weight 24 tons low frequency
d Rubber- tired static roller weight 50 tons
Rollers a and d gave for the crushed lime shystone and the clay the highest relative comshypaction The compaction by the two rol l ers was similar On sand compactor c gave the best overall results Roller b gave satisfactory results only on the sand
The relationship between technical data and the performance of vibratory rollers has been disshycussed by Tope (1967)
Heavy vibrating rollers are often used to comshypact rock fill and granular soils containing large stones and boulders Field compaction tests indicate that rock fill can be efficiently compacted in thicker layers than sand and gravel The large depth effects which are obshytained with vibrating rollers on rock fill is probably due to the high impact forces which are generated when the vibrating drum comes in contact with large stones Also the damping in rock fill is relatively low
Vibratory compaction of rock fill usually causes a reduction of the volume by 5 to 7 Field exshyperience indicates that 10 to 15 ton vibrating rollers with 5 to 10 passes can compact rock fill in 1 0 to 2 0 m lifts Vibrating rollers with weights between 3 and 5 tons are used to compact rock fill in 0 5 to 10 m lifts
Heavy vibrating rollers are also used to comshypact natural sand deposits with a low initial density in order to increase the bearing capashycity and to reduce the settlements The sand may either be fully or partly saturated If the depth is relatively large up to 20 to 30 passes may be required Boringe and other measurements have indicated a maximum depth effect of 25 to 3 m for 10 to 15 ton vibrating rollers (Baker and Moorhouse 1968)
Winter compaction of soil and rock fill has been investigated in Canada Sweden Norway Finland USA and other countries Frozen soils except clean and dry gravel crushed rock and rock fill can generally not be compacted to the same dry density as unfrozen soils The difficulties with winter compaction increase with increasing water content and with decreasing grain size and temperature (Bernell 1965) Vibrating sheepsshyfoot rollers have been used successfully to compact gravel during the winter Due to the high contact pressures lumps of frozen soil can be crushed Test results indicate however that also with this method the dry density of compacted gravel is about 10 lower than that of the same soil compacted during the summer (Bernell 1965)
During the winter unfrozen soil can often be obtained from excavations When the unfrozen soil is spread out in cold weather the surface freezes rapidly It is therefore important to compact the soil immediately after it has been placed
110
VI VIBRATING PLATE COMPACTORS
The most commonly used plate compactors weigh between 100 and 500 kg With two eccentrics working synchronously it is possible to obtain a directed vibratory force and to move the vibrator during the compaction By adjusting the eccentric element the velocity and the direction of motion can be varied A plate vibrator can also be moved with only one rotating eccentric if the eccentric is placed at the front end of the bottomplate
The frequency of heavy self-propelled vibrating plate compactors is usually between 12 and 20 cps while the frequency of small vibrating plate compactors can be as high as 70 to Bo cps (Table I) The amplitudes vary between 05 and 5 mm The centrifugal force is usually 5 to 10 times the total static weight of the vibrator
The action of plate vibrators have been reviewed by Converse (1954) Bernhard and Finelli (1954) Lorentz (1960) and others Siedenburg (1957) has calculated for inelastic soils the motion of a vibrating plate compactor without a springshysupported engine bed plate Calculations for plate compactors with spring-supported engine bed plates have been made by Bathelt (1956) and by Bathelt and Kock (1956) Bathelt used a mechanical model consisting of three springs to analyze the behavior Two of the springs could not expand after they once have been comshypressed The calculations showed that the centrifugal force for a self-propelled vibrator should be between three to ten times the total weight of the vibrator Similar calculations have also been carried out by Ephremidis (1959) and Weber (1965)
Also Jurecka (1965) has calculated the motion of vibratory compactors and the energy distrishybution in the soil
Compaction tests with vibrating plate compactors have been carried out in Germany during the 1930 1 s as mentioned in the introduction (MUller and Ramspeck 1935 and Ramspeck 1937)
Bernhard (1952a) has carried out compaction tests with a 15 ton vibrating plate compactor and a multiple-plate compactor A relative compaction of 95 with respect to the standard AASHO comshypaction test was obtained for a uniform silty sand by the 15 ton vibrator down to a depth of 75 cm
Converse (1952 1954) has investigated the comshypaction of a uniform beach sand by a vibrating plate compactor with a weight of about 5 tons The dry density of the beach sand was at least 95 with respect to the modified AASHO compaction test down to a depth of 045 to 060 m and 93 to 96 between 060 to 150 m below the ground surshyface
Greenman (1948) has investigated the vibratory compaction of sand and gravel The soil could be compacted satisfactorily to a depth of 30 cm with a light plate compactor The relative compaction was higher than that which could be obtained by internal vibrators or by pneumatishycally operated tampers
Aldous and Wills (1952) have investigated the vibratory compaction of crushed rock gravel and sand The soils were compacted in 15 to 30 cm
lifts by vibrating plate compactors weighing either 70 or 170 kg The maximum density of the gravel was reached after two passes The unit weight of the soil in the lower half of the 30 cm lifts was less than in the upper half
Plantema (1954) used a 15 ton vibrating plate compactor to compact a 5 meter thick sand fill The highest relative compaction was obtained at a frequency of 20 cps The compaction was checked by soundings with a Dutch cone penetroshymeter An appreciable increase of the peneshytration resistance was observed after the comshypaction down to a depth of 20 m The velocity did not affect appreciably the compaction With a light compactor the best compaction was obshytained at a velocity of 4 mmin
Compaction tests with l1J8 ton 140 kg and 40 kg plate compactors have been carried out by Streck and Schmidtbauer (1951J) It was possible to compact a sand to a relative density of 85 within a depth of 60 to 80 cm with the 148 ton plate compactor within a depth of 20 to 30 cm with the 140 kg compactor and within a depth of 20 to 25 cm with the 40 kg compactor
Weiss (1956) has investigated the compaction of sandy gravel and gravel with a 78 ton vibrating plate compactor A relative density exceeding 50 with respect to the modified Proctor comshypaction test was obtained down to a depth of 12 m for the sandy gravel and 17 m for the gravel
Schaeffer (1958) has investigated the effects of frequency and velocity for a light vibrating plate compactor on the compaction of sandy gravel The frequencies 25 33 and 40 cps and the velocities 1J3mmin 7-~ mmin and 105 mmin were investigated The highest density was obtained with the l01middotrest frequency and with the lowest velocity
Garbotz and Theiner (1959) tested a 225 ton vibrating plate compactor The most favorable frequency range was 12 to 17 cps
Garbotz and Christoffel (1964) have carried out tests with vibrating plate compactors and vibshyrating rollers on crushed rock (ballast material)
Kronenberger (1960) has investigated the comshypaction of vibrating plate compactors without spring supported engine bed plates The vibrashyting characteristics and the weight of the comshypactors were varied The maximum dry unit weight and the maximum equivalent modulus of elasticity of the compacted soil were reached at a frequency of about 40 cps Also Lammlein (1953) and Weber (1965) have investigated the performance of vibrating plate compactors Comshypaction of sand by plate compactors has also been discussed by Hoppman (1962)
The Road Research Laboratory in England has made comprehensive investigations of vibrating plate compactors (Lewis 1961) The depth to which soils could be compacted increased with inshycreasing weight and with increasing contact area of the vibrators It was possible to compact satisfactorily a well graded sand to a depth of 30 to 45 cm with a 15 ton or a 2 ton plate comshypactor The depth effect at the same weight was larger for the plate compactors than for the vibrating rollers Lewis found also that fewer passes were required for a plate compactor than
111
for a vibrating roller to reach a given density The surface and the volume capacities given by Lewis ( 1967) for plate compactors were however much lower than those for vibrating rollers
Forssblad (1965) has reported results from exshytensive series of compaction tests with vibrating rollers and plate compactors A relative comshypaction of at least 90 with respect to the modified AASHO compaction test was reached for the layer thicknesses given in Table 4
TABLE 4 -- NORMAL LAYER THICKNESS FOR VIBRATION OF COHESIONLESS SOILS WITH LESS THAN 5 TO 10
OF THE MATERIAL SMALLER THAN 0 06 MM
Vibrating plate compactor 100 to 200 kg 20 cm
Vibrating roller 1 to 2 tons 30 cm
Vibrating plate compactor 400 to 600 kg 40 cm
Vibrating roller tractor drawn 3 to 4 tons 50 cm
Tests and practical experience indicate that it is possible to compact sand and gravel to a high relative density even in high lifts Also relatively fine sand with an average grain size between 006 and 02 mm can efficiently be comshypacted in high lifts by vibrating rollers or plate compactors However comparatively small amounts of fines (silt or clay size particles) will increase considerably the compaction efshyfort required to reach a certain relative comshypaction Also the layer thickness must be deshycreased with increasing content of fines
VII VIBROFLOTATION
Vibroflotation has been used since about 1935 to compact saturated cohesionless soils The method has been described in a number of publications (e g Schneider 1938 Steuerman 1939 1948 Tschebotarioff 1946 Schneider 1948 Rappert 1952 Cassel 1956 D Appolonia et al 1953 Mobus 1959 Watanabe 1963 Thorburn and MacVicar 1968)
Vibroflotation has been developed and applied by the firms J Keller Germany Vibr ofl otation Foundation Co USA Cementation Co England The method has also been used in USSR and Japan Project s where vibroflotation has been used have been described by Schneidig (1940) Leussink (1948) Fruhauf (1949) DAppolonia (1954) D Appolonia and Miller (1955) Plannerer (1965) Hansbo et al (1968) and by Doscher (1968)
The especially designed large internal vibrators (vibrofloats) have generally a diameter of 37 -5 cm and operate at a frequency of 30 cps The nominal amplitude is about 10 mm and the centrishyfugal force is up to 10 tons The vibrators are provided with jetting devices which facilitate the insertion and the withdrawal of the vibrashytors Sand or gravel is added during the vibration to compensate for the subsidence at the ground surface as the soil around the vibro-
112
floats is compacted With this method the soil can be compacted down to a depth of 20 to 30 m Vibroflotation has mainly been used to compact natural strata of sandy soils with a relatively high permeability A maximum amount of 8 to 16 of particl es smaller than 0 06 mm can gener-allybe allowed
Test results by DAppolonia et al (1953) indishycated that the relative density of a fine unishyform sand is at least 70 to a distance of 1 m from the vibrofloats A spacing of 2 m between the insertion points gave a minimum relative density of 70 throughout the compacted area The distance from the vibrofloats to which the soi l can be compacted appears to increase with increasing grain size and with increasing unishyformity of the soil
Abu- Wata and Said (1958) used vibrofl otation to compact a uniform dune sand which had been placed under water The spacing of the insertion points varied between 165 and 2 5 m The compaction of the soil was checked by soundings with a Dutch cone penetrometer A subst antial inshycrease in the measured penetration resistance was observed close to the insertion points The average initial penetration resistance before the compaction was about 60 kgcm2 while the minimum penetration resistance after compaction at a spacing of the vibrofloats of 2 5 m was 120 kgcm2 below a depth of 4 5 m The peneshytration resistance increased with decreasing spacing of the vibrofloats The increase in penetration resistance and of the compaction was smal l close to the surface
Scheelhaase (1959) has described a project where vibroflotation was used to compact a uniform coarse to fine sand for a turbine foundation The compaction was checked by static penetration tests The point resistance varied between 0 to 150 kgcm2 before the compaction and beshytween 250 and 500 kgcm2 after the compaction The penetration tests indicated that the soil was compacted to a distance of 1 0 to 11 m from the insertion points
Hansbo et al (1968) has used the vibroflotation method to compact a uniform sand with an avershyage grain size of 0 5 mm to a depth of 8 to 10 m The compaction was determined by pressiometer tests plate load tests and penetrometer tests A substantial increase of the penetration resisshytance was observed to a distance of 0 6 to 0 7 m from the insertion points
Internal vibrators which are normally intended for concrete have also been used to compact saturated cohesionless soils (Wenner and Saare 1954 and Bureau of Reclamation 1963) According to Wenner and Saare (1954) sand and gravel can be compacted to 90 to 100 with resshypect to the modified AASHO compaction test to a distance of 0 25 to 0 50 m from the insertion points
Forssblad (1965) has repor ted results from comshypaction tests on sand and gravel with internal concrete vibrators The size of the vibrator the frequency and the amplitude were varied A density between 90 and 100 of the modified AASHO maximum dry density was obtained The radius of action of the vibrators was found to be smaller and the required vibr a tion time was found to be longer than in concrete
The vibration of sand silt l oess and clay
with internal vibrators has been investigated theoretically and experimentally by Poteur (1968) 165
VIII LABORATORY COMPACTION TESTS
Laboratory compaction of cohesionless soils by vibration has been studied by many The soil has in the laboratory tests usually been comshypacted in a Proctor mould placed on a vibrating table The influence of frequency amplitude and acceleration of the vibrating table as well as the influence of surcharge load soil gradashytion and moisture content have been studied
Schaffner (1962) has investigated the vibratory compaction of dry sand Typical test results are shown in Fig 10 It can be seen that the void ratio decreased with increasing accelerashytion The highest density was obtained at frequencies up to 100 cps probably due to the very small amplitude at high frequencies Schnaffner has derived an empirical equation which relates the void ratio of a sand with frequency and amplitude
Kutzner (1962) has investigated the vibratory compaction of glass beads The experiments were carried out on a vibrating table at fre-
0 100 200 300 Frequency f (cps)
Fig 10 Compaction of Dry Coarse Sand After Schaffner (1962)
quencies which varied between 5 and 100 cps Test results are shown in Fig 11 At freshyquenc i es between 40 and 100 cps the density inshycreased rapidly as the acceleration approached 1 g A further incr ease of the acceleration did not cause a further increase of the density The large amplitudes combined with impacts at low frequencies may explain the relatively good compaction within this frequency range
~ 5mm
tSOo----= L-L--08LO L 10 L-------eo -oL10=---cUIJ (16(1 --oo--L--deg LfO - 1oo-shy
Acce Ieration 0 9
Fig 11 Influence of Acceleration on the Vibshyratory Compaction of Gl ass Beads After Kutzner (1962)
Selig (1963) has studied the effects of fre shyquency acceleration and surcharge load on the vibratory compaction of a uniform dry sand Test results indicated that the density increase was small (less than 1) after two minutes of vibrashytion The maximum density was obtained at an acceleration between 1 to 2 g The acceleration required to reach a certain density increased with increasing overburden pressure
Ortigosa (1968) and Whitman and Ortigosa (1968) found from vibratory compaction tests that the acceleration without surcharge should for a dry fine sand be at least 1 g The maximum density was obtained at 2 g When the acceleration was larger than 2 g the density decreased due to overcompaction With surcharge load the reshyquired acceleration was 1 to 3 g depending on the intensity of the overburden pressure Also Dunglas (1967) has investigated the vibratory compaction of sand Dunglas used a special test mould where water pressure was used as surcharge load
Forssblad (1965) found that the dry unit weight increased for a dry sand with increasing accelershyation up to 2 g and up to 3 g when the same sand was compacted partially or fully saturated The dry unit weight was approximately constant when the acceleration exceeded these limiting values No surcharge was used during the experishyments Forssblad also found that the dry unit weight of the compacted soil was independent of the direction of the vibrations
Laboratory compaction tests on sand crushed limestone and crushed quartzite have also been carried out by Gomes and Graves (1962) and by Honigs Valente and Graves (1963) These matershyials were compacted in a Proctor mould by a surface vibrator consisting of a loud- speaker attached to an aluminum plate The frequency could be var ied Test results indicated that the stress waves generated by the loud- speaker affected the compaction of the soil The maxishymum density occurred at some distance below the soil surface
Standardized vibratory compaction tests have been mentioned in the Chapter Elements of soil comshypaction The development of test procedures have been discussed by e g Kolbuszewski (1948) Burmister (1950) Pauls and Goode (1950) Felt (1958) Leussink and Kutzner (1962) Johnson and Sallberg (1962) and by Pettibone and Hardin (1964)
113
A vibrating table and a surcharge load or a vibrating tamper or hammer are used in the standshyardized vibratory test methods as illustrated in Fig 1 Pettibone and Hardin (1964) have found for the first mentioned method that- the density of the compacted soil at a frequency of 60 cps increased with increased amplitude of the vibrating table The increase in density was insignificant when the vibration time was longer than 6 minutes
IX DAMAGE CAUSED BY VIBRATIONS
Vibratory soil compactors as well as blasting pile driving and heavy road traffic may damage adjacent structures Surface waves generated by medium and heavy weight vibratory compactors can often by observed a~ large distances from the vibrator Since also vibrations of very low intensity can be felt by man the risk of damage to buildings and other structures is often exaggerated
Measurements indicate that the damage is mainly dependent on the maximum velocity of the vibrashytions (Fig 3) The risk of damaging adjacent buildings is small if this velocity is less than 03 to 10 cms as indicated by Scheelshyhaase (1962) Susstrunk (1959) Reiher and Soden (1961) and others The risk of damage is also dependent on the quality of the buildshying and the type of the foundation
Ground oscillations from vibratory compactors have been measured by Susstrunk (1959) and Forssblad (1965) An oscillation velocity of 10 cmsec was observed by Forssblad at a maximum distance of 55 m from a 33 ton tractor-shydrawn vibrating roller There were large variashytions of the ground oscillations due to differshyences in the soil conditions Additional inshyvestigations will be of interest
Due to large variations in the soil conditions in the quality of buildings and in size and type of the compactors it is difficult toesshytablish general rules about the risk of damage by vibratory compactors This risk must howshyever be carefully considered especially when heavy vibratory compactors are used
Buried pipes can also be damaged during vibrashytory compaction of trench-fills Minimum thickness of the soil layer above the pipes during compaction by vibration or tamping are given in German specifications (Forschungsgeshysellschaft filr das Strassenwesen 1964)
Retaining walls abutments and basement walls are sometimes damaged by the high lateral presshysures which develop during the compaction of the backfill Measurements indicate that these pressures can be several times larger than those used in the design (Sowers et al 1957 Broms1967and Brems and Ingelson 1967) Also the lateral earth pressures which remain after the compaction are often high and can approach the Rankine passive earth pressure close to the ground surface Further studies are recommended
X FURTHER RESEARCH
This report on the state-of-the-art of vibratory soil compaction indicates that there is need for further research in this field The followshying important points can be mentioned
1 Compaction Mechanism
Transmission of the vibrations from vibrator to underlying or surrounding soil Propagation of stress waves in the soil Damping propershyties of soils at different frequencies amplishytudes gradations water contents etc
2 Special Features of Vibratory Compaction
Rational relationships between suitable layer thickness and number of passes for different types of soils and vibratory compactors Crushing of soil and roelt particles during vibratory compaction Winter compaction of soil and rock fill
3 Compaction Control
Development of efficient and rapid methods for compaction control of thick layers and for soils containing large stones Development of improved laboratory compaction methods based on vibrations
4 Damage to Structures
Damage to buildings by surface oscillations produced by vibratory compactors Lateral earth pressures on retaining walls abutment and basement walls during and after vibratory comshypaction of soils
5 Technical Data
Recommendations about the technical data of vibratory compactors which should be included in specifications technical reports etc
114
REFERENCES United States Department of the Interior 783 pp
Abu- Wata T and Said A (1958) Compaction Tests of Dune Sand Fill under Water by Deep Internal Vibrat i on Transations 6th Int Congress on Large Dams New York pp 467 - 483
Aldous W M and Wills H W (1952) Field Equipment for Vibratory Compaction of Soils and Base Courses Civil Aeronautics Administration Techn Div Repor t No 186 15 pp Indianapolis
Baker G L and Moorhouse D C (1968) Sand Densification by a Heavy Vibratory Comshypactor ASCE Specialty Conference on Placement and Improvement of Soil Structures MIT Camshybridge 13 pp
Barkan D D (1960) Dynamics of Bases and Foundations McGraw- Hill Book Co New Yor k 434 pp
Bathelt U ( 1956) Das Arbeitsverhalten des Rlittelverdichters auf plastisch- elastischem Undergrund Bautechnik- Archiv No 12 Berlin Ernst and Sohn 52 pp
Bathelt U and Koch H W (1956) Zur Frage der Arbeits- und Wirkungsweise von Rilttelverdichtern Baumaschine und Bautechnik Vo l 3 No 12 pp 373- 377
Bernell L 1965) Properties of Frozen Granshyular Soils and Their Use in Dam Construction Proceedings 6th Int Conf Soil Mech and Found Engng Vol 2 Montreal pp 451- 455
Bernhard R K (1952a) Study on Static and Dynamic Compaction of Soils Proceedings Highway Research Board Vol 31 pp 563- 591
Bernhard R K (1952b) Dynamic Compaction of Soil Rutgers University Engineering Research Bulletin No 37 23 pp
Bernhard R K (1962) On Biaxial Stress Field on Non- Cohesive Soils Subjected to Vibrashytory Loads Symposium on Soil Dynamics Am Soc Testing Materials Special Technical Publication No 305 pp 3-12
Burmister D M ( 1950) Suggested Method of Test for Maximum and Minimum Densities of Granular Soils Procedures for Testing Soil s Am Soc Testing Materials pp 111- 113
Cassel F L (1956) Use of Vibration for the Deep Compaction of Granular Soil Civil Engineering and Public Works Review Vol 51 No 599 pp 532- 536
Christoffel H (1960) Prllfung und Forsshychungs- ergebnisse an Rllttelverdichtern Strassen- und Tiefbau Vol 14 No 2 pp 76-80
Converse J ( 1952) Vibration - Compaction of Sand California Institute of Technology January 1952
Converse F J ( 1954) Compaction of Sand at Resonant Frequency Symposium Dynamic Testing of Soils Am Soc Testing Materials Special Technical Publication No 156 pp 124- 137
Converse F J (1957) Compaction of Coheshysive Soils by Low Frequency Vibration Am Soc Testing Materials Special Technical Publication No 206
D Appolonia E (1954) Loose Sands Their Compaction by Vibroflotation Symposium Dynamic Testing of Soils Am Soc for Testing Materials Special Technical Publication No 156 pp 138-154
D Appolonia E Miller C E and Ware T M (1953) Sand Compaction by Vibroflotation Proc Am Soc Civil Engng Vol 79 Separate No 200 23 pp
DAppolonia E and Miller C E Jr (1955) Sand Compaction by Vibroflotation Transshyactions Amer Soc Civil Engineers Vol 120 pp 154- 168
DAppolonia D J Whitman R V and D Appolshyoni a E (1969) Sand Compaction with Vibrashytory Rollers Proc Am Soc Civil Engineers Soil Mech and Found D V Vol 95 No SM 1
Bernhard R K (1967) Stress and Wave Patterns in Soils Subjected to Dynamic Loads Cold Regions Research and Engineering Laboratory No 120 Hanover New Hampshire 52 pp
Bernhard R K and Finelli J (1954) Pilot Studies on Soil Dynamics Symposium Dynamic Testing Materials Am Soc Testing Materials Special Technical Publication No 156 pp 211- 253
Broms B (1967) Jordtryck mot oeftergivliga konstruktioner Swedish Geotechnical Institute Reprints and Preliminary Reports No 22 Stockholm 29 pp
Broms B and Ingelson I (1967) Resultat frlln matningar av jordtryck mot brolandf1ste Swedish Geotechnical Institute Reprints and Preliminary Reports No 11 Stockholm 16 pp
Bruzelius N G (1954) A Study of the Comshypaction of Soil Statens Vlginstitut Meddeshylande 87 Stockholm 69 pp
Bureau of Reclamation (1963) Earth Manual
Paper 6366 pp 263-284
Doscher H D (1968) Vibroflotation Journal Soil Mech and Found Engng Vol 7 No 3 New Delhi pp 365-385
Dunglas J (1967) Le compactage par vibration des milieux granuleux Travaux Vol 50 No 392 pp 495-503 No 393 pp 563- 572
Ephremidis C (1959) Die mathematische Erfassung der Vorgange bei der Rlittelverdichshytung von Boden VDI- Zeitschrift 101 p 277
Erlenbach L (1959) Verdichtung i m Erdbau Strassen- Asphal t - und Tiefbau- Technik Vol 12 No 1 pp 68- 72
Felt E J (1958) Laboratory Methods of Compacting Granular Materials Am Soc fo r Testing Materials Special Technical Publishycation No 239 pp 89- 108
Forschungsgesellschaft fu~ das Strassenwesen (1964) Merkblatt uber das Zufull en im
115
Schaeffer H (1958) Vberprilfung der Vershydichtungsleistung eines RUttelverdichters auf Kiestragschichten Strasse und Autobahn Vol 9 No 4 pp 145- 148
Schiffner H J (1962) Umlagerung Rolliger Erdstoffe durch Vibration Mitteilunger der Forschungsanstalt fur Schiffahrt Wasser- und Grundbau Berlin No 6
Scheelhaase K (1959) Bodenverdichtungsshyarbeiten mittels RUtteldruckverfahren beim Bau eines Kraftwerkes in Berlin- Spandau Baushymachine und Bautecknik Vol 6 No 12 pp 449- 451
Scheelhaase K (1962) Ergebnisse van Proshyberammungen unter Verwendung eines Vibrashytionsbaren und e ines Frei fallbaren Baushymaschine und Bautechnik Vol 9 No 11 pp 453-4 58
Scheidig A (1940) Speichergriindung auf Riittelfusspfaehlen Die Bautechnik Vol 18 No 25 pp 277-282
Schneider H (1938) Das Riitteldruckvershyfahren und seine Anwendung im Erd- und Betonshybau Beton und Eisen Vol 37 No 1 pp 1-7
Seed H B (1968) Landslides During Earthshyquakes due to Soil Liquefact i on Journal of the Soil Mechanics and Foundations Division ASCE Vol 94 No SM5 Paper 6110 pp 1055-1122
Seed H B and Lee K L (1966) Liqueshyfaction of Saturated Sands During Cycl ic Loading Journal of the Soil Mechanics and Foundations Division ASCE Vol 92 No SM6 Proc Paper 4972 pp 105- 134
Selig E T (1963) Effect of Vibration on Density of Sand Proc 2 Panamerican Conshyference on Soil Mechanics and Foundation Engishyneering Vol 1 pp 129-144
Siedenburg R (1957) Unwuchtschwingerreger mit Selbsttatiger Fortbewegung Die Bautecknik No 9
Sowers G C Robb B D Mullis C H and Glenn A J (1957) The Residual Lateral Pressures Produced by Compacting Soils Proc 4 Int Conf Soil Mechanics and Found EngVol 2 pp 243-247
Stewerman S (1939) A New Soil Compaction Device Engineering News-Record July 20 1939 pp 63- 64
Steuerman S (1948) Silt Consolidation by Vibrofl otation Proceedings 2nd Int Conf Soil Mechanics and Found Eng Vol 2 pp 297-301
Streck and Schmidtbauer (1954) Bodenverdichshytungsversuche mit Schwingungs- und RUttelvershydi chtern Strasse und Autobahn Vol 5 No 12 pp 400- 406
Sung T Y ( 1954) Vibrations in Semi- Infinshyite Solids Due to Periodic Surface Loading Symp Dynamic Testing Soils Am Soc Testing Materials Special Technical Publication No 156 pp 35-63
Silsstrunk A E 0959) Schwingungsmessungen Untersuchungen Uber das dynamische Verhalten des Strassendammes bei ungunstigen Baugrundshyverhaltnissen Strasse und Verkehr Vol 45 No 4 pp 11- 14
Taylor D W (1948) Fundamentals of Soil Mechanics John Wiley amp Sons New York 700 pp
Terzaghi K (1943) Theoretical Soil Mechshyanics John Wiley amp Sons New York 510 pp
Thorburn S and MacVicar R S L (1968) Soil Stabilization Employing Surface and Depth Vibrators The Structural Engineer Vol 46 No 10 pp 309- 316
Tope A R (1967) Technical Aspects of Vibrating Rollers in Relation to Performance Australian Road Research Vol 3 No 4 pp 56- 66
Tschebotarioff G P (1946) Vi bratory Impact Compaction of Soils Am Road Builders Association Technical Bullet in No 109 pp 12 - 31
Tschebotarioff G P and McAlpin G W (1947) The Effect of Vibratory and Slow Repetitional Forces on the Bearing Properties of Soils Civil Aeronautics Administration Technical Development Report No 57 Washington D C 70 pp
Tynan A E and Morris P 0 (1968) The Evaluation of a Range of Vibrating Rollers in Compacting Road Materials Australian Road Research Vol 3 No 5 pp 7-53 Viering G (1965) The Vibrational Behavior of Soil in Relation to its Properties Proc 5th Int Conf on Soil Mechanics and Found Eng Vol 1 pp 547-552
Watanabe T (1963) Compaction of Sandy Ground by Vibration-Vibroflotation and Related Problems Proceedings 2 Asian Regional Conf Soil Mechanics and Found Engng Vol 1 Tokyo pp 406- 410
Weber G ( 1965) Untersuchung Uber Vorgange bei der statischen und dynamischen Verdichtung des Bodens Curt-Risch- Institut fur Schwingshyungs- und Messtechnik der T H Hannover Mitteilunger No 5 Hannover 97 pp
Whitman R V and Ortigosa P (1968) Densishyfication of Sand by Vertical Vibrations MIT Technical Paper No T68-5 7 pp
Weiss H (1956) Verdichtung grobk5rnigen SchUttmaterials mit einem schweren Ruttelshyverdichter Baumaschine Lind Bautechnik Vol 3 Heft 6
Wenner C G and Saare E (1954) Grundshyf6rstlrkning genom vibrering under vatten Byggmastaren Vol 33 No Bll pp 201- 210
Whiffin A C (1954) The Pressures Generat~ in Soil by Compaction Equipment Symp Dynamic Testing Soils Am Soc Testing Materials Special Technical Publication No 156 pp 186-210
Wiklund J A (1960) Synpunkter pa packning och sittning vid Arlandabygget 11 Svenska Vagforeningens Tidskrift Vol 47 No 5 pp 203-206
118
STATENS GEOTEKNISKA INSTITUT Swedish Geotechnical Institute
SARTRYCK OCH PRELIMINARA RAPPORTER Reprints and preliminary reports
Pris kr (Sw crs)
No
1 Views on the Stability of Clay Slopes J Osterman 1960 Out of print
2 Aspects on Some Problems of Geotechnical Chemistry R Soderblom
1960
3 Contributions to the Fifth International Conference on Soil Mechanics and Foundation Engineering Paris 1961 Part I
1961
1 Research on the Texture of Granular Masses T Kalstenius amp W Bergau
2 Relationship between Apparent Angle of Friction with Effective Stresses as Parameters - in Drained and in Consolidated-Undrained Triaxial Tests on Satushyrated Clay Normally-Consolidated Clay S Odenstad
3 Development of two Modern Continuous Sounding Meshythods T Kallstenius
4 In Situ Determination of Horizontal Ground Movements T Kalstenius amp W Bergau
4 Contributions to the Fifth International Conference on Soil Mechanics and Foundation Engineering Paris 1961 Part II
1961 5-
Suggested Improvements in the Liquid Limit Test with Reference to Flow Properties of Remoulded Clays R Karlsson
5 On Cohesive Soils and Their Flow Properties R Karlsson 1963 10-
6 Erosion Problems from Different Aspects 1964 10-
1 Unorthodox Thoughts about Filter Criteria W Kjellman
2 Fiters as Protection against Erosion P A Hedar
3 Stability of Armour Layer of Uniform Stones in Running Water S Andersson
4 Some Laboratory Experiments on the Dispersion and Erosion of Clay Mnteriafs R SOderblom
7 Settlement Studies of Clay 1964 10-
1 Influence of Lateral Movement in Clay Upon Settleshyments in Some Test Areas J Osterman amp G Lindskog
2 Consolidation Tests on Clay Subjected and Thawing J G Stuart
to Freezing
8 Studies on the Properties and J Osterman
Formation of Quick Clays 1965 5-
9 Ber8lming B Broms
av p8ar vid olika belastningsforhSlanden 1965 30 -
1 Berakningsmetoder for sidobelastade p8lar
2 Brottlast for snett beastade pAlar
3 Ber8kning av vertikaa pftlars barf6rm8ga
10 Triaxial Tests on Thin-Walled Tubular Samples 1965 5-
1 Effects of Rotation of the Principal Stress Axes and of the Intermediate Principal Stress on the Shear Strength B Broms amp A 0 Casbarian
2 Analysis of the Triaxial B Broms amp A K Jamal
Test-Cohesionless Soils
11 Nftgot om svensk geoteknisk forskning B Broms 1966 5-
12 88rf6rmftga hos pftlar slagna mot sliintberg B Broms 1966 15-
13 F0rankring av ledningar i jord B Broms amp 0 Orrje 1966 5-
14 Ultrasonic Dispersion of Clay Suspensions R Pusch 1966 5-
15 Investigation of Clay Sections R Pusch
Microstructure by Using Ultra-Thin 1966 10 -
16 Stability of Bennermark
Clay at Vertical Openings B Broms amp H 1967 10 -
Pris kr No (Sw crs)
17 Orn palslagning och palbiirighet 1967 5-1 Dragsprickor i armerade betongpalar S Sahlin
2 Sprickbildning och utmattning vid slagning av armeshyrade modellpalar av belong BmiddotG Heifers
3 88righet hos slantberg vid statisk belastning av bergshyspets Resultat av modellf6rs0k S-E Rehnman
4 Negativ mantelfriktion B H Fellenius
5 Grundl8ggning pa korta pi3lar Redog0relse for en f6rshys6ksserie pa NABO-palar G Fjekner
6 Krokiga pftlars b8rf0rmAga B Brems
18 Palgruppers biirformaga B Broms 1967 10-
19 Orn stoppslagning av stodpalar L Hellman 1967 5-
20 Contributions to the First Congress of the International 1967 5 -Society of Rock Mechanics Lisbon 1966
1 A Note on Strength Properties of Rock B Broms
2 Tensile Strength of Rock Materials B Broms
21 Recent Quick-Clay Studies 1967 10-1 Recent Quick-Clay Studies an Introduction R Pusch
2 Chemical Aspects of Quick-Clay Formation R Soderblom
3 Quick-Clay Microstructure R Pusch
22 Jordtryck vid friktionsmaterial 1967 30-
1 Resultat frEm matning av jordtryck mot brolandfilste B Broms amp I Ingeson
2 Jordtryck mot oeftergivliga konstruktioner B Broms
3 Meted f0r berakning av sambandet mellan jordtryck och deformation hos framst st0dmurar och f0rankringsshyplattor i friktionsmaterial B Broms
4 Berakning av stolpfundament B Broms
23 Contributions to the Geotechnical Conference on Shear 1968 10 -Strength Properties of Natural Soils and Rocks Oslo 1967
1 Effective Angle of Friction for a Normally Consolidated Clay R Brink
2 Shear Strength Parameters and Microstructure Characshyteristics of a Quick Clay of Extremely High Water Content R Karlsson amp R Pusch
3 Ratio cp in Relation to Liquid Limit and Plasticity Index with Special Reference to Swedish Clays R Karlsson amp L Viberg
24 A Technique for Investigation of Clay Microstructure R 1968 22 -Pusch
25 A New Settlement Gauge Pile Driving Effects and Pile 1968 10-Resistance Measurements
1 New Method of Measuring in-situ Settlements U Bergdah amp B Broms
2 Effects of Pile Driving on Soil Properties 0 Orrje amp B Broms
3 End Bearing and Skin Friction Resistance of Piles B Broms amp L Hellman
26 sattningar vid vagbyggnad 1968 20-
F0redrag vid Nordiska Vagtekniska F0rbundets konferens I Voksenasen Oslo 25-26 mars 1968
1 Geotekniska unders0kningar vld bed6mning av s8ttshyningar B Broms
2 Teknisk-ekonomisk 0versikt Over anliiggningsmetoder for reducering av sattningar i vagar A Ekstrom
3 sattning av verkstadsbyggnad I Stenungsund uppford p8 normalkonsoliderad era B Broms amp O Orrje
27 B8rf6rm8ga hos sliintberg vid statisk belastning av 1968 15-bergspets Resultat frAn modellf6rs6k S-E Rehnman
No
28 Bidrag till Nordiska Geoteknikerm6tet 1 GOteborg den 5-7 september 1968
1 Nordiskt geotekniskt samarbete och nordiska geotekshynikerm6ten N Flodin
1968
Pris kr (Sw crs) 15-
2 Nflgra resultat av belastningsf6rs6k pl lerterrang speciellt med avseende pa sekunctar konsolidering G Lindskog
3 sattningar vid grundl8ggning med platter pA moranshylera i Lund S Hansbo H Bennermark amp U Kihfbom
4 Stabilitetsf6rb8ttrande spontkonstruktion ningar 0 Wager
for bankfyllshy
5 Grundvattenproblem I Stockholms city G Lindskog amp U Bergdahl
6 Aktuell svensk geoteknisk forskning B Broms
29 Classification of Soils with Reference to Compaction 8 Broms amp L Forssblad
1968 5-
30 Flygbildstolkning som hjiilpmedel vid oversiktliga grundundersOkningar
1969 10-
1 Flygbildstolkning f6r jordartsbestamning vid samh811sshyplanering 1-2 U Kihlblom L Viberg amp A Heiner
2 ldentifiering av berg och bed6mnlng av jorddjup med hjalp av flygbilder U Kihlblom
31 Nordisk sonderingsmote i Stockholm den 5-6 oktober 1967 FOredrag och diskussioner
1969 30-
32 Contributions to the 3rd Budapest Conference on Soil Mechanics and Foundation Engineering Budapest 1968
1969 10-
1 Swedish Tie-Back Systems for Sheet Pile Walls B Brems
2 Stability of Cohesive Soils behind Vertical Openings in Sheet Pile Walls Analysis of a Recent Failure B Broms amp H Bennermark
33 Seismikdag 1969 Symposium anordnat av Svenska Geotek-niska FOreningen den 22 april 1969
1970 20 -
34 NAgot om geotekniken i Sverige samt dess roll i plane-rings- och byggprocessen NAgra debattinl8gg och allm8nna artiklar
1970 15 -
T Kallstenius 1 Geoteknikern i det specialiserade samhallet B Broms 2 Diskussionsinl8gg vid konferens om geovetenskaperna
7 mars 1969 3 Geoteknik i Sverige
denser - utveckling och utvecklingstenshy
4 Geotekniska unders6kningar och grundl8ggningsmetoshyder
5 Grundlaggning pA platter - en allm8n Oversikt
35 Piles - a New Force Gauge and Bearing Capacity Cacu-lations
1970 10 -
1 New Pile Force Gauge for Accurate Measurements of Pile Behavior during and Following Driving B Fellenius amp Th Haagen
2 Methods of Calculating the city of Piles A Summary B Broms
Ultimate Bearing Capashy
36 P8lslagning Materialegenskaper hos berg och betong 1970 10 -
1 Bergets b8rf6rmAga vid punktbelastning s-E Rehnman
2 Deformationsegenskaper hos slagna betongpAlar B Fellenius amp T Eriksson
37 Jordtryck mot grundmurar 1970 10-
1 Jordtryck mot grundmurar av Lecablock s-E Rehnman amp B Brems
2 Ber8kning B Broms
av jordtryck met k8llarv8ggar
38 Provtagningsdag 1969 Symposium anordnat av Geotekniska FOreningen den 28 oktober 1969
Svenska 1970 25 -
No
39 Mor8ndag 1969 Symposium anordnat av Svenska 1970 Geotekniska F6reningen den 3 december 1969
40 Stability and Strengthening of Rock Tunnels in Scandinavia 1971 1 Correlation of Seismic Refraction Velocities and Rock
Support Requirements in Swedish Tunnels 0 S Cecil 2 Problems with Swelling Clays in Norwegian Undershy
ground Constructions in Hard-Rocks R Selmer-Olsen
41 Stalp8lars biirf6rm8ga Resultat av faltfOrsOk med 18tta 1971 slagdon G Fjefkner
42 Contributions to the Seventh International Conference on 1971 Soil Mechanics and Foundation Engineering Mexico 1969
Pris kr (Sw crs)
25-
25-
30-
15-

FELL ENUS and BR OMS
SOIL Ii - ~ UNORAINED SHEAR STRENG1H tJfm2 ~ no
CLAY
r- Jr
00
A Natural wotorconhnt ~ ~ Yonbull bon bull ~AnbullnuJ numbbullr bull ~ Swbulldlbullh fol canbull to~t -~Pla1o limit -uLiqud limt
Fig 1 Soil description
PILE TYPE AND DRIVING DATA
Two precaat hexagonal Herkulea pilea of reinfo[ced concrete with a cross aectional area of 800 cm and a circuznference of 106 cm were used for the experishyments Each pile was composed of 11 2 m long segments The bottom segment was provided with a rock point of hardened steel The piles were also provided with a center pipe a thin wall steel pipe with 42 mm diaineter inside dianieter in which deformation gauges were inserted after the driving Also special cable pipes (DB mm) were placed in the piles for the electrical cables leading from the pile fore gauges to the head of the pile
The nominal concrete cube strength was 500 kgcm2 bull The average measured cube strength was 607 kgcm2 28 days after the casting The reinforceshyment consisted of six bars with 16 mm diameter and a yield strength of 60 kgmm2 bull The failure bending moment of the pile section exceeded 8 5 tonm The segments were fastened together in the field by rigid steel joints ae the driving proceeded The strength of the joints exceeded that of the pile eegment
Test pile PI was composed of five pile segments and three pile force gauges and test pile PI of six segments and four gauges The length of the upper
segment of pile PI wae Z 0 m In this pile the lowest gauge was placed right at the pile tip as illustrated in Fig 2 The location of the uile forc-P gauges are shown in Fig 3
Fig 2 Photo of pile-force gauge placed at the pile tip The pile tip is provided with a rock point of hardened steel
The piles were driven with a 4 2 tons drop hammer The height of fall was O 3 m when the piles were driven down to a depth of 40 m Below this depth the height of fall was increased to 0 5 m The total number of blows required for the driving was about 5000 for pile PI and 4000 for pile PII The driving of the first pile (PI) was terminated at a depth of 53 1 m when the penetration resistance of the pile was 8 cm per 50 blows The second pile (PII) had to be driven to a depth of 55 1 m to reach the same final penetration resistance as pile PI (The penetrashytion resistance at 53 m depth was low and therefore an additional 2 m long pile segment had to be added) The driving data indicated that the piles acted as combined friction and end bearing piles
Pile PI was relatively straight after the driving Inclinometer measurements (Kallatenius and Bergau 1961) indicated that the pile tip deviated laterally 1 4 m from its intended position The minimum radius of curvature of the displaced pile was 340 m Pile PI was not as straight as pile PI The pile tip after driving had been displaced 6 2 m away from its intended location The minimum radius of the pile axis close to the pile point was 170 m Laboratory tests have indicated that failure by bending will occur at a radius of 50 to 100 m
INSTRUMENTATION OF PILES
The pile-force gauge used in this project was developed by the A Johnson Institute for Industrial Research The gauge is composed of three load cells which are placed between two rigid steel plates
94
I
LONG PILES IN CLAY
The load in each cell is measured separately by a system of vibrating wire gauges This makes it possible to determine the total axial force and b~nding moment in the test pile at the level of the force gauge The O 4 m long force gauges were corinected to a pile in the same manner as the pile segments The pile force gauge was designed to resist the stress conditions which develop during the driving Laboratory and field teats have indishycated that the maximUin error in the imiddotecorded forces ia less than 2 of the design load The gauges were designed to resist a tension load of 50 tons and a compression load of 150 tons These values can however be exceeded three times withshyout impairing the function of the gauges (Fellenius and Haagen 1969)
INSTRUMENTATION OF SOIL
Piezometers and settlement gauges were installed two months prior to the driving of the pilea All piezometers but one were type SGI which ace providshyed with a closed oil system Pore water pressures are read directly on a manometer (Kallstenius md Wallgren 1956) To measure the pore pressure in the permeable bottom layers an open pipe witn a filter tip was used Each settlement gauge consisted of a number of Z m sections of flexible steel spring reinforced rubber hoses with 32 mm inside diashymeter The steel spring reinforcement allowed the hose to change its length axially but prevented the hose from collapsing when subjected to lateral earth pressure The hose sections were connected by brass rings The settlement gauges were placed vertically in pre-drilled holes in the soil The flexible settlement gauges and the brass rings followed the moVements of the soil It was possible to determine the settlements of the soil from the location of the brass rings vlith respect to a refershyence point at the ground surface by lowering a plumb bob inside the hose When the plumb bob came in contact with the brass rings an electrical circuit was closed which could be observed at the ground surface With this method it was possible to determine the settlements every 2 0 m with an accuracy ofplusmn 2 mm (Wager 1969)
Two settlement gauges were installed next to each pile An additional gauge was installed at some distance away from the pile The gauges were brought down to a depth of 36 m The location of the gauges are shoWTI in Fig 3 The various gauges could not be installed absolutely vertically Howshyever the deviations were small down to a depth of 10 m
Three piezometers were installed next to the preshydetermined pile locations at the depths 9 0 22 3 and 30 5 m below the ground surface One additional piezometer was installed at a depth of 28 6 m some distance aw~y from the two pile At about the same distance from the piles an open pipe with a filter tip was installed at a depth of 45 0 m
Wl W2 ~Q-
PI ~ Pil [ p E IE3 ~2smI
0
0
W3 Pvf1E P~t 2E f oltgtmiddot PLAN 1-JllITI_ gtI - __pvt 1
PI P Il
Id Pvt 3 at Pl Pil10
M3 M7
bi Pvt 2 ot PT Pil
25 bi Pvt 2 E
M2 cl Pvt 1 ot PIPII M6
ij Depth of W1 W2
MS lI Pvt1E open pipe)
gtshy~
u
6 zi M4lt(sst u
601 fi Pile joint
bull =Pile - force gouge (Ml
DEPTH bi Piezometer (Pvt
lJ Settlement gouge (W)
Fig 3 Location of piles and instrumentation
BEHAVIOUR DURING AND IMMEDIATELY AFTER DRIVING
The driving of the two test piles caused movements in the soil These were measured close to the two piles and at some distance away from the piles Also high excess pore pressures were measured
Settlements The driving caused the ground surface to heave 20 mm close to the pile as shown in Fig 4 The heave decreased however with increasing
95
FELL ENUS and BR OMS
depth SCttkrnc-nts were measured belOV a depth of S to 6 m The maximum settlement (50 mm) was mcmiddotlttsurcd close to pile PII at a depth of 11 m The obstmiddotrimiddotccl heave was caused by upward displacements of tlH soil above the pile tip and the observed settleshyments ]Hobably by downwards displacements at and btgtlow the pile tip
W1 AT PI W3 JC laquol Sil SpoundTllEHElff 1E 20 JO 0
)
U I I LJ
~ J-
~J Rocdng l ond en takm dring dtmng pllo PI Oltld p_n ~ 11d~1 7 oro lltgtkor bofoo drorg ~lo PQbullobullz R1Ddu11 1 ond15 ltlrbull toaon Gfer dtvin~ p1
~g lloltgtdn~ ll ~ bktn aUor ro mon1h
~~ w ~-alt DEPTH
Fig 4 Vertical movements in the clay during and after driving
The coritinued driving caused the soil to heave about 10 to 15 mm At gauge WIII located 5 and 11 m
away from the test piles the driving caused a heave or 5 mm at the ground surface The heave deshycreased howevermiddot with depth The displacements of the soil shown in Fig 4 have been evaluated from the assumption that the soil at the lowest measuring point did not move The reported values thus represent relative movements within the clay layer A precision levelling before and after the driving indicated however that the lowest measured point of gauge WI had settled 9 mm The corresponding settlements of gauges WI and WIII were 7 mm and 5 mm respectively These settlements are primashyrily caused by compaction of the silt and sand layers below the clay The two test piles were driven 13 and 15 m into the bottom layers
Pore Water Pressure The pore water pressures measured by all piezometers corresponded prior to the- driving of the two test piles to a ground water table at the ground The driving caused however a large increase of the pore water pressure at the
gauges located at a depth of 20 3 m below the ground surface The pore pressure increase at the gauges located at 30 5 m depth was small since these gauges were located several meters away from the two piles Also the pore pressure increase observed at a depth of 9 0 m was small All piezometers have aftershywards been checked and are functioning properly The excess pore pressure caused by the pile driving and the dissipation of the excess pore pressures with time are shown in Fig 5 for the two gauges located close to piles PI and PII at a depth of 20 3 m The maximum total pore pressure was 40 tonsm2 at this level The correspondin~ total vertical overshyburden pressure is 32 9 tonsm2 at the same level Thus the measured pore pressure exceeded locally the total overburden pressure by 20
Gauge depth 223 meter Original pore pressure 221 lonsrr Gauge Pvl 2 at pile PI and Pll
Fig 5 Excess pore pressure caused by pile driving and its dissipation with time
Forces and bending moments The force gauges in the piles were read each time a new pile segment was added
Measurements indicate that the force in the two piles immediately after the driving was roughly equal to or slightly less than the weight of the pile above the gauge Thus the driving did not cause any axial forces to be locked11 into the piles
The bending moments in the straight pile PI were small These varied between O 4 and 1 3 tonm Larger values were measured in the bent pile PII Gauge MS located 12 m from the pile tip at the boundary between the clay and the underlaying silt and sand indicated a bending moment of 3 2 tonm This bending moment corresponds to about 35 of the failure value The corresponding radius of curvature was 170 m over the length of the gauge
96
--- --
LONG PILES IN Cl A Y
Gauges M6 and M7 indicated a bending moment of 0 9 and 2 4 tonm respectively The corresponding radii were 220 and 190 meters
BEHAVIOUR AFTER DRIVING
The driving disturbed the clay around the piles It was anticipated that reconsolidation of the clay would cause settlementgt of the soil and drag forces in the piles To study this phenomenon the various instruments were read regularly during the five months period which followed the driving
Settlements The settlement gauges indicated that the movements of the soil were small The recordshyed settlements varied between one and three millishymeters
Pore water pressure High excess pore water pressures developed around the driven pile in the clay as indicated by the gauges located at a depth of 20 3 m The excess pore watta1 pressures dissipated with time No excess pore water pressures remained 150 days after the driving as can be seen in Fig 5
Forces and bending mvments The axial force distribution with time is shown in Fig 6 At first the axial load in the two test piles increased rapidly at the different measuring levels Two or three weeks after the driving the rate of the load increase slowed down After about eight weeks the load inshycrease was very small at the upper levels
PI Pll
= ltMlt --
t-5 bulld
~ s
MS --- I _----
----=-middotn-b l ~__------- v __ bull -~- I~--~
7 1--~- -r-_= M
1
c -bull Ml-~
- I jJ
Fig 6 Recorded forces in piles PI and PII
In Fig 7 the m~asured loads have been plotted at different time intervals after the driving The dotted line in this figure represents the WPight of the pile The line marked O represents the load distribution immediately after the driving It can be seen from Fig 7 that the axial load in both piles was less than theweight of the pile immediately after the driving down to a depth of nearly 40 m The load in the piles increased with time and 144
97
days after the driving the pile load exceeded the weight of the pile by 25 to 30 tons at the level of the interface between the clay layers and the undershylaying silt and clay layer This load is still inshycreasing five months after the driving Gauge M 4 in pile PII indicates that most of the load due to negative skin friction along the pile is resisted as positive skin friction in the underlaying silt and sand layers The average skin friction can be calculated from the load distributions It is proportional to the load difference between adjacent levels In Fig 8 is shown the average skin friction resistance for the two piles The points which on the same occasion represent the average skin friction have been connected The measurements indicate that the sltin friction resistance increases approximatelv linearly from zero at the ground surface to 14 tm2
at a depth of 40 m The skin friction resistance below this depth was positive The negative skin friction corresponds to 17 of the undrained shear strength of the clay or to 5 of the effective overshyburden pressure of the soil
PI Pll
---Whlclplbull
-- too~ dtribbulltbullon
M Pile-lore 1r1u~o
61
iho iurbull rbullftrs o 11 do) orto
-~----
-r 1 S 1530 63100 14ay~M5 I I I I
m
Fig 7 Vertical distribution of load in the piles at different times after driving
The recorded bending moments increased after the driving However the increase was small The bending moment at gauge MS which immediately after the driving recorded 3 2 tonm increased by 12 to 3 6 tonm five months after the driving This relative increase was the largest recorded by any of the gauges
FELLENIUS and BRO MS
PI PU
M Plo-lo gugt
0r11~middot~ Tho flure rofbull to
~ ~ut~~~~~ltgtylt
P05JTIVE SKlI FIIICIION bull IIEGATIVE SKIii FRICTION
S~CA-LE_ _----t---~c-------e-- tonoimZ +10 +0 -10 -20
Fig 8 Calcmiddotulated average skin friction at different times after driving
CONCLUSO~S
The test results indicate that negative skin friction can be caused by the remoulding of the clay around driven piles and the subsequent reconsolidation of the soil even if the settlements of the soil are very sinall The measured negative skin friction after
a period of five months corresponded to 17 of the average undrained shear strength of the clay or to 5 of the average effective overburden pressure The resulting axial forces in the piles were resisted by positive friction in the silt and sand layers at the lower parts of the piles Considerably higher values of the skin friction resistance will undoubtly develop when a fill is placed over the area
ACKNOWLEDGEMENTS
This project which is carried out in co- operation with the A Johnson Institute for Industrial Research has been supported financially by the National Council of Building Research (Statens Rild poundcir Byggnadsforskning)
REFERENCES
Fellenius B H amp Haagen T 1969 11A New Pile Force Gauge 11 (To be published)
Kallstenius T amp Bergau W 1961 1In Situ Determination of Horizontal Ground Moveshyments11 Proc 5th Int Conf on Soil Mech a Found Eng Paris Vol I pp 481-485
5allstenius T amp Wallgren A 1956 11 Pore Water Pressure Measurements in Field Investigation Swedish Geotech Inst Stockholm Proc No 13 58 p
Wager O 1969 11 A New Device for Measuring Vertical Distribution of Settlements 11 (To be published)
98
-----
---
-------- -
Contribution to the discussion in the Specialty Session on Negative Skin Friction and Settlements of Piled Foundations
Negative Skin Friction for Long Piles Driven in Clay
by Bengt H FeUenius Swedish Geotechnical Institute Stockholm Sweden
The aim of this discussion is to inform about further developments of the test program that is presented in the paper 11 Negative Skin Fri~tion for Long Piles Driven in Clay11 by myself and Dr Bengt B Broms
The paper shows that driving of displacement type piles in clay causes remoulding of the surrounding clay and excess pore pressures The excess pore pressures dissipated after about 150 days The recorded further settlements 150 days after the pile driving were within the accuracy of the settlement gauges i e 1 mm
The loads in the piles increased almost linearily with time (Fig 1) There is however a slight decrease of the loading rate The loads at the bottom of the clay layer were 52 and 56 tons in piles P I and P II respectively 420 days afterthe installation Fig 2 shows the load distribution in the piles Gauge M 4 in pile P II indicates that the load is resisted by positive friction in the silt and sand layers below the clay Of the 46 tons which has been the load increase since the installation only 10 tons reached the pile tip
The negative friction after 420 days corresponds to 28 of the average original undrained shear strength of the clay or to 9 of the average effective overshyburden pressure
FORCE tonbull
~ ~00~
oo-- M~ ~
lt-- ~
-~------- _ - _----
In the next phase of this investigation which will begin smiddot10rtly a dead load of 80 tons will be placed on each test pile In phase three (after further six or ten months) a 2 m high gravel fill will be placed around the two test piles over an area 40 by 40 meters The results of the various test phases will be published by the Swedish Geotechnical Institute
LEGEND ---WbullM o pio ( bull1 -- Ld dltt~von
1-1 Plo-lmo10i Pbull 1gt1bull rololaquo b n~ u of ltWtbull otlor drn
bull
-1 - I
7 bull
Fig 2 Vertical distribution of load at different times after driving
- --- ~------middot--- bull-- __-_-___ I-______ [____ _bull---- C------------------~-----------l---_j-____j_____j______j__ OJYS AFTER - 50 lOO 150 200 250 lOO 350 lOO 511 $00 DRIVING
Fig Recorded loads in piles P I and P II
Contribution to the discussion in the Specialty Session on Negative Skin Friction and Settlements of Piled Foundations
Design of Pile Groups middotwith Respect to Negative Skin Friction
by Bengt B Brems Swedish Geotechnical Institute Stockholtn Sweden
This review is concerned with the methods which are used in Sweden to design pile groups with respect to negative skin friction Measurements have shown that drag forces negative skin friction) develop along single piles or pile groups when the soil settles with respect to the piles The settlement of the soil may be caused by the placement of a fill around the piles a lowering of the ground water table or by remolding of the soil during the driving The load increase due to negative skin friction often approaches the allowshyable load on the pile when the pile length exceeds 20 to 30 m The negative skin friction can be large even if the settlements are small (a few millimeters) Three different cases are gcinerally recognized as illustrated in Figs ia ib and 1c
Fill ~ E bull cV ~middot II I II =-- ------- ---
Clay I --1 -----~- ~~aJlo51 I _cru19 _cnu9sc I
I I I I
~_permoler ~ aroo
(o)Olso I (t Cose II (cJ Caso m
Fig i Calculation of negative skin friction
Case 1 The piles in the pile group shown in Fig ia are assumed to be widely spaced The height of the fill placed around the pile group or the lowering of the ground water table is large enough to develop the maximum skin friction along all the piles in the pile group It is assumed furthermore that the piles are point bearing and that the pile points do not move when the load in the piles is increased by negative skin friction This is generally the case in Sweden where most piles are driven to rock The neutral point is often assumed to be located close to the pile point since the compression of the pile is generally neglected The negative skin friction resistance will be overestimated by this method if the settlements are small or the pile points move
There are two different methods to calculate the negative skin friction which is assumed to act along the full length of the pile The first method is generally used when the liquid limit of the soil is less than about 50 The negative skin friction c is according to this method calculated from the neg equation cneg = a (f J where a 11 is a coefficient and
ltfi is the effective overburden pressure includingV
the weight of the fill In this case it is thus assumed that negative skin friction is propertional to the effective overburden pressure (f i The values of the coefficient a1 which vary befween O 2 to 0 3 are based on test results reported by Johannesen and Bjerrum (1965) These values have 1e_~n derived from pile load tests in a clay with a relashytively low cp-ratio and a low liquid limit
In the second method which is often used when the liquid limit of the clay exceeds approximately 50 it is assumed that the negative skin friction c is equal to the adhesion of the surrounding neg soil with respect to the pile surface The values which are used to calculate the negative skin friction are generally the same as those which are used to calculate the bearing capacity of single piles in clay as indicated by the following table
Table I Evaluation of the unit skin friction resistance ca
(a) cult 0 5 kpcm2
Skin-friction resistance C a
Steel piles 05 C u
Concrete piles 08 C u
Timber piles 10 C u
(b) cgt 0 5 kpcm2
2Steel piles 0 1 kpcm Concrete piles o 3 Timber piles 05
One may question if the same values of the unit adhesions should be used to calculate the negative skin friction as those used in the calculations of the bearing capacity The maximum value of the adhesion governs the negative skin-friction resistance while the minimum value is of interest when the bearing capacity is calculated It may be argued that all piles which are affectetj by negashytive skin friction smiddothould be designed to resist a drag load which corresponds to the full undrained shear strength of the soil as measured by e g vane tests unconfined compression tests or fallshycone tests instead of a reduced value which correshysponds to a lower limit of the adhesion
Case II It is assumed in Fig 1b that the piles are closely spaced and that the height of the fill or the lowering of the ground water table are sufficiently large to mobilize the full skin friction resistance or the full shear strength of the soil along the perimeter area of the pile group The average skin friction cneg piobably will be less than the undrained shear
strength of the soil The perimeter of the pile group partly follows the pile surfaces The undrained shear strength of the soil is generally used for the perimeter area which follows the undisturbed soil while reduced values are used for the area which follows the surfaces of the piles The pile group carries also the weight of the fill which is located immediately above the piles or the increase of the boyant weight of th_e soil within the pile group when the ground water table has been lowered It is thus assumed in the calculations that the vertical effective stress in the soil within the- pile group will not at the level of the rock surface be affected by a lowering of the ground water table The total drag force is as~umed to be equal to the sum of the negative skin friction along the perimeter area and the weight of the fill within the pile group This total drag force is distributed equally among all the piles in the pile group It may however be argued that the change of the boyant weight of the soil within the pile group should not be included in the calculations since the total weight of the soil is not affected This is frequently done by many designers
Case III The piles in Fig 1c are relatively closely spaced and the height of the fill or the lowering of the ground water table is moderate to small In this case it is assumed that the pile group carries a load which corresponds to the weight of the fill within the area indicated in Fig 1c The sides of the inverted truncated soil cone have a slope of 1 3 to 1 5 The proceedures used by different designers differ due to lack of test data If settlem~nts are caused by a lowering of the ground water table it is often assumed that the total drag force corresponds to the change of the boyant weight of the soil below the area indicated in Fig 1c The pile group will in this case carry a load which is equal to the weight of a column of water with a height equal to a lowering of the ground water table
It should be pointed out that the available test data are extremely limited that measurements primarily have been made on single piles and that the settleshyments which have occured around the instrumented piles have been relatively large When additional test data become available it is likely that the presently (1969) used design methods will be changed It should however also be pointed out that these design methods generally do not take illto account the increase of negative skin friction which is caused by remoulding of the soil during driving middotThis inshycrease of the pile loads can be very large in Cases II and III For these cases the calculated negative skin friction is normally moderate
There are several methods to calculate the allowshyable load for a pile group allow as indicated below
group0 group ult Qneg
( I)Qallow F
Qgroup group ult
0 --p-- Qneg (2)allow
In the first case the safety factor Fis -applied on both the calculated ultimate bearing capacity of the pile group as well as on the negative skin friction Qnegmiddot In the second case the factor of safety is
only applied on the calculated ultimate capacity The first method which is normally used in Sweden gives a higher allowable load than the second method
The consequenses of exceeding the ultimate capacity of the pile group are often not serious since excessive pile loads caused by the negative skin friction will generally not cause collapse of the supported strucshyture If a pile group settles then the negative skin friction changes into positive skin friction which will contribute to the bearing capacity of the pile group Thus a relatively low safety factor can be used with respect to negative skin friction
References
Johannessen IJ and Bjerrum L (1965) Measureshyment of the compression of a steel pile to rock due to the settlement of the surrounding clay Proc 6 Int Conpound Soil Mech a Found Engng Vol Z pp 261-264
NEGATIVE SKIN FRICTION ON PILES IN CLAY-A LITERATURE SURVEY
Bengt H Fellenius Swedish Geotechnical Institute Stockholm Sweden
Introduction
In 1965 lhe Axel Johnson Institute for Industrial Research in cooperation with the Swedish Geotechnishycal Institute initiated an investigation on negative skin friction on piles in clay The work is supported financially by the Swedish Council for Building Research
The first step in this investigation was a literature survey This article is a survey of papers which have been published on negative skin friction in clay up to the end of 1968
Contents
1 Statement of the problem
2 Previous investigations
2 1 Structural damage caused by drag forces
2 2 Cases where drag forces have been
considered
2 3 Research on drag forces on piles
2 4 Comments on section 2
3 Calculation of drag forces
3 1 Terzaghi and Peck
3 2 Zeevaert
3 3 Buisson Ahu and Habib
34 Elmasry
3 5 Johannessen and Bjerrum
3 6 Brinch Hansen
3 7 Others
4 Comments and conclusions
5 Literature index
6 List of symbols
1 Statement of the problem
When the soil around a pile settles shear forces are induced along the pile surface and the load in the pile is increased Usually this phenomenon is called negative skin friction In cohesive materials the terms 11 negative skin cohesion and 1negative skin adhesion 11 are sometimes used
2 Previous investigations
Under this heading some cases where negative skin friction has caused structural damage (2 1) are deshyscribed as well as cases where negative skinfriction has been taken into account in the design (2 2) Also the research on drag forces in piles is reviewed (2 3)
2 _Structural damag~ caused 1Y dras-forces
McKay_(1938Jx) describes how a fill around a buildshying which had been founded on concrete piles caused large settlements around the piles The piles were not designed to carry the resulting drag forces and the piles failed No calculations were given by McKay McKay also describes how piles for a river quay in 10 m depth of water were damaged by drag forces caused by a fill of a silty material which had been deposited around the piles Negative skin friction developed both in the silty fill and in the underlying materials through which the piles had been driven
Florentin and l~Heriteau (1948~ describe a case where concrete piles with 0 8 m diameter were driven through a 4 m thick fill and through undershylying layers of very soft clay into a dense sand sublayer The piles settled 30 cm in three yearsmiddot which according to Florentin and lHeriteau 11 can only be explained by negative skin friction on the piles 11 The settlement of the piles was indirectlybull
caused by unsatisfactory pile driving The settleshyment stopped when the pile tips reached the undershylying dense sand
Moore (1949) describes a case where a wooden pile had been driven through a stony fill and underlying compressible soils down tc firm layer The thickshyness of the fill was 13 m and the compressible soils
x) See literature index in section middot5
2
consisted of a 9 m thick layer of mud and 6 m of clay The settlements of the fill and of the compressible layers caused drag forces of such magnitude that the pile pulled loose from the supported structure The design pile load had been determined from i dynamic pile formula The pile might have been damaged during the driving) The drag forces as estimated by Moore were 170 tons for the fill and 12 tons for the mud and clay
Milner (1957) describes a tunnel which was founded on 40 cm diameter cast-in-place concrete piles The piles were driven through 8 m of soft clay into an underlying layer of mica An 8 m thick fill caused settlements in the clay which resulted in estimated drag forces of 80 tons Because of this additional load the piles were pushed down into the mica and the tunnel walls cracked
lt-pp_ (~i~~)_ relates in a letter that settlements of about 2 m caused drag forces of such magnitude around unreinforced concrete piles under the floor of a hangar building at La Guardia Airport New York that some piles were pulled loose from the floor Attempts were made at La Guardia to measshyure the drag force by measuring the force that was required to prevent the pile from sinking When this force reached 30 tons the pile failed in tension
Further examples are given by Chellis (1951)
2 2_ Cases_ where drag forces have been considered in the desipoundn
Golder and 5pence t1960) mention that piles for a bridge where large drag forces were expected were covered with half an inch thick layer of asphalh The piles were put down in predrilled holes in the ground to protect the asphalt
Resendiz_l1964 a[ describes a case where concrete piles of variable diameter were used one upper part (~ 35 cm of about 30 m length) and one lower part (lt6 20 cm of about 3 m length) The piles were driven to a firm sand layer The allowable pile load was the estimated ultimate bearing capacity of the pile tip i e the safety factor against soil failure was equal to 1 When drag forces on the piles were caused by the settlement of the ground the pile tips were pressed down into the sand layer and thus the building on the piles settled at the rate of the ground surface The tests have been described in detail by Resendiz (1964 b)
Girault ( 1964) describes the difficult pile foundation problems in Mexico City These problems are caused by the lowering of the ground water level and the resulting large regional settlements Buildshyings which are founded on end-bearing piles appear to rise with respect to the ground and buildings on friction piles settle unevenly because of large drag forces on the piles Girault has proposed a comshybination of friction piles and end bearing piles (See fig 2 2 1) When the friction piles (A) sink load is transfered through the soil between section oC - cl and section (3 - (3 on to the end bearing piles (B) A building founded on this piling system will accordshying to Girault settle evenly at the same rate as the ground surface
Further examples can be studied in papers by f-e_ev-)5_lJp]_~ )_c(~ 7)_b_)_~~i _(tJJ 2_s_O_ea_ ~196_1 _and Locher_ 1965
--middot
Firm rond subloy(r
Fig 2 2 1 Combination of friction and end bearing piles A= friction pile B = end bearing pile
2 3 _Research on draG forces on p-les
GantL St~pbens and Moulton (19581 describe tests on steel pipe piles which were equipped with electrical strain gauges The purpose of the tests was to determine the allowable pile load for a bridge foundation The soil consisted of 7 m of sandy fill 10 m of silt and a sublayer of sand The piles were of 30 m length and were thus driven about 12 m down into the sand Drag loads of about 90 tons were measured four months after the driving of the piles
Tchebotarioff_li 958) in the discussion following the article by Gant et al indicated a few possible errors in the measurements and pointed out that only a part of the measured axial pile forces could have been caused by drag forces
Weele t1964) describes a case where the drag forces acting along wooden piles of different lengths have been determined Three piles were driven at a spacing of 4 m down to a depth of 13 3 m (No 1) 15 5 m (No 2) and 17 5 m (No 3) The soil consisted of 6 m of sand 7 m of clay and a sand sublayer which at a depth of 17 m was very firm The ground water level in the area was initially 1 m below ground surface In an initial phase the ground water level was lowered 6 m and in a second phase an additional 3 m This caused settlements in the soil and the piles were dragged down See fig 2 3 i
Along the upper part of the piles the settlement in the soil was larger than the settlement of the piles and drag forces were developed along this part of the piles In the lower part the settlements were smaller than those of the piles and thus positive skin friction was obtained along the surface of the piles
----------------------------------
-----------------
3
TIME IN DAYS1~s~RPbbJo~se~l~~ollldllpgtbb~o5er~~===~--ae-
10 10
os 1 O
-20 ___
~ ~
30 - TESTPI LE 3
1-1-1-1 1
o I I I I TEST PILE 1
u 50 ~ I I -r-1 z
60 TESTPI LE 1
-k I 70 ROIINn CURFAC - 80 I-
90
Fig 2 3 1 Settlement-time relation for the ground surface and the 3 test piles during the two stages of the ground-water lowering (After Weele 1964)
From pulling tests on concrete piles the average shear stress along the pile surface were determined as a fW1ction of the pile displacement The maxishymum resistance was obtained at a displacement of about 10 mm The magnitude varied for the three types ot soil
In the upper sand layer 3 tm2
In the clay 1 5 tm2
In the sand under the clay 20 tm2
From these results the drag forces on the piles were calculated The total drag load on pile No was estimated to 24 tons
2 4 Comments on the reviewed cases
Drag forces on piles can be large and cause piles to settle This may damage the supported structures However in the literature on drag forces on piles no reference has been found of the influence of negative skin friction on piles which have been driven to a very firm layer Severinsson_(1965) reportes that no settlement has been observed for 300 structures in Sweden founded on long high quality precast concrete piles driven to rock or to similar layers through settling soil layers
The magnitude of the negative skin friction given by Weele may be compared with the values reshycommended by Tomlinson (1963) for the calculashytion of drag forces along piles
Clay and sitt o 7 3 tm2
Very stiff clay 5 20 tm2
Loose sand 4 tm2
Dense sand 3 7 tm2
In the same paper Tomlinson mentiones that drag forces middotsan be caused by the remoulding and heave of sensitive clays during E]e driving as is shown in Fig 2 4 1 This effect has also been discussed by among others ~~S~S~1-9~ (1_9_3_2J 931Il]1_i1-g_S_l~a_l _lf 9_4_8)2 _ _s_cp_e_~~~fj_(_1J1J] and Zeevaert 1949 1
Heaved-up soil reconsolidating under own weight causing dra o n on piles
Fig 2 4 1 Effects of ground heave on groups of driven piles in clay
3 Calculation of drag forces
Under this heading the existing theories for detershymining drag forces are reviewed
3 1_ Terza_ghi and Peck Ji948 recommend the following method for determining drag forces on pile groups The soil around the piles consists of a compressible layer of clay and a surcharge causes the clay layer to settle The axial force (F) on a pile group is then the sum of the structural load (F ) and the drag force (F ) The drag force itself0is equal to the sum of the 1ampeight of the fill within the pile group (F~) and the skin friction F~) along
the perimeter of the pile group F~ is divided equally between the piles can according toF 11
Terzaghi and Peck vary bet~een zero and the maximum value calculated from equation 3 1 3
F = F + F t F 11 x) 3 1 1Q n n
Structional load on the pile
Weight of fill carried by one pile
F =~bullmiddotHF 3 1 2 n n
A Area of the pile group
n Number of piles
HF= Thickness of fill
Y Unit weight of the surcharge material
F 11 = load caused by settling of the surshyn rounding clay
F11~ S 3 1 3 n n
c Circumference of pile group
HL = Thickness of clay layer
T Average shear strength of clay
4
To reduce of the magnitude of the negative skin fricshytion Terzaghi and Peck recommend that the distance between the piles should not exceed Z 5 pile diashymeters
3 2_Zeevaert_(_1959J states that the ultimate point bearing capacity of piles which have been driven through compressible soil to firm sand layers can be calculated from the equation
3 2 1
Failure load (soil failure)
A factor which is a function of the angle of internal friction (-p) and the relative density of the sand (Dr)
N = N middot (D + O 1)r q r
Nq is a function of ltP It is assumed that the shearing strength is fully mobilized on the surface of failure
a Pile area
p h = Effective vertical soil0
pressure in the sand at the pile tip
The failure load F B depends on the effectiwovershyburden soil pressure at the pile tip When the soil settles the vertical pressure poh is reduced to
pvh by load being transfered to the pile (Fig 3 2 1)
Thus the failure load FB is reduced to F~
z
fig 32 1 Reductionmiddot of th~ effective vertical pre~sure
The middotshear force in the soil along the pile is accordshying to Zeevaert a_function of p
0
3 2 2
is the ratio between the horizontal anq the vertical pressuie in the soil at the pile surface and
tanip is the bullratio between the horizontal pressure against themiddot pile and the shear force along the pile
When p is reduced to p the shear strength is also0
reduced This is a basi~ assumption for Zeevaeres ~athemtical d~riv~ng of the following formulas
The total drag force is derived at
3 2 3
where n= Number of piles per unit area
i_ e-mz)= ( 1 - 3 2 4Pv m
i (1 - e-mh) 3 2 5Pvh = m
m= n UK tanip 3 2 6 0
This approach to negative skin friction is mainly dependant on the validity of Eq (3 2 1) and (3 2 2) These equations do on some occasions not agree with experimental facts as shown for example by Vesic_l1964J Furthermore it is doubtful whether Eq 322 is valid in clay
Zeevaert s approach refers to large pile groups of piles The equations can not be used for a single pile without making certain assumptions about the load distribution around the pile
de _Beer _lt 967) has developed Zeevaert s approach and has published nomograms that simplify the use of the equations In the case of a surcharge on the ground surface de Beer assumes that the area ffecting the single pile is equal to the base area
a 90deg cone with the height equal to the depth of the settling layer
3 3 Buisson Ahu and Habib 1960) have studied theoretically the stress distribution along a pile which has been driven into a compressible clay Settlements of the compressible layer are caused by a fill placed on the ground surface The pile tip rests on sand
The following equation is given (See Fig 3 3 1)
F point F Q + F~ + r middot V middot Z - r V middot H-Z) 3 3 1
where FQ F and F t are defined in Fig 3 3 1 n po1n
u 3 3 2F~ = O 30 2
the term 0 30 is a 11friction coefficient11
which can be compared with K bull tanip0
unit weight of fill
u perimeter of pile
T shear strength of clay
z depth to the neutral point i e the depth along which the dr~g forces act
5
settlement z difference
pile-soil H
_neutral point
Fig 3 3 1
The distance Z to the neutral point can be detershymined by calculating the pile compression and the soil compression separately by iteration procedure The tip of a pile which has been driven to bedrock or to a similar very firm layer does not move when loaded The neutral point must in this case be very close to the pile tip due to the low compressibility of the pile Thus the last term in the equation (3 3 1) is small and can be neglected
34 Elmasry (1963-has tested 80 cm long model Steeff)ffeS~-WhlCh-were provided with strain gauges The piles were driven through a 50 cm thick layer of silty clay which was mixed in a soil mixer beshyfore it was placed in the test cylinder The pile tips were located in a sand layer A load was applied on the cla)- surface through a plate The forces in the model piles were measured for different loading conditions Elmasry derived from the test results an equation to calculate the drag force The maxishymum value of the drag force was found to be proshyportional to
the consolidation pressure from the surface load (pc)
the pile perimeter (U)
the thickness of the clay layer (H)
the ratio between the dry weight of soil per horizontal unit area and the consolidation pressure
the natural water content (w)
The maxilnum value of the drag force was a linear function of these parameters taken separately Comshybining these functions Elmamiddotsry derived the following formula
Fn=Fn-s+0416middot (2middot pcmiddot Hmiddot U 2
O 70 middot middot
w p3 ___c) 3 4 1
15 1d
F is the drag force due to the consolidashyn-s tion of the clay under its own weight This dr1g force can be calculated from the following equation
H T bull dH = U middot H middotTFn-s=JUmiddot -middotp-s p-smean0
is given as 30 of the shear strength of the clay at the final stage of consolidation Elmasry referes to Zeevaert (1957 a)
3 5 Johannessen and Bjerrum (1965) describe reSUlfitfiOffi-teSfs-oii-tWOSteeipliis 47 cm in diashymeter with a length of about 60 m which were driven to bedrock through a layer of clay of about 50 m thickness
After the piles were installed a fill with a height of about 10 m was placed around the piles A slide in the underlying clay disturbed the tests and results were obtained from only one of the two test piles The deformations caused by drag forces were measured on this pile through a system of rods Since the modulus of elasticity of the steel material was known the average shear stress s along the pile surface could be calculated The shear stress corresponded to the equation s = p bull K bull tanP
0
The measured drag load at the pile tip exceeded the ultimate bearing capacity of the pile tip
The tip penetrated 6 cm into the underlying rock This penetration occured slowly and in short steps At each increment the pile was partly unshyloaded The drag force decreased momentarily
The largest calculated value of K bull tanP was O 20 which corresponded to a total pilf shortening of 2 5 cm The calculated total maximum drag load was 300 tons On the basis of these results Bjerrum and Johannessen recommend that the calculated drag loads on piles in loose marine clays should correspond to 20 of the final effektive vertical pressure in the clay i e
K bull tanO = 0 20 0
F = 4-u Sbull dz= o20Ju- pmiddot dz 3 5 1 n J
0 0
3 6_Brinch Hansen_(1968) has investigated thellretishycally the skin friction on piles in general and applied the results on negative skin friction Brinch Hansen derived the following equation
3 6 1s -47 +6~-1Jii-n=bc-
s = shear force (negative)
p surface load per unit area andor pore pressure d~crease in the soil
D pile diameter
b distance between piles in a group
----------------
6
Equation (3 6 1) gives an upper limit of the negative skin friction Brinch Hansen states that the maxishymum negative friction is also governed by the maxishymum pull out resistance of the pile The theoretical expressions for the pull out resistance are given in the paper
Brinch Hansen applied Eq (3 6 i) on the pile tests reported by Johannessen and Bjerrum Chapter 3 5 above) An extremely good agreement was obtained between measured and calculated drag load This agreement may only be a coincident as is pointed out in the paper
3 7 Other studies
Other theoretical studies of negative skin friction have been published by Yokowo et al (1968) and p_op~~~-ltsectL~_l1J_6_8J It is assume_cf in these studies however that both the soil and the pile material are purely elastic These assumptions limit themiddotpractical application of the theories as soil and especially the soft clays in Sweden do not behave elastically These studies have therefore not been cited here
4 Comments and conclusion
Certain assumptions and extensive simplifications must be made as to the soil conditions when applyshying the equations bymiddotBuisson et al and Elmasry on practical cases Since the calculated drag forces are to a large extent dependent of these assumpshytions it is difficult to estimate the accuracy of the proposed methods
When tr1e negative skin friction is calculated according to the method proposed by Terzaghi and Peck it is difficult to choose the value of to be used in the calculation of F It is far from certain that shear is fully developJld along the full perimeter area of a pile or a pile group The value of T deshypends also on the remoulding of the soil during the pile driving and on the resulting reconsolidation of the soil
In Zeevaert s theory the shear force along the pile depends on the resulting overburden pressure in the soil after unloading Part of the overburden is transferred to the pile and will depend on the coefficient K middot tanlp These factors vary with the soil conditioJgts and the method of pile installation However very little is known about how negative skin friction is affected by these factors
Johannessen and Bjerrum base their recommendashytion on the results from a single test pile in loose marine clays in Norway Their equation (Eq 3 51) is simple and can easily be applied on practical cases As mentioned above the general validity of this equation remains to be proved However the equation is the only one that is derived from an actual field test
Before any definite recommendations can be given the parameters which affect the skin friction such as soil conditions soil characteristics and magnishytude of the consolidating pressure must be evalushyated in the field and in laboratory Especially full scale tests should be of value Furthermore it
will be essential to investigate the effects of pile driving and the rate of soil settlement upon the magnitude of the shear forces
Once the maximum drag load can be evaluated the important question of how this drag load affects the behaviour of the pile and how it can be taken into account when designing the actual pile founda tion remains to be answered Fellenius (1964) has proposed for a point bearing concrete pile driven in underconsolidated clay (in southern Sweden) that a drag force corresponding to the original undrained shear strength of the clay should be assumed to act along the pile surface down to a maximum depth of 20 m or for piles shorter than 40 m only along half the length of the pile The sum of the drag load calshyculated in this way the maximum design load and the weight of any fill located within a pile group should not exceed the ultimate strength of the pile section i e about O 65 of the cube strength
This literature survey indicates that drag forces can cause piles to sink with fatal results when the piles are supported by sand strata or any material in which the piles can penetrate Local experience will on many occasions indicate whether a proposed design will be safe or not When high design loads are used or the driving conditions are severe a more thorough penetration of the problems will be required
5 Literature index
Brinch Hansen J (1968) 11A theory for skin friction on piles 11 bull Danish Geotechnical Institute Bulletin No 25 pp 5-20
Buisson M Ahu J and Habib P 1960) 11 Le frottement negatipound 11 Annales de Institute Techshybull
nique de Batitment et des Travaux Publics No 145 Paris 18 pp
Casagrande A 1932) 11 The Structure of Clay and Its Importance in Foundation Engineering 11 Procbull
of the Boston Soc of Civil Eng Val 19 No 4
bullChellis RD (1951) npile foundations 11 McGraw Hill Book Co New York 1951
Correa JJ (1961) uThe Application of Negative Friction Piles to the Reduction of Settlement11
bull
Proc Fifth International Conference on Soil Mechanics and Foundation Engineering Paris Vol II pp41-44
Cummings A E Kerkhoff G D and Peck R B (1948) 11 Effects of Driving Piles into Soft Clay 11
bull
Proc ASCE Val 74 pp 1553-1563
de Beer E (1966) 11 Berekening van de negatieve wrijving op palen 11 bull Tijdschrift der openbaren werken van Belgie No 6 1966 p -29
Elmasry MA 1963) 11 The Negative Skin Fricshytion of Bearing Piles 11 bull Ph D Thesis at Swiss Federal Institute of Technology Ztirich 115 pp
Fellenius Bror (1964) 11Aktuella pcllningsproblem 11 bull
Nordisk J~rnbanetidskrift nr 6 1964 pp 156- 162
7
Florentin J and 1-Heriteau G (1948) 11 About an Observed Case of Negative Friction on Piles 11
bull
Proc Second International Conference on Soil Mechanics and Foundation Engineering Rotterdam Val V pp 155-156
Gant E Stephens J and Moulton L (1958) 1Measurement of Forces Produced in Piles by Settlement of Adjacent Soi1 11 bull Highway Research Board Bulletin 173 Washington D C pp 20-37
Girault P (1964) 11 A New Type of Pile Foundashytion11 Proc Conference of Deep Foundation Mexico City dee 1964 16 pp
Golder H Q and Spence RA (1960) 11 Engineershying Properties of the Marine Clay at Port Man B C 11 bull Proc 14th Canadian Soil Mechanics Conshyference 1960 p 133
Johannes_sen IJ and Bjerrum L (1965) 11 Measurement of the Compression of a Steel Pile to Rock due to Settlement of the Surrounding Clay 11
bull
Proc Sixth International Conference on Soil Mechanics and Foundation Engineering 48 pp 261-264
Kapp M S (1965) Letter to the author dated Nov 1st 1965
Locher H G (1965 ncombined Cast-In-Place and Precast Piles for the Reduction of Negative Skin Friction Caused by Embankment Fill 11
Proc Sixth Int Conpound on Soil Mech a Found Eng 414 pp 290-294
McKay GA (1938) 11 Discussion on Soil Reactions 11 bull Trans ASCE Val 103 p 1220
Meyerhof G G (1959) 11 Compaction of Sand and Bearing Capacity of Piles 11 bull Proc ASCE Val 85 SM No 6 pp 1-30
Milner R P 1957) Discussion on Session 6 Proc Fourth International Conference on Soil Mechanics and Foundation Engineering London Part 3 pp 201-202
Moore WW (1949) 11 Experiences with Preshydetermining Pile Lengths 11 Trans ASCE Val 114bull
pp 366- 367
Poulos H G and Mattes N E (1968) 11 The anashylysis of downdrag in end- bearing piles due to negashytive friction 11 bull Univ of Sydney Australia Research Report No 91 p 16
Severinsson S (1965) 11 Praktiska erfarenheter av rationell stodpllning med prefabricerade beshytongpillar11 Tidning for Byggnadskonst Arg 57 nr 12 p 565
Restlndiz D (1964 a) 11 Estudio de campo sabre pilotes de concreto reforzado 11 Rev Ingenieriabull
Val 34 No 1 pp 101-110
Resendiz D (1964 b) On a Type Point-bearing Pile through Sinking Subsoi1 11 bull Proc Conference on Deep Foundations Mexico City dee 1964
Terzaghi K and Peck R B (1948) 11 Soi1 Mechashynics in Engineering Practice 11
New York 1948 pp 473-474
Tomlinson MJ (1963) 11 Foundation Design and CorlStruction 11 Pitman amp Sons Ltd London ppbull
308 376 and 394
Tschebotarioff G (1949) 11 Discussion middoton Effects on Driving Piles in Soft Clay 11 Proc ASCE Valbull
75 pp 671-676
Tschebotarioff G 1958) 11 Discussion of Measureshyment of Forces Produced in Piles by Settlement of adjacent Soi1 11
bull HRB Bull 173 pp 37-43
Weele A (1964) 11 Negative Skin Friction on Pile Foundation in Holland 1 bull Proc Symposium on Bearing Capacity of Piles Roorkee India febr 1964 10 pp
Yokowo Y Yamagata K and Nagaoka H (1968) non negative skin friction acting on a pile-group11
bull
Trans of the Architectural Institute of Japan No 150 August 1968 pp 51-57
Vesic A S (1964) 11 Investigations of bearing capacity of piles in sand Proc North Am Conpound on Deep Foundations Mexico City
Zeevaert L (1949) 11 Discussion on Effects of Driving Piles in Soft Clay 11
bull Proc ASCE pp 661-668
Zeevaert L (1957 a) 11 Compensated Friction-pile Foundation to Reduce Settlement of Buildings on the Highly Compressible Volcanic Clay of Mexico City11
bull
Proc Fourth International Conference on Soil Mechanics and Foundation Engineering London Val II pp 81-86
Zeevaert L 1957 b) 11 Foundation Design and Behaviour of Tower Latino Americana in Mexico City ceotechnique Val VII Sept 1957 pp 115-133
Zeevaert L 1959) 11 Reduction of Point-bearing Capacity of Piles Because of Negative Friction Proc First Panamerican Conference on Soil Mechanics and Foundation Engineering Sept 1959 Val III pp 1145-1152
Zeevaert L (1963) 11 Foundation Problems Related to Ground Surface Subsidence in Mexido City11 Fieldbull
Testing of Soils ASTM Special Technical Publ No 322 pp 57-66
----------------
----------------
8
7 Symbols
General
volume
weight
safety factor
Stress and strain
p effective vertical soil pressure
original effective vertical soil pressure
decreased effective vershytical soil pressure
consolidating pressure callsed by overburden
5 shear force
T shear strength
shear strength after conshysolidation
T = 0 30 middot (p-s s
Soil classification
w water content in of dry weight
Y unit weight
1 effective unit weight
Y unit weight of solid particles5
Yd dry unit weight
p angle of internal friction
Dimensions
B width
L length
H depth thickness of soil layer
z depth coordinate A certain value of z writes h
Pile symbols
D pile diameter (side)
u pile perimeter
a pile area
Z depth to the neutral point
axial force in pile
structure load
failure load
drag force
F~ drag force in or from fill
F drag force caused by soil settling around a pile
C perimeter of the polyhedron surrounding a pile group
A area of the polyhedron surrounding a pile group or the fill area affecting the pile
n number of piles in a pile group
n number of piles in a pile group per unit area
the ratio between the vertical and the horizontal soil pressure
m = n U bull K tanip0
acc to eq 3 2 6
NUCLEAR RADATION IN CONSTRUCTION CONTROL OF EARTH AND ROCKFLL DAMS RADATONS NUCLEARES DANS LE CONTROLE
DE LA CONSTRUCTION DES BARRAGES
l BERNELL CE and KASCHERMANCE Swedish State Power Board Stockholm Sweden
SYNOPSIS
During the later years the nuclear radiation technique has been widely used in soil investigation in order to deshy
termine certain characteristic properties of soils Principally the development in this field has been concenshy
trated on methods for determining the moisture content in soils and the density conditions in situ and in comshy
pacted embankments whereas very little attention has been devoted to the possibility to apply the new techshy
nique to other fields of soil- and rock mechanics (Bernell and Lindbo 1 1965) In connection with the design and
construction of several earth and rockfill dams the Swedish State Power Board has developed the nuclear radiashy
tion technique for solving many problems in the construction control The experiences thus obtained have reshy
sulted in reliable and simple methods for determining settlem~nts in earth and rockfill embankments and for
controlling the effect of grouting 10 soil and rock These applications of the nuclear method are briefly deshy
scribed in the following
USE OF NUCLEAR METHODS FOR MEASURING
SETT FMENTS
For determining the vertical movements in compacshy
ted earth and rockiills the telescoping pipe device
ith the horLrnntal crossarms is often used This
measuring method has also been applied to Sv edish
dams but experience has shown that it has many
disadvantages (Bernell 1964) In ~mbankments
which have been filled according to the wet-compacshy
tion method the horiLontal movements often become
so large that the pipes break off Another drav -back
is that the pipes and the crossarms must be installed
during the construction periods ltnd thus frequently
cause trouble during the filling operations
In most of the dams constructed by the State Power
Board as rell as by other poer companies in Sweshy
den during the later years the nuclear method was
chosen for determining the simultaneous settlements
at different elevations in the fills (Bernell 1967) 60According to this method a radioactive isotope Co
is placed in the measuring point and the radiation
from the isotope is determined by means of a Geiger-
Milller detector Generally the measurements are
carried out in a steel pipe protected from the surshy
rounding soil by an elastic pipe casing The location
of the isotope is indicated by a peak value in the rashy
diation intensity and thus the elevation of the meashy
suring point can be determined
xperience has shown that the nuclear method can
asily be applied to settlement measurements in
both soil and rockfill embankments Generally the
isotopes are placed in the fill close to the pipe and at
different elevations Fig l shows a typical diagram
from settlement measurements in an earth and rockshy
fill dam In this case the measuring section included
both the core and the rockfill zones Long term meashy
surements in this and many other dams have proved
that the method is very simple and reliable The
accuracy in the results is also very good about 1 cm
at a depth of 100 metres
285
BERNELL and SHERMAN
Upstream rockfill Moraine core Pipe I Pipe II
+215 - - II I I
1-- ~Measuring pipe 1 ~
11 5
I I f
-I I I I
I --210
Height of fill
I
I -Reservoir level
110 I I
I I I
205 -Isotope I
I I I I
105 I I I I
I r I I I
E 200 C
I I I I
I I -
100 I I I I
C 0-
r-- J
I r bull J 0 gt bull
w 195 ~
Igtlt--I I
I I
195
I I
I -- ~
I
I I I
190
185
-
I I
J
I I I I I
---- 190
185
Ilt
I I I -I
I I
I -I I -I -~ -
I I
I
I
i I
----7
-- ---
I I I -~ _J I
I L - -1
180 1965 1966 1967 1968
1N I 1965 1966 1967 1968
II 220E
C Upstream
200rC
~
1aoL bull 0 gt
w 160L e
Fig 1 Settlements in an earth and rockfill dam determined
by means of nuclear measurements
286
NUCLEAR RADIATION IN CONSTRUCTION CONTROL
Since themiddot installation and the maintenance of the
pipes often cause difficulties with regard to the filling
works a modified method for performing the meashy
surer9-ents has successfully been applied The meshy
thod is based on the fact that the range for the radiashy
tion in a soil is relatively large also for very small
quantities of the isotope In a recently completed 60
dam small quantities of Co were placed directly
on the compacted surface within an area of 2 x Z
metres and with a spacing of o 25 metres After
completion of the filling works measuring holes
were drilled down to the surface with the isotopes
Although the holes had to be drilled to a depth of
about 30 metres the measurements could be
successfully executed
The nuclear method is also of great value for detershy
mining additional settlements in natural soil strata
beneath supporting foundations
In this case the isotope is placed in a mechanical
shot-device which is inserted in the pipe after
drilling of the hole By means of the shot-device the
isOtope can be placed in the soil at any desired depth
This method can be applied to many cases in foundashy
tion engineering1 where it may be of special interest
to obtain reliable data concerning the compressibishy
lity and the settlement conditions in the underground
middotrn construction control it is often desirable to arshy
range the measurements in such a way that both the
vertical and the horizontal movements can be detershy
mined by using the same installations For measurshy
ing horizontal movements the strain gauge inclinoshy
meter is generally used (Kallstenius and Bergau
1961) By choosing the diameter of the pipe so that
the pendelum can be inserted in it the same pipe
can be used for both vertical a1d horizontal meashy
surements This combination of measurements has
successfully been applied to the control of the stashy
bility oi slopes
USE OF NUCLEAR RADIATION IN GROUTING
CONTROL
Most of the dams constructed in Sweden during the
later years are situated within the mountain region
in the northern part of Sweden The soils in this
area commonly consist of moraine deposits from the
last ice age Because of geological processes the
composition of these deposits is very irregular and
generally they contain both impervious moraines
and lenses of pervious sediments Therefore conshy
struction of dams in this region often involves diffishy
cult foundation problems especially in cases where
the dam has to be founded on partly permeable deposhy
sits
Because of the erratic soil conditions1 foundation
grouting in the dam site is almost always need-ed in
order to reduce the underseepage after the rise of
the reservoir level But very often it may be a mashy
jor problem during the construction stage to decide
the extension of the gIouting works Sometimes the
need for grouting becomes apparent only ater the
reservoir has been filled and in such cases the founshy
dation must be grouted through the dam embankment
This method has certain advantages but evidently
the grouting operation must be carefully controlled
because of the risk of cracking and eroding the soil
in the foundation Ir order to eliminate this risk the
State Power Board has applied the nuclear radiation
method to the control of grouting operations The
method is based on investigations of the radiation
in soils compacted to various porosities
At a recently completed dam founded on natural
moraine deposits leakage occurred under the founshy
dation after the rise of the reservoir level The seashy
ling measures included the performance of a grout
curtain extending through the existing pervious soil
layers beneath the foundation and down into the undershy
lying faulty rock The thickness of the permeable
layers was about 5-6 metres and in order to reach
these layers the bore holes had to be drilled from
the crest and through the dam core to a depth of
about 20 metres It was also conside1middoted necessary
to protect the bottom layers from possible erosion
caused by leakage water flowing through cracks in
the rock For this purpose the grout curtain had to
be extended to a depth of 10 metres below the rock
surface after completion of the soil grouting
After drilling the grout holes the nuclear density
probe was used for determining the initial porosity
of the soil strata overlying the rock From these
287
BERNELL and SHERMAN
15-----------------~---~--------------
-------- ====o~
en shy+shya
E 20-+-----~----=-----+---------+-------t c v Ground water level
c ~ Q a
0
Rock
CD Radiation curve before grouting __ -middotmiddot- after 1st grouting __ __ _ __ _ 2nd
25---------------_______________ so 1QQ 1so 200
Radioti on in countssec
middotFig 2 Radiation curves measured in foundation
soils under a dam
288
NUCLEAR RADIATION IN CONSTRUCTION CONTROL investigations it was found that the soils located
immediately above the rock surface were pervious
and contained cavities whereas the overlying soils
in the contact zone against the dam foundation conshy
sisted of impervious moraines As a result of this
investigation it was decided to grout the holes in
stages from the rock surface up to the bottom of
the dam
After completion of the soil grouting secondary
holes were drilled through the foundation to a depth
of 5 metres in the rock Before the rock grouting
was begun these holes were measured with the nushy
clear density probe for controlling the effect of the
soil grouting From the measurements combined
with the results of the conventional water pressure
testing valuable informations were obtained conshy
cerning the effect of grouting and also on many
other factors which influence the grouting procedure
in soils
Fig 2 shows a typical radiation diagram for a bore
holeJ drilled for grouting the foundation soils beshy
neath the dam I~ this case both the bottom layers
and therock were so pervious that the first grouting
did not stop the flow of ground water into the bore
hole Therefore additional grouting was needed for
sealing the pervious zones
The same method was used for controlling the rock
grouting and also in this case interesting results
were obtained concerning the grouting procedure
Therefore it is believed that the nuclear method
will be as valuable in the grouting technic as it is
in many other fields of soil and rock mechanics
REFERENCES
1) BERNELLJ L and LINDBO T Test of air
leakage in Rock for Underground Reactor Conshy
tainment Nuclear Safety 1965 V0l 6 No 3
2 BERNELL L Measurements in the Messaure
Dam a Rockfill Structure with Wet-Compacted
Core Eighth Congress on Large Dams Edinshy
burgh 19~4 Vol II Page 317
3) BERNELL L Construction of Rockfill Dams unshy
der Winter Conditions Ninth Congress on Large
Dams Istanbul 1967 Vol IV Page 161
4) KALLSTENIUS T and BERGAU W In Situ Deshy
termination of Horizontal Ground Movements
Proc Fifth Intern Conpound on Soil Mechanics and
Foundation Engineering Paris 1961 Vol 1
Page 481
289
MAIN SESSION 5 SEANCE PLENIERE 5
STABILITY OF NATURAL SLOPES AND EMBANKMENT FOUNDATIONS STABIUTE DES TALUS NATURELS ET DES FONDATIONS DE REMBLAIS
ChairmanPr4ident D H TROLLOPE (Australia GenClal Reporter Rapporteur G6n~el A W SKEMPTON (ElIQ1ahd1 Auociata RoportuRapportcur Adjoint J HUTCHINSON (England)
Members of the PanclMembros du Groupe do Discuuion L 8JERRUM (Norway
H BOROWICKA (Aut1ralia) B BROMS ISwodenl
R C HIRSCHFELD (U S A) C KENNEY (Canadol
Panelist B BROMS
lntroduction
Several large landslides have occurred during the last 20 1ears in the densely populated GtHa River Valley located in the southwestern part of Sweden (Fig 1) Among these the landsUdes at Surte (Jakobson 1952) and at Gtita (Odenstad 1958) can be mentioned In the G6ta River Valley flows the Gtita River which is one of the largest rivers in Sweden The G6ta River is also an important waterway Approximately 4 milj tons oi freight is annually transported on the river In the river valley are located several hydroshyelectric plants The river servea ilao aa water supply for Gothenburg the main seaport of S y-den with approximately 500000 people Two main high~ ways follow the G6ta River Valley The highways are in many places located close to the river Also one railroad line ia located in the valley and baa in some cases been affected by landslides
385
SEANCE PLENIERE 5
Ps wh~re art5a11 prusur1 hobull bH11 oburvet
~) ArtaJ w1 quck clays
SeVert bullrcs011
~ rorEBORG
Fig 1 The Glaa River between Trollhattan and Gothenburg Gtsteborg)
Landslides in the Gtsta River Valley can have Vfry serious consequences A landslide canfor examplP disrupt the boat traffic in the river iriferfere with the operation ofthe hydroelectric plants and pollute the river water (Several large chemical plants are located at the river and oil storage tanks have been built close to the river Two oil tanks collapsed e g during the slide at G6ta)
Landslides in the G0ta River Valley
Scars after old landslides can be seen almost along the whole river especially in the northern part of the valley above Lilla Edet In Fig 2 is shown scars after landslides at Utby (Fig 1)
About 20 slides have here taken place within a distance of about 2 km Several slides have also occurred along the Slump River a tributary to the G6ta River
Scars after a large old landslide can also be seen at Jordfallet (in English 11 Earth fall) located about 2 km upstream of Surte (Fig 1) The scar has a length of about 300 m and reaches iliout 1000 m from the river
One of the largest recorded landslides occurred in 1648 at Intagan located approximately 4 km south-
River
Seo le 0 1000 m L-1-1-LJLJ
Scar otter londsl1de
Fig 2 Landslides at Utby
west of Troilhattan (Fig 1) About 54 acres were affected by the slide and at least 85 people lost their lives Another relatively large landslide which probably was triggered by an earth quake took place in 1759 at Bondestr5m when approximately 400000 m 3 slid into the Gtsta River
The landslide at Surte occurred in 1950 The direct cause of the slide is uncertain but the vibrations from the pile-driving for a small house have been dicussed as one possible factor as well as the vibrations from a train which passed the aren just before the slide The length of the slide area was about 600 m and the width about 400 m The total
3volume was 4 million m Within the slide area lived about 375 people in 31 houses One person lost his life during the slide A major highway and a railroad line which crossed the slide area were damaged The total damage caused by the slide was estimated in 1952 to $ 2 000 000
The landslide at Gtita occurred in 1957 Several large buildings belonging to a paper mill were located within the slide area which was about 1500 m long and 300 m wide Three workers were killed of the 200 which were within the slide area The total cost to restore the river channel after the slide was approximately $ 2 000 000
Geologic History
The Gtlta River Valley was formed by erosion during several glaciations along prequaternary fissured zones in the underlaying bed rock of gneiss The bottom of the valley which is filled with loose sediments is located up to 100 m below the present sea level The maximum thickness of the sediments is about 100 m (at Gothenburg) The thickness of the sediments in general increases downstream The area was covered during the last glaciation by ice with a total thickness of 2 000 to 3 000 m During the last glaciation the valley floor was partly covered by a thin layer of heavily preconsolidated moraine (till) with a total thickness less than 1 to 2 m The moraines are generally covered by glacifluvial and marine sediments The average grain size of the sediments decreases generally towards the ground surface and downstream the river The glacifluvial sediments (sand silt and clay) and the moraines have in many places been reworked by waves
386
MAIN SESSION 5 ~----~--~h--u---rn-----h---~s----~w-------0
Soil m ) stre19th tf tvty conlbulln1 frac14
Btuegroy to groy clay wrootholes
Dork gray
mottltd
clay (stght- 1 ly bonded l
2~ I
Gray cloy
Dork groy mottled cloy
legend -
-
6 O 0 80
28
30
115
deg 27
165
Swldish 192 tall-cone tlsl 205
135
332
3D
190
130
122
Swedish lollmiddot cone tnt I--- Plostc lmt
Field vone tut --1 Lqud tmt
Wotor ccntent
Fig 3 Soil conditions at Utby
The location of the shore line has changed considerashybly since the last glaciation due to changes of the sea level and the general land uplift At the end of the glaciation the sea level at Gothenburg was located 95 m above the present sea level and 128 mat Lake Vanern The present rate of land uplift is 2 mm year downstream at Gothenburg and 2 5 to 3 mm year upstream at the Lake Vanern The gradient of the G6ta River is thus increasing by about 1 mm year A typical soil profile of the clay layer at Utby (Fig 1) is shown in Fig 3 (The clay is underlaid by sand with a thickness of more than 10 m)
Th~ lower parts of the marine clay sediments which generally are stratified are of glacial age The clay middotcontent varies generally between 50 and 60 Organic content of the glacial clay is low Varved silt can frequently be found close to the bottom layer of sand
The upper parts of the marine sediments consist of late- or postglacial clays The particle size is smaller than that of the underlaying glacial clay The clay content varies generally between 60 and 70 The dominating clay mineral is illite The organic content (11 gyttja and organic sulphides) is relatively low but increases downstream the river The glacial as well as the late- and the postglacia1 clays are located just above Casagrandes 11A 1-Jine
The post-gl~cial clays have a stiff upper crust with a total thickness of 1 to 1 5 m The thickness i~creases upstream the river The dry crust is d1sected by vertical desiccation cracks with a thickshyness varying between 1 and 6 mm
Alluvial sediments can frequently be found close to the river The silt and organic contents of these sediments are generally high Their maximum
thickness is about 7 m
High artesian pressures have been measured in many places in the sand and silt layers as shown in Fig 1 The water pressures are related to the amount of rain fall in the area Seasonal variations of the ground water table of 1 to 2 m are not unusual (Pore overpressures of 7 m with respect to the present ground surface has been observed) The pore overpressures are generally highest in the bottom layers and decrease towards the ground surface
The glacial and post-glacial clays are generally normally consolidated except for the stiff dry crust at the ground surface The shear strength increases generally linearly with depth Just below the dry crust the shear strength varies between O 5 and 1 O metric tonsm2 in the downstream fart of the valley and between 3 and 4 metric tonsm in the upstream part of the valley
The following relationship has been found for Swedish clays between undrained shear strength Cu liquid limit wL or fineness number wF (Karlsson 1961) and effective overburden pressure a~ (Hansbo 1957)
cu = 045 wLov
Thus the shear strength increases as a rule linearly with increasing liquid limit (or fineness number) and with increasing effective overburden pressure The shear strength of the normally consolidated clays in the Gota River Valley is in some places higher than that predicted by the relationship proposed by Skempton (1954) or by Hansbo 1957 when the sensitivity of the clay is high (Karlsson amp Viberg 1967)
The angle of internal friction as determined by _drained direct shear tests is approximately 22 a 23deg A higher angle of internal friction is generally obtained with drained triaxial tests than with drained direct shear tests (Osterman 1960 Brink 967) The true angle of internal friction (Gibson 1953) varies generally between 18deg and zoo (Karlsson amp Pusch 1967)
The sensitivity of the clay in the GOta River Valley is frequently high The sensitivity of the Swedish clays is normally about 10 to 20 but the sensitivity ratios as high as 500- 700 has been measured by the fall-cone test (Karlsson 1963) north of Utby Often a relatively large amount of work is required to remould the clays from the GOta River Valley Clays from the GOta River Valley are therefore not as sensitive to vibrations or other mechanical disturbances as clays which can be remoulded easily
S6derblom (1969) has suggested to distinguish between rapid quick middotclays and slow quick clays (a clay is classified as rapid quick when a relatively small amount of work is required to remould the clay while the term slow quick is used when the amount of work is relatively large) Clays with a sensitivity ratio larger than 50 are in Sweden defined as quick clays if the fall-cone test is used to detershymine the undisturbed and the remoulded shear strength of the soil
The high sensitivity of the clays in the GOta River Valley can partly be explained by a reduction of the
387
------- ----
SEANCE PLENIEAE 5 salt content due to leaching and diffusion However infiltration of organic substances (e g humus) hav~ probably also cortributed to the high sensitivity of
the clays The salt content of quick clays is always low but the salt content Of clays with low sensitivity ~ay ~~ry between wide limits Sl5derblom ( 1969) has 1denhfaed a large number of organic substances in pore water with dispersing properties
I- ~ig 4 is shown the relationship betweeio conducshytivity (vt) and the sensitivity (S ) of a clay from a bore hole located close to Utby Fig 1)
- lmmodolbullI) alrr tArr01 --- Ac towotaon lo lobdol)
Srsmly Hyfi m 2()Q JOO co
_ lt
middot ----- I ( -
vr--
) s t OoNn
Fig 4 Relationship between conductivity and sensitivity
The conductivity which is directly proportional to the salt content was determined with a salt sounding tool (Saderblom 1957) The shear strength of the undisturbed and of the remoulded soil was determined by the Swedish fall-cone test in the field immediately after the sampling and in the laboratoshyry approximately two weeks after the sampling It can be seen that no relationship exists in this case between conductivity (salt content) and sensitivity when the salt content is low In fact the highest sensitivities were found at the levels where the salt content was the highest
The sensitivity is however affected by the time after sampling The sensitivity determined two weeks after the sampling was approximately half the sensitivity immediately after the sampling The reduction of the sensitivity was caused mainly by a reduction of the undisturbed shear strength of the clay
In Fig 5 is shown a microphotograph of a quick clay ~ram Lilla Ed~t The shear strength of the clay 1s about 2 tm and the sensitivity about 150 The thickness of the section is 500 A Investigashytions have shown that the microstructure of quick clays is characterized by an extremely open three dimensional network of particles and particleshygroups (Karlsson amp Pusch 1967)
Soil Exploration
The stability conditions in the G5ta River Valley has
0 SA Sealbull
Fig 5 Microphotograph of a quick clay from Lilla Edet (R Pusch)
been investigated extensively The sounding machine type SGI (Fig 6) and the Swedish weight sounding device have been used to determine the thickness of the individual soil layers and the depth to the firm bottom layers
Fig 6 Sounding machine type SGI
The sounding machine type SGI (Kallstenius 1961) records automatically the penetration resistance of a 10 cm2 cone as a function of depth as the cone ismiddot pushed down into the soil The skin friction resisshytance is automatically subtracted from the total resistance and only the point resistance is recorded by the machine This type of penetrometer is much more rapid than for instance the weight sounding test and can be used to detect e g sand and silt seams as shown in Fig 7
The undisturbed shear strength of the clay has been determined in situ with the so-called iskymeter (Kallstenius 1961) and with vane tests and in the laboratory by the Swedish fall-cone (Hanabo 1957) or by unconfined compression tests The iakymeter records the pull-out resistance of a foldable anchor plate which is pulled out of the ground by a wire The anchor plate is driven into the soil folded and unfolds when the plate is pulled With the iskymeter sand or silt seams can be detected as shown in Fig 8
388
MAIN SESSION 5
Storie
M3 Noom stopped
Fig 7 Penetrometer record
I SurfaiesiJ
C-ycrus I
-
----==--Coy orid s11 1
-middot--- ---i
Ckiy I melrl
1000 kg = Fig 8 Iskymeter record
The shear strength determined by the iskymeter agrees relatively close with the results from vane teats in clays with normal sensitivity (Osterman 1960) A good agreement has also been found beshytween fall-cone and field vane tests except when the sensitivity of the soil is high
The vane type SGI is provided with shield or with a shroud which protects the vane blades during drishyving The shield also prevents clay from adhering to
the blades when the vane is driven through the stiff dry crust The test results indicate that clay which adhere-a to the vane blades can appreciably lower the measured shear strength especially when the sensishytivity of the clay is relatively high
Soil samples have been taken with sampler SGI type IV (Kallstenius 1958) and by the Swedish standard piston sampler (Swedish Committee on Piston Sampling 1961) The area ratio of the Swedish standard piston sampler is low Samples have been taken every or every second meter in depth
The Swedish foil sampler has been used in a few cases to check the layer sequence and to locate slip ~urface in slides In Fig 9 is shown two cores from the slide at GOta The location of the slip surfaces can clearly be seen on the photograph
Fig 9 Location of slip surfaces in cores
Pore pressures have been measured hydraulically by pore pressure gauges of type SGI (Kallstenius amp Wallgren 1956) The coupling device of the gauge makes it possible to check the functioning and the accuracy of the gauges cturing long time mtasureshyments These gauges are therefore especially suited for control of pore pressures The gauges along the GOta River are as a rule read every second month
Lateral displacements (creep) have been measured with an inclinometer of type SGI (Kallstenius amp Bergau 1961) at locations where the slope stability has been especially low With this device it is often possible to measure lateral displacements with an accuracy of about 1 to 2 mm for a length of 10 m
The salt content of the clays has been determined at a large number of places by measuring in situ the electrical resistance of the soil with a salt sounding tool as mentioned above (Soderblom 1957 1958)
389
SEANCE PLENIEAE 5 Tlie electrical resistance is measured between two isolated steel rings which are placed at the tip of a sounding rod The tool is driven into the ground with standard equipment The salt contentwhich generally is low close to the ground surface increases with depth and reaches often a maximum value at the middle of the profile The salt content at the bottom layers is generally low due to leaching It has been possible in many cases to locate slip surfaces with this device In Fig 10 is shown the record from a salt sounding at Glita which was carried out 14 days after the slide (S6derblom 1969)
$1p ~rtraquon lthKJltod 1~ ffl mpi
Jsl---1--+----lt
~1----gt-+-------j
Fig 10 Location of slip surface with the salt sounding tool
A sudden jump in the resistivity curve shows the location of the slip surface The actual location was later checked with cores obtained with the Swedish foil sampler
Attempts have also been made to locate slip surshyfaces in quick clays with field vane tests This method has not been successful since the thickness of the disturbed zone where the shear strength in the soil is reduced by remoulding has been small (less than a few centimeters)
Slide Mechanisms
The large slides in the G5ta River Valley are generally retrogressive rotational or retrogressive translational They have as a rule been triggered by a relatively small initial local slide A number of parallel ridges can often be Seen within the area after a slide The landslide at Glita started as a small local slip close to the river In the morning of the slide a crack which was 130 m long was observed approximately 20 to 30 m from the river The crack widened slowly and the final slip occurred 3 hours after the crack first was detected The slide spread upstream the river and in the direction from the river (Odenstad 1958) The slide at Surte initiated however at some distance from the river and the slide then spread gradually towards the river and backwards to the side of the
valley The duration of the slide was at Surte about 3 minutes and the maximum speed of the slide was less than o 9 msec
A number of local slide can be seen in Fig 11
Fig 11 Local slides along the Glita River
The small initial slide is generally caused by erosion of the river bank and by changes of the ground water level by vibrations from traffic pile driving or by earth quakes The small local slides are mainly confined to the part of the river located above L6d6se (Fig 1) where the height of the river banks exceeds several meters
The erosion processes have accelerated during the last 50 years partly by the construction of dams and hydroelectric plants along the river and partly by the heavy ship traffic on the river The erosion of the river banks seems to increase rapidly with the size and speed of the ships Some bottom erosion has taken place downstream of Lilla Edet at the places where the river bottom consists of cohesionless soils Of course a certain erosion has also been caused by the general land uplift (2 mmyear at Gothenburg) This erosion is relashytively small since the land uplift is small Over a very long time period this bottom erosion can however be appreciable and contribute to the general lowering of the stability of the slopes
Method of Analysis
It is not possible to predict accurately with presentshyly available methods if a small local slide will develop into av large catastrophical slide The stability of a number of small local slides have been analysed by the total stress method(~= 0-analysis) and by the effective stress method (c ff -analysis) (Bishop 1955) The total stress anSlysis which is based on results from field vane tests gave nominal safety factors which are close to one with respect to available and mobilized shear strength of the soil (G6taHvkommittCn 1962) Safety factors of the same magnitude were obtained from an effective stress analysis if the results from drained direct shear tests and triaxial tests are used in the analysis The cohesion c determined by drained direct shear test has not been reduced in the calculation Both circular and other shapes of the failure surfaces have been investigated
390
MAIN SESSION 5
Also sections where slides have not occurred have been analysed by the total and the effective stress methods The results from these calculations are shown in Table 1
Table 1 Safety factors calculated by total and effective stress analysis
Location Total stress Effective stress analysis analysis
Intagan - Torp
2345 1 18 1 30 23 72 1 02 1 03 23 82 107 103 2688 - 2752 - 1 1 - 1 1
StrBms Lock
3701 1 0 I 0 37 11 1 1 10 3733 1 0 10
Lilla Edet
34 5 - 35 8 14-15 I 3 1 5
Agnesberg - neberg - 1 5 1 3 1 5
Also in this case a good agreement was obtained between the two methods
The stability of the normally consolidated clay in the GOta River Valley is generally evaluated by the total stress method (~ = 0-analysis) mainly due to the simplicity of this method A total stress analysis reflects the stability of a slope with respect to sudden changes of the applied load and to gradual changes of the undrained shear strength of the soil by e g leaching It is believed that a total stress analysis to a certain extent can be used to investishygate if a small slide will cause a large secondary slide (The initial slide causes a sudden change of the stress conditions in the remaining soil without a change of the water content) Erosion of the river banks often occurs rapidly due to large variations of the water level and the heavy boat traffic in the GBta River The change of the stress conditions by the erosion will generally cause an increase of the pore pressures in the slope due to the high senstivi~ ty of the clay and the high value of the pore pressure coefficient A Dissipation of excess pore pressures and changes of the water content of the clay take place verg slowly due to the low permeability of the clay (10- to 10-10 cmsec) It is believed that changes of the stability conditions by such rapid changes of the stress conditions is better reflected by a total stress analysis than by an effective stress analysis In this case a total stress analysis will give a lower safety factor than an effective stress analysis The limitation of a total stress analysis is however the evaluation of the average undrained shear strength of the soil It ia known that anisotroshypy and the direction of the stress increase (Bjershyrum amp Kenney 1967) and thus the test method will affect the measured shear strengths
The undrained shear strength determined by the field vane or by the Swedish fall-cone test are used in the calculations as mentioned above The shear strength determined by vane tests agrees as a rule closely with the cone values because the cone test has been calibrated against the vane teat If the
sensitivity of the soil is high and the sampling depth is large the vane shear strength is however frequently higher than the cone strength because of the disturbance of the soil samples
The actual shear strength is probably higher than the vane or cone values For normally consolidated clays the shear strength along horizontal planes is often higher than along vertical planes This differshyence in shear strength is probably compensated by the strength decrease caused by time
The shear strength used in the calculations is reduced when the liquid limit or fineness number of the clay is larger than 80 or the soil is organic A reduction coefficient of O 9 is often used for slightly
organic clays O 8 for organic clays and silts O 7 for clayey or silty 11 gyttja and 0 6 for peat and 11gyttja 11
( 11 Gyttja 11 is an organic soil of post-
glacial or recent age) Analysis of old slides which have occurred in organic soils with a high liquid limit has indicated that a reduction is required
In Sweden normally a safety factor of at least 1 4 to 1 5 is required with respect to the undrained reduced shearing strength of the soil in areas where the stability conditions can be changed by the construction of e g buildings and roads close to the river or by erosion In areas in the GCgtta River Valley where the stability conditions are supposed not to change in the future and where structures are not located close to the river a nominal spfety factor of 1 3 is generally considered satisfactory In some cases a safety factor as low as 1 2 has been allowed I safety factors of 1 3 to 1 2 are found it is important to protect the slopes from erosion and to prevent buildings to be constructed near the river or to deepen the river channel by e g dredging Where the factor is lower than the above mentioned the actual stability has been increased by about ten per cent through unloading of the river bank by excavation
An effective stress analysis (cff-analysis) is espeshycially valuable to check the stability conditions in the Gata River Valley when gradual changes of the loading conditions or of the pore pressures are expected It is often difficult to predict the magnishytude of these changes Furthermore there are some difficulties in the evaluation of the coefficients ~- and c which are used in an effective stress analysis These coefficients are affected by volume changes during the drained triaxial and the direct shear testsby rotation of the principal stress directions and to a minor extent by the intermediate principal stress There are also some questions about the value of the parameter c to be used in the analysis The parameter c is not reduced at present since a reduction leads to unreasonable results (If a reduced value is used in the calculations then large parts of the Gata River Valley are not stable according to the calculations)
Slope Protection
The slopes along large parts of the GCgtta River do not satisfy the safety requirements mentioned above Therefore extensively remedial works have been or are being carried out along the river By protecting the alopea from local slides it is believed that the
391
SEANCE PLEN1EAE 5
o Excovotion ot top of
slope
Excavation
d Driving of piles
piles
b Flattening of slope
e lowering of ground water level
c Fill ot toe of slope
-
Fig
f Erosion
12 Stabilizatior of slopes
protection
slopes will also be safe against large landslides
The remedial works can be separated into three major groups To the first group belong all methods which tend to decrease the nominal average shear stress along potential slip or failure surfaces The average shear stress can be decreased e g by excavating the soil at top of a slope by flattening the slope by placement of a fill at the toe of a slope or by raising the water level in the river as illusshytrated in Fig 12 a through c To this group belongs also strengthening of the slope with piles (Fig 12 d)
The second group includes methods which tend to increase the shear strength of the soil along potential slip surfaces The shear strength of the soil can be increased e g by lowering the pore pressures by drainage or by pumping (Fig 12 e To the third group belong methods which prevent a decrease of the slope stability by e g erosion Erosion can be prevented by a reversed filter at the toe of the slope as illustrated in Fig 12 f
The method chosen at a particular location is dependent of the local conditions such as the height and the slope of the river banks the presence of permeable layers in the soil the average shear strength of the soil and of the erosion
It is generally much more effective to remove part
of the soil at the top of the slope as shown in Fig 13 than to flatten the slope or to place a fill at the toe of the slope
A fill at the toe of the slope is often partly located below the water level where only the boyant weight of the fill is effe_ctive
13 Increase of slope stability by excavation at top of slope
392
MA1N
Fig 14 Slide caused by the driving of pile~
Piles are seldom used to increase the slope stability except when the space at the top of the slope is restricted by an adjacent road or by buildings However the driving of piles may temporarily decrease the slope stability by the remoulding of the soil or by the lateral displacement of the slope towards the river A slide caused by pile driving is shown in Fig 14 In this case the lateral displaceshyments and the resulting shear deformations of the soil were sufficiently large so that the peak strength of the soil was exceeded Broms amp Bennershymark 1968)
If the sensitivity of the soil is high the reduction of the shear strength at large lateral displacements can be large However due to the relatively high clay content of the clay in the G5ta River Valley the reduction of the shearing strength is generally moderate Experience has showlil that the lateral displacement and the strength reduction is decreased if the row of piles located close to the river are driven first
The ground water pressure can generally only be middotlowered where silt or sand layers are present in the soil In areas with artesian pressures the ground water pressure can be lowered with bleeder wells In all other cases the ground water pressure can only be lowered by pumping However a lowering of the ground water pressure causes settlements and may cause wells in the area to go dry
The erosion protection is often combined with a flattening of the slopes to prevent local failures as mentioned previously An erosion protection consists generally of a 2 m thick layer of rock fill which is placed by dumping (Fig 15)
SESSION 5 The fill is not compacted The maximum particle size is at least 15 cm Only the sections where the erosion at present is very active is protected However a change of the local conditions (e g a change of the maximum water flow or of the ship traffic) may change the areas affected by erosion
Slide warning systems have been installed by the Swedish State Railways (s J ) The warning system consists of a thin electric wire with a tensile strength less than 110 lb which is placed in the ground in a zig- zag pattern as illustrated in Fig 16 at a depth of 1 0 m The train traffic is stopped automatically when the cable oreaks
r 30m f JOm 30m I 30m 30m 1 30m j 30m
Eloctrnol conlocl
Eleetr~ coble (ma~imum hniale slre11glh of 10 lb)
Post wh1et1 1gtrou11ts -----gt-u d1s1gtlacombulllll cf
lht cohto Whf-11 slrbullkhod
Fig 16 Slide warning system type Swedish State Railways
Twice each year the G5ta River Valley is inspected by personal from the Swedish Geotechnical Institute The erosion of the river banks is followed with aerial photographs The erosion of the river bottom is checked by soundings Also the construction of new buildings storage tanks the placement of fills etc cloa-e to the river is controlled by the Institute
REFERENCES
Bishop A W 1955 11 The Use of Slip Circles in the Stability Analysis of Slopes Geoshytechnique Vol 5 No 1 pp 7-17
Bjerrum L amp Kenney T C 1967 0 Effect of Structure on the Behaviour of Normally Consolidated Clay11 Proc Geotechn Conpound Oslo Vol 2 pp 19-27
Broms BB amp Bennermark H 1967 11 Shear Strength of Soft Clay 11 Discussion Proc Geotechn Conpound Oslo 1967 Vol 2 pp 118- 120
Gibson R E 1953 Experimental Determination of the True Cohesion and True Angle of Internal Friction in Clays Proc 3 Int Conpound Soil Mech a Found Engng Vol 1 pp 126- 130
GBtatilvkommittfn 1962 11 Rasriskerna i G5tatilvshydalen11 Statena Offentliga Utredningar 1962 48 Inrikesdepartementet Stockholm 160 pp
Hansbo S 1957 11A New Approach to the Determishynation of the Shear Strength of Clay by the Fall-Cone Test11
bull Proc Swedish Geotechn Institute No 14 Stockholm 47 ppFig 15 Erosion protection
393
SEANCE PLENIERE 5 Jakobson Bbull 19~2 The Landslide at Surte on the Ftirhandlingar Vol 80 No 1 Stockholm
GOta River 11 bull Proc Swedish Geotechn pp 87-96 Institute No 5 121 pp
Soderblom R 1969 Salt in Swedish Clays and Kallstenius T 1958 11 Mechanical Disturbances in ta Importance for Quick Clay Formation
Clay Samples Taken with Piston Satnplerz 11 Results from eome Field and Laboratorybull
Proc Swedish Geotechn Institute No 16 Studies 1 Proc Swedish Geotechn
75 pp Institute No 22 (in press)
Kallstenius T 1961 11 Development of Two Modern Osterman J 1960 Notes on the Shearing Continuous Sounding Methods 1 Proc 5 Int Resistance of Soft Clay Acta Polyshy1
Conf Soil Mech a Found Engng Vol technica Scandinavia Ci2 2631959 22 pp 1 pp 475-480
Swedish Committee on Piston Sampling 1961 11 Standard Piston Sampling Proc SwedishKallstenius T 1963 Studies on Clay Samples Geotechn Institute No 19 StockholmTaken with Standard Piston Sampler 11
bull Proc Swedish Geotechn Institute No 21 p 195 45 pp
Kallstenius T amp Bergau W 1961 11 In Situ Detershymination of Horizontal Ground Movements 11
Proc 5 lnt Conf Soil Mech a Found Engng Vol 1 pp 481-485
Kallstenius T amp Wallgren A 1956 11 Pore Water Pressure Measurement in Field Investigashytions11 Proc Swedish Geotechn Institute No 13 Stockholm 58 pp
Karlsson R 1961 Suggested Improvements in the Liquid Limit Test with Reference to Flow Properties of Remoulded Clays 11
Proc 5 Int Conpound Soil Mech a Found Engng Vol 1 pp 17 1- 184
Karlsson R 1963 11 0n Cohesive Soils and Their Flow Properties Swedish Geotechn lnatitute Reprints and Preliminary Reporta No 5 24 pp
Karlsson R amp Puoch R 1967 Shear Strength Parameters and Microstructure Characshyteriotico of a Quick Clay of Extremely High Water Content Geotechn Conf Oslo 1967 Vol 1 pp 35-42
Karlsson R amp Viberg L 1967 11 Ratio cp in Relation to Liquid Limit and Plasticity Index with Special Reference to Swedish Clays 11
Proc Geotechn Con Oslo 196( Vol 1 pp 43-47
Kjellman W Kallstenius T amp Wager 0 1950 11Soil Sampler with Metal Foila 11 Proc Swedish Geotechn Institute No 1 76 pp
Odenstad S 1958 11 Jordskredet i GOta den 7 juni 1957 11
Geologiska Ftireningens i Stockholm F6rhandlingar Vol 80 No 1 Stockholm pp 76-86
Skempton A W 1954 11 Discussion of the Structure of Inorganic Soil1 1
bull J Soil Mech a Found Div Proc ASCE Vol 80 Sep No 478 pp 19-22
S6derblom R 1957 11Some Investigationa Conshycerning Salt in Clay 11
Proc 4 Int Conf Soil Mech a Found Engng Vol 1 pp 111-115
S6derblom R 1958 11 Saltaonden och desa anvindshyning vid beatamning av skredbottnen vid GOta bull Geologiska FOreningens i Stockholm
394
VIBRATORY COMPACTION OF COHESIONLESS SOILS
by Bengt B Broms and Lars Forssblad
reprinted from
Proceedings of Specialty Session 2 Soil Dynamics
Seventh International Conference on Soil Mechanics and Foundation Engineering
Mexico City Mexico August 1969
VIBRATORY COMPACTION OF COHESIONLESS SOILS
Bengt B Broms and Lars Forssblad
Bengt B Broms is Director of the Swedish Geotechnical Institute
A graduate of Chalmers Institute of Techshynology in Gothenburg Sweden he received his MS and Ph D degrees from the University of Illinois
From 1959- 1964 he was Associate Professor at Cornell University and he now lectures at the Royal Institute of Technology
He has published widely on the properties and behavior of reinforced concrete members and concrete piles characteristics of soils and soil-structure interaction
He has served on the American Concrete Instishytute Committee on Concrete Piles and the ACI- ASCE Committee on Reinforced Concrete Columns He is presently a member of the Swedish Geotechnical Society committees on Laboratory Testing and on Soil Exploration Bengt B Broms
Lars Forssblad is Research Manager of AB Vibro- Verken in Solna Sweden
He received the degrees of Civil Engishyneer and Doctor of Technology from the Royal Institute of Technology in Stockholm
I~ Before joining AB Vibro-Verken he was active for ten years in design and supervision of dam and water power construction in Sweden
He is author of the publication Invesshytigations of Soil Compaction 21_ Vibrashytion
Lars Forssblad
I INTRODUCTION tons was developed by Losenhausenwerk as early as 1933 This vibrator had a variable frequency between 10 and 25 cps and a maximum depth effect
Vibratory soil compaction was first studied and of 2 0 to 25 m (Muller amp Ramspeck 1935 applied in Germany during the 1930 s (Loos 1936) Ramspeck 1937) Losenhausenwerk also designed A self-propelled caterpillar- type vibrating at about the same time a self-propelled 1 5 plate compactor with a total weight of about 25 ton vibrating plate compactor
101
The vibroflotation method where heavy internal vibrators in combination with jetting are used to compact cohesionless soils to large depths was also developed in Germany during the 1930 s (Schneider 1938)
Other types of vibratory soil compactors were developed during the 1940amp such as tractorshydrawn and self- propelled vibrating rollers multiple plate compactors and vibrating tampers (rammers) as described eg by Garbotz (1958
Table 1 Different types of vibratory soil compactors
Surface vibrators
Type of machine Weight Frequency
Vibratine tampers (rammers)
tHand- guided 50- 150 kg about 10 cps (100-300 lb)
Vibratine plate compactors
Self-propelled hand-guided 50- 3 000 kg 12 - 80 cps (1 00-6000 lb )
Multiple-type mounted on 200- 300 kg 30 - 70 cps tractors etc (400- 600 lb)
Crane-mounted1) up to 20 ton 10 - 15 cps
Vibrating rollers
Self- propelled hand-guided 250- 1500 kg 40 - 80 cps (one or two drums) (500-3000 le) Self-propelled tandem- type 0 7- 10 ton 30 - 80 cps
Self-propelled driving 4 - 25 ton 20 - 40 cps rubber - tires
Tractor-drawn 1 5- 15 ton 20 - 50 cps
1) Used on a limited scal e
Self- propelled vibrating rollers are of three main types - hand- guided vibrating tandem rollers and vibrating rollers with two driving rubber- tires Tractor-drawn vibrating rollers with weights up to 15 tons and vibrating rollers with driving rubber- tires with total weights up to 25 tons are nowadays used
The use of vibratory soil compaction has inshycreased considerably during the last 5 to 10 years Vibratory soil compaction was initially used only for cohesionless soils (Lange 1940 Leussink 1951) Nowadays vibrator y compactors are also used to compact cohesive soils and asphalt surfaces The main applications are given in Table 2
The knowledge of the factors affecting vibratory compaction of soil i s still incomplete in spite of the extensive investigations which have been carried out all over the world s ince the 1930s The compaction of cohesionless soils is affected
102
1959) Erl enbach (1959) Kronenberger (1960) Leussink (1960) and Forssblad (1965)
Vibratory soil compactors can be classified as indicated in Table 1 Vibrating tampers are light hand- guided machines operating at a low frequency about 10 cps and with a large amplitude The types of self- propelled vibrating plate compactors which are most commonly used today weigh between 100 and 500 kg
Internal vibrators
Type of machine Diameter Frequency
Concrete vibrators
Manually operated or 5 - 15 cm 100 - 200 cps tractor-mounted (2 - 6 in)
Vibroflotation eguipm
Crane-mounted 23 - 38 cm about 30 cps ( 9 - 15 in)
eg by average grain size grain size distrishybution shape of particles water content pershymeability compressibility shear strength etc Also the properties of the vibratory compact or such as frequency nominal amplitude centrishyfugal force and total weight affect the comshypaction The descriptions of the soil and of the compactor in test reports and technical articles are usually very schematic
The many factors which affect the vibratory comshypaction make it difficult to draw general conclusions It is therefore important to study carefully the actual test and soil conditions before test r esults are applied to other conshyditions than those under which the tests were carried out
This report deals mainly with vibratory compacshytion of cohesionl ess soils but some data and results from investigations on rock fills and cohesive soils are given for comparisons
Table 2 Applications of vibratory soil compaction
Type of machine
Vibrating tampers rammers)
Vibrating plate compactors
Self-propelled hand-guided
Multiple - type
Vibrating rollers
Self- propelled hand- guided
Self-p ropelled tandem type
Self-propelled driving rubber-tires
Tractor-drawn
II ELEMENTS OF SOI L COMPACTION
The purpose of compaction is to improve the strength and deformation properties of soils The shear strength of cohesionless soils inshycrease while the compressibility and the pershymeability decrease with increasing density For example the angle of internal friction of sand or gravel increases with up to 12deg when the relative density increases from loose to dense
The compressibility of cohesionless soils is also affected by small changes of the density Compaction of a soil will often increase the equivalent modulus of elasticity as determined by plate load tests 5 to 10 times
The permeability is also affected appreciably by the relative density When the relative density increases from loose to dense the permeability of a uniform sand or gravel deshycreases by about 50 to 60 The change of the permeability increases with increasing coefshyficient of uniformity and with decreasing grain size (Taylor 1948)
The compaction of a soil is in most cases exshypressed by the relative compaction or by the relative density The relative compaction or the degree of compaction RD() is defined by
Applications
Street repair Fills behind bridge abutments retaining and basement walls etc Trench fills
Base and subbase compaction for streets side-walks etc Street repair Fills behind bridge abutments retaining and basement walls etc Fills below floors Trench fills
Base and subbase compaction for highways
Base subbase and asphalt compaction fo r streets sideshywalks parki ng areas garage dri veways etc Fills behind bridge abutments and re ta ining walls F i lls below floors T rench fi lls
Base subbase and asphalt compac tion for highways streets s i de-walks parking areas garage dr iveways etc Fills below floors
Base subbase and embankment compaction for highways stree ts parking areas air fields etc Rock fill dams Fills soil or rock) used as foundations for residenti al and industrial buildings
Base subbase and embankment compaction on highways streets parking areas air fields etc Earth- and rock fill dams Fills (soil or rock) used as foundations for residential and industrial buildings Deep compaction of natural deposits of sand
the equation
R = ~ x 100 (1)D Yd max
where y is the actual dry density (dry unit weight)dand yd maxis the maximum dry density determined by ~he Proctor compaction tests (standard AASHO modified AASHO etc ) or byshyvibratory compaction methods as illustrated in Fig 1
a b C
middot- -middotlt middotmiddotmiddot
Fig 1 Laboratory Compaction Methods a) Proctor Compaction Test b) Vibratory Compaction Test with Vibrating Table and Surcharge Load c) Vibratory Compaction Test with Vibrating Tamper or Hammer
103
--
The compactjon of cohesionless soils is often expressed by the relative density The relative density ID() of a soil with the void ratio e is definea by
X 100 ( 2)
In this equation emax and emin are the maximum and the minimum void ratio of the soil respectshyively The relative density is equal to zero when the soil is loose (e = emax) and 100 when the soil is dense (e = e in) For a soil with the dry density yd Eq (~J can be rewritten as
Ydmax (yd- Yd minl - X 100 (3)
Yd (yd max- Ydmin)
where Ydmax and Ydmin are the maximum and minimum dry density of the soil respectively
A vibratory compaction method for cohesionless free- draining soi l s has been developed by the Bureau of Reclamation (1963) This method has been approved as ASTM Standard D 2049 The maximum dry density is determined by vibrating the soil either saturated or completely dry for 8 minutes in a test mould under a surcharge load (Fig 1 b) The volume of the mould is 0 1 cu ft alternatively 0 5 cu ft
The maximum void ratio emax and the minimum density yd min are usually determined by pouring dry soil through a funnel into a Pr octor mould The funnel is generall y held 25 mm above the soil surface Soils with particles larger than 10 mm are generally placed with a scoop (Bureau of Rec l amation 1963)
The maximum density can also be determined by laboratory compaction tests using a vibrating hammer or a vibrating tamper working on the surface of the material (Fig 1 c) The method using a vibrating hammer nas been developed by the Road Research Laboratory in England (Parsons 1964 Odubanjo 1968)
The vibrating tamper method has been developed by Vibro- Verken (Forssblad 1965 1967) Accordshying to this method the soil is compacted in two layer s in a mould with 15 cm diameter Each layer is vibrated for 2 min The resulting maximum dry density is for saturated cohesionless soils about the same as that determined by the modi fied AASHO compaction test
The compaction water content has a different effect on the compaction of cohesionless free shydraining soils than on fine-drained cohesive soil s The water content of a free - draining soil decreases during the compaction if the initial water content is high while the water content does not change for fine-grained soils As a result the Proctor curve of f r ee-draining soils terminates near the maximum value (Fig 2) If a sandy or gravelly soil contains some silt or clay it is not free-draining and excess water does not drain out during the compaction The resulting compaction curve is regular as shown in Fig 2 by Curve 2 Cohesionless freeshydraining soil s very often have comparatively flat compaction curves as illustrated in Fig 2 by Curves 1 3 and 4 In some cases two maxima are obtained probably because of capillary
104
forces in the partially saturated soil
pcf tm
24 23
140 10 ~ 22 Ii- V~
2 1130 ~ 2J Icopy V ~ ii 120
[- --V ~ 19 ~ lltD middotc 18 I110
~ 17 - 0 Icopy
100 16 ~i-- -
15
90 14
1380
12 0 8 10 12 14 16 18 20 22 24
Water content percent
US standard sieve size 34 middotn Nobull No 40 N e 100 No 200 - Il 1-I- I I0i Ibull-0 iv-bull I I
I
~ ~T I1 II I
I
i I II 1 1 i I
II 1 I I I I~ 0_ III I-
I I I
I r- I 11 ~ 1 -r-- II I ~ I
II ~ lv 10 10 01 0 01
Groin size in millimeters
Fig 2 Compaction Curves Obtained with the Modified AASHO Method and Grain Size Distr ibutions for Different Types of Sandy Soils
Due to the compar atively flat compaction curves for free-draining soils and the fact that excess water can drain out during the compaction the water content of the soil is not as imshyportant for cohesionless free-draining soil s as for fine- grained soils The best compactionof sand and gravel is usually obtained when the soil is saturated or completely drybut a comparat i vely good compaction can frequently be obtained also when the soi l is part i ally saturated
Investigations by Bureau of Reclamation (1963) and others as well as practical experience indishycate that a soil usually can be characterized as free-draining if the content of fines ( soil particles with a diameter smaller than 0 06 or 0 074 mm) is less than 5 to 10 In special
cases soils can act as free- draining when the content of fines is as high as 15 to 20
However well-graded sandy and gravelly soils (silty sand clayey gravel etc ) with more than 5 to 10 of fines are as a rule not free shydraining These soils have certain cohesive properties and the control of the compaction water content is essential (Fig 2)
The relevance of the Proctor compaction tests to vi bratory compaction of cohesionless soils has been questioned by many investigators (Lane 19ll8 Felt 1958 Morris amp Cochrane 1965) It has been suggested that vibratory soil comshypaction should be correlated with laboratory compaction tests based on vibration
Impact compaction tests such as the Proctor compaction tests are generally time consuming in comparison with vibratory compaction tests In addition impact tests are to a certain extent affected by the manual performance
A further advantage with vibratory compaction tests is that such tests can be adapted to test moulds with large diameters and can ther efore be carried out on samples containing stones
III TECHNICAL DATA OF VIBRATORY COMPACTORS
There are no accepted rules regarding the techshynical data which should be specified or given for vibratory compactors in specifications technical reports etc Sometimes such more or less undefined terms as dynamic force dynamic load compaction effort in tons impulse in tons per second equivalent static weight are used
The vibrations of the drum of a vibrating rolshyler or of the bottomplate of a vibrating plate compactor are usually generated by one or several rotating eccentrics The frequency amplitude velocity and acceleration of a sinushysoidal oscillation are defined in Fig 3 The frequency expressed in cycles per minute (cpm) or cycles per second (cps or Hz) is determined by the rotational velocity of the eccentric(s) The amplitude of the drum or the bottomplate is a function of the eccentric moment of the ecshycentric as shown in Fig 4 and of the mass of the vibrating system
The so-called nominal amplitude can be calcushylated from the following equation
t _ Eccentric moment1Nominal amp l ude - Mass of drum or bottorqilate ( 4)
The actual amplitude can for certain frequency ranges be up to 50 to 100 larger than the nominal amplitude due to resonance
The rotating eccentric initiates a centrifugal force which is a function of the frequency and the eccentric moment as shown in Fig 4 (Due to the oscillati ons of the drum or bottomplate there will be a small difference between the real centrifugal force and that calculated from Fig 4 The difference is usually less than 1)
The centrifugal force acts inside the drum or bottomplate Its magnitude is not equal to the dynamic force transmitted to the underlying soil as is sometimes assumed
c ~ Amplitude
J____________1--------lt-
Time
Time T for full cycle
Frequency (number of eye les per sec (1T) ) = f cps or Hz
Amplitude (maximum deviation from position at rest) = s cm (in)
Maximum velocity = vmox = 21C-fmiddots cms (insec)
Maximum acceleration = omax = 4Ttf s cms2(insec)
Fig 3 Definition of Frequency Amplitude Velocity and Acceleration for a Sinushysoidal Oscillation
Weight of eccentric = m kg (lb)
Eccentricity = r cm in)
Eccentric moment = m r kgcm (lb in)
Centrifugal force 41 F - ~ kg (lb) g
= =g = occelerotion due to gravity 981 cm sZ 386 insec
Fig 4 Definition of Eccentric Moment and Centrifugal Force
Through the oscillations defined by their freshyquency and amplitude the vibrating drum or bottomplate affects the surface of the ground with a rapid succession of dynamic loads or impacts Each load cycle generates a stress wave as illustrated in Fig 4 It i s i mportant to make a clear distinction between the vibrashytions of the compactor and the characteristics of the stress waves in the soil The charactershyistics of the stress waves are to a large exshytent dependent on the properties of the soil
The static weight of vibratory compactors has a
105
large influence on the compaction effect since the kinetic energy as well as the momentum (mass x velocity) of the vibrating drum or bottom plate are directly proportional to the weight if the amplitude and the frequency are constant Test results indicate for example that the maximum depth to which a soil can be compacted is depending on the total static weight of the compactor However the compaction close to the surface is for vibrating rollers also to a large extent influenced by the static weight per linear inch of drum width
The ratio of drum and frame weight is also of importance with respect to the compaction efshyfect However this weight ratio is given in specifications technical reports etc for vishybrating rollers and vibrating plate compactors
It is proposed that at least the technical data in Table 3 should be given in specifications technical reports etc for vibrating rollers and vibrating plate compactors
TABLE 3 -- TECHNICAL DATA FOR VIBRATING ROLLERS AND VIBRATING PLATE COMPACTORS
Vibrating rollers Vibrating plate compactors
Total weight Total weight
Static load per Static load per unit area of inch of drum width bottom plate
Drum width Width of bottom plate
Drum diameter Length of bottom plate
Frequency Frequency
Nominal amplitude Nominal amplitude
Eccentric moment Eccentric moment
Centrifugal force1 ) Centrifugal force1 )
Working speed Working speed
l) Can be misleading if compactors with two different frequencies are compared
IV COMPACTION MECHANISMS
A large number of factors affect the vibratory compaction of cohesionless soils According to Lorenz (1955 1960) the most important of these factors are the resonant frequency of the comshypactor - soil system (Hertwig 1931 1933) the number of load cycles (Tschebotarioff and McAlpin 1947) and the shear strength during the vibration (Mogami and Kubo 1953)
Whiffin (1954) Forssblad (1965 ) and others have pointed out however that also the magnishytude of the dynamic stresses generated in the soil by the vibrator is of great importance for the results of the compaction
1 Resonance
According to Hertwig (1931 1935) the highest
density of a soil is obtained at the resonant frequency of the vibrator - soil system where the amplitude reaches a maximum Also Terzaghi (1943) Bernhard (1952a 1959) Converse (1954 1957)and others recommend that the compaction should be done at the resonant frequency
The resonant frequency varies with the soil type and with the characteristics of the comshypactor Sung (1954) Viering (1957) and Lorenz (1960) for example have pointed out that the resonant frequency depends on the eccentric moment the weight and dimensions of the vibrator and on the properties of the soil Also Barkan (1960) and others have discussed the factors affecting the resonant frequency of the vibrator - soil system
Compaction tests and practical experience do not indicate however that vibratory compaction at the resonant frequency will give a higher density than at other frequencies (eg Lorenz 1955 1960 Forssblad 1955 1965 Kutzner 1962 Usually the density of compacted soil will increase with increasing frequency even at frequencies exceeding the natural frequency of the vibrator - soil system One reason as pointed out by Forssblad (1965) is that the centrifugal force and the momentum and thus the 11 intensity 11 of the vibrations also increase with increasing frequency The resonance effects of the vibrator - soil system will in this case be combined with the effects of an increase of the 11 intensity11 of the vibrations as graphically illustrated in Fig 5 The resonance effect is in this case 11 hidden 11 bull Due to this reason medium and heavy-weight vibrating rollers often are designed with a frequency just above the resonance frequency of the vibrator - soil system
Nominal o litude 2 s
sect Nominal a itude s
C
~l-----j-ft--i-----1-------j
1 u _____ ----g_
0 tvbgnificot
amplitude n of nominal e to resonance
10 20 30 Frequency
Fig 5 Effect of Frequency and Amplitude on Vibratory Compaction of Soil
2 Number of Load Cycles
According to Tschebotarioff and McAlpin (1947) the number of load cycles and the centrifugal force govern the density of the compacted soil when the frequency is low About 10000 cycles were required to reach the maximum density of a sand when the centrifugal force was 9 and 187 kg The maximum density increased with inshycreasing centrifugal force When the centrifugal force was 37 and 75 kg approximately 30000
106
load cycles were required These tests were carried out at f r equencies between 1 0 and 25 cps
Kutzner (1962) also f ound from vibratory comshypaction tests with glass beads and dry sand that the density increased with increasing numshyber of load cycles or wi th increasing vibr ation time For the glass beads the increase was small after 500 load cycles About 9 000 load cycles were required to reach the maximum denshysity of the dry sand at a frequency of 50 cps
Tests by Whitman and Ortigosa (1968) indicate that the density of a compacted cohesionless soil at accelerations less than 1 g is primarily governed not only by the number of load cycles but also by the stress increase in the soil The density increased as the logarithm of the number of cycles The increase of the density was however smal l when the initial relative density was larger than 70 and the ratio of the maximum and the mi nimum cyclic stress from the vibration was less than 5
The test results thus indicate that the number of load cycles is of special importance at low accel erations The number of load cycles reshyquired to reach a given relative density is also influenced by the gradation of the soil
3 Shear Strength During Vibration
Mogami and Kubo (1953) observed that the shear strength of dry sand decreased with increasing acceleration They investigated two types of dry sand in a direct shear apparatus (Fig 6) at frequencies ranging from 10 to 50 cps and at accelerations which varied up to 20 g The test results indicated that the shear strength decreased approximately linearly when the acceleration increased from 0 5 to 1 0 or 2 0 g
The shear strength of sands under vibratory loading has also been investigated by Linger (1963) with direct shear and triaxial tests The vibratory tests gave a lower shear strength than the static tests The superimposed vibrashytory loads caused a reduction of the normal load for the direct shear tests and of the confining pressure for the triaxial tests
11 175~ JJ7
Fig 6 Test Equipment for Determination of Soil Shear Strength Wi th and Without Vibrations Used by Mogami amp Kubo (1953)
The degree of saturation and the water content
affect appreciably the compaction properties of sand due to capillary forces between the indivishydual soil particles ( false cohesion) In Fig 7 is shown the dr y density of uniform coarse medium and fine sands as a function of the water content (Kutzner 1962) It can be seen that the dry density of the soil compacted either dry or saturated was approximately the same The lowest density was obtained when the water content was 5 to 10 Kutzner also carried out compaction tests where a wetting agent had been added to the pore water In this case the dry density of the coarse sand after compaction was approximately independent of the water content (Fig 7) These tests indicate that the compaction of partly saturated cohesionshyless soils is appreciably affected by capillaryforces
~ ~18 0~
17 L
~-0-
r
1 16
c 15 f = 50cps0
middot S= 085 mm3
middotc O= 85g~
~ Cl
13 I ---wetfin agent
)C
)C
120 5 10 15 20 25 Water content percent
Fi g 7 Vibratory Compaction of Sand at Difshyferent Water Contents After Kutzner (1962)
Forssblad (1965) used the vane test to study the shear strength of mainly cohesionless soils with and without vibrations at different water conshytents The test data indicated that the vibrashytory shear strength varied between 1 to 6 of the static shear strength The lowest value was obtained for gravel sand gravelly silt or crushed stone when the soil was either dry or saturated The vibratory shear strength of all investigated soils was about the same
4 Dynamic Stresses
The compaction of a soil is to a large extent dependent on the type and the intensity of the stress waves generated by the vibrator Longshyitudinal and transverse waves are transmitted through the soil while Rayleigh and Love waves follow the ground surface In a transverse wave the soil particles move in a plane pershypendi cular to the direction of wave propagation while in the longitudinal waves the particles move in the direction of the wave propagation The transverse waves propagate with about half
107
the velocity of the longitudinal waves (also called compressional waves)
The amplitude of the longitudinal and of the transverse waves gener ated by vibrating roll~rs or plate compactors decrease with increasing di stance from the vibrator mainly due to geoshymetrical damping There is a l so a reduction of the amplitude due to absorption of energy by the soil
According to Forssblad (1965) the intensity of the stress waves must be high enough to overshycome the shear strength of the soil In a partly saturated sand and grave l with a relashytively low apparent ( false) cohesi on a verti~al dynamic stress of about 0 5 to 1 0 kgcm was required to reach a relative comshypaction of 90 with respect to the modified AASHO c ompaction test For clays a considerably larger pressur e - about 5 kgcm2 was required to reach the same r elat i ve compaction at the optimum moistur e content
Whiffin (1954) has measured the stress distrishybution bel ow a vibrating roller a static rolshyler a power r ammer and a crawler tractor in two types of clayey soils Whiffin found a relationshyship between peak pressure (static or dynami c) and the relative compaction of the soil whi ch was independent of the type of compaction machine and of the duration of the stress pulse The dynamic str ess gener ated by the vibrating r oller was about 100 l arger than the corr esponding static stress increase These results have been confirmed by other authors
For ssblad (1965) has measured the vertical dyshynamic stresses below different types of vibrashytory compactors and for di fferent soil types As shown in Fig 8 the maximum vertical dynamic stress decreased rapidly with increasing depth below the gr ound surface Forssblad found that it was possible to calcul ate approximately the dynamic stress distribution by Boussinesq s equation for a compacted soil For a loose soil the dynamic stresses in the soil were less than those calculated by Boussinesq s equation Also Ber nhar d (1952a 1952b 1962 1967) Christoffel (1960) and others have measur ed the stress distribution in the soil below different types of vibratory compactors
Vertical dynamic stress 10 20 JO ~o ~o o0 10 eo 90 middoto 10 20 JO bull 0 0
o 1
10 ___ JI _ l= 20 ~-
10 I 1JO J ---i----
10 II
llh
s o JO0 80 - - - -
0 Vibro1ing p loiit compoctOI 13S lrg (300 lb)
-iOO kg (900 lb)100 ~v 2 - -- - -r 3 Vibt01ing tamper 60 lrg (130 lb)IIC
I vaoillg roller 1i ton 120 s 3 3 lo1I - - -IJ O I bull - - - 12 5 IOfI
I 10
Fig 8 Vertical Dynami c St ress es at Different Depth Under Vibrator y Compactor s of Di fferent Types a nd Sizes According to Forssblad (1965)
Reflection of the stress waves against lower more compact layers can give special compaction effects Near such a layer the compaction of a soil will sometimes be better than that close to the surface Reflection can also have a loosening effect when thin layers of soil are placed on a rigid base
Luscher et al (1967) Ortigosa and Whitman (1968) and D Appolonia et al (1969) have sugshygested that both the maximum and minimum dyshynamic stress in the soil are factors which affect vibratory compaction of cohesionless soils The minimum dynamic stress in the soil should not be much larger than zero to obtain a good compaction Even if the minimum dyshynamic stress is relatively small the soil particles are not free to move
5 Liquefaction During Compaction
The pore pr essur e in a saturated sand builds up progressive l y during the vibrat i on if the re shylative density is low and the sand is not freeshydraining The compactor bogs down when the pore pressure approaches the total overburden pr essure of the soil and the vibrator This phenomenon is called liquefaction Li quefaction is depenshydent on the permeability the initial density of the sand the number of load cycles the over shyburden pressure and the intensity of the cyclic load (Seed and Lee 1966 Lee and Seed 1967 Peacock and Seed 1968 Seed 1968) The vibrashytory load and the number of load cycles required for liquefaction increase with increasing r elashytive density and with increasing overburden pressure
The minimum permeability for the soil to be free - draining is a function of the towing speed the thickness of the compacted layer and the compressibility of the soil Approximate calshyculations indic~te that the permeability should be at least 10- cmsec for a layer thickness of 20 cm a towing speed of 4 kmhour and a volume compressibility of 0 02 cm2kg for the soil to be free - draining and to avoid that the compactor bogs down It has been assumed that the consolidation ratio should be at least 50 for each pass
V VIBRATING ROLLERS
A large number of differ ent types of vibrating rollers a r e used as shown in Table 1 The frequency varies between 20 and 80 cps and the nominal amplitude between 0 3 and 2 5 mm Some types of vibrating rollers operate at a higher frequency in combination with a l ow nominal amplitude Other types have relatively low frequencies and l arge amplitudes The frequency can often be changed by changing the engine speed There are a l so v i br ating rollers with adjustable eccentric moment so that the nomi nal amplitude can be varied Tractorshydrawn vibrating rol l ers usually have a centrishyfugal force which is 2 to 3 times the total weight of the roller
The Road Research Laborator y i n England initishyated in 1945 (and is still conducting) ext ensi ve compaction tests with different types of static and vibratory compactors An early investishygation by Hunt (1946) i ndicated that a higher
108
density was obtained for a coarse sand by a 215 kg vibrating roller than by a 12 ton rubber tired roller or by an 8 ton static smooth wheel roller The layer thickness was 22 cm Later compaction tests were carried out on a number of standardized soils (gravel- sand-clay wellshygraded sand uniformly graded fine sand sandy clay and heavy clay) The first three of these soils contained about 15 of fines Detailed results from the compaction tests are available in a number of special reports The test reshysults have been summarized and discussed by Lewis (1954 1960 1961 1967) According to Lewis (1967) vibrating rollers with weights up to 1 ton could only be used to compact granular soils Tractor- drawn vibrating rollers with weights between 3- 34 and 8-12 tons were suitshyable for all soil types also clays The reshyquired number of passes for vibratory rollers were 4 to 6 The maximum layer thicknesses which were recommended for the test vibratory compactors are relatively low The main reason is probably the comparatively high content of fines in the tested soils Lewis (1961) has published results which show a relationship beshy~ween the dry density of the compacted soil and the frequency of the vibrations (Fig 9) In the tested frequency range the effect of changes in frequency was significant only with the granular soils ( Compare also Fig 9 with Fig 5)
Lewis (1961) has also reported results from compaction tests on a well- graded sand with a 3- 34 ton tractor-drawn roller at different towing speeds and different number of passes These test results indicated that a larger towing speed must be compensated by a larger number of passes in order to reach a given reshylative compaction It was found that the reshylative compaction was mainly dependent on the total vibration time on a given surface area
The test results obtained at the Road Research Laboratory have been discussed and analyzed by Johnson and Sallberg (1960) Morris and Cochrane (1964)and others Johnson and Sallberg (1960) pointed out that a good correlation was obtained for vibrating rollers between the degree of comshypaction and the static weight per cm of roll width
Compaction tests have also been carried out at the National Swedish Road Research Institute (Bruzelius 1954) Typical Swedish soils (coarse gravel sand silt and moraine) were compacted in 06 m to 10 m lifts A considerably higher relative compaction was obtained by a 3 ton tractor- drawn vibrating roller and also by a 1 5 ton vibrating plate compactor than by static rollers The maximum effective compaction depth ranged from 05 to 10 m for the vibratory comshypactors The surface density of the soil was generally lower than the density at some depth below the surface The maximum dry density was obtained at a depth of 10 to 30 cm
Two manually- guided vibrating rol l e r s weighing 250 kg and 16 tons have been tested at the Central Road Research Laboratory in India The f r equency was one of the factors which was varied during the tests (Gokhale and Rao 1957)
Garbotz and Theiner (1959) at the Technische Hochschule Aachen Germany have carried out extensive compaction tests with static smooth wheel rollers vibrating rollers and vibrating
l5r-------------Goe-coy
10
- IJS A Wtllbullgroded sand
0
110 - o-tr~
c
l 15
0 ~ -
10 ___t_middot d 115 -- -------------
- - - 13 - Ion troctor drown roller 110 -- Jfrac34 -ton loncJbullm rollbullr
~Havy clay
95---~-- ~--~--~ JO JS o 50
Frequency cps
Fig 9 Relationship Between Dry Density of the Compacted Soils and Frequency of Two Types of Vibrating Roller According to Lewis (1961)
plate compactors Garbotz and Theiner found that uniformly graded cohesionless materials could not be compacted to a higher density by vibrating rollers than by static smooth wheel rollers The depth effect of vibratory comshypactors however was considerably larger than for static smooth rollers Vibratory compacshytion gave the highest degree of compaction for well- graded cohesionless soils
Garbotz and Theiner also found that the degree of compaction of gravel increased when the frequency of a 165 ton tractor-drawn vibrating roller was increased from 23 to 37 cps A further increase in frequency up to 50 cps caused a small decrease of the density For the comshypaction of cohesionless soils Garbotz (1964) recommends for vibrating rollers the combinashytion of a relatively high frequency and a low amplitude
Johnson and Sallberg (1960) have reviewed the factors influencing the field compaction of soils In this report are summarized results from compaction tests available up to that time
Forssblad (1965) has published results from compaction tests on sand with 14 and 3-3 ton tractor-drawn vibrating rollers and with vibrashyting plate compactors weighing 40 120 and 400 kg The influence of the towing speed and of the number of passes was investigated for the 33 ton tractor- drawn roller The required number of passes to reach a specified density increased with increasing towing velocity Test results indicated that the s urface capacity was approximately independent of the rolling speed between 3 and 6 kmh Lower speeds than normal are recommended when the layer thickness is large and when a very high degree of comshypaction is required
Tynan and Morris (1968) have investigated six types of tractor-drawn vibrating rollers weighshying from 3 2 to 9 - 9 tons The compaction tests were carried out on crus~ed rock uniform dune
109
sand and on medium clay at different water conshytents The layer thickness was about 25 cm before the compacti on In the weight class 32 to 5 tons the roller with the largest nominal ampl itude (1 7 mm) and lowest frequency (24 cps) gave for all soil types higher densities than the rollers with a frequency of about 40 cps and a relatively small amplitude For crushed rock and clay the density increased with increasing number of passes up to 16 For the dune sand the increase of the density was small after 2 passes
The optimum water content for the field comshypaction tests was for the crushed rock 1 to 2 higher than the optimum moisture content de shytermined by the modified AASHO compaction test No signifi cant crushing effect was observed for this material For the dune sand the opshytimum moisture content was the same for the field as for the laboratory compaction tests
D Appolonia Whitman and D Appolonia (1969 ) have i nvestigated the compaction of a unifor m dune sand by a 5 ton and by a 3 ton vibrating roller The layer thickness was large Two passes of the 5 ton roller gave the specified compaction (75 relative density) down to a depth of about 60 cm The compaction was not sufficient however close to the surface down to a depth of about 25 cm The density at depths larger than about 25 cm increased substantially with inshycreasing number of passes D Appolonia et al recognized three different compaction zones The soil near the surface was considered to be overcompacted Below this zone to a depth of 60 cm the compaction was believed to be detershymined by the maximum and the minimum dynamic stress generated in the soil by the roller The minimum dynamic stress must be low enough to allow the particles to move The compaction of the soil below a depth of about 60 cm was conshysidered to be caused mainly by the repetitions of str ess (number of load cycles)
The problem with a low surface density of unishyform cohesionless soils has also been discussed by Bruzelius (1954) Garbotz and Theiner (1959) Wiklund (1960) Forssblad (1965) and others Overcompaction can be caused by heavy static rollers as well as by medium and heavy weight vibrating rollers and plate compactors Heavy vibrating rollers can cause overcompaction down to a depth of 40 to 50 cm as indicated by Baker and Moorhouse (1968) The best surface compaction is obtained with light vibrating rollers light and medium weight plate compactors or with light and medium weight static rollers To increase the surface density it is also advantageous to compact the soil at a high water content
Tynan and Morris (1968) observed that the surshyface density of a well- graded crushed rock was low particularly when a heavy high frequency roller was used and the compaction water conshytent was l ow In this case reflection of stress waves against the underlying rigid sub shybase could have contributed to the observed effect
Hall (1968) carried out compaction tests on crushed limestone sand and lean clay The sand contained 8 of material smaller than 0 06 mm The following types of rollers were investigated
a Tractor- drawn vibrating roller weight
32 tons low frequency
b Tractor- drawn vibrating roller weight 1 4 tons high frequency
c Self-propelled vibr ating roller weight 24 tons low frequency
d Rubber- tired static roller weight 50 tons
Rollers a and d gave for the crushed lime shystone and the clay the highest relative comshypaction The compaction by the two rol l ers was similar On sand compactor c gave the best overall results Roller b gave satisfactory results only on the sand
The relationship between technical data and the performance of vibratory rollers has been disshycussed by Tope (1967)
Heavy vibrating rollers are often used to comshypact rock fill and granular soils containing large stones and boulders Field compaction tests indicate that rock fill can be efficiently compacted in thicker layers than sand and gravel The large depth effects which are obshytained with vibrating rollers on rock fill is probably due to the high impact forces which are generated when the vibrating drum comes in contact with large stones Also the damping in rock fill is relatively low
Vibratory compaction of rock fill usually causes a reduction of the volume by 5 to 7 Field exshyperience indicates that 10 to 15 ton vibrating rollers with 5 to 10 passes can compact rock fill in 1 0 to 2 0 m lifts Vibrating rollers with weights between 3 and 5 tons are used to compact rock fill in 0 5 to 10 m lifts
Heavy vibrating rollers are also used to comshypact natural sand deposits with a low initial density in order to increase the bearing capashycity and to reduce the settlements The sand may either be fully or partly saturated If the depth is relatively large up to 20 to 30 passes may be required Boringe and other measurements have indicated a maximum depth effect of 25 to 3 m for 10 to 15 ton vibrating rollers (Baker and Moorhouse 1968)
Winter compaction of soil and rock fill has been investigated in Canada Sweden Norway Finland USA and other countries Frozen soils except clean and dry gravel crushed rock and rock fill can generally not be compacted to the same dry density as unfrozen soils The difficulties with winter compaction increase with increasing water content and with decreasing grain size and temperature (Bernell 1965) Vibrating sheepsshyfoot rollers have been used successfully to compact gravel during the winter Due to the high contact pressures lumps of frozen soil can be crushed Test results indicate however that also with this method the dry density of compacted gravel is about 10 lower than that of the same soil compacted during the summer (Bernell 1965)
During the winter unfrozen soil can often be obtained from excavations When the unfrozen soil is spread out in cold weather the surface freezes rapidly It is therefore important to compact the soil immediately after it has been placed
110
VI VIBRATING PLATE COMPACTORS
The most commonly used plate compactors weigh between 100 and 500 kg With two eccentrics working synchronously it is possible to obtain a directed vibratory force and to move the vibrator during the compaction By adjusting the eccentric element the velocity and the direction of motion can be varied A plate vibrator can also be moved with only one rotating eccentric if the eccentric is placed at the front end of the bottomplate
The frequency of heavy self-propelled vibrating plate compactors is usually between 12 and 20 cps while the frequency of small vibrating plate compactors can be as high as 70 to Bo cps (Table I) The amplitudes vary between 05 and 5 mm The centrifugal force is usually 5 to 10 times the total static weight of the vibrator
The action of plate vibrators have been reviewed by Converse (1954) Bernhard and Finelli (1954) Lorentz (1960) and others Siedenburg (1957) has calculated for inelastic soils the motion of a vibrating plate compactor without a springshysupported engine bed plate Calculations for plate compactors with spring-supported engine bed plates have been made by Bathelt (1956) and by Bathelt and Kock (1956) Bathelt used a mechanical model consisting of three springs to analyze the behavior Two of the springs could not expand after they once have been comshypressed The calculations showed that the centrifugal force for a self-propelled vibrator should be between three to ten times the total weight of the vibrator Similar calculations have also been carried out by Ephremidis (1959) and Weber (1965)
Also Jurecka (1965) has calculated the motion of vibratory compactors and the energy distrishybution in the soil
Compaction tests with vibrating plate compactors have been carried out in Germany during the 1930 1 s as mentioned in the introduction (MUller and Ramspeck 1935 and Ramspeck 1937)
Bernhard (1952a) has carried out compaction tests with a 15 ton vibrating plate compactor and a multiple-plate compactor A relative compaction of 95 with respect to the standard AASHO comshypaction test was obtained for a uniform silty sand by the 15 ton vibrator down to a depth of 75 cm
Converse (1952 1954) has investigated the comshypaction of a uniform beach sand by a vibrating plate compactor with a weight of about 5 tons The dry density of the beach sand was at least 95 with respect to the modified AASHO compaction test down to a depth of 045 to 060 m and 93 to 96 between 060 to 150 m below the ground surshyface
Greenman (1948) has investigated the vibratory compaction of sand and gravel The soil could be compacted satisfactorily to a depth of 30 cm with a light plate compactor The relative compaction was higher than that which could be obtained by internal vibrators or by pneumatishycally operated tampers
Aldous and Wills (1952) have investigated the vibratory compaction of crushed rock gravel and sand The soils were compacted in 15 to 30 cm
lifts by vibrating plate compactors weighing either 70 or 170 kg The maximum density of the gravel was reached after two passes The unit weight of the soil in the lower half of the 30 cm lifts was less than in the upper half
Plantema (1954) used a 15 ton vibrating plate compactor to compact a 5 meter thick sand fill The highest relative compaction was obtained at a frequency of 20 cps The compaction was checked by soundings with a Dutch cone penetroshymeter An appreciable increase of the peneshytration resistance was observed after the comshypaction down to a depth of 20 m The velocity did not affect appreciably the compaction With a light compactor the best compaction was obshytained at a velocity of 4 mmin
Compaction tests with l1J8 ton 140 kg and 40 kg plate compactors have been carried out by Streck and Schmidtbauer (1951J) It was possible to compact a sand to a relative density of 85 within a depth of 60 to 80 cm with the 148 ton plate compactor within a depth of 20 to 30 cm with the 140 kg compactor and within a depth of 20 to 25 cm with the 40 kg compactor
Weiss (1956) has investigated the compaction of sandy gravel and gravel with a 78 ton vibrating plate compactor A relative density exceeding 50 with respect to the modified Proctor comshypaction test was obtained down to a depth of 12 m for the sandy gravel and 17 m for the gravel
Schaeffer (1958) has investigated the effects of frequency and velocity for a light vibrating plate compactor on the compaction of sandy gravel The frequencies 25 33 and 40 cps and the velocities 1J3mmin 7-~ mmin and 105 mmin were investigated The highest density was obtained with the l01middotrest frequency and with the lowest velocity
Garbotz and Theiner (1959) tested a 225 ton vibrating plate compactor The most favorable frequency range was 12 to 17 cps
Garbotz and Christoffel (1964) have carried out tests with vibrating plate compactors and vibshyrating rollers on crushed rock (ballast material)
Kronenberger (1960) has investigated the comshypaction of vibrating plate compactors without spring supported engine bed plates The vibrashyting characteristics and the weight of the comshypactors were varied The maximum dry unit weight and the maximum equivalent modulus of elasticity of the compacted soil were reached at a frequency of about 40 cps Also Lammlein (1953) and Weber (1965) have investigated the performance of vibrating plate compactors Comshypaction of sand by plate compactors has also been discussed by Hoppman (1962)
The Road Research Laboratory in England has made comprehensive investigations of vibrating plate compactors (Lewis 1961) The depth to which soils could be compacted increased with inshycreasing weight and with increasing contact area of the vibrators It was possible to compact satisfactorily a well graded sand to a depth of 30 to 45 cm with a 15 ton or a 2 ton plate comshypactor The depth effect at the same weight was larger for the plate compactors than for the vibrating rollers Lewis found also that fewer passes were required for a plate compactor than
111
for a vibrating roller to reach a given density The surface and the volume capacities given by Lewis ( 1967) for plate compactors were however much lower than those for vibrating rollers
Forssblad (1965) has reported results from exshytensive series of compaction tests with vibrating rollers and plate compactors A relative comshypaction of at least 90 with respect to the modified AASHO compaction test was reached for the layer thicknesses given in Table 4
TABLE 4 -- NORMAL LAYER THICKNESS FOR VIBRATION OF COHESIONLESS SOILS WITH LESS THAN 5 TO 10
OF THE MATERIAL SMALLER THAN 0 06 MM
Vibrating plate compactor 100 to 200 kg 20 cm
Vibrating roller 1 to 2 tons 30 cm
Vibrating plate compactor 400 to 600 kg 40 cm
Vibrating roller tractor drawn 3 to 4 tons 50 cm
Tests and practical experience indicate that it is possible to compact sand and gravel to a high relative density even in high lifts Also relatively fine sand with an average grain size between 006 and 02 mm can efficiently be comshypacted in high lifts by vibrating rollers or plate compactors However comparatively small amounts of fines (silt or clay size particles) will increase considerably the compaction efshyfort required to reach a certain relative comshypaction Also the layer thickness must be deshycreased with increasing content of fines
VII VIBROFLOTATION
Vibroflotation has been used since about 1935 to compact saturated cohesionless soils The method has been described in a number of publications (e g Schneider 1938 Steuerman 1939 1948 Tschebotarioff 1946 Schneider 1948 Rappert 1952 Cassel 1956 D Appolonia et al 1953 Mobus 1959 Watanabe 1963 Thorburn and MacVicar 1968)
Vibroflotation has been developed and applied by the firms J Keller Germany Vibr ofl otation Foundation Co USA Cementation Co England The method has also been used in USSR and Japan Project s where vibroflotation has been used have been described by Schneidig (1940) Leussink (1948) Fruhauf (1949) DAppolonia (1954) D Appolonia and Miller (1955) Plannerer (1965) Hansbo et al (1968) and by Doscher (1968)
The especially designed large internal vibrators (vibrofloats) have generally a diameter of 37 -5 cm and operate at a frequency of 30 cps The nominal amplitude is about 10 mm and the centrishyfugal force is up to 10 tons The vibrators are provided with jetting devices which facilitate the insertion and the withdrawal of the vibrashytors Sand or gravel is added during the vibration to compensate for the subsidence at the ground surface as the soil around the vibro-
112
floats is compacted With this method the soil can be compacted down to a depth of 20 to 30 m Vibroflotation has mainly been used to compact natural strata of sandy soils with a relatively high permeability A maximum amount of 8 to 16 of particl es smaller than 0 06 mm can gener-allybe allowed
Test results by DAppolonia et al (1953) indishycated that the relative density of a fine unishyform sand is at least 70 to a distance of 1 m from the vibrofloats A spacing of 2 m between the insertion points gave a minimum relative density of 70 throughout the compacted area The distance from the vibrofloats to which the soi l can be compacted appears to increase with increasing grain size and with increasing unishyformity of the soil
Abu- Wata and Said (1958) used vibrofl otation to compact a uniform dune sand which had been placed under water The spacing of the insertion points varied between 165 and 2 5 m The compaction of the soil was checked by soundings with a Dutch cone penetrometer A subst antial inshycrease in the measured penetration resistance was observed close to the insertion points The average initial penetration resistance before the compaction was about 60 kgcm2 while the minimum penetration resistance after compaction at a spacing of the vibrofloats of 2 5 m was 120 kgcm2 below a depth of 4 5 m The peneshytration resistance increased with decreasing spacing of the vibrofloats The increase in penetration resistance and of the compaction was smal l close to the surface
Scheelhaase (1959) has described a project where vibroflotation was used to compact a uniform coarse to fine sand for a turbine foundation The compaction was checked by static penetration tests The point resistance varied between 0 to 150 kgcm2 before the compaction and beshytween 250 and 500 kgcm2 after the compaction The penetration tests indicated that the soil was compacted to a distance of 1 0 to 11 m from the insertion points
Hansbo et al (1968) has used the vibroflotation method to compact a uniform sand with an avershyage grain size of 0 5 mm to a depth of 8 to 10 m The compaction was determined by pressiometer tests plate load tests and penetrometer tests A substantial increase of the penetration resisshytance was observed to a distance of 0 6 to 0 7 m from the insertion points
Internal vibrators which are normally intended for concrete have also been used to compact saturated cohesionless soils (Wenner and Saare 1954 and Bureau of Reclamation 1963) According to Wenner and Saare (1954) sand and gravel can be compacted to 90 to 100 with resshypect to the modified AASHO compaction test to a distance of 0 25 to 0 50 m from the insertion points
Forssblad (1965) has repor ted results from comshypaction tests on sand and gravel with internal concrete vibrators The size of the vibrator the frequency and the amplitude were varied A density between 90 and 100 of the modified AASHO maximum dry density was obtained The radius of action of the vibrators was found to be smaller and the required vibr a tion time was found to be longer than in concrete
The vibration of sand silt l oess and clay
with internal vibrators has been investigated theoretically and experimentally by Poteur (1968) 165
VIII LABORATORY COMPACTION TESTS
Laboratory compaction of cohesionless soils by vibration has been studied by many The soil has in the laboratory tests usually been comshypacted in a Proctor mould placed on a vibrating table The influence of frequency amplitude and acceleration of the vibrating table as well as the influence of surcharge load soil gradashytion and moisture content have been studied
Schaffner (1962) has investigated the vibratory compaction of dry sand Typical test results are shown in Fig 10 It can be seen that the void ratio decreased with increasing accelerashytion The highest density was obtained at frequencies up to 100 cps probably due to the very small amplitude at high frequencies Schnaffner has derived an empirical equation which relates the void ratio of a sand with frequency and amplitude
Kutzner (1962) has investigated the vibratory compaction of glass beads The experiments were carried out on a vibrating table at fre-
0 100 200 300 Frequency f (cps)
Fig 10 Compaction of Dry Coarse Sand After Schaffner (1962)
quencies which varied between 5 and 100 cps Test results are shown in Fig 11 At freshyquenc i es between 40 and 100 cps the density inshycreased rapidly as the acceleration approached 1 g A further incr ease of the acceleration did not cause a further increase of the density The large amplitudes combined with impacts at low frequencies may explain the relatively good compaction within this frequency range
~ 5mm
tSOo----= L-L--08LO L 10 L-------eo -oL10=---cUIJ (16(1 --oo--L--deg LfO - 1oo-shy
Acce Ieration 0 9
Fig 11 Influence of Acceleration on the Vibshyratory Compaction of Gl ass Beads After Kutzner (1962)
Selig (1963) has studied the effects of fre shyquency acceleration and surcharge load on the vibratory compaction of a uniform dry sand Test results indicated that the density increase was small (less than 1) after two minutes of vibrashytion The maximum density was obtained at an acceleration between 1 to 2 g The acceleration required to reach a certain density increased with increasing overburden pressure
Ortigosa (1968) and Whitman and Ortigosa (1968) found from vibratory compaction tests that the acceleration without surcharge should for a dry fine sand be at least 1 g The maximum density was obtained at 2 g When the acceleration was larger than 2 g the density decreased due to overcompaction With surcharge load the reshyquired acceleration was 1 to 3 g depending on the intensity of the overburden pressure Also Dunglas (1967) has investigated the vibratory compaction of sand Dunglas used a special test mould where water pressure was used as surcharge load
Forssblad (1965) found that the dry unit weight increased for a dry sand with increasing accelershyation up to 2 g and up to 3 g when the same sand was compacted partially or fully saturated The dry unit weight was approximately constant when the acceleration exceeded these limiting values No surcharge was used during the experishyments Forssblad also found that the dry unit weight of the compacted soil was independent of the direction of the vibrations
Laboratory compaction tests on sand crushed limestone and crushed quartzite have also been carried out by Gomes and Graves (1962) and by Honigs Valente and Graves (1963) These matershyials were compacted in a Proctor mould by a surface vibrator consisting of a loud- speaker attached to an aluminum plate The frequency could be var ied Test results indicated that the stress waves generated by the loud- speaker affected the compaction of the soil The maxishymum density occurred at some distance below the soil surface
Standardized vibratory compaction tests have been mentioned in the Chapter Elements of soil comshypaction The development of test procedures have been discussed by e g Kolbuszewski (1948) Burmister (1950) Pauls and Goode (1950) Felt (1958) Leussink and Kutzner (1962) Johnson and Sallberg (1962) and by Pettibone and Hardin (1964)
113
A vibrating table and a surcharge load or a vibrating tamper or hammer are used in the standshyardized vibratory test methods as illustrated in Fig 1 Pettibone and Hardin (1964) have found for the first mentioned method that- the density of the compacted soil at a frequency of 60 cps increased with increased amplitude of the vibrating table The increase in density was insignificant when the vibration time was longer than 6 minutes
IX DAMAGE CAUSED BY VIBRATIONS
Vibratory soil compactors as well as blasting pile driving and heavy road traffic may damage adjacent structures Surface waves generated by medium and heavy weight vibratory compactors can often by observed a~ large distances from the vibrator Since also vibrations of very low intensity can be felt by man the risk of damage to buildings and other structures is often exaggerated
Measurements indicate that the damage is mainly dependent on the maximum velocity of the vibrashytions (Fig 3) The risk of damaging adjacent buildings is small if this velocity is less than 03 to 10 cms as indicated by Scheelshyhaase (1962) Susstrunk (1959) Reiher and Soden (1961) and others The risk of damage is also dependent on the quality of the buildshying and the type of the foundation
Ground oscillations from vibratory compactors have been measured by Susstrunk (1959) and Forssblad (1965) An oscillation velocity of 10 cmsec was observed by Forssblad at a maximum distance of 55 m from a 33 ton tractor-shydrawn vibrating roller There were large variashytions of the ground oscillations due to differshyences in the soil conditions Additional inshyvestigations will be of interest
Due to large variations in the soil conditions in the quality of buildings and in size and type of the compactors it is difficult toesshytablish general rules about the risk of damage by vibratory compactors This risk must howshyever be carefully considered especially when heavy vibratory compactors are used
Buried pipes can also be damaged during vibrashytory compaction of trench-fills Minimum thickness of the soil layer above the pipes during compaction by vibration or tamping are given in German specifications (Forschungsgeshysellschaft filr das Strassenwesen 1964)
Retaining walls abutments and basement walls are sometimes damaged by the high lateral presshysures which develop during the compaction of the backfill Measurements indicate that these pressures can be several times larger than those used in the design (Sowers et al 1957 Broms1967and Brems and Ingelson 1967) Also the lateral earth pressures which remain after the compaction are often high and can approach the Rankine passive earth pressure close to the ground surface Further studies are recommended
X FURTHER RESEARCH
This report on the state-of-the-art of vibratory soil compaction indicates that there is need for further research in this field The followshying important points can be mentioned
1 Compaction Mechanism
Transmission of the vibrations from vibrator to underlying or surrounding soil Propagation of stress waves in the soil Damping propershyties of soils at different frequencies amplishytudes gradations water contents etc
2 Special Features of Vibratory Compaction
Rational relationships between suitable layer thickness and number of passes for different types of soils and vibratory compactors Crushing of soil and roelt particles during vibratory compaction Winter compaction of soil and rock fill
3 Compaction Control
Development of efficient and rapid methods for compaction control of thick layers and for soils containing large stones Development of improved laboratory compaction methods based on vibrations
4 Damage to Structures
Damage to buildings by surface oscillations produced by vibratory compactors Lateral earth pressures on retaining walls abutment and basement walls during and after vibratory comshypaction of soils
5 Technical Data
Recommendations about the technical data of vibratory compactors which should be included in specifications technical reports etc
114
REFERENCES United States Department of the Interior 783 pp
Abu- Wata T and Said A (1958) Compaction Tests of Dune Sand Fill under Water by Deep Internal Vibrat i on Transations 6th Int Congress on Large Dams New York pp 467 - 483
Aldous W M and Wills H W (1952) Field Equipment for Vibratory Compaction of Soils and Base Courses Civil Aeronautics Administration Techn Div Repor t No 186 15 pp Indianapolis
Baker G L and Moorhouse D C (1968) Sand Densification by a Heavy Vibratory Comshypactor ASCE Specialty Conference on Placement and Improvement of Soil Structures MIT Camshybridge 13 pp
Barkan D D (1960) Dynamics of Bases and Foundations McGraw- Hill Book Co New Yor k 434 pp
Bathelt U ( 1956) Das Arbeitsverhalten des Rlittelverdichters auf plastisch- elastischem Undergrund Bautechnik- Archiv No 12 Berlin Ernst and Sohn 52 pp
Bathelt U and Koch H W (1956) Zur Frage der Arbeits- und Wirkungsweise von Rilttelverdichtern Baumaschine und Bautechnik Vo l 3 No 12 pp 373- 377
Bernell L 1965) Properties of Frozen Granshyular Soils and Their Use in Dam Construction Proceedings 6th Int Conf Soil Mech and Found Engng Vol 2 Montreal pp 451- 455
Bernhard R K (1952a) Study on Static and Dynamic Compaction of Soils Proceedings Highway Research Board Vol 31 pp 563- 591
Bernhard R K (1952b) Dynamic Compaction of Soil Rutgers University Engineering Research Bulletin No 37 23 pp
Bernhard R K (1962) On Biaxial Stress Field on Non- Cohesive Soils Subjected to Vibrashytory Loads Symposium on Soil Dynamics Am Soc Testing Materials Special Technical Publication No 305 pp 3-12
Burmister D M ( 1950) Suggested Method of Test for Maximum and Minimum Densities of Granular Soils Procedures for Testing Soil s Am Soc Testing Materials pp 111- 113
Cassel F L (1956) Use of Vibration for the Deep Compaction of Granular Soil Civil Engineering and Public Works Review Vol 51 No 599 pp 532- 536
Christoffel H (1960) Prllfung und Forsshychungs- ergebnisse an Rllttelverdichtern Strassen- und Tiefbau Vol 14 No 2 pp 76-80
Converse J ( 1952) Vibration - Compaction of Sand California Institute of Technology January 1952
Converse F J ( 1954) Compaction of Sand at Resonant Frequency Symposium Dynamic Testing of Soils Am Soc Testing Materials Special Technical Publication No 156 pp 124- 137
Converse F J (1957) Compaction of Coheshysive Soils by Low Frequency Vibration Am Soc Testing Materials Special Technical Publication No 206
D Appolonia E (1954) Loose Sands Their Compaction by Vibroflotation Symposium Dynamic Testing of Soils Am Soc for Testing Materials Special Technical Publication No 156 pp 138-154
D Appolonia E Miller C E and Ware T M (1953) Sand Compaction by Vibroflotation Proc Am Soc Civil Engng Vol 79 Separate No 200 23 pp
DAppolonia E and Miller C E Jr (1955) Sand Compaction by Vibroflotation Transshyactions Amer Soc Civil Engineers Vol 120 pp 154- 168
DAppolonia D J Whitman R V and D Appolshyoni a E (1969) Sand Compaction with Vibrashytory Rollers Proc Am Soc Civil Engineers Soil Mech and Found D V Vol 95 No SM 1
Bernhard R K (1967) Stress and Wave Patterns in Soils Subjected to Dynamic Loads Cold Regions Research and Engineering Laboratory No 120 Hanover New Hampshire 52 pp
Bernhard R K and Finelli J (1954) Pilot Studies on Soil Dynamics Symposium Dynamic Testing Materials Am Soc Testing Materials Special Technical Publication No 156 pp 211- 253
Broms B (1967) Jordtryck mot oeftergivliga konstruktioner Swedish Geotechnical Institute Reprints and Preliminary Reports No 22 Stockholm 29 pp
Broms B and Ingelson I (1967) Resultat frlln matningar av jordtryck mot brolandf1ste Swedish Geotechnical Institute Reprints and Preliminary Reports No 11 Stockholm 16 pp
Bruzelius N G (1954) A Study of the Comshypaction of Soil Statens Vlginstitut Meddeshylande 87 Stockholm 69 pp
Bureau of Reclamation (1963) Earth Manual
Paper 6366 pp 263-284
Doscher H D (1968) Vibroflotation Journal Soil Mech and Found Engng Vol 7 No 3 New Delhi pp 365-385
Dunglas J (1967) Le compactage par vibration des milieux granuleux Travaux Vol 50 No 392 pp 495-503 No 393 pp 563- 572
Ephremidis C (1959) Die mathematische Erfassung der Vorgange bei der Rlittelverdichshytung von Boden VDI- Zeitschrift 101 p 277
Erlenbach L (1959) Verdichtung i m Erdbau Strassen- Asphal t - und Tiefbau- Technik Vol 12 No 1 pp 68- 72
Felt E J (1958) Laboratory Methods of Compacting Granular Materials Am Soc fo r Testing Materials Special Technical Publishycation No 239 pp 89- 108
Forschungsgesellschaft fu~ das Strassenwesen (1964) Merkblatt uber das Zufull en im
115
Schaeffer H (1958) Vberprilfung der Vershydichtungsleistung eines RUttelverdichters auf Kiestragschichten Strasse und Autobahn Vol 9 No 4 pp 145- 148
Schiffner H J (1962) Umlagerung Rolliger Erdstoffe durch Vibration Mitteilunger der Forschungsanstalt fur Schiffahrt Wasser- und Grundbau Berlin No 6
Scheelhaase K (1959) Bodenverdichtungsshyarbeiten mittels RUtteldruckverfahren beim Bau eines Kraftwerkes in Berlin- Spandau Baushymachine und Bautecknik Vol 6 No 12 pp 449- 451
Scheelhaase K (1962) Ergebnisse van Proshyberammungen unter Verwendung eines Vibrashytionsbaren und e ines Frei fallbaren Baushymaschine und Bautechnik Vol 9 No 11 pp 453-4 58
Scheidig A (1940) Speichergriindung auf Riittelfusspfaehlen Die Bautechnik Vol 18 No 25 pp 277-282
Schneider H (1938) Das Riitteldruckvershyfahren und seine Anwendung im Erd- und Betonshybau Beton und Eisen Vol 37 No 1 pp 1-7
Seed H B (1968) Landslides During Earthshyquakes due to Soil Liquefact i on Journal of the Soil Mechanics and Foundations Division ASCE Vol 94 No SM5 Paper 6110 pp 1055-1122
Seed H B and Lee K L (1966) Liqueshyfaction of Saturated Sands During Cycl ic Loading Journal of the Soil Mechanics and Foundations Division ASCE Vol 92 No SM6 Proc Paper 4972 pp 105- 134
Selig E T (1963) Effect of Vibration on Density of Sand Proc 2 Panamerican Conshyference on Soil Mechanics and Foundation Engishyneering Vol 1 pp 129-144
Siedenburg R (1957) Unwuchtschwingerreger mit Selbsttatiger Fortbewegung Die Bautecknik No 9
Sowers G C Robb B D Mullis C H and Glenn A J (1957) The Residual Lateral Pressures Produced by Compacting Soils Proc 4 Int Conf Soil Mechanics and Found EngVol 2 pp 243-247
Stewerman S (1939) A New Soil Compaction Device Engineering News-Record July 20 1939 pp 63- 64
Steuerman S (1948) Silt Consolidation by Vibrofl otation Proceedings 2nd Int Conf Soil Mechanics and Found Eng Vol 2 pp 297-301
Streck and Schmidtbauer (1954) Bodenverdichshytungsversuche mit Schwingungs- und RUttelvershydi chtern Strasse und Autobahn Vol 5 No 12 pp 400- 406
Sung T Y ( 1954) Vibrations in Semi- Infinshyite Solids Due to Periodic Surface Loading Symp Dynamic Testing Soils Am Soc Testing Materials Special Technical Publication No 156 pp 35-63
Silsstrunk A E 0959) Schwingungsmessungen Untersuchungen Uber das dynamische Verhalten des Strassendammes bei ungunstigen Baugrundshyverhaltnissen Strasse und Verkehr Vol 45 No 4 pp 11- 14
Taylor D W (1948) Fundamentals of Soil Mechanics John Wiley amp Sons New York 700 pp
Terzaghi K (1943) Theoretical Soil Mechshyanics John Wiley amp Sons New York 510 pp
Thorburn S and MacVicar R S L (1968) Soil Stabilization Employing Surface and Depth Vibrators The Structural Engineer Vol 46 No 10 pp 309- 316
Tope A R (1967) Technical Aspects of Vibrating Rollers in Relation to Performance Australian Road Research Vol 3 No 4 pp 56- 66
Tschebotarioff G P (1946) Vi bratory Impact Compaction of Soils Am Road Builders Association Technical Bullet in No 109 pp 12 - 31
Tschebotarioff G P and McAlpin G W (1947) The Effect of Vibratory and Slow Repetitional Forces on the Bearing Properties of Soils Civil Aeronautics Administration Technical Development Report No 57 Washington D C 70 pp
Tynan A E and Morris P 0 (1968) The Evaluation of a Range of Vibrating Rollers in Compacting Road Materials Australian Road Research Vol 3 No 5 pp 7-53 Viering G (1965) The Vibrational Behavior of Soil in Relation to its Properties Proc 5th Int Conf on Soil Mechanics and Found Eng Vol 1 pp 547-552
Watanabe T (1963) Compaction of Sandy Ground by Vibration-Vibroflotation and Related Problems Proceedings 2 Asian Regional Conf Soil Mechanics and Found Engng Vol 1 Tokyo pp 406- 410
Weber G ( 1965) Untersuchung Uber Vorgange bei der statischen und dynamischen Verdichtung des Bodens Curt-Risch- Institut fur Schwingshyungs- und Messtechnik der T H Hannover Mitteilunger No 5 Hannover 97 pp
Whitman R V and Ortigosa P (1968) Densishyfication of Sand by Vertical Vibrations MIT Technical Paper No T68-5 7 pp
Weiss H (1956) Verdichtung grobk5rnigen SchUttmaterials mit einem schweren Ruttelshyverdichter Baumaschine Lind Bautechnik Vol 3 Heft 6
Wenner C G and Saare E (1954) Grundshyf6rstlrkning genom vibrering under vatten Byggmastaren Vol 33 No Bll pp 201- 210
Whiffin A C (1954) The Pressures Generat~ in Soil by Compaction Equipment Symp Dynamic Testing Soils Am Soc Testing Materials Special Technical Publication No 156 pp 186-210
Wiklund J A (1960) Synpunkter pa packning och sittning vid Arlandabygget 11 Svenska Vagforeningens Tidskrift Vol 47 No 5 pp 203-206
118
STATENS GEOTEKNISKA INSTITUT Swedish Geotechnical Institute
SARTRYCK OCH PRELIMINARA RAPPORTER Reprints and preliminary reports
Pris kr (Sw crs)
No
1 Views on the Stability of Clay Slopes J Osterman 1960 Out of print
2 Aspects on Some Problems of Geotechnical Chemistry R Soderblom
1960
3 Contributions to the Fifth International Conference on Soil Mechanics and Foundation Engineering Paris 1961 Part I
1961
1 Research on the Texture of Granular Masses T Kalstenius amp W Bergau
2 Relationship between Apparent Angle of Friction with Effective Stresses as Parameters - in Drained and in Consolidated-Undrained Triaxial Tests on Satushyrated Clay Normally-Consolidated Clay S Odenstad
3 Development of two Modern Continuous Sounding Meshythods T Kallstenius
4 In Situ Determination of Horizontal Ground Movements T Kalstenius amp W Bergau
4 Contributions to the Fifth International Conference on Soil Mechanics and Foundation Engineering Paris 1961 Part II
1961 5-
Suggested Improvements in the Liquid Limit Test with Reference to Flow Properties of Remoulded Clays R Karlsson
5 On Cohesive Soils and Their Flow Properties R Karlsson 1963 10-
6 Erosion Problems from Different Aspects 1964 10-
1 Unorthodox Thoughts about Filter Criteria W Kjellman
2 Fiters as Protection against Erosion P A Hedar
3 Stability of Armour Layer of Uniform Stones in Running Water S Andersson
4 Some Laboratory Experiments on the Dispersion and Erosion of Clay Mnteriafs R SOderblom
7 Settlement Studies of Clay 1964 10-
1 Influence of Lateral Movement in Clay Upon Settleshyments in Some Test Areas J Osterman amp G Lindskog
2 Consolidation Tests on Clay Subjected and Thawing J G Stuart
to Freezing
8 Studies on the Properties and J Osterman
Formation of Quick Clays 1965 5-
9 Ber8lming B Broms
av p8ar vid olika belastningsforhSlanden 1965 30 -
1 Berakningsmetoder for sidobelastade p8lar
2 Brottlast for snett beastade pAlar
3 Ber8kning av vertikaa pftlars barf6rm8ga
10 Triaxial Tests on Thin-Walled Tubular Samples 1965 5-
1 Effects of Rotation of the Principal Stress Axes and of the Intermediate Principal Stress on the Shear Strength B Broms amp A 0 Casbarian
2 Analysis of the Triaxial B Broms amp A K Jamal
Test-Cohesionless Soils
11 Nftgot om svensk geoteknisk forskning B Broms 1966 5-
12 88rf6rmftga hos pftlar slagna mot sliintberg B Broms 1966 15-
13 F0rankring av ledningar i jord B Broms amp 0 Orrje 1966 5-
14 Ultrasonic Dispersion of Clay Suspensions R Pusch 1966 5-
15 Investigation of Clay Sections R Pusch
Microstructure by Using Ultra-Thin 1966 10 -
16 Stability of Bennermark
Clay at Vertical Openings B Broms amp H 1967 10 -
Pris kr No (Sw crs)
17 Orn palslagning och palbiirighet 1967 5-1 Dragsprickor i armerade betongpalar S Sahlin
2 Sprickbildning och utmattning vid slagning av armeshyrade modellpalar av belong BmiddotG Heifers
3 88righet hos slantberg vid statisk belastning av bergshyspets Resultat av modellf6rs0k S-E Rehnman
4 Negativ mantelfriktion B H Fellenius
5 Grundl8ggning pa korta pi3lar Redog0relse for en f6rshys6ksserie pa NABO-palar G Fjekner
6 Krokiga pftlars b8rf0rmAga B Brems
18 Palgruppers biirformaga B Broms 1967 10-
19 Orn stoppslagning av stodpalar L Hellman 1967 5-
20 Contributions to the First Congress of the International 1967 5 -Society of Rock Mechanics Lisbon 1966
1 A Note on Strength Properties of Rock B Broms
2 Tensile Strength of Rock Materials B Broms
21 Recent Quick-Clay Studies 1967 10-1 Recent Quick-Clay Studies an Introduction R Pusch
2 Chemical Aspects of Quick-Clay Formation R Soderblom
3 Quick-Clay Microstructure R Pusch
22 Jordtryck vid friktionsmaterial 1967 30-
1 Resultat frEm matning av jordtryck mot brolandfilste B Broms amp I Ingeson
2 Jordtryck mot oeftergivliga konstruktioner B Broms
3 Meted f0r berakning av sambandet mellan jordtryck och deformation hos framst st0dmurar och f0rankringsshyplattor i friktionsmaterial B Broms
4 Berakning av stolpfundament B Broms
23 Contributions to the Geotechnical Conference on Shear 1968 10 -Strength Properties of Natural Soils and Rocks Oslo 1967
1 Effective Angle of Friction for a Normally Consolidated Clay R Brink
2 Shear Strength Parameters and Microstructure Characshyteristics of a Quick Clay of Extremely High Water Content R Karlsson amp R Pusch
3 Ratio cp in Relation to Liquid Limit and Plasticity Index with Special Reference to Swedish Clays R Karlsson amp L Viberg
24 A Technique for Investigation of Clay Microstructure R 1968 22 -Pusch
25 A New Settlement Gauge Pile Driving Effects and Pile 1968 10-Resistance Measurements
1 New Method of Measuring in-situ Settlements U Bergdah amp B Broms
2 Effects of Pile Driving on Soil Properties 0 Orrje amp B Broms
3 End Bearing and Skin Friction Resistance of Piles B Broms amp L Hellman
26 sattningar vid vagbyggnad 1968 20-
F0redrag vid Nordiska Vagtekniska F0rbundets konferens I Voksenasen Oslo 25-26 mars 1968
1 Geotekniska unders0kningar vld bed6mning av s8ttshyningar B Broms
2 Teknisk-ekonomisk 0versikt Over anliiggningsmetoder for reducering av sattningar i vagar A Ekstrom
3 sattning av verkstadsbyggnad I Stenungsund uppford p8 normalkonsoliderad era B Broms amp O Orrje
27 B8rf6rm8ga hos sliintberg vid statisk belastning av 1968 15-bergspets Resultat frAn modellf6rs6k S-E Rehnman
No
28 Bidrag till Nordiska Geoteknikerm6tet 1 GOteborg den 5-7 september 1968
1 Nordiskt geotekniskt samarbete och nordiska geotekshynikerm6ten N Flodin
1968
Pris kr (Sw crs) 15-
2 Nflgra resultat av belastningsf6rs6k pl lerterrang speciellt med avseende pa sekunctar konsolidering G Lindskog
3 sattningar vid grundl8ggning med platter pA moranshylera i Lund S Hansbo H Bennermark amp U Kihfbom
4 Stabilitetsf6rb8ttrande spontkonstruktion ningar 0 Wager
for bankfyllshy
5 Grundvattenproblem I Stockholms city G Lindskog amp U Bergdahl
6 Aktuell svensk geoteknisk forskning B Broms
29 Classification of Soils with Reference to Compaction 8 Broms amp L Forssblad
1968 5-
30 Flygbildstolkning som hjiilpmedel vid oversiktliga grundundersOkningar
1969 10-
1 Flygbildstolkning f6r jordartsbestamning vid samh811sshyplanering 1-2 U Kihlblom L Viberg amp A Heiner
2 ldentifiering av berg och bed6mnlng av jorddjup med hjalp av flygbilder U Kihlblom
31 Nordisk sonderingsmote i Stockholm den 5-6 oktober 1967 FOredrag och diskussioner
1969 30-
32 Contributions to the 3rd Budapest Conference on Soil Mechanics and Foundation Engineering Budapest 1968
1969 10-
1 Swedish Tie-Back Systems for Sheet Pile Walls B Brems
2 Stability of Cohesive Soils behind Vertical Openings in Sheet Pile Walls Analysis of a Recent Failure B Broms amp H Bennermark
33 Seismikdag 1969 Symposium anordnat av Svenska Geotek-niska FOreningen den 22 april 1969
1970 20 -
34 NAgot om geotekniken i Sverige samt dess roll i plane-rings- och byggprocessen NAgra debattinl8gg och allm8nna artiklar
1970 15 -
T Kallstenius 1 Geoteknikern i det specialiserade samhallet B Broms 2 Diskussionsinl8gg vid konferens om geovetenskaperna
7 mars 1969 3 Geoteknik i Sverige
denser - utveckling och utvecklingstenshy
4 Geotekniska unders6kningar och grundl8ggningsmetoshyder
5 Grundlaggning pA platter - en allm8n Oversikt
35 Piles - a New Force Gauge and Bearing Capacity Cacu-lations
1970 10 -
1 New Pile Force Gauge for Accurate Measurements of Pile Behavior during and Following Driving B Fellenius amp Th Haagen
2 Methods of Calculating the city of Piles A Summary B Broms
Ultimate Bearing Capashy
36 P8lslagning Materialegenskaper hos berg och betong 1970 10 -
1 Bergets b8rf6rmAga vid punktbelastning s-E Rehnman
2 Deformationsegenskaper hos slagna betongpAlar B Fellenius amp T Eriksson
37 Jordtryck mot grundmurar 1970 10-
1 Jordtryck mot grundmurar av Lecablock s-E Rehnman amp B Brems
2 Ber8kning B Broms
av jordtryck met k8llarv8ggar
38 Provtagningsdag 1969 Symposium anordnat av Geotekniska FOreningen den 28 oktober 1969
Svenska 1970 25 -
No
39 Mor8ndag 1969 Symposium anordnat av Svenska 1970 Geotekniska F6reningen den 3 december 1969
40 Stability and Strengthening of Rock Tunnels in Scandinavia 1971 1 Correlation of Seismic Refraction Velocities and Rock
Support Requirements in Swedish Tunnels 0 S Cecil 2 Problems with Swelling Clays in Norwegian Undershy
ground Constructions in Hard-Rocks R Selmer-Olsen
41 Stalp8lars biirf6rm8ga Resultat av faltfOrsOk med 18tta 1971 slagdon G Fjefkner
42 Contributions to the Seventh International Conference on 1971 Soil Mechanics and Foundation Engineering Mexico 1969
Pris kr (Sw crs)
25-
25-
30-
15-

I
LONG PILES IN CLAY
The load in each cell is measured separately by a system of vibrating wire gauges This makes it possible to determine the total axial force and b~nding moment in the test pile at the level of the force gauge The O 4 m long force gauges were corinected to a pile in the same manner as the pile segments The pile force gauge was designed to resist the stress conditions which develop during the driving Laboratory and field teats have indishycated that the maximUin error in the imiddotecorded forces ia less than 2 of the design load The gauges were designed to resist a tension load of 50 tons and a compression load of 150 tons These values can however be exceeded three times withshyout impairing the function of the gauges (Fellenius and Haagen 1969)
INSTRUMENTATION OF SOIL
Piezometers and settlement gauges were installed two months prior to the driving of the pilea All piezometers but one were type SGI which ace providshyed with a closed oil system Pore water pressures are read directly on a manometer (Kallstenius md Wallgren 1956) To measure the pore pressure in the permeable bottom layers an open pipe witn a filter tip was used Each settlement gauge consisted of a number of Z m sections of flexible steel spring reinforced rubber hoses with 32 mm inside diashymeter The steel spring reinforcement allowed the hose to change its length axially but prevented the hose from collapsing when subjected to lateral earth pressure The hose sections were connected by brass rings The settlement gauges were placed vertically in pre-drilled holes in the soil The flexible settlement gauges and the brass rings followed the moVements of the soil It was possible to determine the settlements of the soil from the location of the brass rings vlith respect to a refershyence point at the ground surface by lowering a plumb bob inside the hose When the plumb bob came in contact with the brass rings an electrical circuit was closed which could be observed at the ground surface With this method it was possible to determine the settlements every 2 0 m with an accuracy ofplusmn 2 mm (Wager 1969)
Two settlement gauges were installed next to each pile An additional gauge was installed at some distance away from the pile The gauges were brought down to a depth of 36 m The location of the gauges are shoWTI in Fig 3 The various gauges could not be installed absolutely vertically Howshyever the deviations were small down to a depth of 10 m
Three piezometers were installed next to the preshydetermined pile locations at the depths 9 0 22 3 and 30 5 m below the ground surface One additional piezometer was installed at a depth of 28 6 m some distance aw~y from the two pile At about the same distance from the piles an open pipe with a filter tip was installed at a depth of 45 0 m
Wl W2 ~Q-
PI ~ Pil [ p E IE3 ~2smI
0
0
W3 Pvf1E P~t 2E f oltgtmiddot PLAN 1-JllITI_ gtI - __pvt 1
PI P Il
Id Pvt 3 at Pl Pil10
M3 M7
bi Pvt 2 ot PT Pil
25 bi Pvt 2 E
M2 cl Pvt 1 ot PIPII M6
ij Depth of W1 W2
MS lI Pvt1E open pipe)
gtshy~
u
6 zi M4lt(sst u
601 fi Pile joint
bull =Pile - force gouge (Ml
DEPTH bi Piezometer (Pvt
lJ Settlement gouge (W)
Fig 3 Location of piles and instrumentation
BEHAVIOUR DURING AND IMMEDIATELY AFTER DRIVING
The driving of the two test piles caused movements in the soil These were measured close to the two piles and at some distance away from the piles Also high excess pore pressures were measured
Settlements The driving caused the ground surface to heave 20 mm close to the pile as shown in Fig 4 The heave decreased however with increasing
95
FELL ENUS and BR OMS
depth SCttkrnc-nts were measured belOV a depth of S to 6 m The maximum settlement (50 mm) was mcmiddotlttsurcd close to pile PII at a depth of 11 m The obstmiddotrimiddotccl heave was caused by upward displacements of tlH soil above the pile tip and the observed settleshyments ]Hobably by downwards displacements at and btgtlow the pile tip
W1 AT PI W3 JC laquol Sil SpoundTllEHElff 1E 20 JO 0
)
U I I LJ
~ J-
~J Rocdng l ond en takm dring dtmng pllo PI Oltld p_n ~ 11d~1 7 oro lltgtkor bofoo drorg ~lo PQbullobullz R1Ddu11 1 ond15 ltlrbull toaon Gfer dtvin~ p1
~g lloltgtdn~ ll ~ bktn aUor ro mon1h
~~ w ~-alt DEPTH
Fig 4 Vertical movements in the clay during and after driving
The coritinued driving caused the soil to heave about 10 to 15 mm At gauge WIII located 5 and 11 m
away from the test piles the driving caused a heave or 5 mm at the ground surface The heave deshycreased howevermiddot with depth The displacements of the soil shown in Fig 4 have been evaluated from the assumption that the soil at the lowest measuring point did not move The reported values thus represent relative movements within the clay layer A precision levelling before and after the driving indicated however that the lowest measured point of gauge WI had settled 9 mm The corresponding settlements of gauges WI and WIII were 7 mm and 5 mm respectively These settlements are primashyrily caused by compaction of the silt and sand layers below the clay The two test piles were driven 13 and 15 m into the bottom layers
Pore Water Pressure The pore water pressures measured by all piezometers corresponded prior to the- driving of the two test piles to a ground water table at the ground The driving caused however a large increase of the pore water pressure at the
gauges located at a depth of 20 3 m below the ground surface The pore pressure increase at the gauges located at 30 5 m depth was small since these gauges were located several meters away from the two piles Also the pore pressure increase observed at a depth of 9 0 m was small All piezometers have aftershywards been checked and are functioning properly The excess pore pressure caused by the pile driving and the dissipation of the excess pore pressures with time are shown in Fig 5 for the two gauges located close to piles PI and PII at a depth of 20 3 m The maximum total pore pressure was 40 tonsm2 at this level The correspondin~ total vertical overshyburden pressure is 32 9 tonsm2 at the same level Thus the measured pore pressure exceeded locally the total overburden pressure by 20
Gauge depth 223 meter Original pore pressure 221 lonsrr Gauge Pvl 2 at pile PI and Pll
Fig 5 Excess pore pressure caused by pile driving and its dissipation with time
Forces and bending moments The force gauges in the piles were read each time a new pile segment was added
Measurements indicate that the force in the two piles immediately after the driving was roughly equal to or slightly less than the weight of the pile above the gauge Thus the driving did not cause any axial forces to be locked11 into the piles
The bending moments in the straight pile PI were small These varied between O 4 and 1 3 tonm Larger values were measured in the bent pile PII Gauge MS located 12 m from the pile tip at the boundary between the clay and the underlaying silt and sand indicated a bending moment of 3 2 tonm This bending moment corresponds to about 35 of the failure value The corresponding radius of curvature was 170 m over the length of the gauge
96
--- --
LONG PILES IN Cl A Y
Gauges M6 and M7 indicated a bending moment of 0 9 and 2 4 tonm respectively The corresponding radii were 220 and 190 meters
BEHAVIOUR AFTER DRIVING
The driving disturbed the clay around the piles It was anticipated that reconsolidation of the clay would cause settlementgt of the soil and drag forces in the piles To study this phenomenon the various instruments were read regularly during the five months period which followed the driving
Settlements The settlement gauges indicated that the movements of the soil were small The recordshyed settlements varied between one and three millishymeters
Pore water pressure High excess pore water pressures developed around the driven pile in the clay as indicated by the gauges located at a depth of 20 3 m The excess pore watta1 pressures dissipated with time No excess pore water pressures remained 150 days after the driving as can be seen in Fig 5
Forces and bending mvments The axial force distribution with time is shown in Fig 6 At first the axial load in the two test piles increased rapidly at the different measuring levels Two or three weeks after the driving the rate of the load increase slowed down After about eight weeks the load inshycrease was very small at the upper levels
PI Pll
= ltMlt --
t-5 bulld
~ s
MS --- I _----
----=-middotn-b l ~__------- v __ bull -~- I~--~
7 1--~- -r-_= M
1
c -bull Ml-~
- I jJ
Fig 6 Recorded forces in piles PI and PII
In Fig 7 the m~asured loads have been plotted at different time intervals after the driving The dotted line in this figure represents the WPight of the pile The line marked O represents the load distribution immediately after the driving It can be seen from Fig 7 that the axial load in both piles was less than theweight of the pile immediately after the driving down to a depth of nearly 40 m The load in the piles increased with time and 144
97
days after the driving the pile load exceeded the weight of the pile by 25 to 30 tons at the level of the interface between the clay layers and the undershylaying silt and clay layer This load is still inshycreasing five months after the driving Gauge M 4 in pile PII indicates that most of the load due to negative skin friction along the pile is resisted as positive skin friction in the underlaying silt and sand layers The average skin friction can be calculated from the load distributions It is proportional to the load difference between adjacent levels In Fig 8 is shown the average skin friction resistance for the two piles The points which on the same occasion represent the average skin friction have been connected The measurements indicate that the sltin friction resistance increases approximatelv linearly from zero at the ground surface to 14 tm2
at a depth of 40 m The skin friction resistance below this depth was positive The negative skin friction corresponds to 17 of the undrained shear strength of the clay or to 5 of the effective overshyburden pressure of the soil
PI Pll
---Whlclplbull
-- too~ dtribbulltbullon
M Pile-lore 1r1u~o
61
iho iurbull rbullftrs o 11 do) orto
-~----
-r 1 S 1530 63100 14ay~M5 I I I I
m
Fig 7 Vertical distribution of load in the piles at different times after driving
The recorded bending moments increased after the driving However the increase was small The bending moment at gauge MS which immediately after the driving recorded 3 2 tonm increased by 12 to 3 6 tonm five months after the driving This relative increase was the largest recorded by any of the gauges
FELLENIUS and BRO MS
PI PU
M Plo-lo gugt
0r11~middot~ Tho flure rofbull to
~ ~ut~~~~~ltgtylt
P05JTIVE SKlI FIIICIION bull IIEGATIVE SKIii FRICTION
S~CA-LE_ _----t---~c-------e-- tonoimZ +10 +0 -10 -20
Fig 8 Calcmiddotulated average skin friction at different times after driving
CONCLUSO~S
The test results indicate that negative skin friction can be caused by the remoulding of the clay around driven piles and the subsequent reconsolidation of the soil even if the settlements of the soil are very sinall The measured negative skin friction after
a period of five months corresponded to 17 of the average undrained shear strength of the clay or to 5 of the average effective overburden pressure The resulting axial forces in the piles were resisted by positive friction in the silt and sand layers at the lower parts of the piles Considerably higher values of the skin friction resistance will undoubtly develop when a fill is placed over the area
ACKNOWLEDGEMENTS
This project which is carried out in co- operation with the A Johnson Institute for Industrial Research has been supported financially by the National Council of Building Research (Statens Rild poundcir Byggnadsforskning)
REFERENCES
Fellenius B H amp Haagen T 1969 11A New Pile Force Gauge 11 (To be published)
Kallstenius T amp Bergau W 1961 1In Situ Determination of Horizontal Ground Moveshyments11 Proc 5th Int Conf on Soil Mech a Found Eng Paris Vol I pp 481-485
5allstenius T amp Wallgren A 1956 11 Pore Water Pressure Measurements in Field Investigation Swedish Geotech Inst Stockholm Proc No 13 58 p
Wager O 1969 11 A New Device for Measuring Vertical Distribution of Settlements 11 (To be published)
98
-----
---
-------- -
Contribution to the discussion in the Specialty Session on Negative Skin Friction and Settlements of Piled Foundations
Negative Skin Friction for Long Piles Driven in Clay
by Bengt H FeUenius Swedish Geotechnical Institute Stockholm Sweden
The aim of this discussion is to inform about further developments of the test program that is presented in the paper 11 Negative Skin Fri~tion for Long Piles Driven in Clay11 by myself and Dr Bengt B Broms
The paper shows that driving of displacement type piles in clay causes remoulding of the surrounding clay and excess pore pressures The excess pore pressures dissipated after about 150 days The recorded further settlements 150 days after the pile driving were within the accuracy of the settlement gauges i e 1 mm
The loads in the piles increased almost linearily with time (Fig 1) There is however a slight decrease of the loading rate The loads at the bottom of the clay layer were 52 and 56 tons in piles P I and P II respectively 420 days afterthe installation Fig 2 shows the load distribution in the piles Gauge M 4 in pile P II indicates that the load is resisted by positive friction in the silt and sand layers below the clay Of the 46 tons which has been the load increase since the installation only 10 tons reached the pile tip
The negative friction after 420 days corresponds to 28 of the average original undrained shear strength of the clay or to 9 of the average effective overshyburden pressure
FORCE tonbull
~ ~00~
oo-- M~ ~
lt-- ~
-~------- _ - _----
In the next phase of this investigation which will begin smiddot10rtly a dead load of 80 tons will be placed on each test pile In phase three (after further six or ten months) a 2 m high gravel fill will be placed around the two test piles over an area 40 by 40 meters The results of the various test phases will be published by the Swedish Geotechnical Institute
LEGEND ---WbullM o pio ( bull1 -- Ld dltt~von
1-1 Plo-lmo10i Pbull 1gt1bull rololaquo b n~ u of ltWtbull otlor drn
bull
-1 - I
7 bull
Fig 2 Vertical distribution of load at different times after driving
- --- ~------middot--- bull-- __-_-___ I-______ [____ _bull---- C------------------~-----------l---_j-____j_____j______j__ OJYS AFTER - 50 lOO 150 200 250 lOO 350 lOO 511 $00 DRIVING
Fig Recorded loads in piles P I and P II
Contribution to the discussion in the Specialty Session on Negative Skin Friction and Settlements of Piled Foundations
Design of Pile Groups middotwith Respect to Negative Skin Friction
by Bengt B Brems Swedish Geotechnical Institute Stockholtn Sweden
This review is concerned with the methods which are used in Sweden to design pile groups with respect to negative skin friction Measurements have shown that drag forces negative skin friction) develop along single piles or pile groups when the soil settles with respect to the piles The settlement of the soil may be caused by the placement of a fill around the piles a lowering of the ground water table or by remolding of the soil during the driving The load increase due to negative skin friction often approaches the allowshyable load on the pile when the pile length exceeds 20 to 30 m The negative skin friction can be large even if the settlements are small (a few millimeters) Three different cases are gcinerally recognized as illustrated in Figs ia ib and 1c
Fill ~ E bull cV ~middot II I II =-- ------- ---
Clay I --1 -----~- ~~aJlo51 I _cru19 _cnu9sc I
I I I I
~_permoler ~ aroo
(o)Olso I (t Cose II (cJ Caso m
Fig i Calculation of negative skin friction
Case 1 The piles in the pile group shown in Fig ia are assumed to be widely spaced The height of the fill placed around the pile group or the lowering of the ground water table is large enough to develop the maximum skin friction along all the piles in the pile group It is assumed furthermore that the piles are point bearing and that the pile points do not move when the load in the piles is increased by negative skin friction This is generally the case in Sweden where most piles are driven to rock The neutral point is often assumed to be located close to the pile point since the compression of the pile is generally neglected The negative skin friction resistance will be overestimated by this method if the settlements are small or the pile points move
There are two different methods to calculate the negative skin friction which is assumed to act along the full length of the pile The first method is generally used when the liquid limit of the soil is less than about 50 The negative skin friction c is according to this method calculated from the neg equation cneg = a (f J where a 11 is a coefficient and
ltfi is the effective overburden pressure includingV
the weight of the fill In this case it is thus assumed that negative skin friction is propertional to the effective overburden pressure (f i The values of the coefficient a1 which vary befween O 2 to 0 3 are based on test results reported by Johannesen and Bjerrum (1965) These values have 1e_~n derived from pile load tests in a clay with a relashytively low cp-ratio and a low liquid limit
In the second method which is often used when the liquid limit of the clay exceeds approximately 50 it is assumed that the negative skin friction c is equal to the adhesion of the surrounding neg soil with respect to the pile surface The values which are used to calculate the negative skin friction are generally the same as those which are used to calculate the bearing capacity of single piles in clay as indicated by the following table
Table I Evaluation of the unit skin friction resistance ca
(a) cult 0 5 kpcm2
Skin-friction resistance C a
Steel piles 05 C u
Concrete piles 08 C u
Timber piles 10 C u
(b) cgt 0 5 kpcm2
2Steel piles 0 1 kpcm Concrete piles o 3 Timber piles 05
One may question if the same values of the unit adhesions should be used to calculate the negative skin friction as those used in the calculations of the bearing capacity The maximum value of the adhesion governs the negative skin-friction resistance while the minimum value is of interest when the bearing capacity is calculated It may be argued that all piles which are affectetj by negashytive skin friction smiddothould be designed to resist a drag load which corresponds to the full undrained shear strength of the soil as measured by e g vane tests unconfined compression tests or fallshycone tests instead of a reduced value which correshysponds to a lower limit of the adhesion
Case II It is assumed in Fig 1b that the piles are closely spaced and that the height of the fill or the lowering of the ground water table are sufficiently large to mobilize the full skin friction resistance or the full shear strength of the soil along the perimeter area of the pile group The average skin friction cneg piobably will be less than the undrained shear
strength of the soil The perimeter of the pile group partly follows the pile surfaces The undrained shear strength of the soil is generally used for the perimeter area which follows the undisturbed soil while reduced values are used for the area which follows the surfaces of the piles The pile group carries also the weight of the fill which is located immediately above the piles or the increase of the boyant weight of th_e soil within the pile group when the ground water table has been lowered It is thus assumed in the calculations that the vertical effective stress in the soil within the- pile group will not at the level of the rock surface be affected by a lowering of the ground water table The total drag force is as~umed to be equal to the sum of the negative skin friction along the perimeter area and the weight of the fill within the pile group This total drag force is distributed equally among all the piles in the pile group It may however be argued that the change of the boyant weight of the soil within the pile group should not be included in the calculations since the total weight of the soil is not affected This is frequently done by many designers
Case III The piles in Fig 1c are relatively closely spaced and the height of the fill or the lowering of the ground water table is moderate to small In this case it is assumed that the pile group carries a load which corresponds to the weight of the fill within the area indicated in Fig 1c The sides of the inverted truncated soil cone have a slope of 1 3 to 1 5 The proceedures used by different designers differ due to lack of test data If settlem~nts are caused by a lowering of the ground water table it is often assumed that the total drag force corresponds to the change of the boyant weight of the soil below the area indicated in Fig 1c The pile group will in this case carry a load which is equal to the weight of a column of water with a height equal to a lowering of the ground water table
It should be pointed out that the available test data are extremely limited that measurements primarily have been made on single piles and that the settleshyments which have occured around the instrumented piles have been relatively large When additional test data become available it is likely that the presently (1969) used design methods will be changed It should however also be pointed out that these design methods generally do not take illto account the increase of negative skin friction which is caused by remoulding of the soil during driving middotThis inshycrease of the pile loads can be very large in Cases II and III For these cases the calculated negative skin friction is normally moderate
There are several methods to calculate the allowshyable load for a pile group allow as indicated below
group0 group ult Qneg
( I)Qallow F
Qgroup group ult
0 --p-- Qneg (2)allow
In the first case the safety factor Fis -applied on both the calculated ultimate bearing capacity of the pile group as well as on the negative skin friction Qnegmiddot In the second case the factor of safety is
only applied on the calculated ultimate capacity The first method which is normally used in Sweden gives a higher allowable load than the second method
The consequenses of exceeding the ultimate capacity of the pile group are often not serious since excessive pile loads caused by the negative skin friction will generally not cause collapse of the supported strucshyture If a pile group settles then the negative skin friction changes into positive skin friction which will contribute to the bearing capacity of the pile group Thus a relatively low safety factor can be used with respect to negative skin friction
References
Johannessen IJ and Bjerrum L (1965) Measureshyment of the compression of a steel pile to rock due to the settlement of the surrounding clay Proc 6 Int Conpound Soil Mech a Found Engng Vol Z pp 261-264
NEGATIVE SKIN FRICTION ON PILES IN CLAY-A LITERATURE SURVEY
Bengt H Fellenius Swedish Geotechnical Institute Stockholm Sweden
Introduction
In 1965 lhe Axel Johnson Institute for Industrial Research in cooperation with the Swedish Geotechnishycal Institute initiated an investigation on negative skin friction on piles in clay The work is supported financially by the Swedish Council for Building Research
The first step in this investigation was a literature survey This article is a survey of papers which have been published on negative skin friction in clay up to the end of 1968
Contents
1 Statement of the problem
2 Previous investigations
2 1 Structural damage caused by drag forces
2 2 Cases where drag forces have been
considered
2 3 Research on drag forces on piles
2 4 Comments on section 2
3 Calculation of drag forces
3 1 Terzaghi and Peck
3 2 Zeevaert
3 3 Buisson Ahu and Habib
34 Elmasry
3 5 Johannessen and Bjerrum
3 6 Brinch Hansen
3 7 Others
4 Comments and conclusions
5 Literature index
6 List of symbols
1 Statement of the problem
When the soil around a pile settles shear forces are induced along the pile surface and the load in the pile is increased Usually this phenomenon is called negative skin friction In cohesive materials the terms 11 negative skin cohesion and 1negative skin adhesion 11 are sometimes used
2 Previous investigations
Under this heading some cases where negative skin friction has caused structural damage (2 1) are deshyscribed as well as cases where negative skinfriction has been taken into account in the design (2 2) Also the research on drag forces in piles is reviewed (2 3)
2 _Structural damag~ caused 1Y dras-forces
McKay_(1938Jx) describes how a fill around a buildshying which had been founded on concrete piles caused large settlements around the piles The piles were not designed to carry the resulting drag forces and the piles failed No calculations were given by McKay McKay also describes how piles for a river quay in 10 m depth of water were damaged by drag forces caused by a fill of a silty material which had been deposited around the piles Negative skin friction developed both in the silty fill and in the underlying materials through which the piles had been driven
Florentin and l~Heriteau (1948~ describe a case where concrete piles with 0 8 m diameter were driven through a 4 m thick fill and through undershylying layers of very soft clay into a dense sand sublayer The piles settled 30 cm in three yearsmiddot which according to Florentin and lHeriteau 11 can only be explained by negative skin friction on the piles 11 The settlement of the piles was indirectlybull
caused by unsatisfactory pile driving The settleshyment stopped when the pile tips reached the undershylying dense sand
Moore (1949) describes a case where a wooden pile had been driven through a stony fill and underlying compressible soils down tc firm layer The thickshyness of the fill was 13 m and the compressible soils
x) See literature index in section middot5
2
consisted of a 9 m thick layer of mud and 6 m of clay The settlements of the fill and of the compressible layers caused drag forces of such magnitude that the pile pulled loose from the supported structure The design pile load had been determined from i dynamic pile formula The pile might have been damaged during the driving) The drag forces as estimated by Moore were 170 tons for the fill and 12 tons for the mud and clay
Milner (1957) describes a tunnel which was founded on 40 cm diameter cast-in-place concrete piles The piles were driven through 8 m of soft clay into an underlying layer of mica An 8 m thick fill caused settlements in the clay which resulted in estimated drag forces of 80 tons Because of this additional load the piles were pushed down into the mica and the tunnel walls cracked
lt-pp_ (~i~~)_ relates in a letter that settlements of about 2 m caused drag forces of such magnitude around unreinforced concrete piles under the floor of a hangar building at La Guardia Airport New York that some piles were pulled loose from the floor Attempts were made at La Guardia to measshyure the drag force by measuring the force that was required to prevent the pile from sinking When this force reached 30 tons the pile failed in tension
Further examples are given by Chellis (1951)
2 2_ Cases_ where drag forces have been considered in the desipoundn
Golder and 5pence t1960) mention that piles for a bridge where large drag forces were expected were covered with half an inch thick layer of asphalh The piles were put down in predrilled holes in the ground to protect the asphalt
Resendiz_l1964 a[ describes a case where concrete piles of variable diameter were used one upper part (~ 35 cm of about 30 m length) and one lower part (lt6 20 cm of about 3 m length) The piles were driven to a firm sand layer The allowable pile load was the estimated ultimate bearing capacity of the pile tip i e the safety factor against soil failure was equal to 1 When drag forces on the piles were caused by the settlement of the ground the pile tips were pressed down into the sand layer and thus the building on the piles settled at the rate of the ground surface The tests have been described in detail by Resendiz (1964 b)
Girault ( 1964) describes the difficult pile foundation problems in Mexico City These problems are caused by the lowering of the ground water level and the resulting large regional settlements Buildshyings which are founded on end-bearing piles appear to rise with respect to the ground and buildings on friction piles settle unevenly because of large drag forces on the piles Girault has proposed a comshybination of friction piles and end bearing piles (See fig 2 2 1) When the friction piles (A) sink load is transfered through the soil between section oC - cl and section (3 - (3 on to the end bearing piles (B) A building founded on this piling system will accordshying to Girault settle evenly at the same rate as the ground surface
Further examples can be studied in papers by f-e_ev-)5_lJp]_~ )_c(~ 7)_b_)_~~i _(tJJ 2_s_O_ea_ ~196_1 _and Locher_ 1965
--middot
Firm rond subloy(r
Fig 2 2 1 Combination of friction and end bearing piles A= friction pile B = end bearing pile
2 3 _Research on draG forces on p-les
GantL St~pbens and Moulton (19581 describe tests on steel pipe piles which were equipped with electrical strain gauges The purpose of the tests was to determine the allowable pile load for a bridge foundation The soil consisted of 7 m of sandy fill 10 m of silt and a sublayer of sand The piles were of 30 m length and were thus driven about 12 m down into the sand Drag loads of about 90 tons were measured four months after the driving of the piles
Tchebotarioff_li 958) in the discussion following the article by Gant et al indicated a few possible errors in the measurements and pointed out that only a part of the measured axial pile forces could have been caused by drag forces
Weele t1964) describes a case where the drag forces acting along wooden piles of different lengths have been determined Three piles were driven at a spacing of 4 m down to a depth of 13 3 m (No 1) 15 5 m (No 2) and 17 5 m (No 3) The soil consisted of 6 m of sand 7 m of clay and a sand sublayer which at a depth of 17 m was very firm The ground water level in the area was initially 1 m below ground surface In an initial phase the ground water level was lowered 6 m and in a second phase an additional 3 m This caused settlements in the soil and the piles were dragged down See fig 2 3 i
Along the upper part of the piles the settlement in the soil was larger than the settlement of the piles and drag forces were developed along this part of the piles In the lower part the settlements were smaller than those of the piles and thus positive skin friction was obtained along the surface of the piles
----------------------------------
-----------------
3
TIME IN DAYS1~s~RPbbJo~se~l~~ollldllpgtbb~o5er~~===~--ae-
10 10
os 1 O
-20 ___
~ ~
30 - TESTPI LE 3
1-1-1-1 1
o I I I I TEST PILE 1
u 50 ~ I I -r-1 z
60 TESTPI LE 1
-k I 70 ROIINn CURFAC - 80 I-
90
Fig 2 3 1 Settlement-time relation for the ground surface and the 3 test piles during the two stages of the ground-water lowering (After Weele 1964)
From pulling tests on concrete piles the average shear stress along the pile surface were determined as a fW1ction of the pile displacement The maxishymum resistance was obtained at a displacement of about 10 mm The magnitude varied for the three types ot soil
In the upper sand layer 3 tm2
In the clay 1 5 tm2
In the sand under the clay 20 tm2
From these results the drag forces on the piles were calculated The total drag load on pile No was estimated to 24 tons
2 4 Comments on the reviewed cases
Drag forces on piles can be large and cause piles to settle This may damage the supported structures However in the literature on drag forces on piles no reference has been found of the influence of negative skin friction on piles which have been driven to a very firm layer Severinsson_(1965) reportes that no settlement has been observed for 300 structures in Sweden founded on long high quality precast concrete piles driven to rock or to similar layers through settling soil layers
The magnitude of the negative skin friction given by Weele may be compared with the values reshycommended by Tomlinson (1963) for the calculashytion of drag forces along piles
Clay and sitt o 7 3 tm2
Very stiff clay 5 20 tm2
Loose sand 4 tm2
Dense sand 3 7 tm2
In the same paper Tomlinson mentiones that drag forces middotsan be caused by the remoulding and heave of sensitive clays during E]e driving as is shown in Fig 2 4 1 This effect has also been discussed by among others ~~S~S~1-9~ (1_9_3_2J 931Il]1_i1-g_S_l~a_l _lf 9_4_8)2 _ _s_cp_e_~~~fj_(_1J1J] and Zeevaert 1949 1
Heaved-up soil reconsolidating under own weight causing dra o n on piles
Fig 2 4 1 Effects of ground heave on groups of driven piles in clay
3 Calculation of drag forces
Under this heading the existing theories for detershymining drag forces are reviewed
3 1_ Terza_ghi and Peck Ji948 recommend the following method for determining drag forces on pile groups The soil around the piles consists of a compressible layer of clay and a surcharge causes the clay layer to settle The axial force (F) on a pile group is then the sum of the structural load (F ) and the drag force (F ) The drag force itself0is equal to the sum of the 1ampeight of the fill within the pile group (F~) and the skin friction F~) along
the perimeter of the pile group F~ is divided equally between the piles can according toF 11
Terzaghi and Peck vary bet~een zero and the maximum value calculated from equation 3 1 3
F = F + F t F 11 x) 3 1 1Q n n
Structional load on the pile
Weight of fill carried by one pile
F =~bullmiddotHF 3 1 2 n n
A Area of the pile group
n Number of piles
HF= Thickness of fill
Y Unit weight of the surcharge material
F 11 = load caused by settling of the surshyn rounding clay
F11~ S 3 1 3 n n
c Circumference of pile group
HL = Thickness of clay layer
T Average shear strength of clay
4
To reduce of the magnitude of the negative skin fricshytion Terzaghi and Peck recommend that the distance between the piles should not exceed Z 5 pile diashymeters
3 2_Zeevaert_(_1959J states that the ultimate point bearing capacity of piles which have been driven through compressible soil to firm sand layers can be calculated from the equation
3 2 1
Failure load (soil failure)
A factor which is a function of the angle of internal friction (-p) and the relative density of the sand (Dr)
N = N middot (D + O 1)r q r
Nq is a function of ltP It is assumed that the shearing strength is fully mobilized on the surface of failure
a Pile area
p h = Effective vertical soil0
pressure in the sand at the pile tip
The failure load F B depends on the effectiwovershyburden soil pressure at the pile tip When the soil settles the vertical pressure poh is reduced to
pvh by load being transfered to the pile (Fig 3 2 1)
Thus the failure load FB is reduced to F~
z
fig 32 1 Reductionmiddot of th~ effective vertical pre~sure
The middotshear force in the soil along the pile is accordshying to Zeevaert a_function of p
0
3 2 2
is the ratio between the horizontal anq the vertical pressuie in the soil at the pile surface and
tanip is the bullratio between the horizontal pressure against themiddot pile and the shear force along the pile
When p is reduced to p the shear strength is also0
reduced This is a basi~ assumption for Zeevaeres ~athemtical d~riv~ng of the following formulas
The total drag force is derived at
3 2 3
where n= Number of piles per unit area
i_ e-mz)= ( 1 - 3 2 4Pv m
i (1 - e-mh) 3 2 5Pvh = m
m= n UK tanip 3 2 6 0
This approach to negative skin friction is mainly dependant on the validity of Eq (3 2 1) and (3 2 2) These equations do on some occasions not agree with experimental facts as shown for example by Vesic_l1964J Furthermore it is doubtful whether Eq 322 is valid in clay
Zeevaert s approach refers to large pile groups of piles The equations can not be used for a single pile without making certain assumptions about the load distribution around the pile
de _Beer _lt 967) has developed Zeevaert s approach and has published nomograms that simplify the use of the equations In the case of a surcharge on the ground surface de Beer assumes that the area ffecting the single pile is equal to the base area
a 90deg cone with the height equal to the depth of the settling layer
3 3 Buisson Ahu and Habib 1960) have studied theoretically the stress distribution along a pile which has been driven into a compressible clay Settlements of the compressible layer are caused by a fill placed on the ground surface The pile tip rests on sand
The following equation is given (See Fig 3 3 1)
F point F Q + F~ + r middot V middot Z - r V middot H-Z) 3 3 1
where FQ F and F t are defined in Fig 3 3 1 n po1n
u 3 3 2F~ = O 30 2
the term 0 30 is a 11friction coefficient11
which can be compared with K bull tanip0
unit weight of fill
u perimeter of pile
T shear strength of clay
z depth to the neutral point i e the depth along which the dr~g forces act
5
settlement z difference
pile-soil H
_neutral point
Fig 3 3 1
The distance Z to the neutral point can be detershymined by calculating the pile compression and the soil compression separately by iteration procedure The tip of a pile which has been driven to bedrock or to a similar very firm layer does not move when loaded The neutral point must in this case be very close to the pile tip due to the low compressibility of the pile Thus the last term in the equation (3 3 1) is small and can be neglected
34 Elmasry (1963-has tested 80 cm long model Steeff)ffeS~-WhlCh-were provided with strain gauges The piles were driven through a 50 cm thick layer of silty clay which was mixed in a soil mixer beshyfore it was placed in the test cylinder The pile tips were located in a sand layer A load was applied on the cla)- surface through a plate The forces in the model piles were measured for different loading conditions Elmasry derived from the test results an equation to calculate the drag force The maxishymum value of the drag force was found to be proshyportional to
the consolidation pressure from the surface load (pc)
the pile perimeter (U)
the thickness of the clay layer (H)
the ratio between the dry weight of soil per horizontal unit area and the consolidation pressure
the natural water content (w)
The maxilnum value of the drag force was a linear function of these parameters taken separately Comshybining these functions Elmamiddotsry derived the following formula
Fn=Fn-s+0416middot (2middot pcmiddot Hmiddot U 2
O 70 middot middot
w p3 ___c) 3 4 1
15 1d
F is the drag force due to the consolidashyn-s tion of the clay under its own weight This dr1g force can be calculated from the following equation
H T bull dH = U middot H middotTFn-s=JUmiddot -middotp-s p-smean0
is given as 30 of the shear strength of the clay at the final stage of consolidation Elmasry referes to Zeevaert (1957 a)
3 5 Johannessen and Bjerrum (1965) describe reSUlfitfiOffi-teSfs-oii-tWOSteeipliis 47 cm in diashymeter with a length of about 60 m which were driven to bedrock through a layer of clay of about 50 m thickness
After the piles were installed a fill with a height of about 10 m was placed around the piles A slide in the underlying clay disturbed the tests and results were obtained from only one of the two test piles The deformations caused by drag forces were measured on this pile through a system of rods Since the modulus of elasticity of the steel material was known the average shear stress s along the pile surface could be calculated The shear stress corresponded to the equation s = p bull K bull tanP
0
The measured drag load at the pile tip exceeded the ultimate bearing capacity of the pile tip
The tip penetrated 6 cm into the underlying rock This penetration occured slowly and in short steps At each increment the pile was partly unshyloaded The drag force decreased momentarily
The largest calculated value of K bull tanP was O 20 which corresponded to a total pilf shortening of 2 5 cm The calculated total maximum drag load was 300 tons On the basis of these results Bjerrum and Johannessen recommend that the calculated drag loads on piles in loose marine clays should correspond to 20 of the final effektive vertical pressure in the clay i e
K bull tanO = 0 20 0
F = 4-u Sbull dz= o20Ju- pmiddot dz 3 5 1 n J
0 0
3 6_Brinch Hansen_(1968) has investigated thellretishycally the skin friction on piles in general and applied the results on negative skin friction Brinch Hansen derived the following equation
3 6 1s -47 +6~-1Jii-n=bc-
s = shear force (negative)
p surface load per unit area andor pore pressure d~crease in the soil
D pile diameter
b distance between piles in a group
----------------
6
Equation (3 6 1) gives an upper limit of the negative skin friction Brinch Hansen states that the maxishymum negative friction is also governed by the maxishymum pull out resistance of the pile The theoretical expressions for the pull out resistance are given in the paper
Brinch Hansen applied Eq (3 6 i) on the pile tests reported by Johannessen and Bjerrum Chapter 3 5 above) An extremely good agreement was obtained between measured and calculated drag load This agreement may only be a coincident as is pointed out in the paper
3 7 Other studies
Other theoretical studies of negative skin friction have been published by Yokowo et al (1968) and p_op~~~-ltsectL~_l1J_6_8J It is assume_cf in these studies however that both the soil and the pile material are purely elastic These assumptions limit themiddotpractical application of the theories as soil and especially the soft clays in Sweden do not behave elastically These studies have therefore not been cited here
4 Comments and conclusion
Certain assumptions and extensive simplifications must be made as to the soil conditions when applyshying the equations bymiddotBuisson et al and Elmasry on practical cases Since the calculated drag forces are to a large extent dependent of these assumpshytions it is difficult to estimate the accuracy of the proposed methods
When tr1e negative skin friction is calculated according to the method proposed by Terzaghi and Peck it is difficult to choose the value of to be used in the calculation of F It is far from certain that shear is fully developJld along the full perimeter area of a pile or a pile group The value of T deshypends also on the remoulding of the soil during the pile driving and on the resulting reconsolidation of the soil
In Zeevaert s theory the shear force along the pile depends on the resulting overburden pressure in the soil after unloading Part of the overburden is transferred to the pile and will depend on the coefficient K middot tanlp These factors vary with the soil conditioJgts and the method of pile installation However very little is known about how negative skin friction is affected by these factors
Johannessen and Bjerrum base their recommendashytion on the results from a single test pile in loose marine clays in Norway Their equation (Eq 3 51) is simple and can easily be applied on practical cases As mentioned above the general validity of this equation remains to be proved However the equation is the only one that is derived from an actual field test
Before any definite recommendations can be given the parameters which affect the skin friction such as soil conditions soil characteristics and magnishytude of the consolidating pressure must be evalushyated in the field and in laboratory Especially full scale tests should be of value Furthermore it
will be essential to investigate the effects of pile driving and the rate of soil settlement upon the magnitude of the shear forces
Once the maximum drag load can be evaluated the important question of how this drag load affects the behaviour of the pile and how it can be taken into account when designing the actual pile founda tion remains to be answered Fellenius (1964) has proposed for a point bearing concrete pile driven in underconsolidated clay (in southern Sweden) that a drag force corresponding to the original undrained shear strength of the clay should be assumed to act along the pile surface down to a maximum depth of 20 m or for piles shorter than 40 m only along half the length of the pile The sum of the drag load calshyculated in this way the maximum design load and the weight of any fill located within a pile group should not exceed the ultimate strength of the pile section i e about O 65 of the cube strength
This literature survey indicates that drag forces can cause piles to sink with fatal results when the piles are supported by sand strata or any material in which the piles can penetrate Local experience will on many occasions indicate whether a proposed design will be safe or not When high design loads are used or the driving conditions are severe a more thorough penetration of the problems will be required
5 Literature index
Brinch Hansen J (1968) 11A theory for skin friction on piles 11 bull Danish Geotechnical Institute Bulletin No 25 pp 5-20
Buisson M Ahu J and Habib P 1960) 11 Le frottement negatipound 11 Annales de Institute Techshybull
nique de Batitment et des Travaux Publics No 145 Paris 18 pp
Casagrande A 1932) 11 The Structure of Clay and Its Importance in Foundation Engineering 11 Procbull
of the Boston Soc of Civil Eng Val 19 No 4
bullChellis RD (1951) npile foundations 11 McGraw Hill Book Co New York 1951
Correa JJ (1961) uThe Application of Negative Friction Piles to the Reduction of Settlement11
bull
Proc Fifth International Conference on Soil Mechanics and Foundation Engineering Paris Vol II pp41-44
Cummings A E Kerkhoff G D and Peck R B (1948) 11 Effects of Driving Piles into Soft Clay 11
bull
Proc ASCE Val 74 pp 1553-1563
de Beer E (1966) 11 Berekening van de negatieve wrijving op palen 11 bull Tijdschrift der openbaren werken van Belgie No 6 1966 p -29
Elmasry MA 1963) 11 The Negative Skin Fricshytion of Bearing Piles 11 bull Ph D Thesis at Swiss Federal Institute of Technology Ztirich 115 pp
Fellenius Bror (1964) 11Aktuella pcllningsproblem 11 bull
Nordisk J~rnbanetidskrift nr 6 1964 pp 156- 162
7
Florentin J and 1-Heriteau G (1948) 11 About an Observed Case of Negative Friction on Piles 11
bull
Proc Second International Conference on Soil Mechanics and Foundation Engineering Rotterdam Val V pp 155-156
Gant E Stephens J and Moulton L (1958) 1Measurement of Forces Produced in Piles by Settlement of Adjacent Soi1 11 bull Highway Research Board Bulletin 173 Washington D C pp 20-37
Girault P (1964) 11 A New Type of Pile Foundashytion11 Proc Conference of Deep Foundation Mexico City dee 1964 16 pp
Golder H Q and Spence RA (1960) 11 Engineershying Properties of the Marine Clay at Port Man B C 11 bull Proc 14th Canadian Soil Mechanics Conshyference 1960 p 133
Johannes_sen IJ and Bjerrum L (1965) 11 Measurement of the Compression of a Steel Pile to Rock due to Settlement of the Surrounding Clay 11
bull
Proc Sixth International Conference on Soil Mechanics and Foundation Engineering 48 pp 261-264
Kapp M S (1965) Letter to the author dated Nov 1st 1965
Locher H G (1965 ncombined Cast-In-Place and Precast Piles for the Reduction of Negative Skin Friction Caused by Embankment Fill 11
Proc Sixth Int Conpound on Soil Mech a Found Eng 414 pp 290-294
McKay GA (1938) 11 Discussion on Soil Reactions 11 bull Trans ASCE Val 103 p 1220
Meyerhof G G (1959) 11 Compaction of Sand and Bearing Capacity of Piles 11 bull Proc ASCE Val 85 SM No 6 pp 1-30
Milner R P 1957) Discussion on Session 6 Proc Fourth International Conference on Soil Mechanics and Foundation Engineering London Part 3 pp 201-202
Moore WW (1949) 11 Experiences with Preshydetermining Pile Lengths 11 Trans ASCE Val 114bull
pp 366- 367
Poulos H G and Mattes N E (1968) 11 The anashylysis of downdrag in end- bearing piles due to negashytive friction 11 bull Univ of Sydney Australia Research Report No 91 p 16
Severinsson S (1965) 11 Praktiska erfarenheter av rationell stodpllning med prefabricerade beshytongpillar11 Tidning for Byggnadskonst Arg 57 nr 12 p 565
Restlndiz D (1964 a) 11 Estudio de campo sabre pilotes de concreto reforzado 11 Rev Ingenieriabull
Val 34 No 1 pp 101-110
Resendiz D (1964 b) On a Type Point-bearing Pile through Sinking Subsoi1 11 bull Proc Conference on Deep Foundations Mexico City dee 1964
Terzaghi K and Peck R B (1948) 11 Soi1 Mechashynics in Engineering Practice 11
New York 1948 pp 473-474
Tomlinson MJ (1963) 11 Foundation Design and CorlStruction 11 Pitman amp Sons Ltd London ppbull
308 376 and 394
Tschebotarioff G (1949) 11 Discussion middoton Effects on Driving Piles in Soft Clay 11 Proc ASCE Valbull
75 pp 671-676
Tschebotarioff G 1958) 11 Discussion of Measureshyment of Forces Produced in Piles by Settlement of adjacent Soi1 11
bull HRB Bull 173 pp 37-43
Weele A (1964) 11 Negative Skin Friction on Pile Foundation in Holland 1 bull Proc Symposium on Bearing Capacity of Piles Roorkee India febr 1964 10 pp
Yokowo Y Yamagata K and Nagaoka H (1968) non negative skin friction acting on a pile-group11
bull
Trans of the Architectural Institute of Japan No 150 August 1968 pp 51-57
Vesic A S (1964) 11 Investigations of bearing capacity of piles in sand Proc North Am Conpound on Deep Foundations Mexico City
Zeevaert L (1949) 11 Discussion on Effects of Driving Piles in Soft Clay 11
bull Proc ASCE pp 661-668
Zeevaert L (1957 a) 11 Compensated Friction-pile Foundation to Reduce Settlement of Buildings on the Highly Compressible Volcanic Clay of Mexico City11
bull
Proc Fourth International Conference on Soil Mechanics and Foundation Engineering London Val II pp 81-86
Zeevaert L 1957 b) 11 Foundation Design and Behaviour of Tower Latino Americana in Mexico City ceotechnique Val VII Sept 1957 pp 115-133
Zeevaert L 1959) 11 Reduction of Point-bearing Capacity of Piles Because of Negative Friction Proc First Panamerican Conference on Soil Mechanics and Foundation Engineering Sept 1959 Val III pp 1145-1152
Zeevaert L (1963) 11 Foundation Problems Related to Ground Surface Subsidence in Mexido City11 Fieldbull
Testing of Soils ASTM Special Technical Publ No 322 pp 57-66
----------------
----------------
8
7 Symbols
General
volume
weight
safety factor
Stress and strain
p effective vertical soil pressure
original effective vertical soil pressure
decreased effective vershytical soil pressure
consolidating pressure callsed by overburden
5 shear force
T shear strength
shear strength after conshysolidation
T = 0 30 middot (p-s s
Soil classification
w water content in of dry weight
Y unit weight
1 effective unit weight
Y unit weight of solid particles5
Yd dry unit weight
p angle of internal friction
Dimensions
B width
L length
H depth thickness of soil layer
z depth coordinate A certain value of z writes h
Pile symbols
D pile diameter (side)
u pile perimeter
a pile area
Z depth to the neutral point
axial force in pile
structure load
failure load
drag force
F~ drag force in or from fill
F drag force caused by soil settling around a pile
C perimeter of the polyhedron surrounding a pile group
A area of the polyhedron surrounding a pile group or the fill area affecting the pile
n number of piles in a pile group
n number of piles in a pile group per unit area
the ratio between the vertical and the horizontal soil pressure
m = n U bull K tanip0
acc to eq 3 2 6
NUCLEAR RADATION IN CONSTRUCTION CONTROL OF EARTH AND ROCKFLL DAMS RADATONS NUCLEARES DANS LE CONTROLE
DE LA CONSTRUCTION DES BARRAGES
l BERNELL CE and KASCHERMANCE Swedish State Power Board Stockholm Sweden
SYNOPSIS
During the later years the nuclear radiation technique has been widely used in soil investigation in order to deshy
termine certain characteristic properties of soils Principally the development in this field has been concenshy
trated on methods for determining the moisture content in soils and the density conditions in situ and in comshy
pacted embankments whereas very little attention has been devoted to the possibility to apply the new techshy
nique to other fields of soil- and rock mechanics (Bernell and Lindbo 1 1965) In connection with the design and
construction of several earth and rockfill dams the Swedish State Power Board has developed the nuclear radiashy
tion technique for solving many problems in the construction control The experiences thus obtained have reshy
sulted in reliable and simple methods for determining settlem~nts in earth and rockfill embankments and for
controlling the effect of grouting 10 soil and rock These applications of the nuclear method are briefly deshy
scribed in the following
USE OF NUCLEAR METHODS FOR MEASURING
SETT FMENTS
For determining the vertical movements in compacshy
ted earth and rockiills the telescoping pipe device
ith the horLrnntal crossarms is often used This
measuring method has also been applied to Sv edish
dams but experience has shown that it has many
disadvantages (Bernell 1964) In ~mbankments
which have been filled according to the wet-compacshy
tion method the horiLontal movements often become
so large that the pipes break off Another drav -back
is that the pipes and the crossarms must be installed
during the construction periods ltnd thus frequently
cause trouble during the filling operations
In most of the dams constructed by the State Power
Board as rell as by other poer companies in Sweshy
den during the later years the nuclear method was
chosen for determining the simultaneous settlements
at different elevations in the fills (Bernell 1967) 60According to this method a radioactive isotope Co
is placed in the measuring point and the radiation
from the isotope is determined by means of a Geiger-
Milller detector Generally the measurements are
carried out in a steel pipe protected from the surshy
rounding soil by an elastic pipe casing The location
of the isotope is indicated by a peak value in the rashy
diation intensity and thus the elevation of the meashy
suring point can be determined
xperience has shown that the nuclear method can
asily be applied to settlement measurements in
both soil and rockfill embankments Generally the
isotopes are placed in the fill close to the pipe and at
different elevations Fig l shows a typical diagram
from settlement measurements in an earth and rockshy
fill dam In this case the measuring section included
both the core and the rockfill zones Long term meashy
surements in this and many other dams have proved
that the method is very simple and reliable The
accuracy in the results is also very good about 1 cm
at a depth of 100 metres
285
BERNELL and SHERMAN
Upstream rockfill Moraine core Pipe I Pipe II
+215 - - II I I
1-- ~Measuring pipe 1 ~
11 5
I I f
-I I I I
I --210
Height of fill
I
I -Reservoir level
110 I I
I I I
205 -Isotope I
I I I I
105 I I I I
I r I I I
E 200 C
I I I I
I I -
100 I I I I
C 0-
r-- J
I r bull J 0 gt bull
w 195 ~
Igtlt--I I
I I
195
I I
I -- ~
I
I I I
190
185
-
I I
J
I I I I I
---- 190
185
Ilt
I I I -I
I I
I -I I -I -~ -
I I
I
I
i I
----7
-- ---
I I I -~ _J I
I L - -1
180 1965 1966 1967 1968
1N I 1965 1966 1967 1968
II 220E
C Upstream
200rC
~
1aoL bull 0 gt
w 160L e
Fig 1 Settlements in an earth and rockfill dam determined
by means of nuclear measurements
286
NUCLEAR RADIATION IN CONSTRUCTION CONTROL
Since themiddot installation and the maintenance of the
pipes often cause difficulties with regard to the filling
works a modified method for performing the meashy
surer9-ents has successfully been applied The meshy
thod is based on the fact that the range for the radiashy
tion in a soil is relatively large also for very small
quantities of the isotope In a recently completed 60
dam small quantities of Co were placed directly
on the compacted surface within an area of 2 x Z
metres and with a spacing of o 25 metres After
completion of the filling works measuring holes
were drilled down to the surface with the isotopes
Although the holes had to be drilled to a depth of
about 30 metres the measurements could be
successfully executed
The nuclear method is also of great value for detershy
mining additional settlements in natural soil strata
beneath supporting foundations
In this case the isotope is placed in a mechanical
shot-device which is inserted in the pipe after
drilling of the hole By means of the shot-device the
isOtope can be placed in the soil at any desired depth
This method can be applied to many cases in foundashy
tion engineering1 where it may be of special interest
to obtain reliable data concerning the compressibishy
lity and the settlement conditions in the underground
middotrn construction control it is often desirable to arshy
range the measurements in such a way that both the
vertical and the horizontal movements can be detershy
mined by using the same installations For measurshy
ing horizontal movements the strain gauge inclinoshy
meter is generally used (Kallstenius and Bergau
1961) By choosing the diameter of the pipe so that
the pendelum can be inserted in it the same pipe
can be used for both vertical a1d horizontal meashy
surements This combination of measurements has
successfully been applied to the control of the stashy
bility oi slopes
USE OF NUCLEAR RADIATION IN GROUTING
CONTROL
Most of the dams constructed in Sweden during the
later years are situated within the mountain region
in the northern part of Sweden The soils in this
area commonly consist of moraine deposits from the
last ice age Because of geological processes the
composition of these deposits is very irregular and
generally they contain both impervious moraines
and lenses of pervious sediments Therefore conshy
struction of dams in this region often involves diffishy
cult foundation problems especially in cases where
the dam has to be founded on partly permeable deposhy
sits
Because of the erratic soil conditions1 foundation
grouting in the dam site is almost always need-ed in
order to reduce the underseepage after the rise of
the reservoir level But very often it may be a mashy
jor problem during the construction stage to decide
the extension of the gIouting works Sometimes the
need for grouting becomes apparent only ater the
reservoir has been filled and in such cases the founshy
dation must be grouted through the dam embankment
This method has certain advantages but evidently
the grouting operation must be carefully controlled
because of the risk of cracking and eroding the soil
in the foundation Ir order to eliminate this risk the
State Power Board has applied the nuclear radiation
method to the control of grouting operations The
method is based on investigations of the radiation
in soils compacted to various porosities
At a recently completed dam founded on natural
moraine deposits leakage occurred under the founshy
dation after the rise of the reservoir level The seashy
ling measures included the performance of a grout
curtain extending through the existing pervious soil
layers beneath the foundation and down into the undershy
lying faulty rock The thickness of the permeable
layers was about 5-6 metres and in order to reach
these layers the bore holes had to be drilled from
the crest and through the dam core to a depth of
about 20 metres It was also conside1middoted necessary
to protect the bottom layers from possible erosion
caused by leakage water flowing through cracks in
the rock For this purpose the grout curtain had to
be extended to a depth of 10 metres below the rock
surface after completion of the soil grouting
After drilling the grout holes the nuclear density
probe was used for determining the initial porosity
of the soil strata overlying the rock From these
287
BERNELL and SHERMAN
15-----------------~---~--------------
-------- ====o~
en shy+shya
E 20-+-----~----=-----+---------+-------t c v Ground water level
c ~ Q a
0
Rock
CD Radiation curve before grouting __ -middotmiddot- after 1st grouting __ __ _ __ _ 2nd
25---------------_______________ so 1QQ 1so 200
Radioti on in countssec
middotFig 2 Radiation curves measured in foundation
soils under a dam
288
NUCLEAR RADIATION IN CONSTRUCTION CONTROL investigations it was found that the soils located
immediately above the rock surface were pervious
and contained cavities whereas the overlying soils
in the contact zone against the dam foundation conshy
sisted of impervious moraines As a result of this
investigation it was decided to grout the holes in
stages from the rock surface up to the bottom of
the dam
After completion of the soil grouting secondary
holes were drilled through the foundation to a depth
of 5 metres in the rock Before the rock grouting
was begun these holes were measured with the nushy
clear density probe for controlling the effect of the
soil grouting From the measurements combined
with the results of the conventional water pressure
testing valuable informations were obtained conshy
cerning the effect of grouting and also on many
other factors which influence the grouting procedure
in soils
Fig 2 shows a typical radiation diagram for a bore
holeJ drilled for grouting the foundation soils beshy
neath the dam I~ this case both the bottom layers
and therock were so pervious that the first grouting
did not stop the flow of ground water into the bore
hole Therefore additional grouting was needed for
sealing the pervious zones
The same method was used for controlling the rock
grouting and also in this case interesting results
were obtained concerning the grouting procedure
Therefore it is believed that the nuclear method
will be as valuable in the grouting technic as it is
in many other fields of soil and rock mechanics
REFERENCES
1) BERNELLJ L and LINDBO T Test of air
leakage in Rock for Underground Reactor Conshy
tainment Nuclear Safety 1965 V0l 6 No 3
2 BERNELL L Measurements in the Messaure
Dam a Rockfill Structure with Wet-Compacted
Core Eighth Congress on Large Dams Edinshy
burgh 19~4 Vol II Page 317
3) BERNELL L Construction of Rockfill Dams unshy
der Winter Conditions Ninth Congress on Large
Dams Istanbul 1967 Vol IV Page 161
4) KALLSTENIUS T and BERGAU W In Situ Deshy
termination of Horizontal Ground Movements
Proc Fifth Intern Conpound on Soil Mechanics and
Foundation Engineering Paris 1961 Vol 1
Page 481
289
MAIN SESSION 5 SEANCE PLENIERE 5
STABILITY OF NATURAL SLOPES AND EMBANKMENT FOUNDATIONS STABIUTE DES TALUS NATURELS ET DES FONDATIONS DE REMBLAIS
ChairmanPr4ident D H TROLLOPE (Australia GenClal Reporter Rapporteur G6n~el A W SKEMPTON (ElIQ1ahd1 Auociata RoportuRapportcur Adjoint J HUTCHINSON (England)
Members of the PanclMembros du Groupe do Discuuion L 8JERRUM (Norway
H BOROWICKA (Aut1ralia) B BROMS ISwodenl
R C HIRSCHFELD (U S A) C KENNEY (Canadol
Panelist B BROMS
lntroduction
Several large landslides have occurred during the last 20 1ears in the densely populated GtHa River Valley located in the southwestern part of Sweden (Fig 1) Among these the landsUdes at Surte (Jakobson 1952) and at Gtita (Odenstad 1958) can be mentioned In the G6ta River Valley flows the Gtita River which is one of the largest rivers in Sweden The G6ta River is also an important waterway Approximately 4 milj tons oi freight is annually transported on the river In the river valley are located several hydroshyelectric plants The river servea ilao aa water supply for Gothenburg the main seaport of S y-den with approximately 500000 people Two main high~ ways follow the G6ta River Valley The highways are in many places located close to the river Also one railroad line ia located in the valley and baa in some cases been affected by landslides
385
SEANCE PLENIERE 5
Ps wh~re art5a11 prusur1 hobull bH11 oburvet
~) ArtaJ w1 quck clays
SeVert bullrcs011
~ rorEBORG
Fig 1 The Glaa River between Trollhattan and Gothenburg Gtsteborg)
Landslides in the Gtsta River Valley can have Vfry serious consequences A landslide canfor examplP disrupt the boat traffic in the river iriferfere with the operation ofthe hydroelectric plants and pollute the river water (Several large chemical plants are located at the river and oil storage tanks have been built close to the river Two oil tanks collapsed e g during the slide at G6ta)
Landslides in the G0ta River Valley
Scars after old landslides can be seen almost along the whole river especially in the northern part of the valley above Lilla Edet In Fig 2 is shown scars after landslides at Utby (Fig 1)
About 20 slides have here taken place within a distance of about 2 km Several slides have also occurred along the Slump River a tributary to the G6ta River
Scars after a large old landslide can also be seen at Jordfallet (in English 11 Earth fall) located about 2 km upstream of Surte (Fig 1) The scar has a length of about 300 m and reaches iliout 1000 m from the river
One of the largest recorded landslides occurred in 1648 at Intagan located approximately 4 km south-
River
Seo le 0 1000 m L-1-1-LJLJ
Scar otter londsl1de
Fig 2 Landslides at Utby
west of Troilhattan (Fig 1) About 54 acres were affected by the slide and at least 85 people lost their lives Another relatively large landslide which probably was triggered by an earth quake took place in 1759 at Bondestr5m when approximately 400000 m 3 slid into the Gtsta River
The landslide at Surte occurred in 1950 The direct cause of the slide is uncertain but the vibrations from the pile-driving for a small house have been dicussed as one possible factor as well as the vibrations from a train which passed the aren just before the slide The length of the slide area was about 600 m and the width about 400 m The total
3volume was 4 million m Within the slide area lived about 375 people in 31 houses One person lost his life during the slide A major highway and a railroad line which crossed the slide area were damaged The total damage caused by the slide was estimated in 1952 to $ 2 000 000
The landslide at Gtita occurred in 1957 Several large buildings belonging to a paper mill were located within the slide area which was about 1500 m long and 300 m wide Three workers were killed of the 200 which were within the slide area The total cost to restore the river channel after the slide was approximately $ 2 000 000
Geologic History
The Gtlta River Valley was formed by erosion during several glaciations along prequaternary fissured zones in the underlaying bed rock of gneiss The bottom of the valley which is filled with loose sediments is located up to 100 m below the present sea level The maximum thickness of the sediments is about 100 m (at Gothenburg) The thickness of the sediments in general increases downstream The area was covered during the last glaciation by ice with a total thickness of 2 000 to 3 000 m During the last glaciation the valley floor was partly covered by a thin layer of heavily preconsolidated moraine (till) with a total thickness less than 1 to 2 m The moraines are generally covered by glacifluvial and marine sediments The average grain size of the sediments decreases generally towards the ground surface and downstream the river The glacifluvial sediments (sand silt and clay) and the moraines have in many places been reworked by waves
386
MAIN SESSION 5 ~----~--~h--u---rn-----h---~s----~w-------0
Soil m ) stre19th tf tvty conlbulln1 frac14
Btuegroy to groy clay wrootholes
Dork gray
mottltd
clay (stght- 1 ly bonded l
2~ I
Gray cloy
Dork groy mottled cloy
legend -
-
6 O 0 80
28
30
115
deg 27
165
Swldish 192 tall-cone tlsl 205
135
332
3D
190
130
122
Swedish lollmiddot cone tnt I--- Plostc lmt
Field vone tut --1 Lqud tmt
Wotor ccntent
Fig 3 Soil conditions at Utby
The location of the shore line has changed considerashybly since the last glaciation due to changes of the sea level and the general land uplift At the end of the glaciation the sea level at Gothenburg was located 95 m above the present sea level and 128 mat Lake Vanern The present rate of land uplift is 2 mm year downstream at Gothenburg and 2 5 to 3 mm year upstream at the Lake Vanern The gradient of the G6ta River is thus increasing by about 1 mm year A typical soil profile of the clay layer at Utby (Fig 1) is shown in Fig 3 (The clay is underlaid by sand with a thickness of more than 10 m)
Th~ lower parts of the marine clay sediments which generally are stratified are of glacial age The clay middotcontent varies generally between 50 and 60 Organic content of the glacial clay is low Varved silt can frequently be found close to the bottom layer of sand
The upper parts of the marine sediments consist of late- or postglacial clays The particle size is smaller than that of the underlaying glacial clay The clay content varies generally between 60 and 70 The dominating clay mineral is illite The organic content (11 gyttja and organic sulphides) is relatively low but increases downstream the river The glacial as well as the late- and the postglacia1 clays are located just above Casagrandes 11A 1-Jine
The post-gl~cial clays have a stiff upper crust with a total thickness of 1 to 1 5 m The thickness i~creases upstream the river The dry crust is d1sected by vertical desiccation cracks with a thickshyness varying between 1 and 6 mm
Alluvial sediments can frequently be found close to the river The silt and organic contents of these sediments are generally high Their maximum
thickness is about 7 m
High artesian pressures have been measured in many places in the sand and silt layers as shown in Fig 1 The water pressures are related to the amount of rain fall in the area Seasonal variations of the ground water table of 1 to 2 m are not unusual (Pore overpressures of 7 m with respect to the present ground surface has been observed) The pore overpressures are generally highest in the bottom layers and decrease towards the ground surface
The glacial and post-glacial clays are generally normally consolidated except for the stiff dry crust at the ground surface The shear strength increases generally linearly with depth Just below the dry crust the shear strength varies between O 5 and 1 O metric tonsm2 in the downstream fart of the valley and between 3 and 4 metric tonsm in the upstream part of the valley
The following relationship has been found for Swedish clays between undrained shear strength Cu liquid limit wL or fineness number wF (Karlsson 1961) and effective overburden pressure a~ (Hansbo 1957)
cu = 045 wLov
Thus the shear strength increases as a rule linearly with increasing liquid limit (or fineness number) and with increasing effective overburden pressure The shear strength of the normally consolidated clays in the Gota River Valley is in some places higher than that predicted by the relationship proposed by Skempton (1954) or by Hansbo 1957 when the sensitivity of the clay is high (Karlsson amp Viberg 1967)
The angle of internal friction as determined by _drained direct shear tests is approximately 22 a 23deg A higher angle of internal friction is generally obtained with drained triaxial tests than with drained direct shear tests (Osterman 1960 Brink 967) The true angle of internal friction (Gibson 1953) varies generally between 18deg and zoo (Karlsson amp Pusch 1967)
The sensitivity of the clay in the GOta River Valley is frequently high The sensitivity of the Swedish clays is normally about 10 to 20 but the sensitivity ratios as high as 500- 700 has been measured by the fall-cone test (Karlsson 1963) north of Utby Often a relatively large amount of work is required to remould the clays from the GOta River Valley Clays from the GOta River Valley are therefore not as sensitive to vibrations or other mechanical disturbances as clays which can be remoulded easily
S6derblom (1969) has suggested to distinguish between rapid quick middotclays and slow quick clays (a clay is classified as rapid quick when a relatively small amount of work is required to remould the clay while the term slow quick is used when the amount of work is relatively large) Clays with a sensitivity ratio larger than 50 are in Sweden defined as quick clays if the fall-cone test is used to detershymine the undisturbed and the remoulded shear strength of the soil
The high sensitivity of the clays in the GOta River Valley can partly be explained by a reduction of the
387
------- ----
SEANCE PLENIEAE 5 salt content due to leaching and diffusion However infiltration of organic substances (e g humus) hav~ probably also cortributed to the high sensitivity of
the clays The salt content of quick clays is always low but the salt content Of clays with low sensitivity ~ay ~~ry between wide limits Sl5derblom ( 1969) has 1denhfaed a large number of organic substances in pore water with dispersing properties
I- ~ig 4 is shown the relationship betweeio conducshytivity (vt) and the sensitivity (S ) of a clay from a bore hole located close to Utby Fig 1)
- lmmodolbullI) alrr tArr01 --- Ac towotaon lo lobdol)
Srsmly Hyfi m 2()Q JOO co
_ lt
middot ----- I ( -
vr--
) s t OoNn
Fig 4 Relationship between conductivity and sensitivity
The conductivity which is directly proportional to the salt content was determined with a salt sounding tool (Saderblom 1957) The shear strength of the undisturbed and of the remoulded soil was determined by the Swedish fall-cone test in the field immediately after the sampling and in the laboratoshyry approximately two weeks after the sampling It can be seen that no relationship exists in this case between conductivity (salt content) and sensitivity when the salt content is low In fact the highest sensitivities were found at the levels where the salt content was the highest
The sensitivity is however affected by the time after sampling The sensitivity determined two weeks after the sampling was approximately half the sensitivity immediately after the sampling The reduction of the sensitivity was caused mainly by a reduction of the undisturbed shear strength of the clay
In Fig 5 is shown a microphotograph of a quick clay ~ram Lilla Ed~t The shear strength of the clay 1s about 2 tm and the sensitivity about 150 The thickness of the section is 500 A Investigashytions have shown that the microstructure of quick clays is characterized by an extremely open three dimensional network of particles and particleshygroups (Karlsson amp Pusch 1967)
Soil Exploration
The stability conditions in the G5ta River Valley has
0 SA Sealbull
Fig 5 Microphotograph of a quick clay from Lilla Edet (R Pusch)
been investigated extensively The sounding machine type SGI (Fig 6) and the Swedish weight sounding device have been used to determine the thickness of the individual soil layers and the depth to the firm bottom layers
Fig 6 Sounding machine type SGI
The sounding machine type SGI (Kallstenius 1961) records automatically the penetration resistance of a 10 cm2 cone as a function of depth as the cone ismiddot pushed down into the soil The skin friction resisshytance is automatically subtracted from the total resistance and only the point resistance is recorded by the machine This type of penetrometer is much more rapid than for instance the weight sounding test and can be used to detect e g sand and silt seams as shown in Fig 7
The undisturbed shear strength of the clay has been determined in situ with the so-called iskymeter (Kallstenius 1961) and with vane tests and in the laboratory by the Swedish fall-cone (Hanabo 1957) or by unconfined compression tests The iakymeter records the pull-out resistance of a foldable anchor plate which is pulled out of the ground by a wire The anchor plate is driven into the soil folded and unfolds when the plate is pulled With the iskymeter sand or silt seams can be detected as shown in Fig 8
388
MAIN SESSION 5
Storie
M3 Noom stopped
Fig 7 Penetrometer record
I SurfaiesiJ
C-ycrus I
-
----==--Coy orid s11 1
-middot--- ---i
Ckiy I melrl
1000 kg = Fig 8 Iskymeter record
The shear strength determined by the iskymeter agrees relatively close with the results from vane teats in clays with normal sensitivity (Osterman 1960) A good agreement has also been found beshytween fall-cone and field vane tests except when the sensitivity of the soil is high
The vane type SGI is provided with shield or with a shroud which protects the vane blades during drishyving The shield also prevents clay from adhering to
the blades when the vane is driven through the stiff dry crust The test results indicate that clay which adhere-a to the vane blades can appreciably lower the measured shear strength especially when the sensishytivity of the clay is relatively high
Soil samples have been taken with sampler SGI type IV (Kallstenius 1958) and by the Swedish standard piston sampler (Swedish Committee on Piston Sampling 1961) The area ratio of the Swedish standard piston sampler is low Samples have been taken every or every second meter in depth
The Swedish foil sampler has been used in a few cases to check the layer sequence and to locate slip ~urface in slides In Fig 9 is shown two cores from the slide at GOta The location of the slip surfaces can clearly be seen on the photograph
Fig 9 Location of slip surfaces in cores
Pore pressures have been measured hydraulically by pore pressure gauges of type SGI (Kallstenius amp Wallgren 1956) The coupling device of the gauge makes it possible to check the functioning and the accuracy of the gauges cturing long time mtasureshyments These gauges are therefore especially suited for control of pore pressures The gauges along the GOta River are as a rule read every second month
Lateral displacements (creep) have been measured with an inclinometer of type SGI (Kallstenius amp Bergau 1961) at locations where the slope stability has been especially low With this device it is often possible to measure lateral displacements with an accuracy of about 1 to 2 mm for a length of 10 m
The salt content of the clays has been determined at a large number of places by measuring in situ the electrical resistance of the soil with a salt sounding tool as mentioned above (Soderblom 1957 1958)
389
SEANCE PLENIEAE 5 Tlie electrical resistance is measured between two isolated steel rings which are placed at the tip of a sounding rod The tool is driven into the ground with standard equipment The salt contentwhich generally is low close to the ground surface increases with depth and reaches often a maximum value at the middle of the profile The salt content at the bottom layers is generally low due to leaching It has been possible in many cases to locate slip surfaces with this device In Fig 10 is shown the record from a salt sounding at Glita which was carried out 14 days after the slide (S6derblom 1969)
$1p ~rtraquon lthKJltod 1~ ffl mpi
Jsl---1--+----lt
~1----gt-+-------j
Fig 10 Location of slip surface with the salt sounding tool
A sudden jump in the resistivity curve shows the location of the slip surface The actual location was later checked with cores obtained with the Swedish foil sampler
Attempts have also been made to locate slip surshyfaces in quick clays with field vane tests This method has not been successful since the thickness of the disturbed zone where the shear strength in the soil is reduced by remoulding has been small (less than a few centimeters)
Slide Mechanisms
The large slides in the G5ta River Valley are generally retrogressive rotational or retrogressive translational They have as a rule been triggered by a relatively small initial local slide A number of parallel ridges can often be Seen within the area after a slide The landslide at Glita started as a small local slip close to the river In the morning of the slide a crack which was 130 m long was observed approximately 20 to 30 m from the river The crack widened slowly and the final slip occurred 3 hours after the crack first was detected The slide spread upstream the river and in the direction from the river (Odenstad 1958) The slide at Surte initiated however at some distance from the river and the slide then spread gradually towards the river and backwards to the side of the
valley The duration of the slide was at Surte about 3 minutes and the maximum speed of the slide was less than o 9 msec
A number of local slide can be seen in Fig 11
Fig 11 Local slides along the Glita River
The small initial slide is generally caused by erosion of the river bank and by changes of the ground water level by vibrations from traffic pile driving or by earth quakes The small local slides are mainly confined to the part of the river located above L6d6se (Fig 1) where the height of the river banks exceeds several meters
The erosion processes have accelerated during the last 50 years partly by the construction of dams and hydroelectric plants along the river and partly by the heavy ship traffic on the river The erosion of the river banks seems to increase rapidly with the size and speed of the ships Some bottom erosion has taken place downstream of Lilla Edet at the places where the river bottom consists of cohesionless soils Of course a certain erosion has also been caused by the general land uplift (2 mmyear at Gothenburg) This erosion is relashytively small since the land uplift is small Over a very long time period this bottom erosion can however be appreciable and contribute to the general lowering of the stability of the slopes
Method of Analysis
It is not possible to predict accurately with presentshyly available methods if a small local slide will develop into av large catastrophical slide The stability of a number of small local slides have been analysed by the total stress method(~= 0-analysis) and by the effective stress method (c ff -analysis) (Bishop 1955) The total stress anSlysis which is based on results from field vane tests gave nominal safety factors which are close to one with respect to available and mobilized shear strength of the soil (G6taHvkommittCn 1962) Safety factors of the same magnitude were obtained from an effective stress analysis if the results from drained direct shear tests and triaxial tests are used in the analysis The cohesion c determined by drained direct shear test has not been reduced in the calculation Both circular and other shapes of the failure surfaces have been investigated
390
MAIN SESSION 5
Also sections where slides have not occurred have been analysed by the total and the effective stress methods The results from these calculations are shown in Table 1
Table 1 Safety factors calculated by total and effective stress analysis
Location Total stress Effective stress analysis analysis
Intagan - Torp
2345 1 18 1 30 23 72 1 02 1 03 23 82 107 103 2688 - 2752 - 1 1 - 1 1
StrBms Lock
3701 1 0 I 0 37 11 1 1 10 3733 1 0 10
Lilla Edet
34 5 - 35 8 14-15 I 3 1 5
Agnesberg - neberg - 1 5 1 3 1 5
Also in this case a good agreement was obtained between the two methods
The stability of the normally consolidated clay in the GOta River Valley is generally evaluated by the total stress method (~ = 0-analysis) mainly due to the simplicity of this method A total stress analysis reflects the stability of a slope with respect to sudden changes of the applied load and to gradual changes of the undrained shear strength of the soil by e g leaching It is believed that a total stress analysis to a certain extent can be used to investishygate if a small slide will cause a large secondary slide (The initial slide causes a sudden change of the stress conditions in the remaining soil without a change of the water content) Erosion of the river banks often occurs rapidly due to large variations of the water level and the heavy boat traffic in the GBta River The change of the stress conditions by the erosion will generally cause an increase of the pore pressures in the slope due to the high senstivi~ ty of the clay and the high value of the pore pressure coefficient A Dissipation of excess pore pressures and changes of the water content of the clay take place verg slowly due to the low permeability of the clay (10- to 10-10 cmsec) It is believed that changes of the stability conditions by such rapid changes of the stress conditions is better reflected by a total stress analysis than by an effective stress analysis In this case a total stress analysis will give a lower safety factor than an effective stress analysis The limitation of a total stress analysis is however the evaluation of the average undrained shear strength of the soil It ia known that anisotroshypy and the direction of the stress increase (Bjershyrum amp Kenney 1967) and thus the test method will affect the measured shear strengths
The undrained shear strength determined by the field vane or by the Swedish fall-cone test are used in the calculations as mentioned above The shear strength determined by vane tests agrees as a rule closely with the cone values because the cone test has been calibrated against the vane teat If the
sensitivity of the soil is high and the sampling depth is large the vane shear strength is however frequently higher than the cone strength because of the disturbance of the soil samples
The actual shear strength is probably higher than the vane or cone values For normally consolidated clays the shear strength along horizontal planes is often higher than along vertical planes This differshyence in shear strength is probably compensated by the strength decrease caused by time
The shear strength used in the calculations is reduced when the liquid limit or fineness number of the clay is larger than 80 or the soil is organic A reduction coefficient of O 9 is often used for slightly
organic clays O 8 for organic clays and silts O 7 for clayey or silty 11 gyttja and 0 6 for peat and 11gyttja 11
( 11 Gyttja 11 is an organic soil of post-
glacial or recent age) Analysis of old slides which have occurred in organic soils with a high liquid limit has indicated that a reduction is required
In Sweden normally a safety factor of at least 1 4 to 1 5 is required with respect to the undrained reduced shearing strength of the soil in areas where the stability conditions can be changed by the construction of e g buildings and roads close to the river or by erosion In areas in the GCgtta River Valley where the stability conditions are supposed not to change in the future and where structures are not located close to the river a nominal spfety factor of 1 3 is generally considered satisfactory In some cases a safety factor as low as 1 2 has been allowed I safety factors of 1 3 to 1 2 are found it is important to protect the slopes from erosion and to prevent buildings to be constructed near the river or to deepen the river channel by e g dredging Where the factor is lower than the above mentioned the actual stability has been increased by about ten per cent through unloading of the river bank by excavation
An effective stress analysis (cff-analysis) is espeshycially valuable to check the stability conditions in the Gata River Valley when gradual changes of the loading conditions or of the pore pressures are expected It is often difficult to predict the magnishytude of these changes Furthermore there are some difficulties in the evaluation of the coefficients ~- and c which are used in an effective stress analysis These coefficients are affected by volume changes during the drained triaxial and the direct shear testsby rotation of the principal stress directions and to a minor extent by the intermediate principal stress There are also some questions about the value of the parameter c to be used in the analysis The parameter c is not reduced at present since a reduction leads to unreasonable results (If a reduced value is used in the calculations then large parts of the Gata River Valley are not stable according to the calculations)
Slope Protection
The slopes along large parts of the GCgtta River do not satisfy the safety requirements mentioned above Therefore extensively remedial works have been or are being carried out along the river By protecting the alopea from local slides it is believed that the
391
SEANCE PLEN1EAE 5
o Excovotion ot top of
slope
Excavation
d Driving of piles
piles
b Flattening of slope
e lowering of ground water level
c Fill ot toe of slope
-
Fig
f Erosion
12 Stabilizatior of slopes
protection
slopes will also be safe against large landslides
The remedial works can be separated into three major groups To the first group belong all methods which tend to decrease the nominal average shear stress along potential slip or failure surfaces The average shear stress can be decreased e g by excavating the soil at top of a slope by flattening the slope by placement of a fill at the toe of a slope or by raising the water level in the river as illusshytrated in Fig 12 a through c To this group belongs also strengthening of the slope with piles (Fig 12 d)
The second group includes methods which tend to increase the shear strength of the soil along potential slip surfaces The shear strength of the soil can be increased e g by lowering the pore pressures by drainage or by pumping (Fig 12 e To the third group belong methods which prevent a decrease of the slope stability by e g erosion Erosion can be prevented by a reversed filter at the toe of the slope as illustrated in Fig 12 f
The method chosen at a particular location is dependent of the local conditions such as the height and the slope of the river banks the presence of permeable layers in the soil the average shear strength of the soil and of the erosion
It is generally much more effective to remove part
of the soil at the top of the slope as shown in Fig 13 than to flatten the slope or to place a fill at the toe of the slope
A fill at the toe of the slope is often partly located below the water level where only the boyant weight of the fill is effe_ctive
13 Increase of slope stability by excavation at top of slope
392
MA1N
Fig 14 Slide caused by the driving of pile~
Piles are seldom used to increase the slope stability except when the space at the top of the slope is restricted by an adjacent road or by buildings However the driving of piles may temporarily decrease the slope stability by the remoulding of the soil or by the lateral displacement of the slope towards the river A slide caused by pile driving is shown in Fig 14 In this case the lateral displaceshyments and the resulting shear deformations of the soil were sufficiently large so that the peak strength of the soil was exceeded Broms amp Bennershymark 1968)
If the sensitivity of the soil is high the reduction of the shear strength at large lateral displacements can be large However due to the relatively high clay content of the clay in the G5ta River Valley the reduction of the shearing strength is generally moderate Experience has showlil that the lateral displacement and the strength reduction is decreased if the row of piles located close to the river are driven first
The ground water pressure can generally only be middotlowered where silt or sand layers are present in the soil In areas with artesian pressures the ground water pressure can be lowered with bleeder wells In all other cases the ground water pressure can only be lowered by pumping However a lowering of the ground water pressure causes settlements and may cause wells in the area to go dry
The erosion protection is often combined with a flattening of the slopes to prevent local failures as mentioned previously An erosion protection consists generally of a 2 m thick layer of rock fill which is placed by dumping (Fig 15)
SESSION 5 The fill is not compacted The maximum particle size is at least 15 cm Only the sections where the erosion at present is very active is protected However a change of the local conditions (e g a change of the maximum water flow or of the ship traffic) may change the areas affected by erosion
Slide warning systems have been installed by the Swedish State Railways (s J ) The warning system consists of a thin electric wire with a tensile strength less than 110 lb which is placed in the ground in a zig- zag pattern as illustrated in Fig 16 at a depth of 1 0 m The train traffic is stopped automatically when the cable oreaks
r 30m f JOm 30m I 30m 30m 1 30m j 30m
Eloctrnol conlocl
Eleetr~ coble (ma~imum hniale slre11glh of 10 lb)
Post wh1et1 1gtrou11ts -----gt-u d1s1gtlacombulllll cf
lht cohto Whf-11 slrbullkhod
Fig 16 Slide warning system type Swedish State Railways
Twice each year the G5ta River Valley is inspected by personal from the Swedish Geotechnical Institute The erosion of the river banks is followed with aerial photographs The erosion of the river bottom is checked by soundings Also the construction of new buildings storage tanks the placement of fills etc cloa-e to the river is controlled by the Institute
REFERENCES
Bishop A W 1955 11 The Use of Slip Circles in the Stability Analysis of Slopes Geoshytechnique Vol 5 No 1 pp 7-17
Bjerrum L amp Kenney T C 1967 0 Effect of Structure on the Behaviour of Normally Consolidated Clay11 Proc Geotechn Conpound Oslo Vol 2 pp 19-27
Broms BB amp Bennermark H 1967 11 Shear Strength of Soft Clay 11 Discussion Proc Geotechn Conpound Oslo 1967 Vol 2 pp 118- 120
Gibson R E 1953 Experimental Determination of the True Cohesion and True Angle of Internal Friction in Clays Proc 3 Int Conpound Soil Mech a Found Engng Vol 1 pp 126- 130
GBtatilvkommittfn 1962 11 Rasriskerna i G5tatilvshydalen11 Statena Offentliga Utredningar 1962 48 Inrikesdepartementet Stockholm 160 pp
Hansbo S 1957 11A New Approach to the Determishynation of the Shear Strength of Clay by the Fall-Cone Test11
bull Proc Swedish Geotechn Institute No 14 Stockholm 47 ppFig 15 Erosion protection
393
SEANCE PLENIERE 5 Jakobson Bbull 19~2 The Landslide at Surte on the Ftirhandlingar Vol 80 No 1 Stockholm
GOta River 11 bull Proc Swedish Geotechn pp 87-96 Institute No 5 121 pp
Soderblom R 1969 Salt in Swedish Clays and Kallstenius T 1958 11 Mechanical Disturbances in ta Importance for Quick Clay Formation
Clay Samples Taken with Piston Satnplerz 11 Results from eome Field and Laboratorybull
Proc Swedish Geotechn Institute No 16 Studies 1 Proc Swedish Geotechn
75 pp Institute No 22 (in press)
Kallstenius T 1961 11 Development of Two Modern Osterman J 1960 Notes on the Shearing Continuous Sounding Methods 1 Proc 5 Int Resistance of Soft Clay Acta Polyshy1
Conf Soil Mech a Found Engng Vol technica Scandinavia Ci2 2631959 22 pp 1 pp 475-480
Swedish Committee on Piston Sampling 1961 11 Standard Piston Sampling Proc SwedishKallstenius T 1963 Studies on Clay Samples Geotechn Institute No 19 StockholmTaken with Standard Piston Sampler 11
bull Proc Swedish Geotechn Institute No 21 p 195 45 pp
Kallstenius T amp Bergau W 1961 11 In Situ Detershymination of Horizontal Ground Movements 11
Proc 5 lnt Conf Soil Mech a Found Engng Vol 1 pp 481-485
Kallstenius T amp Wallgren A 1956 11 Pore Water Pressure Measurement in Field Investigashytions11 Proc Swedish Geotechn Institute No 13 Stockholm 58 pp
Karlsson R 1961 Suggested Improvements in the Liquid Limit Test with Reference to Flow Properties of Remoulded Clays 11
Proc 5 Int Conpound Soil Mech a Found Engng Vol 1 pp 17 1- 184
Karlsson R 1963 11 0n Cohesive Soils and Their Flow Properties Swedish Geotechn lnatitute Reprints and Preliminary Reporta No 5 24 pp
Karlsson R amp Puoch R 1967 Shear Strength Parameters and Microstructure Characshyteriotico of a Quick Clay of Extremely High Water Content Geotechn Conf Oslo 1967 Vol 1 pp 35-42
Karlsson R amp Viberg L 1967 11 Ratio cp in Relation to Liquid Limit and Plasticity Index with Special Reference to Swedish Clays 11
Proc Geotechn Con Oslo 196( Vol 1 pp 43-47
Kjellman W Kallstenius T amp Wager 0 1950 11Soil Sampler with Metal Foila 11 Proc Swedish Geotechn Institute No 1 76 pp
Odenstad S 1958 11 Jordskredet i GOta den 7 juni 1957 11
Geologiska Ftireningens i Stockholm F6rhandlingar Vol 80 No 1 Stockholm pp 76-86
Skempton A W 1954 11 Discussion of the Structure of Inorganic Soil1 1
bull J Soil Mech a Found Div Proc ASCE Vol 80 Sep No 478 pp 19-22
S6derblom R 1957 11Some Investigationa Conshycerning Salt in Clay 11
Proc 4 Int Conf Soil Mech a Found Engng Vol 1 pp 111-115
S6derblom R 1958 11 Saltaonden och desa anvindshyning vid beatamning av skredbottnen vid GOta bull Geologiska FOreningens i Stockholm
394
VIBRATORY COMPACTION OF COHESIONLESS SOILS
by Bengt B Broms and Lars Forssblad
reprinted from
Proceedings of Specialty Session 2 Soil Dynamics
Seventh International Conference on Soil Mechanics and Foundation Engineering
Mexico City Mexico August 1969
VIBRATORY COMPACTION OF COHESIONLESS SOILS
Bengt B Broms and Lars Forssblad
Bengt B Broms is Director of the Swedish Geotechnical Institute
A graduate of Chalmers Institute of Techshynology in Gothenburg Sweden he received his MS and Ph D degrees from the University of Illinois
From 1959- 1964 he was Associate Professor at Cornell University and he now lectures at the Royal Institute of Technology
He has published widely on the properties and behavior of reinforced concrete members and concrete piles characteristics of soils and soil-structure interaction
He has served on the American Concrete Instishytute Committee on Concrete Piles and the ACI- ASCE Committee on Reinforced Concrete Columns He is presently a member of the Swedish Geotechnical Society committees on Laboratory Testing and on Soil Exploration Bengt B Broms
Lars Forssblad is Research Manager of AB Vibro- Verken in Solna Sweden
He received the degrees of Civil Engishyneer and Doctor of Technology from the Royal Institute of Technology in Stockholm
I~ Before joining AB Vibro-Verken he was active for ten years in design and supervision of dam and water power construction in Sweden
He is author of the publication Invesshytigations of Soil Compaction 21_ Vibrashytion
Lars Forssblad
I INTRODUCTION tons was developed by Losenhausenwerk as early as 1933 This vibrator had a variable frequency between 10 and 25 cps and a maximum depth effect
Vibratory soil compaction was first studied and of 2 0 to 25 m (Muller amp Ramspeck 1935 applied in Germany during the 1930 s (Loos 1936) Ramspeck 1937) Losenhausenwerk also designed A self-propelled caterpillar- type vibrating at about the same time a self-propelled 1 5 plate compactor with a total weight of about 25 ton vibrating plate compactor
101
The vibroflotation method where heavy internal vibrators in combination with jetting are used to compact cohesionless soils to large depths was also developed in Germany during the 1930 s (Schneider 1938)
Other types of vibratory soil compactors were developed during the 1940amp such as tractorshydrawn and self- propelled vibrating rollers multiple plate compactors and vibrating tampers (rammers) as described eg by Garbotz (1958
Table 1 Different types of vibratory soil compactors
Surface vibrators
Type of machine Weight Frequency
Vibratine tampers (rammers)
tHand- guided 50- 150 kg about 10 cps (100-300 lb)
Vibratine plate compactors
Self-propelled hand-guided 50- 3 000 kg 12 - 80 cps (1 00-6000 lb )
Multiple-type mounted on 200- 300 kg 30 - 70 cps tractors etc (400- 600 lb)
Crane-mounted1) up to 20 ton 10 - 15 cps
Vibrating rollers
Self- propelled hand-guided 250- 1500 kg 40 - 80 cps (one or two drums) (500-3000 le) Self-propelled tandem- type 0 7- 10 ton 30 - 80 cps
Self-propelled driving 4 - 25 ton 20 - 40 cps rubber - tires
Tractor-drawn 1 5- 15 ton 20 - 50 cps
1) Used on a limited scal e
Self- propelled vibrating rollers are of three main types - hand- guided vibrating tandem rollers and vibrating rollers with two driving rubber- tires Tractor-drawn vibrating rollers with weights up to 15 tons and vibrating rollers with driving rubber- tires with total weights up to 25 tons are nowadays used
The use of vibratory soil compaction has inshycreased considerably during the last 5 to 10 years Vibratory soil compaction was initially used only for cohesionless soils (Lange 1940 Leussink 1951) Nowadays vibrator y compactors are also used to compact cohesive soils and asphalt surfaces The main applications are given in Table 2
The knowledge of the factors affecting vibratory compaction of soil i s still incomplete in spite of the extensive investigations which have been carried out all over the world s ince the 1930s The compaction of cohesionless soils is affected
102
1959) Erl enbach (1959) Kronenberger (1960) Leussink (1960) and Forssblad (1965)
Vibratory soil compactors can be classified as indicated in Table 1 Vibrating tampers are light hand- guided machines operating at a low frequency about 10 cps and with a large amplitude The types of self- propelled vibrating plate compactors which are most commonly used today weigh between 100 and 500 kg
Internal vibrators
Type of machine Diameter Frequency
Concrete vibrators
Manually operated or 5 - 15 cm 100 - 200 cps tractor-mounted (2 - 6 in)
Vibroflotation eguipm
Crane-mounted 23 - 38 cm about 30 cps ( 9 - 15 in)
eg by average grain size grain size distrishybution shape of particles water content pershymeability compressibility shear strength etc Also the properties of the vibratory compact or such as frequency nominal amplitude centrishyfugal force and total weight affect the comshypaction The descriptions of the soil and of the compactor in test reports and technical articles are usually very schematic
The many factors which affect the vibratory comshypaction make it difficult to draw general conclusions It is therefore important to study carefully the actual test and soil conditions before test r esults are applied to other conshyditions than those under which the tests were carried out
This report deals mainly with vibratory compacshytion of cohesionl ess soils but some data and results from investigations on rock fills and cohesive soils are given for comparisons
Table 2 Applications of vibratory soil compaction
Type of machine
Vibrating tampers rammers)
Vibrating plate compactors
Self-propelled hand-guided
Multiple - type
Vibrating rollers
Self- propelled hand- guided
Self-p ropelled tandem type
Self-propelled driving rubber-tires
Tractor-drawn
II ELEMENTS OF SOI L COMPACTION
The purpose of compaction is to improve the strength and deformation properties of soils The shear strength of cohesionless soils inshycrease while the compressibility and the pershymeability decrease with increasing density For example the angle of internal friction of sand or gravel increases with up to 12deg when the relative density increases from loose to dense
The compressibility of cohesionless soils is also affected by small changes of the density Compaction of a soil will often increase the equivalent modulus of elasticity as determined by plate load tests 5 to 10 times
The permeability is also affected appreciably by the relative density When the relative density increases from loose to dense the permeability of a uniform sand or gravel deshycreases by about 50 to 60 The change of the permeability increases with increasing coefshyficient of uniformity and with decreasing grain size (Taylor 1948)
The compaction of a soil is in most cases exshypressed by the relative compaction or by the relative density The relative compaction or the degree of compaction RD() is defined by
Applications
Street repair Fills behind bridge abutments retaining and basement walls etc Trench fills
Base and subbase compaction for streets side-walks etc Street repair Fills behind bridge abutments retaining and basement walls etc Fills below floors Trench fills
Base and subbase compaction for highways
Base subbase and asphalt compaction fo r streets sideshywalks parki ng areas garage dri veways etc Fills behind bridge abutments and re ta ining walls F i lls below floors T rench fi lls
Base subbase and asphalt compac tion for highways streets s i de-walks parking areas garage dr iveways etc Fills below floors
Base subbase and embankment compaction for highways stree ts parking areas air fields etc Rock fill dams Fills soil or rock) used as foundations for residenti al and industrial buildings
Base subbase and embankment compaction on highways streets parking areas air fields etc Earth- and rock fill dams Fills (soil or rock) used as foundations for residential and industrial buildings Deep compaction of natural deposits of sand
the equation
R = ~ x 100 (1)D Yd max
where y is the actual dry density (dry unit weight)dand yd maxis the maximum dry density determined by ~he Proctor compaction tests (standard AASHO modified AASHO etc ) or byshyvibratory compaction methods as illustrated in Fig 1
a b C
middot- -middotlt middotmiddotmiddot
Fig 1 Laboratory Compaction Methods a) Proctor Compaction Test b) Vibratory Compaction Test with Vibrating Table and Surcharge Load c) Vibratory Compaction Test with Vibrating Tamper or Hammer
103
--
The compactjon of cohesionless soils is often expressed by the relative density The relative density ID() of a soil with the void ratio e is definea by
X 100 ( 2)
In this equation emax and emin are the maximum and the minimum void ratio of the soil respectshyively The relative density is equal to zero when the soil is loose (e = emax) and 100 when the soil is dense (e = e in) For a soil with the dry density yd Eq (~J can be rewritten as
Ydmax (yd- Yd minl - X 100 (3)
Yd (yd max- Ydmin)
where Ydmax and Ydmin are the maximum and minimum dry density of the soil respectively
A vibratory compaction method for cohesionless free- draining soi l s has been developed by the Bureau of Reclamation (1963) This method has been approved as ASTM Standard D 2049 The maximum dry density is determined by vibrating the soil either saturated or completely dry for 8 minutes in a test mould under a surcharge load (Fig 1 b) The volume of the mould is 0 1 cu ft alternatively 0 5 cu ft
The maximum void ratio emax and the minimum density yd min are usually determined by pouring dry soil through a funnel into a Pr octor mould The funnel is generall y held 25 mm above the soil surface Soils with particles larger than 10 mm are generally placed with a scoop (Bureau of Rec l amation 1963)
The maximum density can also be determined by laboratory compaction tests using a vibrating hammer or a vibrating tamper working on the surface of the material (Fig 1 c) The method using a vibrating hammer nas been developed by the Road Research Laboratory in England (Parsons 1964 Odubanjo 1968)
The vibrating tamper method has been developed by Vibro- Verken (Forssblad 1965 1967) Accordshying to this method the soil is compacted in two layer s in a mould with 15 cm diameter Each layer is vibrated for 2 min The resulting maximum dry density is for saturated cohesionless soils about the same as that determined by the modi fied AASHO compaction test
The compaction water content has a different effect on the compaction of cohesionless free shydraining soils than on fine-drained cohesive soil s The water content of a free - draining soil decreases during the compaction if the initial water content is high while the water content does not change for fine-grained soils As a result the Proctor curve of f r ee-draining soils terminates near the maximum value (Fig 2) If a sandy or gravelly soil contains some silt or clay it is not free-draining and excess water does not drain out during the compaction The resulting compaction curve is regular as shown in Fig 2 by Curve 2 Cohesionless freeshydraining soil s very often have comparatively flat compaction curves as illustrated in Fig 2 by Curves 1 3 and 4 In some cases two maxima are obtained probably because of capillary
104
forces in the partially saturated soil
pcf tm
24 23
140 10 ~ 22 Ii- V~
2 1130 ~ 2J Icopy V ~ ii 120
[- --V ~ 19 ~ lltD middotc 18 I110
~ 17 - 0 Icopy
100 16 ~i-- -
15
90 14
1380
12 0 8 10 12 14 16 18 20 22 24
Water content percent
US standard sieve size 34 middotn Nobull No 40 N e 100 No 200 - Il 1-I- I I0i Ibull-0 iv-bull I I
I
~ ~T I1 II I
I
i I II 1 1 i I
II 1 I I I I~ 0_ III I-
I I I
I r- I 11 ~ 1 -r-- II I ~ I
II ~ lv 10 10 01 0 01
Groin size in millimeters
Fig 2 Compaction Curves Obtained with the Modified AASHO Method and Grain Size Distr ibutions for Different Types of Sandy Soils
Due to the compar atively flat compaction curves for free-draining soils and the fact that excess water can drain out during the compaction the water content of the soil is not as imshyportant for cohesionless free-draining soil s as for fine- grained soils The best compactionof sand and gravel is usually obtained when the soil is saturated or completely drybut a comparat i vely good compaction can frequently be obtained also when the soi l is part i ally saturated
Investigations by Bureau of Reclamation (1963) and others as well as practical experience indishycate that a soil usually can be characterized as free-draining if the content of fines ( soil particles with a diameter smaller than 0 06 or 0 074 mm) is less than 5 to 10 In special
cases soils can act as free- draining when the content of fines is as high as 15 to 20
However well-graded sandy and gravelly soils (silty sand clayey gravel etc ) with more than 5 to 10 of fines are as a rule not free shydraining These soils have certain cohesive properties and the control of the compaction water content is essential (Fig 2)
The relevance of the Proctor compaction tests to vi bratory compaction of cohesionless soils has been questioned by many investigators (Lane 19ll8 Felt 1958 Morris amp Cochrane 1965) It has been suggested that vibratory soil comshypaction should be correlated with laboratory compaction tests based on vibration
Impact compaction tests such as the Proctor compaction tests are generally time consuming in comparison with vibratory compaction tests In addition impact tests are to a certain extent affected by the manual performance
A further advantage with vibratory compaction tests is that such tests can be adapted to test moulds with large diameters and can ther efore be carried out on samples containing stones
III TECHNICAL DATA OF VIBRATORY COMPACTORS
There are no accepted rules regarding the techshynical data which should be specified or given for vibratory compactors in specifications technical reports etc Sometimes such more or less undefined terms as dynamic force dynamic load compaction effort in tons impulse in tons per second equivalent static weight are used
The vibrations of the drum of a vibrating rolshyler or of the bottomplate of a vibrating plate compactor are usually generated by one or several rotating eccentrics The frequency amplitude velocity and acceleration of a sinushysoidal oscillation are defined in Fig 3 The frequency expressed in cycles per minute (cpm) or cycles per second (cps or Hz) is determined by the rotational velocity of the eccentric(s) The amplitude of the drum or the bottomplate is a function of the eccentric moment of the ecshycentric as shown in Fig 4 and of the mass of the vibrating system
The so-called nominal amplitude can be calcushylated from the following equation
t _ Eccentric moment1Nominal amp l ude - Mass of drum or bottorqilate ( 4)
The actual amplitude can for certain frequency ranges be up to 50 to 100 larger than the nominal amplitude due to resonance
The rotating eccentric initiates a centrifugal force which is a function of the frequency and the eccentric moment as shown in Fig 4 (Due to the oscillati ons of the drum or bottomplate there will be a small difference between the real centrifugal force and that calculated from Fig 4 The difference is usually less than 1)
The centrifugal force acts inside the drum or bottomplate Its magnitude is not equal to the dynamic force transmitted to the underlying soil as is sometimes assumed
c ~ Amplitude
J____________1--------lt-
Time
Time T for full cycle
Frequency (number of eye les per sec (1T) ) = f cps or Hz
Amplitude (maximum deviation from position at rest) = s cm (in)
Maximum velocity = vmox = 21C-fmiddots cms (insec)
Maximum acceleration = omax = 4Ttf s cms2(insec)
Fig 3 Definition of Frequency Amplitude Velocity and Acceleration for a Sinushysoidal Oscillation
Weight of eccentric = m kg (lb)
Eccentricity = r cm in)
Eccentric moment = m r kgcm (lb in)
Centrifugal force 41 F - ~ kg (lb) g
= =g = occelerotion due to gravity 981 cm sZ 386 insec
Fig 4 Definition of Eccentric Moment and Centrifugal Force
Through the oscillations defined by their freshyquency and amplitude the vibrating drum or bottomplate affects the surface of the ground with a rapid succession of dynamic loads or impacts Each load cycle generates a stress wave as illustrated in Fig 4 It i s i mportant to make a clear distinction between the vibrashytions of the compactor and the characteristics of the stress waves in the soil The charactershyistics of the stress waves are to a large exshytent dependent on the properties of the soil
The static weight of vibratory compactors has a
105
large influence on the compaction effect since the kinetic energy as well as the momentum (mass x velocity) of the vibrating drum or bottom plate are directly proportional to the weight if the amplitude and the frequency are constant Test results indicate for example that the maximum depth to which a soil can be compacted is depending on the total static weight of the compactor However the compaction close to the surface is for vibrating rollers also to a large extent influenced by the static weight per linear inch of drum width
The ratio of drum and frame weight is also of importance with respect to the compaction efshyfect However this weight ratio is given in specifications technical reports etc for vishybrating rollers and vibrating plate compactors
It is proposed that at least the technical data in Table 3 should be given in specifications technical reports etc for vibrating rollers and vibrating plate compactors
TABLE 3 -- TECHNICAL DATA FOR VIBRATING ROLLERS AND VIBRATING PLATE COMPACTORS
Vibrating rollers Vibrating plate compactors
Total weight Total weight
Static load per Static load per unit area of inch of drum width bottom plate
Drum width Width of bottom plate
Drum diameter Length of bottom plate
Frequency Frequency
Nominal amplitude Nominal amplitude
Eccentric moment Eccentric moment
Centrifugal force1 ) Centrifugal force1 )
Working speed Working speed
l) Can be misleading if compactors with two different frequencies are compared
IV COMPACTION MECHANISMS
A large number of factors affect the vibratory compaction of cohesionless soils According to Lorenz (1955 1960) the most important of these factors are the resonant frequency of the comshypactor - soil system (Hertwig 1931 1933) the number of load cycles (Tschebotarioff and McAlpin 1947) and the shear strength during the vibration (Mogami and Kubo 1953)
Whiffin (1954) Forssblad (1965 ) and others have pointed out however that also the magnishytude of the dynamic stresses generated in the soil by the vibrator is of great importance for the results of the compaction
1 Resonance
According to Hertwig (1931 1935) the highest
density of a soil is obtained at the resonant frequency of the vibrator - soil system where the amplitude reaches a maximum Also Terzaghi (1943) Bernhard (1952a 1959) Converse (1954 1957)and others recommend that the compaction should be done at the resonant frequency
The resonant frequency varies with the soil type and with the characteristics of the comshypactor Sung (1954) Viering (1957) and Lorenz (1960) for example have pointed out that the resonant frequency depends on the eccentric moment the weight and dimensions of the vibrator and on the properties of the soil Also Barkan (1960) and others have discussed the factors affecting the resonant frequency of the vibrator - soil system
Compaction tests and practical experience do not indicate however that vibratory compaction at the resonant frequency will give a higher density than at other frequencies (eg Lorenz 1955 1960 Forssblad 1955 1965 Kutzner 1962 Usually the density of compacted soil will increase with increasing frequency even at frequencies exceeding the natural frequency of the vibrator - soil system One reason as pointed out by Forssblad (1965) is that the centrifugal force and the momentum and thus the 11 intensity 11 of the vibrations also increase with increasing frequency The resonance effects of the vibrator - soil system will in this case be combined with the effects of an increase of the 11 intensity11 of the vibrations as graphically illustrated in Fig 5 The resonance effect is in this case 11 hidden 11 bull Due to this reason medium and heavy-weight vibrating rollers often are designed with a frequency just above the resonance frequency of the vibrator - soil system
Nominal o litude 2 s
sect Nominal a itude s
C
~l-----j-ft--i-----1-------j
1 u _____ ----g_
0 tvbgnificot
amplitude n of nominal e to resonance
10 20 30 Frequency
Fig 5 Effect of Frequency and Amplitude on Vibratory Compaction of Soil
2 Number of Load Cycles
According to Tschebotarioff and McAlpin (1947) the number of load cycles and the centrifugal force govern the density of the compacted soil when the frequency is low About 10000 cycles were required to reach the maximum density of a sand when the centrifugal force was 9 and 187 kg The maximum density increased with inshycreasing centrifugal force When the centrifugal force was 37 and 75 kg approximately 30000
106
load cycles were required These tests were carried out at f r equencies between 1 0 and 25 cps
Kutzner (1962) also f ound from vibratory comshypaction tests with glass beads and dry sand that the density increased with increasing numshyber of load cycles or wi th increasing vibr ation time For the glass beads the increase was small after 500 load cycles About 9 000 load cycles were required to reach the maximum denshysity of the dry sand at a frequency of 50 cps
Tests by Whitman and Ortigosa (1968) indicate that the density of a compacted cohesionless soil at accelerations less than 1 g is primarily governed not only by the number of load cycles but also by the stress increase in the soil The density increased as the logarithm of the number of cycles The increase of the density was however smal l when the initial relative density was larger than 70 and the ratio of the maximum and the mi nimum cyclic stress from the vibration was less than 5
The test results thus indicate that the number of load cycles is of special importance at low accel erations The number of load cycles reshyquired to reach a given relative density is also influenced by the gradation of the soil
3 Shear Strength During Vibration
Mogami and Kubo (1953) observed that the shear strength of dry sand decreased with increasing acceleration They investigated two types of dry sand in a direct shear apparatus (Fig 6) at frequencies ranging from 10 to 50 cps and at accelerations which varied up to 20 g The test results indicated that the shear strength decreased approximately linearly when the acceleration increased from 0 5 to 1 0 or 2 0 g
The shear strength of sands under vibratory loading has also been investigated by Linger (1963) with direct shear and triaxial tests The vibratory tests gave a lower shear strength than the static tests The superimposed vibrashytory loads caused a reduction of the normal load for the direct shear tests and of the confining pressure for the triaxial tests
11 175~ JJ7
Fig 6 Test Equipment for Determination of Soil Shear Strength Wi th and Without Vibrations Used by Mogami amp Kubo (1953)
The degree of saturation and the water content
affect appreciably the compaction properties of sand due to capillary forces between the indivishydual soil particles ( false cohesion) In Fig 7 is shown the dr y density of uniform coarse medium and fine sands as a function of the water content (Kutzner 1962) It can be seen that the dry density of the soil compacted either dry or saturated was approximately the same The lowest density was obtained when the water content was 5 to 10 Kutzner also carried out compaction tests where a wetting agent had been added to the pore water In this case the dry density of the coarse sand after compaction was approximately independent of the water content (Fig 7) These tests indicate that the compaction of partly saturated cohesionshyless soils is appreciably affected by capillaryforces
~ ~18 0~
17 L
~-0-
r
1 16
c 15 f = 50cps0
middot S= 085 mm3
middotc O= 85g~
~ Cl
13 I ---wetfin agent
)C
)C
120 5 10 15 20 25 Water content percent
Fi g 7 Vibratory Compaction of Sand at Difshyferent Water Contents After Kutzner (1962)
Forssblad (1965) used the vane test to study the shear strength of mainly cohesionless soils with and without vibrations at different water conshytents The test data indicated that the vibrashytory shear strength varied between 1 to 6 of the static shear strength The lowest value was obtained for gravel sand gravelly silt or crushed stone when the soil was either dry or saturated The vibratory shear strength of all investigated soils was about the same
4 Dynamic Stresses
The compaction of a soil is to a large extent dependent on the type and the intensity of the stress waves generated by the vibrator Longshyitudinal and transverse waves are transmitted through the soil while Rayleigh and Love waves follow the ground surface In a transverse wave the soil particles move in a plane pershypendi cular to the direction of wave propagation while in the longitudinal waves the particles move in the direction of the wave propagation The transverse waves propagate with about half
107
the velocity of the longitudinal waves (also called compressional waves)
The amplitude of the longitudinal and of the transverse waves gener ated by vibrating roll~rs or plate compactors decrease with increasing di stance from the vibrator mainly due to geoshymetrical damping There is a l so a reduction of the amplitude due to absorption of energy by the soil
According to Forssblad (1965) the intensity of the stress waves must be high enough to overshycome the shear strength of the soil In a partly saturated sand and grave l with a relashytively low apparent ( false) cohesi on a verti~al dynamic stress of about 0 5 to 1 0 kgcm was required to reach a relative comshypaction of 90 with respect to the modified AASHO c ompaction test For clays a considerably larger pressur e - about 5 kgcm2 was required to reach the same r elat i ve compaction at the optimum moistur e content
Whiffin (1954) has measured the stress distrishybution bel ow a vibrating roller a static rolshyler a power r ammer and a crawler tractor in two types of clayey soils Whiffin found a relationshyship between peak pressure (static or dynami c) and the relative compaction of the soil whi ch was independent of the type of compaction machine and of the duration of the stress pulse The dynamic str ess gener ated by the vibrating r oller was about 100 l arger than the corr esponding static stress increase These results have been confirmed by other authors
For ssblad (1965) has measured the vertical dyshynamic stresses below different types of vibrashytory compactors and for di fferent soil types As shown in Fig 8 the maximum vertical dynamic stress decreased rapidly with increasing depth below the gr ound surface Forssblad found that it was possible to calcul ate approximately the dynamic stress distribution by Boussinesq s equation for a compacted soil For a loose soil the dynamic stresses in the soil were less than those calculated by Boussinesq s equation Also Ber nhar d (1952a 1952b 1962 1967) Christoffel (1960) and others have measur ed the stress distribution in the soil below different types of vibratory compactors
Vertical dynamic stress 10 20 JO ~o ~o o0 10 eo 90 middoto 10 20 JO bull 0 0
o 1
10 ___ JI _ l= 20 ~-
10 I 1JO J ---i----
10 II
llh
s o JO0 80 - - - -
0 Vibro1ing p loiit compoctOI 13S lrg (300 lb)
-iOO kg (900 lb)100 ~v 2 - -- - -r 3 Vibt01ing tamper 60 lrg (130 lb)IIC
I vaoillg roller 1i ton 120 s 3 3 lo1I - - -IJ O I bull - - - 12 5 IOfI
I 10
Fig 8 Vertical Dynami c St ress es at Different Depth Under Vibrator y Compactor s of Di fferent Types a nd Sizes According to Forssblad (1965)
Reflection of the stress waves against lower more compact layers can give special compaction effects Near such a layer the compaction of a soil will sometimes be better than that close to the surface Reflection can also have a loosening effect when thin layers of soil are placed on a rigid base
Luscher et al (1967) Ortigosa and Whitman (1968) and D Appolonia et al (1969) have sugshygested that both the maximum and minimum dyshynamic stress in the soil are factors which affect vibratory compaction of cohesionless soils The minimum dynamic stress in the soil should not be much larger than zero to obtain a good compaction Even if the minimum dyshynamic stress is relatively small the soil particles are not free to move
5 Liquefaction During Compaction
The pore pr essur e in a saturated sand builds up progressive l y during the vibrat i on if the re shylative density is low and the sand is not freeshydraining The compactor bogs down when the pore pressure approaches the total overburden pr essure of the soil and the vibrator This phenomenon is called liquefaction Li quefaction is depenshydent on the permeability the initial density of the sand the number of load cycles the over shyburden pressure and the intensity of the cyclic load (Seed and Lee 1966 Lee and Seed 1967 Peacock and Seed 1968 Seed 1968) The vibrashytory load and the number of load cycles required for liquefaction increase with increasing r elashytive density and with increasing overburden pressure
The minimum permeability for the soil to be free - draining is a function of the towing speed the thickness of the compacted layer and the compressibility of the soil Approximate calshyculations indic~te that the permeability should be at least 10- cmsec for a layer thickness of 20 cm a towing speed of 4 kmhour and a volume compressibility of 0 02 cm2kg for the soil to be free - draining and to avoid that the compactor bogs down It has been assumed that the consolidation ratio should be at least 50 for each pass
V VIBRATING ROLLERS
A large number of differ ent types of vibrating rollers a r e used as shown in Table 1 The frequency varies between 20 and 80 cps and the nominal amplitude between 0 3 and 2 5 mm Some types of vibrating rollers operate at a higher frequency in combination with a l ow nominal amplitude Other types have relatively low frequencies and l arge amplitudes The frequency can often be changed by changing the engine speed There are a l so v i br ating rollers with adjustable eccentric moment so that the nomi nal amplitude can be varied Tractorshydrawn vibrating rol l ers usually have a centrishyfugal force which is 2 to 3 times the total weight of the roller
The Road Research Laborator y i n England initishyated in 1945 (and is still conducting) ext ensi ve compaction tests with different types of static and vibratory compactors An early investishygation by Hunt (1946) i ndicated that a higher
108
density was obtained for a coarse sand by a 215 kg vibrating roller than by a 12 ton rubber tired roller or by an 8 ton static smooth wheel roller The layer thickness was 22 cm Later compaction tests were carried out on a number of standardized soils (gravel- sand-clay wellshygraded sand uniformly graded fine sand sandy clay and heavy clay) The first three of these soils contained about 15 of fines Detailed results from the compaction tests are available in a number of special reports The test reshysults have been summarized and discussed by Lewis (1954 1960 1961 1967) According to Lewis (1967) vibrating rollers with weights up to 1 ton could only be used to compact granular soils Tractor- drawn vibrating rollers with weights between 3- 34 and 8-12 tons were suitshyable for all soil types also clays The reshyquired number of passes for vibratory rollers were 4 to 6 The maximum layer thicknesses which were recommended for the test vibratory compactors are relatively low The main reason is probably the comparatively high content of fines in the tested soils Lewis (1961) has published results which show a relationship beshy~ween the dry density of the compacted soil and the frequency of the vibrations (Fig 9) In the tested frequency range the effect of changes in frequency was significant only with the granular soils ( Compare also Fig 9 with Fig 5)
Lewis (1961) has also reported results from compaction tests on a well- graded sand with a 3- 34 ton tractor-drawn roller at different towing speeds and different number of passes These test results indicated that a larger towing speed must be compensated by a larger number of passes in order to reach a given reshylative compaction It was found that the reshylative compaction was mainly dependent on the total vibration time on a given surface area
The test results obtained at the Road Research Laboratory have been discussed and analyzed by Johnson and Sallberg (1960) Morris and Cochrane (1964)and others Johnson and Sallberg (1960) pointed out that a good correlation was obtained for vibrating rollers between the degree of comshypaction and the static weight per cm of roll width
Compaction tests have also been carried out at the National Swedish Road Research Institute (Bruzelius 1954) Typical Swedish soils (coarse gravel sand silt and moraine) were compacted in 06 m to 10 m lifts A considerably higher relative compaction was obtained by a 3 ton tractor- drawn vibrating roller and also by a 1 5 ton vibrating plate compactor than by static rollers The maximum effective compaction depth ranged from 05 to 10 m for the vibratory comshypactors The surface density of the soil was generally lower than the density at some depth below the surface The maximum dry density was obtained at a depth of 10 to 30 cm
Two manually- guided vibrating rol l e r s weighing 250 kg and 16 tons have been tested at the Central Road Research Laboratory in India The f r equency was one of the factors which was varied during the tests (Gokhale and Rao 1957)
Garbotz and Theiner (1959) at the Technische Hochschule Aachen Germany have carried out extensive compaction tests with static smooth wheel rollers vibrating rollers and vibrating
l5r-------------Goe-coy
10
- IJS A Wtllbullgroded sand
0
110 - o-tr~
c
l 15
0 ~ -
10 ___t_middot d 115 -- -------------
- - - 13 - Ion troctor drown roller 110 -- Jfrac34 -ton loncJbullm rollbullr
~Havy clay
95---~-- ~--~--~ JO JS o 50
Frequency cps
Fig 9 Relationship Between Dry Density of the Compacted Soils and Frequency of Two Types of Vibrating Roller According to Lewis (1961)
plate compactors Garbotz and Theiner found that uniformly graded cohesionless materials could not be compacted to a higher density by vibrating rollers than by static smooth wheel rollers The depth effect of vibratory comshypactors however was considerably larger than for static smooth rollers Vibratory compacshytion gave the highest degree of compaction for well- graded cohesionless soils
Garbotz and Theiner also found that the degree of compaction of gravel increased when the frequency of a 165 ton tractor-drawn vibrating roller was increased from 23 to 37 cps A further increase in frequency up to 50 cps caused a small decrease of the density For the comshypaction of cohesionless soils Garbotz (1964) recommends for vibrating rollers the combinashytion of a relatively high frequency and a low amplitude
Johnson and Sallberg (1960) have reviewed the factors influencing the field compaction of soils In this report are summarized results from compaction tests available up to that time
Forssblad (1965) has published results from compaction tests on sand with 14 and 3-3 ton tractor-drawn vibrating rollers and with vibrashyting plate compactors weighing 40 120 and 400 kg The influence of the towing speed and of the number of passes was investigated for the 33 ton tractor- drawn roller The required number of passes to reach a specified density increased with increasing towing velocity Test results indicated that the s urface capacity was approximately independent of the rolling speed between 3 and 6 kmh Lower speeds than normal are recommended when the layer thickness is large and when a very high degree of comshypaction is required
Tynan and Morris (1968) have investigated six types of tractor-drawn vibrating rollers weighshying from 3 2 to 9 - 9 tons The compaction tests were carried out on crus~ed rock uniform dune
109
sand and on medium clay at different water conshytents The layer thickness was about 25 cm before the compacti on In the weight class 32 to 5 tons the roller with the largest nominal ampl itude (1 7 mm) and lowest frequency (24 cps) gave for all soil types higher densities than the rollers with a frequency of about 40 cps and a relatively small amplitude For crushed rock and clay the density increased with increasing number of passes up to 16 For the dune sand the increase of the density was small after 2 passes
The optimum water content for the field comshypaction tests was for the crushed rock 1 to 2 higher than the optimum moisture content de shytermined by the modified AASHO compaction test No signifi cant crushing effect was observed for this material For the dune sand the opshytimum moisture content was the same for the field as for the laboratory compaction tests
D Appolonia Whitman and D Appolonia (1969 ) have i nvestigated the compaction of a unifor m dune sand by a 5 ton and by a 3 ton vibrating roller The layer thickness was large Two passes of the 5 ton roller gave the specified compaction (75 relative density) down to a depth of about 60 cm The compaction was not sufficient however close to the surface down to a depth of about 25 cm The density at depths larger than about 25 cm increased substantially with inshycreasing number of passes D Appolonia et al recognized three different compaction zones The soil near the surface was considered to be overcompacted Below this zone to a depth of 60 cm the compaction was believed to be detershymined by the maximum and the minimum dynamic stress generated in the soil by the roller The minimum dynamic stress must be low enough to allow the particles to move The compaction of the soil below a depth of about 60 cm was conshysidered to be caused mainly by the repetitions of str ess (number of load cycles)
The problem with a low surface density of unishyform cohesionless soils has also been discussed by Bruzelius (1954) Garbotz and Theiner (1959) Wiklund (1960) Forssblad (1965) and others Overcompaction can be caused by heavy static rollers as well as by medium and heavy weight vibrating rollers and plate compactors Heavy vibrating rollers can cause overcompaction down to a depth of 40 to 50 cm as indicated by Baker and Moorhouse (1968) The best surface compaction is obtained with light vibrating rollers light and medium weight plate compactors or with light and medium weight static rollers To increase the surface density it is also advantageous to compact the soil at a high water content
Tynan and Morris (1968) observed that the surshyface density of a well- graded crushed rock was low particularly when a heavy high frequency roller was used and the compaction water conshytent was l ow In this case reflection of stress waves against the underlying rigid sub shybase could have contributed to the observed effect
Hall (1968) carried out compaction tests on crushed limestone sand and lean clay The sand contained 8 of material smaller than 0 06 mm The following types of rollers were investigated
a Tractor- drawn vibrating roller weight
32 tons low frequency
b Tractor- drawn vibrating roller weight 1 4 tons high frequency
c Self-propelled vibr ating roller weight 24 tons low frequency
d Rubber- tired static roller weight 50 tons
Rollers a and d gave for the crushed lime shystone and the clay the highest relative comshypaction The compaction by the two rol l ers was similar On sand compactor c gave the best overall results Roller b gave satisfactory results only on the sand
The relationship between technical data and the performance of vibratory rollers has been disshycussed by Tope (1967)
Heavy vibrating rollers are often used to comshypact rock fill and granular soils containing large stones and boulders Field compaction tests indicate that rock fill can be efficiently compacted in thicker layers than sand and gravel The large depth effects which are obshytained with vibrating rollers on rock fill is probably due to the high impact forces which are generated when the vibrating drum comes in contact with large stones Also the damping in rock fill is relatively low
Vibratory compaction of rock fill usually causes a reduction of the volume by 5 to 7 Field exshyperience indicates that 10 to 15 ton vibrating rollers with 5 to 10 passes can compact rock fill in 1 0 to 2 0 m lifts Vibrating rollers with weights between 3 and 5 tons are used to compact rock fill in 0 5 to 10 m lifts
Heavy vibrating rollers are also used to comshypact natural sand deposits with a low initial density in order to increase the bearing capashycity and to reduce the settlements The sand may either be fully or partly saturated If the depth is relatively large up to 20 to 30 passes may be required Boringe and other measurements have indicated a maximum depth effect of 25 to 3 m for 10 to 15 ton vibrating rollers (Baker and Moorhouse 1968)
Winter compaction of soil and rock fill has been investigated in Canada Sweden Norway Finland USA and other countries Frozen soils except clean and dry gravel crushed rock and rock fill can generally not be compacted to the same dry density as unfrozen soils The difficulties with winter compaction increase with increasing water content and with decreasing grain size and temperature (Bernell 1965) Vibrating sheepsshyfoot rollers have been used successfully to compact gravel during the winter Due to the high contact pressures lumps of frozen soil can be crushed Test results indicate however that also with this method the dry density of compacted gravel is about 10 lower than that of the same soil compacted during the summer (Bernell 1965)
During the winter unfrozen soil can often be obtained from excavations When the unfrozen soil is spread out in cold weather the surface freezes rapidly It is therefore important to compact the soil immediately after it has been placed
110
VI VIBRATING PLATE COMPACTORS
The most commonly used plate compactors weigh between 100 and 500 kg With two eccentrics working synchronously it is possible to obtain a directed vibratory force and to move the vibrator during the compaction By adjusting the eccentric element the velocity and the direction of motion can be varied A plate vibrator can also be moved with only one rotating eccentric if the eccentric is placed at the front end of the bottomplate
The frequency of heavy self-propelled vibrating plate compactors is usually between 12 and 20 cps while the frequency of small vibrating plate compactors can be as high as 70 to Bo cps (Table I) The amplitudes vary between 05 and 5 mm The centrifugal force is usually 5 to 10 times the total static weight of the vibrator
The action of plate vibrators have been reviewed by Converse (1954) Bernhard and Finelli (1954) Lorentz (1960) and others Siedenburg (1957) has calculated for inelastic soils the motion of a vibrating plate compactor without a springshysupported engine bed plate Calculations for plate compactors with spring-supported engine bed plates have been made by Bathelt (1956) and by Bathelt and Kock (1956) Bathelt used a mechanical model consisting of three springs to analyze the behavior Two of the springs could not expand after they once have been comshypressed The calculations showed that the centrifugal force for a self-propelled vibrator should be between three to ten times the total weight of the vibrator Similar calculations have also been carried out by Ephremidis (1959) and Weber (1965)
Also Jurecka (1965) has calculated the motion of vibratory compactors and the energy distrishybution in the soil
Compaction tests with vibrating plate compactors have been carried out in Germany during the 1930 1 s as mentioned in the introduction (MUller and Ramspeck 1935 and Ramspeck 1937)
Bernhard (1952a) has carried out compaction tests with a 15 ton vibrating plate compactor and a multiple-plate compactor A relative compaction of 95 with respect to the standard AASHO comshypaction test was obtained for a uniform silty sand by the 15 ton vibrator down to a depth of 75 cm
Converse (1952 1954) has investigated the comshypaction of a uniform beach sand by a vibrating plate compactor with a weight of about 5 tons The dry density of the beach sand was at least 95 with respect to the modified AASHO compaction test down to a depth of 045 to 060 m and 93 to 96 between 060 to 150 m below the ground surshyface
Greenman (1948) has investigated the vibratory compaction of sand and gravel The soil could be compacted satisfactorily to a depth of 30 cm with a light plate compactor The relative compaction was higher than that which could be obtained by internal vibrators or by pneumatishycally operated tampers
Aldous and Wills (1952) have investigated the vibratory compaction of crushed rock gravel and sand The soils were compacted in 15 to 30 cm
lifts by vibrating plate compactors weighing either 70 or 170 kg The maximum density of the gravel was reached after two passes The unit weight of the soil in the lower half of the 30 cm lifts was less than in the upper half
Plantema (1954) used a 15 ton vibrating plate compactor to compact a 5 meter thick sand fill The highest relative compaction was obtained at a frequency of 20 cps The compaction was checked by soundings with a Dutch cone penetroshymeter An appreciable increase of the peneshytration resistance was observed after the comshypaction down to a depth of 20 m The velocity did not affect appreciably the compaction With a light compactor the best compaction was obshytained at a velocity of 4 mmin
Compaction tests with l1J8 ton 140 kg and 40 kg plate compactors have been carried out by Streck and Schmidtbauer (1951J) It was possible to compact a sand to a relative density of 85 within a depth of 60 to 80 cm with the 148 ton plate compactor within a depth of 20 to 30 cm with the 140 kg compactor and within a depth of 20 to 25 cm with the 40 kg compactor
Weiss (1956) has investigated the compaction of sandy gravel and gravel with a 78 ton vibrating plate compactor A relative density exceeding 50 with respect to the modified Proctor comshypaction test was obtained down to a depth of 12 m for the sandy gravel and 17 m for the gravel
Schaeffer (1958) has investigated the effects of frequency and velocity for a light vibrating plate compactor on the compaction of sandy gravel The frequencies 25 33 and 40 cps and the velocities 1J3mmin 7-~ mmin and 105 mmin were investigated The highest density was obtained with the l01middotrest frequency and with the lowest velocity
Garbotz and Theiner (1959) tested a 225 ton vibrating plate compactor The most favorable frequency range was 12 to 17 cps
Garbotz and Christoffel (1964) have carried out tests with vibrating plate compactors and vibshyrating rollers on crushed rock (ballast material)
Kronenberger (1960) has investigated the comshypaction of vibrating plate compactors without spring supported engine bed plates The vibrashyting characteristics and the weight of the comshypactors were varied The maximum dry unit weight and the maximum equivalent modulus of elasticity of the compacted soil were reached at a frequency of about 40 cps Also Lammlein (1953) and Weber (1965) have investigated the performance of vibrating plate compactors Comshypaction of sand by plate compactors has also been discussed by Hoppman (1962)
The Road Research Laboratory in England has made comprehensive investigations of vibrating plate compactors (Lewis 1961) The depth to which soils could be compacted increased with inshycreasing weight and with increasing contact area of the vibrators It was possible to compact satisfactorily a well graded sand to a depth of 30 to 45 cm with a 15 ton or a 2 ton plate comshypactor The depth effect at the same weight was larger for the plate compactors than for the vibrating rollers Lewis found also that fewer passes were required for a plate compactor than
111
for a vibrating roller to reach a given density The surface and the volume capacities given by Lewis ( 1967) for plate compactors were however much lower than those for vibrating rollers
Forssblad (1965) has reported results from exshytensive series of compaction tests with vibrating rollers and plate compactors A relative comshypaction of at least 90 with respect to the modified AASHO compaction test was reached for the layer thicknesses given in Table 4
TABLE 4 -- NORMAL LAYER THICKNESS FOR VIBRATION OF COHESIONLESS SOILS WITH LESS THAN 5 TO 10
OF THE MATERIAL SMALLER THAN 0 06 MM
Vibrating plate compactor 100 to 200 kg 20 cm
Vibrating roller 1 to 2 tons 30 cm
Vibrating plate compactor 400 to 600 kg 40 cm
Vibrating roller tractor drawn 3 to 4 tons 50 cm
Tests and practical experience indicate that it is possible to compact sand and gravel to a high relative density even in high lifts Also relatively fine sand with an average grain size between 006 and 02 mm can efficiently be comshypacted in high lifts by vibrating rollers or plate compactors However comparatively small amounts of fines (silt or clay size particles) will increase considerably the compaction efshyfort required to reach a certain relative comshypaction Also the layer thickness must be deshycreased with increasing content of fines
VII VIBROFLOTATION
Vibroflotation has been used since about 1935 to compact saturated cohesionless soils The method has been described in a number of publications (e g Schneider 1938 Steuerman 1939 1948 Tschebotarioff 1946 Schneider 1948 Rappert 1952 Cassel 1956 D Appolonia et al 1953 Mobus 1959 Watanabe 1963 Thorburn and MacVicar 1968)
Vibroflotation has been developed and applied by the firms J Keller Germany Vibr ofl otation Foundation Co USA Cementation Co England The method has also been used in USSR and Japan Project s where vibroflotation has been used have been described by Schneidig (1940) Leussink (1948) Fruhauf (1949) DAppolonia (1954) D Appolonia and Miller (1955) Plannerer (1965) Hansbo et al (1968) and by Doscher (1968)
The especially designed large internal vibrators (vibrofloats) have generally a diameter of 37 -5 cm and operate at a frequency of 30 cps The nominal amplitude is about 10 mm and the centrishyfugal force is up to 10 tons The vibrators are provided with jetting devices which facilitate the insertion and the withdrawal of the vibrashytors Sand or gravel is added during the vibration to compensate for the subsidence at the ground surface as the soil around the vibro-
112
floats is compacted With this method the soil can be compacted down to a depth of 20 to 30 m Vibroflotation has mainly been used to compact natural strata of sandy soils with a relatively high permeability A maximum amount of 8 to 16 of particl es smaller than 0 06 mm can gener-allybe allowed
Test results by DAppolonia et al (1953) indishycated that the relative density of a fine unishyform sand is at least 70 to a distance of 1 m from the vibrofloats A spacing of 2 m between the insertion points gave a minimum relative density of 70 throughout the compacted area The distance from the vibrofloats to which the soi l can be compacted appears to increase with increasing grain size and with increasing unishyformity of the soil
Abu- Wata and Said (1958) used vibrofl otation to compact a uniform dune sand which had been placed under water The spacing of the insertion points varied between 165 and 2 5 m The compaction of the soil was checked by soundings with a Dutch cone penetrometer A subst antial inshycrease in the measured penetration resistance was observed close to the insertion points The average initial penetration resistance before the compaction was about 60 kgcm2 while the minimum penetration resistance after compaction at a spacing of the vibrofloats of 2 5 m was 120 kgcm2 below a depth of 4 5 m The peneshytration resistance increased with decreasing spacing of the vibrofloats The increase in penetration resistance and of the compaction was smal l close to the surface
Scheelhaase (1959) has described a project where vibroflotation was used to compact a uniform coarse to fine sand for a turbine foundation The compaction was checked by static penetration tests The point resistance varied between 0 to 150 kgcm2 before the compaction and beshytween 250 and 500 kgcm2 after the compaction The penetration tests indicated that the soil was compacted to a distance of 1 0 to 11 m from the insertion points
Hansbo et al (1968) has used the vibroflotation method to compact a uniform sand with an avershyage grain size of 0 5 mm to a depth of 8 to 10 m The compaction was determined by pressiometer tests plate load tests and penetrometer tests A substantial increase of the penetration resisshytance was observed to a distance of 0 6 to 0 7 m from the insertion points
Internal vibrators which are normally intended for concrete have also been used to compact saturated cohesionless soils (Wenner and Saare 1954 and Bureau of Reclamation 1963) According to Wenner and Saare (1954) sand and gravel can be compacted to 90 to 100 with resshypect to the modified AASHO compaction test to a distance of 0 25 to 0 50 m from the insertion points
Forssblad (1965) has repor ted results from comshypaction tests on sand and gravel with internal concrete vibrators The size of the vibrator the frequency and the amplitude were varied A density between 90 and 100 of the modified AASHO maximum dry density was obtained The radius of action of the vibrators was found to be smaller and the required vibr a tion time was found to be longer than in concrete
The vibration of sand silt l oess and clay
with internal vibrators has been investigated theoretically and experimentally by Poteur (1968) 165
VIII LABORATORY COMPACTION TESTS
Laboratory compaction of cohesionless soils by vibration has been studied by many The soil has in the laboratory tests usually been comshypacted in a Proctor mould placed on a vibrating table The influence of frequency amplitude and acceleration of the vibrating table as well as the influence of surcharge load soil gradashytion and moisture content have been studied
Schaffner (1962) has investigated the vibratory compaction of dry sand Typical test results are shown in Fig 10 It can be seen that the void ratio decreased with increasing accelerashytion The highest density was obtained at frequencies up to 100 cps probably due to the very small amplitude at high frequencies Schnaffner has derived an empirical equation which relates the void ratio of a sand with frequency and amplitude
Kutzner (1962) has investigated the vibratory compaction of glass beads The experiments were carried out on a vibrating table at fre-
0 100 200 300 Frequency f (cps)
Fig 10 Compaction of Dry Coarse Sand After Schaffner (1962)
quencies which varied between 5 and 100 cps Test results are shown in Fig 11 At freshyquenc i es between 40 and 100 cps the density inshycreased rapidly as the acceleration approached 1 g A further incr ease of the acceleration did not cause a further increase of the density The large amplitudes combined with impacts at low frequencies may explain the relatively good compaction within this frequency range
~ 5mm
tSOo----= L-L--08LO L 10 L-------eo -oL10=---cUIJ (16(1 --oo--L--deg LfO - 1oo-shy
Acce Ieration 0 9
Fig 11 Influence of Acceleration on the Vibshyratory Compaction of Gl ass Beads After Kutzner (1962)
Selig (1963) has studied the effects of fre shyquency acceleration and surcharge load on the vibratory compaction of a uniform dry sand Test results indicated that the density increase was small (less than 1) after two minutes of vibrashytion The maximum density was obtained at an acceleration between 1 to 2 g The acceleration required to reach a certain density increased with increasing overburden pressure
Ortigosa (1968) and Whitman and Ortigosa (1968) found from vibratory compaction tests that the acceleration without surcharge should for a dry fine sand be at least 1 g The maximum density was obtained at 2 g When the acceleration was larger than 2 g the density decreased due to overcompaction With surcharge load the reshyquired acceleration was 1 to 3 g depending on the intensity of the overburden pressure Also Dunglas (1967) has investigated the vibratory compaction of sand Dunglas used a special test mould where water pressure was used as surcharge load
Forssblad (1965) found that the dry unit weight increased for a dry sand with increasing accelershyation up to 2 g and up to 3 g when the same sand was compacted partially or fully saturated The dry unit weight was approximately constant when the acceleration exceeded these limiting values No surcharge was used during the experishyments Forssblad also found that the dry unit weight of the compacted soil was independent of the direction of the vibrations
Laboratory compaction tests on sand crushed limestone and crushed quartzite have also been carried out by Gomes and Graves (1962) and by Honigs Valente and Graves (1963) These matershyials were compacted in a Proctor mould by a surface vibrator consisting of a loud- speaker attached to an aluminum plate The frequency could be var ied Test results indicated that the stress waves generated by the loud- speaker affected the compaction of the soil The maxishymum density occurred at some distance below the soil surface
Standardized vibratory compaction tests have been mentioned in the Chapter Elements of soil comshypaction The development of test procedures have been discussed by e g Kolbuszewski (1948) Burmister (1950) Pauls and Goode (1950) Felt (1958) Leussink and Kutzner (1962) Johnson and Sallberg (1962) and by Pettibone and Hardin (1964)
113
A vibrating table and a surcharge load or a vibrating tamper or hammer are used in the standshyardized vibratory test methods as illustrated in Fig 1 Pettibone and Hardin (1964) have found for the first mentioned method that- the density of the compacted soil at a frequency of 60 cps increased with increased amplitude of the vibrating table The increase in density was insignificant when the vibration time was longer than 6 minutes
IX DAMAGE CAUSED BY VIBRATIONS
Vibratory soil compactors as well as blasting pile driving and heavy road traffic may damage adjacent structures Surface waves generated by medium and heavy weight vibratory compactors can often by observed a~ large distances from the vibrator Since also vibrations of very low intensity can be felt by man the risk of damage to buildings and other structures is often exaggerated
Measurements indicate that the damage is mainly dependent on the maximum velocity of the vibrashytions (Fig 3) The risk of damaging adjacent buildings is small if this velocity is less than 03 to 10 cms as indicated by Scheelshyhaase (1962) Susstrunk (1959) Reiher and Soden (1961) and others The risk of damage is also dependent on the quality of the buildshying and the type of the foundation
Ground oscillations from vibratory compactors have been measured by Susstrunk (1959) and Forssblad (1965) An oscillation velocity of 10 cmsec was observed by Forssblad at a maximum distance of 55 m from a 33 ton tractor-shydrawn vibrating roller There were large variashytions of the ground oscillations due to differshyences in the soil conditions Additional inshyvestigations will be of interest
Due to large variations in the soil conditions in the quality of buildings and in size and type of the compactors it is difficult toesshytablish general rules about the risk of damage by vibratory compactors This risk must howshyever be carefully considered especially when heavy vibratory compactors are used
Buried pipes can also be damaged during vibrashytory compaction of trench-fills Minimum thickness of the soil layer above the pipes during compaction by vibration or tamping are given in German specifications (Forschungsgeshysellschaft filr das Strassenwesen 1964)
Retaining walls abutments and basement walls are sometimes damaged by the high lateral presshysures which develop during the compaction of the backfill Measurements indicate that these pressures can be several times larger than those used in the design (Sowers et al 1957 Broms1967and Brems and Ingelson 1967) Also the lateral earth pressures which remain after the compaction are often high and can approach the Rankine passive earth pressure close to the ground surface Further studies are recommended
X FURTHER RESEARCH
This report on the state-of-the-art of vibratory soil compaction indicates that there is need for further research in this field The followshying important points can be mentioned
1 Compaction Mechanism
Transmission of the vibrations from vibrator to underlying or surrounding soil Propagation of stress waves in the soil Damping propershyties of soils at different frequencies amplishytudes gradations water contents etc
2 Special Features of Vibratory Compaction
Rational relationships between suitable layer thickness and number of passes for different types of soils and vibratory compactors Crushing of soil and roelt particles during vibratory compaction Winter compaction of soil and rock fill
3 Compaction Control
Development of efficient and rapid methods for compaction control of thick layers and for soils containing large stones Development of improved laboratory compaction methods based on vibrations
4 Damage to Structures
Damage to buildings by surface oscillations produced by vibratory compactors Lateral earth pressures on retaining walls abutment and basement walls during and after vibratory comshypaction of soils
5 Technical Data
Recommendations about the technical data of vibratory compactors which should be included in specifications technical reports etc
114
REFERENCES United States Department of the Interior 783 pp
Abu- Wata T and Said A (1958) Compaction Tests of Dune Sand Fill under Water by Deep Internal Vibrat i on Transations 6th Int Congress on Large Dams New York pp 467 - 483
Aldous W M and Wills H W (1952) Field Equipment for Vibratory Compaction of Soils and Base Courses Civil Aeronautics Administration Techn Div Repor t No 186 15 pp Indianapolis
Baker G L and Moorhouse D C (1968) Sand Densification by a Heavy Vibratory Comshypactor ASCE Specialty Conference on Placement and Improvement of Soil Structures MIT Camshybridge 13 pp
Barkan D D (1960) Dynamics of Bases and Foundations McGraw- Hill Book Co New Yor k 434 pp
Bathelt U ( 1956) Das Arbeitsverhalten des Rlittelverdichters auf plastisch- elastischem Undergrund Bautechnik- Archiv No 12 Berlin Ernst and Sohn 52 pp
Bathelt U and Koch H W (1956) Zur Frage der Arbeits- und Wirkungsweise von Rilttelverdichtern Baumaschine und Bautechnik Vo l 3 No 12 pp 373- 377
Bernell L 1965) Properties of Frozen Granshyular Soils and Their Use in Dam Construction Proceedings 6th Int Conf Soil Mech and Found Engng Vol 2 Montreal pp 451- 455
Bernhard R K (1952a) Study on Static and Dynamic Compaction of Soils Proceedings Highway Research Board Vol 31 pp 563- 591
Bernhard R K (1952b) Dynamic Compaction of Soil Rutgers University Engineering Research Bulletin No 37 23 pp
Bernhard R K (1962) On Biaxial Stress Field on Non- Cohesive Soils Subjected to Vibrashytory Loads Symposium on Soil Dynamics Am Soc Testing Materials Special Technical Publication No 305 pp 3-12
Burmister D M ( 1950) Suggested Method of Test for Maximum and Minimum Densities of Granular Soils Procedures for Testing Soil s Am Soc Testing Materials pp 111- 113
Cassel F L (1956) Use of Vibration for the Deep Compaction of Granular Soil Civil Engineering and Public Works Review Vol 51 No 599 pp 532- 536
Christoffel H (1960) Prllfung und Forsshychungs- ergebnisse an Rllttelverdichtern Strassen- und Tiefbau Vol 14 No 2 pp 76-80
Converse J ( 1952) Vibration - Compaction of Sand California Institute of Technology January 1952
Converse F J ( 1954) Compaction of Sand at Resonant Frequency Symposium Dynamic Testing of Soils Am Soc Testing Materials Special Technical Publication No 156 pp 124- 137
Converse F J (1957) Compaction of Coheshysive Soils by Low Frequency Vibration Am Soc Testing Materials Special Technical Publication No 206
D Appolonia E (1954) Loose Sands Their Compaction by Vibroflotation Symposium Dynamic Testing of Soils Am Soc for Testing Materials Special Technical Publication No 156 pp 138-154
D Appolonia E Miller C E and Ware T M (1953) Sand Compaction by Vibroflotation Proc Am Soc Civil Engng Vol 79 Separate No 200 23 pp
DAppolonia E and Miller C E Jr (1955) Sand Compaction by Vibroflotation Transshyactions Amer Soc Civil Engineers Vol 120 pp 154- 168
DAppolonia D J Whitman R V and D Appolshyoni a E (1969) Sand Compaction with Vibrashytory Rollers Proc Am Soc Civil Engineers Soil Mech and Found D V Vol 95 No SM 1
Bernhard R K (1967) Stress and Wave Patterns in Soils Subjected to Dynamic Loads Cold Regions Research and Engineering Laboratory No 120 Hanover New Hampshire 52 pp
Bernhard R K and Finelli J (1954) Pilot Studies on Soil Dynamics Symposium Dynamic Testing Materials Am Soc Testing Materials Special Technical Publication No 156 pp 211- 253
Broms B (1967) Jordtryck mot oeftergivliga konstruktioner Swedish Geotechnical Institute Reprints and Preliminary Reports No 22 Stockholm 29 pp
Broms B and Ingelson I (1967) Resultat frlln matningar av jordtryck mot brolandf1ste Swedish Geotechnical Institute Reprints and Preliminary Reports No 11 Stockholm 16 pp
Bruzelius N G (1954) A Study of the Comshypaction of Soil Statens Vlginstitut Meddeshylande 87 Stockholm 69 pp
Bureau of Reclamation (1963) Earth Manual
Paper 6366 pp 263-284
Doscher H D (1968) Vibroflotation Journal Soil Mech and Found Engng Vol 7 No 3 New Delhi pp 365-385
Dunglas J (1967) Le compactage par vibration des milieux granuleux Travaux Vol 50 No 392 pp 495-503 No 393 pp 563- 572
Ephremidis C (1959) Die mathematische Erfassung der Vorgange bei der Rlittelverdichshytung von Boden VDI- Zeitschrift 101 p 277
Erlenbach L (1959) Verdichtung i m Erdbau Strassen- Asphal t - und Tiefbau- Technik Vol 12 No 1 pp 68- 72
Felt E J (1958) Laboratory Methods of Compacting Granular Materials Am Soc fo r Testing Materials Special Technical Publishycation No 239 pp 89- 108
Forschungsgesellschaft fu~ das Strassenwesen (1964) Merkblatt uber das Zufull en im
115
Schaeffer H (1958) Vberprilfung der Vershydichtungsleistung eines RUttelverdichters auf Kiestragschichten Strasse und Autobahn Vol 9 No 4 pp 145- 148
Schiffner H J (1962) Umlagerung Rolliger Erdstoffe durch Vibration Mitteilunger der Forschungsanstalt fur Schiffahrt Wasser- und Grundbau Berlin No 6
Scheelhaase K (1959) Bodenverdichtungsshyarbeiten mittels RUtteldruckverfahren beim Bau eines Kraftwerkes in Berlin- Spandau Baushymachine und Bautecknik Vol 6 No 12 pp 449- 451
Scheelhaase K (1962) Ergebnisse van Proshyberammungen unter Verwendung eines Vibrashytionsbaren und e ines Frei fallbaren Baushymaschine und Bautechnik Vol 9 No 11 pp 453-4 58
Scheidig A (1940) Speichergriindung auf Riittelfusspfaehlen Die Bautechnik Vol 18 No 25 pp 277-282
Schneider H (1938) Das Riitteldruckvershyfahren und seine Anwendung im Erd- und Betonshybau Beton und Eisen Vol 37 No 1 pp 1-7
Seed H B (1968) Landslides During Earthshyquakes due to Soil Liquefact i on Journal of the Soil Mechanics and Foundations Division ASCE Vol 94 No SM5 Paper 6110 pp 1055-1122
Seed H B and Lee K L (1966) Liqueshyfaction of Saturated Sands During Cycl ic Loading Journal of the Soil Mechanics and Foundations Division ASCE Vol 92 No SM6 Proc Paper 4972 pp 105- 134
Selig E T (1963) Effect of Vibration on Density of Sand Proc 2 Panamerican Conshyference on Soil Mechanics and Foundation Engishyneering Vol 1 pp 129-144
Siedenburg R (1957) Unwuchtschwingerreger mit Selbsttatiger Fortbewegung Die Bautecknik No 9
Sowers G C Robb B D Mullis C H and Glenn A J (1957) The Residual Lateral Pressures Produced by Compacting Soils Proc 4 Int Conf Soil Mechanics and Found EngVol 2 pp 243-247
Stewerman S (1939) A New Soil Compaction Device Engineering News-Record July 20 1939 pp 63- 64
Steuerman S (1948) Silt Consolidation by Vibrofl otation Proceedings 2nd Int Conf Soil Mechanics and Found Eng Vol 2 pp 297-301
Streck and Schmidtbauer (1954) Bodenverdichshytungsversuche mit Schwingungs- und RUttelvershydi chtern Strasse und Autobahn Vol 5 No 12 pp 400- 406
Sung T Y ( 1954) Vibrations in Semi- Infinshyite Solids Due to Periodic Surface Loading Symp Dynamic Testing Soils Am Soc Testing Materials Special Technical Publication No 156 pp 35-63
Silsstrunk A E 0959) Schwingungsmessungen Untersuchungen Uber das dynamische Verhalten des Strassendammes bei ungunstigen Baugrundshyverhaltnissen Strasse und Verkehr Vol 45 No 4 pp 11- 14
Taylor D W (1948) Fundamentals of Soil Mechanics John Wiley amp Sons New York 700 pp
Terzaghi K (1943) Theoretical Soil Mechshyanics John Wiley amp Sons New York 510 pp
Thorburn S and MacVicar R S L (1968) Soil Stabilization Employing Surface and Depth Vibrators The Structural Engineer Vol 46 No 10 pp 309- 316
Tope A R (1967) Technical Aspects of Vibrating Rollers in Relation to Performance Australian Road Research Vol 3 No 4 pp 56- 66
Tschebotarioff G P (1946) Vi bratory Impact Compaction of Soils Am Road Builders Association Technical Bullet in No 109 pp 12 - 31
Tschebotarioff G P and McAlpin G W (1947) The Effect of Vibratory and Slow Repetitional Forces on the Bearing Properties of Soils Civil Aeronautics Administration Technical Development Report No 57 Washington D C 70 pp
Tynan A E and Morris P 0 (1968) The Evaluation of a Range of Vibrating Rollers in Compacting Road Materials Australian Road Research Vol 3 No 5 pp 7-53 Viering G (1965) The Vibrational Behavior of Soil in Relation to its Properties Proc 5th Int Conf on Soil Mechanics and Found Eng Vol 1 pp 547-552
Watanabe T (1963) Compaction of Sandy Ground by Vibration-Vibroflotation and Related Problems Proceedings 2 Asian Regional Conf Soil Mechanics and Found Engng Vol 1 Tokyo pp 406- 410
Weber G ( 1965) Untersuchung Uber Vorgange bei der statischen und dynamischen Verdichtung des Bodens Curt-Risch- Institut fur Schwingshyungs- und Messtechnik der T H Hannover Mitteilunger No 5 Hannover 97 pp
Whitman R V and Ortigosa P (1968) Densishyfication of Sand by Vertical Vibrations MIT Technical Paper No T68-5 7 pp
Weiss H (1956) Verdichtung grobk5rnigen SchUttmaterials mit einem schweren Ruttelshyverdichter Baumaschine Lind Bautechnik Vol 3 Heft 6
Wenner C G and Saare E (1954) Grundshyf6rstlrkning genom vibrering under vatten Byggmastaren Vol 33 No Bll pp 201- 210
Whiffin A C (1954) The Pressures Generat~ in Soil by Compaction Equipment Symp Dynamic Testing Soils Am Soc Testing Materials Special Technical Publication No 156 pp 186-210
Wiklund J A (1960) Synpunkter pa packning och sittning vid Arlandabygget 11 Svenska Vagforeningens Tidskrift Vol 47 No 5 pp 203-206
118
STATENS GEOTEKNISKA INSTITUT Swedish Geotechnical Institute
SARTRYCK OCH PRELIMINARA RAPPORTER Reprints and preliminary reports
Pris kr (Sw crs)
No
1 Views on the Stability of Clay Slopes J Osterman 1960 Out of print
2 Aspects on Some Problems of Geotechnical Chemistry R Soderblom
1960
3 Contributions to the Fifth International Conference on Soil Mechanics and Foundation Engineering Paris 1961 Part I
1961
1 Research on the Texture of Granular Masses T Kalstenius amp W Bergau
2 Relationship between Apparent Angle of Friction with Effective Stresses as Parameters - in Drained and in Consolidated-Undrained Triaxial Tests on Satushyrated Clay Normally-Consolidated Clay S Odenstad
3 Development of two Modern Continuous Sounding Meshythods T Kallstenius
4 In Situ Determination of Horizontal Ground Movements T Kalstenius amp W Bergau
4 Contributions to the Fifth International Conference on Soil Mechanics and Foundation Engineering Paris 1961 Part II
1961 5-
Suggested Improvements in the Liquid Limit Test with Reference to Flow Properties of Remoulded Clays R Karlsson
5 On Cohesive Soils and Their Flow Properties R Karlsson 1963 10-
6 Erosion Problems from Different Aspects 1964 10-
1 Unorthodox Thoughts about Filter Criteria W Kjellman
2 Fiters as Protection against Erosion P A Hedar
3 Stability of Armour Layer of Uniform Stones in Running Water S Andersson
4 Some Laboratory Experiments on the Dispersion and Erosion of Clay Mnteriafs R SOderblom
7 Settlement Studies of Clay 1964 10-
1 Influence of Lateral Movement in Clay Upon Settleshyments in Some Test Areas J Osterman amp G Lindskog
2 Consolidation Tests on Clay Subjected and Thawing J G Stuart
to Freezing
8 Studies on the Properties and J Osterman
Formation of Quick Clays 1965 5-
9 Ber8lming B Broms
av p8ar vid olika belastningsforhSlanden 1965 30 -
1 Berakningsmetoder for sidobelastade p8lar
2 Brottlast for snett beastade pAlar
3 Ber8kning av vertikaa pftlars barf6rm8ga
10 Triaxial Tests on Thin-Walled Tubular Samples 1965 5-
1 Effects of Rotation of the Principal Stress Axes and of the Intermediate Principal Stress on the Shear Strength B Broms amp A 0 Casbarian
2 Analysis of the Triaxial B Broms amp A K Jamal
Test-Cohesionless Soils
11 Nftgot om svensk geoteknisk forskning B Broms 1966 5-
12 88rf6rmftga hos pftlar slagna mot sliintberg B Broms 1966 15-
13 F0rankring av ledningar i jord B Broms amp 0 Orrje 1966 5-
14 Ultrasonic Dispersion of Clay Suspensions R Pusch 1966 5-
15 Investigation of Clay Sections R Pusch
Microstructure by Using Ultra-Thin 1966 10 -
16 Stability of Bennermark
Clay at Vertical Openings B Broms amp H 1967 10 -
Pris kr No (Sw crs)
17 Orn palslagning och palbiirighet 1967 5-1 Dragsprickor i armerade betongpalar S Sahlin
2 Sprickbildning och utmattning vid slagning av armeshyrade modellpalar av belong BmiddotG Heifers
3 88righet hos slantberg vid statisk belastning av bergshyspets Resultat av modellf6rs0k S-E Rehnman
4 Negativ mantelfriktion B H Fellenius
5 Grundl8ggning pa korta pi3lar Redog0relse for en f6rshys6ksserie pa NABO-palar G Fjekner
6 Krokiga pftlars b8rf0rmAga B Brems
18 Palgruppers biirformaga B Broms 1967 10-
19 Orn stoppslagning av stodpalar L Hellman 1967 5-
20 Contributions to the First Congress of the International 1967 5 -Society of Rock Mechanics Lisbon 1966
1 A Note on Strength Properties of Rock B Broms
2 Tensile Strength of Rock Materials B Broms
21 Recent Quick-Clay Studies 1967 10-1 Recent Quick-Clay Studies an Introduction R Pusch
2 Chemical Aspects of Quick-Clay Formation R Soderblom
3 Quick-Clay Microstructure R Pusch
22 Jordtryck vid friktionsmaterial 1967 30-
1 Resultat frEm matning av jordtryck mot brolandfilste B Broms amp I Ingeson
2 Jordtryck mot oeftergivliga konstruktioner B Broms
3 Meted f0r berakning av sambandet mellan jordtryck och deformation hos framst st0dmurar och f0rankringsshyplattor i friktionsmaterial B Broms
4 Berakning av stolpfundament B Broms
23 Contributions to the Geotechnical Conference on Shear 1968 10 -Strength Properties of Natural Soils and Rocks Oslo 1967
1 Effective Angle of Friction for a Normally Consolidated Clay R Brink
2 Shear Strength Parameters and Microstructure Characshyteristics of a Quick Clay of Extremely High Water Content R Karlsson amp R Pusch
3 Ratio cp in Relation to Liquid Limit and Plasticity Index with Special Reference to Swedish Clays R Karlsson amp L Viberg
24 A Technique for Investigation of Clay Microstructure R 1968 22 -Pusch
25 A New Settlement Gauge Pile Driving Effects and Pile 1968 10-Resistance Measurements
1 New Method of Measuring in-situ Settlements U Bergdah amp B Broms
2 Effects of Pile Driving on Soil Properties 0 Orrje amp B Broms
3 End Bearing and Skin Friction Resistance of Piles B Broms amp L Hellman
26 sattningar vid vagbyggnad 1968 20-
F0redrag vid Nordiska Vagtekniska F0rbundets konferens I Voksenasen Oslo 25-26 mars 1968
1 Geotekniska unders0kningar vld bed6mning av s8ttshyningar B Broms
2 Teknisk-ekonomisk 0versikt Over anliiggningsmetoder for reducering av sattningar i vagar A Ekstrom
3 sattning av verkstadsbyggnad I Stenungsund uppford p8 normalkonsoliderad era B Broms amp O Orrje
27 B8rf6rm8ga hos sliintberg vid statisk belastning av 1968 15-bergspets Resultat frAn modellf6rs6k S-E Rehnman
No
28 Bidrag till Nordiska Geoteknikerm6tet 1 GOteborg den 5-7 september 1968
1 Nordiskt geotekniskt samarbete och nordiska geotekshynikerm6ten N Flodin
1968
Pris kr (Sw crs) 15-
2 Nflgra resultat av belastningsf6rs6k pl lerterrang speciellt med avseende pa sekunctar konsolidering G Lindskog
3 sattningar vid grundl8ggning med platter pA moranshylera i Lund S Hansbo H Bennermark amp U Kihfbom
4 Stabilitetsf6rb8ttrande spontkonstruktion ningar 0 Wager
for bankfyllshy
5 Grundvattenproblem I Stockholms city G Lindskog amp U Bergdahl
6 Aktuell svensk geoteknisk forskning B Broms
29 Classification of Soils with Reference to Compaction 8 Broms amp L Forssblad
1968 5-
30 Flygbildstolkning som hjiilpmedel vid oversiktliga grundundersOkningar
1969 10-
1 Flygbildstolkning f6r jordartsbestamning vid samh811sshyplanering 1-2 U Kihlblom L Viberg amp A Heiner
2 ldentifiering av berg och bed6mnlng av jorddjup med hjalp av flygbilder U Kihlblom
31 Nordisk sonderingsmote i Stockholm den 5-6 oktober 1967 FOredrag och diskussioner
1969 30-
32 Contributions to the 3rd Budapest Conference on Soil Mechanics and Foundation Engineering Budapest 1968
1969 10-
1 Swedish Tie-Back Systems for Sheet Pile Walls B Brems
2 Stability of Cohesive Soils behind Vertical Openings in Sheet Pile Walls Analysis of a Recent Failure B Broms amp H Bennermark
33 Seismikdag 1969 Symposium anordnat av Svenska Geotek-niska FOreningen den 22 april 1969
1970 20 -
34 NAgot om geotekniken i Sverige samt dess roll i plane-rings- och byggprocessen NAgra debattinl8gg och allm8nna artiklar
1970 15 -
T Kallstenius 1 Geoteknikern i det specialiserade samhallet B Broms 2 Diskussionsinl8gg vid konferens om geovetenskaperna
7 mars 1969 3 Geoteknik i Sverige
denser - utveckling och utvecklingstenshy
4 Geotekniska unders6kningar och grundl8ggningsmetoshyder
5 Grundlaggning pA platter - en allm8n Oversikt
35 Piles - a New Force Gauge and Bearing Capacity Cacu-lations
1970 10 -
1 New Pile Force Gauge for Accurate Measurements of Pile Behavior during and Following Driving B Fellenius amp Th Haagen
2 Methods of Calculating the city of Piles A Summary B Broms
Ultimate Bearing Capashy
36 P8lslagning Materialegenskaper hos berg och betong 1970 10 -
1 Bergets b8rf6rmAga vid punktbelastning s-E Rehnman
2 Deformationsegenskaper hos slagna betongpAlar B Fellenius amp T Eriksson
37 Jordtryck mot grundmurar 1970 10-
1 Jordtryck mot grundmurar av Lecablock s-E Rehnman amp B Brems
2 Ber8kning B Broms
av jordtryck met k8llarv8ggar
38 Provtagningsdag 1969 Symposium anordnat av Geotekniska FOreningen den 28 oktober 1969
Svenska 1970 25 -
No
39 Mor8ndag 1969 Symposium anordnat av Svenska 1970 Geotekniska F6reningen den 3 december 1969
40 Stability and Strengthening of Rock Tunnels in Scandinavia 1971 1 Correlation of Seismic Refraction Velocities and Rock
Support Requirements in Swedish Tunnels 0 S Cecil 2 Problems with Swelling Clays in Norwegian Undershy
ground Constructions in Hard-Rocks R Selmer-Olsen
41 Stalp8lars biirf6rm8ga Resultat av faltfOrsOk med 18tta 1971 slagdon G Fjefkner
42 Contributions to the Seventh International Conference on 1971 Soil Mechanics and Foundation Engineering Mexico 1969
Pris kr (Sw crs)
25-
25-
30-
15-
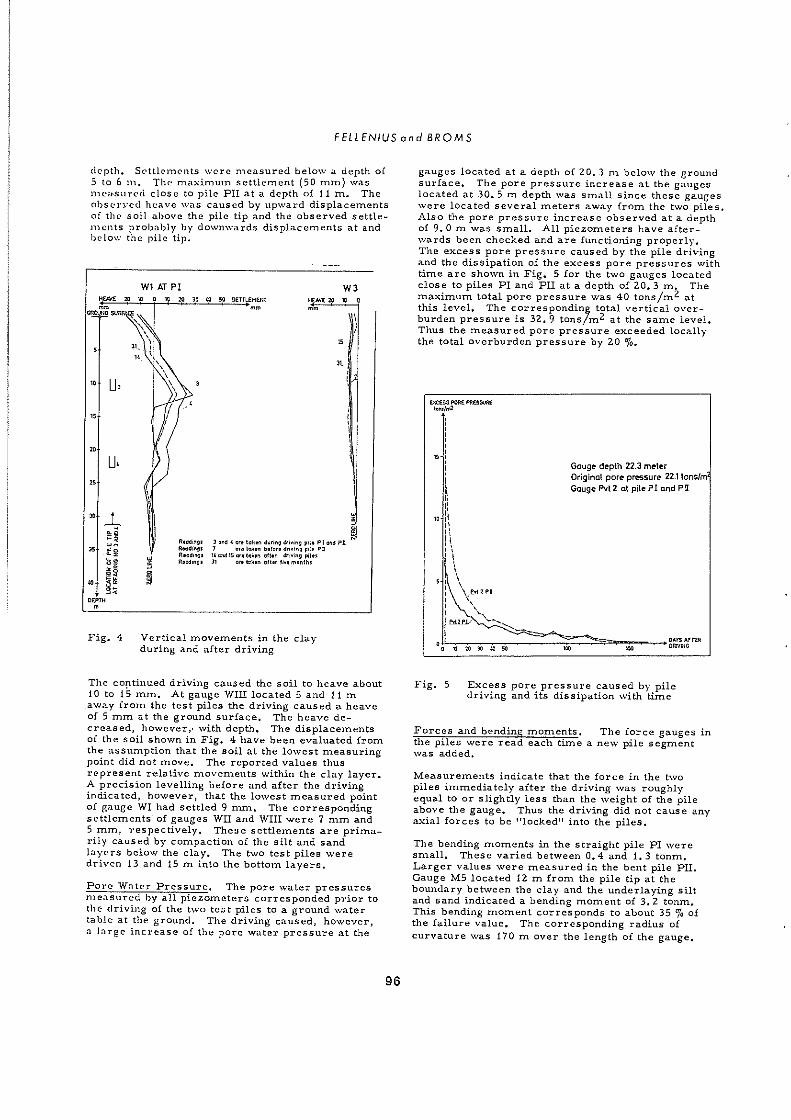