Embed Size (px)
Citation preview


Statement of Management’s Responsibility | 1
STATEMENT OF MANAGEMENT'S RESPONSIBILITY FOR FINANCIAL STATEMENTS
The management of Philippine Seven Corporation is responsible for the preparation and fair presentation of the consolidated financial statements for the years ended December 31, 2011 and 2010, including the additional components attached therein, in accordance with Philippine Financial Reporting Standards. This responsibility includes designing and implementing internal controls relevant to the preparation and fair presentation of the consolidated financial statements that are free from material misstatement, whether due to fraud or error, selecting and applying appropriate accounting policies, and making accounting estimates that are reasonable in the circumstances.
The Board of Directors or the Executive Committee or the Audit Committee, as authorized by the Board,reviews and approves the consolidated financial statements and submits the same to the stockholders.
SyCip Gorres Velayo & Co. the independent auditor appointed by the stockholders for the period December 31, 2011 and 2010, respectively, have examined the consolidated financial statements of the company in accordance with Philippine Standards on Auditing, and in their reports to the stockholders, have expressed their opinion on the fairness of presentation upon completion of such examination.
VICENTE T. PATERNOChairman of the Board
JOSE VICTOR P. PATERNOChief Executive Officer
YU-HSIU TSAIChief Financial Officer

2 | Independent Auditors’ Report
INDEPENDENT AUDITORS’ REPORT The Stockholders and the Board of Directors Philippine Seven Corporation We have audited the accompanying consolidated financial statements of Philippine Seven Corporation and Subsidiaries, which comprise the consolidated balance sheets as at December 31, 2011 and 2010, and the consolidated statements of comprehensive income, statements of changes in equity and statements of cash flows for each of the three years in the period ended December 31, 2011, and a summary of significant accounting policies and other explanatory information. Management’s Responsibility for the Consolidated Financial Statements Management is responsible for the preparation and fair presentation of these consolidated financial statements in accordance with Philippine Financial Reporting Standards, and for such internal control as management determines is necessary to enable the preparation of consolidated financial statements that are free from material misstatement, whether due to fraud or error. Auditors’ Responsibility Our responsibility is to express an opinion on these consolidated financial statements based on our audits. We conducted our audits in accordance with Philippine Standards on Auditing. Those standards require that we comply with ethical requirements and plan and perform the audit to obtain reasonable assurance about whether the consolidated financial statements are free from material misstatement. An audit involves performing procedures to obtain audit evidence about the amounts and disclosures in the consolidated financial statements. The procedures selected depend on the auditor’s judgment, including the assessment of the risks of material misstatement of the consolidated financial statements, whether due to fraud or error. In making those risk assessments, the auditor considers internal control relevant to the entity’s preparation and fair presentation of the consolidated financial statements in order to design audit procedures that are appropriate in the circumstances, but not for the purpose of expressing an opinion on the effectiveness of the entity’s internal control. An audit also includes evaluating the appropriateness of accounting policies used and the reasonableness of accounting estimates made by management, as well as evaluating the overall presentation of the consolidated financial statements. We believe that the audit evidence we have obtained is sufficient and appropriate to provide a basis for our audit opinion.
SyCip Gorres Velayo & Co. 6760 Ayala Avenue 1226 Makati City Philippines
Phone: (632) 891 0307 Fax: (632) 819 0872 www.sgv.com.ph BOA/PRC Reg. No. 0001 SEC Accreditation No. 0012-FR-2

Independent Auditors’ Report | 3
Opinion In our opinion, the consolidated financial statements present fairly, in all material respects, the financial position of Philippine Seven Corporation and Subsidiaries as at December 31, 2011 and 2010, and their financial performance and their cash flows for each of the three years in the period ended December 31, 2011 in accordance with Philippine Financial Reporting Standards. SYCIP GORRES VELAYO & CO. Julie Christine O. Mateo Partner CPA Certificate No. 93542 SEC Accreditation No. 0780-AR-1 (Group A), February 2, 2012, valid until February 1, 2015 Tax Identification No. 198-819-116 BIR Accreditation No. 08-001998-68-2009, June 1, 2009, valid until May 31, 2012 PTR No. 3174818, January 2, 2012, Makati City February 10, 2012

4 | Consolidated Balance Sheets
PHILIPPINE SEVEN CORPORATION AND SUBSIDIARIES CONSOLIDATED BALANCE SHEETS December 31 2011 2010 ASSETS Current Assets Cash and cash equivalents (Note 4) P=394,696,749 P=358,729,534 Short-term investment (Note 4) 10,409,907 10,141,555 Receivables (Note 5) 239,289,287 158,342,635 Inventories (Note 6) 519,258,936 402,419,577 Prepayments and other current assets (Note 7) 161,522,138 139,607,097 Total Current Assets 1,325,177,017 1,069,240,398 Noncurrent Assets Property and equipment (Note 8) 1,946,032,976 1,607,296,761 Deposits (Note 9) 215,964,826 181,196,390 Deferred income tax assets - net (Note 27) 40,662,817 40,827,991 Goodwill and other noncurrent assets (Note 10) 206,461,345 194,611,819 Total Noncurrent Assets 2,409,121,964 2,023,932,961 TOTAL ASSETS P=3,734,298,981 P=3,093,173,359 LIABILITIES AND EQUITY Current Liabilities Bank loans (Note 11) P=374,666,667 P=320,000,000 Accounts payable and accrued expenses (Note 12) 1,243,937,457 1,078,339,407 Income tax payable 73,922,196 45,289,647 Other current liabilities (Notes 13 and 25) 298,435,516 265,799,298 Total Current Liabilities 1,990,961,836 1,709,428,352 Noncurrent Liabilities Deposits payable (Note 14) 171,457,833 142,862,137 Net retirement obligations (Note 24) 65,192,720 57,453,582 Cumulative redeemable preferred shares (Note 15) 6,000,000 6,000,000 Deferred revenue - net of current portion (Note 16) 4,057,482 7,000,300 Total Noncurrent Liabilities 246,708,035 213,316,019 Total Liabilities 2,237,669,871 1,922,744,371 Equity Capital stock (Note 17) - P=1 par value Authorized - 400,000,000 shares Issued - 347,329,216 and 302,114,918 shares as of
December 31, 2011 and 2010, respectively [held by 666 and 684 equity holders in 2011 and 2010, respectively (Note 1)] 347,329,216 302,114,918
Additional paid-in capital 293,525,037 293,525,037 Retained earnings (Note 17) 855,468,208 574,482,384 Revaluation increment on land [net of deferred income tax liability
(Notes 8 and 27)] 3,229,895 3,229,895 1,499,552,356 1,173,352,234 Cost of 686,250 shares held in treasury (2,923,246) (2,923,246) Total Equity 1,496,629,110 1,170,428,988 TOTAL LIABILITIES AND EQUITY P=3,734,298,981 P=3,093,173,359 See accompanying Notes to Consolidated Financial Statements.
Consolidated Statements of Comprehensive Income | 5
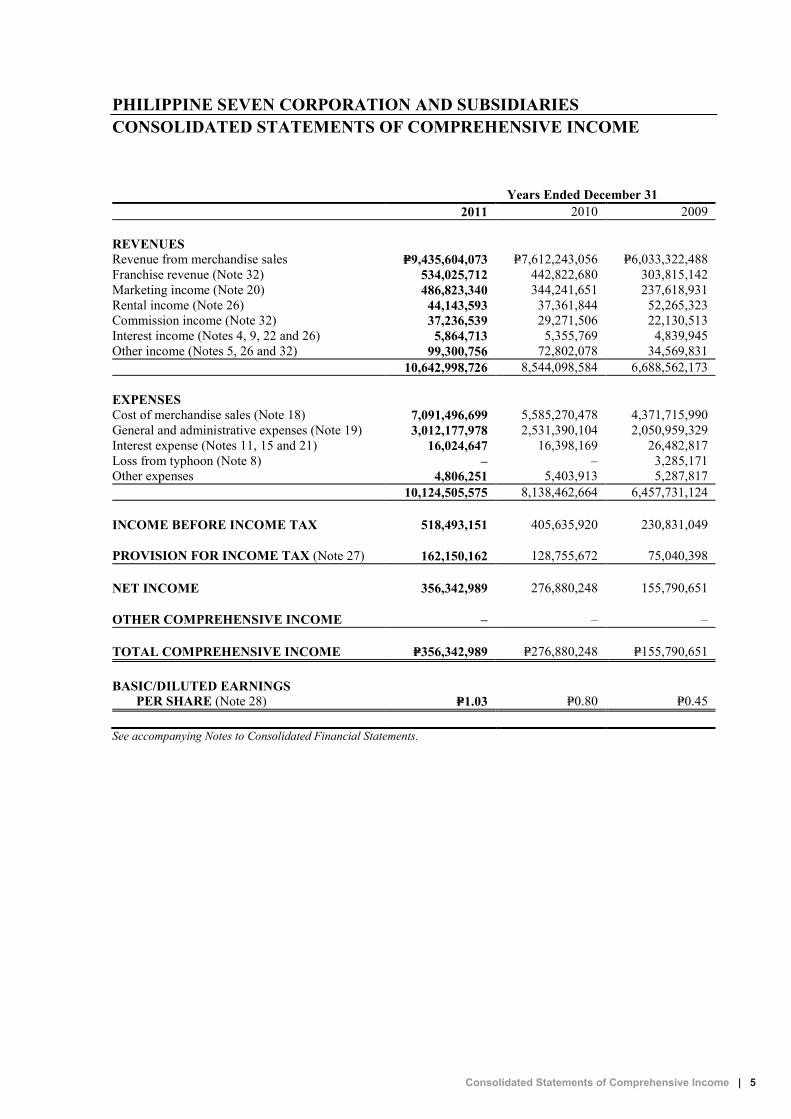
PHILIPPINE SEVEN CORPORATION AND SUBSIDIARIES CONSOLIDATED STATEMENTS OF COMPREHENSIVE INCOME Years Ended December 31 2011 2010 2009
REVENUES Revenue from merchandise sales P=9,435,604,073 P=7,612,243,056 P=6,033,322,488 Franchise revenue (Note 32) 534,025,712 442,822,680 303,815,142 Marketing income (Note 20) 486,823,340 344,241,651 237,618,931 Rental income (Note 26) 44,143,593 37,361,844 52,265,323 Commission income (Note 32) 37,236,539 29,271,506 22,130,513 Interest income (Notes 4, 9, 22 and 26) 5,864,713 5,355,769 4,839,945 Other income (Notes 5, 26 and 32) 99,300,756 72,802,078 34,569,831 10,642,998,726 8,544,098,584 6,688,562,173
EXPENSES Cost of merchandise sales (Note 18) 7,091,496,699 5,585,270,478 4,371,715,990 General and administrative expenses (Note 19) 3,012,177,978 2,531,390,104 2,050,959,329 Interest expense (Notes 11, 15 and 21) 16,024,647 16,398,169 26,482,817 Loss from typhoon (Note 8) – – 3,285,171 Other expenses 4,806,251 5,403,913 5,287,817 10,124,505,575 8,138,462,664 6,457,731,124
INCOME BEFORE INCOME TAX 518,493,151 405,635,920 230,831,049
PROVISION FOR INCOME TAX (Note 27) 162,150,162 128,755,672 75,040,398
NET INCOME 356,342,989 276,880,248 155,790,651
OTHER COMPREHENSIVE INCOME – – –
TOTAL COMPREHENSIVE INCOME P=356,342,989 P=276,880,248 P=155,790,651
BASIC/DILUTED EARNINGS PER SHARE (Note 28) P=1.03 P=0.80 P=0.45
See accompanying Notes to Consolidated Financial Statements.

6 | Consolidated Statements of Changes in Equity
PHIL
IPPI
NE
SE
VE
N C
OR
POR
AT
ION
AN
D S
UB
SID
IAR
IES
CO
NSO
LID
AT
ED
ST
AT
EM
EN
TS
OF
CH
AN
GE
S IN
EQ
UIT
Y
FOR
TH
E Y
EAR
S EN
DED
DEC
EMB
ER 3
1, 2
011,
201
0 an
d 20
09
Add
ition
al
R
eval
uatio
n
Paid
-in
Ret
aine
d In
crem
ent o
n
Trea
sury
C
apita
l Sto
ck
Cap
ital
Earn
ings
La
nd (N
ote
8)
Tota
l St
ock
Tota
l
BA
LAN
CES
AS
OF
DE
CE
MB
ER 3
1, 2
008
P=261
,663
,450
P=2
93,5
25,0
37
P=196
,616
,699
P=3
,229
,895
P=7
55,0
35,0
81
(P=2,
923,
246)
P=7
52,1
11,8
35
Stoc
k di
vide
nds (
Not
e 17
) 26
,097
,722
–
(26,
097,
722)
–
– –
– To
tal c
ompr
ehen
sive
inco
me
for t
he y
ear
– –
155,
790,
651
– 15
5,79
0,65
1 –
155,
790,
651
BA
LAN
CES
AS
OF
DE
CE
MB
ER 3
1, 2
009
287,
761,
172
293,
525,
037
326,
309,
628
3,22
9,89
5 91
0,82
5,73
2 (2
,923
,246
) 90
7,90
2,48
6 St
ock
divi
dend
s (N
ote
17)
14,3
53,7
46
– (1
4,35
3,74
6)
– –
– –
Cas
h di
vide
nds (
Not
e 17
) –
– (1
4,35
3,74
6)
– (1
4,35
3,74
6)
– (1
4,35
3,74
6)
Tota
l com
preh
ensi
ve in
com
e fo
r the
yea
r –
– 27
6,88
0,24
8 –
276,
880,
248
– 27
6,88
0,24
8
BA
LAN
CES
AS
OF
DE
CE
MB
ER 3
1, 2
010
302,
114,
918
293,
525,
037
574,
482,
384
3,22
9,89
5 1,
173,
352,
234
(2,9
23,2
46)
1,17
0,42
8,98
8 St
ock
divi
dend
s (N
ote
17)
45,2
14,2
98
– (4
5,21
4,29
8)
– –
– –
Cas
h di
vide
nds (
Not
e 17
) –
– (3
0,14
2,86
7)
– (3
0,14
2,86
7)
– (3
0,14
2,86
7)
Tota
l com
preh
ensi
ve in
com
e fo
r the
yea
r –
– 35
6,34
2,98
9 –
356,
342,
989
– 35
6,34
2,98
9
BA
LAN
CES
AS
OF
DE
CE
MB
ER 3
1, 2
011
P=347
,329
,216
P=2
93,5
25,0
37
P=855
,468
,208
P=3
,229
,895
P=1
,499
,552
,356
(P=
2,92
3,24
6) P=
1,49
6,62
9,11
0
Se
e ac
com
pany
ing
Not
es to
Con
solid
ated
Fin
anci
al S
tate
men
ts.

Consolidated Statements of Cash Flows | 7
PHILIPPINE SEVEN CORPORATION AND SUBSIDIARIES CONSOLIDATED STATEMENTS OF CASH FLOWS Years Ended December 31 2011 2010 2009
CASH FLOWS FROM OPERATING ACTIVITIES
Income before income tax P=518,493,151 P=405,635,920 P=230,831,049 Adjustments for: Depreciation and amortization (Notes 8 and 19) 378,355,521 291,803,754 203,905,718 Interest expense (Notes 11, 15, and 21) 16,024,647 16,398,169 26,482,817 Net retirement obligations (Note 24) 7,739,138 1,786,458 19,839,386 Interest income (Notes 4, 9, 22 and 26) (5,864,713) (5,355,769) (4,839,945) Amortization of: Deferred lease (Notes 10 and 26) 2,779,684 1,414,700 1,475,524 Software and other program costs (Notes 10 and 19) 2,598,741 3,089,728 3,053,728 Deferred revenue on exclusivity contract (Note 16) (1,934,524) (5,476,190) (3,913,691) Deferred revenue on finance lease (Notes 16 and 26) (589,567) (709,665) (1,310,151) Unrealized foreign exchange loss (gain) (49,798) 378,900 485,170 Loss from/on: Retirement of property and equipment – 67,751 – Typhoon (Note 8) – – 3,285,171 Operating income before working capital changes 917,552,280 709,033,756 479,294,776 Decrease (increase) in: Receivables (78,072,578) 14,301,014 11,444,710 Inventories (116,839,359) 13,233,094 (76,096,286) Prepayments and other current assets (32,811,310) (58,286,054) (56,529,837) Increase (decrease) in: Accounts payable and accrued expenses 165,298,414 50,754,902 180,337,730 Other current liabilities 32,636,218 21,551,666 31,737,028 Deposits payable 28,595,696 22,895,083 36,714,408 Deferred revenue (Notes 16 and 32) (418,727) 5,133,336 – Cash generated from operations 915,940,634 778,616,797 606,902,529 Income taxes paid (133,352,439) (118,023,813) (68,854,934) Interest received 2,933,116 3,711,520 3,138,083 Net cash generated from operating activities 785,521,311 664,304,504 541,185,678
CASH FLOWS FROM INVESTING ACTIVITIES
Additions to: Property and equipment (Note 8) (717,091,736) (671,923,830) (362,393,990) Software and other program costs (Note 10) – (161,900) (286,000) Decrease (increase) in: Deposits (34,768,436) (28,984,235) (17,644,957) Goodwill and other noncurrent assets (7,922,962) 6,339,916 (11,952,821) Acquisition of short-term investments (10,409,907) (10,141,555) – Proceeds from maturity of short-term investments 10,141,555 – – Collection of lease receivable (Note 26) 1,591,280 1,775,466 2,782,500 Net cash used in investing activities (758,460,206) (703,096,138) (389,495,268)
(Forward)
8 | Consolidated Statements of Cash Flows
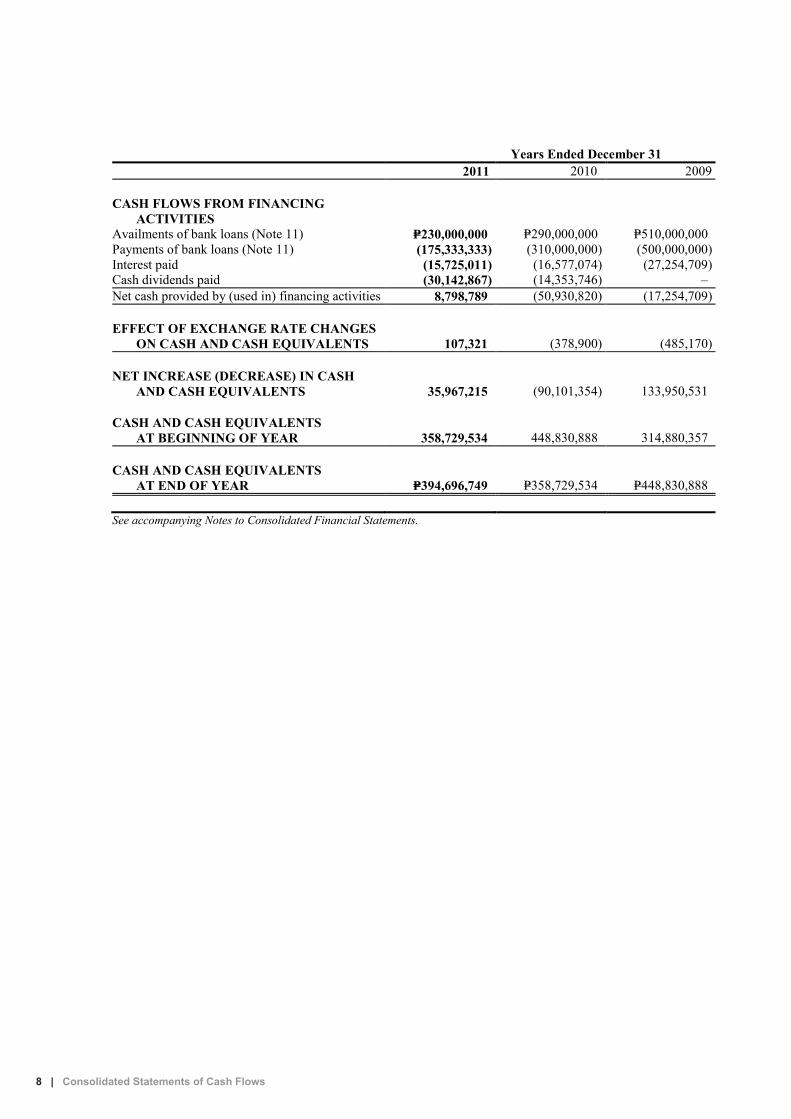
Years Ended December 31 2011 2010 2009
CASH FLOWS FROM FINANCING ACTIVITIES
Availments of bank loans (Note 11) P=230,000,000 P=290,000,000 P=510,000,000 Payments of bank loans (Note 11) (175,333,333) (310,000,000) (500,000,000) Interest paid (15,725,011) (16,577,074) (27,254,709) Cash dividends paid (30,142,867) (14,353,746) – Net cash provided by (used in) financing activities 8,798,789 (50,930,820) (17,254,709)
EFFECT OF EXCHANGE RATE CHANGES ON CASH AND CASH EQUIVALENTS 107,321 (378,900) (485,170)
NET INCREASE (DECREASE) IN CASH AND CASH EQUIVALENTS 35,967,215 (90,101,354) 133,950,531
CASH AND CASH EQUIVALENTS AT BEGINNING OF YEAR 358,729,534 448,830,888 314,880,357
CASH AND CASH EQUIVALENTS AT END OF YEAR P=394,696,749 P=358,729,534 P=448,830,888
See accompanying Notes to Consolidated Financial Statements.

Notes to Consolidated Financial Statements | 9
PHILIPPINE SEVEN CORPORATION AND SUBSIDIARIES NOTES TO CONSOLIDATED FINANCIAL STATEMENTS 1. Corporate Information and Authorization for Issuance of Financial Statements Corporate Information Philippine Seven Corporation (the Company or PSC) was incorporated in the Philippines and
registered with the Philippine Securities and Exchange Commission (SEC) on November 29, 1982. The Company and its subsidiaries (collectively referred to as “the Group”), are primarily engaged in the business of retailing, merchandising, buying, selling, marketing, importing, exporting, franchising, acquiring, holding, distributing, warehousing, trading, exchanging or otherwise dealing in all kinds of grocery items, dry goods, food or foodstuffs, beverages, drinks and all kinds of consumer needs or requirements and in connection therewith, operating or maintaining warehouses, storages, delivery vehicles and similar or incidental facilities. The Group is also engaged in the management, development, sale, exchange, and holding for investment or otherwise of real estate of all kinds, including buildings, houses and apartments and other structures.
The Company is controlled by President Chain Store (Labuan) Holdings, Ltd., an investment holding company incorporated in Malaysia, which owns 56.59% of the Company’s outstanding shares. The remaining 43.41% of the shares are widely held. The ultimate parent of the Company is President Chain Store Corporation (PCSC), which is incorporated in Taiwan, Republic of China.
The Company has its primary listing on the Philippine Stock Exchange. As of December 31, 2011 and 2010, the Company has 666 and 684 equity holders, respectively.
The registered business address of the Company is 7th Floor, The Columbia Tower, Ortigas
Avenue, Mandaluyong City.
Authorization for Issuance of the Financial Statements The consolidated financial statements as of December 31, 2011 and 2010 and for each of the three years in the period ended December 31, 2011 were authorized for issue by the Board of Directors (BOD) on February 10, 2012.
2. Summary of Significant Accounting Policies and Financial Reporting Practices Basis of Preparation The consolidated financial statements are prepared under the historical cost basis, except for
parcels of land, which are carried at revalued amount. The consolidated financial statements are presented in Philippine Peso (Peso), which is the Group’s functional currency and all amounts are rounded to the nearest Peso except when otherwise indicated.
Statement of Compliance The consolidated financial statements, which are prepared for submission to the SEC, are prepared in compliance with Philippine Financial Reporting Standards (PFRS).
Changes in Accounting Policies The accounting policies adopted are consistent with those of the previous financial year except for the following new and amended PFRS, Philippine Accounting Standards (PAS) and Philippine Interpretations based on International Financial Reporting Interpretations Committee (IFRIC)

10 | Notes to Consolidated Financial Statements
interpretations, which became effective on January 1, 2011. Except as otherwise indicated, the adoption of the new and amended Standards and Interpretations, did not have a significant impact on the consolidated financial statements.
Amendment to PAS 24, Related Party Disclosures
This Amendment clarifies the definition of a related party. The new definitions emphasize a symmetrical view of related party relationships and clarify the circumstances in which persons and key management personnel affect related party relationships of an entity.
In addition, the amendment introduces an exemption from the general related party disclosure requirements for transactions with government and entities that are controlled, jointly controlled or significantly influenced by the same government as the reporting entity.
Amendment to PAS 32, Financial Instruments: Presentation - Classification of Rights Issues
This Amendment alters the definition of a financial liability in order to classify rights issues (and certain options or warrants) as equity instruments in cases where such rights are given pro rata to all of the existing owners of the same class of an entity’s non-derivative equity instruments, in order to acquire a fixed number of the entity’s own equity instruments for a fixed amount in any currency.
Amendment to Philippine Interpretation IFRIC 14, Prepayments of a Minimum Funding
Requirement This Amendment removes an unintended consequence when an entity is subject to minimum funding requirements and makes an early payment of contributions to cover such requirements. The amendment permits a prepayment of future service cost by the entity to be recognized as a pension asset. The Group is not subject to minimum funding requirements in the Philippines, therefore the amendment of the interpretation has no effect on the financial position nor performance of the Group.
Philippine Interpretation IFRIC 19, Extinguishing Financial Liabilities with Equity
Instruments This Interpretation clarifies that equity instruments issued to a creditor to extinguish a financial liability qualify as consideration paid. The equity instruments issued are measured at their fair value. In case that this cannot be reliably measured, the instruments are measured at the fair value of the liability extinguished. Any gain or loss is recognized immediately in profit or loss.
Improvements to PFRSs The omnibus amendments to PFRSs issued in May 2010 were issued primarily with a view to removing inconsistencies and clarifying wording. There are separate transitional provisions for each standard. Except otherwise stated, the adoption of these amendments did not have significant impact on the consolidated financial statements. Amendment to PFRS 3, Business Combinations (Revised)
This Amendment clarifies that the Amendments to PFRS 7, Financial Instruments: Disclosures, PAS 32 and PAS 39, Financial Instruments: Recognition and Measurement (Amendment) - Eligible Hedged Items that eliminate the exemption for contingent consideration, do not apply to contingent consideration that arose from business combinations whose acquisition dates precede the application of PFRS 3 (as revised in 2008).

Notes to Consolidated Financial Statements | 11
The measurement options available for non-controlling interest (NCI) were amended. Only components of NCI that constitute a present ownership interest that entitles their holder to a proportionate share of the entity’s net assets in the event of liquidation should be measured at either fair value or at the present ownership instruments’ proportionate share of the acquiree’s identifiable net assets. All other components are to be measured at their acquisition date fair value.
Amendment to PFRS 7, Financial Instruments: Disclosures
This Amendment was intended to simplify the disclosures provided by reducing the volume of disclosures around collateral held and improving disclosures by requiring qualitative information to put the quantitative information in context.
Amendment to PAS 1, Presentation of Financial Statements
This Amendment clarifies that an entity will present an analysis of other comprehensive income (OCI) for each component of equity, either in the statement of changes in equity or in the notes to the financial statements.
Amendment to PAS 27, Consolidated and Separate Financial Statements
This Amendment clarifies that the consequential amendments from PAS 27 made to PAS 21, The Effect of Changes in Foreign Exchange Rates, PAS 28, Investments in Associates and PAS 31, Interests in Joint Ventures, apply prospectively for annual periods beginning on or after July 1, 2009 or earlier when PAS 27 is applied earlier.
Amendment to PAS 34, Interim Financial Reporting This Amendment provides guidance to illustrate how to apply disclosure principles in PAS 34 and add disclosure requirements around: a) The circumstances likely to affect fair values of financial instruments and their
classification; b) Transfers of financial instruments between different levels of the fair value hierarchy; c) Changes in classification of financial assets; and d) Changes in contingent liabilities and assets.
Amendment to Philippine Interpretation IFRIC 13, Customer Loyalty Programmes
This Amendment clarifies that when the fair value of award credits is measured based on the value of the awards for which they could be redeemed, the amount of discounts or incentives otherwise granted to customers not participating in the award credit scheme, is to be taken into account.
New Accounting Standards, Interpretations, and Amendments to Existing Standards Effective Subsequent to December 31, 2011 The Group will adopt the following standards, interpretations and amendments to existing standards enumerated below when these become effective. Except as otherwise indicated, the Group does not expect the adoption of these standards, interpretations and amendments to existing standards to have a significant impact on the consolidated financial statements.
Effective in 2012 Amendments to PAS 1, Financial Statement Presentation, Presentation of Items of Other
Comprehensive Income This Amendment changed the grouping of items presented in OCI. Items that could be reclassified (or ‘recycled’) to profit or loss at a future point in time (for example, upon derecognition or settlement) would be presented separately from items that will never be

12 | Notes to Consolidated Financial Statements
reclassified. The amendment affects presentation only and will have no impact on the Group’s financial position or performance.
Amendment to PFRS 7, Financial Instruments: Disclosures - Enhanced Derecognition Disclosure Requirements The Amendments to PFRS 7 are effective for annual periods beginning on or after July 1, 2011. The amendments require additional disclosure about financial assets that have been transferred but not derecognized to enable the user of the entity’s financial statements to understand the relationship with those assets that have not been derecognized and their associated liabilities. In addition, the amendments require disclosures about continuing involvement in derecognized assets to enable the user to evaluate the nature of, and risks associated with, the entity’s continuing involvement in those derecognized assets.
Amendment to PAS 12, Income Taxes, Deferred Tax: Recovery of Underlying Assets This Amendment to PAS 12 is effective for annual periods beginning on or after January 1, 2012. The amendment clarified the determination of deferred tax on investment property measured at fair value. The amendment introduces a rebuttable presumption that deferred tax on investment property measured using the fair value model in PAS 40, Investment Property, should be determined on the basis that its carrying amount will be recovered through sale. Furthermore, it introduces the requirement that deferred tax on non-depreciable assets that are measured using the revaluation model in PAS 16 always be measured on a sale basis of the asset.
Effective 2013
Amendment to PFRS 7, Financial Instruments: Disclosures - Offsetting Financial Assets and Financial Liabilities The Amendments to PFRS 7 are to be retrospectively applied for annual periods beginning on or after January 1, 2013. These Amendments require an entity to disclose information about rights of set-off and related arrangements (such as collateral agreements). The new disclosures are required for all recognized financial instruments that are set off in accordance with PAS 32. These disclosures also apply to recognized financial instruments that are subject to an enforceable master netting arrangement or ‘similar agreement’, irrespective of whether they are set-off in accordance with PAS 32. The amendments require entities to disclose, in a tabular format unless another format is more appropriate, the following minimum quantitative information. This is presented separately for financial assets and financial liabilities recognized at the end of the reporting period: a) The gross amounts of those recognized financial assets and recognized financial liabilities; b) The amounts that are set off in accordance with the criteria in PAS 32 when determining
the net amounts presented in the statement of financial position; c) The net amounts presented in the statement of financial position; d) The amounts subject to an enforceable master netting arrangement or similar agreement
that are not otherwise included in (b) above, including: i. Amounts related to recognized financial instruments that do not meet some or all of
the offsetting criteria in PAS 32; and ii. Amounts related to financial collateral (including cash collateral); and
e) The net amount after deducting the amounts in (d) from the amounts in (c) abo ve.

Notes to Consolidated Financial Statements | 13
The amendment affects disclosures only and has no impact on the Group’s financial position or performance.
PFRS 10, Consolidated Financial Statements
This Standard becomes effective for annual periods beginning on or after January 1, 2013. PFRS 10 replaces the portion of PAS 27 that addresses the accounting for consolidated financial statements. It also includes the issues raised in Standing Interpretations Committee (SIC)-12, Consolidation - Special Purpose Entities.
PFRS 10 establishes a single control model that applies to all entities including special purpose entities. The changes introduced by PFRS 10 will require management to exercise significant judgment to determine which entities are controlled, and therefore, are required to be consolidated by a parent, compared with the requirements that were in PAS 27. The Group is currently assessing the full impact that this standard will have on the financial position and performance.
PFRS 11, Joint Arrangements
This Standard becomes effective for annual periods beginning on or after January 1, 2013. It replaces PAS 31, Interests in Joint Ventures and SIC-13 Jointly-controlled Entities - Non-monetary Contributions by Venturers. It also removes the option to account for jointly controlled entities (JCEs) using proportionate consolidation. Instead, JCEs that meet the definition of a joint venture must be accounted for using the equity method.
PFRS 12, Disclosure of Interest with Other Entities
This Standard becomes effective for annual periods beginning on or after January 1, 2013. It includes all of the disclosures that were previously in PAS 27 related to consolidated financial statements, as well as all of the disclosures that were previously included in PAS 31 and PAS 28. These disclosures relate to an entity’s interests in subsidiaries, joint arrangements, associates and structured entities. A number of new disclosures are also required.
PFRS 13, Fair Value Measurement
This Standard becomes effective for annual periods beginning on or after January 1, 2013. It establishes a single source of guidance under PFRS for all fair value measurements. It does not change when an entity is required to use fair value, but rather provides guidance on how to measure fair value under PFRS when fair value is required or permitted. The Group is currently assessing the impact that this standard will have on the financial position and performance.
Amendment to PAS 19, Employee Benefits
This Amendment becomes effective for annual periods beginning on or after January 1, 2013. The Amendment provides changes which range from fundamental changes such as removing the corridor mechanism and the concept of expected returns on plan assets to simple clarifications and re-wording. The Group is currently assessing the full impact of the amendments.
Amendment to PAS 27, Separate Financial Statements (Revised)
This Amendment becomes effective for annual periods beginning on or after January 1, 2013. As a consequence of the new PFRS 10 and PFRS 12, what remains of PAS 27 is limited to accounting for subsidiaries, jointly controlled entities, and associates in separate financial statements.

14 | Notes to Consolidated Financial Statements
Amendment to PAS 28, Investments in Associates and Joint Ventures (Revised)
This Amendment becomes effective for annual periods beginning on or after January 1, 2013. As a consequence of the new PFRS 11 and PFRS 12, PAS 28 has been renamed PAS 28, Investments in Associates and Joint Ventures, and describes the application of the equity method to investments in joint ventures in addition to associates.
Philippine Interpretation IFRIC 20, Stripping Costs in the Production Phase of a Surface Mine This interpretation becomes effective for annual periods beginning on or after January 1, 2013. This interpretation applies to waste removal costs that are incurred in surface mining activity during the production phase of the mine (“production stripping costs”) and provides guidance on the recognition of production stripping costs as an asset and measurement of the stripping activity asset. This interpretation will have no impact on the Group’s financial statements.
Effective 2014 Amendments to PAS 32, Offsetting Financial Assets and Financial Liabilities
These Amendments are to be retrospectively applied for annual periods beginning on or after January 1, 2014. It clarifies the meaning of “currently has a legally enforceable right to set-off” and also clarify the application of the PAS 32 offsetting criteria to settlement systems (such as central clearing house systems) which apply gross settlement mechanisms that are not simultaneous. The Group is currently assessing the impact of these amendments.
Effective 2015
PFRS 9, Financial Instruments: Classification and Measurement
This Standard becomes effective for annual periods beginning on or after January 1, 2015. The Standard, as issued in 2010, reflects the first phase of the work on the replacement of PAS 39 and applies to classification and measurement of financial assets and financial liabilities as defined in PAS 39. In subsequent phases, hedge accounting and impairment of financial assets will be addressed with the completion of this project expected on the first half of 2012. The adoption of the first phase of PFRS 9 will have an effect on the classification and measurement of the Group’s financial assets, but will potentially have no impact on classification and measurements of financial liabilities. The Group will quantify the effect in conjunction with the other phases, when issued, to present a comprehensive picture.
Philippine Interpretation IFRIC 15, Agreements for the Construction of Real Estate
The SEC and the Financial Reporting Standards Council have deferred the effectivity of this interpretation until the final Revenue standard is issued by International Accounting Standards Board and an evaluation of the requirements of the final Revenue standard against the practices of the Philippine real estate industry is completed. This interpretation covers accounting for revenue and associated expenses by entities that undertake the construction of real estate directly or through subcontractors. The interpretation requires that revenue on construction of real estate be recognized only upon completion, except when such contract qualifies as construction contract to be accounted for under PAS 11, Construction Contracts, or involves rendering of services in which case revenue is recognized based on stage of completion. Contracts involving provision of services with the construction materials and where the risks and reward of ownership are transferred to the buyer on a continuous basis will also be accounted for based on stage of completion. This interpretation will have no impact on the Group’s financial statements.

Notes to Consolidated Financial Statements | 15
Basis of Consolidation The consolidated financial statements include the accounts of the Company and the following subsidiaries:
Country of
Incorporation Percentage of
Ownership Convenience Distribution, Inc. (CDI) Philippines 100 Store Sites Holding, Inc. (SSHI) Philippines 100
Subsidiaries are those entities in which the Company has an interest of more than one half of the voting rights or otherwise has power to govern the financial and operating policies through interlocking directorships such that substantial benefits from the subsidiaries’ activities flow to the Company. Subsidiaries are fully consolidated from the date on which control is transferred to the Company. They are de-consolidated from the date on which control ceases. The results of subsidiaries acquired or disposed of during the year are included in profit or loss from the date of acquisition or up to the date of the disposal, as appropriate. SSHI’s capital stock, which is divided into 40% common shares and 60% preferred shares are owned by the Company and by Philippine Seven Corporation-Employees Retirement Plan (PSC-ERP) through its trustee, Bank of the Philippines Islands-Asset Management and Trust Group (BPI-AMTG), respectively. These preferred shares which accrue and pay guaranteed preferred dividends and are redeemable at the option of the holder are recognized as a financial liability in accordance with PFRS (see Note 15). The Company owns 100% of SSHI’s common shares, which, together with common key management, gives the Company control over SSHI. The financial statements of the subsidiaries are prepared for the same reporting year as the Company, using uniform accounting policies. Intercompany transactions, balances and unrealized gains and losses are eliminated in full.
Cash and Cash Equivalents Cash includes cash on hand and in banks. Cash equivalents are short-term, highly liquid investments that are readily convertible to known amounts of cash with original maturities of three months or less from the date of acquisition and that are subject to an insignificant change in value.
Financial Instruments The Group recognizes a financial asset or a financial liability in the consolidated balance sheet when it becomes a party to the contractual provisions of the instrument.
Financial assets and financial liabilities are recognized initially at fair value. Transaction costs are included in the initial measurement of all financial assets and financial liabilities, except for financial instruments measured at fair value through profit or loss (FVPL).
All regular way purchases and sales of financial assets are recognized on the trade date, i.e. the date the Group commits to purchase or sell the financial asset. Regular way purchases or sales of financial assets require delivery of assets within the time frame generally established by regulation in the market place.

16 | Notes to Consolidated Financial Statements
The Group classifies its financial assets as financial assets at FVPL, held-to-maturity (HTM) financial assets, available-for-sale financial (AFS) assets or loans and receivables. Financial liabilities, on the other hand, are classified as either financial liabilities at FVPL or other financial liabilities. The classification depends on the purpose for which the financial assets and financial liabilities were acquired. Management determines the classification at initial recognition and, where allowed and appropriate, re-evaluates this designation at every balance sheet date.
Financial Assets a. Financial Assets at FVPL
Financial assets at FVPL include financial assets held-for-trading and those designated upon initial recognition as at FVPL. Financial assets are classified as held-for-trading if they are acquired for the purpose of selling in the near term.
Financial assets are designated as at FVPL on initial recognition when any of the following criteria are met: the designation eliminates or significantly reduces the inconsistent treatment that would
otherwise arise from measuring the assets or recognizing gains or losses on them on a different basis; or
the assets are part of a group of financial assets which are managed and their performance is evaluated on a fair value basis, in accordance with a documented risk management or investment strategy; or
the financial asset contains an embedded derivative, unless the embedded derivative does not significantly modify the cash flows or it is clear, with little or no analysis, that it would not be separately recorded.
Financial assets at FVPL are recorded in the consolidated balance sheet at fair value. Changes in fair value are accounted for directly in profit or loss. Interest earned is recorded as interest income, while dividend income is recognized according to the terms of the contract, or when the right of the payment has been established. As of December 31, 2011 and 2010, the Group has no financial assets at FVPL.
The Group assesses whether embedded derivatives are required to be separated from the host contracts when the Group first becomes a party to the contract. Re-assessment only occurs if there is a change in the terms of the contract that significantly modifies the cash flows that would otherwise be required.
An embedded derivative is separated from the host financial or non-financial asset contract and accounted for as a derivative if all of the following conditions are met:
the economic characteristics and risks of the embedded derivative are not closely related
to the economic characteristic of the host contract; a separate instrument with the same terms as the embedded derivative would meet the
definition of a derivative; and the hybrid or combined instrument is not recognized as FVPL.

Notes to Consolidated Financial Statements | 17
Embedded derivatives that are bifurcated from the host contracts are accounted for as financial assets at FVPL. Changes in fair values are included in profit or loss.
As of December 31, 2011 and 2010, the Group has no outstanding embedded derivatives.
b. HTM Financial Assets
HTM financial assets are quoted non-derivative financial assets with fixed or determinable payments and fixed maturities wherein the Group has the positive intention and ability to hold to maturity. HTM financial assets are subsequently carried either at cost or amortized cost in the consolidated balance sheet. Amortization is determined by using the effective interest rate method. Assets under this category are classified as current assets if maturity is within 12 months from balance sheet date. Otherwise, these are classified as noncurrent assets.
As of December 31, 2011 and 2010, the Group has not designated any financial asset as HTM.
c. AFS Financial Assets AFS financial assets are non-derivative financial assets that are either designated in this
category or not classified in any of the other categories. Financial assets may be designated at initial recognition as AFS if they are purchased and held indefinitely, and may be sold in response to liquidity requirements or changes in market conditions. AFS financial assets are carried at fair value in the consolidated balance sheet. Changes in the fair value of such assets are accounted for in the consolidated statement of comprehensive income until the financial asset is derecognized or until the financial asset is determined to be impaired at which time the cumulative gain or loss previously reported in the consolidated statement of comprehensive income is recognized in profit or loss. AFS financial assets are classified as current assets if maturity is within 12 months from balance sheet date. Otherwise, these are classified as noncurrent assets.
The Group’s AFS financial assets consist of unquoted investments in preferred shares of a public utility company included as part of “Others” under “Goodwill and other noncurrent assets” in the consolidated balance sheets as of December 31, 2011 and 2010.
d. Loans and Receivables Loans and receivables are non-derivative financial assets with fixed or determinable payments
that are not quoted in an active market. Loans and receivables are subsequently carried either at cost or amortized cost in the consolidated balance sheet. Amortization is determined using the effective interest rate method. Loans and receivables are classified as current assets if maturity is within 12 months from balance sheet date. Otherwise, these are classified as noncurrent assets. The Group’s loans and receivables consist of cash and cash equivalents, short-term investments, receivables and deposits as of December 31, 2011 and 2010.
Financial Liabilities a. Financial Liabilities at FVPL
Financial liabilities at FVPL include financial liabilities held-for-trading and those designated upon recognition at FVPL.
Financial liabilities are classified as held-for-trading if they are acquired for the purpose of
selling in the near term.

18 | Notes to Consolidated Financial Statements
Financial liabilities are designated as at FVPL on initial recognition when any of the following
criteria are met:
the designation eliminates or significantly reduces the inconsistent treatment that would otherwise arise from measuring the liabilities or recognizing gains or losses on them on a different basis; or
the liabilities are part of a group of financial liabilities which are managed and their performance is evaluated on a fair value basis, in accordance with a documented risk management or investment strategy; or
the financial instrument contains an embedded derivative, unless the embedded derivative does not significantly modify the cash flows or it is clear, with little or no analysis, that it would not be separately recorded.
Financial liabilities at FVPL are recorded in the consolidated balance sheet at fair value. Changes in fair value are accounted for directly in profit or loss. Interest incurred is recorded as interest expense.
As of December 31, 2011 and 2010, the Group has not designated any financial liability as at FVPL.
b. Other Financial Liabilities
This category pertains to financial liabilities that are neither held-for-trading nor designated as at FVPL upon the inception of the liability. Other financial liabilities are subsequently carried at amortized cost, taking into account the impact of applying the effective interest rate method of amortization (or accretion) for any related premium, discount and any directly attributable transaction costs.
Other financial liabilities are classified as current liabilities if maturity is within the normal operating cycle of the Company and it does not have unconditional right to defer settlement of the liability for at least 12 months from balance sheet date. Otherwise, these are classified as noncurrent liabilities.
The Group’s other financial liabilities consist of bank loans, accounts payable and accrued expenses, other current liabilities, deposits payable and cumulative redeemable preferred shares as of December 31, 2011 and 2010.
Determination of Fair Values Fair value is determined by reference to the transaction price or other market prices. If such market prices are not readily determinable, the fair value of the consideration is estimated as the sum of all future cash payments or receipts, discounted using the prevailing market rates of interest for similar instruments with similar maturities.
Day 1 Difference Where the transaction price in a non-active market is different from the fair value from other observable current market transactions in the same instrument or based on a valuation technique whose variables include only data from observable market, the Group recognizes the difference between the transaction price and fair value (a Day 1 difference) in profit or loss unless it qualifies for recognition as some other type of asset. In cases where use is made of data which is not observable, the difference between the transaction price and model value is only recognized in profit or loss when the inputs become observable or when the instrument is derecognized. For each transaction, the Group determines the appropriate method of recognizing the day 1 difference.

Notes to Consolidated Financial Statements | 19
Offsetting Financial Instruments Financial assets and financial liabilities are offset and the net amount is reported in the consolidated balance sheet if, and only if, there is a currently enforceable legal right to offset the recognized amounts and there is an intention to settle on a net basis, or to realize the asset and settle the liability simultaneously. Impairment of Financial Assets The Group assesses at each balance sheet date whether a financial asset or a group of financial assets is impaired.
Financial Assets Carried at Amortized Cost If there is objective evidence that an impairment loss on loans and receivables has been incurred, the amount of impairment loss is measured as the difference between the financial asset’s carrying amount and the present value of estimated future cash flows (excluding future expected credit losses that have not been incurred) discounted at the financial asset’s original effective interest rate (i.e., the effective interest rate computed at initial recognition). The carrying amount of the asset is reduced by the impairment loss, which is recognized in profit or loss.
The Group first assesses whether objective evidence of impairment exists for financial assets that are individually significant and collectively for financial assets that are not individually significant. Objective evidence includes observable data that comes to the attention of the Group about loss events such as but not limited to significant financial difficulty of the counterparty, a breach of contract, such as a default or delinquency in interest or principal payments, probability that the borrower will enter bankruptcy or other financial reorganization. If it is determined that no objective evidence of impairment exists for an individually or collectively assessed financial asset, whether significant or not, the asset is included in the group of financial assets with similar credit risk characteristics and that group of financial assets is collectively assessed for impairment. Assets that are individually assessed for impairment and for which an impairment loss is or continue to be recognized are not included in a collective assessment of impairment. The impairment assessment is performed at each balance sheet date. For the purpose of a collective evaluation of impairment, financial assets are grouped on the basis of such credit risk characteristics such as customer type, payment history, past-due status and term. Loans and receivables, together with the related allowance, are written off when there is no realistic prospect of future recovery and all collateral has been realized. If, in a subsequent period, the amount of the impairment loss decreases and the decrease can be related objectively to an event occurring after the impairment was recognized, the previously recognized impairment loss is reversed. Any subsequent reversal of an impairment loss is recognized in profit or loss, to the extent that the carrying value of the asset does not exceed its amortized cost at the reversal date. Financial Assets Carried at Cost If there is objective evidence that an impairment loss on an unquoted equity instrument that is not carried at fair value because its fair value cannot be reliably measured, or on a derivative asset that is linked to and must be settled by delivery of such an unquoted equity instrument has been incurred, the amount of the loss is measured as the difference between the asset’s carrying amount and the present value of estimated future cash flows discounted at the current market rate of return of a similar financial asset.

20 | Notes to Consolidated Financial Statements
Financial Assets Carried at Fair Value
If an AFS financial asset is impaired, an amount comprising the difference between its cost (net of any principal payment) and its current fair value, less any impairment loss previously recognized in profit or loss, is transferred from the consolidated statement of comprehensive income to profit or loss. In case of equity securities classified as AFS financial asset, objective evidence would include a significant or prolonged decline in the fair value of the financial assets below its cost or where other objective evidence of impairment exists. The determination of what is “significant” or “prolonged” requires judgment. The Group treats “significant” generally as 20% or more of the original cost of investment, and “prolonged” as greater than six months. In addition, the Group evaluates other factors, including normal volatility in share price for unquoted equities. Impairment losses on equity investments are not reversed through profit or loss. Increases in fair value after impairment are recognized directly in consolidated statement of comprehensive income. Reversals in respect of equity instruments classified as AFS financial asset are not recognized in profit or loss. Reversals of impairment losses on debt instruments are recognized in profit or loss if the increase in fair value of the instrument can be objectively related to an event occurring after the impairment loss was recognized in profit or loss. In case of debt securities classified as AFS financial asset, impairment is assessed based on the same criteria as financial assets carried at amortized cost. Future interest income is based on the reduced carrying amount and is accrued based on the rate of interest used to discount future cash flows for the purpose of measuring impairment loss. Such accrual is recorded as part of “Interest income” in the consolidated statement of comprehensive income. If, in subsequent year, the fair value of a debt security increases and the increase can be objectively related to an event occurring after the impairment loss was recognized in profit or loss, the impairment loss is reversed through profit or loss.
Derecognition of Financial Assets and Liabilities
Financial Assets A financial asset (or, where applicable, a part of a financial asset or a part of a group of similar financial assets) is derecognized when:
the right to receive cash flows from the asset has expired; the Group retains the right to receive cash flows from the asset, but has assumed an obligation
to pay them in full without material delay to a third party under a pass-through arrangement; or
the Group has transferred its right to receive cash flows from the asset and either (a) has transferred substantially all the risks and rewards of the asset, or (b) has neither transferred nor retained substantially all risks and rewards of the asset, but has transferred control of the asset.
Where the Group has transferred its rights to receive cash flows from an asset and has neither
transferred nor retained substantially all the risks and rewards of the asset nor transferred control of the asset, the asset is recognized to the extent of the Group’s continuing involvement in the asset. Continuing involvement that takes the form of a guarantee over the transferred asset is measured at the lower of the original carrying amount of the asset and the maximum amount of consideration that the Group could be required to repay.

Notes to Consolidated Financial Statements | 21
Financial Liabilities A financial liability is derecognized when the obligation under the liability is discharged,
cancelled or has expired.
Where an existing financial liability is replaced by another from the same lender on substantially different terms, or the terms of an existing liability are substantially modified, such an exchange or modification is treated as a derecognition of the original liability and the recognition of a new liability, and the difference in the respective carrying amounts is recognized in profit or loss.
Inventories
Inventories are stated at the lower of cost and net realizable value (NRV). Cost of inventories is determined using the first-in, first-out method. NRV is the selling price in the ordinary course of business, less the estimated cost of marketing and distribution.
Value-Added Tax (VAT)
Input VAT is the 12% indirect tax paid by the Group in the course of the Group’s trade or business on local purchase of goods or services, including lease or use of property, from a VAT-registered entity. For acquisition of capital goods over P=1,000,000, the related input taxes are deferred and amortized over the useful life or 60 months, whichever is shorter, commencing on the date of acquisition. Deferred input VAT which is expected to be utilized more than 12 months after the balance sheet date is included under “Goodwill and other noncurrent assets” account in the consolidated balance sheet.
Output VAT pertains to the 12% tax due on the sale of merchandise and lease or exchange of taxable goods or properties or services by the Group. If at the end of any taxable month the output VAT exceeds the input VAT, the excess shall be paid by the Group. Any outstanding balance is included under “Accounts payable and accrued expenses” account in the consolidated balance sheet. If the input VAT exceeds the output VAT, the excess shall be carried over to the succeeding month or months. Excess input VAT is included under “Prepayments and other current assets” account in the consolidated balance sheet. Input VAT on capital goods may, at the option of the Group, be refunded or credited against other internal revenue taxes, subject to certain tax laws. Revenue, expenses and assets are recognized net of the amount of VAT.
Advances to Suppliers
Advances to suppliers are downpayments for acquisitions of property and equipment not yet received. Once the property and equipment are received, the asset is recognized together with the corresponding liability.
Property and Equipment
Property and equipment, except for land, are carried at cost less accumulated depreciation and amortization, and any impairment in value.
Land is carried at revalued amount less any impairment in value. The difference between cost and revalued amount goes to the equity section of the consolidated balance sheet. The revalued amount is determined by a professionally qualified independent appraiser.

22 | Notes to Consolidated Financial Statements
The initial cost of property and equipment consists of its purchase price and any directly attributable costs of bringing the asset to its working condition and location for its intended use. Expenditures incurred after the assets have been put into operation, such as repairs and maintenance and overhaul costs, are recognized in profit or loss in the period in which the costs are incurred. In situations where it can be clearly demonstrated that the expenditures have resulted in an increase in the future economic benefits expected to be obtained from the use of an item of property and equipment beyond its originally assessed standard of performance, the expenditures are capitalized as an additional cost of the assets.
Construction in progress includes cost of construction and other direct costs and is stated at cost less any impairment in value. Construction in progress is not depreciated until such time the relevant assets are completed and put into operational use.
Depreciation and amortization commence once the assets are available for use. It ceases at the earlier of the date that it is classified as noncurrent asset held-for-sale and the date the asset is derecognized. Depreciation is computed on a straight-line method over the estimated useful lives of the assets as follows:
Years Buildings and improvements 10 to 12 Store furniture and equipment 5 to 10 Office furniture and equipment 3 to 5 Transportation equipment 3 to 5 Computer equipment 3
Leasehold improvements are amortized over the estimated useful life of the improvements, ranging from five to ten years, or the term of the lease, whichever is shorter.
The assets’ estimated useful lives and depreciation and amortization method are reviewed periodically to ensure that the period and method of depreciation and amortization are consistent with the expected pattern of economic benefits from the items of property and equipment. When assets are retired or otherwise disposed of, the cost or revalued amount and the related accumulated depreciation and amortization and any impairment in value are removed from the accounts and any resulting gain or loss is recognized in profit or loss. The revaluation increment in equity relating to the revalued asset sold is transferred to retained earnings.
Fully depreciated assets are retained in the books until disposed. Software and Program Cost Software and program cost, which are not specifically identifiable and integral to a specific
computer hardware, are shown under “Goodwill and other noncurrent assets” in the consolidated balance sheet. These are carried at cost, less accumulated amortization and any impairment in value. Amortization is computed on a straight-line method over their estimated useful life of five years.
Notes to Consolidated Financial Statements | 23
Impairment of Property and Equipment and Software and Program Cost
The Group assesses at each balance sheet date whether there is an indication that a nonfinancial asset may be impaired. If any such indication exists, or when annual impairment testing for an asset is required, the Group makes an estimate of the asset’s recoverable amount. An asset’s recoverable amount is the higher of an asset’s or cash generating unit’s fair value less costs to sell and its value-in-use and is determined for an individual asset, unless the asset does not generate cash inflows that are largely independent of those from other assets or groups of assets. For land, the asset’s recoverable amount is the land’s net selling price, which may be obtained from its sale in an arm’s length transaction. For goodwill, the asset’s recoverable amount is its value-in-use. Where the carrying amount of an asset exceeds its recoverable amount, the asset is considered impaired and is written down to its recoverable amount. In assessing value-in-use, the estimated future cash flows are discounted to their present value, using a pre-tax discount rate that reflects current market assessments of the time value of money and risks specific to the asset. Impairment losses, if any, are recognized in profit or loss in those expense categories consistent with the function of the impaired asset.
An assessment is made at each balance sheet date as to whether there is any indication that previously recognized impairment losses may no longer exist or may have decreased. If such indication exists, the recoverable amount is estimated. A previously recognized impairment loss is reversed only if there has been a change in the estimates used to determine the asset’s recoverable amount since the last impairment loss was recognized. If that is the case, the carrying amount of the asset is increased to its recoverable amount. That increased amount cannot exceed the carrying amount that would have been determined, net of depreciation and amortization, had no impairment loss been recognized for the asset in previous years. Such reversal is recognized in profit or loss, unless the asset is carried at revalued amount, in which case, the reversal is treated as a revaluation increase. After such reversal, the depreciation charge is adjusted in the future periods to allocate the asset’s revised carrying amount, less any residual value, on a systematic basis over its remaining useful life.
Deposits
Deposits are amounts paid as guarantee in relation to noncancelable agreements entered into by the Group. Deposits include rent deposits for lease, franchise and service agreements. These deposits are recognized at cost and can be refunded or applied to future billings.
Business Combinations and Goodwill Business combinations are accounted for using the acquisition method. The cost of an acquisition is measured as the aggregate of the consideration transferred, measured at acquisition date fair value and the amount of any non-controlling interest in the acquiree. For each business combination, the acquirer measures the non-controlling interest in the acquiree either at fair value or at the proportionate share of the acquiree’s identifiable net assets. Acquisition costs incurred are expensed and included in administrative expenses. When the Company acquires a business, it assesses the financial assets and financial liabilities assumed for appropriate classification and designation in accordance with the contractual terms, economic circumstances and pertinent conditions as at the acquisition date. This includes the separation of embedded derivatives in host contracts by the acquiree. If the business combination is achieved in stages, the acquisition date fair value of the acquirer’s previously held equity interest in the acquiree is re-measured to fair value at the acquisition date through profit or loss.
24 | Notes to Consolidated Financial Statements
Any contingent consideration to be transferred by the acquirer will be recognized at fair value at the acquisition date. Subsequent changes to the fair value of the contingent consideration, which is deemed to be an asset or liability, will be recognized in accordance with PAS 39 either in profit or loss or as a change to other comprehensive income. If the contingent consideration is classified as equity, it should not be re-measured until it is finally settled within equity. Goodwill, included in “Goodwill and other noncurrent assets” in the consolidated balance sheet, represents the excess of the cost of an acquisition over the fair value of the businesses acquired. Following initial recognition, goodwill is measured at cost less any accumulated impairment losses. Goodwill is reviewed for impairment, annually or more frequently if event or changes in circumstances indicate that the carrying value may be impaired. Impairment is determined for goodwill by assessing the recoverable amount of the cash-generating unit or group of cash-generating units to which the goodwill relates. Where the recoverable amount of the cash- generating unit or group of cash-generating units is less than the carrying amount of the cash-generating unit or group of cash-generating units to which goodwill has been allocated, an impairment loss is recognized. Impairment losses relating to goodwill cannot be reversed in future periods.
Cumulative Redeemable Preferred Shares
Cumulative redeemable preferred shares that exhibit characteristics of a liability is recognized as a financial liability in the consolidated balance sheet, net of transaction cost. The corresponding dividends on those shares are charged as interest expense in profit or loss.
Deferred Revenue
Deferred revenue is recognized for cash received for income not yet earned. Deferred revenue is recognized as revenue over the life of the revenue contract or upon delivery of goods or services.
Equity Capital Stock
Capital stock is measured at par value for all shares issued and outstanding. When the Group issues more than one class of stock, a separate account is maintained for each class of stock and number of shares issued and outstanding.
Additional Paid-in Capital When the shares are sold at premium, the difference between the proceeds and the par value is credited to the “Additional paid-in capital” account. When shares are issued for a consideration other than cash, the proceeds are measured by the fair value of the consideration received. In case the shares are issued to extinguish or settle the liability of the Group, the shares shall be measured either at the fair value of the shares issued or fair value of the liability settled, whichever is more reliably determinable.
Retained Earnings
Retained earnings represent the cumulative balance of periodic net income or loss and changes in accounting policy. When the retained earnings account has a debit balance, it is called “deficit.” A deficit is not an asset but a deduction from equity. Treasury Stock
Treasury stock is stated at acquisition cost and is deducted from equity. No gain or loss is recognized in profit or loss on the purchase, sale, issuance or cancellation of the Group’s own equity instruments.

Notes to Consolidated Financial Statements | 25
Revenue Recognition
Revenue is recognized to the extent that it is probable that the economic benefits will flow to the Group and the amount of revenue can be measured reliably. The Group has assessed its revenue arrangements against the criteria enumerated under PAS 18, Revenue Recognition, and concluded that it is acting as principal in all arrangements, except for its sale of consigned goods. The following specific recognition criteria must also be met before revenue is recognized:
Merchandise Sales
Revenue from merchandise sales is recognized when the significant risks and rewards of ownership of the goods have passed to the buyer. Revenue is measured at the fair value of the consideration received, excluding discounts, returns, rebates and sales taxes.
Franchise Franchise fee is recognized upon execution of the franchise agreement and performance of initial services required under the franchise agreement. Franchise revenue is recognized in the period earned. Marketing Marketing income is recognized when service is rendered. In case of marketing support funds, revenue is recognized upon achievement of the minimum purchase requirement of the suppliers.
Rental
Rental income is accounted for on a straight-line basis over the term of the lease. Commission Commission income is recognized upon the sale of consigned goods.
Interest Interest income is recognized as it accrues based on the effective interest rate method.
Costs and Expenses Recognition Costs of merchandise sold are recognized in profit or loss at the point of sale. Expenses are recognized in profit or loss upon utilization of the services or when they are incurred.
Other Comprehensive Income Other comprehensive income comprises items of income and expense (including items previously presented under the statement of changes in equity) that are not recognized in profit or loss for the year in accordance with PFRS.
Retirement Benefits
Retirement benefits cost is determined using the projected unit credit actuarial valuation method. Actuarial gains and losses are recognized as income or expense when the net cumulative unrecognized actuarial gains and losses for each individual plan at the end of the previous reporting year exceeded 10% of the higher of the present value of the retirement obligations and the fair value of the net plan assets as of that date. These gains or losses are recognized over the expected average remaining working lives of the employees participating in the plan.
Past service cost is recognized as an expense in profit or loss on a straight-line basis over the
average period until the benefits become vested. If the benefits are already vested following the introduction of, or changes to the plan, past service cost is recognized immediately.

26 | Notes to Consolidated Financial Statements
The net retirement obligation is the aggregate of the present value of the retirement obligation and
actuarial gains and losses not recognized reduced by past service cost not yet recognized and the fair value of the net plan assets out of which obligations are to be settled directly. If such aggregate is negative, the asset is measured at the lower of such aggregate or the aggregate of cumulative unrecognized net actuarial losses and past service cost and the present value of any economic benefits available in the form of refund from the plan or reductions in the future contributions to the plan.
Leases Finance leases, which transfer to the lessee substantially all the risks and rewards of ownership of the asset, are capitalized at the inception of the lease at the fair value of the leased property or, if lower, at the present value of the minimum lease payments. Lease payments are apportioned between the interest income and reduction of the lease receivable so as to achieve a constant rate of interest on the remaining balance of the receivable. Interest income is recognized directly in profit or loss.
Leases where the lessor retains substantially all the risks and rewards of ownership of the asset are classified as operating leases. Operating leases are recognized as an expense in profit or loss on a straight-line basis over the lease term. The determination of whether an arrangement is, or contains a lease is based on the substance of the arrangement and requires an assessment of whether the fulfillment of the arrangement is dependent on the use of a specific asset or assets and the arrangement conveys a right to use the asset. A reassessment is made after inception of the lease only if one of the following applies: a. there is a change in contractual terms, other than a renewal or extension of the arrangement; or b. a renewal option is exercised or extension is granted, unless the term of the renewal or
extension was initially included in the lease term; or c. there is a change in the determination of whether fulfillment is dependent on a specified asset;
or d. there is a substantial change to the asset.
Where a re-assessment is made, lease accounting shall commence or cease from the date when the change in circumstance gave rise to the re-assessment for scenarios (a), (c) or (d) above, and the date of renewal or extension for scenario (b).
Borrowing Costs
Borrowing costs directly attributable to the acquisition, construction or production of an asset that necessarily takes a substantial period of time to get ready for its intended use or sale are capitalized as part of the cost of the respective assets. All other borrowing costs are expensed in the period they occur. Borrowing costs consist of interest and other costs that an entity incurs in connection with the borrowing of funds.
Foreign Currency-denominated Transactions
Transactions in foreign currency are initially recorded at the exchange rate at the date of transaction. Outstanding foreign currency-denominated monetary assets and liabilities are translated using the applicable exchange rate at balance sheet date. Exchange differences arising from translation of foreign currency monetary items at rates different from those at which they were originally recorded are recognized in profit or loss.

Notes to Consolidated Financial Statements | 27
Income Tax Current Income Tax Current income tax assets and liabilities for the current and prior periods are measured at the
amount expected to be recovered from or paid to the taxation authorities. The tax rates and tax laws used to compute the amount are those that have been enacted or substantively enacted at the balance sheet date.
Deferred Income Tax Deferred income tax is recognized on all temporary differences at the balance sheet date between
the tax bases of assets and liabilities and their carrying amounts for financial reporting purposes. Deferred income tax liabilities are recognized for all taxable temporary differences. Deferred
income tax assets are recognized for all deductible temporary differences to the extent that it is probable that sufficient future taxable profits will be available against which the deductible temporary differences can be utilized.
Deferred income tax relating to items recognized directly in equity is recognized in profit or loss. The carrying amount of deferred income tax assets is reviewed at each balance sheet date and
reduced to the extent that it is no longer probable that sufficient future taxable profits will be available to allow all or part of the deferred income tax assets to be utilized. Unrecognized deferred income tax assets are reassessed at each balance sheet date and are recognized to the extent that it has become probable that sufficient future taxable profits will allow the deferred income tax assets to be recovered.
Deferred income tax assets and liabilities are measured at the tax rates that are expected to apply
to the period when the asset is realized or the liability is settled, based on tax rates (and tax laws) that have been enacted or substantively enacted at the balance sheet date.
Deferred income tax assets and liabilities are offset, if a legally enforceable right exists to set off
deferred income tax assets against deferred income tax liabilities and the deferred income taxes relate to the same taxable entity and the same taxation authority.
Earnings (Loss) Per Share Basic earnings (loss) per share is calculated by dividing the net income or (loss) for the year
attributable to common shareholders by the weighted average number of shares outstanding during the year, excluding treasury shares.
Diluted earnings (loss) per share is calculated by dividing the net income or (loss) for the year attributable to common shareholders by the weighted average number of shares outstanding during the year, excluding treasury shares and adjusted for the effects of all potential dilutive common shares, if any.
In determining both the basic and diluted earnings (loss) per share, the effect of stock dividends, if
any, is accounted for retrospectively. Segment Reporting
Operating segments are components of an entity for which separate financial information is available and evaluated regularly by management in deciding how to allocate resources and assessing performance. The Group considers the store operation as its primary activity and its only business segment. Franchising, renting of properties and commissioning on bills payment services are considered an integral part of the store operations.

28 | Notes to Consolidated Financial Statements
Provisions
Provisions are recognized when: (a) the Group has a present obligation (legal or constructive) as a result of a past event; (b) it is probable that an outflow of resources embodying economic benefits will be required to settle the obligation; and (c) a reliable estimate can be made of the amount of the obligation. If the effect of the time value of money is material, provisions are determined by discounting the expected future cash flows at a pre-tax rate that reflects current market assessments of the time value of money and, where appropriate, the risks specific to the liability. Where discounting is used, the increase in the provision due to the passage of time is recognized as interest expense. When the Group expects a provision or loss to be reimbursed, the reimbursement is recognized as a separate asset only when the reimbursement is virtually certain and its amount is estimable. The expense relating to any provision is presented in profit or loss, net of any reimbursement.
Contingencies Contingent liabilities are not recognized in the consolidated financial statements. They are
disclosed unless the possibility of an outflow of resources embodying economic benefits is remote. Contingent assets are not recognized in the consolidated financial statements but disclosed when an inflow of economic benefit is probable. Contingent assets are assessed continually to ensure that developments are appropriately reflected in the consolidated financial statements. If it has become virtually certain that an inflow of economic benefits will arise, the asset and the related income are recognized in the consolidated financial statements.
Events after the Balance Sheet Date Post year-end events that provide additional information about the Group’s position at the balance sheet date (adjusting events) are reflected in the consolidated financial statements. Post year-end events that are non-adjusting events are disclosed in the notes to the consolidated financial statements when material.
3. Use of Significant Accounting Judgments, Estimates and Assumptions
The preparation of the consolidated financial statements in accordance with PFRS requires management to make judgments, estimates and assumptions that affect the amounts reported in the consolidated financial statements and notes. The judgments, estimates and assumptions used in the consolidated financial statements are based upon management’s evaluation of relevant facts and circumstances as of balance sheet date. Future events may occur which can cause the assumptions used in arriving at those judgments, estimates and assumptions to change. The effects of any changes will be reflected in the consolidated financial statements of the Group as they become reasonably determinable.
Judgments In the process of applying the Group’s accounting policies, management has made the following judgments, apart from those involving estimations, which have the most significant effect on amounts recognized in the consolidated financial statements:
Determination of Functional Currency Based on the economic substance of the underlying circumstances relevant to the Company, the functional currency of the Company has been determined to be the Peso. The Peso is the currency of the primary economic environment in which the Company operates. It is the currency that mainly influences the revenue, costs and expenses of the Company.
Notes to Consolidated Financial Statements | 29
Classification of Financial Instruments The Group classifies a financial instrument, or its components, on initial recognition as a financial asset, liability or equity instrument in accordance with the substance of the contractual arrangement and the definitions of a financial asset, liability or equity instrument. The substance of a financial instrument, rather than its legal form, governs its classification in the consolidated balance sheet.
Financial assets are classified as financial assets at FVPL, HTM financial assets, AFS financial assets and loans and receivables. Financial liabilities, on the other hand, are classified as financial liabilities at FVPL and other financial liabilities.
The Group determines the classification at initial recognition and, where allowed and appropriate, re-evaluates this classification at every balance sheet date.
The Group’s financial instruments include loans and receivables, AFS financial assets and other financial liabilities (see Note 29).
Classification of Leases a. Finance lease as lessor
The Group entered into a sale and leaseback transaction with an armored car service provider where it has determined that the risks and rewards related to the armored vehicles leased out will be transferred to the lessee at the end of the lease term. As such, the lease agreement was accounted for as a finance lease (see Note 26).
b. Operating lease as lessee
The Group entered into various property leases, where it has determined that the risks and rewards related to the properties are retained with the lessors. As such, the lease agreements were accounted for as operating leases (see Note 26).
c. Operating lease as lessor
The Company entered into property subleases on its leased properties. SSHI also entered into lease agreements on properties which it owns. The Company and SSHI determined that it retains all the significant risks and rewards of these properties which are leased out on operating leases (see Note 26).
Impairment of Property and Equipment and Software and Program Costs
The Group determines whether its items of property and equipment and software and program costs are impaired on an annual basis. This requires an estimation of the value-in-use of the cash-generating units to which the assets are allocated. The preparation of the estimated future cash flows in determining value-in-use involves significant judgment, estimation and assumption. While management believes that the assumptions made are appropriate and reasonable, significant changes in these assumptions may materially affect the assessment of recoverable values and may lead to future impairment charges. The carrying value of property and equipment and software and program costs amounted to P=1,948,517,102 and P=1,612,379,628 as of December 31, 2011 and 2010, respectively (see Notes 8 and 10). Based on management’s judgment, there were no indicators of impairment of the Group’s nonfinancial assets, thus, no impairment loss were recognized in 2011, 2010 and 2009.

30 | Notes to Consolidated Financial Statements
Estimates The key assumptions concerning the future and other key sources of estimation uncertainty at the balance sheet date that have a significant risk of causing a material adjustment to the carrying amounts of assets and liabilities follow:
Determination of Fair Values The fair value for financial instruments traded in active markets at the balance sheet date is based
on their quoted market price or dealer price quotations (bid price for long positions and ask price for short positions), without any deduction for transaction costs. When current bid and asking prices are not available, the price of the most recent transaction provides evidence of the current fair value as long as there has not been a significant change in economic circumstances since the time of the transaction. For all other financial instruments not listed in an active market, the fair value is determined by using appropriate valuation techniques. Valuation techniques include net present value techniques, comparison to similar instruments for which market observable prices exist, options pricing models, and other relevant valuation models. Note 29 presents the fair values of the financial instruments and the methods and assumptions used in estimating their fair values.
Impairment of Loans and Receivables The Group reviews its loans and receivables at each balance sheet date to assess whether a provision for impairment should be recognized in profit or loss or loans and receivables balance should be written off. In particular, judgment by management is required in the estimation of the amount and timing of future cash flows when determining the level of allowance required. Such estimates are based on assumptions about a number of factors and actual results may differ, resulting in future changes to the allowance. Moreover, management evaluates the presence of objective evidence of impairment which includes observable data that comes to the attention of the Group about loss events such as but not limited to significant financial difficulty of the counterparty, a breach of contract, such as a default or delinquency in interest or principal payments, probability that the borrower will enter bankruptcy or other financial re-organization. In addition to specific allowances against individually significant loans and receivables, the Group also makes a collective impairment allowance against exposures which, although not specifically identified as requiring a specific allowance, have a greater risk of default than when originally granted. This takes into consideration the credit risk characteristics such as customer type, payment history, past due status and term.
The carrying value of loans and receivables amounted to P=708,505,045 and P=571,226,437 as of December 31, 2011 and 2010, respectively (see Note 29). Allowance for impairment on loans and receivables amounted to P=7,438,483 and P=3,627,492 as of December 31, 2011 and 2010, respectively (see Notes 5 and 30). Provision for impairment amounted to P=3,810,991, P=1,622,883 and P=9,798,327 in 2011, 2010 and 2009, respectively (see Notes 5 and 19).
Notes to Consolidated Financial Statements | 31
Impairment of AFS Financial Assets In determining the fair values of financial assets, management evaluates the presence of significant and prolonged decline in the fair value of share price below its cost, the normal volatility in the share price, the financial health of the investee and the industry and sector performance like changes in operational and financial cash flows. Any indication of deterioration in these factors can have a negative impact on their fair value. The determination of what is “significant” or “prolonged” requires judgment. The Group treats “significant” generally as 20% or more of the original cost of investment, and “prolonged” as greater than six months.
The carrying value of AFS financial assets included as part of “Others” under “Goodwill and other noncurrent assets” amounted to nil as of December 31, 2011 and P=1,320,575 as of December 31, 2010. (see Notes 10 and 29). No impairment losses were recognized in 2011, 2010 and 2009.
Decline in Inventory Value Provisions are made for inventories whose NRV are lower than their carrying cost. This entails
determination of replacement costs and costs necessary to make the sale. The estimates are based on a number of factors, such as but not limited to the age, status and recoverability of inventories.
The carrying value of inventories amounted to P=519,258,936 and P=402,419,577 as of
December 31, 2011 and 2010, respectively (see Note 6). No provisions for decline in inventory value were recognized in 2011, 2010 and 2009. Estimation of Useful Lives of Property and Equipment and Software and Program Cost
The Group estimates the useful lives of its property and equipment and software and program cost based on a period over which the assets are expected to be available for use.
Property and equipment, net of accumulated depreciation and amortization, amounted to
P=1,946,032,976 and P=1,607,296,761 as of December 31, 2011 and 2010, respectively (see Note 8). The carrying amount of software and program cost amounted to P=2,484,126 and P=5,082,867 as of December 31, 2011 and 2010, respectively (see Note 10).
Impairment of Goodwill
The Group determines whether goodwill is impaired at least on an annual basis. This requires an estimation of the value-in-use of the cash-generating units to which the goodwill is allocated. Estimating the value-in-use amount requires management to make an estimate of the expected future cash flows from the cash-generating unit and also to choose a suitable discount rate in order to calculate the present value of those cash flows. The carrying value of goodwill amounted to P=65,567,524 as of December 31, 2011 and 2010. No impairment losses were recognized in 2011, 2010 and 2009 (see Note 10). Based on the assessment made by the Group, there is no impairment of goodwill as the recoverable amount of the cash-generating units exceeds the carrying amount of the unit, including goodwill as of December 31, 2011 and 2010.
Estimation of Retirement Benefits The determination of the obligation and retirement benefits is dependent on management’s
assumptions used by the actuary in calculating such amounts. Those assumptions are described in Note 24 and include, among others, discount rates per annum, expected annual rate of return on plan assets and salary increase rates. Actual results that differ from the Group’s assumptions are accumulated and amortized over future periods and therefore, generally affect the recognized expense and recorded obligation in such future periods. While the Group believes that the assumptions are reasonable and appropriate, significant differences in the actual experience or significant changes in the assumptions may materially affect the retirement obligations.
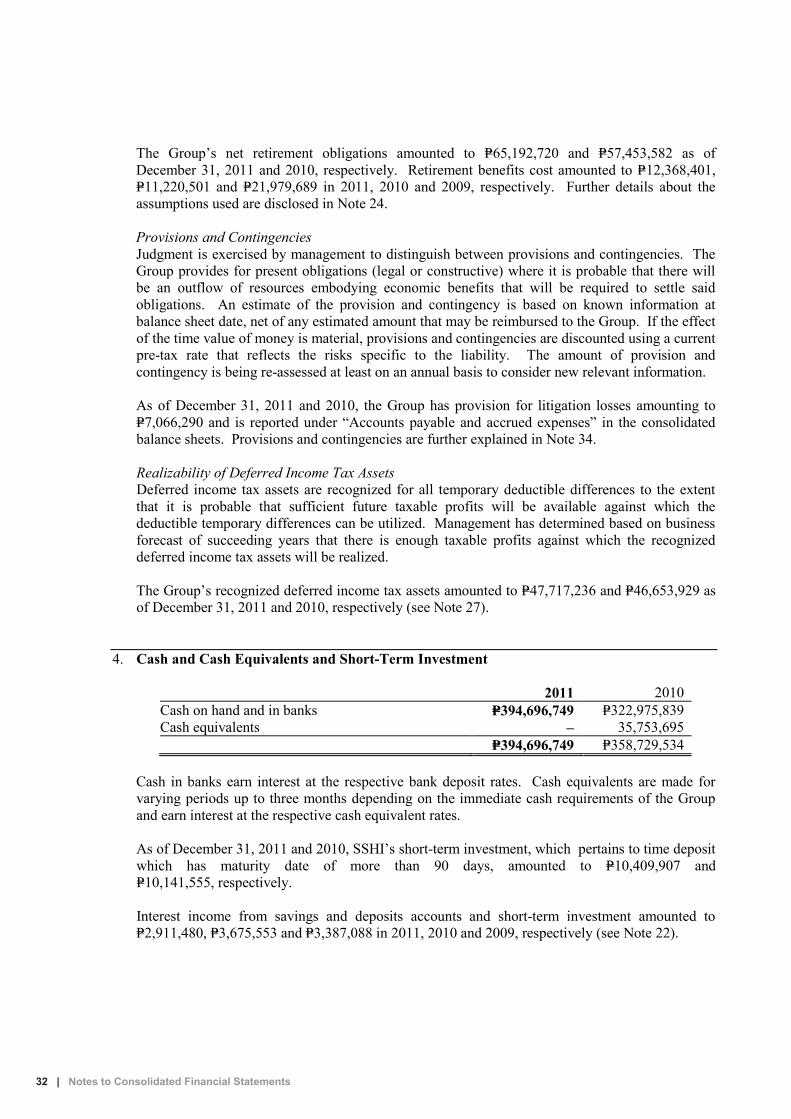
32 | Notes to Consolidated Financial Statements
The Group’s net retirement obligations amounted to P=65,192,720 and P=57,453,582 as of December 31, 2011 and 2010, respectively. Retirement benefits cost amounted to P=12,368,401, P=11,220,501 and P=21,979,689 in 2011, 2010 and 2009, respectively. Further details about the assumptions used are disclosed in Note 24. Provisions and Contingencies Judgment is exercised by management to distinguish between provisions and contingencies. The Group provides for present obligations (legal or constructive) where it is probable that there will be an outflow of resources embodying economic benefits that will be required to settle said obligations. An estimate of the provision and contingency is based on known information at balance sheet date, net of any estimated amount that may be reimbursed to the Group. If the effect of the time value of money is material, provisions and contingencies are discounted using a current pre-tax rate that reflects the risks specific to the liability. The amount of provision and contingency is being re-assessed at least on an annual basis to consider new relevant information. As of December 31, 2011 and 2010, the Group has provision for litigation losses amounting to P=7,066,290 and is reported under “Accounts payable and accrued expenses” in the consolidated balance sheets. Provisions and contingencies are further explained in Note 34. Realizability of Deferred Income Tax Assets Deferred income tax assets are recognized for all temporary deductible differences to the extent that it is probable that sufficient future taxable profits will be available against which the deductible temporary differences can be utilized. Management has determined based on business forecast of succeeding years that there is enough taxable profits against which the recognized deferred income tax assets will be realized. The Group’s recognized deferred income tax assets amounted to P=47,717,236 and P=46,653,929 as of December 31, 2011 and 2010, respectively (see Note 27).
4. Cash and Cash Equivalents and Short-Term Investment
2011 2010 Cash on hand and in banks P=394,696,749 P=322,975,839 Cash equivalents – 35,753,695 P=394,696,749 P=358,729,534
Cash in banks earn interest at the respective bank deposit rates. Cash equivalents are made for varying periods up to three months depending on the immediate cash requirements of the Group and earn interest at the respective cash equivalent rates. As of December 31, 2011 and 2010, SSHI’s short-term investment, which pertains to time deposit which has maturity date of more than 90 days, amounted to P=10,409,907 and P=10,141,555, respectively. Interest income from savings and deposits accounts and short-term investment amounted to P=2,911,480, P=3,675,553 and P=3,387,088 in 2011, 2010 and 2009, respectively (see Note 22).

Notes to Consolidated Financial Statements | 33
5. Receivables
2011 2010 Suppliers P=99,035,030 P=58,816,472 Franchisees 89,638,852 40,871,647 Store operators 15,683,186 9,718,957 Employees 15,407,124 10,321,643 Rent 7,068,009 5,709,582 Notes 1,328,983 728,097 Current portion of lease receivable - net of unearned
interest income amounting to P=291,204 and P=378,850 as of December 31, 2011 and 2010, respectively (Note 26) 1,300,075 1,212,430
Insurance receivable 319,208 10,986,094 Due from Philseven Foundation, Inc. (PFI)
(Note 25) 173,945 888,425 Deposits 1,009,864 1,009,864 Others 15,763,494 21,706,916 246,727,770 161,970,127 Less allowance for impairment 7,438,483 3,627,492 P=239,289,287 P=158,342,635
The classes of receivables of the Group are as follows:
Suppliers - pertains to receivables from the Group’s suppliers for display allowances, annual
volume discount and commission income from different service providers. Franchisees - pertains to receivables for the inventory loans obtained by the franchisees at the
start of their store operations. Store operators - pertains to the advances given to third party store operators under service
agreements (see Note 32). Employees - includes car loans, salary loans and cash shortages from stores which are charged
to employees. Rent - pertains to receivables from sublease agreements with third parties, which are based on
an agreed fixed monthly rate or as agreed upon by the parties.
Receivables are noninterest-bearing and are generally on 30 to 90 day terms except for lease receivable with a 7% interest rate per annum.
The Company collected P=10,858,906 and P=8,606,678 in 2011 and 2010, respectively, from the insurance company as insurance proceeds for the Company’s properties destroyed by the typhoon “Ondoy”. As of December 31, 2011, there is no outstanding receivable from the insurance company related to the claim. The gain amounting to P=19,465,584 is included as “Other income” in the 2010 consolidated statement of comprehensive income.
Movements in allowance for impairment are as follows:
2011 Suppliers Others Total Beginning balances P=381,786 P=3,245,706 P=3,627,492 Provision for the year (Note 19) 1,396,168 2,414,823 3,810,991 Ending balances P=1,777,954 P=5,660,529 P=7,438,483

34 | Notes to Consolidated Financial Statements
2010 Suppliers Others Total Beginning balances P=7,535,300 P=3,308,648 P=10,843,948 Provision for the year (Note 19) 204,716 1,418,167 1,622,883 Write-off (7,140,854) − (7,140,854) Recovery of bad debts (217,376) (1,481,109) (1,698,485) Ending balances P=381,786 P=3,245,706 P=3,627,492
6. Inventories
2011 2010 At cost (Note 18): Warehouse merchandise P=271,683,488 P=200,869,257 Store merchandise 247,575,448 201,550,320 P=519,258,936 P=402,419,577
7. Prepayments and Other Current Assets
2011 2010 Deferred input VAT P=43,844,078 P=35,627,256 Advances to suppliers 47,628,097 46,036,750 Prepaid rent (Note 10) 36,729,050 32,972,222 Pre-operating store expenses 11,354,992 10,387,131 Advances for expenses 5,176,635 3,268,768 Current portion of deferred lease (Notes 10 and 26) 2,425,557 1,363,270 Prepaid uniform 2,145,413 2,400,798 Supplies 1,825,459 1,915,107 Others 10,392,857 5,635,795 P=161,522,138 P=139,607,097
Deferred input VAT pertains to the acquisition of capital goods over P=1,000,000 which are being amortized over the useful life or 60 months, whichever is shorter, commencing on the date of acquisition. Current portion of deferred input VAT in 2011 and 2010 amounted to P=43,844,078 and P=35,627,256, respectively.
8. Property and Equipment
Movements in property and equipment are as follows:
2011 Land- Store Office at revalued Buildings and Furniture and Furniture and Transportation Computer Leasehold Construction amount Improvements Equipment Equipment Equipment Equipment Improvements In-Progress Total Costs/Revalued Amount Beginning balances P=44,481,000 P=109,312,911 P=1,176,847,311 P=419,230,096 P=37,624,956 P=248,482,190 P=828,894,084 P=41,487,041 P=2,906,359,589 Additions – 866,938 348,799,410 106,667,047 16,034,780 53,854,534 121,517,149 69,351,878 717,091,736 Disposals – – (218,620,219) (71,994,025) (14,671,134) (125,977,509) (9,605,987) – (440,868,874) Reclassifications – – – 203,179 – – 37,828,990 (38,032,169) – Ending balances 44,481,000 110,179,849 1,307,026,502 454,106,297 38,988,602 176,359,215 978,634,236 72,806,750 3,182,582,451 Accumulated Depreciation and Amortization Beginning balances – 60,016,925 455,617,362 209,862,824 24,284,740 199,975,370 349,305,607 – 1,299,062,828 Depreciation and amortization (Note 19) – 4,941,169 188,112,964 56,852,655 6,069,588 31,284,991 91,094,154 – 378,355,521 Disposals – – (218,620,219) (71,994,025) (14,671,134) (125,977,509) (9,605,987) – (440,868,874) Ending balances – 64,958,094 425,110,107 194,721,454 15,683,194 105,282,852 430,793,774 – 1,236,549,475 Net Book Values P=44,481,000 P=45,221,755 P=881,916,395 P=259,384,843 P=23,305,408 P=71,076,363 P=547,840,462 P=72,806,750 P=1,946,032,976

Notes to Consolidated Financial Statements | 35
2010 Land - Store Office at revalued Buildings and Furniture and Furniture and Transportation Computer Leasehold Construction amount Improvements Equipment Equipment Equipment Equipment Improvements In-Progress Total Costs/Revalued Amount Beginning balances P=44,481,000 P=106,835,234 P=838,669,091 P=341,773,268 P=31,477,634 P=234,546,575 P=632,372,530 P=43,745,821 P=2,273,901,153 Additions − 2,477,677 364,185,866 83,407,721 7,246,905 16,016,009 91,525,378 107,064,274 671,923,830 Disposals − − (26,007,646) (5,950,893) (1,099,583) (2,080,394) (4,326,878) − (39,465,394) Reclassifications − − − − − − 109,323,054 (109,323,054) − Ending balances 44,481,000 109,312,911 1,176,847,311 419,230,096 37,624,956 248,482,190 828,894,084 41,487,041 2,906,359,589 Accumulated Depreciation and Amortization Beginning balances – 55,131,255 358,677,752 170,264,855 20,393,889 162,318,915 279,870,057 – 1,046,656,723 Depreciation and amortization (Note 19) – 4,884,908 123,939,882 45,462,652 4,626,521 40,107,026 72,782,765 – 291,803,754 Disposals – – (26,007,646) (5,883,148) (1,099,583) (2,080,394) (4,326,878) – (39,397,649) Reclassifications – 762 (992,626) 18,465 363,913 (370,177) 979,663 – – Ending balances – 60,016,925 455,617,362 209,862,824 24,284,740 199,975,370 349,305,607 – 1,299,062,828 Net Book Values P=44,481,000 P=49,295,986 P=721,229,949 P=209,367,272 P=13,340,216 P=48,506,820 P=479,588,477 P=41,487,041 P=1,607,296,761
On February 5, 2007, the Group revalued its land with cost amounting to P=39,866,864 at appraised
value of P=44,481,000, as determined by a professionally qualified independent appraiser. The appraisal increase of P=3,229,895, net of P=1,384,241 deferred income tax liability, resulting from the revaluation was credited to “Revaluation increment on land” account under equity section of the consolidated balance sheets. The appraised value was determined using the market data approach, wherein the value of the land is based on sales and listings of comparable properties registered within the vicinity. On September 26, 2009, nine of the Group’s stores were devastated by the typhoon “Ondoy”. The Group recognized loss from the said typhoon amounting to P=3,285,171, which represents the net book value of the property and equipment destroyed by the typhoon as of that said date.
The carrying value of the Group’s capitalized interest amounted to P=13,130 and P=1,677,864 as of December 31, 2011 and 2010.
The cost of fully depreciated property and equipment that are still being used in operations amounted to P=45,007,187 and P=585,711,873 as of December 31, 2011 and 2010, respectively. No property and equipment are pledged nor treated as security to the outstanding liablities, as of December 31, 2011 and 2010.
9. Deposits
2011 2010 Rent P=155,379,984 P=142,148,088 Utilities 29,267,868 23,969,222 Refundable 26,789,004 11,805,629 Others 4,527,970 3,273,451 P=215,964,826 P=181,196,390
Refundable
Refundable deposits on rent are computed at amortized cost as follows:
2011 2010 Face value of security deposits P=27,391,286 P=26,918,039 Additions 25,186,036 1,073,247 Refunded (3,974,386) (600,000) Unamortized discount (21,813,932) (15,585,657) P=26,789,004 P=11,805,629

36 | Notes to Consolidated Financial Statements
Movements in unamortized discount are as follows:
2011 2010 Beginning balance P=15,585,657 P=16,591,060 Additions 8,616,062 257,859 Amortization (Note 22) (2,387,787) (1,035,216) Refunded – (228,046) Ending balance P=21,813,932 P=15,585,657
10. Goodwill and Other Noncurrent Assets
2011 2010 Deferred input VAT - net of current portion P=103,958,618 P=93,062,349 Goodwill 65,567,524 65,567,524 Deferred lease - net of current portion (Note 26) 15,266,788 10,492,697 Garnished accounts (Note 34) 6,241,465 9,676,376 Lease receivable - net of current portion (Note 26) 3,448,336 4,748,411 Software and program cost 2,484,126 5,082,867 Prepaid rent - net of current portion 6,134,227 – Others 3,360,261 5,981,595 P=206,461,345 P=194,611,819
Goodwill On March 22, 2004, the Group purchased the leasehold rights and store assets of Jollimart
Philippines Corporation (Jollimart) for a total consideration of P=130,000,000. The excess of the acquisition cost over the fair value of the assets acquired was recorded as goodwill amounting to P=70,178,892.
The recoverable amount of the goodwill was estimated based on the value-in-use calculation using
cash flow projections from financial budgets approved by senior management covering a five year period. The pre-tax discount rate applied to cash flow projections is 10.22% in 2011 and 10.65% in 2010. The cash flows beyond the five-year period are extrapolated using a 3% growth rate in 2011 and 2010 that is the same as the long-term average growth rate for the retail industry.
No store acquired from Jollimart was closed in 2011 and 2010. In 2009, the Group has closed one
store out of the 25 remaining stores it purchased from Jollimart. No impairment loss was recognized in 2011, 2010 and 2009.
Goodwill is allocated to the group of cash generating unit (CGU) which comprises the working
capital and property and equipment of all the purchased stores’ assets. Key assumptions used in value-in-use calculations in 2011 and 2010 follow: Sales and Cost Ratio Sales and cost ratio are based on average values achieved in the three years preceding the start of
the budget period. These are increased over the budget period for anticipated efficiency improvements. Sales are projected to increase by two to three percent per annum while the cost ratio is set at 68.00% - 70.00% of sales per annum.
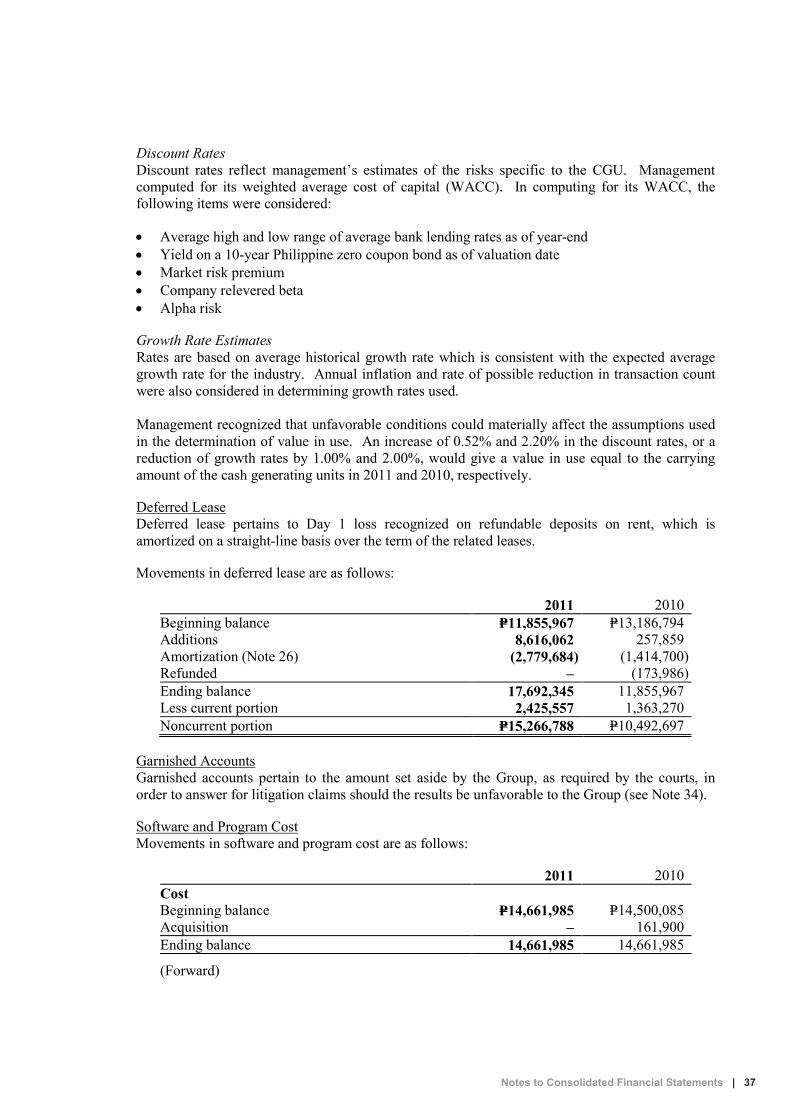
Notes to Consolidated Financial Statements | 37
Discount Rates
Discount rates reflect management’s estimates of the risks specific to the CGU. Management computed for its weighted average cost of capital (WACC). In computing for its WACC, the following items were considered:
Average high and low range of average bank lending rates as of year-end Yield on a 10-year Philippine zero coupon bond as of valuation date Market risk premium Company relevered beta Alpha risk
Growth Rate Estimates Rates are based on average historical growth rate which is consistent with the expected average growth rate for the industry. Annual inflation and rate of possible reduction in transaction count were also considered in determining growth rates used. Management recognized that unfavorable conditions could materially affect the assumptions used in the determination of value in use. An increase of 0.52% and 2.20% in the discount rates, or a reduction of growth rates by 1.00% and 2.00%, would give a value in use equal to the carrying amount of the cash generating units in 2011 and 2010, respectively.
Deferred Lease
Deferred lease pertains to Day 1 loss recognized on refundable deposits on rent, which is amortized on a straight-line basis over the term of the related leases. Movements in deferred lease are as follows:
2011 2010 Beginning balance P=11,855,967 P=13,186,794 Additions 8,616,062 257,859 Amortization (Note 26) (2,779,684) (1,414,700) Refunded – (173,986) Ending balance 17,692,345 11,855,967 Less current portion 2,425,557 1,363,270 Noncurrent portion P=15,266,788 P=10,492,697
Garnished Accounts Garnished accounts pertain to the amount set aside by the Group, as required by the courts, in
order to answer for litigation claims should the results be unfavorable to the Group (see Note 34).
Software and Program Cost Movements in software and program cost are as follows:
2011 2010 Cost Beginning balance P=14,661,985 P=14,500,085 Acquisition – 161,900 Ending balance 14,661,985 14,661,985
(Forward)
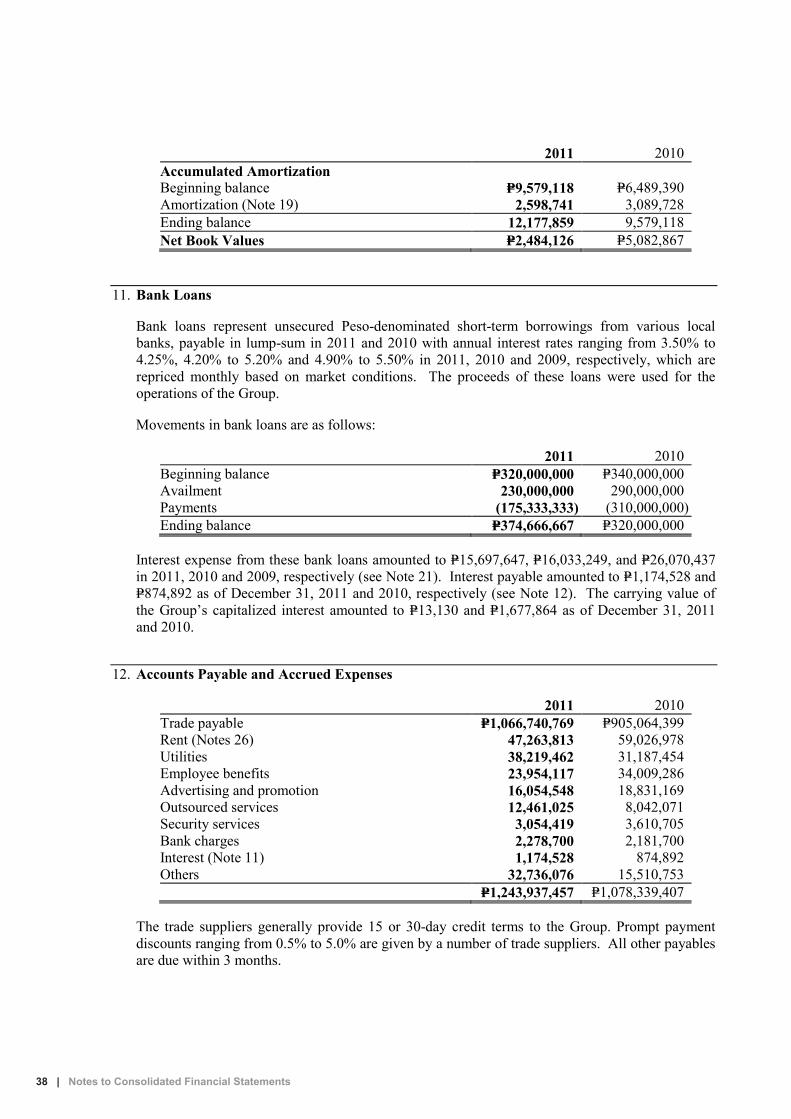
38 | Notes to Consolidated Financial Statements
2011 2010 Accumulated Amortization Beginning balance P=9,579,118 P=6,489,390 Amortization (Note 19) 2,598,741 3,089,728 Ending balance 12,177,859 9,579,118 Net Book Values P=2,484,126 P=5,082,867
11. Bank Loans Bank loans represent unsecured Peso-denominated short-term borrowings from various local
banks, payable in lump-sum in 2011 and 2010 with annual interest rates ranging from 3.50% to 4.25%, 4.20% to 5.20% and 4.90% to 5.50% in 2011, 2010 and 2009, respectively, which are repriced monthly based on market conditions. The proceeds of these loans were used for the operations of the Group.
Movements in bank loans are as follows:
2011 2010 Beginning balance P=320,000,000 P=340,000,000 Availment 230,000,000 290,000,000 Payments (175,333,333) (310,000,000) Ending balance P=374,666,667 P=320,000,000
Interest expense from these bank loans amounted to P=15,697,647, P=16,033,249, and P=26,070,437 in 2011, 2010 and 2009, respectively (see Note 21). Interest payable amounted to P=1,174,528 and P=874,892 as of December 31, 2011 and 2010, respectively (see Note 12). The carrying value of the Group’s capitalized interest amounted to P=13,130 and P=1,677,864 as of December 31, 2011 and 2010.
12. Accounts Payable and Accrued Expenses
2011 2010 Trade payable P=1,066,740,769 P=905,064,399 Rent (Notes 26) 47,263,813 59,026,978 Utilities 38,219,462 31,187,454 Employee benefits 23,954,117 34,009,286 Advertising and promotion 16,054,548 18,831,169 Outsourced services 12,461,025 8,042,071 Security services 3,054,419 3,610,705 Bank charges 2,278,700 2,181,700 Interest (Note 11) 1,174,528 874,892 Others 32,736,076 15,510,753 P=1,243,937,457 P=1,078,339,407
The trade suppliers generally provide 15 or 30-day credit terms to the Group. Prompt payment discounts ranging from 0.5% to 5.0% are given by a number of trade suppliers. All other payables are due within 3 months.

Notes to Consolidated Financial Statements | 39
13. Other Current Liabilities
2011 2010 Non-trade accounts payable P=188,758,358 P=164,122,488 Withholding taxes 22,974,557 18,896,178 Service fees payable 19,370,472 15,694,145 Output VAT 19,205,290 25,721,487 Retention payable 18,688,531 18,459,378 Royalty (Note 25) 10,353,333 8,465,255 Employee related liabilities 3,860,665 3,655,040 Current portion of deferred revenue on: Exclusivity contract (Notes 16 and 32) 1,934,524 1,934,524 Finance lease (Notes 16 and 26) 589,567 589,567 Others 12,700,219 8,261,236 P=298,435,516 P=265,799,298
Non-trade accounts payable pertains to payable to suppliers of goods or services that are not directly related to the Company’s ordinary course of business. 14. Deposits Payable
2011 2010 Franchisees (Note 32) P=88,795,094 P=75,679,031 Service agreements (Note 32) 69,260,533 55,282,328 Rent 13,402,206 11,900,778 P=171,457,833 P=142,862,137
15. Cumulative Redeemable Preferred Shares Cumulative redeemable preferred shares, which are redeemable at the option of the holder,
represent the share of PSC-ERP through its trustee, BPI-AMTG, in SSHI’s net assets pertaining to preferred shares. PSC-ERP is entitled to an annual “Guaranteed Preferred Dividend” in the earnings of SSHI starting April 5, 2002, the date when the 25% of the subscription on preferred shares have been paid, in accordance with the Corporation Code.
The guaranteed annual dividends shall be calculated and paid in accordance with the Shareholder’s Agreement dated November 16, 2000 which provides that the dividend shall be determined by the BOD of SSHI using the prevailing market conditions and other relevant factors. Further, the preferred shareholder shall not participate in the earnings of SSHI except to the extent of guaranteed dividends and whatever is left of the retained earnings be declared as dividends in favor of common shareholders. Guaranteed preferred dividends included under “Interest expense” in the consolidated statements of comprehensive income amounted to P=327,000, P=364,920 and P=412,380 in 2011, 2010 and 2009, respectively (see Note 21). Interest payable included under “Accounts payable and accrued expenses” in the consolidated balance sheets amounted to P=327,000 and P=364,920 as of December 31, 2011 and 2010, respectively.
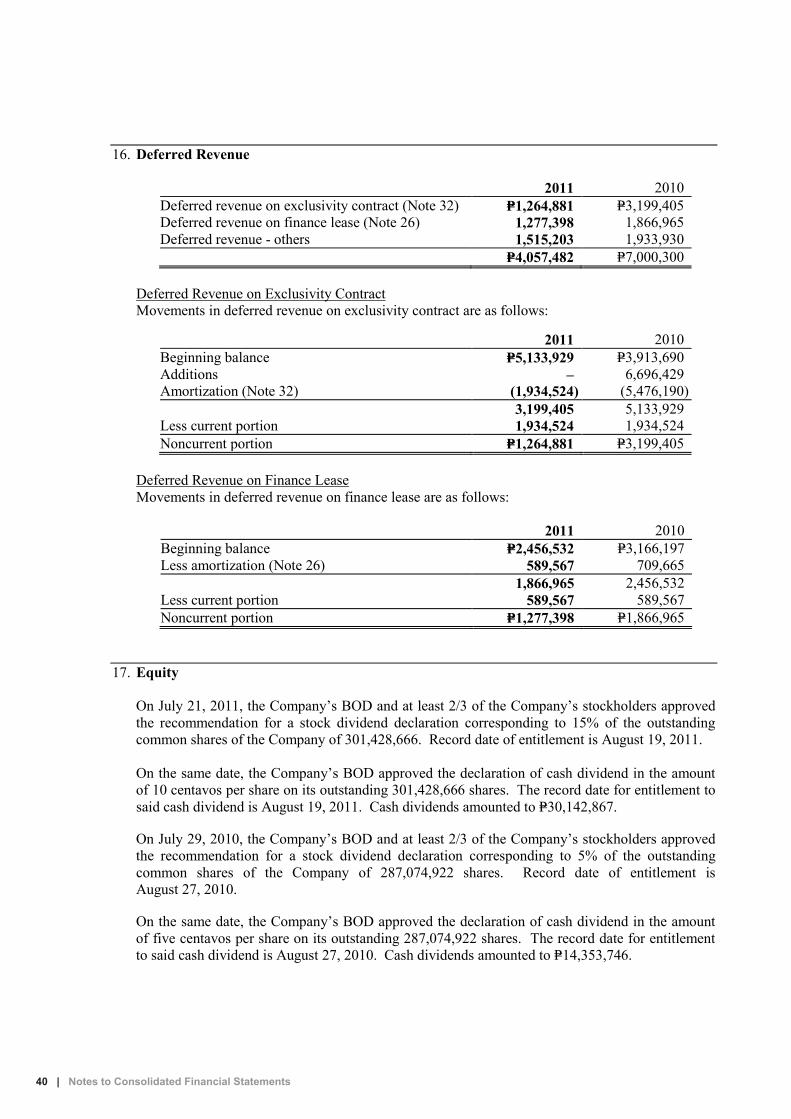
40 | Notes to Consolidated Financial Statements
16. Deferred Revenue
2011 2010 Deferred revenue on exclusivity contract (Note 32) P=1,264,881 P=3,199,405 Deferred revenue on finance lease (Note 26) 1,277,398 1,866,965 Deferred revenue - others 1,515,203 1,933,930 P=4,057,482 P=7,000,300
Deferred Revenue on Exclusivity Contract Movements in deferred revenue on exclusivity contract are as follows:
2011 2010 Beginning balance P=5,133,929 P=3,913,690 Additions – 6,696,429 Amortization (Note 32) (1,934,524) (5,476,190) 3,199,405 5,133,929 Less current portion 1,934,524 1,934,524 Noncurrent portion P=1,264,881 P=3,199,405
Deferred Revenue on Finance Lease Movements in deferred revenue on finance lease are as follows:
2011 2010 Beginning balance P=2,456,532 P=3,166,197 Less amortization (Note 26) 589,567 709,665 1,866,965 2,456,532 Less current portion 589,567 589,567 Noncurrent portion P=1,277,398 P=1,866,965
17. Equity
On July 21, 2011, the Company’s BOD and at least 2/3 of the Company’s stockholders approved the recommendation for a stock dividend declaration corresponding to 15% of the outstanding common shares of the Company of 301,428,666. Record date of entitlement is August 19, 2011.
On the same date, the Company’s BOD approved the declaration of cash dividend in the amount of 10 centavos per share on its outstanding 301,428,666 shares. The record date for entitlement to said cash dividend is August 19, 2011. Cash dividends amounted to P=30,142,867. On July 29, 2010, the Company’s BOD and at least 2/3 of the Company’s stockholders approved the recommendation for a stock dividend declaration corresponding to 5% of the outstanding common shares of the Company of 287,074,922 shares. Record date of entitlement is August 27, 2010. On the same date, the Company’s BOD approved the declaration of cash dividend in the amount of five centavos per share on its outstanding 287,074,922 shares. The record date for entitlement to said cash dividend is August 27, 2010. Cash dividends amounted to P=14,353,746.

Notes to Consolidated Financial Statements | 41
On June 25, 2009, the Company’s BOD approved the recommendation for a stock dividend declaration corresponding to 10% of the outstanding common shares of the Company of 260,977,200. The stock dividends approved by the Company’s BOD were approved by at least 2/3 of the Company’s stockholders on July 16, 2009. Record date of entitlement is August 14, 2009.
There are 686,250 shares that are in the treasury amounting to P=2,923,246 as of December 31, 2011 and 2010. There are no movement in the Group’s treasury shares in 2011 and 2010. The Company’s retained earnings is restricted to the extent of P=56,484,212 and P=36,014,643 as of December 31, 2011 and 2010, respectively for the undistributed earnings of subsidiaries and P=2,923,246 as of December 31, 2011 and 2010 for the cost of treasury shares.
The Group was listed with the Philippine Stock Exchange on February 4, 1998 with total listed shares of 71,382,000 common shares consisting of 47,000,000 shares for public offering and 24,382,000 shares for private placement. The Parent Company offered the share at a price of P=4.40. As of December 31, 2011, the Parent Company has a total of 666 shareholders on record. Movements in the number of shares are as follows:
2011 2010 2009 Beginning balance 302,114,918 287,761,172 261,663,450 Issuance of stock dividends 45,214,298 14,353,746 26,097,722 Ending balance 347,329,216 302,114,918 287,761,172
18. Cost of Merchandise Sales
2011 2010 2009 Merchandise inventory, beginning P=402,419,577 P=415,652,671 P=339,556,385 Net purchases 7,208,336,058 5,572,037,384 4,447,812,276 7,610,755,635 5,987,690,055 4,787,368,661 Less merchandise inventory,
ending 519,258,936 402,419,577 415,652,671 P=7,091,496,699 P=5,585,270,478 P=4,371,715,990
19. General and Administrative Expenses
2011 2010 2009 Communication, light and water P=610,997,841 P=528,123,729 P=371,580,742 Outside services (Note 32) 527,283,460 389,212,920 299,568,215 Rent (Note 26) 401,628,602 341,397,389 325,249,255 Depreciation and amortization
(Note 8) 378,355,521 291,803,754 203,905,718 Personnel costs (Note 23) 271,925,395 287,246,482 285,712,784 Trucking services 128,105,699 89,415,946 68,511,742 Advertising and promotion 119,151,632 101,175,106 73,763,919 Royalties (Note 25) 106,490,524 90,693,176 70,386,281
(Forward)

42 | Notes to Consolidated Financial Statements
2011 2010 2009 Repairs and maintenance P=101,447,166 P=86,964,361 P=60,593,879 Supplies 98,718,890 81,307,138 56,019,871 Taxes and licenses 76,189,697 68,340,335 64,648,509 Warehousing services 69,397,133 58,179,955 48,668,549 Entertainment, amusement and
recreation 28,169,708 36,145,205 25,874,891 Transportation and travel 26,472,937 23,642,048 26,539,417 Inventory losses 19,906,752 14,659,113 10,639,655 Insurance 6,032,839 4,216,516 4,634,768 Dues and subscription 5,898,075 5,143,890 5,123,248 Provision for impairment
of receivables (Note 5) 3,810,991 1,622,883 9,798,327 Amortization of software and
program costs (Note 10) 2,598,741 3,089,728 3,053,728 Others 29,596,375 29,010,430 36,685,831 P=3,012,177,978 P=2,531,390,104 P=2,050,959,329
20. Marketing Income
2011 2010 2009 Display charges P=195,671,478 P=161,168,392 P=119,307,326 Promotions 171,330,886 112,766,444 84,413,455 Marketing support funds
(Note 32) 119,820,976 70,306,815 33,898,150 P=486,823,340 P=344,241,651 P=237,618,931
21. Interest Expense
2011 2010 2009 Interest on bank loans P=15,697,647 P=16,033,249 P=26,070,437 Guaranteed preferred dividends 327,000 364,920 412,380 P=16,024,647 P=16,398,169 P=26,482,817
22. Interest Income
2011 2010 2009 Bank deposits P=2,911,480 P=3,675,553 P=3,387,088 Accretion of refundable deposits
(Note 9) 2,387,787 1,035,216 987,606 Finance lease (Note 26) 378,850 403,887 465,251 Accretion of notes receivable 186,596 241,113 – P=5,864,713 P=5,355,769 P=4,839,945
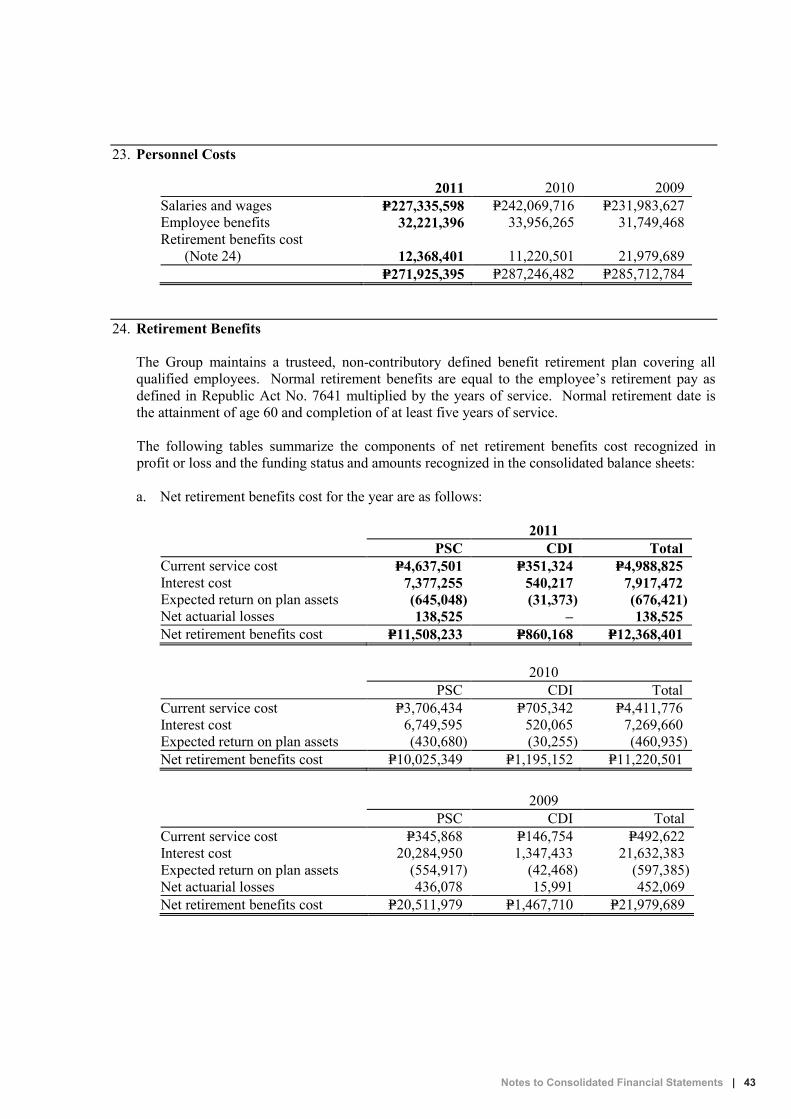
Notes to Consolidated Financial Statements | 43
23. Personnel Costs
2011 2010 2009 Salaries and wages P=227,335,598 P=242,069,716 P=231,983,627 Employee benefits 32,221,396 33,956,265 31,749,468 Retirement benefits cost
(Note 24) 12,368,401 11,220,501 21,979,689 P=271,925,395 P=287,246,482 P=285,712,784
24. Retirement Benefits The Group maintains a trusteed, non-contributory defined benefit retirement plan covering all
qualified employees. Normal retirement benefits are equal to the employee’s retirement pay as defined in Republic Act No. 7641 multiplied by the years of service. Normal retirement date is the attainment of age 60 and completion of at least five years of service.
The following tables summarize the components of net retirement benefits cost recognized in
profit or loss and the funding status and amounts recognized in the consolidated balance sheets: a. Net retirement benefits cost for the year are as follows:
2011 PSC CDI Total Current service cost P=4,637,501 P=351,324 P=4,988,825 Interest cost 7,377,255 540,217 7,917,472 Expected return on plan assets (645,048) (31,373) (676,421) Net actuarial losses 138,525 – 138,525 Net retirement benefits cost P=11,508,233 P=860,168 P=12,368,401
2010 PSC CDI Total Current service cost P=3,706,434 P=705,342 P=4,411,776 Interest cost 6,749,595 520,065 7,269,660 Expected return on plan assets (430,680) (30,255) (460,935) Net retirement benefits cost P=10,025,349 P=1,195,152 P=11,220,501
2009 PSC CDI Total Current service cost P=345,868 P=146,754 P=492,622 Interest cost 20,284,950 1,347,433 21,632,383 Expected return on plan assets (554,917) (42,468) (597,385) Net actuarial losses 436,078 15,991 452,069 Net retirement benefits cost P=20,511,979 P=1,467,710 P=21,979,689

44 | Notes to Consolidated Financial Statements
b. Net retirement obligations recognized by the Group are as follows:
2011 PSC CDI Total Present value of retirement obligations P=96,296,328 P=6,764,360 P=103,060,688 Less fair value of net plan assets 12,239,143 565,547 12,804,690 Unfunded retirement obligation 84,057,185 6,198,813 90,255,998 Unrecognized net actuarial gain (losses) (25,368,578) 305,300 (25,063,278) Net retirement obligations P=58,688,607 P=6,504,113 P=65,192,720
2010 PSC CDI Total Present value of retirement obligations P=72,897,778 P=5,615,558 P=78,513,336 Less fair value of net plan assets 10,750,804 522,878 11,273,682 Unfunded retirement obligation 62,146,974 5,092,680 67,239,654 Unrecognized net actuarial gain (losses) (10,337,337) 551,265 (9,786,072) Net retirement obligations P=51,809,637 P=5,643,945 P=57,453,582
c. Changes in the present value of the retirement obligations are as follows:
2011 PSC CDI Total Beginning balances P=72,897,778 P=5,615,558 P=78,513,336 Current service cost 4,637,501 351,324 4,988,825 Interest cost 7,377,255 540,217 7,917,472 Benefits paid (4,018,237) – (4,018,237) Actuarial losses 15,402,031 257,261 15,659,292 Ending balances P=96,296,328 P= 6,764,360 P=103,060,688
2010 PSC CDI Total Beginning balances P=62,438,440 P=4,864,964 P=67,303,404 Current service cost 3,706,434 705,342 4,411,776 Interest cost 6,749,595 520,065 7,269,660 Benefits paid (6,248,673) – (6,248,673) Actuarial losses (gains) 6,251,982 (474,813) 5,777,169 Ending balances P=72,897,778 P=5,615,558 P=78,513,336
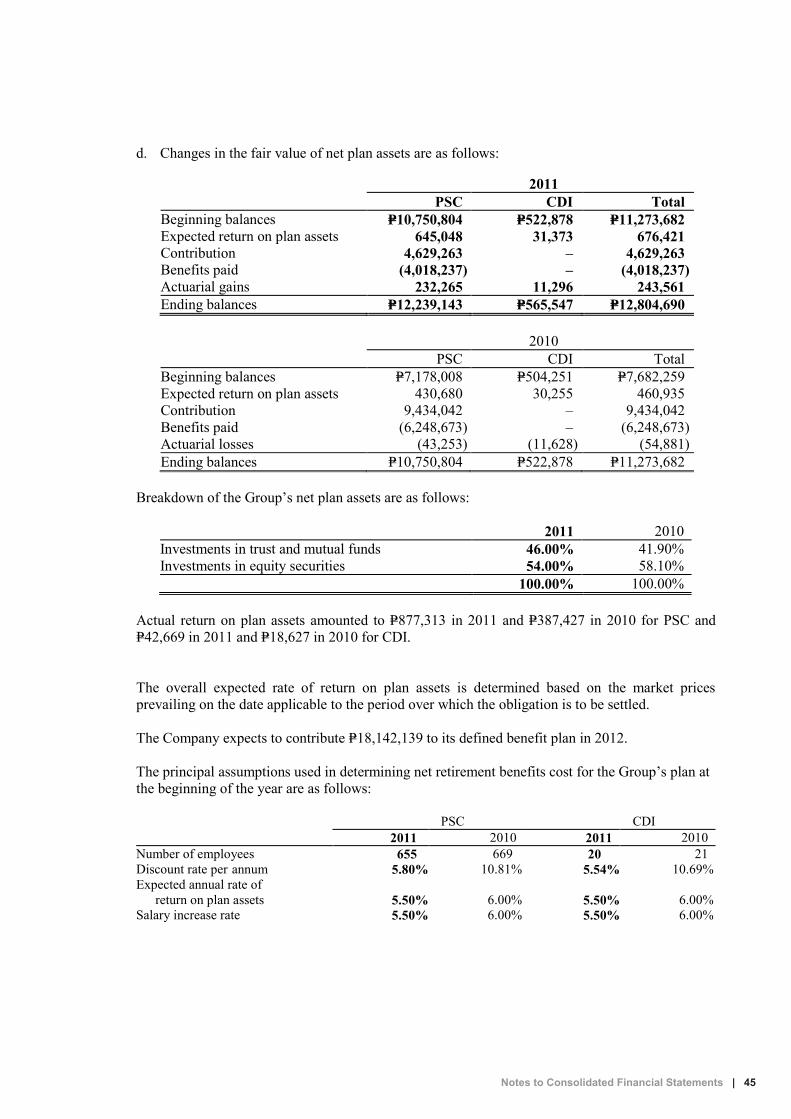
Notes to Consolidated Financial Statements | 45
d. Changes in the fair value of net plan assets are as follows:
2011 PSC CDI Total Beginning balances P=10,750,804 P=522,878 P=11,273,682 Expected return on plan assets 645,048 31,373 676,421 Contribution 4,629,263 – 4,629,263 Benefits paid (4,018,237) – (4,018,237) Actuarial gains 232,265 11,296 243,561 Ending balances P=12,239,143 P=565,547 P=12,804,690
2010 PSC CDI Total Beginning balances P=7,178,008 P=504,251 P=7,682,259 Expected return on plan assets 430,680 30,255 460,935 Contribution 9,434,042 – 9,434,042 Benefits paid (6,248,673) – (6,248,673) Actuarial losses (43,253) (11,628) (54,881) Ending balances P=10,750,804 P=522,878 P=11,273,682
Breakdown of the Group’s net plan assets are as follows:
2011 2010 Investments in trust and mutual funds 46.00% 41.90% Investments in equity securities 54.00% 58.10% 100.00% 100.00%
Actual return on plan assets amounted to P=877,313 in 2011 and P=387,427 in 2010 for PSC and
P=42,669 in 2011 and P=18,627 in 2010 for CDI.
The overall expected rate of return on plan assets is determined based on the market prices prevailing on the date applicable to the period over which the obligation is to be settled.
The Company expects to contribute P=18,142,139 to its defined benefit plan in 2012.
The principal assumptions used in determining net retirement benefits cost for the Group’s plan at the beginning of the year are as follows:
PSC CDI 2011 2010 2011 2010 Number of employees 655 669 20 21 Discount rate per annum 5.80% 10.81% 5.54% 10.69% Expected annual rate of return on plan assets 5.50% 6.00% 5.50% 6.00% Salary increase rate 5.50% 6.00% 5.50% 6.00%

46 | Notes to Consolidated Financial Statements
Amounts for the current and prior four periods are as follows:
2011 PSC CDI Total Present value of retirement obligations P=96,296,328 P=6,764,360 P=103,060,688 Fair value of net plan assets 12,239,143 565,547 12,804,690 Unfunded retirement obligation 84,057,185 6,198,813 90,255,998 Experience loss (gain) adjustments on retirement obligations 324,950 (267,061) 57,889 Experience gain adjustments on plan assets 232,265 11,296 243,561
2010 PSC CDI Total Present value of retirement obligations
P=72,897,778
P=5,615,558
P=77,762,742
Fair value of net plan assets 10,750,804 522,878 11,273,682 Unfunded retirement obligation 62,146,974 5,092,680 67,239,654 Experience gain adjustments on retirement obligations
(6,251,982)
(857,124)
(7,109,106)
Experience loss adjustments on plan assets
(43,253)
(11,628)
(54,881)
2009 PSC CDI Total Present value of retirement obligations
P=62,438,440
P=4,864,964
P=67,303,404
Fair value of net plan assets 7,178,008 504,251 7,682,259 Unfunded retirement obligation 55,260,432 4,360,713 59,621,145 Experience gain adjustments on retirement obligations
(12,458,512)
(857,124)
(13,315,636)
Experience loss adjustments on plan assets
(69,753)
(10,086)
(79,839)
2008 PSC CDI Total Present value of retirement obligations
P=54,006,788
P=4,174,204
P=58,180,992
Fair value of net plan assets 6,165,743 471,869 6,637,612 Unfunded retirement obligation 47,841,045 3,702,335 51,543,380 Experience loss adjustments on retirement obligations
46,616
2,532,432
2,579,048
Experience loss adjustments on plan assets
(283,759)
(21,716)
(305,475)
2007 PSC CDI Total Present value of retirement obligations P=50,892,911 P=1,674,978 P=52,567,889 Fair value of net plan assets 6,039,312 462,193 6,501,505
(Forward)

Notes to Consolidated Financial Statements | 47
2007 PSC CDI Total Unfunded retirement obligation P=44,853,599 P=1,212,785 P=46,066,384 Experience loss (gain) adjustment on retirement obligations 2,872,179 (94,636) 2,777,543 Experience loss adjustments on plan assets (477,943) (28,521) (506,464)
The discount rate of PSC and CDI as of December 31, 2011 are 5.80% and 5.54%, respectively, based on market rates consistent with the obligation of the defined benefit plan. Future annual increase in salary as of December 31, 2011 is 5.5%. Expected rate of return as of December 31, 2011 is 5.5%.
25. Related Party Transactions
Related party relationships exist when one party has the ability to control, directly or indirectly
through one or more intermediaries, the other party or exercise significant influence over the other party in making financial and operating decisions. Such relationships also exist between and/or among entities which are under common control with the reporting enterprise, or between and/or among the reporting enterprises and their key management personnel, directors or its stockholders.
Transactions with related parties consist of: a. The Group executed a licensing agreement with Seven Eleven, Inc. (SEI), a stockholder
organized in Texas, U.S.A. This grants the Group the exclusive right to use the 7-Eleven System in the Philippines. In accordance with the agreement, the Group pays, among others, royalty fee to SEI based on a certain percentage of monthly gross sales, net of gross receipts tax. Royalty fees recorded by the Group amounted to P=106,490,524, P=90,693,176, and P=70,386,281 in 2011, 2010 and 2009, respectively. Royalty fees are paid on a monthly basis.
Royalty payable included under “Other current liabilities” in the consolidated balance sheets amounted to P=10,353,333 and P=8,465,255 as of December 31, 2011 and 2010, respectively.
b. PSC has transactions with PFI, a foundation with common key management of the Group,
consisting of noninterest-bearing advances pertaining primarily to salaries, taxes and other operating expenses initially paid by PSC for PFI. Amounts due from PFI amounted to P=173,945 and P=888,425 as of December 31, 2011 and 2010, respectively. Amount due to PFI included under others in “Other current liabilities” in the consolidated balance sheets amounted to P=84,100 and P=12,099 as of December 31, 2011 and 2010, respectively.
c. Compensation of key management personnel are as follows:
2011 2010 2009 Short-term employee benefits P=31,624,639 P=33,663,181 P=32,583,183 Post-employment benefits 1,664,000 1,662,152 1,752,710 Other long-term benefits 376,073 376,073 376,073 P=33,664,712 P=35,701,406 P=34,711,966

48 | Notes to Consolidated Financial Statements
26. Leases
Finance Lease as Lessor In March 2007, PSC entered into a five-year sale and leaseback finance lease agreement with an
armored car service provider. The lease has no terms of renewal and no escalation clauses. Unguaranteed residual values accruing to the Company amounted to P=300,000.
In March 2010, the Company amended its agreement with the armored car service provider extending the lease term for another five years from March 1, 2010 to February 1, 2015, imposing 7% interest per annum on the restructured loan obligation and reducing its monthly rental payments. The unguaranteed residual values accruing to the Company was retained. The restructuring resulted in the recognition of a gain on accretion amounting to P=849,890 and is reported under “Other income” in the 2010 consolidated statement of comprehensive income.
Future minimum lease receivable under this lease as of December 31 are as follows:
2011 2010 Within one year P=1,591,280 P=1,591,280 After one year but not more than five years 3,747,773 5,339,053 Total minimum lease payments 5,339,053 6,930,333 Less unearned interest income 590,642 969,492 Present value of future minimum lease payments 4,748,411 5,960,841 Less current portion 1,300,075 1,212,430 Noncurrent portion P=3,448,336 P=4,748,411
Collection of lease receivable amounted to P=1,591,280 and P=1,775,466 in 2011 and 2010, respectively. Present value of lease receivable as of December 31 is as follows:
2011 2010 Within one year P=1,300,075 P=1,212,430 After one year but not more than five years 3,448,336 4,748,411 Total minimum lease payments 4,748,411 5,960,841 Less current portion 1,300,075 1,212,430 Present value of future minimum lease payments P=3,448,336 P=4,748,411
Unearned interest income as of December 31, 2011 and 2010 amounted to P=590,642 and
P=969,492, respectively. Related interest income amounted to P=378,850, P=403,887 and P=465,251 in 2011, 2010 and 2009, respectively.
Difference between the original lease agreement’s present value of minimum lease payments at the date of lease inception against the carrying value of the finance lease asset resulted in a deferred revenue on finance lease amounting to P=6,550,753, which is to be amortized on a straight-line basis over the lease term. The related deferred revenue amounted to P=1,277,398 and P=1,866,965 as of December 31, 2011 and 2010, with current portion amounting to P=589,567 in 2011 and 2010, and noncurrent portion amounting to P=1,277,398 and P=1,866,965 as of December 31, 2011 and 2010, respectively. Amortization of deferred revenue amounted to P=589,567, P=709,665 and P=1,310,151, in 2011, 2010 and 2009, respectively.

Notes to Consolidated Financial Statements | 49
Operating Lease as Lessee a. PSC has various lease agreements with third parties relating to its store operations. Certain
agreements provide for the payment of rentals based on various schemes such as an agreed percentage of net sales for the month and fixed monthly rate. Rental expense related to these lease agreements amounted to P=375,908,146, P=312,975,325 and P=295,747,766 in 2011, 2010 and 2009, respectively. Of the total rent expense, P=2,019,210 in 2011, P=1,902,221 in 2010 and P=663,802 in 2009 pertains to contingent rent of some stores based on percentage ranging from 1.5% to 3.0% of merchandise sales. Amortization of deferred lease amounted to P=1,689,184, P=324,200 and P=385,024 in 2011, 2010 and 2009, respectively.
The approximate annual minimum rental payments of PSC under its existing lease agreements as of December 31 are as follows:
2011 2010 Within one year P=52,930,899 P=48,966,221 After one year but not more than five years 114,077,970 93,993,928 More than five years – 3,131,450 P=167,008,869 P=146,091,599
b. CDI entered into a 15-year operating lease contract for the lease of its warehouse effective November 1, 2005. The lease is subject to an escalation rate of 7.0% after every two years starting on the third year of the lease.
Rent expense related to this lease agreement amounted to P=22,925,240 in 2011, 2010 and
2009. Amortization of deferred lease amounted to P=1,090,500 in 2011, 2010 and 2009. The approximate annual minimum rental payments of CDI under its existing lease contract as
of December 31 are as follows:
2011 2010 Within one year P=31,879,766 P=21,058,664 After one year but not more than five years 138,038,344 92,747,776 More than five years 152,413,780 130,516,307 P=322,331,890 P=244,322,747
The Company also has other various short-term operating leases pertaining to rental of
warehouse fixtures and equipments. Related rent expense amounted to P=994,083, P=2,448,678 and P=2,397,929 in 2011, 2010 and 2009, respectively.
Operating Lease as Lessor
The Group has various sublease agreements with third parties which provide for lease rentals based on an agreed fixed monthly rate or as agreed upon by the parties. Rental income related to these sublease agreements amounted to P=44,143,593, P=37,361,84 and P=52,265,323 in 2011, 2010 and 2009, respectively.
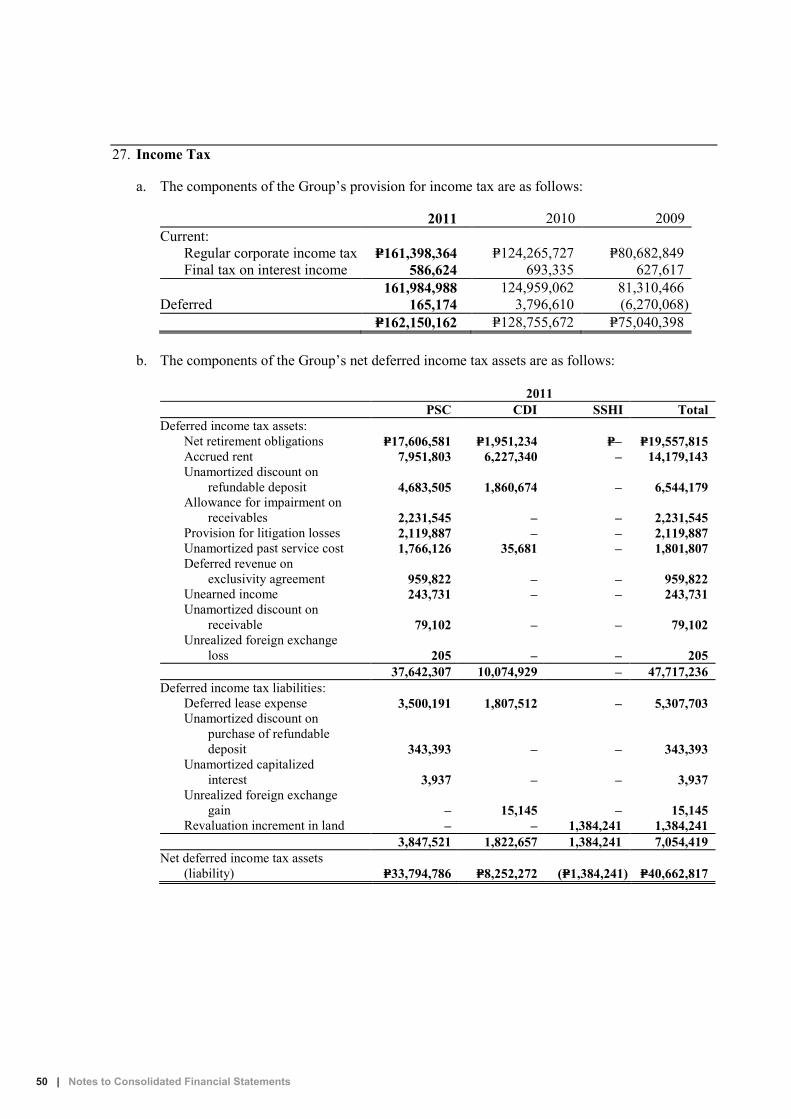
50 | Notes to Consolidated Financial Statements
27. Income Tax
a. The components of the Group’s provision for income tax are as follows:
2011 2010 2009 Current: Regular corporate income tax P=161,398,364 P=124,265,727 P=80,682,849 Final tax on interest income 586,624 693,335 627,617 161,984,988 124,959,062 81,310,466 Deferred 165,174 3,796,610 (6,270,068) P=162,150,162 P=128,755,672 P=75,040,398
b. The components of the Group’s net deferred income tax assets are as follows:
2011 PSC CDI SSHI Total Deferred income tax assets: Net retirement obligations P=17,606,581 P=1,951,234 P=– P=19,557,815 Accrued rent 7,951,803 6,227,340 – 14,179,143 Unamortized discount on refundable deposit 4,683,505 1,860,674 – 6,544,179 Allowance for impairment on receivables 2,231,545 – – 2,231,545 Provision for litigation losses 2,119,887 – – 2,119,887 Unamortized past service cost 1,766,126 35,681 – 1,801,807 Deferred revenue on exclusivity agreement 959,822 – – 959,822 Unearned income 243,731 – – 243,731 Unamortized discount on receivable 79,102 – – 79,102 Unrealized foreign exchange loss 205 – – 205 37,642,307 10,074,929 – 47,717,236 Deferred income tax liabilities: Deferred lease expense 3,500,191 1,807,512 – 5,307,703 Unamortized discount on purchase of refundable deposit 343,393 – – 343,393 Unamortized capitalized interest 3,937 – – 3,937 Unrealized foreign exchange gain – 15,145 – 15,145 Revaluation increment in land – – 1,384,241 1,384,241 3,847,521 1,822,657 1,384,241 7,054,419 Net deferred income tax assets (liability) P=33,794,786 P=8,252,272 (P=1,384,241) P=40,662,817

Notes to Consolidated Financial Statements | 51
2010 PSC CDI SSHI Total Deferred income tax assets: Accrued rent P=12,040,725 P=5,667,367 P=– P=17,708,092 Net retirement obligations 15,542,890 1,693,184 – 17,236,074 Unamortized discount on refundable deposit 4,675,697 – – 4,675,697 Provision for litigation losses 2,119,887 – – 2,119,887 Allowance for impairment on receivables 1,088,248 – – 1,088,248 Deferred revenue on exclusivity agreement
1,540,179
–
–
1,540,179
Unamortized past service cost 1,994,721 42,280 – 2,037,001 Unamortized discount on receivable 135,081 – – 135,081 Unrealized foreign exchange loss 113,670 – – 113,670 39,251,098 7,402,831 – 46,653,929 Deferred income tax liabilities: Deferred lease expense 3,556,790 – – 3,556,790 Unamortized capitalized interest 503,359 – – 503,359 Unamortized discount on purchase of refundable deposit
381,548
–
–
381,548 Revaluation increment in land – – 1,384,241 1,384,241 4,441,697 – 1,384,241 5,825,938 Net deferred income tax assets (liability)
P=34,809,401
P=7,402,831
(P=1,384,241)
P=40,827,991
c. The reconciliation of the provision for income tax computed at the statutory income tax rate to
provision for income tax shown in the consolidated statements of comprehensive income follow:
2011 2010 2009 Provision for income tax computed at statutory income tax rate P=155,509,791 P=121,690,776 P=69,249,315 Adjustments for: Nondeductible expenses: Inventory losses 5,972,026 4,397,733 3,353,737 Interest expense and others 955,165 3,114,649 1,662,459 Tax effect of rate difference between final tax and statutory tax rate on bank interest income (286,820) (386,196) (313,809) Nontaxable other income – (61,290) (112,855) Loss from typhoon – – 985,551 Donation expense – – 216,000 P=162,150,162 P=128,755,672 P=75,040,398
d. RA 9504, effective on July 7, 2008 allows availment of optional standard deductions (OSD). Corporations, except for nonresident foreign corporations, may now elect to claim standard deduction in an amount not exceeding 40% of their gross income. The Group did not avail of the OSD for the computation of its taxable income in 2011, 2010 and 2009.

52 | Notes to Consolidated Financial Statements
28. Basic/Diluted Earnings Per Share
2011 2010 2009 a. Net income P=356,342,989 P=276,880,248 P=155,790,651 b. Weighted average number
of shares issued 347,329,216 347,329,216 347,329,216 c. Less weighted average
number of shares held in treasury 686,250 686,250 686,250
d. Weighted average number of shares outstanding (b-c) 346,642,966 346,642,966 346,642,966
e. Basic/diluted earnings per share (a/d) P=1.03 P=0.80 P=0.45
The Group does not have potentially dilutive common shares as of December 31, 2011, 2010 and 2009. Thus, the basic earnings per share is equal to the diluted earnings per share as of those dates.
The Group’s outstanding common shares increased from 302,114,918 to 347,329,216 as a result of
stock dividend issuance equivalent to 15% of the outstanding common shares of the Company of 301,428,666 shares approved on July 21, 2011 (see Note 17). Therefore, the calculation of basic/diluted earnings per share for all periods presented has been adjusted retrospectively.
29. Financial Instruments The following tables summarize the carrying value and fair value of the Group’s financial assets
and financial liabilities per class as of December 31:
2011 2010 Carrying Value Fair Value Carrying Value Fair Value FINANCIAL ASSETS Loans and Receivables Cash and cash equivalents Cash on hand and in banks P=394,696,749 P= 394,696,749 P=322,975,839 P=322,975,839 Cash equivalents – – 35,753,695 35,753,695 394,696,749 394,696,749 358,729,534 358,729,534 Short-term investments 10,409,907 10,409,907 10,141,555 10,141,555 Receivables: Suppliers 97,257,076 97,257,076 58,434,686 58,434,686 Franchisee 89,638,852 89,638,852 40,871,647 40,871,647 Store operators 15,683,186 15,683,186 9,718,957 9,718,957 Employees 15,407,124 15,407,124 10,321,643 10,321,643 Rent* 7,068,009 7,068,009 5,925,582 5,925,582 Notes 1,328,983 1,328,983 728,097 728,097 Current portion of lease receivable 1,300,075 1,563,950 1,212,430 1,363,599 Insurance claims 319,208 319,208 10,986,094 10,986,094 Due from PFI 173,945 173,945 888,425 888,425 Deposits – – 1,009,864 1,009,864 Others 11,112,829 11,112,829 18,461,210 18,461,210 239,289,287 239,553,162 158,558,635 158,709,804 Deposits: Utilities 29,267,868 29,267,868 23,969,222 23,969,222 Refundable 26,864,928 27,301,992 11,805,629 15,894,383 Others 4,527,970 4,527,970 3,273,451 3,273,451 60,660,766 61,097,830 39,048,302 43,137,056
(Forward)

Notes to Consolidated Financial Statements | 53
2011 2010 Carrying Value Fair Value Carrying Value Fair Value Other noncurrent assets - lease receivable (net
of current portion) P=3,448,336 P=3,439,941 P=4,748,411 P=4,915,991 Total Loans and Receivables 708,505,045 709,197,589 571,226,437 575,633,940 AFS Financial Assets – – 1,320,575 1,320,575 TOTAL FINANCIAL ASSETS P=708,505,045 P=709,197,589 P=572,547,012 P=576,954,515 FINANCIAL LIABILITIES Other Financial Liabilities Bank loans P=374,666,667 P=374,666,667 P=320,000,000 P=320,000,000 Accounts payable and accrued expenses: Trade payable 1,066,740,769 1,066,740,769 905,064,399 905,064,399 Utilities 38,219,462 38,219,462 31,187,454 31,187,454 Employee benefits 23,954,117 23,954,117 34,009,286 34,009,286 Advertising and promotion 16,054,548 16,054,548 18,831,169 18,831,169 Outsourced services 12,461,025 12,461,025 8,042,071 8,042,071 Security services 3,054,419 3,054,419 3,610,705 3,610,705 Bank charges 2,278,700 2,278,700 2,181,700 2,181,700 Interest 1,174,528 1,174,528 874,892 874,892 Others** 32,734,076 32,734,076 15,508,753 15,508,753 1,196,671,644 1,196,671,644 1,019,310,429 1,019,310,429 Other current liabilities: Non-trade accounts payable 188,758,358 188,758,358 164,122,488 164,122,488 Service fees payable 19,370,472 19,370,472 15,694,145 15,694,145 Retention payable 18,688,531 18,688,531 18,459,378 18,459,378 Royalty 10,353,333 10,353,333 8,465,255 8,465,255 Others 12,700,219 12,700,219 11,916,276 11,916,276 249,870,913 249,870,913 218,657,542 218,657,542 Deposit payable 171,457,833 171,457,833 142,862,137 142,862,137 Cumulative redeemable preferred shares 6,000,000 6,000,000 6,000,000 6,000,000 177,457,833 177,457,833 148,862,137 148,862,137 TOTAL FINANCIAL LIABILITIES P=1,998,667,057 P=1,998,667,057 P=1,706,830,108 P=1,706,830,108 **Includes short-term refundable deposits amounting to P=216,000 as of December 31, 2011 and 2010, respectively, reported under
“Prepayments and other current assets” in the consolidated balance sheet. **Excludes withholding taxes payable amounting to P=2,000 as of December 31, 2011 and 2010.
Fair Value Information Current Financial Assets and Financial Liabilities Due to the short-term nature of the related transactions, the fair value of cash and cash equivalents,
receivables (except for lease receivables), accounts payable and accrued expenses and other current liabilities approximates their carrying amount as of balance sheet date.
Lease Receivables
The fair value of lease receivable is determined by discounting the sum of future cash flows using the prevailing market rates for instruments with similar maturities as of December 31, 2011 and 2010, which is 3.80% and 4.64%, respectively.
Utility and Other Deposits
The fair value of utility and other deposits approximates its carrying value as it earns interest based on repriced market conditions.
Refundable Deposits The fair value of deposits is determined by discounting the sum of future cash flows using the
prevailing market rates for instruments with similar maturities as of December 31, 2011 and 2010 ranging from 1.66% to 5.30% and 2.74% to 6.09%, respectively.
AFS Financial Assets The fair value of unquoted AFS financial assets is not reasonably determinable, thus, balances are
presented at cost.

54 | Notes to Consolidated Financial Statements
Bank Loans and Deposit Payables The carrying value approximates fair value because of recent and monthly repricing of related
interest based on market conditions. Cumulative Redeemable Preferred Shares The carrying value approximates fair value because corresponding dividends on these shares that
are charged as interest expense in profit or loss are based on recent treasury bill rates repriced annually at year end. Fair Value Hierarchy As of December 31, 2011 and 2010, the Group has no financial instruments measured at fair value.
30. Financial Risk Management Objectives and Policies The main risks arising from the Group’s financial instruments are credit risk, liquidity risk,
interest rate risk and foreign exchange risk. The BOD reviews and approves policies for managing each of these risks. The BOD also created separate board-level entity, which is the Audit Committee, with explicit authority and responsibility in managing and monitoring risks. The Audit Committee, which ensures the integrity of internal control activities throughout the Group, develops, oversees, checks and pre-approves financial management functions and systems in the areas of credit, market, liquidity, operational, legal and other risks of the Group, and crisis management. The Internal Audit Department and the External Auditor directly report to the Audit Committee regarding the direction, scope and coordination of audit and any related activities.
Listed below are the summarized risk identified by the BOD.
Credit Risk Credit risk is the risk that one party to a financial instrument will cause a financial loss to the other party by failing to discharge an obligation. The receivable balances are monitored on an ongoing basis with the result that the Group’s exposure to impairment is managed to a not significant level. The Group deals only with counterparty duly approved by the BOD.
The following tables provide information regarding the maximum credit risk exposure of the Group as of December 31:
2011 2010 Cash and cash equivalents (excluding cash on hand): Cash in bank P=277,117,736 P=248,539,958 Cash equivalents – 35,753,695 277,117,736 284,293,653 Short-term investments 10,409,907 10,141,555 Receivables: Suppliers 99,035,030 58,816,472 Franchisee 89,638,852 40,871,647 Store operators 15,683,186 9,718,957 Employees 15,407,124 10,321,643 Rent* 7,068,009 5,925,582 Notes 1,328,983 728,097 Current portion of lease receivables 1,300,075 1,212,430 Insurance claims 319,208 10,986,094
(Forward)
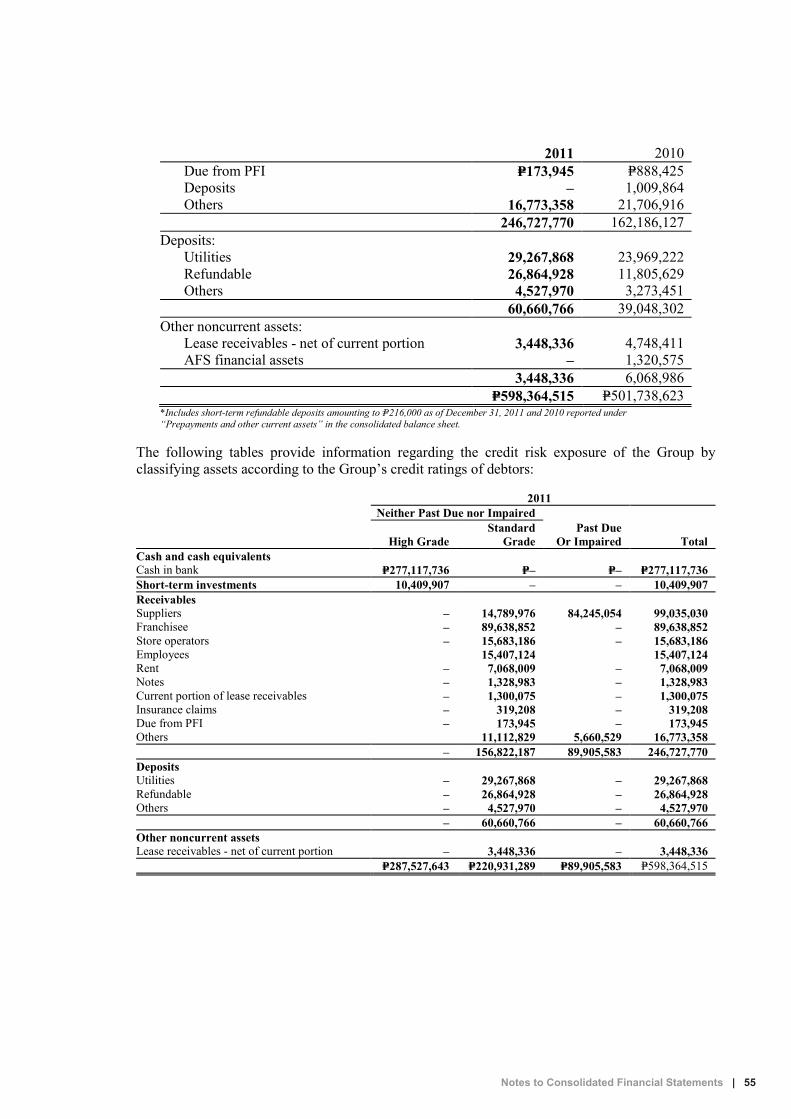
Notes to Consolidated Financial Statements | 55
2011 2010 Due from PFI P=173,945 P=888,425 Deposits – 1,009,864 Others 16,773,358 21,706,916 246,727,770 162,186,127 Deposits: Utilities 29,267,868 23,969,222 Refundable 26,864,928 11,805,629 Others 4,527,970 3,273,451 60,660,766 39,048,302 Other noncurrent assets: Lease receivables - net of current portion 3,448,336 4,748,411 AFS financial assets – 1,320,575 3,448,336 6,068,986 P=598,364,515 P=501,738,623
*Includes short-term refundable deposits amounting to P=216,000 as of December 31, 2011 and 2010 reported under “Prepayments and other current assets” in the consolidated balance sheet.
The following tables provide information regarding the credit risk exposure of the Group by classifying assets according to the Group’s credit ratings of debtors: 2011 Neither Past Due nor Impaired Standard Past Due High Grade Grade Or Impaired Total Cash and cash equivalents Cash in bank P=277,117,736 P=– P=– P=277,117,736 Short-term investments 10,409,907 – – 10,409,907 Receivables Suppliers – 14,789,976 84,245,054 99,035,030 Franchisee – 89,638,852 – 89,638,852 Store operators – 15,683,186 – 15,683,186 Employees 15,407,124 15,407,124 Rent – 7,068,009 – 7,068,009 Notes – 1,328,983 – 1,328,983 Current portion of lease receivables – 1,300,075 – 1,300,075 Insurance claims – 319,208 – 319,208 Due from PFI – 173,945 – 173,945 Others 11,112,829 5,660,529 16,773,358 – 156,822,187 89,905,583 246,727,770 Deposits Utilities – 29,267,868 – 29,267,868 Refundable – 26,864,928 – 26,864,928 Others – 4,527,970 – 4,527,970 – 60,660,766 – 60,660,766 Other noncurrent assets Lease receivables - net of current portion – 3,448,336 – 3,448,336 P=287,527,643 P=220,931,289 P=89,905,583 P=598,364,515

56 | Notes to Consolidated Financial Statements
2010 Neither Past Due nor Impaired Standard Past Due Or High Grade Grade Impaired Total Cash and cash equivalents Cash in bank P=248,539,958 P=– P=– P=248,539,958 Cash equivalents 35,753,695 – – 35,753,695
284,293,653 – – 284,293,653 Short-term investments 10,141,555 – – 10,141,555 Receivables Suppliers – 13,814,889 45,001,583 58,816,472 Franchisee – 40,871,647 – 40,871,647 Insurance claims – 10,986,094 – 10,986,094 Employees – 9,929,725 391,918 10,321,643 Store operators – 9,718,957 – 9,718,957 Rent – 5,925,582 – 5,925,582 Current portion of lease receivables – 1,212,430 – 1,212,430 Deposits – – 1,009,864 1,009,864 Due from PFI – 888,425 – 888,425 Notes – 728,097 – 728,097 Others – 19,862,992 1,843,924 21,706,916 – 113,938,838 48,247,289 162,186,127 Deposits Utilities – 23,969,222 – 23,969,222 Refundable – 11,805,629 – 11,805,629 Others – 3,273,451 – 3,273,451 – 39,048,302 – 39,048,302 Other noncurrent assets Lease receivables - net of current portion – 4,748,411 – 4,748,411 AFS financial assets – 1,320,575 – 1,320,575 – 6,068,986 – 6,068,986 P=294,435,208 P=159,056,126 P=48,247,289 P=501,738,623 The Group uses the following criteria to rate credit quality:
Class Description High Grade Financial assets that have a recognized foreign or local
third party rating or instruments which carry guaranty/collateral.
Standard Grade Financial assets of companies that have the apparent ability to satisfy its obligations in full.
The credit qualities of the financial assets were determined as follows: Cash and cash equivalents are classified as high grade since these are deposited or transacted with reputable banks which have low probability of insolvency. Receivables, deposits and other noncurrent assets are classified as standard grade since these pertain to receivables considered as unsecured from third parties with good paying habits.

Notes to Consolidated Financial Statements | 57
The following tables provide the analysis of financial assets that are past due but not impaired and past due and impaired:
2011 Aging analysis of financial assets past due but not impaired Past due and 31 to 60 days 61 to 90 days > 90 days Total impaired Total Receivables: Suppliers P=3,565,821 P=3,058,308 P=75,842,971 P=82,467,100 P=1,777,954 P=84,245,054 Others – – – – 5,660,529 5,660,529 P=3,565,821 P=3,058,308 P=75,842,971 P=82,467,100 P=7,438,483 P=89,905,583
2010 Aging analysis of financial assets past due but not impaired Past due and 31 to 60 days 61 to 90 days > 90 days Total impaired Total Receivables: Suppliers P=7,533,090 P=9,420,501 P=27,666,206 P=44,619,797 P=381,786 P=45,001,583 Others – – – – 3,245,706 3,245,706 P=7,533,090 P=9,420,501 P=27,666,206 P=44,619,797 P=3,627,492 P=48,247,289
Receivables from suppliers are noninterest-bearing and are generally on 30-day to 90-day terms. There are no significant concentrations of credit risk within the Group. Liquidity Risk Liquidity risk is the risk that an entity will encounter difficulty in meeting obligations associated with financial instruments. The Group seeks to manage its liquidity profile to be able to finance its capital expenditures and service its maturing debts. To cover for its financing requirements, the Group intends to use internally generated funds and sales of certain assets.
As part of its liquidity risk management program, the Group regularly evaluates projected and actual cash flow information and continuously assesses conditions in the financial markets for opportunities to pursue fund raising initiatives. These initiatives may include drawing of loans from the approved credit line intended for working capital and capital expenditures purposes and equity market issues. The tables below summarize the maturity profile of the financial assets of the Group: 2011
Three months More than
three months More than
one year More than or less to one year to five years five years Total Cash and cash equivalents Cash P=394,696,749 P=− P=− P=− P=394,696,749 Short-term investments − 10,409,907 − − 10,409,907 Receivables Suppliers 97,257,076 − − − 97,257,076 Franchisee 89,638,852 − − − 89,638,852 Store operators 15,683,186 − − − 15,683,186 Employees 15,407,124 − − − 15,407,124 Rent 7,068,009 − − − 7,068,009 Current portion of lease receivables 1,300,075 − − − 1,300,075 Notes 1,328,983 − − − 1,328,983 Insurance claims − 319,208 − − 319,208 Due from PFI − 173,945 − − 173,945 Others 11,112,829 − − − 11,112,829 238,796,134 493,153 − − 239,289,287 Deposits Utilities − − 29,267,868 − 29,267,868 Refundable − − 26,864,928 − 26,864,928
(Forward)

58 | Notes to Consolidated Financial Statements
2011
Three months More than
three months More than
one year More than or less to one year to five years five years Total Others P=− P=− P=4,527,970 P=− P=4,527,970 − − 60,660,766 − 60,660,766 Other noncurrent assets Lease receivables - net of current portion − − 3,448,336 − 3,448,336 P=633,492,883 P=10,903,060 P=64,109,102 P=− P=708,505,045
2010
Three months More than
three months More than
one year
More than or less to one year to five years five years Total Cash and cash equivalents Cash P=322,975,839 P=− P=− P=− P=322,975,839 Cash equivalents 35,753,695 − − − 35,753,695 358,729,534 − − − 358,729,534 Short-term investments − 10,141,555 − − 10,141,555 Receivables Suppliers 45,001,583 13,433,103 − − 58,434,686 Franchisee 40,871,647 − − − 40,871,647 Insurance claims − 10,986,094 − − 10,986,094 Employees 10,321,643 − − − 10,321,643 Store operators 9,718,957 − − − 9,718,957 Rent 5,925,582 − − − 5,925,582 Current portion of lease receivables 295,221 917,209 − − 1,212,430 Deposits 1,009,864 − − − 1,009,864 Due from PFI − 888,425 − − 888,425 Notes 728,097 − − − 728,097 Others 1,197,103 17,264,107 − − 18,461,210 115,069,697 43,488,938 − − 158,558,635 Deposits Utilities − − 23,969,222 − 23,969,222 Refundable − − 11,805,629 − 11,805,629 Others − − 3,273,451 − 3,273,451 − − 39,048,302 − 39,048,302 Other noncurrent assets Lease receivables - net of current portion − − 4,748,411 − 4,748,411 AFS financial assets − − − 1,320,575 1,320,575 − − 4,748,411 1,320,575 6,068,986 P=473,799,231 P=53,630,493 P=43,796,713 P=1,320,575 P=572,547,012
The tables below summarize the maturity profile of the financial liabilities of the Group based on remaining undiscounted contractual obligations:
2011
Three months More than
three months
More than or less to one year one year Total Bank loans P=293,389,375 P=83,335,278 P=– P=376,724,653 Accounts payable and accrued expenses Trade payable 1,066,740,769 – – 1,066,740,769 Utilities 38,219,462 – – 38,219,462 Employee benefits 23,954,117 – – 23,954,117 Advertising and promotion 16,054,548 – – 16,054,548 Outsourced services 12,461,025 – – 12,461,025 Security services 3,054,419 – – 3,054,419 Bank charges 2,278,700 – – 2,278,700
(Forward)

Notes to Consolidated Financial Statements | 59
2011
Three months More than
three months
More than or less to one year one year Total Interest P=1,174,528 P=– P=– P=1,174,528 Others 32,736,076 – – 32,736,076 1,196,673,644 – – 1,196,673,644 Other current liabilities Non-trade accounts payable 23,253,171 165,505,187 – 188,758,358 Service fees payable – 19,370,472 – 19,370,472 Retention payable – 18,688,531 – 18,688,531 Royalty 10,353,333 – – 10,353,333 Others – 12,700,219 – 12,700,219 33,606,504 216,264,409 – 249,870,913 Cumulative redeemable preferred shares 6,000,000 – – 6,000,000 P=1,529,669,523 P=299,599,687 P=– P=1,829,269,210
2010
Three months More than
three months
More than or less to one year one year Total Bank loans P=170,821,194 P=152,479,267 P=– P=323,300,461 Accounts payable and accrued expenses Trade payable 905,064,399 – – 905,064,399 Employee benefits 34,009,286 – – 34,009,286 Utilities 31,187,454 – – 31,187,454 Advertising and promotion 18,831,169 – – 18,831,169 Outsourced services 8,042,071 – – 8,042,071 Security services 3,610,705 – – 3,610,705 Bank charges 2,181,700 – – 2,181,700 Interest 874,892 – – 874,892 Others 15,508,753 – – 15,508,753 1,019,310,429 – – 1,019,310,429 Other current liabilities Non-trade accounts payable 13,657,982 150,464,506 – 164,122,488 Retention payable – 18,459,378 – 18,459,378 Service fees payable – 15,694,145 – 15,694,145 Royalty 8,465,255 – – 8,465,255 Others – 11,916,276 – 11,916,276 22,123,237 196,534,305 – 218,657,542 Cumulative redeemable preferred shares 6,000,000 – – 6,000,000 P=1,218,254,860 P=349,013,572 P=– P=1,567,268,432 Interest rate risk Interest rate risk is the risk that the fair value or future cash flows of a financial instrument will fluctuate because of changes in market interest rates. The Group’s fair value and cash flows interest rate risk mainly arise from bank loans with floating interest rates. The Group is expecting to substantially reduce the level of bank loans over time. Internally generated funds coming from its cash generating units and from its franchising business will be used to pay off outstanding debts and consequently reduce the interest rate exposure. The maturity profile of financial instruments that are exposed to interest rate risk are as follows:
2011 2010 Due in less than one year P=374,666,667 P=320,000,000 Rate 3.50%-4.25% 4.20%-5.20%
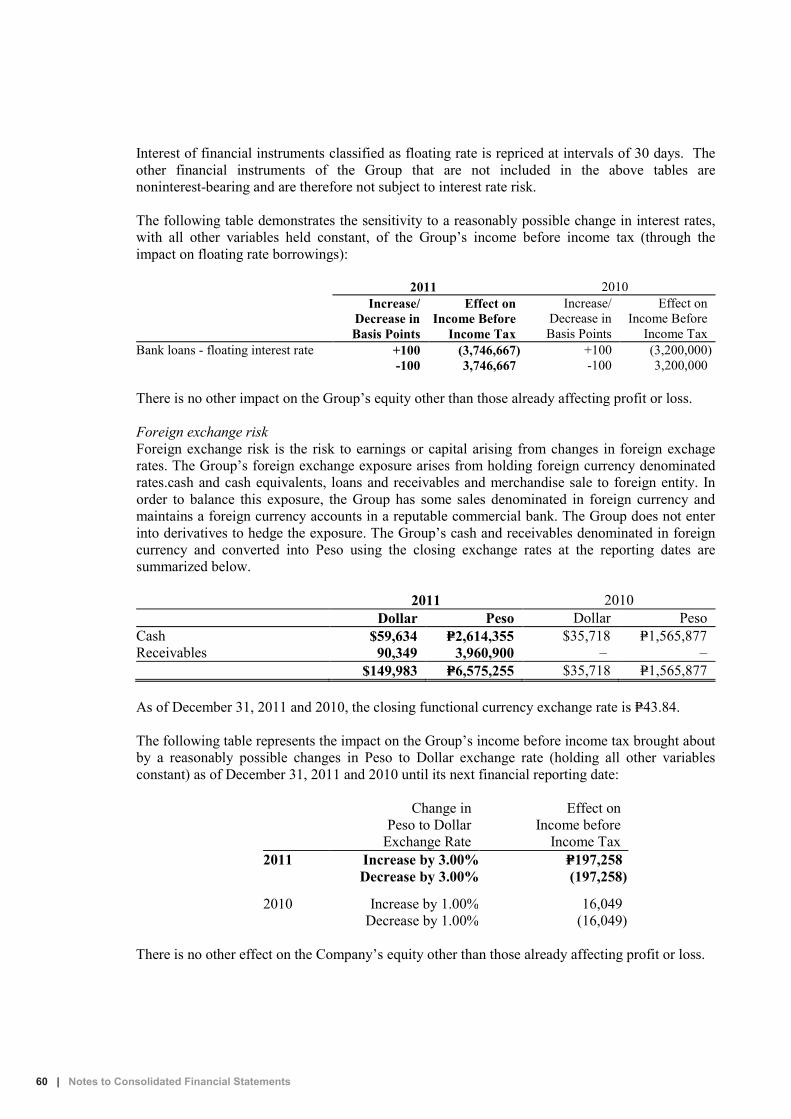
60 | Notes to Consolidated Financial Statements
Interest of financial instruments classified as floating rate is repriced at intervals of 30 days. The
other financial instruments of the Group that are not included in the above tables are noninterest-bearing and are therefore not subject to interest rate risk. The following table demonstrates the sensitivity to a reasonably possible change in interest rates, with all other variables held constant, of the Group’s income before income tax (through the impact on floating rate borrowings): 2011 2010
Increase/ Decrease in Basis Points
Effect on Income Before
Income Tax
Increase/ Decrease in Basis Points
Effect on Income Before
Income Tax Bank loans - floating interest rate +100 (3,746,667) +100 (3,200,000) -100 3,746,667 -100 3,200,000 There is no other impact on the Group’s equity other than those already affecting profit or loss. Foreign exchange risk Foreign exchange risk is the risk to earnings or capital arising from changes in foreign exchage rates. The Group’s foreign exchange exposure arises from holding foreign currency denominated rates.cash and cash equivalents, loans and receivables and merchandise sale to foreign entity. In order to balance this exposure, the Group has some sales denominated in foreign currency and maintains a foreign currency accounts in a reputable commercial bank. The Group does not enter into derivatives to hedge the exposure. The Group’s cash and receivables denominated in foreign currency and converted into Peso using the closing exchange rates at the reporting dates are summarized below.
2011 2010 Dollar Peso Dollar Peso
Cash $59,634 P=2,614,355 $35,718 P=1,565,877 Receivables 90,349 3,960,900 – –
$149,983 P=6,575,255 $35,718 P=1,565,877 As of December 31, 2011 and 2010, the closing functional currency exchange rate is P=43.84.
The following table represents the impact on the Group’s income before income tax brought about by a reasonably possible changes in Peso to Dollar exchange rate (holding all other variables constant) as of December 31, 2011 and 2010 until its next financial reporting date:
Change in Peso to Dollar
Exchange Rate
Effect on Income before
Income Tax 2011 Increase by 3.00% P=197,258
Decrease by 3.00% (197,258)
2010 Increase by 1.00% 16,049 Decrease by 1.00% (16,049)
There is no other effect on the Company’s equity other than those already affecting profit or loss.

Notes to Consolidated Financial Statements | 61
31. Capital Management
The primary objective of the Group’s capital management is to ensure that it maintains a strong credit rating and healthy capital ratios in order to support its business and maximize shareholder value. In the light of changes in economic conditions, the Group manages dividend payments to shareholders, pay-off existing debts, return capital to shareholders or issue new shares. The Group mainly uses financing from local banks. The Group considers equity contributed by shareholders as capital. The Group manages its capital structure by keeping a net worth of between 30% and 50% in relation to its total assets. The Group’s net worth ratio is 40% and 38% as of December 31, 2011 and 2010, respectively. No changes were made in the objectives, policies and processes during the year.
2011 2010 Capital stock P=347,329,216 P=302,114,918 Additional paid-in capital 293,525,037 293,525,037 Retained earnings 855,468,208 574,482,384 1,496,322,461 1,170,122,339 Less cost of shares held in treasury 2,923,246 2,923,246 P=1,493,399,215 P=1,167,199,093
Total assets P=3,734,298,981 P=3,093,173,359
Net worth 40% 38% As of December 31, 2011 and 2010, the Group was able to meet its objective. 32. Significant Agreements
a. The Group has various store franchise agreements with third parties for the operation of certain stores. The agreement includes a one-time franchise fee payment and an annual 7-Eleven charge for the franchisee, which is equal to a certain percentage of the franchised store’s gross profit. Franchise fee amounted to P=55,198,201, P=40,202,044 and P=32,828,051 in 2011, 2010 and 2009, respectively, and franchise revenue for the 7-Eleven charge amounted to P=478,827,511, P=402,620,636 and P=270,987,091 in 2011, 2010 and 2009, respectively.
b. The Group has service agreements with third parties for the management and operation of
certain stores. In consideration thereof, the store operator is entitled to a service fee based on a certain percentage of the store’s gross profit and operating expenses as stipulated in the service agreement. Service fees included under outside services shown as part of “General and administrative expenses” in profit or loss amounted to P=174,464,102 in 2011, P=134,893,173 in 2010 and P=109,601,229 in 2009.
c. On April 1, 2011, CDI has entered into a Memorandum of Agreement (MOA) with TAIT
Marketing and Distribution Co., Ltd., a corporation duly organized and existing under the laws of the Republic of China (ROC) with principal office at Taiwan, ROC. The contract indicates that CDI shall provide consumer goods and products from Philippine Suppliers that

62 | Notes to Consolidated Financial Statements
meet the needs and specifications of TAIT. Revenue from merchandise sold to TAIT amounted to P=11,974,766 in 2011 with associated cost of goods sold amounted to P=9,986,582.
d. The Group has an agreement with its phone card supplier effective January 1, 2000. Under the arrangement, the Group earns commission on the sale of phone cards based on a certain percentage of net sales for the month and a fixed monthly rate. Commission income amounted to P=37,236,539, P=29,271,506 and P=22,130,513 in 2011, 2010 and 2009, respectively.
e. The Group has entered into an exclusivity agreement with a Third Party Supplier in the
Philippines on October 1, 2007. Upon the effectivity of the agreement, all existing branches of 7-Eleven shall exclusively carry the Third Party Supplier’s products and 7-Eleven should not carry any other similar or parallel products. The agreement is for a period of three years starting October 1, 2007 and shall continue in force and effect until December 31, 2010. In June 2008, the Company received a total consideration of P=11,741,071 in relation to the agreement, to be amortized over three years. On October 15, 2010, the said agreement was extended for another 3 years. The Company received P=29,000,000 as a result of the extension. Income from exclusivity contract included as part of “Marketing support funds” under “Marketing income” in the consolidated statement of comprehensive income amounted to P=29,000,000 in 2011 and P=3,913,690 in 2010 and 2009.
f. The Group has also entered into a 3-year exclusivity contract with a Third Party soda manufacturer in the Philippines effective April 2010 to March 2013. The contract indicates that the Third Party soda manufacturer will exclusively supply all slurpee products of 7-Eleven. The Group received a one-time signing bonus amounting to P=4,464,286 upon the effectivity of the exclusivity supply contract amortized over three years. Income from exclusivity contract included as part of “Marketing support funds” under “Marketing income” in consolidated statement of comprehensive income amounted to P=1,488,095 and P=1,116,071 in 2011 and 2010, respectively. Deferred revenue as of December 31, 2011 and 2010 amounted to P=1,860,119 and P=3,348,214, respectively.
g. In 2010, the Group collected a signing bonus amounting to P=2,232,143 from one of the
Group’s food suppliers for awarding half of the Company's existing Hotdog Stock Keeping Units (SKUs) to the food supplier for the next five years starting January 1, 2010. Income from exclusivity contract included as part of “Marketing support funds” under “Marketing income” in profit or loss amounted to P=446,429 both in 2011 and 2010. Deferred revenue as of December 31, 2011 and 2010 amounted to P=1,339,286 and P=1,785,715, respectively.
h. The Group has entered into a Memorandum of Agreement (MOA) with Chevron Philippines, Inc. (CPI) on August 6, 2009, wherein CPI has granted the Group as authorized co-locator for a full term of three-years to establish, operate and/or franchise its 7-Eleven stores in CPI service stations. Both parties have identified 22 CPI service stations, wherein the Group will give the Retailers of these service stations a Letter Offer to Franchise (LOF) 7-Eleven stores. Upon acceptance of the Retailers of the LOF, the Retailers will sign a Store Franchise Agreement (SFA) with the Group. If LOF is not accepted by one of the 22 original service stations identified, that service station will be replaced with another mutually acceptable service station site.

Notes to Consolidated Financial Statements | 63
Upon signing of the MOA, CPI executes a Caltex Retail Agreement with each of the 25 service station Retailers, which shall have a full term of three years and which will be co-terminus with the SFA. The Company has 25 Retailers franchised stores as of December 31, 2011 and 2010.
33. Segment Reporting
The Group considers the store operations as its only business segment based on its primary business activity. Franchising, renting of properties and commissioning on bills payment services are considered an integral part of the store operations. The products and services from which the store operations derive its revenues from are as follows: Merchandise sales Franchise revenue Marketing income Rental income Commission income Interest income The segment’s relevant financial information is as follows:
2011 2010 2009
REVENUE Revenue from merchandise sales P=9,435,604,073 P=7,612,243,056 P=6,033,322,488 Franchise revenue 534,025,712 442,822,680 303,815,142 Marketing income 484,888,816 338,765,461 236,502,860 Rent income 44,143,593 37,361,844 52,265,323 Commission income 37,236,539 29,271,506 22,130,513 Interest income 5,864,713 5,355,769 4,839,945 Other income 101,235,280 78,278,268 35,685,902 10,642,998,726 8,544,098,584 6,688,562,173 EXPENSES Cost of merchandise sales 7,091,496,699 5,585,270,478 4,371,715,990 General and administrative expenses: Depreciation and amortization 380,954,262 294,893,483 203,905,718 Others 2,631,223,716 2,236,612,313 1,847,053,611 Interest expense 16,024,647 16,398,169 26,482,817 Other expenses 4,806,251 5,288,221 8,572,988 10,124,505,575 8,138,462,664 6,457,731,124 INCOME BEFORE INCOME TAX 518,493,151 405,635,920 230,831,049 PROVISION FOR INCOME TAX 162,150,162 128,755,672 75,040,398 SEGMENT PROFIT P=356,342,989 P=276,880,248 P=155,790,651
SEGMENT ASSETS P=3,734,298,981 P=3,093,173,359 P=2,709,291,692
SEGMENT LIABILITIES P=2,237,669,871 P=1,922,744,371 P=1,801,389,206
CAPITAL EXPENDITURE FOR THE YEAR P=717,091,736 P=671,923,830 P=362,393,990

64 | Notes to Consolidated Financial Statements
34. Provisions and Contingencies The Group is a party to various litigations involving, among others, employees suing for illegal
dismissal, back wages and damage claims, lessors claiming for lease payments for the unexpired portion of the lease agreements in cases of pre-termination of lease agreements, claims arising from store operations and as co-respondents with manufacturers on complaints with the Bureau of Food and Drugs, specific performance and other civil claims. All such cases are in the normal course of business and are not deemed to be considered as material legal proceedings. Further, these cases are either pending in courts or under protest, the outcome of which are not presently determinable. Management and its legal counsel believe that the liability, if any, that may result from the outcome of these litigations and claims will not materially affect their financial position or financial performance.
As of December 31, 2011 and 2010, the Company has provisions amounting to P=7,066,290
pertaining to probable loss on litigations. The table below summarizes the movements in the Company’s provision as of December 31:
2011 2010 Beginning of the year P=7,066,290 P=12,578,122 Provisions during the year – 4,098,267 Payments during the year – (9,610,099) P=7,066,290 P=7,066,290
35. Note to Consolidated Statements of Cash Flows
The principal non-cash transaction of the Group under financing activities pertains to the issuance of stock dividends (see Note 17).