Embed Size (px)
Citation preview
Statement of
Bryan Darr President and Chief Executive Officer
Mosaik Solutions
Before the
U.S. House of Representatives Committee on Energy and Commerce
Subcommittee on Communications and Technology
“Defining and Mapping Broadband Coverage in America”
June 21, 2017

1
Good morning, my name is Bryan Darr, and I am the President and Chief Executive Officer
of Mosaik Solutions. I want to thank Chairman Blackburn, Ranking Member Doyle, and the fellow
members of the Subcommittee on Communications and Technology for this opportunity to speak
with you.
I appeared before this committee in March 2017 and appreciate the opportunity to return to
provide additional testimony, particularly with the focused interest on defining and mapping
broadband coverage.
Broadband deployment is a bipartisan national priority. But expanding and accelerating
broadband deployment requires reliable information and data-driven decision making. Without
trusted data about coverage gaps, underserved populations, network speeds, and other indicators, we
will not stimulate private-sector investment, advance toward the goal of universal service, expand
broadband into more rural areas, or improve the competitive broadband market we see today.
Since I founded Mosaik in 1988, my company’s sole mission has been to produce reliable
data about wireless network coverage and performance. Almost thirty years later, we’re still a small
business—we have less than 50 employees and we’re still based in Memphis, Tennessee, but we
offer some of the most accurate insight into network coverage and performance available in the
market. We like to describe Mosaik as a business intelligence company with deep
telecommunications domain expertise. More simply put, we tell our clients where they can
reasonably expect to have access to a variety of mobile networks, and how reliable wireless networks
are at any given point in the United States and much of the rest of the world.
Having founded Mosaik during the infancy of the wireless industry, I continue to be
impressed and often amazed by the advancements in network service quality and seemingly never-
ending innovative uses for broadband services by consumers, enterprises, and entrepreneurs alike.
I’m also proud of our longstanding and constructive relationship with the Federal Communications

2
Commission—we have supported part of the FCC’s recurring informational needs for many years.
The FCC has used our CoverageRight datasets in its annual competition reports and other policy
and regulatory decisions. Improving wireless customer experiences was the mission when I started
Mosaik, and through near constant innovation and investment, Mosaik continues with the same
mission today. During our almost three decades serving clients, we have developed competencies
that span geospatial analytics, graphic design and data visualization, software engineering, cloud-
based big-data management, and mobile application development.
Mosaik and its competitors stake our reputations on supporting the products and services
we provide to our clients. Today, consumer devices collect millions of daily measurements
providing granular information about the quality of mobile networks. This data is absolutely
required to understand network quality in over eleven-million census blocks. It is equally important
in rural, high-cost areas that remain underserved. Mosaik is currently leading a research and
development effort with one of the largest fleets in the United States to radically expand available
information about mobile network quality. I am confident other private companies are making
similar investments.
Despite healthy competition and increasingly sophisticated data analysis among private
sector network-analysis companies, the FCC has sought to displace this industry by mandating use
of its own data analytics tools. In 2013, the FCC elected to expand its Form 477 with the
Modernizing the FCC Form 477 Data Program Order to mandate that carriers provide information
directly to the Commission. In some cases, the FCC uses its in-house data to the exclusion of all
3
other sources. The Wireless Telecommunications Bureau recently stated that its Form 477 coverage
data is “the best available data we have today.”1
It’s not.
The Form 477 mobile broadband coverage data is flawed. First, there are no defined
specifications for what radio-frequency conditions or methodologies are required. Second, the
FCC’s data is out of date almost as soon as it is filed. Form 477 data is too infrequently updated and
has too large of a time gap between reporting date and release date. For example, mobile network
coverage data as of December 2015 was released in September 2016—a lifetime in this fast-moving
industry. During this nine-month period alone, a national operator radically expanded the
population served with its LTE network while another more established operator added thousands
of square miles of rural LTE coverage. That’s precisely why Mosaik’s LTE network coverage
datasets are updated monthly.
In the map shown in Figure 1, on the next page, we overlay the latest available Form 477
mobile broadband coverage data with the most recent coverage data from T-Mobile. It clearly shows
how much has changed in a relatively short period. This additional coverage represents
approximately 339,474 square miles and 583,820 census blocks representing 5,048,900 people (based
on the 2010 census).
1 Jon Wilkins, Mobility Fund II: Improving the Data We Use to Identify & Close Mobile Coverage Gaps, FCC Blog (Sept. 30, 2016), https://www.fcc.gov/news-events/blog/2016/09/30/mobility-fund-ii-improving-data-we-use-identify-close-mobile-coverage.

4
Figure 1
Figure 2

5
It’s not just the big, national operators that have been investing in their networks. Many of
the regional and rural operators have invested heavily in expanding both the size and depth of their
networks. The map in Figure 2, on the previous page, shows the combined patterns of three
neighboring rural operators in eastern Montana. They made great progress over a recent eighteen-
month period to enhance their coverage footprint. Since the only area in which they can compete is
within their limited license territory, all of their investment is highly targeted toward the territory and
customers they serve. Higher quality coverage data can surgically identify unserved areas and enable
operators to replicate the successes across the rest of the country.
Both large and small operators have shown a willingness to build new infrastructure and
introduce service to new areas. But covering the last, least-populated or hard-to-service areas is
economically impractical. Dedicating infrastructure spending in broadband networks holds the
promise to extend these networks to many of the unserved areas that remain. Ensuring that the
funds are directed toward areas that meet the “no service” criteria, as it will soon be defined, can be
more successful with access to better and fresher data. It can also help to minimize the number of
objections brought forth during a challenge process.
Relying exclusively on antiquated or inferior government-mandated data threatens to
frustrate mobile broadband deployment and harm American consumers. And the exclusion of other
types of data threatens to crowd out private investment from U.S. companies—including Mosaik—
that compete to provide similar and, we believe, far superior products about network coverage and
performance. These private companies are responsible for much of the innovation that has
provided the gains in predicting and understanding network availability.
Just as importantly, private companies have long term obligations to their clients. They
provide a continuity of service and, therefore, a continuity of expertise and care to the data sets they
must maintain. Private industry is also less susceptible to the natural swings in priorities with which
6
governments must contend. Within an industry changing as rapidly as telecommunications, shutting
down research for even a few months can create a backlog of issues. Approximately $350 million
was spent creating the original National Broadband Map. Once funding was discontinued, most
states dropped the program. Three years after its release, the map is little more than a snapshot of a
brief moment in the history of the broadband industry. Future endeavors to produce an improved
mapping of fixed and mobile broadband networks should rely more on the private to ensure
continuity.
We can do better. To assist policymakers in how they make broadband funding decisions,
we should overlay traditional datasets with wireless infrastructure information, including tower assets
and fiber optic availability, as well as on-the-ground network coverage and performance testing. We
should also evaluate novel key performance indicators or derivatives, such as verified coverage,
percentage of RAN utilization per network, and human and agricultural density data, among many
others.
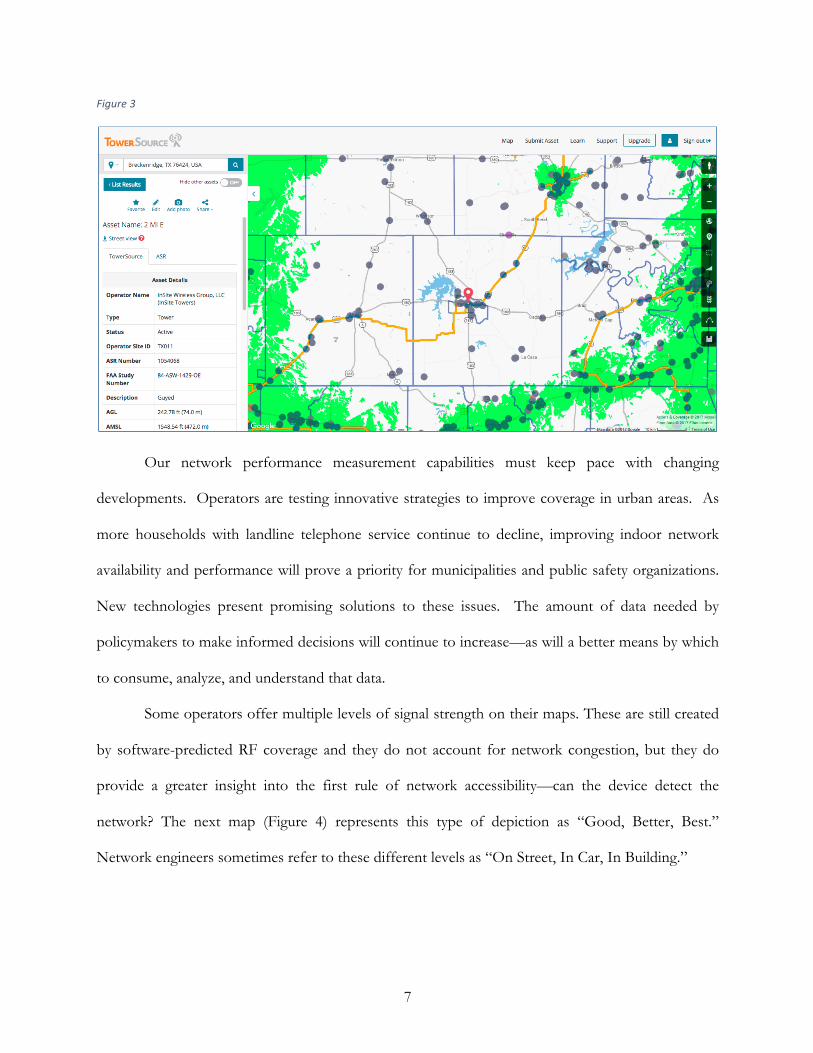
The next image (Figure 3) shows how overlaying coverage, tower assets and fiber routes can
speed the site acquisition process to locate suitable tower or rooftop assets for network expansion.
Identifying existing structures for infrastructure deployment can avoid much of the opposition to
new tower sitings. Passing legislation to simplify approval of new sites and additional antennas could
further accelerate relief to unserved and underserved areas. But LTE and future broadband services
require fiber to deliver broadband speeds. Intelligence about the surrounding telecom landscape is
critical to defining priorities and understanding where the taxpayer can get the most return for their
considerable investment.
7
Figure 3
Our network performance measurement capabilities must keep pace with changing
developments. Operators are testing innovative strategies to improve coverage in urban areas. As
more households with landline telephone service continue to decline, improving indoor network
availability and performance will prove a priority for municipalities and public safety organizations.
New technologies present promising solutions to these issues. The amount of data needed by
policymakers to make informed decisions will continue to increase—as will a better means by which
to consume, analyze, and understand that data.
Some operators offer multiple levels of signal strength on their maps. These are still created
by software-predicted RF coverage and they do not account for network congestion, but they do
provide a greater insight into the first rule of network accessibility—can the device detect the
network? The next map (Figure 4) represents this type of depiction as “Good, Better, Best.”
Network engineers sometimes refer to these different levels as “On Street, In Car, In Building.”

8
Figure 4
There is no defined industry standard as to what specific signal level is used to represent the
demarcation between each of these boundaries. But it is also important to consider that different
spectrum blocks have distinctive characteristics regarding effective distance and their ability to
penetrate structures. If a specific signal strength level is used to define minimum requirements for
broadband connectivity, it will have a very significant impact on the total square miles eligible for
assistance. We do not endorse any given level but recognize the impact that this decision may have.
The map in Figure 5 shows signal strength readings collected anonymously from consumer
devices. This information is overlaid with the typical predictive RF model that we have commonly
seen. The RF model certainly shows areas of poor or no coverage in the rural areas, but does not
indicate where the weak spots within the coverage patterns may exist. No network is going to be
able to offer maximum signal quality everywhere — and frankly, that’s not required to have a robust
and performant network. Congestion levels on a network can have just as much impact on the user’s
experience so understanding throughput speeds and latency also need to be considered.

9
Figure 5
We commend Congress and the FCC for recognizing the importance of data-driven
decision-making. When measuring the availability of broadband to consumers, the policymakers
should take into account all sources—especially as providers embrace newer technologies to
improve network quality. That holistic approach is consistent with longstanding executive-branch
policy, which directs agencies to rely on the private sector whenever feasible. Here, policymakers
can greatly augment the quality and depth of their data—and at a cost equivalent to a handful of cell
sites. When government agencies embrace the capabilities of private companies instead of
competing with them, taxpayers can spend less money and benefit from sound policymaking based
on more accurate and timely data about network coverage and performance. Let’s make sure we use
the best of what the private sector has to offer.
Thank you and I look forward to answering your questions.

10
Supplemental Maps — Ranking Coverage Quality
Figure 6