Embed Size (px)
Citation preview

State Water Survey Division SURFACE WATER SECTION
AT THE UNIVERSITY OF ILLINOIS
Illinois Department of Energy and Natural Resources
SWS Contract Report 383
KANKAKEE DAM DISCHARGE CHARACTERISTICS
by
J. Rodger Adams and Allen P. Bonini
Prepared for the Illinois Department of Conservation
March 1986

CONTENTS
Page
Introduction 1 Acknowledgements 2
West Station Street Discharge 2
Spillway Ratings 4
Flashboard Installation 11
Summary 20
References 20

KANKAKEE DAM DISCHARGE CHARACTERISTICS
by
J. Rodger Adams and Allen P. Bonini
INTRODUCTION
Flashboards are used to maintain a higher head on the dam across the Kankakee River in Kankakee, Illinois. The higher head also provides a greater depth of water at the city water intake and greater depths for boating in Six Mile Pool. There has been some concern about the decreased discharge and water depth downstream from the dam immediately following annual installation of the flashboards in early to mid-summer. The flashboard installation is done by the Illinois Department of Conservation (DOC). Beginning in 1984, they have been required to install the flashboards in two stages, each covering one-half of the spillway crest length. The flashboards must be installed before the discharge drops below 1300 cubic feet per second (cfs).
In anticipation of this requirement, DOC contacted the Illinois State Water Survey in June 1983 and requested technical assistance in determining the discharge characteristics of the dam and the impact of flashboard installation on the river downstream from the dam. Discharge characteristics were developed on the basis of the spillway crest profile, with engineering judgment used for the irregularly-shaped crest, and were transmitted to DOC in August 1983. At this time a scope of work was also submitted to DOC for the field calibration of the dam discharge characteristics, measurement of the effects of flashboard installation on flow conditions downstream from the dam, and the time required for the river to return to steady flow conditions. This two-year project was agreed upon and ran from January 1, 1984, to December 31, 1985.
The two years of field data have been analyzed to determine the discharge characteristics of the Kankakee Dam with and without flashboards and the rate of return to steady flow following flashboard installation. The discharge measuring site at the West Station Street bridge was found to have a good discharge-stage rating. The dam discharge ratings with and without flashboards are also good. In this report the rating without flashboards is compared to the estimated rating developed by hydraulic analysis in 1983. The time histories of water levels above and below the dam and of the discharge are presented for the periods before and after flashboard installation. The water level and discharge responses to installation of the second half of the flashboards are discussed in detail for three data sets.
This report includes sections on the West Station Street discharge-stage rating, the spillway ratings, and the stage and discharge changes and recoveries following flashboard installation.
1

Acknowledpements
Administrative supervision was provided by Stanley A. Changnon, Jr. (Chief), Richard J. Schicht (Acting Chief), and Michael L. Terstriep (Head of the Surface Water Section), State Water Survey Division, Illinois Department of Energy and Natural Resources. Liaison for the sponsor, the Illinois Department of Conservation (DOC), was provided by James Mick and Dale Burkett.
Anne Klock, a graduate research assistant, assisted with several discharge measurements. William Bogner conducted the leveling survey to determine the dam crest elevation and gage zero elevations. Department of Conservation personnel installed the staff gages and assisted with data collection during flashboard installation.
The illustrations were prepared under the supervision of John Brother, Jr. Kathleen Brown typed the camera-ready copy and Gail Taylor edited the report.
WEST STATION STREET DISCHARGE
A bridge with a good walkway and railing that crosses a reasonably straight and uniform reach of the river is necessary for discharge measurements. The West Station Street bridge (see figure 1), about 0.7 miles downstream from the dam, meets these criteria for a discharge measuring site. A staff gage was mounted on the west pier of the bridge to measure the water level, or stage, in the river. Methods for measuring the water discharge follow those of the U.S. Geological Survey (Carter and Davidian, 1968; Buchanan and Somers, 1969).
The top width of the river is divided into at least 20 segments by measuring along the bridge railing. No segment should carry over 10% of the discharge and it is better if no segment carries over 5% of the discharge. Water velocity and depth are measured at both ends of each segment. A standard Price-type current meter with a six cup rotor mounted on a vertical shaft is used to measure the velocity. An electrical contact is made once each revolution of the rotor. The number of revolutions are counted for a measured period of time (40 to 60 seconds) and the velocity is determined from a calibration table. The current meter and a weight are suspended on a conducting cable attached to a winch on a three-wheeled crane which is wheeled along the bridge.
For depths less than 2.5 ft a single velocity reading is taken at 0.6 depth below the surface. For depths over 2.5 ft velocity readings are taken at 0.2 and 0.8 depth and the two readings are averaged to determine the velocity at that vertical of the river. The segment discharge is equal to the average of the velocities at both ends of the segment multiplied by the segment area, which is the product of the average of the depths at both ends and the width.
A total of 23 discharge measurements were made, 11 in 1984 and 12 in
2

Figure 1. Locat ion map
3

1985. As shown in table 1, stages at the West Station Street gage varied between 0.99 and 4.65 ft. The discharge varied between 618 and 5547 cfs. Gage height and water surface elevations for both the West Station Street and Schuyler Avenue gages are given in table 1. The Schuyler Avenue gage measures the stage upstream of the dam and is discussed in the "Spillway Ratings" section.
The zero datum of the West Station Street gage is 581.89 ft above mean sea level (msl). River top width, cross-sectional area, average depth, and average velocity are given in table 1 for each discharge measurement for the West Station Street gage. The discharge versus gage height or water surface elevation rating curve is shown in figure 2.
All the data points from before, during, and after flashboard installation fall on the same line. The line was determined by linear regression and has the equation:
Q = 609 h 1 . 4 1 7 (1)
where Q is the discharge in cfs and h is the gage height in ft. The correlation coefficient is greater than 0.99. This indicates that the discharge measurements have good precision and that the reach has consistent flow characteristics within the range of measurements. All but one discharge measurement were rated as good, or with a 5% maximum error. Either equation 1 or the line in figure 2 may be used to determine the discharges for other gage heights. Extrapolation beyond the measured discharge of 5547 cfs and gage height of 4.65 ft should be done only with caution.
SPILLWAY RATINGS
The primary goal of this project was the rating of the dam at Kankakee both with and without flashboards in place. The location and plan view of the dam are shown in figure 1. The spillway has a crest length of 440 ft and a crest elevation of 592.80 ft above msl. An 80-ft-long section of wall perpendicular to the crest connects it to the powerhouse. This wall has a rectangular top shape and a top elevation of 594.80 ft above msl. Flow over this wall is not treated separately from flow over the spillway crest.
The spillway crest is curved with the center about 20 ft upstream of the ends. The cross-sectional shape of the spillway is shown in figure 3. The 15-inch-high flashboards are placed on the spillway crest and raise the crest elevation to 594.05 ft above msl. Considering all these factors in the geometry of the dam, determination of a spillway discharge coefficient by standard engineering methods leaves much uncertainty. Thus the need for the field measurement of head on the spillway and discharge over a range of discharges.
Before the office and field discharge versus head (water level above the crest) relationships, or ratings, are described, the annual cycle of flashboard installation and removal needs to be outlined. The flashboards are installed in the summer when the water level in Six Mile Pool falls to
4

Table 1. Discharge Measurements on the Kankakee River at the West Station Street Bridge
West St ation St. Schuy ler Ave. Gage Elevation Gage Elevation Top Average Average height (ft above height (ft above Discharge Width Area depth velocity
Date (ft) msl) (ft) msl) (cfs) (ft) (sq ft) (ft) (fps) 16-May-84 3.34 585.23 0.61 594.92 3417 272 1126 4.14 3.03 07-Jun-84 4.65 586.54 1.15 595.46 5547 289 1497 5.18 3.71 28-Jun-84 3.61 585.50 0.67 594.98 3866 279 1197 4.29 3.23 05-Jul-84 2.59 584.48 0.19 594.50 2317 255 904 3.54 2.56 05-Jul-84 2.08 583.97 0.40 594.71 1733 253 788 3.12 2.20 06-Jul-84 2.56 584.45 0.63 594.94 2273 255 885 3.47 2.57 07-Jul-84 1.89 583.78 0.96 595.27 1518 250 698 2.79 2.18 13-Jul-84 2.32 584.21 1.10 595.41 1923 253 825 3.26 2.33 23-Jul-84 1.71 583.60 0.85 595.16 1236 250 662 2.65 1.87 06-Aug-84 1.50 583.39 0.78 595.09 1060 249 601 2.41 1.76 30-Aug-84 0.99 582.88 0.55 594.86 618 232 464 2.00 1.33 03-May-85 3.81 585.70 0.86 595.17 4230 282 1272 4.51 3.33 16-May-85 2.68 584.57 0.28 594.59 2418 256 917 3.58 2.64 31-May-85 2.88 584.77 0.36 594.67 2779 263 923 3.51 3.01 31-May-85 2.39 584.28 0.54 594.85 1993 256 789 3.08 2.52 01-Jun-85 2.81 584.70 0.75 595.06 2605 258 891 3.45 2.92 01-Jun-85 2.13 584.02 1.03 595.34 1730 253 732 2.89 2.36 03-Jun-85 2.60 584.49 1.25 595.56 2327 257 856 3.33 2.72 14-Jun-85 1.99 583.88 0.96 595.27 1610 252 698 2.77 2.31 02-Jul-85 1 .64 583.53 0.79 595.10 1227 251 646 2.57 1.90 13-Aug-85 1.34 583.23 0.68 594.99 918 250 573 2.29 1.60 26-Aug-85 1.49 583.38 0.77 595.08 1107 250 608 2.43 1.82 16-Sep-85 1.28 583.17 0.69 595.00 916 250 578 2.31 1.59

Figure 2. Discharge rating at the West Station Street gaging station
6

Figure 3. Cross section of spillway showing flashboards and water surface
7

about 1 foot above the dam crest. Two 8-inch planks are placed one atop the other against a series of retaining pins spaced 4 ft apart along the spillway crest. It takes less than one-half hour to place flashboards halfway across the dam. The planks are held against the pins by water pressure. After installation in the summer, the flashboards remain in place until broken by ice in the winter or washed away during spring floods. The water flows over the concrete dam crest from the time the flashboards are removed by natural forces until new boards are installed in the summer.
An office study was conducted in 1983 to estimate the discharge characteristics of the spillway without the flashboards in place. This is the more important rating, since the flashboards are to be in place before the discharge drops to 1300 cfs in the summer. This discharge is based on a desire to maintain at least 1 foot of head on the dam for boating in Six Mile Pool, and on an assumed rating of 100 cfs per inch of water over the dam.
The office rating was made by estimating a discharge coefficient by comparison of the spillway cross section with similar-shaped spillways given in Bradley's publication on discharge over irregularly shaped spillways (1952). Figure 4 gives this rating curve, which is the lowest line shown in the figure. Because the estimated discharge coefficients are too large, the estimated discharge exceeds the measured discharge for the same water surface elevation throughout the ranges of stage and discharge shown.
A total of seven measurements were obtained for flow over the spillway crest. The rating equation determined by least-squares regression is:
Q = 796 H 1 . 9 7 1 (2)
with H = h + 1.51 (3)
where h is the gage height in feet at the Schuyler Avenue bridge. If water surface elevation is used, the head datum in equation 2 is 592.80. The correlation coefficient is over 0.99.
Twelve measurements were obtained with all the flashboards in place. Four discharge measurements were made with flashboards installed halfway across the spillway. These points are also shown in figure 4. No rating equation or line was determined for the data with half of the flashboards in place. The upper line through the 12 points obtained with the flashboards in place has the equation:
Q = 1017 H 2 . 0 9 2 (4)
with H = h + 0.26 (5)
The correlation coefficient is also over 0.99 for this case. If the water surface elevation is used, the head datum in equation 4 is 594.05.
The estimated rating was based on a design discharge coefficient of
8
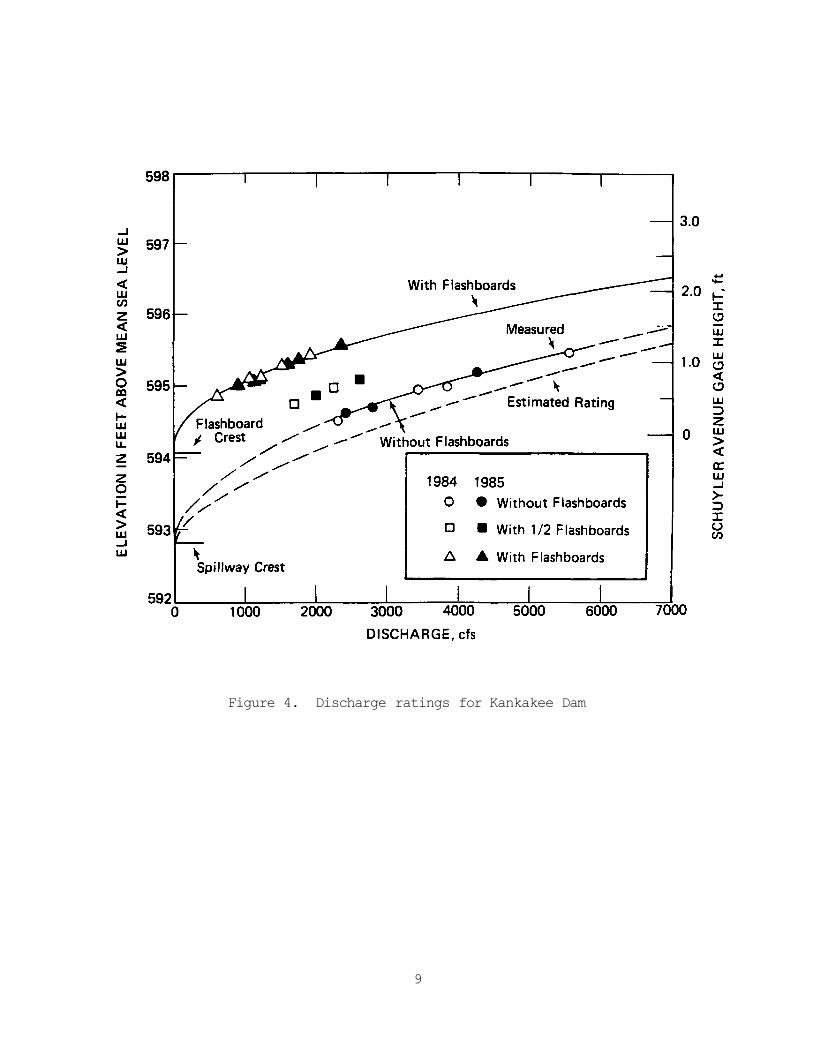
Figure 4. Discharge ratings for Kankakee Dam
9

3.70 at a head of 5.0 ft. Within the measured data with heads less than 2.66 ft, the estimated rating always exceeds the measured rating. The estimated rating also uses an exponent of 1.5 on the head, while the measured data yield an exponent near 2.0. The basic equation for spillway discharge is
Q = CLHn (6)
where C is the discharge coefficient, L is the spillway length in ft, and n is the exponent which is theoretically 1.5. One interpretation of exponents different from 1.5 is that C varies with H and is given by:
C = C'(n-1.5) (7)
where C' is a new coefficient which is independent of H. Applying this to equation 2 gives a C of 1.809 and an (n-1.5) of 0.471. The computed rating varied C with H based on a graph given by Bradley (1952) . The values given in table 2 illustrate the comparison between the estimated and measured ratings.
At the assumed design head of 5.0 ft the two ratings are within 5%, though they differ by nearly 100% at 1.0 ft head. The geometry of the spillway and the approach channel causes the discharge coefficient to decrease more rapidly with decreasing head than in the theoretical case.
Since the reason for this study is to help anticipate the discharge of 1300 cfs at which the flashboards must be in place, table 3 gives the gage readings at the Schuyler Avenue bridge for discharges from 2500 to 1300 cfs.
The gage reading for 1300 cfs corresponds to a water level elevation of 594.08. This table allows use of the new gage on the Schuyler Avenue bridge or the older gage on the south abutment of the Illinois Central Gulf Railroad bridge. With the flashboards in place the spillway performs somewhat like a sharp-crested weir of small height, and using equation 7 with the rating equation 4 yields a C of 2.311 and an (n-1.5) of 0.592. The flashboards maintain the pool level at or above elevation 595 for all discharges over 900 cfs. Without the flashboards the pool level is below 495 for discharges less than 3770 cfs.
Table 2. Discharges and Discharge Coefficients for Given Heads
Headwater elevation
Head (ft) Qest (cfs)
Cest Q m e a s cfs c m e a s
593.80 1.0 1400 3.15 796 1.81 594.80 2.0 4100 3.33 3121 2.51 597.80 5.0 18100 3.70 18990 3.86
10

Table 3. Gage Readings at Schuyler Avenue for Low Discharges
Discharge, cfs 2500 2300 2100 1900 1700 1500 1300 Head, ft 1.79 1.71 1.64 1.55 1.47 1. 38 1 .28 Gage, ft 0.28 0.20 0.15 0.04 -0.04 -0..13 -0 .23 Elevation, 594.59 594.51 594.46 594.35 594.27 594.18 594 .08 ft msl
FLASHBOARD INSTALLATION
As described previously, the flashboards are installed halfway across the dam one day and the rest of the way a day or two later. They are installed when the upstream pool level is about 1.5 ft above the spillway crest, or the water is a little over 1 foot deep on the spillway crest. In 1984 the Department of Conservation installed the flashboards on July 5 and July 7. The first half were installed beginning at 6 p.m. (1800) CDT on July 5. This limited the time of observation of the stage changes following flashboard installation. The stage data are given in table 4. The discharge was 2317 cfs at 1400 before the flashboard installation. Another discharge measurement was made beginning one hour after the flashboards were installed. That discharge was 1733 cfs, or 75% of the discharge beforehand. The stage at West Station Street was 0.51 ft lower at this time than it had been before installation. The discharge was also measured on July 6 and was 2273 cfs.
The second half of the flashboards were installed beginning at 10:45 a.m. (1045) on July 7. The stage data are given in table 5. The West Station Street rating equation (equation 1) was used to calculate the discharges given in table 5. The discharge was measured beginning at 1300 and was 1518 cfs, which agrees well with the discharges obtained from the gage readings between 1300 and 1500 that afternoon. The time history of stage and discharge is shown in figure 5 for the installation of the second half of the flashboards.
The minimum stage and discharge at West Station Street occurred 1.75 hours after the flashboards were installed. The minimum stage was 0.76 ft lower than the initial stage. The minimum discharge was 1317 cfs, or 58.7% of the initial discharge of 2244 cfs. When stage readings were stopped about 6.5 hours after installation, the stage at West Station Street had recovered 0.62 ft or 81.6% of the total decrease in stage. The discharge at this time was 2066 or 92% of the initial value, which corresponds to a recovery of 80.8% of the total decrease in discharge. These stage recovery data follow an exponential curve and would have returned to within 0.01 ft of the starting value after 13.5 hours, or shortly after midnight.
The water surface elevation at the Schuyler Avenue gage increases gradually with time. Based on the initial discharge of 2244 cfs and the rating curve with the flashboards in place, the total increase in stage in Six Mile Pool would be 0.60 ft. By 5:30 p.m. the stage had increased 0.55 ft or 92% of the total. The approach to the new stage is asymptotic and follows an exponential curve. The upstream stage will be within 1% or 0.006 ft of its new level in 12 hours or just before 11 p.m.
11

Table 4. Stages during Flashboard In s t a l l a t i on , July 5, 1984
West Station Street Schuyl er Avenue Gage Gage
Time, height Elevation height Elevation Discharge CDT (ft) (ft above msl) (ft) (ft above msl) (cfs)
1800* 0.19 594.50 1804 2.58 584.47 2334 1810 0.26 594.57 1816 2.48 584.37 2205 1821 0.28 594.59 1826 2.35 584.24 1831 0.30 594.61 1837 2.24 584.13 1906 1844 0.32 594.63 1849 2.15 584.04 1854 0.33 594.64 1900 2.11 584.00 1749
* Installation of flashboards begun
12

Table 5. Stages during Flashboard Installation, July 7, 1984
West Gage
Station Street Schuyl Gage
er Avenue
Time, height Elevation height Elevation Discharge CDT (ft) (ft above msl) (ft) (ft above msl) (cfs)
0935 2.51 584.40 2244 0942 0.60 594.91 1010 0.60 594.91 1020 2.51 584.40 1045 Flashboard installation begun 1050 0.61 594.92 1055 2.49 584.38 1105 0.69 595.00 1110 2.30 584.19 1979 1120 0.75 595.06 1125 2.10 583.99 1135 0.75 595.06 1142 1.91 583.80 1516 1200 1.82 583.71 0.82 595.13 1213 1.76 583.65 1215 0.86 595.17 1230 1.75 583.64 0.88 595.19 1317 1245 1.77 583.66 1250 0.95 595.26 1300 1.82 583.71 1415 1315 0.98 595.29 1325 1.89 583.78 1335 1.02 595.33 1345 1.96 583.85 1355 1.04 595.35 1405 2.02 583.91 1701 1422 2.07 583.96 1430 1.06 595.37 1520 2.21 584.10 1869 1528 1.10 595.41 1620 2.30 584.19 1628 1.13 595.44 1720 2.37 584.26 2066 1728 1.15 595.46
13

Figure 5. Time history for second stage installation of flashboards in 1984
14

The 1985 installation of the flashboards took place on May 31 and June 1. Installation of the first half began at 4:15 p.m. (1615) on May 31 and stage data were collected until nearly 2300. The stage data for West Station Street and Schuyler Avenue are given in table 6 and figure 6. The initial discharge was 2753 cfs and the minimum discharge was 2043 cfs which is 74% of the initial discharge. The minimum stage at West Station Street was 0.55 ft lower than before installation started. When data collection was stopped almost 7 hours after installation, the stage had recovered 0.46 ft or 83.6% and the discharge had recovered a similar percentage to 2633 cfs. The stage recovery follows an exponential curve and would have returned to within 0.01 ft of the original stage by about 4:18 a.m., some 12 hours after the starting time.
At the Schuyler Avenue gage above the dam, the stage increases gradually with time. On the basis of the initial discharge of 2753 cfs the total increase in stage for one-half the flashboards would be 0.52 ft. When the last stage reading was recorded, it was 0.46 ft, or 88.5% of the expected change. This stage would have been within 0.01 ft of its new value by 2:05 a.m., or almost 10 hours from the beginning of flashboard installation.
The remainder of the flashboards were installed beginning at 11:32 a.m. (1132) on the next day, June 1. The data are presented in table 7 and figure 7 for this half of the installation. The initial discharge was 2620 cfs, about 8% less than the day before. In fact, the stages before installation began indicate that the river may have been at nearly steady flow conditions when data collection ended the previous evening.
The stage and discharge at West Station Street follow a pattern very similar to that for the first half or for the 1984 second half installation. The maximum drop in stage was 0.72 ft. The minimum discharge was 1719 cfs or 65.7% of the initial discharge. When data collection was terminated 7.5 hours later, the stage had recovered 0.62 ft, or 86.1%, and the discharge had recovered to 2488 cfs which is 85.3% of the maximum decrease. The stage would have returned to within 0.01 ft of its original value by 1:30 a.m., about 14 hours after installation began.
The stage increase upstream of the dam was also similar to the other observations. The total increase in stage based on the initial discharge was 0.58 ft. At the end of data collection, the stage had increased 0.51 ft, 86.3% of the total. This stage would reach 0.01 ft below the projected new stage by 2251, or 12 hours and 19 minutes after the beginning of flashboard installation.
The stage data at both the upstream and downstream gaging locations follow expected patterns after installation of flashboards. The data show that within 12 hours after flashboard installation the pool upstream of the dam has adjusted to the changed discharge characteristics of the dam and that within 13.5 hours the downstream reach between the dam and the West Station Street bridge will have returned to the natural discharge and stage.
15

Table 6. Stages during Flashboard Installation, May 31, 1985
West St ation St. Schuyler Ave. Gage Elevation Gage Elevation height (ft above height (ft above
Time (ft) msl) (ft) msl) 1615 Flashboard install ation be gun 1615 2.90 584.79 0.30 594.61 1630 2.80 584.69 0.39 594.70 1645 2.60 584.49 0.45 594.76 1700 2.50 584.39 0.46 594.77 1715 2.40 584.29 0.47 594.78 1730 2.35 584.24 0.49 594.80 1745 2.35 584.24 0.55 594.86 1800 2.40 584.29 0.59 594.90 1815 2.45 584.34 0.59 594.90 1825 2.45 584.34 1830 0.59 594.90 1835 0.61 594.92 1900 2.54 584.43 1908 0.67 594.98 1930 2.60 584.49 1935 0.69 595.00 2000 2.67 584.56 2005 0.71 595.02 2030 2.71 584.60 2038 0.73 595.04 2115 2.76 584.65 2122 0.74 595.05 2145 2.78 584.67 2245 2.81 584.70 2254 0.76 595.07
16

Figure 6. Time history for first stage flashboard installation in 1985
17

Table 7. Stages during Flashboard Installation, June 1, 1985
West St ation St. Schuyler Ave. Gage Elevation Gage Elevation height (ft above height (ft above
Tine (ft) msl) (ft) msl) 1115 2.80 584.69 0.75 595.06 1130 2.80 584.69 0.76 595.07 1132 Flashboard install ation begun 1145 2.78 584.67 0.83 595.14 1200 2.60 584.49 0.88 595.19 1215 2.31 584.20 0.91 595.22 1230 2.18 584.07 0.93 595.24 1245 2.10 583.99 0.96 595.27 1300 2.08 583.97 1.03 595.34 1315 1.04 595.35 1330 2.14 584.03 1340 1.10 595.41 1350 2.22 584.11 1400 2.24 584.13 1408 1. 12 595.43 1430 2.32 584.21 1435 1.16 595.47 1500 2.40 584.29 1508 1. 19 595.50 1530 2.47 584.36 1537 1.21 595.52 1600 2.53 584.42 1607 1.23 595.54 1630 2.58 584.47 1636 1.25 595.56 1700 2.62 584.51 1730 2.64 584.53 1736 1.26 595.57 1830 2.68 584.57 1837 1.27 595.58 1900 2.70 584.59
18

Figure 7. Time history for second stage flashboard installation in 1985
19

SUMMARY
The West Station Street bridge is a good site for discharge measurements and has a stable rating curve over the range of observed flow conditions. The measured discharges and stages were used to compute rating equations for the Kankakee Dam with and without the 15-inch-high flashboards in place. The rating equations both have correlation coefficients over 0.99, and are quite accurate within the range of measurements. Any extrapolation of these ratings to higher stages and discharges should be done only with caution.
REFERENCES
Bradley, J.N. 1952. Discharge coefficients for irregular overfall spillways. U.S. Bureau of Reclamation Engineering Monograph No. 9, Denver, CO.
Buchanan, T.J. and W.P. Somers. 1969. Discharge measurements at gaging stations. Chapter A8, Book 3, Techniques of Water-Resources Investigations of the U.S. Geological Survey, Washington, D.C.
Carter, R.W. and J. Davidian. 1968. General procedure for gaging streams. Chapter A6, Book 3, Techniques of Water-Resources Investigations of the U.S. Geological Survey, Washington, D.C.
20


![· 2018-01-31 · view riser pipe w/anchc]red base freeboard 1' spillway depth emergency overflow spillway crest aaa outlet pipe plan provide trash rack on pipes it" diameter and](https://img.dokumen.tips/doc/110x75/5e7a28dae4b1b5308c171f3d/2018-01-31-view-riser-pipe-wanchcred-base-freeboard-1-spillway-depth-emergency.jpg)