Embed Size (px)
Citation preview

October 2006 Prepared for The Florida Senate Prepared by Committee on Finance and Tax
State Revenues Shared with Local Governments: A State-by-State Comparison
Report Number 2007-123


Table of Contents Background 1
Florida State Revenues Shared with Local Governments 1 Legislative History 1 Local Government Half-cent Sales Tax Program 1 Florida Revenue Sharing Act 3 Motor and Special Fuel Taxes 6 Gross Receipts Tax 9 Motor Vehicle License Tax 9 Mobile Home Licenses Tax 10 Pari-Mutuel Tax 10 Communications Services Tax 11 Beverage License Tax 12 Insurance License Tax 12 Vessel License Tax 12 Solid Minerals Severance Tax 13 Oil and Gas Tax 14
Methodology 15 Findings 16
Ten-Year History of Florida’s State Shared Revenues 16 A State-by-State Comparison of State Shared Revenues 19
Conclusions 22 Appendixes 23 Appendix A – Local Government Half-Cent Sales Tax Distributions 25 Appendix B – 10 Year History of Florida’s State Shared Revenues with Counties, Cities and School Districts, FY 1996-97 to FY 2005-06 37 Appendix C – State Revenues Shared with Local Governments: State-by-State Comparison, 2005 Fiscal Year 39

State Revenues Shared with Local Governments: A State-by-State Comparison
Page 1
Background Florida State Revenues Shared with Local Governments The State of Florida shares a variety of state revenue collections with cities, counties, and school districts. The sharing of state revenues began in 1931, with the sharing of 3-cents per gallon of the state’s motor fuel tax with counties.1 In fiscal year 2005-06, state shared revenues equaled $3.8 billion. The majority of the $3.8 billion is made up of sales and use tax, gross receipts tax, motor and special fuel taxes, and motor vehicle license tax revenues.
Legislative History
Local Government Half-cent Sales Tax Program The Local Government Half-cent Sales Tax Program, which was created in 1982,2 is the largest of the state-shared revenues authorized by the Legislature. The general state sales tax rate was increased from 4 percent to 5 percent effective May 1, 1982, and for the first time, a portion of the proceeds were distributed annually to eligible municipalities and county governments.3 Each participating county or municipal government received one-half of the 1 cent increase in the sales and use tax, referred to as the “local government half-cent sales tax.”4 The program’s primary purpose is to provide relief from ad valorem and utility taxes in addition to providing counties and municipalities with revenues for local programs.5 The half-cent sales tax program consists of three distributions of state sales tax revenue collections. The ordinary distribution equals 8.714 percent of net sales tax proceeds and is deposited into the Local Government Half-cent Sales Tax Clearing Trust Fund.6 The emergency and supplemental distributions equal 0.095% of net sales tax proceeds.7 In 1994, the emergency distribution to counties was changed from an annual General Revenue appropriation of not less than $5.5 million to 0.054 percent of net sales tax proceeds.8 Section 92 of ch. 2003-402, L.O.F., changed the emergency distribution to the current rate of 0.095%. Only those counties and municipal governments that meet eligibility requirements for
1 Section 3 of ch. 15659, 1931, L.O.F. 2 Section 10 of ch. 82-154, L.O.F. 3 Deposits into the Local Government Half-cent Sales Tax Clearing Trust Fund began on October 1, 1982. 4 Section 10 of ch. 82-154, L.O.F. 5 FLCIR, 2005 Local Government Financial Information Handbook, p. 61. 6 Section 212.20(6)(d)3., F.S. 7 Section 212.20(6)(d)4., F.S. 8 Section 1 of ch. 94-245, L.O.F.
State Revenues Shared with Local Governments: A State-by-State Comparison
Page 2
revenue sharing pursuant to s. 218.23, F.S., may participate in the program.9 (See Appendix A, Local Government Half-cent Sales Tax Revenue Estimates for the Local Fiscal Year Ending September 30, 2006.) Effective January 1, 1988, the general state sales tax rate was increased from 5 percent to the current rate of 6 percent and the ordinary distribution of the half-cent sales tax was increased from 9.697 percent to 9.888 percent.10 Beginning October 1, 1992, the ordinary distribution to local governments was reduced from 9.88 percent to 9.664 percent and beginning July 1, 1993, the rate was reduced further to 9.653 percent.11 Effective July 1, 2003, the ordinary distribution was reduced by 0.1 percent. The 0.1 percent is distributed to the Public Employees Relations Commission Trust Fund, less $5,000 each month. The $5,000 each month is distributed to qualified counties pursuant to s. 218.65, emergency distribution.12 In 2003, the sales tax distributions to the Local Government Half-cent Sales Tax Clearing Trust Fund were changed in order to provide funding for the judicial system. Effective July 1, 2004, distributions were changed as follows: the ordinary distribution was reduced from 9.653 percent to 8.814 percent; and the emergency and supplemental was increased from 0.065 percent to 0.095 percent.13 Each participating county or municipality government receives a portion of the local government half-cent sales tax. The allocation factor for each county government is computed by dividing the sum of the incorporated area population plus two-thirds of the incorporated area population by the sum of the total county population plus two-thirds of the incorporated area population.14 The allocation factor for each municipal government is computed by dividing the population of that municipality by the sum of the total county population plus two-thirds of the incorporated area population.15 The proportion of the local government half-cent sales tax received by a county government based on two-thirds of the incorporated area population is deemed countywide revenues is to be expended only for countywide tax relief or countywide programs. The remaining county government portion is deemed county revenues derived on behalf of the unincorporated area but maybe expended on a countywide basis.16 Municipalities must expend their portions of the local government half-cent sales tax for municipal-wide programs or for
9 Section 218.63(1), F.S. 10 Section 42 of ch. 87-548, L.O.F. 11 Section 18 of ch. 92-319, L.O.F. 12 Section 1 of ch. 2003-404, L.O.F. 13 Section 92 of ch. 2003-402, L.O.F. 14 Section 218.62(2), F.S. 15 Section 218.62(3), F.S. 16 Section 218.64(1), F.S.

State Revenues Shared with Local Governments: A State-by-State Comparison
Page 3
municipal-wide property tax or municipal utility tax relief. All utility tax rate reductions afforded by participation in the local government half-cent sales tax program are to be applied uniformly across all types of taxed utility services.17 A local government is authorized to pledge proceeds of the local government half-cent sales tax for the payment of principal and interest on any capital project.18 Total distributions to the Local Government Half-cent Sales Tax Clearing Trust Fund for state fiscal year 2005-06 were $1,731,888,409 - $1.149.2 million to counties and $582.7 million to municipalities.19
Florida Revenue Sharing Act Chapter 72-360, Laws of Florida, created the Florida Revenue Sharing Act of 1972, which was a major attempt by the Legislature to ensure a minimum level of revenue parity across units of local governments.20 The Revenue Sharing Act placed three shared tax sources for cities and two shared tax sources for counties into a “revenue sharing program.” State revenues deposited in the Revenue Sharing Trust Fund for Municipalities were 32.4 percent of the cigarette tax,21 the 1 cent municipal fuel tax,22 and the alternative fuels tax.23 State revenues deposited in the Revenue Sharing Trust Fund for Counties were 37.7 percent of the intangibles tax24 and 2.9 percent of the cigarette tax.25 These distributions continued from July 1, 1972, through June 30, 2001, when the cigarette tax and intangibles tax revenues were replaced by sales tax revenue. Florida began collecting the intangibles tax in 1931 at the rate of 2 mills annually on stocks and bonds, 2 mills on mortgages at time of recordation, and 1/10 of one mill on money. Revenues were deposited into the General Revenue Fund.26 In 1941, the intangibles tax rates were changed to 1 mill on stocks and bonds, 3 mills on mortgages, and 1/20 mill on money with the tax revenues used to fund county tax assessors and collectors and the remainder divided 75 percent to General Revenue and 25 percent to the county where collected.27 In 1951, the tax rate on mortgages was reduced to 2 mills,28 and in 1955, the disposition of the intangibles
17 Section 218.64(2), F.S. 18 Section 212.64(3), F.S. 19 Source: Florida Department of Revenue 20 Florida Legislative Committee on Intergovernmental Relations (FLCIR), 2005 Local Government Financial Information Handbook, pgs. 43 and 81. 21 Section 210.20(2)(a), F.S. (repealed by s. 29 of ch. 2000-355, L.O.F.) 22 Sections 206.605(1) and 206.875(2), F.S. 23 Section 206.879(1), F.S. 24 Section 199.292(4), F.S. (repealed by s. 8 of ch. 2000-173, L.O.F.) 25 Section 210.20(2)(a), F.S. 26 Chapter 15789, 1931, L.O.F. 27 Section 13 of ch. 20769, 1941, L.O.F. 28 Section 1 of ch. 26769, 1951, L.O.F.

State Revenues Shared with Local Governments: A State-by-State Comparison
Page 4
tax was changed to pay for retirement of state and county officers and employees, with the balance going to the General Revenue Fund.29 The intangibles tax on money was increased from 1/20 of one mill to 1/10 of one mill and the tax on stocks and bonds was increased from 1 mill to 2 mills in 1957.30 Effective January 1, 1962 through December 31, 1963, the tax on stocks and bonds was reduced to 1.5 mills and dropped to 1 mill effective January 1, 1964.31 In 1967, 55 percent of net collections was shared with counties where collected.32 Chapter 71-987, Laws of Florida, repealed the intangibles tax on money, effective July 1, 1972. The Revenue Sharing Act of 1972 provided that the 55 percent of intangibles tax revenue be transferred to counties through a revenue sharing formula.33 Chapter 74-237, Laws of Florida, provided a $20,000 exemption for the annual tax for all taxpayers. Chapter 90-132, Laws of Florida, increased the annual tax from 1 mill to 1.5 mills, with a $100,000 exemption per person and spouse against the additional .5 mill. In addition, the tax base was broadened to include interest in certain limited partnerships. The distribution was changed in 1990 from 55 percent to 41.3 percent to the Revenue Sharing Trust Fund for Counties and from 45 percent to 58.7 percent to the General Revenue Fund, essentially allowing the state to retain the full amount of increased revenues. Again in 1992, the annual tax was increased from 1.5 mills to 2 mills with banks and savings associations being exempt from the additional .5 mill. The intangibles tax distribution was changed from 41.3 percent to 33.5 percent to the Revenue Sharing Trust Fund for Counties and from 58.7 percent to 66.5 percent to the General Revenue Fund.34 In 1998, the Legislature exempted one-third of accounts receivable from the intangibles tax beginning January, 1999.35 The distribution rate was again changed to 35.3 percent for the Revenue Sharing Trust Fund for Counties for fiscal year 1998-99, and 37.7 percent for fiscal year 1999-2000.36 In 1999, the Legislature reduced the annual tax on intangible assets to a 1.5 mill tax rate, and increased the exemption for accounts receivable to two-thirds, but did not change distribution percentages. Chapter 2000-173, Laws of Florida, reduced the annual tax rate to 1 mill and fully exempted accounts receivable from the tax. The law also repealed the revenue sharing of intangibles tax with counties, and replaced the revenue with a 2.25 percent distribution of net sales tax revenues, effective July 1, 2000.
29 Section 1, ch. 29929, 1955, L.O.F. 30 Section 1 of ch. 57-399, L.O.F. 31 Section 1 of ch. 61-159, L.O.F. 32 Section 2 of ch. 67-411, L.O.F. 33 Section 18 of ch. 72-360, L.O.F. 34 Sections 1, 2 & 3 of ch. 92-319, L.O.F. 35 Section 6 of ch. 98-132, L.O.F. 36 Section 10 of ch. 98-132, L.O.F.

State Revenues Shared with Local Governments: A State-by-State Comparison
Page 5
Florida began taxing cigarettes at 3 cents per package of twenty cigarettes in 1943.37 Rates were increased in 1949, 1963, 1968, 1971, 1986, and finally in 1990 to the current rate of 33.9 cents per pack.38 Chapter 26320, 1949, Laws of Florida, authorized a municipal cigarette tax of up to the total state tax rate with a corresponding credit on the state cigarette tax. The municipal cigarette tax was imposed at the rate of 2 cents per pack. Each municipality imposing the municipal cigarette tax was required to reduce ad valorem taxes. The state cigarette tax pursuant to s. 210.02, Florida Statutes, was increased to 11 cents per pack in 1968; two cents of the state cigarette tax was deposited in the Municipal Financial Assistance Trust Fund and 27 percent of state collections from unincorporated areas was distributed to counties. An additional state cigarette tax of 4 cents per package became effective April 1, 1968, with all proceeds going to the General Revenue Fund.39 Chapter 71-344, Laws of Florida, imposed an additional 2 cents per package cigarette tax, the proceeds of which were deposited into the General Revenue Fund from July 1, 1971 through September 30, 1971. Beginning October 1, 1971 and thereafter, the proceeds were deposited into the Municipal Financial Assistance Trust Fund. The Revenue Sharing Act of 1972 repealed the municipal authority to levy a cigarette tax and allocated 11/17 cents per pack to the Revenue Sharing Trust Fund for Municipalities; 2/17 cents per pack to the Municipal Financial Assistance Trust Fund; 1.17 cents per pack to the Revenue Sharing Trust Fund for Counties; and 3/17 cents per pack to the General Revenue Fund.40 (s. 210.20, F.S.) As the state cigarette tax increased, local government distribution percentages were also increased. Cigarette tax collections have been decreasing since 1998-99, resulting in a decrease of cigarette tax revenues to the Revenue Sharing Trust Fund for Municipalities (until replaced by sales tax in 2000) and the Revenue Sharing Trust Fund for Counties. Also, with the reduction in the annual intangibles tax rate on stocks and bonds, the elimination of the tax on accounts receivable, and the granting of additional exemptions, the revenues to the Revenue Sharing Trust Fund for Counties from the intangibles tax began decreasing in fiscal year 1998-99. Chapter 2000-355, Laws of Florida, restructured the Revenue Sharing Trust Fund for Municipalities, eliminating the 32.4 percent cigarette tax distribution to the Revenue Sharing Trust Fund for Municipalities and the 5.8 percent distribution to the Municipal Financial Assistance Trust Fund, transferring the portion of the cigarette tax that previously funded these trust funds to the General Revenue Fund, and provided a distribution of 1.0715 percent of sales and use tax collections to the Revenue Sharing Trust for Municipalities. Likewise, ch. 2000-173, Laws of Florida, eliminated the sharing of intangibles tax revenues with
37 Section 1 of ch. 21946, 1943. 38 Chapters 26320, 1949; 63-480; 68-30; 72-360; 86-123; and 90-132, L.O.F.. 39 Chapter 68-30, L.O.F. 40 Section 8 of ch. 72-360, L.O.F.

State Revenues Shared with Local Governments: A State-by-State Comparison
Page 6
counties41 and provided for a distribution of 2.25 percent of sales and use tax collections to the Revenue Sharing Trust Fund for Counties. Chapter 2003-402, Laws of Florida, changed sales tax distributions to local governments because of constitutionally mandated realignment funding for the state court system. Effective July 1, 2004, sales tax distributions were changed as follows: the ordinary distribution was reduced from 9.563 percent to 8.814 percent; the emergency distribution was increased from 0.065 percent to 0.095 percent; the distribution to the Revenue Sharing Trust Fund for Counties was decreased from 2.25 percent to 2.0440 percent; and the distribution to the Revenue Sharing Trust Fund for Municipalities was increased from 1.0715 percent to 1.3409 percent to offset municipalities’ losses from the ordinary distribution reduction. There are no restrictions placed on the local government’s uses of sales tax revenues distributed as revenue sharing, except for a limitation on the amount which may be pledged for debt service. In 1984, the Legislature imposed a fee on alternative fuels, twenty-five percent of which is transferred to the Revenue Sharing Trust Fund for Municipalities. (See Motor and Special Fuels Taxes for legislative history.) Total revenue sharing for fiscal year 2005-06 to the Revenue Sharing Trust Fund for Municipalities was: • 1-cent motor and special fuel tax - $94.1 million • 1.0715 percent of net sales tax revenues - $253.2 million • 25 percent of collections of the Alternative Fuel User Fee - $1.2 million Total revenue sharing for fiscal year 2005-06 to the Revenue Sharing Trust Fund for Counties was: • 1-cent cigarette tax - $11.4 million • 2.044 percent of net sales tax revenues - $386.0
Motor and Special Fuel Taxes Florida began taxing gasoline in 1921, at the rate of 1 cent per gallon. In 1923, gasoline taxes were levied at the rate of 3 cents per gallon, with 2 cents per gallon going to the state for the use of the State Road Department and 1 cent per gallon being equally distributed between counties.42 In 1925, gasoline taxes were increased to 4 cents per gallon, with 3 cents per gallon going to the state for the use of the State Road Department and 1 cent per gallon being equally distributed
41 Section 8 of ch. 2000-173, L.O.F. 42 Section 1 of ch. 9120, 1923, L.O.F..

State Revenues Shared with Local Governments: A State-by-State Comparison
Page 7
between counties.43 Effective July 1, 1931, the state gasoline tax totaled 6 cents per gallon. The 6 cents consisted of the 3 cents First Gas Tax, which was paid into the “State Road License Fund” of the State Road Department44 and the 3 cents Second Gas Tax, which was paid into the “State Road Distribution Fund” for use by counties.45 Effective July 1, 1933, a 1 cent Emergency Gas Tax was imposed for deposit into the General Revenue Fund.46 Chapter 20554, 1941, Laws of Florida, enacted similar taxation of special fuels, commonly referred to as diesel fuel. In 1941, the Legislature adopted a temporary additional one cent per gallon gas tax, requiring one-half of the additional one cent per gallon tax to be deposited into the County School Fund.47 This additional one cent per gallon gas tax was scheduled for repeal on June 30, 1943.48 However, the one cent per gallon gas tax was extended through June 30, 1945 pursuant to ch. 21639, 1943, L.O.F.; extended again through June 30, 1947 pursuant to ch. 22822, 1945, L.O.F.; and extended again through June 30, 1949 pursuant to ch. 24172, 1947, L.O.F. Chapter 25266, 1949, L.O.F., extended the one cent per gallon gas tax through June 30, 1951, but deposited all of the revenue into the General Revenue Fund. During a 1949 Special Session, the Legislature made the 1 cent per gallon gas tax permanent by creating s. 208.44, Florida Statutes, and distributed the proceeds in the same manner as the second gas tax.49 Section 2 of ch. 57-162, Laws of Florida, changed the designation of the 6 cents gas tax, but kept the distribution the same, resulting in more gas tax revenue going to the state and less to counties. The First Gas Tax became 4 cents and the Second Gas Tax became 2 cents. In 1961, the 7th cent gas tax trust fund was created for deposit of the additional 1 cent gas tax pursuant to s. 208.44, Florida Statutes.50 Chapter 71-212, L.O.F., provided for the return to the counties of that portion of the seventh cent gas tax which was remitted to the state Department of Transportation. Section 206.60, Florida Statutes, provides for the distribution of the 7th cent or “county fuel tax.” Proceeds from the county fuel tax must be used for transportation-related purposes only. Effective July 1, 1971, the Legislature enacted an additional 1 cent per gallon tax on motor fuel and special fuel called the “8th cent” tax, which was shared with municipalities beginning October 1, 1972. From July 1, 1971 through September
43 Section 1 of ch. 10025, 1925, L.O.F. 44 The State Road Department was the precursor to the Department of Transportation. 45 Chapter 15659, 1931, L.O.F. 46 Sections 1, 16 of ch. 16250, 1933, L.O.F. 47 Section 1 of ch. 20228, 1941, L.O.F. 48 Section 14 of ch. 20228, 1941, L.O.F. 49 Chapter 25266, 1949, L.O.F. 50 Section 3 of ch. 61-119, L.O.F.

State Revenues Shared with Local Governments: A State-by-State Comparison
Page 8
30, 1972, the proceeds from the 8th cent tax was used to fund the Florida Highway Patrol. Beginning October 1, 1972, the revenue from the 8th cent motor fuel tax was deposited in the “local government distribution trust fund” and apportioned in the following ratio: fifty percent based on the ratio of the total “second gas tax” collected on retail sales or use in each county to the total collected in all counties of the state during the previous fiscal year and fifty percent based on the ratio that the total population of the county bears to the total population of the state. Each county’s allocation was then apportioned as follows: each incorporated municipality received that portion of the county total in a ratio that its population bears to the total population of the county, and the balance of the county’s share was paid to the board of county commissioners. The funds could only be used for transportation-related activities. Municipalities levying more than 10 mills, except for debt service or other special millages, on July 1, 1971, were required to reduce their operating millages for their fiscal year 1971-72 by the number of mills that would have been necessary to raise eighty percent of the revenues replaced for the period October 1, 1971 to October 1, 1972.51 The Florida Revenue Sharing Act of 1972 directed that the additional 8th cent tax on motor fuel be deposited into the Revenue Sharing Trust Fund for Municipalities.52 (s. 206.605, F.S.) Chapter 83-3, Laws of Florida, changed the name of the second gas tax to the constitutional gas tax. In 1987, all of the proceeds from the constitutional gas tax were credited to each county to meet debt service requirements pursuant to s. 16, Art. IX and s. 9(c), Art. XII of the State Constitution. (s. 206.47, F.S.) In 1984, the Legislature imposed a fee on alternative fuels. (s. 206.877(1), F.S.) Effective January 1, 1985, in lieu of paying the excise tax on special fuels pursuant to s. 206.87, Florida Statutes, the owner or operator of a motor vehicle powered by alternative fuels shall pay a state alternative fuel fee for each 1 cent of local option tax imposed in the county ranging from $44 to $84 depending on type and weight of vehicle and a local alternative fuel fee for each 1 cent of local option tax imposed in the county ranging from $11 to $21.53 The state alternative fuel fee was increased effective January 1, 1991, to rates ranging from $1.10 to $2.10.54 The state alternative fuel fee is distributed as follows: fifty percent to the State Board of Administration for distribution pursuant to s. 16, Art. IX of the State Constitution of 1885, as amended, which monies are distributed to counties; twenty-five percent of the state alternative fuel fee is transferred to the Revenue Sharing Trust Fund for Municipalities and the remaining twenty-five percent is
51 Chapter 71-363, L.O.F. 52 Section 16 of ch. 72-360, L.O.F. 53 Effective July 1, 1996, imposition of local option fuel taxes was changed from ch. 336 to s. 206.87(1), F.S. 54 S. 11 of ch. 90-136, L.O.F.
State Revenues Shared with Local Governments: A State-by-State Comparison
Page 9
distributed to counties in the same manner as the 1-cent County Gas Tax.55 Alternative fuel fee revenues can only be used for transportation-related purposes. Fiscal year 2005-06 shared fuel tax revenues were as follows: • 2-cent Constitutional Gas Tax: $210.9 million • 1-cent County Gas Tax: $92.6 million • 1-cent Municipal Gas Tax: $94.1 million (Revenue Sharing Trust Fund for
Municipalities) • Alternative Fuels Tax: $1.2 million (Revenue Sharing Trust Fund for
Municipalities)
Gross Receipts Tax The gross receipts tax was enacted in 1931 at the rate of 1.5 percent on the gross receipts of electric, gas, and telephone companies.56 In 1963, collections were earmarked by constitutional amendment for funding capital outlay needs of the universities and junior colleges and for revenue bonds. A 1974 amendment to the State Constitution opened up use of these funds to include public schools and authorized the issuance of general obligation bonds in lieu of the former authorized for revenue bonds only.57 Section 14 of ch. 90-132, Laws of Florida, increased the gross receipts tax to 2.5 percent over a three year period: 2.0 percent effective July 1, 1990; 2.25 percent effective July 1, 1991; and 2.5 percent effective July 1, 1992. In addition, the base was expanded to include certain co-generated electrical power transmission. The definition of telecommunications was changed as part of the communications services tax and effective October 1, 2001 and the gross receipts tax rate on telecommunication services, including cable and direct satellite television, was set at 2.37 percent.58 The gross receipts tax is imposed pursuant to s. 203.01, Florida Statutes. Gross receipts tax distributions to school boards for fiscal year 2005-06 were $975.8 million.
Motor Vehicle License Tax Florida began annual motor vehicle licensing in 1917.59 In 1930, a constitutional amendment was adopted exempting motor vehicles from ad valorem taxes.60 Constitutional earmarking of the first proceed of the revenues derived from the licensing of motor vehicles in an amount required to meet fixed capital outlay
55 Section 206.60(1), F.S. 56 Sections 1,2 of ch. 15658, L.O.F. 57 Section (9)(a), Art.XII of the State Constitution 58 Sections 41, 44 of ch. 2000-260, L.O.F. 59 Section of ch. 7275, 1917, L.O.F. 60Section 1(b), Art. VII of the State Constitution

State Revenues Shared with Local Governments: A State-by-State Comparison
Page 10
needs of local school districts was approved in November 1952.61 The constitution was further amended in 1965 to expand the definition of “motor vehicles” to include mobile homes, house trailers, camper-type mobile homes and similar type vehicles, if such vehicles are not attached to the land.62 Motor vehicle license taxes are imposed pursuant to s. 320.08, Florida Statutes, and s. 320.20, Florida Statutes, provides for the disposition of the license tax revenues. Fiscal year 2005-06 revenues from motor vehicle license taxes to school districts were $118.9 million.
Mobile Home Licenses Tax A portion of mobile home license taxes was distributed to local governments effective July 1, 1973. Mobile home license tax revenues, less $1.50 collected on each license, is distributed to the counties and cities within the counties wherein the mobile homes are located as follows: one-half to the county school board and the remainder either to the board of county commissioners for the mobile homes which are located within the unincorporated areas of the county, or to any city within such county for the mobile homes which are located within its corporate limits.63 (Section 320.081(4), F.S.) Fiscal year 2005-06 revenues from mobile home licenses totaled $19.4 million: $9.7 million to school boards; $5.1 million to counties; and $4.7 million to cities.
Pari-Mutuel Tax Pari-mutuel wagering in Florida was first authorized in 1931.64 Section 7, Art. VII of the State Constitution provides that “Taxes upon the operation of pari-mutuel pools may be preempted to the state or allocated in whole or in part to the counties. When allocated to the counties, the distribution shall be in equal amounts to the several counties.” Section 4151(61), Florida Statutes, provided that 90 percent of pari-mutuel tax revenue shall be divided into as many equal parts as there are counties in the state.65 Pari-mutuel revenues can be used at the discretion of the county.66 The Legislature in 1971, placed a ceiling of $446,500 on the amount of racing revenues distributed to each county, for a statewide total of $29,915,500.67 Section 3 of ch. 2000-354, Laws of Florida, designated the $29.9 million paid annually to counties to be deposited directly into the General Revenue Fund rather than the Pari-mutuel Trust Fund. Section 212.20(6)(d)7., Florida Statutes, was amended to distribute $29,915,500 in sales tax revenues 61 Section 9.(d)(3), Art. XII of the State Constitution 62 Section 1 of ch. 65-446, L.O.F. 63 Section 2 of ch. 73-343, L.O.F. 64 Chapter 14832, 1931, L.O.F. 65 Ib., s.12 66 Ib., s.13 67 Section 550.135(1), L.O.F.

State Revenues Shared with Local Governments: A State-by-State Comparison
Page 11
annually to counties to replace the loss of the $29.9 million in pari-mutuel revenues.68
Communications Services Tax Prior to 2001, nonresidential telecommunications services were subject to sales and use tax under chapter 212 at the rate of 7 cents. Cable television and direct satellite television were subject to sales and use tax at the rate of 6 percent. Chapter 2000-260, Laws of Florida, created chapter 202, the Communications Services Simplification Tax, which provided for a new statewide tax on communications services to replace the sales and use tax on telecommunications services, cable and direct satellite. The communications services tax of 6.8 percent is imposed on the retail sales of communications services which originate and terminate in Florida, or originate or terminate in Florida and are billed to a Florida address. Communications services include all forms of telecommunications previously taxed by the gross receipts tax plus cable television and direct-to-home satellite service. Direct-to-home satellite services are taxed at the rate of 10.8 percent. Except for the tax on direct-to-home satellite service, the state communications services tax collections are distributed by the same formula as the sales and use tax, pursuant to s. 212.20(6), F.S. Sixty-three percent of the tax on direct-to-home satellite is distributed by the sales tax formula and the remainder (37%) is transferred to the Local Government Half-Cent Clearing Trust Fund and allocated in the same proportion as the half-cent sales tax under s. 218.61, F.S., and the emergency distribution under s. 218.65, F.S.69 Chapter 2006-229, Laws of Florida, changed the distribution of the communications services tax on direct-to-home satellite service. Seventy percent of the 37 percent is allocated in the same proportion as the half-cent sales tax under s. 218.61, F.S. The remaining 30 percent of the 37 percent is distributed pursuant to newly created s. 218.67, F.S. Section 218.67, F.S., provides for a distribution to fiscally constrained counties, which are defined as each county that is entirely within a rural area of critical economic concern pursuant to s. 288.0656, F.S., or each county for which the value of a mill will raise no more than $5 million in revenue. The source of this distribution is a state tax on satellite TV service which cannot be levied by local governments. Since its enactment in 2001, the revenues have grown dramatically. The group of counties receiving the new share of this revenue tend to be poorer and rural, so they can be expected to have a disproportionate share of satellite subscribers. These revenues may be used by a county for any public purpose, except that such revenues may not be used to pay debt services on bonds, notes, certificates or participation, or any other forms of indebtedness.
68 Section 3 of ch. 2000-354, L.O.F. 69 Section 202.18, F.S.

State Revenues Shared with Local Governments: A State-by-State Comparison
Page 12
Beverage License Tax The State of Florida began assessing an annual state license tax on manufacturers, distributors, vendors, brokers, sales agents, and importers of alcoholic beverages in 1935.70 Effective July 1, 1971, a portion of the annual state beverage license taxes levied on such manufacturers, distributors, vendors, brokers, sales agents, and importers of beer, wine and liquor collected within a county or municipality in Florida was shared with those local governments. Pursuant to s. 561.342, Florida Statutes, twenty-four percent of the license taxes imposed under s. 561.34, subsections (1), (2), (3), (6), (7) and s. 561.35, collected within an incorporated county shall be returned to the county. Thirty-eight percent of the license taxes imposed under s. 561.34, subsections (1), (2), (3), (6), (7) and s. 561.35, collected within an incorporated municipality shall be returned to the municipality.71 Beverage license tax revenues may be used at the discretion of the local government. Fiscal year 2005-06 beverage license tax revenue distributions were $6.1 million to counties and $6.8 million to cities.
Insurance License Tax In 1903, the State of Florida imposed a $5 annual state license tax on the original appointment and renewal of insurance representatives and agents selling various types of insurance products in Florida.72 In 1959, a county license tax of $3.00 was levied by the state in addition to the state license tax73 and increased to $6.00 in 1982.74 The county tax is paid by each insurer for each agent only for the county where the agent resides. Section 624.505, Florida Statutes, requires the Department of Financial Services to deposit the county license tax in the Agents County Tax Trust Fund. In fiscal year 2005-06, $5.2 million was deposited into the Agents County Tax Trust Fund for use by the county.
Vessel License Tax In lieu of property taxes, vessels must be registered and numbered in Florida. Section 328.70, Florida Statutes, imposes annual vessel registrations, which began in 1965, based on the length of the vessel. In addition to the state registration tax, a county license tax was also adopted, ranging in rates from $1.00 to $72.50, which was distributed back to the county where registered.75 In 1970, state vessel
70 Section 4 of ch. 16774, 1935, L.O.F. 71 Section 6 of ch. 71-361, L.O.F. 72 Section 23 of ch. 5106, 1903, L.O.F. 73 Section 74 of ch. 59-205, L.O.F. 74 Section 65 of ch. 82-243, L.O.F. 75 Chapter 65-361, L.O.F.
State Revenues Shared with Local Governments: A State-by-State Comparison
Page 13
registration fees were increased by $1.00 while county registration fees were decreased by $1.00.76 Effective June 1, 1989, both state and county vessel registration fees were increased.77 Until 2000, the Department of Highway Safety and Motor Vehicles (prior to 1995, the Department of Environmental Protection) collected all vessel registration fees through county tax collectors for distribution of the county license tax back to the county. In 2000, the Legislature authorized the tax collector to distribute the county portion of vessel registration fees directly to the board of county commissioners.78 County vessel registration fee revenues must be used for boat-related activities and manatee and marine mammal protection and recovery.79 In fiscal year 2005-06, $8.1 million was retained by counties in vessel registration fees.
Solid Minerals Severance Tax Pursuant to Part II of chapter 211, Florida Statutes, a severance tax is levied upon every person engaging in the business of severing phosphate rock from the soils or waters of Florida for commercial use.80 Counties where phosphate rock is severed began receiving severance tax revenues in 1982 at the rate of 5 percent of the number of tons of phosphate rock produced.81 Distributions to counties have changed many times since 1982. The current distributions of severance tax on phosphate after the first $10 million is distributed to the Conservation and Recreation Lands Trust Fund are as follows: • 40.1 % to the General Revenue Fund; • 16.5 % to the County where mined; • 9.3 % to the Phosphate Research Trust Fund; • 10.7 % to the Minerals Trust Fund; • 10.4 % to the Nonmandatory Land Reclamation Trust Fund; and • 13.0% to counties that have been designated a Rural Area of Critical
Economic Concern. Counties receiving 16.5 percent pursuant to s. 211.3103(3)(b)2., Florida Statutes, must use the proceeds for phosphate-related expenses. Payments to counties designated a rural area of critical economic concern may be used for planning, preparing, and financing of infrastructure projects for job creation and capital investment; maximizing the use of federal, local, and private resources; and projects that improve inadequate infrastructure that has resulted in regulatory
76 Section 4 of ch. 70-336, L.O.F. 77 Section 3 of ch. 88-336, L.O.F. 78 Section 31 of ch.362, L.O.F. 79 Section 328.72 (15), F.S. 80 Chapter 71-105, L.O.F. 81 Section 1 of ch. 82-184, L.O.F.

State Revenues Shared with Local Governments: A State-by-State Comparison
Page 14
action that prohibits economic development or community growth, if such projects are related to specific job creation or job retention opportunities.82 Distributions to counties for fiscal year 2005-06 from the phosphate severance tax were $ 10.0 million.
Oil and Gas Tax Part I of Chapter 211, Florida Statutes, imposes an excise tax on every person who extracts gas, oil, or sulfur for sale or transport, storage, profit, or commercial use. The tax rate is calculated separately for oil, gas, or sulfur; however, the tax rates are all based on the volume of oil, gas, or sulfur produced in a particular month. The severance taxation of oil and gas began in Florida in 1945 at the rate of 5 percent. Tax revenues were distributed 80 percent to the General Revenue Fund and 20 percent to the county in which the oil and gas was produced for use by the General Revenue Fund of the Board of County Commissioners.83 In 1977, the tax rate on oil was increased to 8 percent.84 Sulfur production became subject to tax July 1, 1986.85 Distributions of oil, gas and sulfur tax revenues have been changed many times since 1945. The revenues generated from these taxes may be used at the discretion of the governing body of the county. The current distributions of the oil, gas and sulfur tax are as follows: 8% oil tax: 75% to the General Revenue Fund 12.5 % to the County in which produced 12.5 % to the Minerals Trust Fund 5% Oil, gas, sulfur tax: 67.5% to the General Revenue Fund 20.0% to the County in which produced 12.5% to the Minerals Trust Fund Distributions to counties for fiscal year 2005-06 from the oil, gas and sulfur tax were $ 1.3 million.
82 Section 211.3103(5), F.S. 83 Sections 1, 2 of ch. 22784, 1945, L.O.F. 84 Section 1 of ch. 77-408, L.O.F. 85 Section 4 of ch. 86-178, L.O.F.
State Revenues Shared with Local Governments: A State-by-State Comparison
Page 15
Methodology A legislative review was done of Florida’s revenue sharing program and the following state revenues shared with local governments: motor and special fuels; sales and use tax; cigarette taxes; gross receipts tax; motor vehicle taxes; pari-mutuel taxes; motor boat license fees; mobile home licenses; beverage license fees; communications services tax; insurance license fees; severance taxes and oil and gas taxes. A ten-year history of Florida state tax revenues shared with local governments was developed and a survey was sent to the Department of Revenue of the forty-nine additional states, asking for fiscal year 2005 revenue data. The survey asked the following questions about a variety of taxes, licenses and fees:
1. Total “Own-source” state revenue collections. 2. Total revenue collections for state taxes, licenses and fees that are shared
with local governments and the distribution amounts to those local governments..
3. Can state shared revenues be bonded or used for debt service by the local government?
4. Are the shared revenues intended to provide additional revenue sources for the local government or to replace local revenue sources?
5. Are there any limitations on the uses of the shared revenues?
State Revenues Shared with Local Governments: A State-by-State Comparison
Page 16
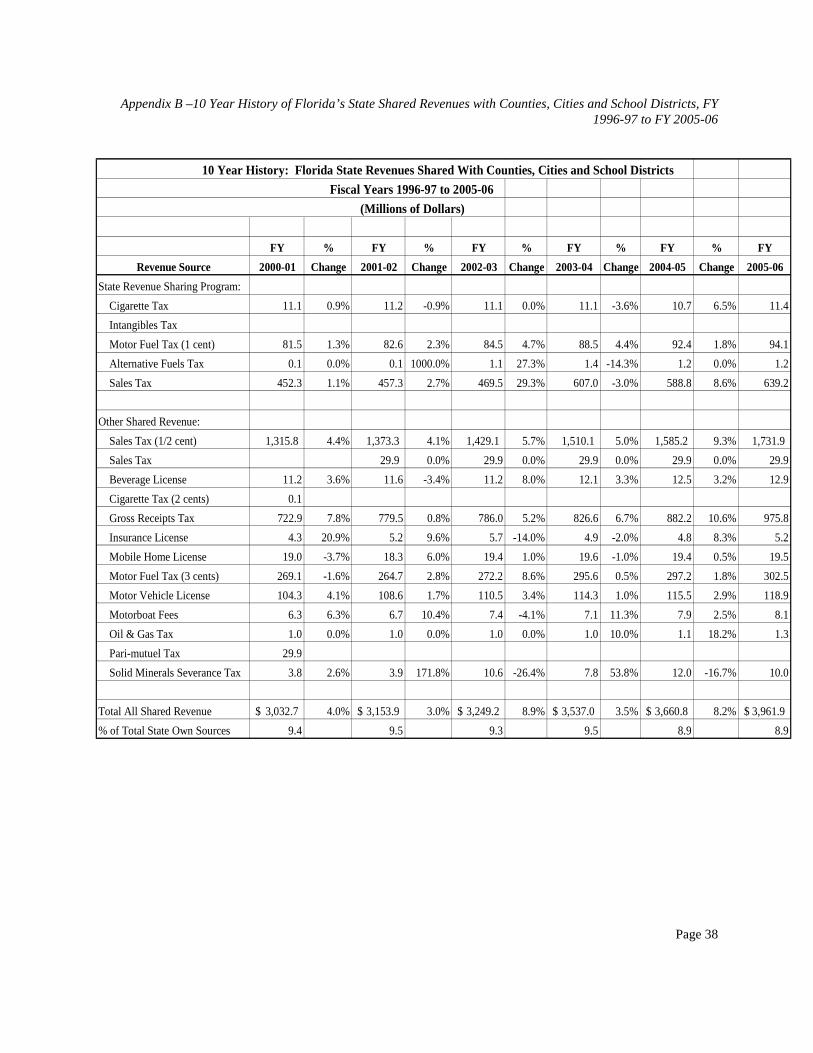
Findings Ten-Year History of Florida’s State Shared Revenues The fiscal year 2005-06 total for Florida “own source” revenue collections was $44,585.3 million.86 Of that total, $3,962.8 million was shared with cities, counties, and school districts, which represents 8.9 percent of total “own source” state revenues. Table 1 shows the growth in state shared revenues for the ten years between fiscal years 1996-97 and 2005-06. (Year-by-year state shared revenues by revenue source can be found in Appendix B.) In fiscal year 1996-97, total shared revenues were $2.504.0 million or 9.1 percent of total “own sources” of $26,633.4 million.87 As a percent of total “own source” revenues, state shared revenues declined in fiscal year 2004-05, when sales tax distributions were changed in order to provide funding for the judicial system. Over this ten year period, state shared revenues grew by 58.3 percent.
86 Florida Revenue Estimating Conference, Revenue Analysis FY 1970-71 Through FY 2014-15, Vol. 21, Fall, 2005, Table 2.7 Total Direct Revenue. 87 Id., Table 1.8 History Total Direct Revenue.

State Revenues Shared with Local Governments: A State-by-State Comparison
Page 17
Table 1 10 Year Growth in Florida State Shared Revenues (Millions of Dollars)
FY FY %Revenue Source 1996-97 2005-06 Change
State Revenue Sharing Program: Intangibles/Sales Tax 299.9 386.0 28.7% Cigarette/Sales Tax 148.2 253.2 Cigarette Tax (1 cent) 11.3 11.4 0.9% Motor Fuel Tax (1 cent) 73.0 94.1 28.9% Alternative Fuels Tax 0.1 1.2 1100.0%
Other Shared Revenue: Sales Tax (1/2 cent) 1,012.5 1,731.9 71.1% Sales Tax/Pari-mutuel 29.9 29.9 0.0% Beverage License 8.6 12.9 50.0% Gross Receipts Tax 572.1 975.8 70.6% Insurance License 3.8 5.2 36.8% Mobile Home License 19.2 19.4 1.0% Motor Fuel Tax (3 cents) 220.1 303.5 37.9% Motor Vehicle License 97.5 118.9 21.9% Motorboat Fees 1.4 8.1 478.6% Oil & Gas Tax 1.3 1.3 0.0% Solid Minerals Severance Tax 5.2 10.0 92.3%
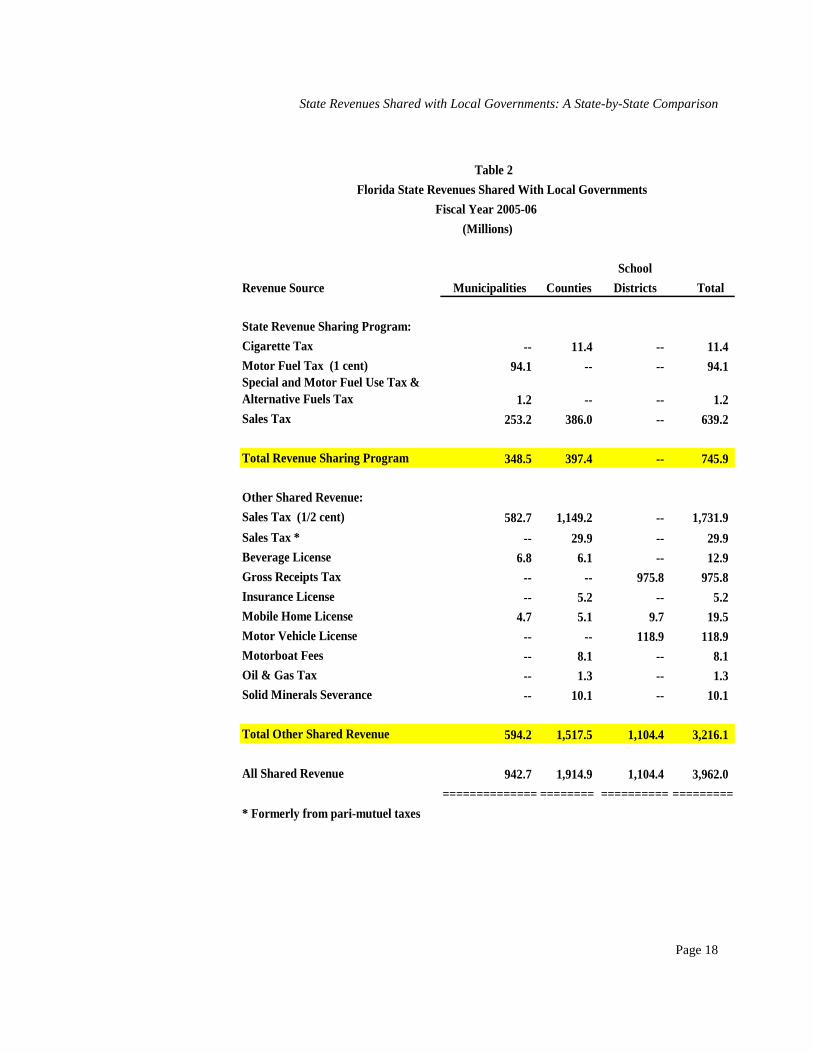
Total All Shared Revenue 2,504.1$ 3,962.8$ 58.3% Source: Florida Tax Handbook, Including Fiscal Impact of Potential Changes. State Revenues Shared with Local Governments, Issues 1999-2006. Table 2 shows Florida’s fiscal year 2005-06 state revenues shared with municipalities, counties and school districts. Counties receive the most shared revenues, almost twice as much as municipalities and school districts.
State Revenues Shared with Local Governments: A State-by-State Comparison
Page 18
Table 2
Florida State Revenues Shared With Local Governments
Fiscal Year 2005-06
(Millions)
School
Revenue Source Municipalities Counties Districts Total
State Revenue Sharing Program:
Cigarette Tax -- 11.4 -- 11.4 Motor Fuel Tax (1 cent) 94.1 -- -- 94.1 Special and Motor Fuel Use Tax & Alternative Fuels Tax 1.2 -- -- 1.2 Sales Tax 253.2 386.0 -- 639.2
Total Revenue Sharing Program 348.5 397.4 -- 745.9
Other Shared Revenue: Sales Tax (1/2 cent) 582.7 1,149.2 -- 1,731.9
Sales Tax * -- 29.9 -- 29.9 Beverage License 6.8 6.1 -- 12.9 Gross Receipts Tax -- -- 975.8 975.8 Insurance License -- 5.2 -- 5.2 Mobile Home License 4.7 5.1 9.7 19.5 Motor Vehicle License -- -- 118.9 118.9 Motorboat Fees -- 8.1 -- 8.1 Oil & Gas Tax -- 1.3 -- 1.3 Solid Minerals Severance -- 10.1 -- 10.1
Total Other Shared Revenue 594.2 1,517.5 1,104.4 3,216.1
All Shared Revenue 942.7 1,914.9 1,104.4 3,962.0
============== ======== ========== =========
* Formerly from pari-mutuel taxes

State Revenues Shared with Local Governments: A State-by-State Comparison
Page 19
A State-by-State Comparison of State Shared Revenues Of the forty-nine surveys mailed, all but five were returned.88 In order to compare other states with Florida’s state shared revenues, state shared revenues were defined as “state taxes, licenses, or fees that are imposed, collected and enforced by the state, where a portion of such taxes, licenses, or fees are distributed to counties, cities, school districts, or other local governments.” Appropriations were not to be considered as state shared revenues nor were local taxes collected by the state for the local government. Given this definition of “state shared revenues,” Connecticut, Georgia, New York, and Wisconsin do not share state revenues with local governments. However, in fiscal year 2005, Georgia provided $402.9 million to local governments for property tax relief. The Georgia Tax Relief Credit requires local governments to credit homeowner’s property tax bills by the amount appropriated in the budget. Most states do not levy a state property tax, which is primarily a locally imposed tax. Of the states responding to the survey, Alabama, Kentucky, New Hampshire, and Pennsylvania impose some form of state property tax, which is shared with local governments and Ohio shares a portion of their intangibles tax. The most commonly shared revenues are motor fuel and special fuel taxes and the sales and use tax. Twenty seven states, including Florida, share motor fuel and special fuel taxes with cities and counties. The following states restrict the uses of these taxes to transportation-related activities: Alabama, Arkansas, California, Florida, Hawaii, Kansas, Kentucky, Maryland, Michigan, Nebraska, Ohio, Pennsylvania, Tennessee, Utah, Washington, and Wyoming. Seventeen states, including Florida, share motor vehicle license tax revenues with local governments, with Alabama, Arkansas, California, Hawaii, Idaho, Illinois, Indiana, Kentucky, Maryland and Virginia requiring shared revenues to be used for transportation-related purposes. Of the twenty-three states, including Florida, that share state sales and use tax revenues with local governments, only Alabama, California, Iowa, Maryland, Nebraska, Washington, and West Virginia restrict the uses of some or all of their shared revenues. Alabama requires counties to use their shared sales and use tax revenues for law enforcement, public health, and agriculture extension services. Iowa earmarks their motor vehicle use tax revenues shared with cities and counties for road projects in the approved transportation plan. Sales tax revenues collected on rental cars by Maryland and Nebraska and shared with local governments must be used for transportation-related projects. A portion of Washington’s shared sales and use tax revenues must be dedicated to stadiums
88 Delaware, Missouri, Nevada, Rhode Island, and Vermont.
State Revenues Shared with Local Governments: A State-by-State Comparison
Page 20
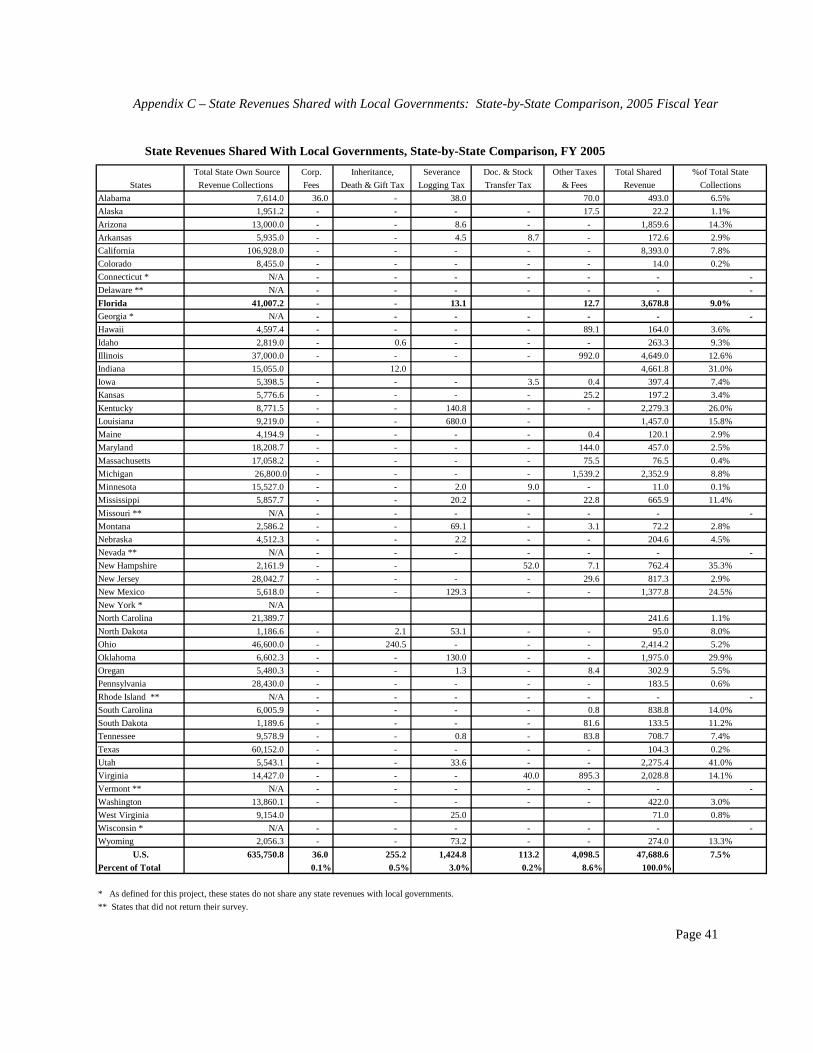
while West Virginia’s shared sales and use tax revenues must be used for infrastructure improvements, economic development, regional jail and correctional authority and county jail expenses. Eighteen states, including Florida, share severance taxes with local governments; seventeen states share alcoholic beverage taxes; twelve states, including Florida, share cigarette taxes; eleven states share corporate income tax revenues; eight states share personal income tax revenues; and nine states, including Florida, share some public utility tax revenues with local governments. Alabama, Kansas, Kentucky, and South Carolina require their state imposed “bed tax” to be used by the local government for the promotion of tourism. New Hampshire requires a portion of their shared corporate income tax revenues to be used for education, while Utah dedicates 100 percent of both their corporate and personal income tax revenues to education. The portion of insurance premium tax revenues shared with local governments in Arizona and West Virginia must be used for pension plans. Table 3 below is a summary of state-by-state comparisons of “state shared revenues” with local government for fiscal year 2005. (See appendix C for state shared revenues by tax source) As defined for use in this report, the national average for fiscal year 2005 of “state shared revenues” is 7.5 percent, with Florida above the national average at 9 percent. Seventeen other states are above the national average and twenty-two fall below. In addition to “state shared revenues,” most states, including Florida, appropriate billions of dollars to local governments, with educational funding to local school districts receiving the most appropriated monies.

State Revenues Shared with Local Governments: A State-by-State Comparison
Page 21
Table 3Total State Total Shared Percent of Total
States Own Source Collections Revenue State Collections
Alabama 7,614.0 493.0 6.5%
Alaska 1,951.2 22.2 1.1%
Arizona 13,000.0 1,859.6 14.3%
Arkansas 5,935.0 172.6 2.9%
California 106,928.0 8,393.0 7.8%
Colorado 8,455.0 14.0 0.2%
Connecticut * N/A - - Delaware ** N/A - -
Florida 41,007.2 3,678.8 9.0%Georgia * N/A - - Hawaii 4,597.4 164.0 3.6%
Idaho 2,819.0 263.3 9.3%
Illinois 37,000.0 4,649.0 12.6%
Indiana 15,055.0 4,661.8 31.0%
Iowa 5,398.5 397.4 7.4%
Kansas 5,776.6 197.2 3.4%
Kentucky 8,771.5 2,279.3 26.0%
Louisiana 9,219.0 1,457.0 15.8%
Maine 4,194.9 120.1 2.9%
Maryland 18,208.7 457.0 2.5%
Massachusetts 17,058.2 76.5 0.4%
Michigan 26,800.0 2,352.9 8.8%
Minnesota 15,527.0 11.0 0.1%
Mississippi 5,857.7 665.9 11.4%
Missouri ** N/A - - Montana 2,586.2 72.2 2.8%
Nebraska 4,512.3 204.6 4.5%
Nevada ** N/A - - New Hampshire 2,161.9 762.4 35.3%
New Jersey 28,042.7 817.3 2.9%
New Mexico 5,618.0 1,377.8 24.5%
New York * N/A
North Carolina 21,389.7 241.6 1.1%
North Dakota 1,186.6 95.0 8.0%
Ohio 46,600.0 2,414.2 5.2%
Oklahoma 6,602.3 1,975.0 29.9%
Oregan 5,480.3 302.9 5.5%
Pennsylvania 28,430.0 183.5 0.6%
Rhode Island ** N/A - - South Carolina 6,005.9 838.8 14.0%
South Dakota 1,189.6 133.5 11.2%
Tennessee 9,578.9 708.7 7.4%
Texas 60,152.0 104.3 0.2%
Utah 5,543.1 2,275.4 41.0%
Virginia 14,427.0 2,028.8 14.1%
Vermont ** N/A - - Washington 13,860.1 422.0 3.0%
West Virginia 9,154.0 71.0 0.8%
Wisconsin * N/A - - Wyoming 2,056.3 274.0 13.3%
U.S. 635,750.8 47,688.6 7.5%
Percent of Total 100.0%
* As defined for this project, these states do not share any state revenues with local governments.
** States that did not return their survey.

State Revenues Shared with Local Governments: A State-by-State Comparison
Page 22
Conclusions The purpose of this report was to compare Florida’s state shared revenues with local governments to other states similar programs. Florida falls in the middle in the percentage of state “own source” revenues shared with local governments and is, in fact, slightly above the national average. Florida’s state shared revenues have remained stable over the years, and when cigarette tax and intangibles tax revenues began to decline, the Legislature replaced those revenue sources with a percentage of the state sales and use tax, an inherently more stable and growing source than the revenues replaced. If one wanted to get the whole picture of how much funding is provide to local governments by the states, state appropriations would have to be included in the analysis along with “state shared revenues,” although as previously noted, school districts receive the bulk of appropriated funds.

Appendixes


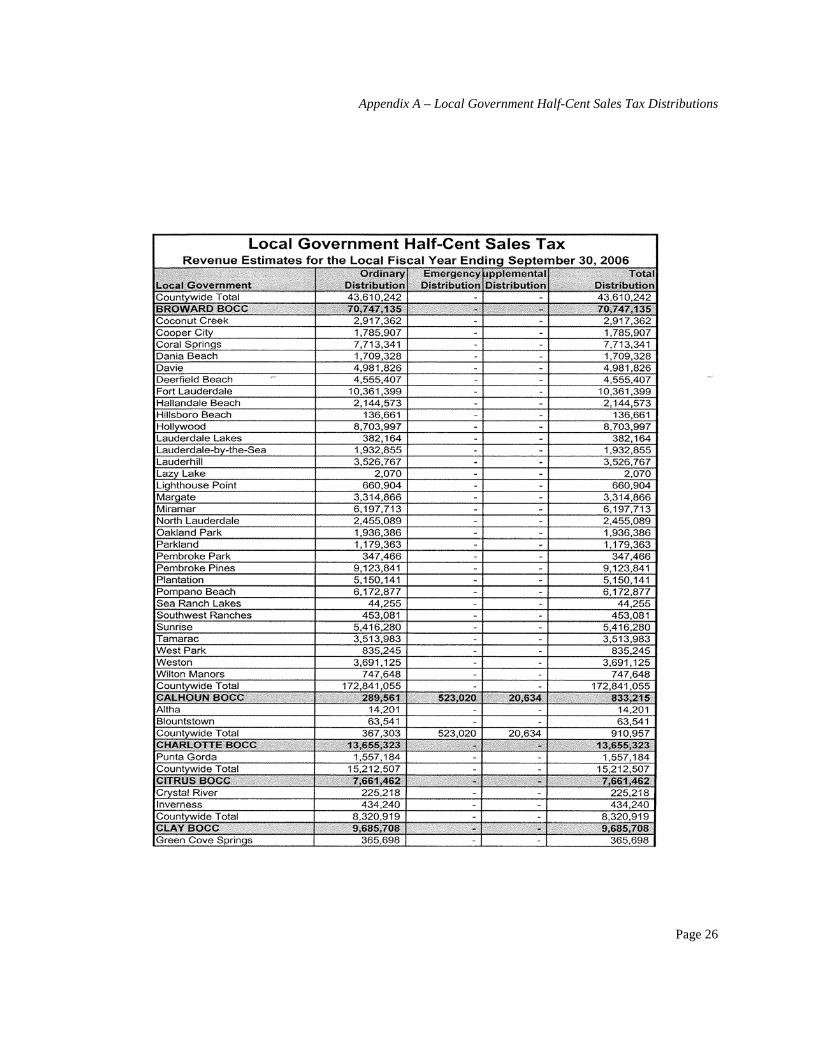
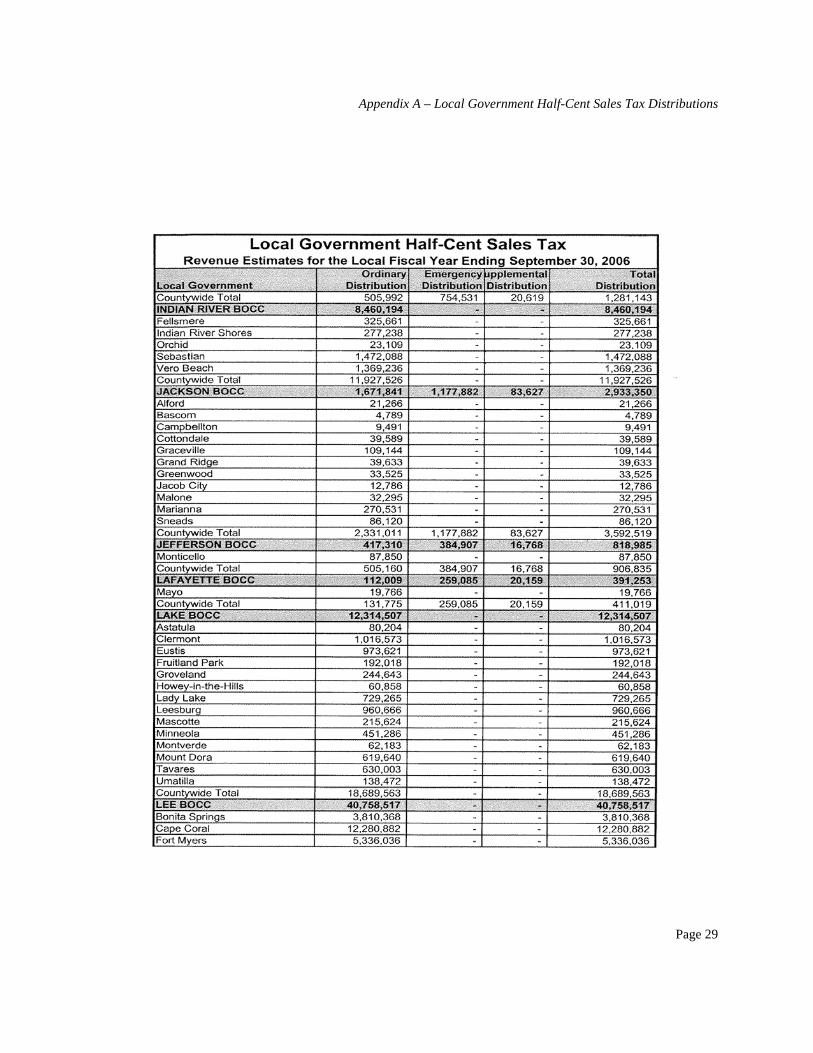
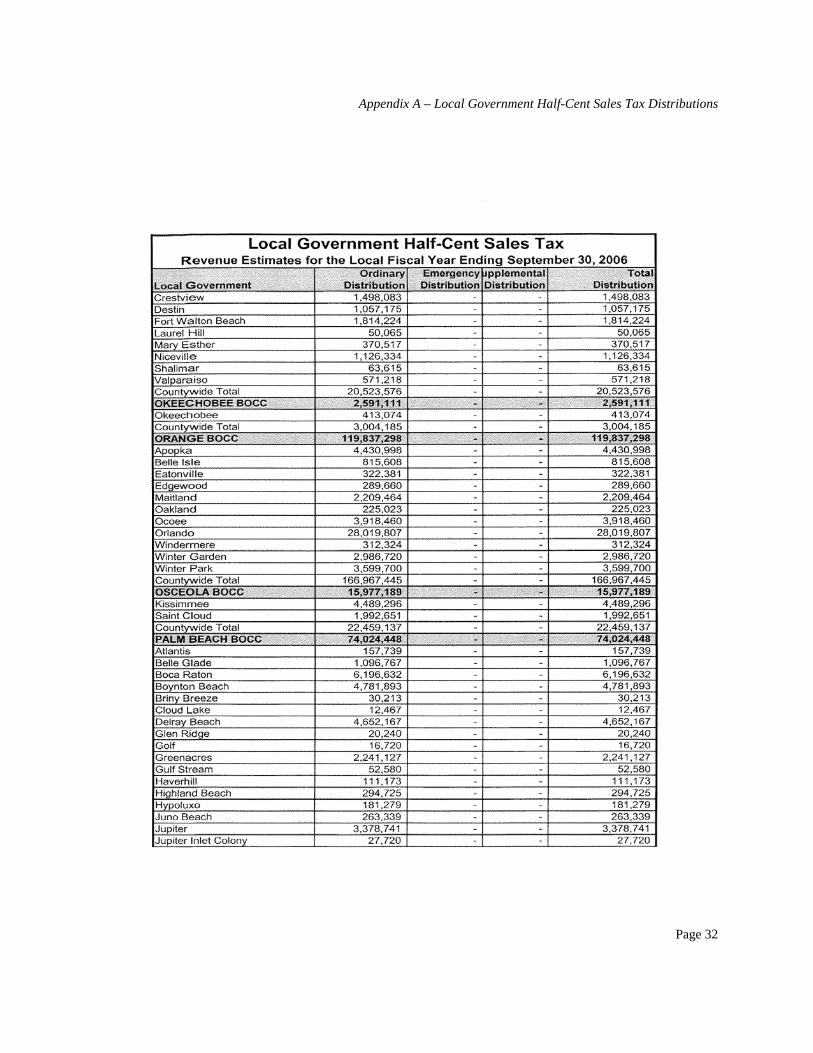
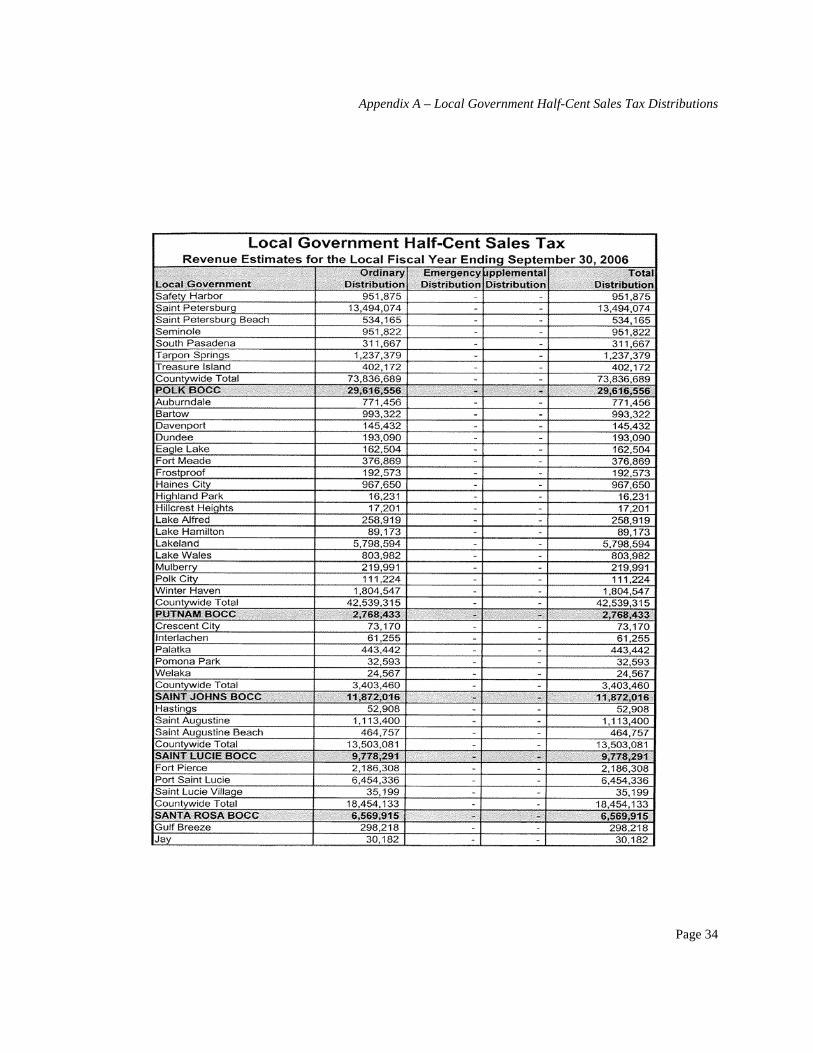
Appendix A – Local Government Half-Cent Sales Tax Distributions
Page 25
Appendix A – Local Government Half-Cent Sales Tax Distributions
Appendix A – Local Government Half-Cent Sales Tax Distributions
Page 26

Appendix A – Local Government Half-Cent Sales Tax Distributions
Page 27

Appendix A – Local Government Half-Cent Sales Tax Distributions
Page 28
Appendix A – Local Government Half-Cent Sales Tax Distributions
Page 29

Appendix A – Local Government Half-Cent Sales Tax Distributions
Page 30

Appendix A – Local Government Half-Cent Sales Tax Distributions
Page 31
Appendix A – Local Government Half-Cent Sales Tax Distributions
Page 32

Appendix A – Local Government Half-Cent Sales Tax Distributions
Page 33
Appendix A – Local Government Half-Cent Sales Tax Distributions
Page 34

Appendix A – Local Government Half-Cent Sales Tax Distributions
Page 35

Appendix A – Local Government Half-Cent Sales Tax Distributions
Page 36
Source: Local Government Financial Information Handbook, LCIR, 2005 Edition, March 2006.

Appendix B –10 Year History of Florida’s State Shared Revenues with Counties, Cities and School Districts, FY 1996-97 to FY 2005-06
Page 37
Appendix B – 10 Year History of Florida’s State Shared Revenues with Counties, Cities and School Districts, FY 1996-97 to FY 2005-06
10 Year History: Florida State Revenues Shared With Counties, Cities and School Districts
Fiscal Years 1996-97 to 2005-06
(Millions of Dollars)
FY % FY % FY % FY % FY
Revenue Source 1996-97 Change 1997-98 Change 1998-99 Change 1999-00 Change 2000-01
State Revenue Sharing Program:
Cigarette Tax 136.9 5.5% 144.4 -4.2% 138.4 -1.4% 136.4 -91.9% 11.1
Intangibles Tax 299.9 23.0% 368.8 12.0% 413.2 -13.8% 356.0
Motor Fuel Tax (1 cent) 73.0 28.8% 94.0 -17.8% 77.3 3.9% 80.3 1.5% 81.5
Alternative Fuels Tax 0.1 0.0% 0.1 0.0% 0.1 0.0% 0.1 0.0% 0.1
Sales Tax 452.3
Other Shared Revenue:
Sales Tax (1/2 cent) 1,012.5 9.1% 1,104.4 4.7% 1,156.3 9.5% 1,265.9 3.9% 1,315.8
Sales Tax
Beverage License 8.6 19.8% 10.3 -2.9% 10 9.0% 10.9 2.8% 11.2
Cigarette Tax (2 cents) 22.5 5.3% 23.7 -5.9% 22.3 0.0% 22.3 -99.6% 0.1
Gross Receipts Tax 572.1 3.7% 593.4 7.7% 639.3 4.7% 669.2 8.0% 722.9
Insurance License 3.8 -2.6% 3.7 -8.1% 3.4 14.7% 3.9 10.3% 4.3
Mobile Home License 19.2 1.6% 19.5 -0.5% 19.4 -1.0% 19.2 -1.0% 19.0
Motor Fuel Tax (3 cents) 220.1 10.5% 243.3 -4.7% 231.9 9.4% 253.7 6.1% 269.1
Motor Vehicle License 97.5 4.4% 101.8 1.6% 103.4 0.6% 104.0 0.3% 104.3
Motorboat Fees 1.4 192.9% 4.1 -7.3% 3.8 73.7% 6.6 -4.5% 6.3
Oil & Gas Tax 1.3 -23.1% 1.0 -60.0% 0.4 150.0% 1.0 0.0% 1.0
Pari-mutuel Tax 29.9 0.0% 29.9 0.0% 29.9 0.0% 29.9 0.0% 29.9
Solid Minerals Severance Tax 5.2 19.2% 6.2 0.0% 6.2 -16.1% 5.2 -26.9% 3.8
Total All Shared Revenue 2,504.0$ 9.8% 2,748.6$ 3.9% 2,855.3$ 3.8% 2,964.6$ 2.3% 3,032.7$
% of Total State Own Sources 9.4 9.6 9.4 9.5 9.4
Appendix B –10 Year History of Florida’s State Shared Revenues with Counties, Cities and School Districts, FY 1996-97 to FY 2005-06
Page 38
10 Year History: Florida State Revenues Shared With Counties, Cities and School Districts
Fiscal Years 1996-97 to 2005-06
(Millions of Dollars)
FY % FY % FY % FY % FY % FY
Revenue Source 2000-01 Change 2001-02 Change 2002-03 Change 2003-04 Change 2004-05 Change 2005-06
State Revenue Sharing Program:
Cigarette Tax 11.1 0.9% 11.2 -0.9% 11.1 0.0% 11.1 -3.6% 10.7 6.5% 11.4
Intangibles Tax
Motor Fuel Tax (1 cent) 81.5 1.3% 82.6 2.3% 84.5 4.7% 88.5 4.4% 92.4 1.8% 94.1
Alternative Fuels Tax 0.1 0.0% 0.1 1000.0% 1.1 27.3% 1.4 -14.3% 1.2 0.0% 1.2
Sales Tax 452.3 1.1% 457.3 2.7% 469.5 29.3% 607.0 -3.0% 588.8 8.6% 639.2
Other Shared Revenue:
Sales Tax (1/2 cent) 1,315.8 4.4% 1,373.3 4.1% 1,429.1 5.7% 1,510.1 5.0% 1,585.2 9.3% 1,731.9
Sales Tax 29.9 0.0% 29.9 0.0% 29.9 0.0% 29.9 0.0% 29.9
Beverage License 11.2 3.6% 11.6 -3.4% 11.2 8.0% 12.1 3.3% 12.5 3.2% 12.9
Cigarette Tax (2 cents) 0.1
Gross Receipts Tax 722.9 7.8% 779.5 0.8% 786.0 5.2% 826.6 6.7% 882.2 10.6% 975.8
Insurance License 4.3 20.9% 5.2 9.6% 5.7 -14.0% 4.9 -2.0% 4.8 8.3% 5.2
Mobile Home License 19.0 -3.7% 18.3 6.0% 19.4 1.0% 19.6 -1.0% 19.4 0.5% 19.5
Motor Fuel Tax (3 cents) 269.1 -1.6% 264.7 2.8% 272.2 8.6% 295.6 0.5% 297.2 1.8% 302.5
Motor Vehicle License 104.3 4.1% 108.6 1.7% 110.5 3.4% 114.3 1.0% 115.5 2.9% 118.9
Motorboat Fees 6.3 6.3% 6.7 10.4% 7.4 -4.1% 7.1 11.3% 7.9 2.5% 8.1
Oil & Gas Tax 1.0 0.0% 1.0 0.0% 1.0 0.0% 1.0 10.0% 1.1 18.2% 1.3
Pari-mutuel Tax 29.9
Solid Minerals Severance Tax 3.8 2.6% 3.9 171.8% 10.6 -26.4% 7.8 53.8% 12.0 -16.7% 10.0
Total All Shared Revenue 3,032.7$ 4.0% 3,153.9$ 3.0% 3,249.2$ 8.9% 3,537.0$ 3.5% 3,660.8$ 8.2% 3,961.9$
% of Total State Own Sources 9.4 9.5 9.3 9.5 8.9 8.9

Appendix C – State Revenues Shared with Local Governments: State-by-State Comparison, 2005 Fiscal Year
Page 39
Appendix C – State Revenues Shared with Local Governments: State-by-State Comparison, 2005 Fiscal Year State Revenues Shared With Local Governments, State-by-State Comparison, FY 2005
Total State Own Source State Prop. Or General Sales or Alcoholic Cigarette Insurance
States Revenue Collections Intangibles Tax Gross Receipts Tax Bev. Tax Tax Prem. Tax
Alabama 7,614.0 107.0 4.0 5.0 1.0 -
Alaska 1,951.2 - - 0.8 - -
Arizona 13,000.0 - 958.8 - - 12.5
Arkansas 5,935.0 - - - - -
California 106,928.0 - 5,246.0 - - -
Colorado 8,455.0 - - - 14.0 -
Connecticut * N/A - - - - -
Delaware ** N/A - - - - -
Florida 41,007.2 - 2,203.8 - 10.7 -
Georgia * N/A - - - - -
Hawaii 4,597.4 - - - - -
Idaho 2,819.0 0.1 156.9 17.4 9.2 -
Illinois 37,000.0 - 1,782.0 - - -
Indiana 15,055.0 2,516.8 19.4 15.2
Iowa 5,398.5 - - - -
Kansas 5,776.6 - 15.9 - -
Kentucky 8,771.5 2,010.6 - - - -
Louisiana 9,219.0 - 35.0 5.0 155.0 -
Maine 4,194.9 - 48.0 - - -
Maryland 18,208.7 - - - - -
Massachusetts 17,058.2 - - - - -
Michigan 26,800.0 - 412 32.1 20.9 -
Minnesota 15,527.0 - - - - -
Mississippi 5,857.7 - 383.0 2.3 - 14.3
Missouri ** N/A - - - - -
Montana 2,586.2 - - - - -
Nebraska 4,512.3 - - - - 25.6
Nevada ** N/A - - - - -
New Hampshire 2,161.9 363.4 - - 28.2 -
New Jersey 28,042.7 - - - - -
New Mexico 5,618.0 - 1,164.0 0.9 1.6 25.0
New York * N/A
North Carolina 21,389.7 - 56.0 29.8 - -
North Dakota 1,186.6 - 38.5 - 1.3 -
Ohio 46,600.0 11.4 301.0 - - -
Oklahoma 6,602.3 1,377.0 9.0 - -
Oregan 5,480.3 - - - 8.4 -
Pennsylvania 28,430.0 29.3 - - - -
Rhode Island ** N/A - - - - -
South Carolina 6,005.9 - 835.9 2.1 - -
South Dakota 1,189.6 - 3.3 4.0 - -
Tennessee 9,578.9 - 220.4 28.5 - -
Texas 60,152.0 - - 93.6 - -
Utah 5,543.1 - - 18.1 - -
Virginia 14,427.0 - 928.6 8.5 - -
Vermont ** N/A - - - - - Washington 13,860.1 - 107.0 53.0 - -
West Virginia 9,154.0 9.0 37.0
Wisconsin * N/A - - - - - Wyoming 2,056.3 - 159.5 - 3.4 -
U.S. 635,750.8 2,521.8 18,946.5 345.4 268.9 114.4
Percent of Total 5.3% 39.7% 0.7% 0.6% 0.2%
* As defined for this project, these states do not share any state revenues with local governments.
** States that did not return their survey.

Appendix C – State Revenues Shared with Local Governments: State-by-State Comparison, 2005 Fiscal Year
Page 40
State Revenues Shared With Local Governments, State-by-State Comparison, FY 2005
Total State Own Source Motor & Special Lottery Public Personal Income & Vehcile & Drivers Alcoho
States Revenue Collections Fuels Tax Pari-mutuels Tax Utilities Tax Income Tax Business Tax Licenses Bev. Lic
Alabama 7,614.0 182.0 - - 16.0 18.0 16.0
Alaska 1,951.2 0.1 - 3.8 - - -
Arizona 13,000.0 1.2 - - - 373.1 505.4
Arkansas 5,935.0 124.0 - - - - 35.4
California 106,928.0 1,133.0 - - - - 2,014.0
Colorado 8,455.0 - - - - - -
Connecticut * N/A - - - - - -
Delaware ** N/A - - - - - -
Florida 41,007.2 408.9 - 882.2 - - 134.9 Georgia * N/A - - - - - - Hawaii 4,597.4 74.9 - - - - -
Idaho 2,819.0 79.1 - - - - -
Illinois 37,000.0 536.0 - 440.0 719.0 180.0 -
Indiana 15,055.0 307.8 204.9 1,528.2 46.4 8.6
Iowa 5,398.5 261.2 - - - - 132.3
Kansas 5,776.6 142.2 - - - - 13.9
Kentucky 8,771.5 127.5 - - - - 0.4
Louisiana 9,219.0 582.0 - - - - -
Maine 4,194.9 - - - 64.8 6.9 -
Maryland 18,208.7 177.0 - - - 51.0 85.0
Massachusetts 17,058.2 - 1.0 - - - -
Michigan 26,800.0 191.8 - - - - 156.9
Minnesota 15,527.0 - - - - - -
Mississippi 5,857.7 6.3 113.5 10.7 - - 92.8
Missouri ** N/A - - - - - - Montana 2,586.2 - - - - - -
Nebraska 4,512.3 176.8 - - - - -
Nevada ** N/A - - - - - - New Hampshire 2,161.9 - 70.3 60.1 - 181.3 -
New Jersey 28,042.7 - - 787.7 - - -
New Mexico 5,618.0 32.0 - - - - 25.0
New York * N/A
North Carolina 21,389.7 - - 155.8 - - -
North Dakota 1,186.6 - - - - - -
Ohio 46,600.0 396.3 - 297.1 828.9 47.4 291.6
Oklahoma 6,602.3 421.0 - 38.0 - - -
Oregan 5,480.3 145.1 - - - - 139.7
Pennsylvania 28,430.0 154.2 - - - - -
Rhode Island ** N/A - - - - - -
South Carolina 6,005.9 - - - - - -
South Dakota 1,189.6 - - - - 12.8 31.5
Tennessee 9,578.9 289.6 - - 35.8 49.8 -
Texas 60,152.0 - 10.7 - - - -
Utah 5,543.1 99.9 - - 1,926.6 188.9 4.6
Virginia 14,427.0 - 156.4 - - - -
Vermont ** N/A - - - - - - Washington 13,860.1 241.0 - 21.0 - - -
West Virginia 9,154.0
Wisconsin * N/A - - - - - - Wyoming 2,056.3 37.9 - - - - -
U.S. 635,750.8 6,328.8 556.8 2,696.4 5,119.3 1,155.6 3,688.0
Percent of Total 13.3% 1.2% 5.7% 10.7% 2.4% 7.7%
* As defined for this project, these states do not share any state revenues with local governments.
** States that did not return their survey.
Appendix C – State Revenues Shared with Local Governments: State-by-State Comparison, 2005 Fiscal Year
Page 41
State Revenues Shared With Local Governments, State-by-State Comparison, FY 2005
Total State Own Source Corp. Inheritance, Severance Doc. & Stock Other Taxes Total Shared %of Total State
States Revenue Collections Fees Death & Gift Tax Logging Tax Transfer Tax & Fees Revenue Collections
Alabama 7,614.0 36.0 - 38.0 70.0 493.0 6.5%
Alaska 1,951.2 - - - - 17.5 22.2 1.1%
Arizona 13,000.0 - - 8.6 - - 1,859.6 14.3%
Arkansas 5,935.0 - - 4.5 8.7 - 172.6 2.9%
California 106,928.0 - - - - - 8,393.0 7.8%
Colorado 8,455.0 - - - - - 14.0 0.2%
Connecticut * N/A - - - - - - - Delaware ** N/A - - - - - - -
Florida 41,007.2 - - 13.1 12.7 3,678.8 9.0%Georgia * N/A - - - - - - - Hawaii 4,597.4 - - - - 89.1 164.0 3.6%
Idaho 2,819.0 - 0.6 - - - 263.3 9.3%
Illinois 37,000.0 - - - - 992.0 4,649.0 12.6%
Indiana 15,055.0 12.0 4,661.8 31.0%
Iowa 5,398.5 - - - 3.5 0.4 397.4 7.4%
Kansas 5,776.6 - - - - 25.2 197.2 3.4%
Kentucky 8,771.5 - - 140.8 - - 2,279.3 26.0%
Louisiana 9,219.0 - - 680.0 - 1,457.0 15.8%
Maine 4,194.9 - - - - 0.4 120.1 2.9%
Maryland 18,208.7 - - - - 144.0 457.0 2.5%
Massachusetts 17,058.2 - - - - 75.5 76.5 0.4%
Michigan 26,800.0 - - - - 1,539.2 2,352.9 8.8%
Minnesota 15,527.0 - - 2.0 9.0 - 11.0 0.1%
Mississippi 5,857.7 - - 20.2 - 22.8 665.9 11.4%
Missouri ** N/A - - - - - - - Montana 2,586.2 - - 69.1 - 3.1 72.2 2.8%
Nebraska 4,512.3 - - 2.2 - - 204.6 4.5%
Nevada ** N/A - - - - - - - New Hampshire 2,161.9 - - 52.0 7.1 762.4 35.3%
New Jersey 28,042.7 - - - - 29.6 817.3 2.9%
New Mexico 5,618.0 - - 129.3 - - 1,377.8 24.5%
New York * N/A
North Carolina 21,389.7 241.6 1.1%
North Dakota 1,186.6 - 2.1 53.1 - - 95.0 8.0%
Ohio 46,600.0 - 240.5 - - - 2,414.2 5.2%
Oklahoma 6,602.3 - - 130.0 - - 1,975.0 29.9%
Oregan 5,480.3 - - 1.3 - 8.4 302.9 5.5%
Pennsylvania 28,430.0 - - - - - 183.5 0.6%
Rhode Island ** N/A - - - - - - - South Carolina 6,005.9 - - - - 0.8 838.8 14.0%
South Dakota 1,189.6 - - - - 81.6 133.5 11.2%
Tennessee 9,578.9 - - 0.8 - 83.8 708.7 7.4%
Texas 60,152.0 - - - - - 104.3 0.2%
Utah 5,543.1 - - 33.6 - - 2,275.4 41.0%
Virginia 14,427.0 - - - 40.0 895.3 2,028.8 14.1%
Vermont ** N/A - - - - - - -
Washington 13,860.1 - - - - - 422.0 3.0%
West Virginia 9,154.0 25.0 71.0 0.8%
Wisconsin * N/A - - - - - - - Wyoming 2,056.3 - - 73.2 - - 274.0 13.3%
U.S. 635,750.8 36.0 255.2 1,424.8 113.2 4,098.5 47,688.6 7.5%
Percent of Total 0.1% 0.5% 3.0% 0.2% 8.6% 100.0%
* As defined for this project, these states do not share any state revenues with local governments.
** States that did not return their survey.

Appendix C – State Revenues Shared with Local Governments: State-by-State Comparison, 2005 Fiscal Year
Page 42
Notes:
The following states did not return their surveys: Delaware, Missouri, Rhode Island and Vermont. * As defined for this project, these states do not share any state revenues with local governments.(1) Other - Congress requires payment in-lieu-of-tax to Alabama by the Tennessee Valley Authority, a federally chartered agency. Alabama considers these payments as tax collections and not federal funds. (2) Other - Transient accommodations tax(3) Idaho imposes a state ad valorem tax on rail road cars. $13.4 m of sales tax revenues replaces property tax on agricultural equipment and $15 m compensates counties for other property tax relief.(4) Other - Replacement Tax. Replacing state property tax that was shared with local governments until state property tax was abolished in the 1970's.(5) Motor vehicle license number is the motor vehicle use tax, which shared revenues must be used for road projects in the approved transportation plan.(6) Other - Vehicle rental excise tax collections of $2.8 m is replacement revenues to local governments for personal property taxes and must be distributed the same as local property tax receipts.(7) Beginning June 1, 2005, adopted a transient room tax and telecommunications gross receipts tax, to be shared 100% with local governments. The transient room tax must be used for the promotion of tourism.A11(8) Other - $139 m from the motor vehicle excise tax and $ 5 million from the sales tax on rental cars.(9) Other - Room occupancy tax(10) Other - $17.3 m Convention Tax to be used for payment of debt service; $11.7 m in Airport parking fees to be used for indigent care; $16.3 m E-911 Fee; and $1,539.2 in Transportation Rebate revenues.(11) Other - $ 4 m in use taxes and $18.8 m in nuclear in lieu of taxes.(12) Severance tax revenues shared with school districts, $34.9 m, must be allocated for the same purposes and in the same proportion to property tax mill levied for those purposes.(13) The $176.8 m in motor and special fuel tax revenues comes from the following state sources: $303.8 m from motor & special fuel taxes; $65.8 m from motor vehicle registrations; and $143 m from the sales tax on motor vehicles (14) Other - Hotel/Motel Occupancy Tax(15) Ohio imposes an intangibles tax.(16) Oregon budgeted $2,422.2 m from personal income tax revenues to school districts to replace property tax dollars. Distributions from the State Highway Fund of motor fuel and motor vehicle license taxes to local governments were calculate based on percent of total receipts going to each local government.(17) The $29.3 m from property tax is the Pennsylvania Utility Realty Tax.(18) In FY 2005, South Carolina transferred $506.3 m from the General Fund to the State's Property Tax Relief Trust Fund to distribute to local governments for property tax relief.(19) Other - Congress requires payment in-lieu-fo-tax to Tennessee by the Tennessee Valley Authority, a federally chartered agency. Tennessee considers these payments as tax collections and not federal funds. Included in the corporate income tax number is $26.9 m from the privilege tax.(20) In FY 2005, Texas budgeted $17.3 billion in intergovernmental payments, all of which are constitutionally dedicated revenues and statutory transfers from the state's general fund.(21) In Virginia, local governments assess and collect a local personal property tax on motor vehicles. In FY 2005, Virginia appropriated $890.1 m to local governments to provide a 70% person property tax relief to its citizens.