Embed Size (px)
Citation preview

STATE OF THE STRUCTURES AND BRIDGES REPORT
JANUARY 2009
Prepared by: Virginia Department of Transportation Structure & Bridge Division
Comments and or questions may be directed to: Kendal Walus, P.E.
State Structure and Bridge Engineer Virginia Department of Transportation
1401 East Broad Street, Richmond, VA 23219 Telephone: (804) 786-4575 Email: [email protected]

Virginia Department of Transportation State of the Structures and Bridges Report
Executive Summary
The Virginia Department of Transportation (VDOT) is responsible for the inventory, inspection, maintenance, and improvement of 20,879 structures (bridges and culverts) across all of the commonwealth’s roadway systems. Of this inventory 19,362 structures are maintained by VDOT and 1,517 are maintained by localities and private owners. The total represents a net increase of 48 structures from fiscal year 2008.
VDOT inspects over 10,000 structures annually at an approximate cost of $16 million annually for safety inspection services.
The number of structurally deficient structures in the VDOT inventory is 1,730 (8.3%). This represents a 0.1% decrease from fiscal year 2008. The national average of structurally deficient structures is twelve (12%) percent. Structurally deficient bridges are those structures with deficient elements that require the structure to be monitored and/or repaired and has either been restricted to light weight vehicles or have been closed to traffic.
The number of functionally obsolete structures in the VDOT inventory is 3,096 (14.8%).
This represents a 0.0% increase from fiscal year 2008. The national average of functionally obsolete structures is thirteen (13%) percent. Functionally obsolete bridges are those with deck geometry (e.g., lane width), load carrying capacity, clearance, or approach roadway alignment that no longer meet the criteria for the system of which the bridge is a part.
The combined deficient (structurally deficient and functional obsolete) structures in the VDOT inventory is 4,826 (23.1%). This represents a 0.1% decrease from fiscal year 2008. The national average of deficient structures is twenty five (25%) percent.
The number of weight posted structures in the inventory is 1,506 (7.2%). This value is the
same as in fiscal year 2008.
The current performance measure for structurally deficient structures is eight (8%) percent of the structure inventory. Currently, VDOT’s structurally deficient percentage is eight point three (8.3%) percent. This represents a 0.1% decrease from fiscal year 2008.
The design service life of a bridge has been 50 years, but with the evolution of new design guidelines and construction materials the anticipated service life for newly constructed bridges is 75 years. Fifty-five (55%) percent of the structure inventory is approaching the end of its anticipated service design life.
Page 2 of 42

Virginia Department of Transportation State of the Structures and Bridges Report
Background
The Virginia Department of Transportation (VDOT) is responsible for the inventory, inspection, maintenance, and improvement of 20,879 structures (bridges and culverts) across all of the commonwealth’s roadway systems. Of this inventory 19,362 structures are maintained by VDOT and 1,517 are maintained by localities and private owners. The total represents a net increase of 48 structures from fiscal year 2008. The 2008 estimated value of Virginia’s structure inventory is approximately $33 billion.
Chart 1. Distribution of Structures by System
3,002
5,08211,514
1,18398
Primary Secondary Urban OtherInterstate
Determining Bridge Conditions
VDOT is responsible for the bridge inspection and maintenance program including designing and managing the bridge maintenance, rehabilitation and replacement work.
The Federal Highway Administration (FHWA) requires VDOT to inventory and inspect all structures with lengths greater than twenty (20) feet. In addition, VDOT inventories and inspects all bridges regardless of their length and culverts having an opening of 36 square feet or greater.
Page 3 of 42
Virginia Department of Transportation State of the Structures and Bridges Report
Inspection procedures and requirements are detailed in the National Bridge Inspection Standards (NBIS) of the Code of Federal Regulations and in the latest (VDOT) Informational & Instructional Memorandum dealing with bridge inspection.
Bridges are inspected at a minimum once every two years. The condition assessments of the structures are performed by qualified inspectors, and all assessments are performed in accordance with the NBIS, and VDOT’s policies and procedures.
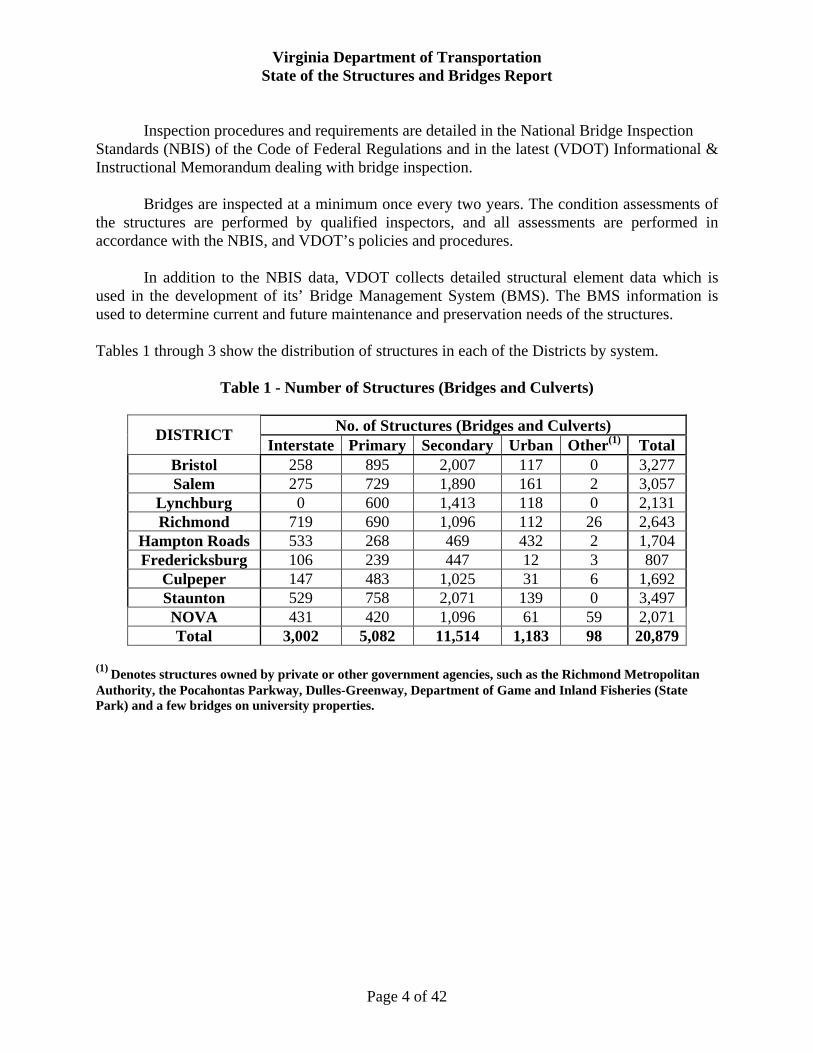
In addition to the NBIS data, VDOT collects detailed structural element data which is used in the development of its’ Bridge Management System (BMS). The BMS information is used to determine current and future maintenance and preservation needs of the structures. Tables 1 through 3 show the distribution of structures in each of the Districts by system.
Table 1 - Number of Structures (Bridges and Culverts)
No. of Structures (Bridges and Culverts) DISTRICT
Interstate Primary Secondary Urban Other(1) Total Bristol 258 895 2,007 117 0 3,277 Salem 275 729 1,890 161 2 3,057
Lynchburg 0 600 1,413 118 0 2,131 Richmond 719 690 1,096 112 26 2,643
Hampton Roads 533 268 469 432 2 1,704 Fredericksburg 106 239 447 12 3 807
Culpeper 147 483 1,025 31 6 1,692 Staunton 529 758 2,071 139 0 3,497 NOVA 431 420 1,096 61 59 2,071 Total 3,002 5,082 11,514 1,183 98 20,879
(1) Denotes structures owned by private or other government agencies, such as the Richmond Metropolitan Authority, the Pocahontas Parkway, Dulles-Greenway, Department of Game and Inland Fisheries (State Park) and a few bridges on university properties.
Page 4 of 42

Virginia Department of Transportation State of the Structures and Bridges Report
Table 2 - Number of Bridges by District
Number of Bridges
DISTRICT Interstate Primary Secondary Urban Other(1) Total
Bristol 166 511 1,531 87 0 2,295 Salem 162 416 1,329 122 1 2,033
Lynchburg 0 315 801 86 0 1,202 Richmond 452 413 581 70 15 1,531
Hampton Roads 398 181 276 330 1 1,186 Fredericksburg 48 128 190 12 3 381
Culpeper 94 241 651 16 3 1,005 Staunton 302 456 1,380 88 0 2,226 NOVA 305 246 439 25 38 1,053 Total 1,927 2,907 7,181 836 61 12,912
Table 3 - Number of Culverts by District Number of Culverts
DISTRICT Interstate Primary Secondary Urban Other(1) Total
Bristol 92 384 476 30 0 982 Salem 113 313 558 39 1 1,024
Lynchburg 0 285 612 32 0 929 Richmond 267 277 515 42 11 1,112
Hampton Roads 135 87 193 102 1 518 Fredericksburg 58 111 257 0 0 426
Culpeper 53 242 374 15 3 687 Staunton 227 302 691 51 0 1,271 NOVA 130 174 657 36 21 1,018 Total 1,075 2,175 4,333 347 37 7,967
Page 5 of 42

Virginia Department of Transportation State of the Structures and Bridges Report
It is important to note that 55% of the statewide structure inventory is approaching the
end of its anticipated service design life. 58% of the interstate, 62% of the primary, 53% of the secondary, and 41% of the urban system structures are approaching 50 years old.
Chart 2 - Cumulative Age Distribution of Structures
100.0%
93.2%
82.1%
71.8%
55.1%
34.5%
26.2%22.1%
3.3%0.8% 0.3% 0.1%
0.0%
20.0%
40.0%
60.0%
80.0%
100.0%
120.0%
2000-2008
1990-1999
1980-1989
1970-1979
1960-1969
1950-1959
1940-1949
1930-1939
1920-1929
1910-1919
1900-1909
pre-1900
Per
cen
t
55% of inventory is 40 years or older
The anticipated design service life of a bridge has been 50 years, but with the evolution of new design guidelines and construction materials the anticipated service life for newly constructed bridges is 75 years.
Page 6 of 42
Virginia Department of Transportation State of the Structures and Bridges Report
Measuring Performance
VDOT’s system performance measure for Structures is based on the number of structurally deficient structures in the Department’s inventory. A Structurally Deficient (SD) structure has a general condition rating of poor (general condition rating of 4 or less) or worse for one or more of the following structural elements: deck, superstructure, substructure or culvert, or has an appraisal rating of two (2) or less for the structural condition or waterway adequacy. These deficient structural elements require the structure to be monitored and/or repaired and has either been restricted to light weight vehicles or have been closed to traffic. Appendix A provides definitions of the general condition ratings.
VDOT’s current goal is to have no more than eight (8%) percent SD structures statewide.
Currently, eight point three (8.3%) percent (1,730) of the inventory is rated as structurally deficient. Charts 3 through 12 show the current percent of structurally deficient structures by District for each roadway classification, and a three year trend for each roadway system.
Appendix C shows the National trend of deficient structures from 2000 to 2007.
Page 7 of 42
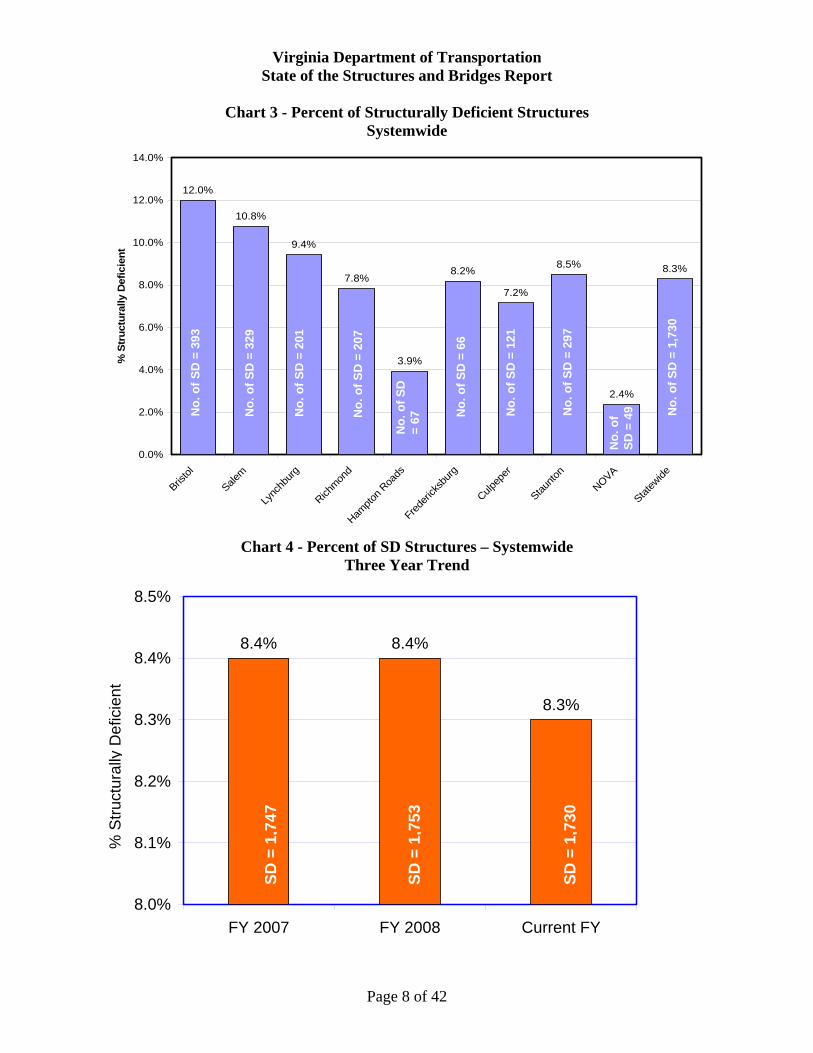
Virginia Department of Transportation State of the Structures and Bridges Report
Chart 3 - Percent of Structurally Deficient Structures
Systemwide
12.0%
10.8%
9.4%
7.8%
3.9%
8.2%
7.2%
8.5%
2.4%
8.3%
0.0%
2.0%
4.0%
6.0%
8.0%
10.0%
12.0%
14.0%
Bristo
l
Salem
Lync
hbur
g
Richm
ond
Hampt
on R
oads
Frede
ricks
burg
Culpe
per
Staun
ton
NOVA
State
wide
% S
tru
ctu
rally
Defi
cie
nt
No
. of
SD
= 1
,730
No
. of
SD
= 2
97
No
. of
SD
= 3
93
No
. of
SD
= 1
21
No
. of
SD
= 2
01
No
. of
SD
= 3
29
No
. of
SD
= 2
07
No
. o
f S
D =
66
No
. o
f S
D
= 6
7
No
. o
f S
D =
49
Chart 4 - Percent of SD Structures – Systemwide Three Year Trend
8.4% 8.4%
8.3%
8.0%
8.1%
8.2%
8.3%
8.4%
8.5%
FY 2007 FY 2008 Current FY
% D
efic
ien
t%
Str
uctu
rally
Def
icie
nt
SD
= 1
,747
SD
= 1
,753
SD
= 1
,730
Page 8 of 42

N
No
.=
67
No
. o
f S
D =
4
Virginia Department of Transportation State of the Structures and Bridges Report
Chart 5 - Percent of Structurally Deficient Structures – Interstate
5.8%5.5%
0.0%
4.2%
0.9%
4.7%
0.7%
1.5% 1.4%
2.8%
0.0%
2.0%
4.0%
6.0%
8.0%
Bristol
Salem
Lync
hbur
g
Richmon
d
Hampt
on R
oads
Fred
erick
sbur
g
Culpe
per
Staun
ton
NOVA
Statewid
e
% S
tructu
rally D
eficie
nt
No.
of
SD
= 5
No.
of
SD
= 1
No
. of
SD
= 3
93
No
. o
f S
D =
15
No
. o
f S
D =
15
No
. o
f S
D =
30
No
. o
f S
D =
85
No
. o
f S
D =
6
No
. o
f S
D =
8
Chart 6 – Percent of SD Structures – Interstate Three Year Trend
3.0%
2.9%
2.8%
2.5%
2.6%
2.7%
2.8%
2.9%
3.0%
3.1%
3.2%
FY 2007 FY 2008 Current FY
% D
efic
ien
t%
Str
uctu
rally
Def
icie
nt
SD
= 9
0
SD
= 8
7
SD
= 8
5
Page 9 of 42
Virginia Department of Transportation State of the Structures and Bridges Report
Chart 7 - Percent of Structurally Deficient Structures – Primary
7.8%
5.8%
4.5%
6.5%
5.2%
7.1%
2.5%
5.7%
2.4%
5.5%
0.0%
3.0%
6.0%
9.0%
Bristo
l
Salem
Lync
hbur
g
Richm
ond
Hampt
on R
oads
Fred
erick
sbur
g
Culpe
per
Staun
ton
NOVA
State
wide
% S
tru
ctu
rally
Def
icie
nt
No
. o
f S
D =
42
No
. of
SD
= 2
80
No
. o
f S
D =
70
No
. o
f S
D =
27
No
. o
f S
D =
45
No
. o
f S
D =
14
No
. o
f S
D =
17
No
. o
f S
D =
43
No
. o
f S
D =
12
No
. o
f S
D =
10
Chart 8 – Percent of SD Structures – Primary Three Year Trend
5.8%
5.7%
5.5%
5.0%
5.1%
5.2%
5.3%
5.4%
5.5%
5.6%
5.7%
5.8%
5.9%
6.0%
FY 2007 FY 2008 Current FY
% D
efic
ien
t%
Str
uctu
rally
Def
icie
nt
SD
= 2
97
SD
= 2
92
SD
= 2
81
Page 10 of 42

Virginia Department of Transportation State of the Structures and Bridges Report
Chart 9 - Percent of Structurally Deficient Structures – Secondary
14.2% 13.9%
11.6%11.1%
4.1%
8.9%
10.0%
11.5%
3.0%
11.0%
0.0%
5.0%
10.0%
15.0%
Bristol
Salem
Lync
hbur
g
Richmon
d
Hampt
on R
oads
Fred
erick
sbur
g
Culpe
per
Staun
ton
NOVA
State
wide
% S
tructu
rallu D
eficie
nt
No
. of
SD
= 1
,264
No
. of
SD
= 1
03
No
. of
SD
= 2
37
No
. of
SD
= 2
62
No
. of
SD
= 1
22
No
. of
SD
= 2
84
No
. of
SD
= 1
64
No
. o
f S
D =
40
No
. o
f S
D =
19
No
. o
f S
D =
33
Chart 10 – Percent of SD Structures – Secondary
Three Year Trend
11.0%11.1%
11.0%
10.0%
10.2%
10.4%
10.6%
10.8%
11.0%
11.2%
11.4%
FY 2007 FY 2008 Current FY
% D
efic
ien
t%
Str
uctu
rally
Def
icie
nt
SD
= 1
,258
SD
= 1
,275
SD
= 1
,264
Page 11 of 42

Virginia Department of Transportation State of the Structures and Bridges Report
Chart 11 - Percent of Structurally Deficient Structures – Urban
20.5%
5.6%
8.5% 8.9%
6.7%
33.3%
12.9%
6.6%
0.0%
8.4%
0.0%
5.0%
10.0%
15.0%
20.0%
25.0%
30.0%
35.0%
Bristo
l
Salem
Lync
hbur
g
Richm
ond
Hampt
on R
oads
Frede
ricks
burg
Culpep
er
Staun
ton
NOVA
State
wide
% S
tru
ctu
rall
y D
efi
cie
nt
No
. o
f S
D =
24
No
. o
f S
D =
4
No
. o
f S
D =
4
No
. o
f S
D =
10
No
. o
f S
D =
29
No
. o
f S
D =
10
No
. o
f S
D =
99
No
. o
f S
D =
9
No
. o
f S
D =
9
Chart 12 – Percent of SD Structures – Urban Three Year Trend
8.3%
8.4%8.4%
8.0%
8.1%
8.2%
8.3%
8.4%
8.5%
8.6%
FY 2007 FY 2008 Current FY
% D
efic
ient
% S
truc
tura
lly D
efic
ient
SD
= 1
01
SD
= 9
9
SD
= 9
8
Page 12 of 42

Virginia Department of Transportation State of the Structures and Bridges Report
Systemwide – 2008 Structurally Deficient Structures
Number of SD Structures = 1,730 Square foot area of SD Structures = 5,787,623 - Denotes SD Structure
Page 13 of 42

Virginia Department of Transportation State of the Structures and Bridges Report
Bristol District – 2008 Structurally Deficient Structures
Number of SD Structures = 393 Square foot area of SD Structures = 741,059
- Denotes SD Structure
Page 14 of 42

Virginia Department of Transportation State of the Structures and Bridges Report
Salem District – 2008 Structurally Deficient Structures
Number of SD Structures = 329 Square foot area of SD Structures = 677,645
- Denotes SD Structure
Page 15 of 42

Virginia Department of Transportation State of the Structures and Bridges Report
Lynchburg District – 2008 Structurally Deficient Structures
Number of SD Structures = 201 Square foot area of SD Structures = 477,875
- Denotes SD Structure
Page 16 of 42
Virginia Department of Transportation State of the Structures and Bridges Report
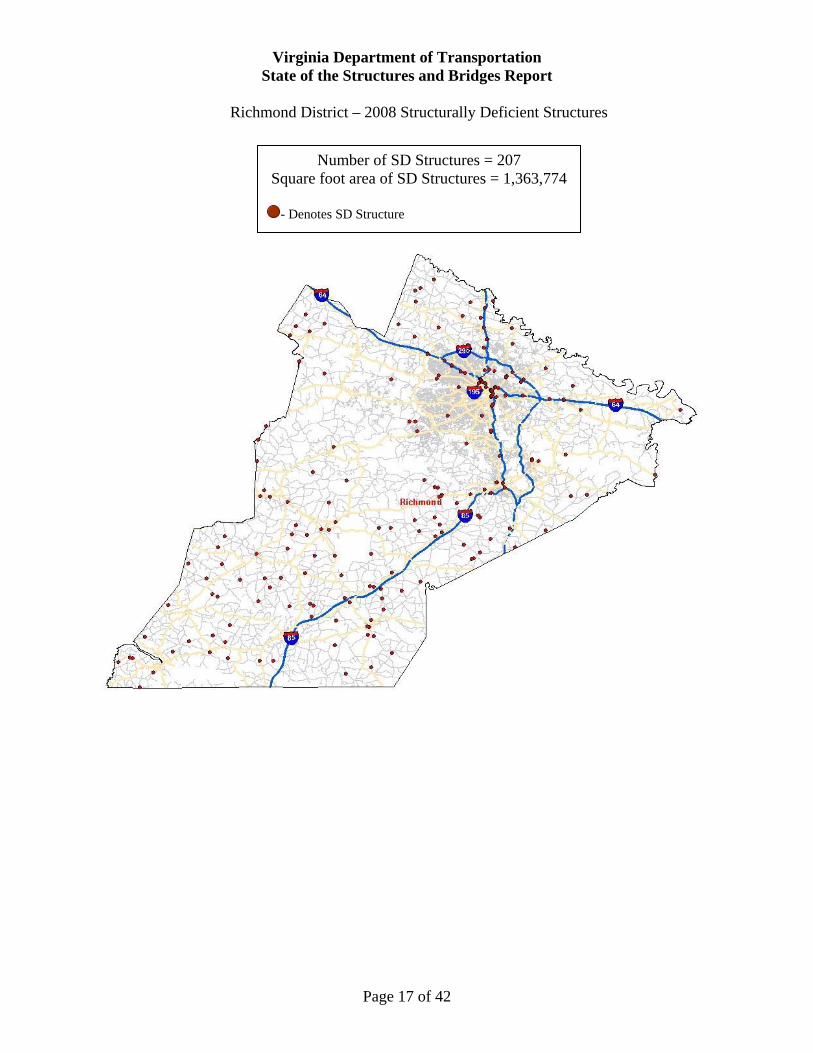
Richmond District – 2008 Structurally Deficient Structures
Number of SD Structures = 207 Square foot area of SD Structures = 1,363,774
- Denotes SD Structure
Page 17 of 42

Virginia Department of Transportation State of the Structures and Bridges Report
Hampton Roads District – 2008 Structurally Deficient Structures
Number of SD Structures = 67 Square foot area of SD Structures = 973,206
- Denotes SD Structure
Page 18 of 42

Virginia Department of Transportation State of the Structures and Bridges Report
Fredericksburg District – 2008 Structurally Deficient Structures
Number of SD Structures = 66 Square foot area of SD Structures = 507,670
- Denotes SD Structure
Page 19 of 42

Virginia Department of Transportation State of the Structures and Bridges Report
Culpeper District – 2008 Structurally Deficient Structures
Number of SD Structures = 121 Square foot area of SD Structures = 210,600
- Denotes SD Structure
Page 20 of 42

Virginia Department of Transportation State of the Structures and Bridges Report
Staunton District – 2008 Structurally Deficient Structures
Number of SD Structures = 297 Square foot area of SD Structures = 550,784
- Denotes SD Structure
Page 21 of 42

Virginia Department of Transportation State of the Structures and Bridges Report
NOVA District – 2008 Structurally Deficient Structures
Number of SD Structures = 49 Square foot area of SD Structures = 285,011
- Denotes SD Structure
Page 22 of 42

Virginia Department of Transportation State of the Structures and Bridges Report
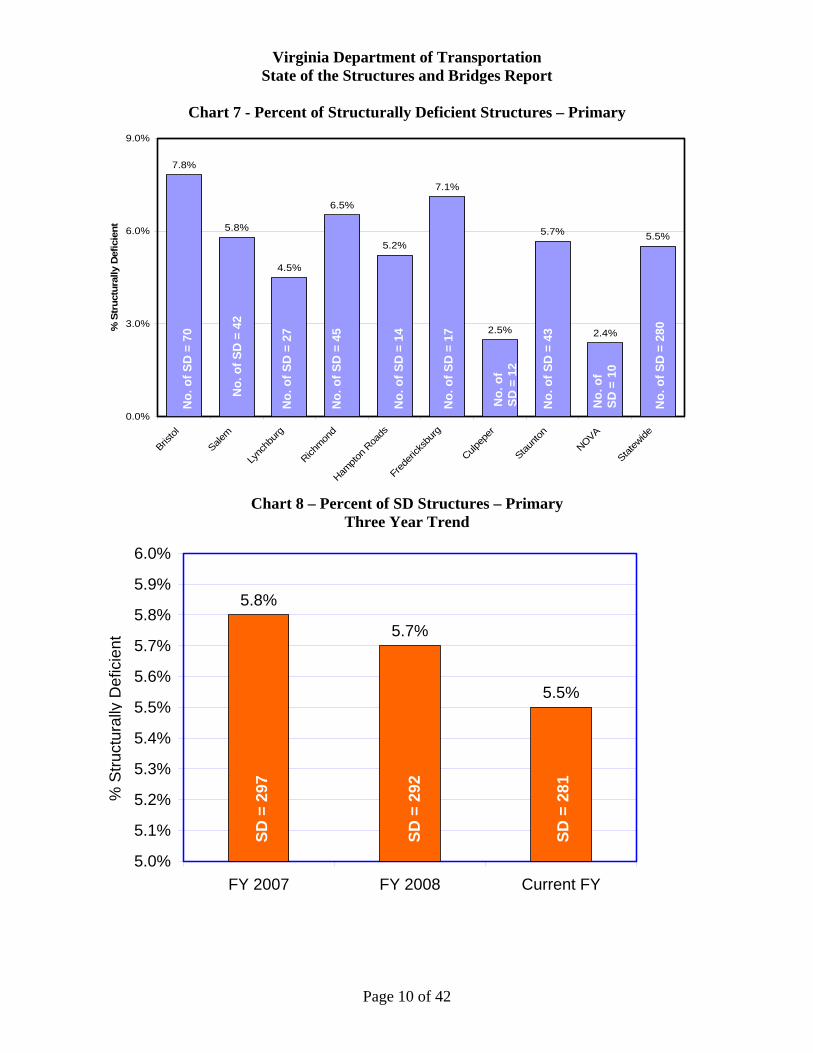
Other performance indicators that are used by VDOT in the overall management of the structural inventory include:
Functionally Obsolete (FO) - An FO structure is one that has an appraisal rating of three (3) or worse for the deck geometry, under clearance, approach roadway alignment, structural condition or waterway adequacy. A FO designation means that the structure was built to standards (deck geometry, load carrying capacity, clearances, or approach roadway alignment) that are less conservative than those used today.
Combining Structurally Deficient and Functionally Obsolete - According to the
Federal Highway Administration a structure is deemed “deficient” if the structure is rated either SD or FO. A deficient structure may not be both SD and FO…. It's one or the other. FHWA uses the combined deficient designation in the allocation of bridge funding per State.
Weight Posted - A weight posted structure is one that has a rated load carrying capacity
less than the Virginia designated legal loads. Virginia legal loads are as follows:
o 27 Tons for a single unit o 40 Tons for semi-trailers
Charts 13 through 32 show a three year trend for the above-mentioned measures. In addition, Appendix D shows the 2008 performance measures based on the square footage area of the structures.
Page 23 of 42

Virginia Department of Transportation State of the Structures and Bridges Report
Functionally Obsolete Measure (Charts 13 – 17)
A functionally obsolete structure is one that has an appraisal rating of three (3) or worse for the deck geometry, under clearance, approach roadway alignment, structural condition or waterway adequacy. A FO designation means that the structure was built to standards (deck geometry, load carrying capacity, clearances, or approach roadway alignment) that are less conservative than those used today.
Chart 13 – Percent of FO Structures – Systemwide Three Year Trend
14.9%
14.8% 14.8%
14.6%
14.7%
14.8%
14.9%
15.0%
FY 2007 FY 2008 Current FY
% D
efic
ient
% F
unct
iona
lly O
bsol
ete
FO
= 3
,094
FO
= 3
,083
FO
= 3
,096
Page 24 of 42

Virginia Department of Transportation State of the Structures and Bridges Report
Chart 14 – Percent of FO Structures – Interstate Chart 15 – Percent of FO Structures – Primary
Three Year Trend Three Year Trend
% F
unct
iona
lly O
bsol
ete
12.1%
12.2%
12.1%
11.7%
11.8%
11.9%
12.0%
12.1%
12.2%
12.3%
FY 2007 FY 2008 Current FY
% D
efic
ient
13.3%
13.4% 13.4%
13.2%
13.3%
13.4%
13.5%
FY 2007 FY 2008 Current FY
% D
efic
ient
F
O =
367
FO
= 3
64
Chart 16 – Percent of FO Structures – Secondary Chart 17 – Percent of FO Structures – Urban
Three Year Trend Three Year Trend
% F
unct
iona
lly O
bsol
ete
15.7%
15.6%
15.7%
15.0%
15.2%
15.4%
15.6%
15.8%
16.0%
FY 2007 FY 2008 Current FY
% D
efic
ient
20.3%
20.6%
20.3%
20.0%
20.2%
20.4%
20.6%
20.8%
FY 2007 FY 2008 Current FY
% D
efic
ient
FO
= 3
64
FO
= 1
,803
FO
= 3
64
FO
= 1
,785
FO
= 3
64
Page 25 of 42

Virginia Department of Transportation State of the Structures and Bridges Report
Structurally Deficient or Functionally Obsolete Measure (Charts 18 - 22)
Combining Structurally Deficient and Functionally Obsolete - According to the Federal Highway Administration a structure is deemed “deficient” if the structure is rated either SD or FO. A deficient structure may not be both SD and FO…. It's one or the other. FHWA uses the combined deficient designation in the allocation of bridge funding per State.
FO
= 2
43
Chart 18 – Percent of SD or FO Structures – Systemwide Three Year Trend
23.2% 23.2%
23.1%
22.8%
23.0%
23.2%
23.4%
FY 2007 FY 2008 Current FY
ent
% D
efic
i%
SD
or
FO
SD
or
FO
= 4
,841
SD
or
FO
= 4
,836
SD
or
FO
= 4
,826
Page 26 of 42

Virginia Department of Transportation State of the Structures and Bridges Report
Chart 19 – Percent of SD or FO Structures Chart– 20 – Percent of SD or FO Structures Interstate Primary
Three Year Trend Three Year Trend
15.1% 15.1%
15.0%
14.5%
14.7%
14.9%
15.1%
15.3%
15.5%
FY 2007 FY 2008 Current FY
% D
efic
ient 19.1%
19.2%
18.9%
18.5%
18.7%
18.9%
19.1%
19.3%
19.5%
FY 2007 FY 200
SD or FO
8 Current FY
% D
efic
ient
Chart 21 - Percent of SD or FO Structures Chart 22 - Percent of Structures Secondary Urban
Three Year Trend Three Year Trend
% S
D o
r F
O
SD
or
FO
= 4
49
26.7% 26.7% 26.7%
26.4%
26.5%
26.6%
26.7%
26.8%
FY 2007 FY 2008 Current FY
% D
efic
ient 28.8%
28.9%
28.7%
28.5%
28.6%
28.7%
28.8%
28.9%
29.0%
FY 2007 FY 2008 Current FY
% D
efic
ient
% S
D o
r F
O
Page 27 of 42

Virginia Department of Transportation State of the Structures and Bridges Report
Page 28 of 42
Weight Posted Structures Measure (Charts 23 – 27)
Weight Posted - A weight posted structure is one that has a rated load carrying capacity less than the Virginia designated legal loads. Virginia legal loads are as follows:
o 27 Tons for a single unit o 40 Tons for semi-trailers
Chart 23 – Percent of Weight Posted Structures – Systemwide Three Year Trend
7.5%
7.3%
7.2%
7.1%
7.2%
7.3%
7.4%
7.5%
7.6%
FY 2007 FY 2008 Current FY
% D
efic
ient
% W
eigh
t Pos
ted
SD
or
FO
=
339
Po
sted
= 1
,569
Po
sted
= 1
,523
Po
sted
=
1,50
6
\

Virginia Department of Transportation State of the Structures and Bridges Report
Page 29 of 42
Chart 24 – Percent of Weight Posted Structures – Chart 25 – Percent of Weight Posted Structures Interstate Primary
Three Year Trend Three Year Trend
1.4% 1.4%
1.5%
1.0%
1.1%
1.2%
1.3%
1.4%
1.5%
1.6%
FY 2007
0.2%
0.1% 0.1%
0.0%
0.
0.
0.
0.
% D
efic
ient
1%
1%
2%
2%
0.3%
FY 2007 2008 Current FY
% W
eigh
t Pos
ted
FY 20FY 08 Current FY
% D
efic
ient
–
hart 26 – Percent of Weight Posted Structures – Chart 27 – Percent of Weight Posted Structures Secondary Urban
Three Year Trend Three Year Trend
C
12.3%
11.9%
11.7%
11.5%
11.6%
11.7%
11.8%
11.9%
12.0%
12.1%
12.2%
12.3%
12.4%
6.8% 6.8%
6.3%
5.0%
5.5%
6.0%
6.5%
7.0%
% D
efic
ient
FY 2007 FY 2008 Current FY FY 2007 FY 2008 Current FY
% D
efic
ient
% W
eigh
t Pos
ted
Po
sted
= 3

Virginia Department of Transportation State of the Structures and Bridges Report
Appendix A– General Condition Ratings General Condition Ratings (GCR’s): According to the National Bridge Inventory (NBI), Condition ratings are used to describe the existing, in-place bridge or culvert as compared to the as-built condition. Evaluation is for the materials related, physical condition of the deck, superstructure and substructure components of a bridge. GCR’s is a numerical system that ranges from 0 (failed condition) to 9 (excellent condition). The following general condition ratings are used as a guide in evaluating bridge decks, bridge superstructures, bridge substructures, and culverts.
Code Description N NOT APPLICABLE 9 EXCELLENT CONDITION 8 VERY GOOD CONDITION
No problems noted. 7 GOOD CONDITION
6 SATISFAStr
5 FAIR CONDITION All primary structural elements are sound but may have some minor section loss, cracking, spalling or scour
4 POOR CONDITION Advanced section loss, deterioration, spalling or scour.
3 SERIOUS CONDITION Loss of section, deterioration, spalling or scour have seriously affected primary structural components. Local failures are possible. Fatigue cracks in steel or shear cracks in concrete may be present.
2 CRITICAL CONDITION Advanced deterioration of primary structural elements. Fatigue cracks in steel or shear cracks in concrete may be present or scour may have removed substructure support. Unless closely monitored it may be necessary to close the bridge until corrective action is taken.
1 "IMMINENT" FAILURE CONDITION Major deterioration or section loss present in critical structural components or obvious vertical or horizontal movem nt affecting structure stability. Bridge is closed to traffic but corrective action may put back in light service.
0 FAILED CONDITION Out of service - beyond corrective action.
Some minor problems. CTORY CONDITION
uctural elements show some minor deterioration.
e
Page 30 of 42
Virginia Department of Transportation State of the Structures and Bridges Report
or the evaluation of a structure’s safety and for decisions on planning, budgeting, and erforming of maintenance, repair, rehabilitation and replacement of our structures. Since 1991,
the Structure and Bridge Division (S&B) has had in place a policy for the quality control and quality uran afety inspection program. In January 2005, the NBIS portion of the de o amended to require each state to “Assure systematic quality ntrol dures are used to maintain a high degree of accuracy and co stenc rogram. Include periodic field review of inspection teams, periodi ridg training for Program Managers and Team Leaders, and indepen nt re omputations.”
e NB plete the FHWA - Nati ridges’ within the first five (5) years of employment in bridge inspection. In addition to this require nt, V nspection personnel to successfully complete the NHI course ‘Bridge Inspec DOT requires the underwater inspect to fu ments as set forth in the VDOT ‘Dive Safety Manual’.
Both th d validate inspect rep es found during field and office reviews perform by b report and shared wit
It is im s’ are shared throughout the state. It is also important to correct accur a misunderstanding or misapplication of a policy/procedu Office review VDOT spect ate cost of $16 million annually for safety inspe
Appendix B– Quality Assurance Program
The accuracy, thoroughness and completeness of the bridge safety inspections are essential fp
ass ce of the structure sCo f Federal Regulations was co and quality assurance procensic b
y in the inspection pe inspection refresher
de view of inspection reports and c
Th IS requires Program Managers and Team Leaders to successfully comonal Highway Institute (NHI) course ‘Safety Inspection of In-Service B
me DOT S&B requires ition Refresher Training’ every three (3) years. V
ors lfill the training require
e Central Office and the Districts have a responsibility to review an. Discrepanciion
edorts and inventory dataoth District and Central Office personnel shall be documented in a written
h all parties involved.
portant that ‘best practice in acies that are discovered that indicate
re. Each year a summary report is compiled of the findings of the Centraland sent to all Districts by March of the following year.
in s over 10,000 structures annually at an approximction services.
Page 31 of 42

Virginia Department of Transportation State of the Structures and Bridges Report
Virginia Department of Transportation State of the Structures and Bridges Report
Page 32 of 42
s
Appendix C– National Performance Trend
Chart C.1 - Comparing Virginia's SD Structures to the NationalAverage
8.0%
10.0%
12.0%
14.0%
16.0%
% S
tru
ctu
rall
y D
efic
ien
t
6.0%
0.0%
2.0%
4.0%
National 12.1% 12.4% 12.8% 13.1% 13.5% 13.8% 14.2% 14.8%
VA 9.0% 9.0% 9.0% 9.0% 8.9% 9.1% 9.6% 9.7%
2007 2006 2005 2004 2003 2002 2001 2000
National VA
Chart C.2 - Comparing Virginia's FO Structures to the NationalAverage
0.0%
2.0%
4.0%
6.0%
8.0%
10.0%
% F
un
ctio
nal
ly O
bso
lete
18.0%
20.0%
16.0%
12.0%
14.0%
National 13.3% 13.4% 13.5% 13.6% 13.7% 13.8% 13.8% 13.8%
VA 16.7% 16.6% 16.6% 16.4% 17.2% 17.4% 17.5% 18.0%
2007 2006 2005 2004 2003 2002 2001 2000
National VA
Page 32 of 42
Virginia Department of Transportation State of the Structures and Bridges Report
Page 33 of 42
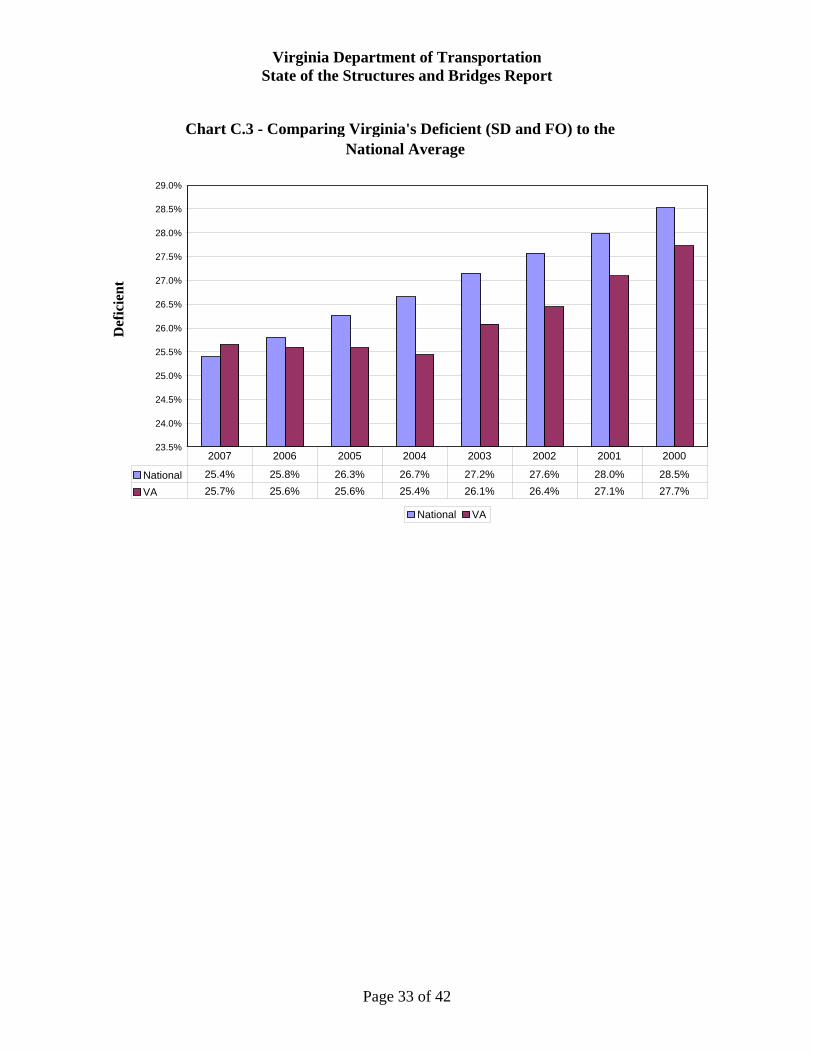
Chart C.3 - Comparing Virginia's Deficient (SD and FO) to the
27.5%
28.0%
28.5%
De
National Average
29.0%
27.0%
fici
ent
26.5%
26.0%
25.5%
25.0%
24.5%
24.0%
23.5%
National 25.4% 25.8% 26.3% 2 27 27.6% 28.0% 28.5%6.7% .2%
VA 25.7% 25.6% 25.6% 25.4% 26.1% 26.4% 27.1% 27.7%
2007 2006 2005 2004 2003 2002 2001 2000
National VA

Virginia Department of Transportation State of the Structures and Bridges Report
Appendix D– Square Foot Area of Structures D.1 – Square Foot Area of Structure
Sq-Ft Area of Structures (Bridges and Culverts)
s System wide
DIST T Interstate Primary Secondary Urban Other Total
RIC
Bristol 2,072,910 3,742,642 2,402,541 376,452 0 8,594,545 Salem 2,078,123 3,664,472 2,778,789 1,174,548 2,969 9,698,902
Lynchburg 0 3,748,581 2,599,295 1,074,660 0 7,422,536 Richmond 8,881,967 6,274,547 2,551,077 1,966,241 1,116,202 20,790,035
Hampt oads 12,275,642 10,096,253 861,112 5,644,380 12,617 28,890,004 on RFreder 1,010,359 2,594,839 848,832 115,074 10,145 4,579,250 icksburg
Culpeper 1,345,510 1,664,418 1,515,010 180,419 5,386 4,710,743 Staunton 4,177,010 2,767,075 2,581,724 656,659 0 10,182,468 NOVA 7,055,406 3,451,340 5,355,812 573,125 562,278 16,997,962
Statewide 38,896,927 38,004,168 21,494,194 11,761,559 1,709,598 111,866,445
Square Foot Area of Structures Systemwide
0
5,000,000
10,000,000
15,000,000
20,000,000
25,000,000
30,000,000
35,000,000
Bristol
Salem
Lynch
burg
Richmon
d
Hampt
on R
oads
Freder
icksb
urg
Culpe
per
Staunto
n
NOVA
Sq
uar
e F
oot
Are
a
Page 34 of 42

Virginia Department of Transportation State of the Structures and Bridges Report
nt Structures Systemwide D.2 – Square Foot Area of Structurally Deficie
Sq-Ft Area of Structurally Deficient Structures DISTRICT
Interstate Primary Secondary Urban Other Total
Bristol 111,244 741,059 319,162 250,747 59,906 0
Salem 2 55 677,645 198,118 159,670 271,60 48,2 0
Lynchburg 3 65 0 209,656 176,95 91,2 0 477,875
Richmond 9 3 542,108 541,054 168,09 112,51 0 1,363,774
Hampton Roads 35 05 2 4 0,8 129,515 31,39 461,49 0 973,206
Fr g 4 3edericksbur 53,358 368,745 55,09 30,47 0 507,670
Culpeper 20,280 39,816 105,992 7 44,05 456 210,600
Staunton 87,276 178,116 32 60 221,2 64,1 0 550,784
NOVA 122,047 114,124 0 48,84 0 0 285,011
Statewide 1,485,235 2,059,859 50 23 1,329,9 912,1 456 5,787,623
Square Foot Area of SD Structures Systemwide
0
200,000
400,000
600,000
800,000
1,000,000
1,200,000
1,400,000
1,600,000
Bristol
Salem
Lynch
burg
Richm
ond
Hampt
on R
oads
Frederi
cksb
urg
Culpe
per
Staunto
n
NOVA
Sq
-Ft
Str
uct
ura
lly
Def
icie
nt
Page 35 of 42

Virginia Department of Transportation State of the Structures and Bridges Report
stemwide
Perce ures
D.3 – Percent of Square Foot Area of Structurally Deficient Structures Sy
nt of Sq-Ft Area of Structurally Deficient StructDISTRICT Interstate Primary y n er l Secondar Urba Oth Tota
Bristol 5.4% 8.5% 10.4% % .0% 15.9 0 8.6%
Salem 9.5% 4.4% 9.8% .0% 4.1% 0 7.0%
Lynchburg 0 .0% .0% 5.6% 6.8% 8.5% 0 6.4%
Richmond 6.1% 8.6% 6.6% .0% 5.7% 0 6.6%
Hampton Roads 2.9% 1.3% 3.6% .0% 8.2% 0 3.4%
Fredericksburg 5.3% 14.2% 6.5% % .0% 26.5 0 11.1%
Culpeper 1.5% 2.4% 7.0% % 5% 24.4 8. 4.5%
Staunton 2.1% 6.4% 8.6% .0% 9.8% 0 5.4%
NOVA 1.7% 3.3% 0.9% .0% .0% 0 0 1.7%
Statewide 3.8% 5.4% 6.2% 7.8% 0% 0. 5.2%
Percent of Square Foot Area of Structurally Deficient Structures
8.6%
7.0%
6.4% 6.6%
3.4%
11.1%
4.5%
5.4%
1.7%
5.2%
0.0%
2.0%
4.0%
6.0%
8.0%
10.0%
12.0%
Bristol
Salem
Lynch
burg
Richmon
d
Hampt
on R
oads
Freder
icksb
urg
Culpe
per
Staunto
n
NOVA
Statew
ide
% S
q-F
t S
tru
ctu
rall
y D
efic
ien
t
SD
Are
a =
741
,059
SD A
rea
= 6
77,6
45
SD A
rea
= 4
77,8
75
SD A
rea
= 1
,363
,774
SD A
rea
= 9
73,2
06
SD
Are
a =
507
,670
SD A
rea
= 2
10,6
00
SD A
rea
= 5
50,7
84
SD A
rea
= 2
85,0
11
SD
Are
a =
5,7
87,6
23
Page 36 of 42

Virginia Department of Transportation State of the Structures and Bridges Report
D.4 – Square Foot Area of Functionally Obsolete Structures Systemwide
Sq-Ft Area of Functionally Obsolete Structures DISTRICT
I Pr Seco rba th Total nterstate imary ndary U n O er
Bristol 267,154 366,664 251,856 51,132 0 936,806
Salem 341,068 555,361 467,793 366,439 0 ,731 0,662
Lynchburg 0 318 187,619 377,049 0 883,725 ,393
Richmond 688,435 1,122,186 249,999 520,585 0 ,582 1,205
Hampton Roads 2,232,768 2,383,049 112,69 1,026,311 0 ,757 5 4,824
Fredericksburg 61,028 506,266 56,390 0 0 623,684
Culpeper 71,356 102,732 201,914 43,341 0 419,343
Staunton 326,819 467,884 274,121 111,269 0 ,181 0,093
NOVA 1,220,694 379,378 463,893 85,48 ,161 17,625 2 7,072
Statewide 5,2 6,202,245 2,266,283 2,581,607 6,2709,321 17,625 1 7,080
Square Foot Area of Functionally Obsolete Structures Systemwide
0
1,000,000
2,000,000
3,000,000
4,000,000
5,000,000
6,000,000
7,000,000
Bristol
Salem
Lynch
burg
Richmon
d
Hampt
on R
oads
Freder
icksb
urg
Culpe
per
Staunto
n
NOVA
Sq-F
t F
unct
ion
ally
Obs
olet
e
Page 37 of 42

Virginia Department of Transportation State of the Structures and Bridges Report
stem wide
Perce ures
D.5 – Percent of Square Foot Area of Functionally Obsolete Structures Sy
nt of Sq-Ft Area of Functionally Obsolete StructDISTRICT
Interstate y ary ban er l Primar Second Ur Oth Tota
Bristol 12.9% 9.8% % .6% 0.0% 10.5 13 10.9%
Salem 16.4% 15.2% % 2% 0.0%16.8 31. 17.8%
Lynchburg 0 % % 1% 0.0% .0 8.5% 7.2 35. 11.9%
Richmond 7.8% 17.9% % 5% 0.0%9.8 26. 12.4%
Hampton Roads 18.2% 23.6% % % 0.0%13.1 18.2 19.9%
Fredericksburg 6.0% 19.5% % 0.0% 6.6 0.0% 13.6%
Culpeper 5.3% 6.2% % 0% 0.0%13.3 24. 8.9%
Staunton 7.8% 16.9% % 9% %10.6 16. 0.0 11.6%
NOVA 17.3% 11.0% % %8.7% 14.9 3.1 12.7%
Statewide 13.4% 16.3% % % %10.5 21.9 1.0 14.6%
Percent Square Foot Area of Functionally Obsolete Structures Systemwide
10.9%
17.8%
11.9% 12.4%
19.9%
13.6%
8.9%
11.6%12.7%
14.6%
0.0%
5.0%
10.0%
15.0%
20.0%
25.0%
Bristol
Salem
Lynch
burg
Richmon
d
Hampt
on R
oads
Freder
icksb
urg
Culpe
per
Staunt
on
NOVA
Statew
ide
% S
q-F
t F
un
ctio
nal
ly O
bso
lete
FO
= 9
36,8
06
FO
= 1
,730
,662
FO
= 8
83,3
93
FO
= 2
,581
,205
FO
= 5
,754
,824
FO
= 6
23,6
84
FO
= 4
19,3
43
FO
= 1
,180
,093
FO
= 2
,167
,072
FO
= 1
6,27
7,08
0
Page 38 of 42
Virginia Department of Transportation State of the Structures and Bridges Report
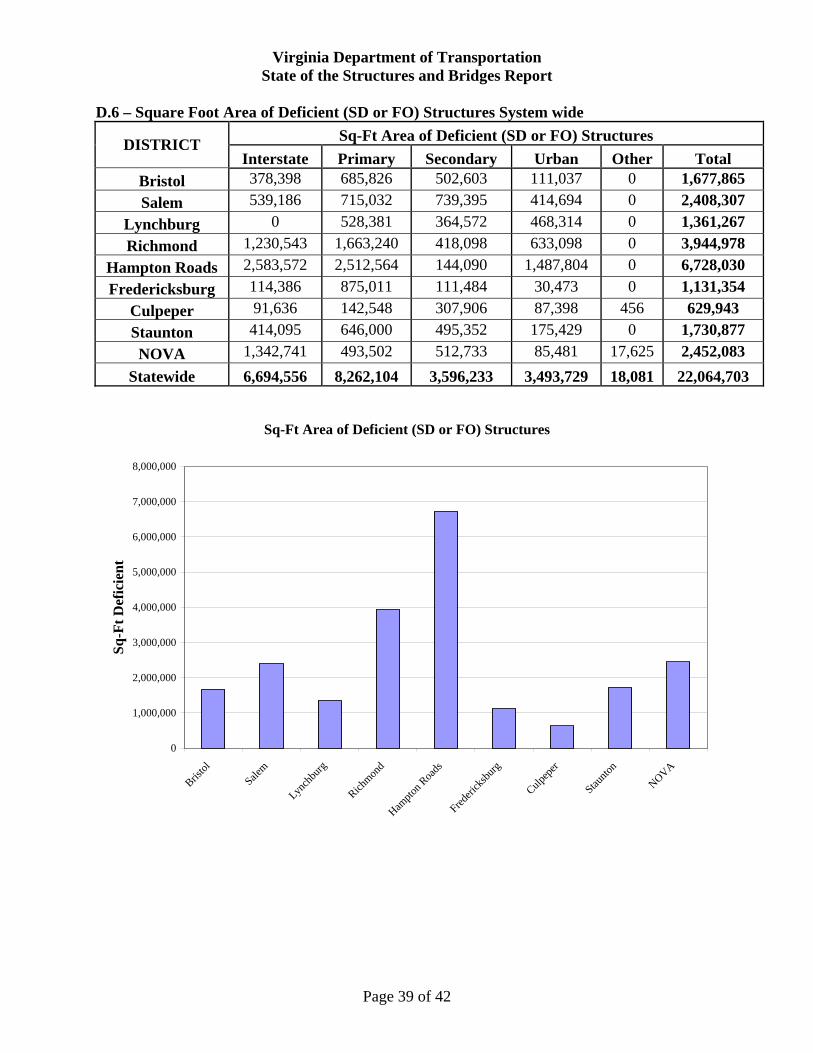
D.6 – Square Foot Area of Deficient (SD or FO) Structures System wide
Sq-Ft Area of Deficient (SD or FO) Structures DISTRICT
I Pr Seco rba th Total nterstate imary ndary U n O er
Bristol 378,398 685,826 502,603 111,037 0 ,671 7,865
Salem 539,186 715,032 739,395 414,694 0 ,402 8,307
Lynchburg 0 528 364,572 468,314 0 ,36,381 1 1,267
Richmond 1,230,543 1,663,240 418,09 633,0 0 ,948 98 3 4,978
Hampton Roads 2,583,572 2,512,564 144,0 1,487, 0 ,7290 804 6 8,030
Fredericksburg 114,386 875,011 111,484 30,473 0 ,131 1,354
Culpeper 91,636 142,548 307,906 87,398 456 629,943
Staunton 414,095 646,000 495,352 175,429 0 1,730,877
NOVA 1,342,741 493,502 512,7 85,48 7,62 ,4533 1 1 5 2 2,083
S tatewide 6,6 8,262,104 3,596,233 3,493,729 8,08 2,094,556 1 1 2 64,703
Sq-Ft Area of Deficient (SD or FO) Structures
0
1,000,000
2,000,000
3,000,000
4,000,000
5,000,000
6,000,000
7,000,000
8,000,000
Bristol
Salem
Lynch
burg
Richmon
d
Hampt
on R
oads
Freder
icksb
urg
Culpe
per
Staunto
n
NOVA
Sq
-Ft
Def
icie
nt
Page 39 of 42

Virginia Department of Transportation State of the Structures and Bridges Report
stemwide
Perce ures
D.7 – Percent of Square Foot Area of Deficient (SD or FO) Structures Sy
nt of Sq-Ft Area of Deficient (SD or FO) StructDISTRICT
Interstate y ary ban er l Primar Second Ur Oth Tota
Bristol 18.3% 18.3% % 5% 0.0%20.9 29. 19.5%
Salem 25.9% 19.5% % 3% 0.0%26.6 35. 24.8%
Lynchburg 0 % % 6% 0.0%.0 14.1% 14.0 43. 18.3%
Richmond 13.9% 26.5% % 2% 0.0%16.4 32. 19.0%
Hampton Roads 21.0% 24.9% % % 0.0%16.7 26.4 23.3%
Fredericksburg 11.3% 33.7% % .5% .0%13.1 26 0 24.7%
Culpeper 6.8% 8.6% % 4% .5%20.3 48. 8 13.4%
Staunton 9.9% 23.3% % 7% %19.2 26. 0.0 17.0%
NOVA 19.0% 14.3% % %9.6% 14.9 3.1 14.4%
17.2% 21.7% 16.7% 29.7% 1.1% 19.7% Statewide
Percent of Sq-Ft Area of Deficient (SD or FO)Structures Systemwide
19.5%
24.8%
18.3% 19.0%
23.3%24.7%
13.4%
17.0%
14.4%
19.7%
0.0%
5.0%
10.0%
15.0%
20.0%
25.0%
30.0%
Bristol
Salem
Lynch
burg
Richmon
d
Hampt
on R
oads
Freder
icksb
urg
Culpe
per
Staunt
on
NOVA
Statew
ide
% S
q-F
t D
efic
ien
t
Def
= 1
,677
,865
Def
. =2,
408,
307
Def
.= 1
,361
,267
Def
. = 3
,944
,978
Def
. = 6
,728
,030
Def
. = 1
,131
,354
Def
. = 6
29,9
43
Def
. = 1
,730
,877
Def
. = 2
,452
,083
Def
. = 2
2 ,06
4,70
3
Page 40 of 42

Virginia Department of Transportation State of the Structures and Bridges Report
D.8 – Square Foot Area of Weight Posted Structures Systemwide
Sq-Ft Area of Weight Posted Structures DISTRICT
I P Secondary Urban Total nterstate rimary Other
Bristol 6,996 83 229,215 19,713 0 33,184 9,108
Salem 12,811 12,727 269,803 60,062 0 355,403
Lynchburg 0 44 213,407 3,8 0 26,956 59 2,222
Richmond 0 17 147,300 5,0 0 338,417 99 0,815
Hampton Roads 0 16 77,088 158, 0 406,647 399 2,134
Fredericksburg 0 4 28,397 1,4 0 34,468 72 ,337
Culpeper 0 25 114,439 5,0 912 14,721 17 6,089
Staunton 0 99,155 146,928 39,122 0 285,206
NOVA 0 6 19,679 0 0 26,425 ,104
S 1 621,701 1,246,255 292,743 912 2,181,417 tatewide 9,807
Sq-Ft Area of Weight Posted Structures
0
50,000
100,000
150,000
200,000
250,000
300,000
350,000
400,000
450,000
Bristol
Salem
Lynch
burg
Richmon
d
Hampt
on R
oads
Freder
icksb
urg
Culpe
per
Staunt
on
NOVA
Sq
-Ft
Pos
ted
Page 41 of 42

Virginia Department of Transportation State of the Structures and Bridges Report
Page 42 of 42
stemwide
Perce ures
D.9 – Percent of Square Foot Area of Weight Posted Structures Sy
nt of Sq-Ft Area of Weight Posted StructDISTRICT
Interstate Primary ry an her l Seconda Urb Ot Tota
Bristol 0.3% 2.2% % 0.0% 9.5% 5.2 3.9%
Salem 0.6% 0.3% % 0.0% 9.7% 5.1 3.7%
Lynchburg 0 4% 0.0% .0% 1.2% 8.2% 0. 3.5%
Richmond 0 3% 0.0% .0% 2.8% 5.8% 0. 1.6%
Hampton Roads 0 % % 0.0% .0% 1.7% 9.0 2.8 1.4%
Fredericksburg 0 % 3% 0.0% .0% 0.2% 3.3 1. 0.7%
Culpeper 0 8% 6.9% .0% 1.5% 7.6% 2. 1 3.1%
Staunton 0 % 0.0% .0% 3.6% 5.7% 6.0 2.8%
NOVA 0 % 0.0% 0.0% .0% 0.2% 0.4 0.2%
Statewide 0.1% 1.6% 5.8% % .1%2.5 0 2.0%
Percent Sq-Ft Area of Weight Posted Structures
3.9%
3.7%3.5%
1.6%1.4%
0.7%
3.1%
2.8%
0.2%
2.0%
0.0%
0.5%
1.0%
1.5%
2.0%
2.5%
3.0%
3.5%
4.0%
4.5%
Bristol
Salem
Lynch
burg
Richmon
d
Hampt
on R
oads
Freder
icksb
urg
Culpe
per
Staunto
n
NOVA
Statew
ide
% P
oste
d
Pos
t =
339
,108
Pos
t =
355
,403
Pos
et =
262
,222
Pos
t=33
0,81
5
Pos
t=40
2,13
4
Pos
t=34
,337
Pos
t =
146
,089
Pos
t =
285
,206
Pos
t =
285
,206
Pos
t =
2,1
81,4
17