Embed Size (px)
Citation preview

State of the Nation’s Housing Markets
2nd Quarter 2010 Update
Kevin P. KaneChief Housing Market Analyst
Office of Policy Development and ResearchSpecial Thanks – Randall Goodnight (Ft. Worth)
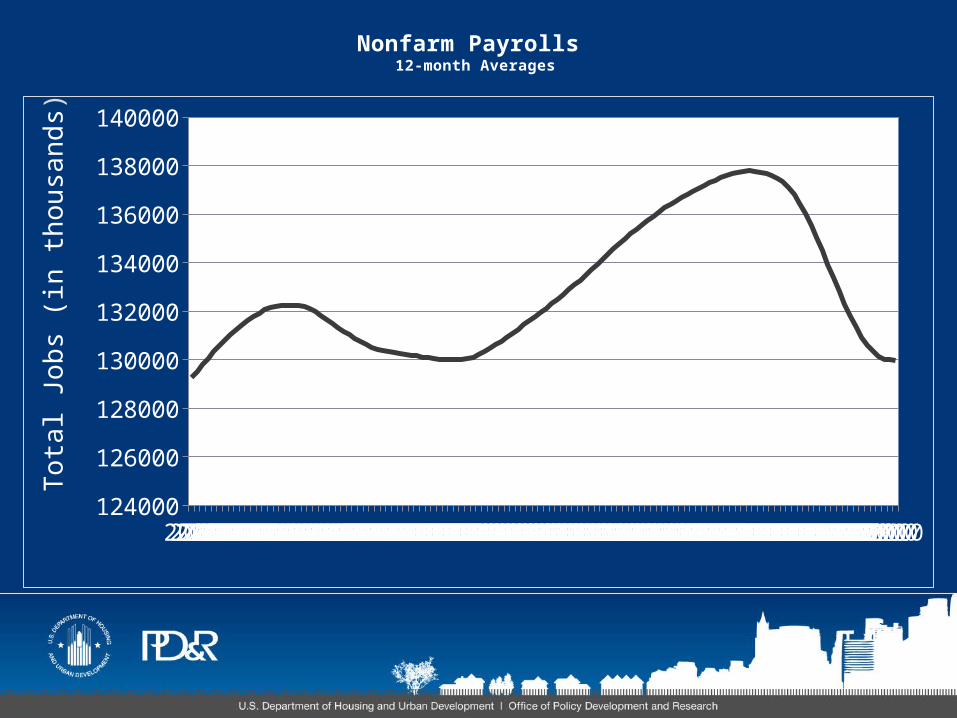
Nonfarm Payrolls 12-month Averages
200020002000200020002000200020002000200020002000200120012001200120012001200120012001200120012001200220022002200220022002200220022002200220022002200320032003200320032003200320032003200320032003200420042004200420042004200420042004200420042004200520052005200520052005200520052005200520052005200620062006200620062006200620062006200620062006200720072007200720072007200720072007200720072007200820082008200820082008200820082008200820082008200920092009200920092009200920092009200920092009201020102010201020102010124000
126000
128000
130000
132000
134000
136000
138000
140000
Tot
al J
obs
(in
thou
sand
s)
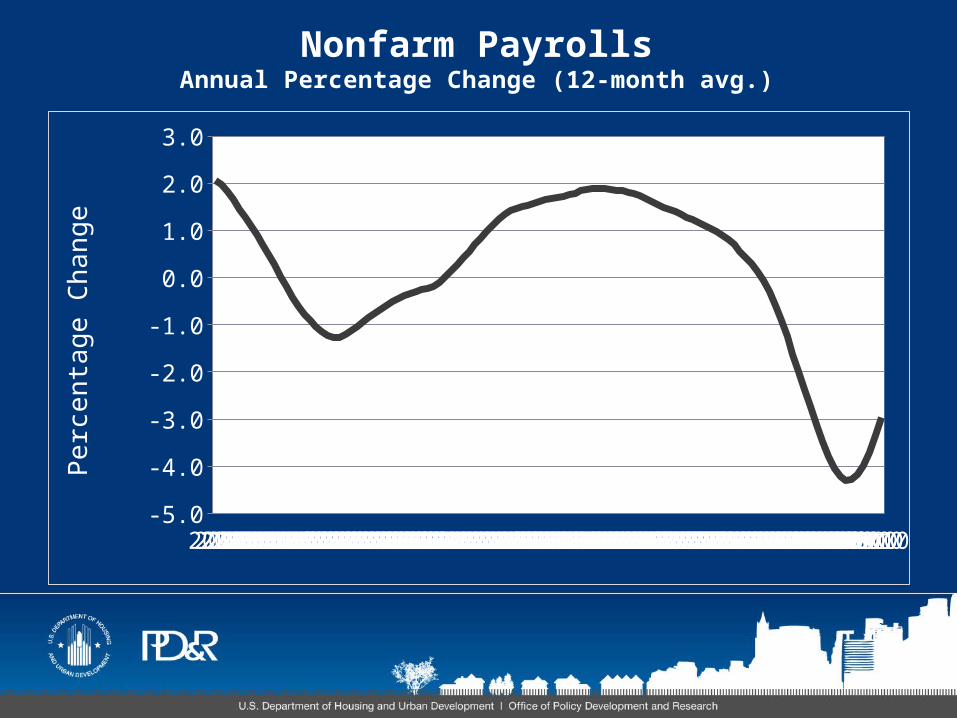
Nonfarm PayrollsAnnual Percentage Change (12-month avg.)
200120012001200120012001200120012001200120012001200220022002200220022002200220022002200220022002200320032003200320032003200320032003200320032003200420042004200420042004200420042004200420042004200520052005200520052005200520052005200520052005200620062006200620062006200620062006200620062006200720072007200720072007200720072007200720072007200820082008200820082008200820082008200820082008200920092009200920092009200920092009200920092009201020102010201020102010-5.0
-4.0
-3.0
-2.0
-1.0
0.0
1.0
2.0
3.0
Per
cent
age
Cha
nge

Regional Nonfarm PayrollsPercentage Change 12 months ending June 2010
New E
nglan
d
Mid-
Atlant
ic
Midw
est
Great
Plai
ns
Pacific
-6-5-4-3-2-10


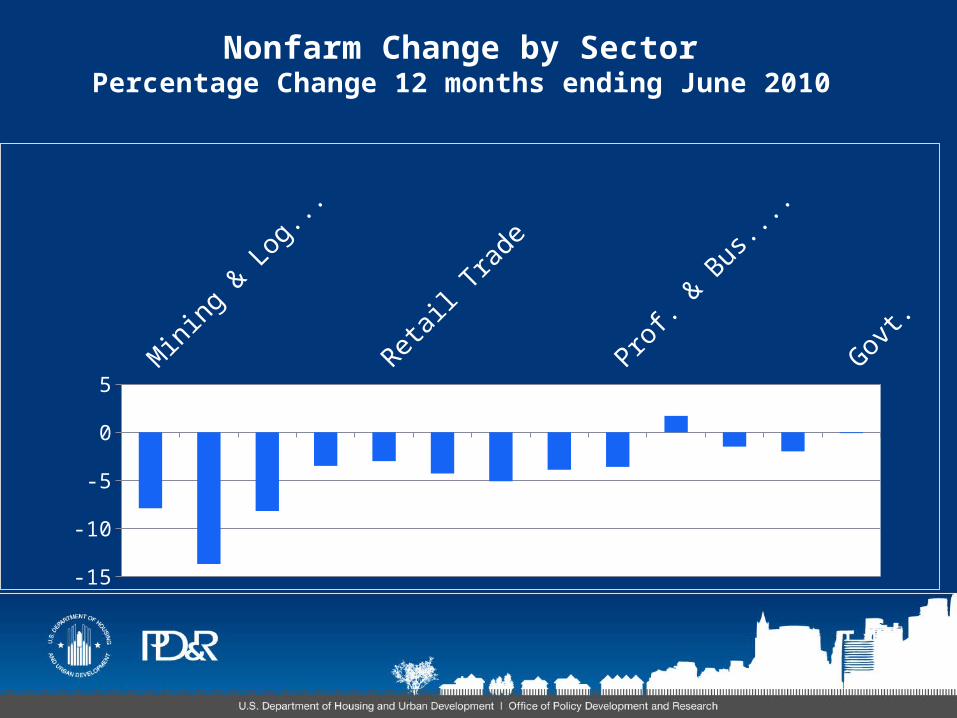
Nonfarm Change by SectorPercentage Change 12 months ending June 2010
Mini
ng &
Log
ging
Who
lesale
Tra
de
Info
rmat
ion
Ed. &
Hea
lth S
erv.
Govt.
-15
-10
-5
0
5


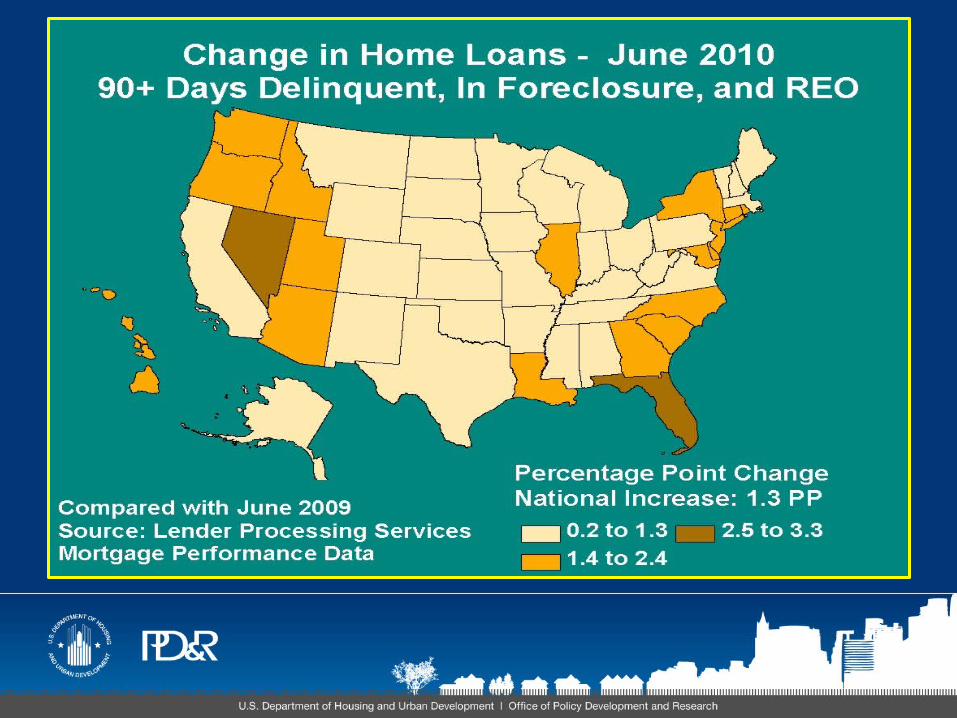
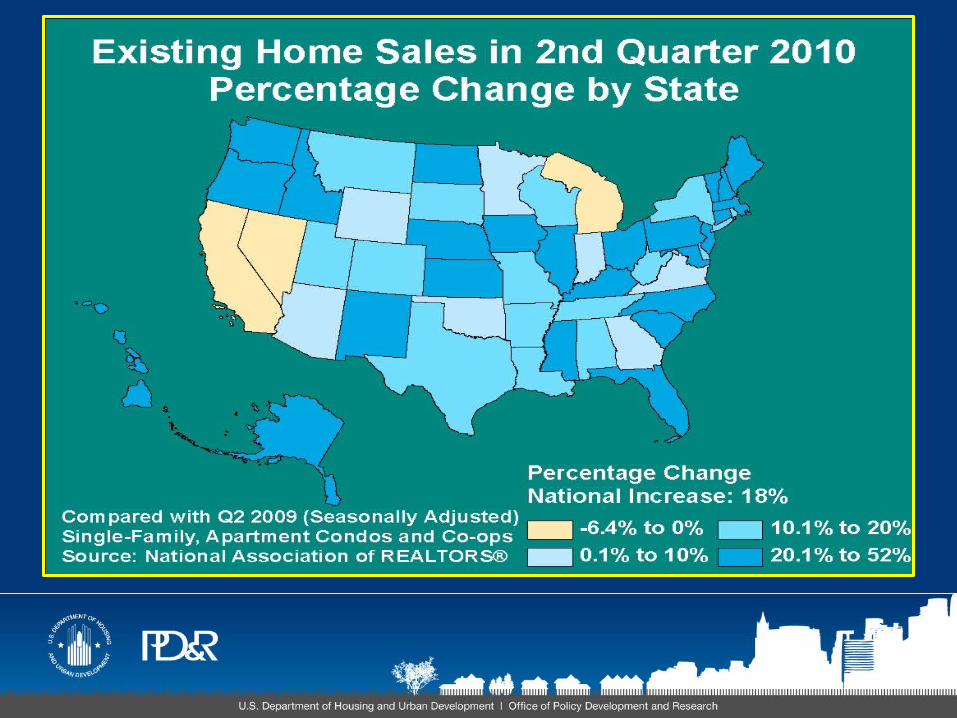
U.S. Housing Market Conditions: 2Q 2010 • Sales market conditions remain soft in much of the
country but continue to improve in many areas
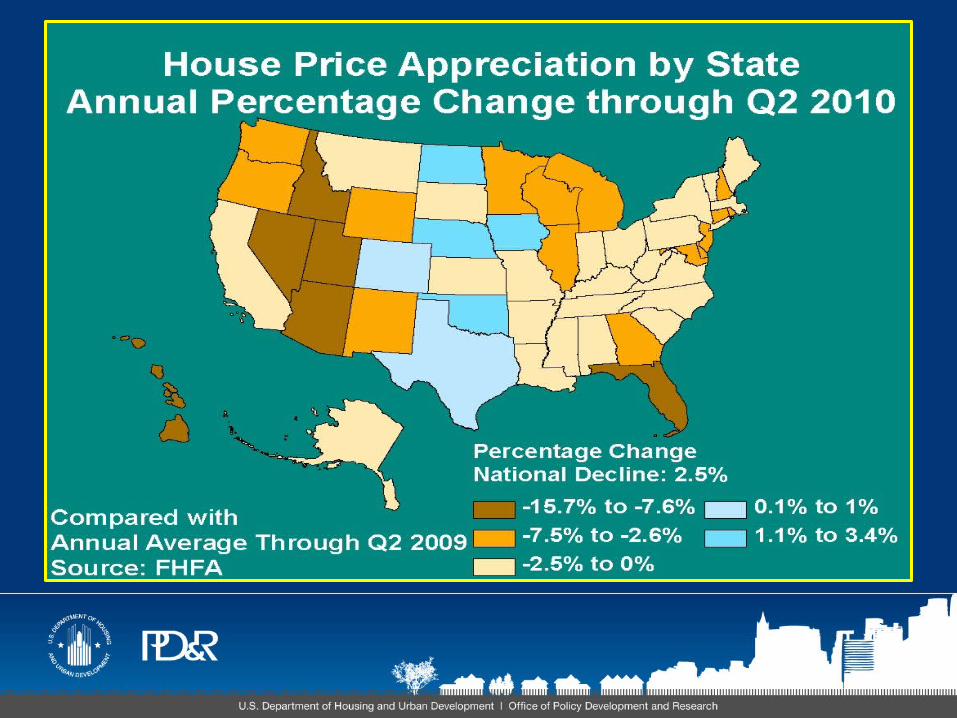
• Data on home sales prices indicate improvement
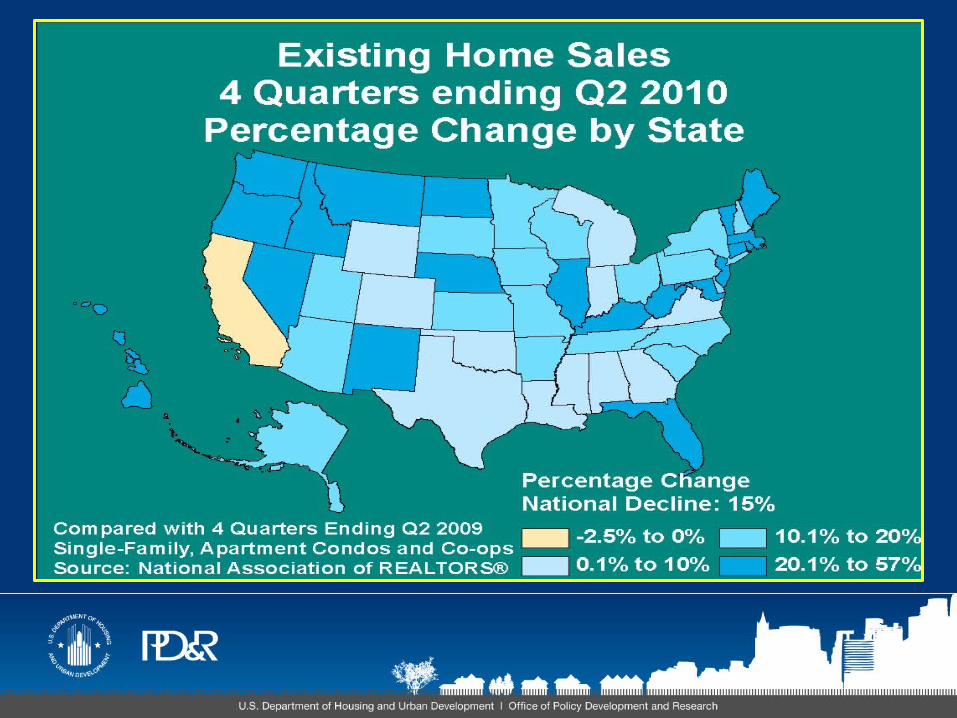
• Home sales are up (homebuyer tax credit)
• Inventories of new and existing homes for sale are down from a year ago and coming closer to balance
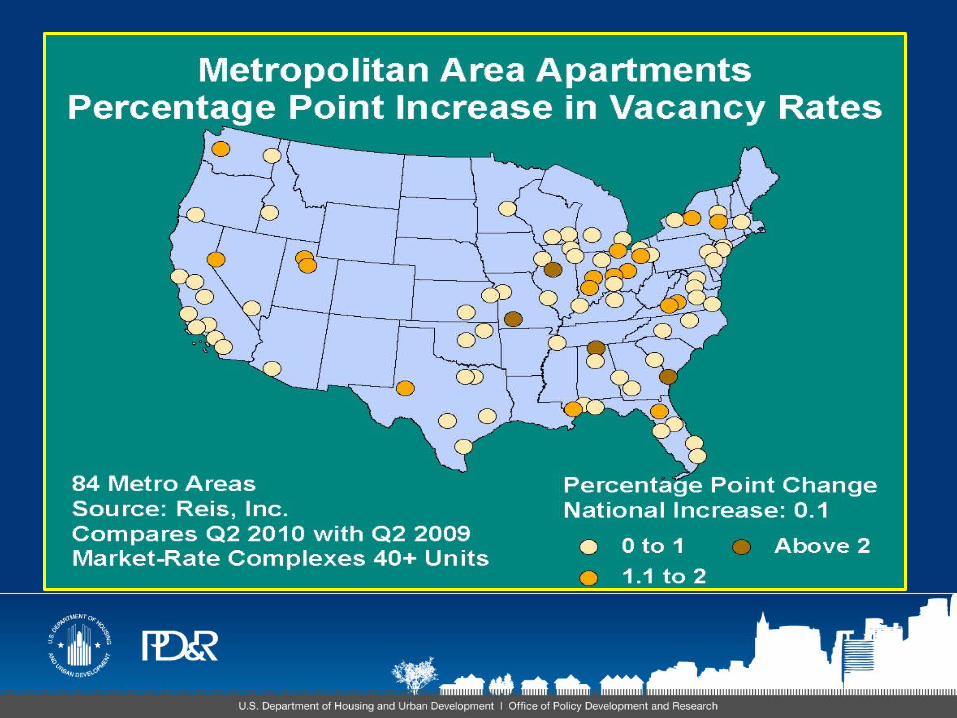
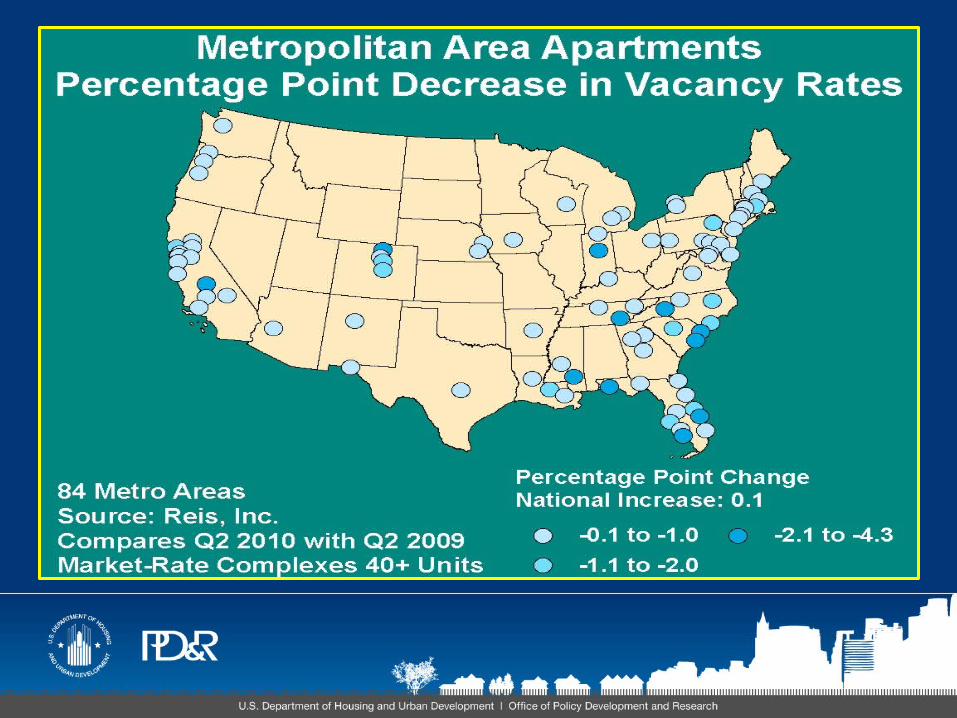
• Rental market conditions are mixed throughout the country
• Significant declines in multifamily permits have continued
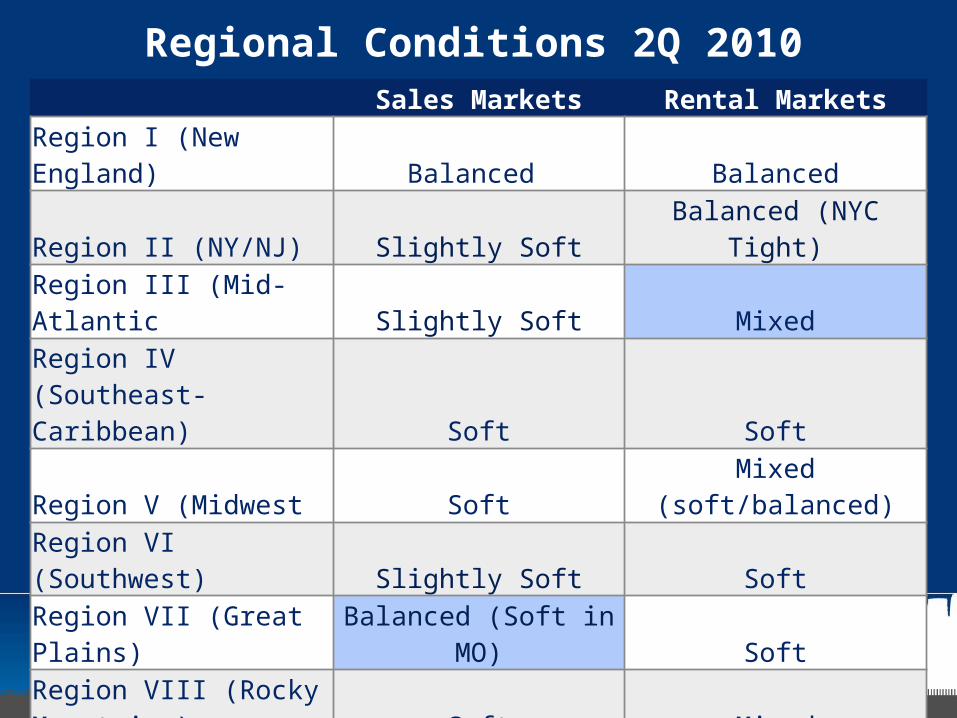
Regional Conditions 2Q 2010Sales Markets Rental Markets
Region I (New England) Balanced BalancedRegion II (NY/NJ) Slightly Soft Balanced (NYC Tight)Region III (Mid-Atlantic Slightly Soft MixedRegion IV (Southeast-Caribbean) Soft SoftRegion V (Midwest Soft Mixed (soft/balanced)Region VI (Southwest) Slightly Soft Soft
Region VII (Great Plains) Balanced (Soft in MO) SoftRegion VIII (Rocky Mountains) Soft MixedRegion IX (Pacific) Soft Mixed Region X (Northwest) Soft Balanced

National Home Price IndicesBased on Qtr. To Same Qtr. Previous Year
1992
1993
1995
1996
1998
1999
2001
2002
2004
2005
2007
2008
2010
-25.00-20.00-15.00-10.00
-5.000.005.00
10.0015.0020.00
S&P/Case-Schiller Price Index (NSA)
FHFA Purchase Only Index (SA)
% C
hang
e, y
ear
ago


SF Permit ActivityDuring 12 Months Ending
June-09 June-100
50,000
100,000
150,000
200,000
250,000
300,000
350,000
400,000
450,000
500,000

Percentage Change in SF Activity12 Months Ending 6/09 to 6/10
New E
ngland
New Y
ork-N
ew J
ersey
Mid
-Atla
ntic
Southeast-C
aribbean
Mid
west
Southw
est
Gre
at Pla
ins
Rocky Mounta
ins
Pacific
Northw
est0.0
5.0
10.0
15.0
20.0


MF Permit ActivityDuring 12 Months Ending
June-09 June-100
50,000
100,000
150,000
200,000
250,000
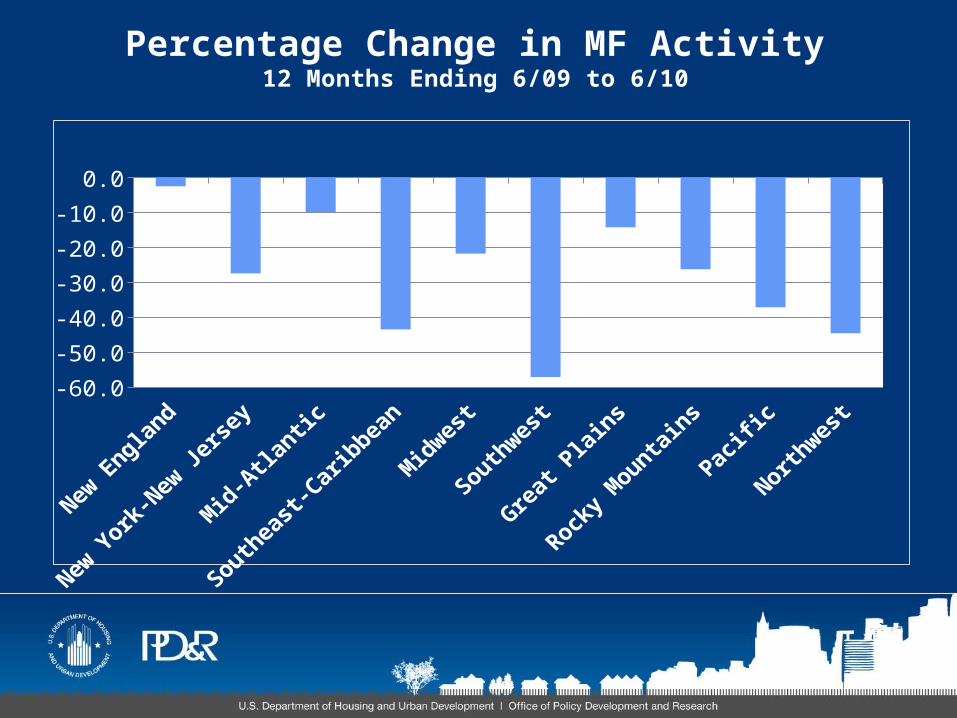
Percentage Change in MF Activity12 Months Ending 6/09 to 6/10
-60.0
-50.0
-40.0
-30.0
-20.0
-10.0
0.0


For additional information:
• U.S. Housing Market Conditions Report 2Q 2010 available at www.huduser.org
• Contact your local Regional or Field Economist
• Contact me at [email protected]