Embed Size (px)
DESCRIPTION
State of the Nation's Housing 2011 from Harvard University
Citation preview

JOINT CENTER FOR HOUSING STUDIES OF HARVARD UNIVERSITY
2011
THE STATE OF THE
NATION’S HOUSING

GRADUATE SCHOOL OF DESIGN
JOHN F. KENNEDY SCHOOL OF GOVERNMENT
Principal funding for this report was provided by the Ford Foundation and the Policy Advisory Board of the Joint Center for Housing Studies. Additional support was provided by:
Federal Home Loan Banks
Freddie Mac
Housing Assistance Council
National Association of Home Builders
National Association of Housing and Redevelopment Officials
National Association of Local Housing Finance Agencies
National Association of Realtors®
National Council of State Housing Agencies
National Housing Conference
National Housing Endowment
National League of Cities
National Low Income Housing Coalition
National Multi Housing Council
Research Institute for Housing America
©2011 President and Fellows of Harvard College.
The opinions expressed in The State of the Nation’s Housing 2011 do not necessarily represent the views of Harvard University, the Policy Advisory Board of the Joint Center for Housing Studies, the Ford Foundation, or the other sponsoring agencies.
JOINT CENTER FOR HOUSING STUDIES OF HARVARD UNIVERSITY

1JOINT CENTER FOR HOUSING STUDIES OF HARVARD UNIVERSITY
THE ROCKY ROAD TO RECOVERYAs in past downturns, renewed job growth and stronger con-sumer confidence are needed to spark the housing recovery. Through 2010, however, conditions in few states showed signs of improvement (Figure 1). Unemployment rates are still hovering near 9 percent and confidence remains relatively low. In addition, the persistent decline in home prices, the ongoing foreclosure crisis, the large shares of underwater homeowners, and tight lending standards are all holding back homebuyer demand.
Conditions in the rental and owner markets have begun to diverge. Even with the net shift of 1.4 million single-family homes to rentals in 2007–9 (nearly double the number in 2005–7), rental vacancy rates have fallen and given a lift to rents and property values. But on the homeowner side, vacancy rates have edged down little from the 2008 peak despite draconian cuts in new construction, and the number of vacant homes held off the market continues to climb. Moreover, new home sales set another record low in February 2011 as prices fell both nationally and in most states.
With an unusually large number of households leaving home-ownership and an unusually small number of renter house-holds buying homes, the national homeownership rate dipped below 67 percent in 2010, down from 69 percent in 2004. Given that the foreclosure wave is still cresting and would-be buyers are waiting for prices to firm, homeownership could continue to decline in 2011. The farther the homeownership rate falls, the longer it will take to work through the excess inventory of homes for-sale and held off market (Figure 2).
At this point, a more normal rate of household growth is needed to hasten the absorption of excess supply. But even though the echo boomers (born 1986 and later)—the largest generation ever to reach their 20s—are entering their peak household formation years, household growth flagged during the late 2000s as more young adults delayed setting out on their own and growth in foreign-born households came to a halt. While estimates vary widely, the Current Population Survey indicates that household growth averaged about 500,000 per year in 2007–10. This is not only less than half the 1.2 million annual pace averaged in
With employment growth
strengthening, consumer
spending up, and rental
markets tightening, some of the
ingredients for a housing recovery
were taking shape in early 2011.
Yet in the first quarter of the year,
new home sales plumbed record
lows, existing sales remained in
a slump, and home prices slid.
Tight underwriting requirements,
on top of uncertainty about
the direction of home prices,
continue to dampen homebuying
activity. The weakness of
demand is slowing the absorption
of vacant properties for sale,
hindering the recovery.
1 Executive Summary

THE STATE OF THE NATION’S HOUSING 20112
2000–7, but also lower than that averaged in the 1990s when the smaller baby-bust generation entered the housing market.
UNCERTAINTY IN THE HOMEOWNER MARKET It is unclear how strongly attitudes toward homeownership have become more negative. According to a Fannie Mae sur-vey, the share of renters believing that buying a home is a safe investment is sharply lower than in 2003, and even fell over the course of 2010. This is not surprising given the plunge in home prices over the past five years as well as the dramatic increase in owners that have lost all their home equity. Even so, some 74 percent of renters still agreed, as of the first quarter of 2011, that owning a home makes more financial sense than renting, as did 87 percent of the overall US population. And when asked if now is a good time to buy, the shares of both renters and owners responding yes were similar to the shares in 2003. Most Americans thus still prefer to own their homes and perceive that today’s lower home prices and low mortgage interest rates provide a buying opportunity.
First-time buyers are key to a strong recovery in the homeowner market. The potential for first-timers to drive growth is clear from the lift in both home sales and prices that came with the expiration of the tax credit programs in 2009 and 2010 (Figure 3). Many of these would-be homeowners were locked out at the top of the market and were then scared away as both home prices and employment plummeted. The question now is whether, without the incentive provided by the tax credits, first-timers have the will to buy.
While many households aspire to homeownership, underwrit-ing standards may stand in their way. Low-downpayment loans, a common means of entry for many moderate-income home-buyers, are largely unavailable outside of FHA-insured mort-gage programs. Even there, though, the Obama Administration has tightened requirements and raised costs. Many lenders originating low-downpayment loans have also imposed higher credit score screens than FHA. If the proposed 20-percent down requirement for qualified residential mortgages passes, low-downpayment lending without a federal guarantee may remain sharply curtailed.
The combination of higher income, downpayment, and credit score requirements in today’s broader mortgage market will pre-vent many borrowers from getting the loans today that they would have qualified for in the 1990s before the housing boom and bust. While a return to more stringent standards was clearly warranted, there is concern that overly rigid guidelines may unnecessarily restrict access of low- and moderate-income households to the benefits of homeownership. Indeed, regulators have signaled in their initial proposals that they are inclined to take a conservative approach to defining risky loans. Over the longer term, it is unclear how the impending reform of the housing finance system, includ-ing changes in the role played by Fannie Mae and Freddie Mac, will influence the cost and availability of mortgage loans.
RENTAL REBOUND After years of stagnation, growth in the number of renter households accelerated in the second half of the 2000s. While estimates vary, the Housing Vacancy Survey indicates that the number of renters swelled by 3.9 million from 2004 to 2010. Nevertheless, rental vacancy rates rose and rents stalled through 2009 as new additions to the supply and conversions of existing homes to rentals exceeded demand. The tide turned in 2010 as the rental vacancy rate fell from 10.6 percent in the first quarter to 9.4 percent in the last, the lowest quarterly rate posted since 2003. Just under one-third of the 64 markets sur-veyed by MPF Research reported vacancy rates below 5 percent at the end of last year, and more than half reported rates under 6 percent. Only a year earlier, vacancy rates in just one-fifth of these markets were below 6 percent.
With vacancy rates down, the pressure on rents has mounted. MPF Research found that nominal rents for professionally man-aged apartments were up 2.3 percent last year, recovering some of the ground lost in 2009. The rental rebound has reached most metropolitan markets, with the notable exception of areas with an excess supply of for-sale units. Indeed, of the metros cov-ered, only Las Vegas, Fort Myers, and Tucson reported further rent declines in 2010.
If employment growth, especially among young adults, contin-ues to pick up and homeownership rates continue to slide, rent-er household growth should remain strong. This would increase pressure on vacancy rates and rents, spurring an increase in
Notes: Changes in all measures except permits are from 2009:4 to 2010:4. Permits are measured year over year from 2009 to 2010. Vacancy rates are for owner units. Stronger job growth is defined as at least a 1% increase.Source: JCHS tabulations of US Census Bureau, Housing Vacancy Survey and New Residential Construction; National Association of Realtors®, Existing Home Sales; Bureau of Labor Statistics, Total Nonfarm Employment; and Federal Housing Finance Agency, Purchase-Only House Price Index.
30
25
20
15
10
5
0Higher
PermittingHigher
Home SalesHigher
Home PricesStronger
Job GrowthLower
Vacancy Rates
Few States Showed Signs of Housing MarketRecovery in 2010Number of States
FIGURE 1

3JOINT CENTER FOR HOUSING STUDIES OF HARVARD UNIVERSITY
multifamily construction—assuming that acquisition, construc-tion, and development financing is available. Since it will take some time before any additional supply comes on line, rental markets are likely to remain tight at least in the short term. In any case, with most new construction that does occur focused
at the high end of the market, the affordability challenges for low-income renters are likely to intensify.
SHIFTS IN DEMAND Questions about changes in homebuying attitudes, access to mortgage credit, immigration trends, and household formation rates among young adults shroud the short-term outlook for housing demand. Certain demographic trends, however, make some aspects of the longer-term picture clearer. In particular, the aging of the baby boomers (born 1946–65) is projected to drive up the number of households over age 65 by some 8.7 million by 2020—a 35 percent increase from 2010 (Figure 4). Immigration has little impact on these projections because few people emigrate at these ages. The growing share of older households will provide important ballast for the owner mar-ket, offsetting in part the lower homeownership rates among younger households.
The majority of baby boomers are likely to age in place since most people do not relocate in the years leading up to or after retirement. Still, fully one in three heads of households aged 65–74 in 2007 reported having moved in the previous 10 years, many to smaller homes. If the older baby boomers match this mobility rate, some 3.8 million would downsize their homes over the coming decade, lifting the demand for smaller units. Their sheer numbers also mean that the baby boomers will have a major impact on the housing markets of preferred retirement destinations, which so far have been the non-metropolitan areas in the South and West. Meanwhile, the number of pre-boomer households over age 75 will also grow rapidly over the
Notes: Excess vacancies are measured by comparing current levels with those obtained by applying average vacancy rates from past periods of stability. For sale and held off market vacancies use rates from 1999–2001; for rent vacancies use rates from 2003–7. Held off market units include units intended for occasional use, occupied by someone with a usual residence elsewhere (URE), and all other year-round units not for rent or for sale but vacant for reasons other than the above. Source: JCHS tabulations of US Census Bureau, Housing Vacancy Surveys.
● 2006 ● 2007 ● 2008 ● 2009 ● 2010
1,200
1,000
800
600
400
200
0
-200For Rent For Sale Held Off Market
Excess Vacancies Remain Abnormally High, Especially for Units Held Off Market Excess Vacant Units (Thousands)
FIGURE 2
● House Price Index, Excluding Distressed Sales [Right axis] ● Home Price Index [Right axis] ● Home Sales [Left axis]
Notes: Vertical lines denote expiration dates of homebuyer tax credit programs. Existing home sales are at seasonally adjusted annual rates. Sources: National Association of Realtors®; First American CoreLogic.
6
5
4
3
2
1
0
Jan
Feb
Mar Ap
r
May
June
July
Aug
Sept Oc
t
Nov
Dec
Jan
Feb
Mar Ap
r
May
June
July
Aug
Sept Oc
t
Nov
Dec
Jan
Feb
Mar Ap
r
May
June
July
Aug
Sept Oc
t
Nov
Dec
Jan
Feb
2008 2009 2010 2011
160
150
140
130
120
110
100
Expiration of the Homebuyer Tax Credits Boosted Sales and Prices in 2009 and Early 2010Existing Single-Family Home Sales (Millions) Single-Family Home Prices (Index)
FIGURE 3

THE STATE OF THE NATION’S HOUSING 20114
next 10 years and spur demand for housing developments that offer both independent and assisted living.
The massive echo-boomer generation will have an important but less predictable impact on housing markets. The house-hold headship rates of young adults were sliding even before the Great Recession hit, and the downturn accelerated that decline. It is unclear how much, if at all, headship rates among echo-boomer adults will recover as they age and the economy improves. It is also unclear if net immigration will make up for the declines that occurred after the economic crisis. Even so, there is reason to believe that the echo-boomer generation will be large enough to boost the number of young adult households in 2010–20 and in turn the demand for starter apartments and single-family homes. Indeed, assuming headship rates revert to their 2007–9 average and that immigration is just half what the Census Bureau now projects, the number of households under age 35 will grow to nearly 26.5 million in the next decade.
Even under these conservative immigration assumptions, minorities will account for seven out of ten of the 11.8 million net new households in 2010–20. Hispanics alone will contrib-ute nearly 40 percent of the increase. By 2020, minorities are expected to make up a third of all US households. But with their lower average incomes and wealth than whites, more of these households will have to stretch to afford housing. And with their lower homeownership rates, the rising number of minority households will place downward pressure on the national homeownership rate. Impending decisions about underwriting standards—especially downpayment require-ments and credit score cutoffs—will thus have an especially
important impact on the ability of tomorrow’s minority house-holds to buy homes.
MOUNTING HOUSING CHALLENGESThe Great Recession exacerbated the affordability challenges that had been building for a half-century. At last measure in 2009, 19.4 million households paid more than half their incomes for housing, including 9.3 million owners and 10.1 million renters. While low-income households are most likely to have such severe burdens, cost pressures have moved up the income scale (Figure 5). Households earning between $45,000 and $60,000 saw the biggest increase in the share pay-ing more than 30 percent of their incomes for housing, up 7.9 percentage points since 2001. Among those earning less than $15,000, the share rose by only 2.9 percentage points—primar-ily because nearly 80 percent of these households were already housing-cost burdened in 2001.
In addition to longstanding and worsening affordability chal-lenges, the housing crash and ensuing economic downturn drained household wealth, ruined the credit standing of many borrowers, and devastated communities with widespread foreclosures. The collapse of house prices has left nearly 15 percent of homeowners with properties worth less than their mortgages and eroded the equity of most others. Overall, the amount of real home equity fell from $14.9 trillion at its peak in the first quarter of 2006 to $6.3 trillion at the end of 2010—well below the $10.1 trillion in outstanding mortgage debt. This has reduced the amount that owners can cash out if they sell, as well as the amount they can borrow to finance spend-ing and investment.
Meanwhile, the foreclosure crisis continues. As of March 2011, the Lender Processing Services (LPS) reports that about 2.0 million home loans were at least 90 days delinquent. Another 2.2 million properties were still in the foreclosure pipeline, with 67 percent of owners having made no payments in more than a year, and 31 percent having made no payments in two years. The crisis is espe-cially acute in pockets across the country. Indeed, just 5 percent of census tracts accounted for more than a third of all homes lost to foreclosure since 2008. It will take years for these neighbor-hoods—which are disproportionately minority—to recover from this calamity. As policymakers tackle the regulation and redesign of the mortgage market, it will be important to keep sight of the needs of these hard-hit communities.
THE OUTLOOKSo far, housing has not played its traditional role of helping the economy recover from a recession. Weak job growth, high unemployment, slumping home prices, and subdued consumer confidence have all hampered a rebound in residential invest-ment. The strength of the housing recovery, when it does occur, will rest on how fully employment bounces back. The first four months of 2011 brought promising news on the jobs front, with
Notes: Senior households are those headed by a person aged 65 or older. JCHS low projection assumes that immigration in 2010–20 is half that in the US Census Bureau’s 2008 middle-series (preferred) population projection.Sources: JCHS tabulations of US Census Bureau, Current Population Surveys; JCHS 2010 household growth projections.
35
30
25
20
15
10
5
01980 2000 2020
(Low Projection)20101990
As the Baby Boomers Age, the Number of Seniors Will Increase Dramatically in the Next DecadeHouseholds Headed by Persons Aged 65 and Older (Millions)
FIGURE 4

5JOINT CENTER FOR HOUSING STUDIES OF HARVARD UNIVERSITY
● 2001 ● 2009 ● Percentage Point Change 2001–9
Notes: Cost-burdened households spend more than 30 percent of pre-tax income for housing. Income ranges are in 2009 dollars, adjusted for inflation by the CPI-U for All Items.Source: JCHS tabulations of US Census Bureau, 2001 and 2009 American Community Surveys.
90
80
70
60
50
40
30
20
10
0
Real Household Income
Under $15,000 $15–30,000 $30–45,000 $45–60,000 $60–75,000 Over $75,000
Affordability Problems Are Creeping Up the Income ScaleShare of Households with Cost Burdens (Percent)
FIGURE 5
payrolls expanding by nearly 200,000 per month on average. If these advances continue and energy prices settle down, a sus-tainable recovery could at last be developing.
Local housing markets will revive at different rates, in propor-tion to the depths they hit during the recession, the amount of overbuilding that occurred, and the speed at which job growth resumes. As of February 2011, 21 states were within 5 percent of their previous peak employment levels while most others were 5-7 percent below previous peaks. At the recent pace of growth, however, regaining the jobs lost during the recession will take at least five years in most areas. Many of the states with the farthest to go—Nevada, Florida, Georgia, Arizona, and California—are those that claimed the largest share of homebuilding activ-ity during the boom. With recovery in these states likely to lag, national construction volumes will remain lackluster until employment growth in these markets strengthens.
Most critical to a housing recovery is a pickup in house-hold growth. The severity of the Great Recession depressed immigration as well as headship rates among both young and middle-aged households. Indeed, an improving economy may allow more people who have delayed living on their own to form additional households and, as a result, temporarily boost household growth above the baseline trend. However, high unemployment rates—on top of the long-term increase in rental affordability problems—may have lowered the trend itself. To match the 1.12 million annual rate averaged in the 2000s, household formation rates must return to their 2007–9 average, and net immigration must reach at least half of Census Bureau projections.
In the near term, rental markets are likely to lead the hous-ing recovery. The owner-occupied market continues to face headwinds, with servicing problems causing long delays in resolving the backlog of foreclosures. In addition, tighter underwriting requirements are preventing many potential first-time buyers from qualifying for mortgages. On the fore-closure front, the good news is that the share of home loans delinquent by at least three months dropped from 5.6 percent in early 2010 to 3.8 percent in March—a sign of light at the end of the tunnel. And once consumers perceive that a floor has formed under house prices, their reentry into the market could quickly burn through the lean inventory of unsold new homes and slim down the excess supply of existing homes on the market.
A number of major policy debates are under way that could add even more uncertainty to the housing outlook. Implementation of the Financial Reform Act and decisions about what form government mortgage guarantees are to take will have a profound impact on the future cost and avail-ability of mortgage credit. What seems certain is that federal programs aimed at relieving rental affordability problems and revitalizing distressed neighborhoods will be on the table, along with other domestic spending programs as the govern-ment attempts to address fiscal imbalances. Thus, the pres-sure to curb spending on housing is mounting just as rental affordability problems are escalating.

THE STATE OF THE NATION’S HOUSING 20116
GRIM CONSTRUCTION AND SALES REPORTSThe construction downturn has swept across the entire housing sector (Figure 6). Single-family completions in 2010 sank to lows last seen in the midst of World War II, multifamily completions were down another 43 percent from the year earlier, and manu-factured home placements hit their lowest levels since record-keeping began in 1974. Total starts held well below 1 million for the third consecutive year, distinguishing this cycle from past recoveries when construction rebounded quickly and strongly once annual starts dipped below that mark. Single-family starts did, however, stabilize near a 570,000 seasonally adjusted annual rate from the first quarter of 2009 to the end of 2010. The small increase in single-family permits and substantially larger 10.9 percent gain in multifamily permits last year suggest a bot-tom may have formed.
With such drastic cutbacks in construction activity, the inven-tory of new homes for sale is just 183,000 units—a level not posted since the mid-1960s when the number of US households was half what it is today. Even so, demand remains weak and the supply of new homes for sale was 7.3 months in March 2011, up from 7.1 months a year earlier and still well above the long-run average of 6.2 months. New home sales dropped another 14 percent in 2010 to a low of 323,000, marking the fifth consecu-tive year of double-digit declines. The downtrend continued in the first quarter of 2011 with sales running below a 300,000 annual rate.
Existing single-family home sales also fell in 2010, reversing gains in 2009 and surpassing the 2008 low despite another homebuyer tax credit last year. Based on Multiple Listing Service (MLS) data, the National Association of Realtors® (NAR) reports that existing single-family home sales dropped 5.7 percent to just 4.3 million. Estimates from First American CoreLogic, which include non-MLS sales, indicate roughly twice that decline.
According to NAR, first-timers accounted for 39 percent of homebuyers in 2010—essentially the same share reported in the American Housing Survey on average since 1977. But bolstered by the federal tax credit program ending in April 2010, the first-time buyer share hit 49 percent in that month before falling to 33 percent in December of last year and then to 29 percent in
Despite the most favorable
mortgage rates in decades and
two rounds of homebuyer tax
credits, major housing market
indicators stood at or near record
lows in 2010. Construction was
particularly depressed, with
completions of new homes down
some 18 percent from a year
earlier to just 652,000 units.
A rebound in single-family
production and new home sales
will depend largely on an upturn
in household growth to reduce
the severe inventory overhang.
But with rental markets already
tightening, multifamily starts
may get a bounce.
2 Housing Markets

7JOINT CENTER FOR HOUSING STUDIES OF HARVARD UNIVERSITY
January 2011. The homebuyer tax credit thus had a dramatic but short-lived impact, setting the stage for a sharp retreat in sales as soon as the program expired.
As the share of first-time buyers shrank, the share of cash buy-ers expanded from 19.8 percent in 2009 to 27.4 percent in 2010. With distressed sales and foreclosure auctions on the rise, cash purchases climbed steadily to a record-high share of 35 percent in March 2011. This trend indicates that many typical homebuy-ers remain on the sidelines, either unsure about the direction of home prices or unable to qualify for financing.
PRICES UNDER PRESSUREAfter strengthening slightly at mid-year, home prices ratcheted down again, ending 2010 down 4.1 percent. Trends were remark-ably similar nationwide. Indeed, home prices in nearly three-quarters of the 384 metro areas and divisions covered by the FHFA index fell in the fourth quarter of last year, with 47 metros posting drops of more than 5 percent. The Case-Shiller index, which reports on fewer markets but is not similarly restricted to sales of homes with conventional mortgages, indicates that pric-es in 18 of 20 large metros were down year over year in January 2011, with prices in 11 metros surpassing previous cyclical lows. Still, the brief rise in home prices when the second homebuyer tax credit expired suggests that underlying demand remains
strong, although potential buyers feel little urgency to act with-out an incentive. The weakness in house prices was evident not only in areas hit hard by the foreclosure crisis, such as Phoenix and Atlanta, but also in markets where prices had been firming. For example, Minneapolis and Dallas posted significant price drops in 2010 after prior-year gains (Table W-7). The only metros reporting higher prices last year were Washington, DC (up 2.3 percent) and San Diego (up 1.7 percent).
While prices for low-end homes made especially large gains during the housing boom, they have now dropped much more sharply than those for high-end properties (Figure 7). In Atlanta, for example, prices of high-end homes were down 23 percent from the peak to December 2010, but those for low-end homes plunged a staggering 50 percent. In the last year, prices at the low end of these markets typically fell three times more than those at the high end.
According to First American CoreLogic, the latest round of declines pushed overall home prices back to levels last seen in early 2003. With so many years of price appreciation lost, millions of Americans own homes worth less than their mortgages. These underwater homeowners are often unable to move because their choices are so unpalatable: pay off the balance of the loan that the sale price does not cover, negotiate a short sale or deed in lieu of foreclosure, or relinquish the house to foreclosure. The large
Note: All dollar values are in 2010 dollars, adjusted for inflation by the CPI-U for All Items. Sources: US Census Bureau, New Residential Construction; National Association of Realtors®, Existing Home Sales; Federal Reserve Board, Flow of Funds; Bureau of Economic Accounts, National Income and Product Accounts.
The Housing Market Recovery Failed to Materialize in 2010
FIGURE 6
2008 2009 2010
Percent Change
2007–8 2008–9 2009–10
Single-Family Home SalesNew (Thousands) 485 375 323 -37.5 -22.7 -13.9Existing (Millions) 4.35 4.57 4.31 -11.9 5.0 -5.7
Residential ConstructionTotal Starts (Thousands) 906 554 587 -33.2 -38.8 5.9Total Completions (Thousands) 1,120 794 652 -25.5 -29.1 -18.0
Median Single-Family Sales PriceNew (Dollars) 235,068 220,254 221,800 -9.8 -6.3 0.7Existing (Dollars) 199,114 174,923 173,100 -13.1 -12.1 -1.0
Homeowner Balance SheetsHome Equity (Trillions of dollars) 7.06 6.85 6.30 -35.0 -3.0 -8.0Mortgage Debt (Trillions of dollars) 10.63 10.51 10.07 -4.1 -1.1 -4.2
Construction SpendingResidential Fixed Investment (Billions of dollars) 479 358 341 -27.6 -25.2 -4.9Homeowner Improvements (Billions of dollars) 122 114 115 -16.8 -6.4 0.9
Note: All dollar values are in 2010 dollars, adjusted for inflation by the CPI-U for All Items. Sources: US Census Bureau, New Residential Construction; National Association of Realtors®, Existing Home Sales; Federal Reserve Board, Flow of Funds; Bureau of Economic Analysis, National Income and Product Accounts.

THE STATE OF THE NATION’S HOUSING 20118
number of owners thus stuck in place inhibits trade-up demand, putting even more downward pressure on prices.
Progress in relieving this problem has been slow. Based on about 85 percent of US mortgages, First American CoreLogic estimates indicate that the number of homeowners with negative equity edged down from 11.3 million in 2009 to 11.1 million at the end of 2010. Of these underwater owners, nearly 5 million (about 10 percent of all owners with mortgages) have loans of at least 125 percent of home value. In hard-hit Florida and Arizona, about 30 percent of homeowners with mortgages are severely under-water. In Nevada, the share is nearly 50 percent and mortgage debt overall has reached 118 percent of the aggregate value of homes in the state.
Troubled loans, short sales, and foreclosure auctions will con-tinue to stifle home prices and slow the rate at which homeown-ers escape their negative equity positions. According to NAR, dis-tressed sales of existing homes increased to 40 percent in March 2011, up from 35 percent a year earlier. Including distressed sales, the decline in existing home prices December 2009 to December 2010, as measured by First American CoreLogic, rises
from 3.1 percent to 4.5 percent. At last measure in February, inclusion of distressed sales turns annual price appreciation in 15 states from positive to negative. Overall, Zillow.com esti-mates suggest that the share of homes sold for less than their purchase prices climbed from 25.4 percent in 2009 to 30.7 per-cent in 2010.
THE INVENTORY OVERHANGRental vacancy rates improved significantly last year, dropping steadily to 9.4 percent in the fourth quarter. This was the lowest quarterly rate posted since 2003 and well below the 10.7 percent rate a year earlier. The largest vacancy rate decline was for large multifamily buildings with 10 or more rental units.
Meanwhile, the 2010 vacancy rate for for-sale homes was 2.6 percent, unchanged from 2009. Single-family vacancies actually dipped slightly while those for condo and co-op units rose sig-nificantly. The largest increase was for units in buildings with 10 or more units, where vacancy rates climbed 1.4 percentage points to 10.0 percent. The inventory overhang from the hous-ing boom was still evident in both rental and for-sale markets, with vacancy rates for units built in 2000 or later well above those for older units.
While there is no definitive way to determine how much excess inventory exists, one common approach is to start with “normal” vacancy rates, that is, from the pre-boom years when rents and house prices were more stable. Average vacancy rates from 2003 to 2007 for rental units, and from 1999 to 2001 for all other types of units, provide a fair approximation of normal. Comparing these rates against those in 2010, the excess inventory amounts to approximately 700,000 for-sale homes and 160,000 rentals.
But these estimates do not include units held off market in preparation for sale or rent, a category that covers many unoc-cupied homes in some stage of foreclosure. Vacancy rates for this category are abnormally high and rising. Indeed, excess vacant units of this type numbered 1.1 million in 2010. Add to that about 700,000 excess seasonal homes (another category that may include vacant units that owners are waiting to put up for sale when conditions improve), and the excess housing inventory could total as much as 2.6 million units.
Working off the inventory overhang appears to be a demand-side problem. The post-2006 cutback in housing production has been so severe that completions and placements in the past 10 years—a period that includes one of the largest hous-ing bubbles in the nation’s history—barely exceed the lowest level of any 10-year period in records that began in 1974 (Figure 8). And with weakness continuing, 2002–11 will likely set a new low for production.
According to the Current Population Survey, the source that comes closest to matching the 2010 Census count, aver-age annual household growth slowed by more than 400,000
Note: The high (low) tier includes the top (bottom) third of all homes, ranked by initial sales price.Source: Table A-8.
Phoenix
Las Vegas
Miami
Tampa
San Francisco
Los Angeles
Atlanta
Minneapolis
Chicago
San Diego
Washington, DC
Seattle
New York
Portland
Boston
Denver
-40 0-20-60-70 -30 -10-50
Prices at the Low End of the Market Have Fallen More than at the High EndDecline in Home Prices, Peak to December 2010 (Percent)
FIGURE 7
● Low Tier ● High Tier

9JOINT CENTER FOR HOUSING STUDIES OF HARVARD UNIVERSITY
between 2001–5 and 2005–10. As a result, 2 million fewer house-holds were formed in the last five years than if the pace in the first half of the 2000s had continued. Such depressed levels of household formation have kept excess vacancies high despite the sharp correction in construction.
While it is difficult to gauge how close the market is to balance, the longer-term outlook is positive. Based simply on the aging of the current US population and average headship rates by age and race/ethnicity in 2007–9, household growth should hit 1.0 million per year over the coming decade. Additional demand will come from immigration, the need to replace existing homes, and demand for second homes. All told, baseline demand for new housing is likely to total at least 16 million units over the next ten years, although construction levels could be lower given the need to work off the current excess supply.
STATE-LEVEL CONDITIONSPermitting levels, home sales and prices, vacancy rates, and employment growth all help to gauge conditions in specific housing markets. While most states saw improvement in at least one of these indicators in 2010, just 19 experienced broad gains. Permitting was the most widely improving indica-tor, although just 29 states posted increases in this measure, and total permits remained near historical lows. Homeowner vacancy rates also ended 2010 lower in 20 states, reflecting the significant number of owned units converted to rentals or taken off the market.
The direction of home prices was the most common negative factor. As measured by the FHFA purchase-only price index,
home prices in just three states ended the year higher than they began. Washington, DC, was the only market to register posi-tively on four of the five indicators, although Washington State, North Dakota, and Hawaii posted improvements in three. Eight states saw no turnaround in housing market indicators in 2010.
Employment growth is perhaps the most important metric because it is a leading indicator of housing demand. While nonfarm employment is still well below pre-recession levels in all but three states, the number of states registering job gains jumped from 2 in the first quarter of 2010 to 44 in the first quar-ter of 2011. Based on recent growth rates, though, returning to pre-recession employment levels will take more than five years on average.
Job gains in the once-hottest homebuilding markets are espe-cially modest. At the height of the housing boom in 2005, just four states—Florida, California, Georgia, and North Carolina—accounted for more than 30 percent of US permits and had job growth rates that were 50 percent above the national average. Since 2008, however, employment gains in these states have lagged. In fact, Florida, Georgia, and North Carolina are three of just eight states where nonfarm employment fell last year.
HOUSING AND THE ECONOMYRather than leading the recovery as in past cycles, homebuild-ing was a damper on GDP growth in 2010 (Figure 9). Spending was volatile during the year, but the 0.75 percentage-point drop in residential fixed investment (RFI) in the third quarter was the biggest drag on growth since the worst of the housing bust. In 2010 as a whole, RFI fell another 0.2 percentage point to just
Notes: New homes built includes all units completed and placements of mobile homes. Records start in 1974. Source: JCHS tabulations of US Census Bureau, New Residential Construction data.
19.0
18.5
18.0
17.5
17.0
16.5
16.0
15.5
15.0
14.51997–2006 1998–2007 1999–2008 2000–2009 2001–2010 Median
10-Year Total
Lowest 10-Year Period on Record
(1988–1997)
Despite the Mid-Decade Surge, Home Construction in the 2000s Was Lower than in Nearly Every 10-Year Period Since 1974New Homes Built (Millions)
FIGURE 8

THE STATE OF THE NATION’S HOUSING 201110
2.3 percent of GDP—the smallest share since 1945. In stark con-trast, RFI as a share of economic output averaged 4.2 percent in the 1980s and 1990s, reaching as high as 6.1 percent at the market peak in 2005.
In addition to homebuilding, the housing sector adds directly to the economy through consumption of housing services, including rent paid by tenants, homeowners’ imputed rent, rental management services, residential utilities, and furniture purchases. This spending is less volatile than construction and, when combined with RFI, makes up a much larger part of the economy. In 2010, the total housing share of GDP was 17.1 per-cent, down from a high of 20.7 percent in 2005 and below the 18.3 percent averaged in the 1980s and 1990s.
Housing-related activities also affect GDP indirectly. Falling home sales reduce the multipliers associated with the spending of income derived from these transactions. Housing wealth effects—generated by strong house price appreciation—also contribute indirectly to GDP by spurring expenditures on consumer goods and services, often financed with home equity. With the current weakness in house prices, however, the volume of cash-out refi-nancings (resulting in measurably higher mortgage balances) hit a 10-year low even though refinancing overall accounted for two-thirds of the estimated $1.6 trillion in mortgage originations last year. According to Freddie Mac, just 18 percent of conventional mortgage refinancings took cash out while a third put cash in (reinvesting equity to reduce outstanding debt). The trend toward cash-in refinancing strengthened over the year, reaching 44 per-cent of all refinances in the fourth quarter—the highest share
since 1985. Many of these cash-in refinancings were no doubt by necessity so that borrowers could take advantage of historically low mortgage rates.
INVESTMENT IN EXISTING HOMES Even at the height of the homebuilding boom, expenditures on maintenance and improvement of existing homes accounted for about a quarter of total residential fixed investment. That share has since risen to nearly 45 percent. In 2010, real homeowner improvement spending was down 26.7 percent from its peak—a substantial decline, although much more modest than the 76.4 percent drop in new residential construction spending.
Like other segments of the housing market, homeowner improvement activity has yet to stage a strong rebound, with real spending last year up just 0.9 percent from 2009. One reason is the slowdown in home sales, a primary driver of mar-ginal changes in remodeling expenditures. The Joint Center for Housing Studies estimates that owners spend 2.5 times more on improvements in the first two years after buying homes than the annual average outlay of $2,500. After the initial two years of ownership, however, spending drops precipitously (Figure 10).
The small increase in spending last year does, however, suggest that more owners are choosing to remodel than to move. The government stimulus package, combined with their own desire to save money, has supported owners’ efforts to increase the effi-ciency of their homes. And with the added benefit of tax credits, energy-efficiency improvements have become a growth market for remodeling contractors. Indeed, a JCHS survey indicates that the share of remodelers that reported completing energy-efficien-cy or sustainability-related projects in the previous year increased from 84 percent in early 2009 to 97 percent in early 2011.
The need to address the deferred maintenance of properties that have gone through the long foreclosure process may also help to boost remodeling spending. The Home Improvement Research Institute reports that buyers of distressed homes spend an aver-age of 14 percent more on improvements within the first year of ownership than buyers of non-distressed homes.
PIVOTAL FEDERAL SUPPORTSWith Fannie Mae and Freddie Mac under conservatorship, reliance on federal mortgage guarantees has escalated. Inside Mortgage Finance reports that the government owned or guar-anteed close to 90 percent of mortgage originations in 2010. FHA has become the primary lender to borrowers with down-payments of less than 20 percent, lifting its share of mortgage originations to nearly 20 percent last year. USDA Section 502 guarantees for mortgages to low- and moderate-income house-holds in rural areas have also increased significantly.
In the secondary markets, GSE and agency mortgage-backed securities (MBS) accounted for 96 percent of issuances last
Source: JCHS tabulations of US Bureau of Economic Analysis, National Income and Product Accounts.
● Average for Post-1960 Cycles ● 2007–9 Cycle
0.6
0.4
0.2
0.0
-0.2
-0.4
-0.6
-0.8
-1.0
-1.2Last 2 Quartersof Recession
2–4 Quarters Before End of Recession
First 6 QuartersAfter Recession
Unlike in Previous Cycles, Residential ConstructionHas Been a Drag on the Economic Recovery Contribution of Residential Fixed Investment to Real GDP Growth (Percentage point)
FIGURE 9

11JOINT CENTER FOR HOUSING STUDIES OF HARVARD UNIVERSITY
year. Moreover, from January 2009 through March 2010, the US Treasury not only bought $1.25 trillion of these MBS, but also invested $175 billion in GSE debt securities.
As the government attempts to extricate itself from this pivotal role, many private issuers of mortgage securities remain on the sidelines. While this may reflect caution about accepting credit risk while housing prices are still falling and employment growth is sluggish, it may also signal that the large government footprint has left little room for private lending. Accordingly, the GSEs and FHA raised the costs of their guarantees in early 2011 to shore up their balance sheets and to test the waters for reentry of private capital without government guarantees. The Obama Administration intends to continue this course to allow private investors to regain market share. The longer-run federal role in mortgage markets is unclear. The Administration has outlined three broad options for restructuring government mortgage guarantees, none of which call for the continued existence of Fannie Mae and Freddie Mac. However, rolling back public sector support too quickly could severely shock the hous-ing market.
Regulations being developed under the Financial Reform Act, including creation of the Consumer Financial Protection Bureau, will also fundamentally reshape the mortgage market. Among the proposed changes are prohibitions on some of the riskiest types of loans and imposition of different risk retention and liability requirements on the basis of specific loan terms. Other regulations will affect reporting rules and capital requirements for mortgage lenders, as well as loan-level disclosures of secu-
ritized pools. These efforts to bolster the safety and soundness of the mortgage system have, however, raised concerns that the changes will unduly raise the costs of credit and reduce access for borrowers with limited wealth.
THE OUTLOOK Despite the severe cutback in homebuilding, the sharp slow-down in household growth has kept vacancy rates high. Absorption of the excess supply has been slowed by the weak-ness of the economic recovery, which has yet to stimulate a large enough rebound in employment to spur housing demand. In the meantime, more than 11 million homeowners remain stuck in homes worth less than their mortgages, 2.0 million are severely delinquent on their payments, and 2.2 million are in the foreclosure process. With distressed sales continuing to push down prices, many would-be homebuyers are waiting for even better deals.
On the brighter side, low interest rates and weak prices have made homeownership more affordable than in decades. Several strong months of private sector job growth in early 2011 provide encouraging signs of a housing market rebound. With inven-tories of new homes at historic lows, a turnaround in demand could quickly result in tighter markets. Over the longer term, the number of younger households is set to rise sharply, sup-porting growth in the population that fuels growth in both new renters and first-time buyers. The path of the economy and evolution of the mortgage market will determine when and if this increased demand materializes.
Note: Distressed properties include those bought from a financial institution, purchased as a short sale, or with loans that were either delinquent or in the foreclosure process. Source: JCHS tabulations of US Census Bureau, 1995–2009 American Housing Surveys; and Home Improvement Research Institute, 2010 Recent Home Buyers Survey.
7
6
5
4
3
2
1
0
300
250
200
150
100
50
0
Years in Current Home Built After 2000 Built Before 2000
Less than Two Two or More DistressedNot DistressedDistressedNot Distressed
Homeowners Spend the Most on Improvements Within Two Years of Buying, Especially If the Property Is Distressed
FIGURE 10
Average Annual Improvement Spending Average Post-Purchase Improvement Spending (Thousands of 2009 dollars) (Index)

THE STATE OF THE NATION’S HOUSING 201112
Over the longer term, the aging of the echo boomers into adult-hood and the baby boomers into their retirement years will largely shape housing demand. The baby boomers will drive significant changes in the age distribution of households over the coming decade, lifting the number of households aged 65–74 by 6.5 million and those aged 55–64 by 3.7 million. The impact of the echo baby boomers on household growth is less certain because they are entering the housing market during a period of high unemployment. The weak economy could thus suppress both the share of younger adults that form indepen-dent households and the net immigration that ordinarily aug-ments their ranks.
LACKLUSTER HOUSEHOLD GROWTHThe 2010 Decennial Census reveals that household growth averaged only 1.12 million per year during the 2000s—a full 17 percent lower than in the 1990s. After a strong start, household growth dropped sharply by the end of the decade. According to the major federal surveys, the pace of household growth aver-aged well below 1.0 million annually in 2007–10, with estimated declines from the previous seven-year period ranging from 500,000 to 700,000 per year (Figure 11).
Immigration played a key role in this slowdown. For the first time in decades, growth in the foreign-born population slowed in the 2000s, and growth in the number of foreign-born house-holds appeared to stall in the wake of the recession (Figure 12). After increasing by roughly 400,000 in 2004–7, the total num-ber of foreign-born households was flat thereafter—contribut-ing substantially to weaker overall household growth. Since legal immigration volumes have changed little, this reversal appears to reflect a net loss of undocumented immigrants. Indeed, while the number of households headed by foreign-born citizens increased almost continuously by about 200,000 per year from 2004 to 2010, the number of households headed by foreign-born non-citizens declined by about the same amount from 2007 to 2010.
Lower household formation rates among young adults are another contributing factor. Although the share of young adults that delayed living on their own was growing even before the
The dramatic slowdown in
household growth that began
when the housing market
went bust continued in 2010.
In the aftermath of the Great
Recession, the weak economy
has dampened the pace of
immigration and prevented many
young adults from living on their
own. The ongoing foreclosure
crisis has added to the weakness
of household growth by forcing
more families to double up. While
some share of household growth
that would have occurred over
the past few years may be gone
for good, some may simply be
postponed.
Demographic Drivers3

13JOINT CENTER FOR HOUSING STUDIES OF HARVARD UNIVERSITY
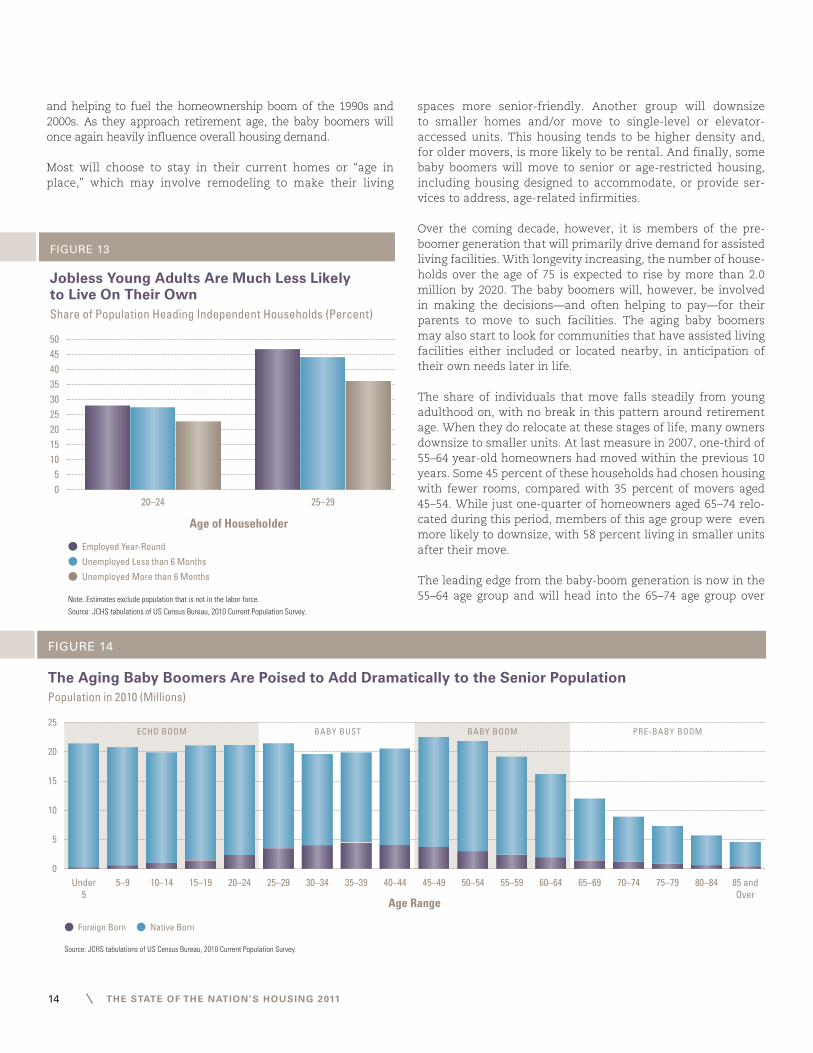
housing bust, this trend intensified in the second half of the 2000s. Since 2007, headship rates (the share heading indepen-dent households) among adults aged 20–24 dropped by 2.6 per-centage points, while those among adults aged 25–29 fell by 2.8 percentage points.
Many of these young adults are living with their parents. After declining slightly from the mid-1990s to the early 2000s, the share of young adults in their 20s living in parental homes began to rise by mid-decade. In 2010, the shares had reached 44.7
percent for 20–24 year-olds and 18.0 percent of 25–29 year-olds. With some 42.6 million adults aged 20–29 in 2010, the increase in these shares since 2005 amounts to an additional 1.6 million young adults living at home.
While the recession is not entirely responsible for the decline in headship rates, high unemployment rates have clearly kept some younger households from living on their own. Without jobs, young adults are less likely to live independently (Figure 13). In fact, household headship rates among 20–24 year-olds employed year-round are more than 5 percentage points higher than for those who have been unemployed for at least six months. Among 25–29 year-olds, this difference increases to 10.5 percentage points.
The fact that the increase in seemingly temporary living situa-tions—young adults living with parents and families doubling up with other households—accelerated after the housing bubble burst and the Great Recession began suggests the pres-ence of at least some pent-up housing demand. But how much and how soon this demand will be released remains uncer-tain. When employment growth picks up and more young adults have jobs, headship rates should recover enough to lift household growth above trend for a period of time. Although somewhat volatile over the past three decades, household formation rates among young adults have converged as each cohort ages.
But many social, demographic, and economic factors are at play and it is possible that headship rates among young adults will not rebound much from recent levels. Even in the absence of recent economic woes, long-term trends toward delayed marriage and childbearing, the growing minority share of the population, the increased importance of higher education for advancement in the job market, and the rising cost of going away to college have all helped to lift the numbers of young adults liv-ing with their parents or doubling up with others.
THE BABY BOOMERS AND HOUSING DEMAND With household growth among young adults slowing, the aging of the baby boomers will dominate changes in the age distribu-tion of households. While shrinking in size as mortality rates rise, the baby-boom generation far outnumbers its immediate elders and will therefore add dramatically to the senior popula-tion (Figure 14). The number of households with heads between the ages of 55 and 74 is set to increase by 10.2 million from 2010 to 2020. This projection is much more certain than that for younger households because it is less subject to unknowns about trends in immigration and headship rates.
The baby boomers have dominated housing market trends at each stage of their lives—first as children in the households that were part of the great wave of suburbanization, then as young adults entering the housing market for the first time, and most recently as middle-aged households trading up to bigger and better homes
Note: Average annual growth in the American Community Survey is based on years 2007–9.Source: JCHS tabulations of US Census Bureau, American Community Surveys, Current Population Surveys, and Housing Vacancy Surveys.
● 2000–7 ● 2007–10
1.4
1.2
1.0
0.8
0.6
0.4
0.2
0.0Housing Vacancy
SurveyCurrent Population
SurveyAmerican Community
Survey
By Every Major Measure, Household Growth Slowed Sharply Late in the 2000sAverage Annual Household Growth (Millions)
FIGURE 11
Source: JCHS tabulations of US Census Bureau, Decennial Censuses and 2009 American Community Survey.
1.2
1.0
0.8
0.6
0.4
0.2
0.01970–1980 1980–1990 2000–20091990–2000
Three Decades of Increasing Immigration Ended in the 2000sAverage Annual Growth in Foreign-Born Population (Millions)
FIGURE 12
THE STATE OF THE NATION’S HOUSING 201114
and helping to fuel the homeownership boom of the 1990s and 2000s. As they approach retirement age, the baby boomers will once again heavily influence overall housing demand.
Most will choose to stay in their current homes or “age in place,” which may involve remodeling to make their living
spaces more senior-friendly. Another group will downsize to smaller homes and/or move to single-level or elevator-accessed units. This housing tends to be higher density and, for older movers, is more likely to be rental. And finally, some baby boomers will move to senior or age-restricted housing, including housing designed to accommodate, or provide ser-vices to address, age-related infirmities.
Over the coming decade, however, it is members of the pre-boomer generation that will primarily drive demand for assisted living facilities. With longevity increasing, the number of house-holds over the age of 75 is expected to rise by more than 2.0 million by 2020. The baby boomers will, however, be involved in making the decisions—and often helping to pay—for their parents to move to such facilities. The aging baby boomers may also start to look for communities that have assisted living facilities either included or located nearby, in anticipation of their own needs later in life.
The share of individuals that move falls steadily from young adulthood on, with no break in this pattern around retirement age. When they do relocate at these stages of life, many owners downsize to smaller units. At last measure in 2007, one-third of 55–64 year-old homeowners had moved within the previous 10 years. Some 45 percent of these households had chosen housing with fewer rooms, compared with 35 percent of movers aged 45–54. While just one-quarter of homeowners aged 65–74 relo-cated during this period, members of this age group were even more likely to downsize, with 58 percent living in smaller units after their move.
The leading edge from the baby-boom generation is now in the 55–64 age group and will head into the 65–74 age group over Note: Estimates exclude population that is not in the labor force.
Source: JCHS tabulations of US Census Bureau, 2010 Current Population Survey.
● Employed Year-Round
● Unemployed Less than 6 Months
● Unemployed More than 6 Months
Age of Householder
504540353025201510
50
20–24 25–29
Jobless Young Adults Are Much Less Likely to Live On Their Own Share of Population Heading Independent Households (Percent)
FIGURE 13
● Foreign Born ● Native Born
Source: JCHS tabulations of US Census Bureau, 2010 Current Population Survey.
25
20
15
10
5
030–3425–2920–2415–19 65–69 70–74 75–79 80–84 85 and
Over10–14 55–5950–5445–4940–4435–39 60–645–9Under
5
ECHO BOOM BABY BUST BABY BOOM PRE-BABY BOOM
Age Range
The Aging Baby Boomers Are Poised to Add Dramatically to the Senior PopulationPopulation in 2010 (Millions)
FIGURE 14

15JOINT CENTER FOR HOUSING STUDIES OF HARVARD UNIVERSITY
the next decade. As a result, demand for smaller homes should increase steadily as the baby boomers age. Since young first-time homebuyers also tend to purchase homes that are smaller and less expensive than average, the echo boomers will add to the demand for more modest housing as they replace the smaller baby-bust generation in the under-35 age range.
GEOGRAPHIC POPULATION SHIFTSEarly results from the 2010 Decennial Census show that the US population continues to shift to the South and West. Growth in these two regions was approximately 14 percent over the past decade, far exceeding the 3–4 percent pace in the Northeast and Midwest. All five fastest-growing states—Nevada, Arizona, Utah, Idaho, and Texas—are located in the South or West, each registering population gains of more than 20 percent in 2000–10.
The US population is also shifting toward metropolitan areas, although growth remains concentrated in the lowest-density counties of these areas (Figure 15). While major cities such as New York, Chicago, Los Angeles, and Houston have seen consid-erably slower population gains over the past decade, their sub-urbs continue to attract growing numbers of residents. Indeed, growth rates in high-density metropolitan area counties were less than a third of those in medium- and low-density counties. Moreover, only 12.7 percent of decade-long population growth occurred in high-density areas.
The baby boomers may reinforce these trends. When older households make longer-distance moves, they tend to relocate to areas with warmer climates and lower housing costs. Over
the past decade, the leading edge of the baby-boom genera-tion has shown no inclination to move back to cities. In fact, the share living in cities has decreased, representing a net loss of 343,000 households, while the share living in rural areas outside metro areas has increased. Furthermore, with the majority of baby boomers living in suburbs and aging in place, the number of seniors living in suburban areas will grow by millions over the next two decades. The pressure to add more services and amenities geared toward the elderly in these areas will no doubt increase.
It must be said, however, that the baby boomers have seldom behaved like their predecessors at comparable ages. There are reasons to believe that they will make somewhat different housing choices and perhaps on a different timetable. First, more baby boomers are expected to work at least part-time well past the typical retirement age, at least in part because their retirement savings and home equity eroded so greatly in the wake of the Great Recession. In addition, many baby-boomer households have two earners, which may mean that more couples will retire in stages. And finally, both the baby boomers and their children are more likely to have had fami-lies later in life than previous generations. As a result, they are more apt to become grandparents later in life, which may increase their tendency to age in place rather than move away from their families.
INCOME AND WEALTH TRENDS Income and wealth influence household formation decisions, the quality and size of homes demanded, and the share of income allocated to housing. In sharp contrast to the 1990s, real household incomes in the 2000s fell for all age groups under 55. The decade-long stagnation of household incomes and erosion of wealth—and especially housing wealth—have contributed to a steep rise in the share of households spending more than half their incomes on housing.
After the 2001 recession, employment regained little ground before the Great Recession struck in 2007. Even when mea-sured from peak to peak during the last economic cycle, real incomes fell for the bottom 70 percent of households. This trend significantly lowered the income trajectory of the younger baby boomers compared with those of their older counterparts and the pre-boomers. Indeed, the younger baby boomers have ended their peak earning years of 45–54 with lower household incomes than those of the older baby boom-ers (Figure 16). The largest income declines have been among low-income households, minorities, and the foreign-born. As a result, the income gap between whites and minorities, as well as between native- and foreign-born households, expanded from 2000 to 2009.
The Great Recession has also decimated household net wealth. Real median household net wealth fell by more than 23 percent in 2007–9, from $125,400 to $96,000. In aggregate,
Note: Each density category represents one-third of the metro area population in 2000.Source: JCHS tabulations of US Census Bureau, 2000 and 2010 Decennial Censuses.
Metro Area County Density
14
12
10
8
6
4
2
0Low Medium Non-MetroHigh
Residential Growth Continues to Favor Low-Density Counties in Metropolitan AreasPopulation Growth, 2000–10 (Millions)
FIGURE 15

THE STATE OF THE NATION’S HOUSING 201116
real net household wealth plunged some $12.4 trillion from 2006 to 2010, returning to its 2003 level. The prolonged weak-ness in home values continues to be a drag on household wealth, with the decline in home equity accounting for 61 percent of the drop. After hitting a low of $50.1 trillion in the first quarter of 2009, household net wealth recovered to $56.6 trillion in the fourth quarter of 2010, led by a $6.9 trillion jump in the value of stock wealth. The total value of real estate owned by households declined slightly during this time.
The collapse in home prices has not affected all homeowners equally. Minority homeowners, in particular, were poorly posi-tioned to absorb such a significant drop. Among homeowners with mortgages in 2007, the median mortgage debt among minorities—who are younger on average and more likely to have bought near the market peak—was 13.5 percent higher than among their white counterparts, while their median home equity was 26.8 percent lower (Table W-2). From 2007 to 2009, the median value of homes owned by minorities fell 20 percent in real terms, compared with 13 percent for whites. As a result, minority homeowners are much more likely to be underwater on their mortgages than white homeowners.
THE OUTLOOKLingering economic uncertainty makes it difficult to predict the pace of household growth. Nonetheless, the aging of the echo boomers should boost the number of households in their late 20s and early 30s by replacing the smaller baby-bust gen-
eration currently in that age group. But employment growth will be a critical factor in how quickly echo boomers form independent households. A lackluster economy could keep headship rates lower than those of the baby-bust generation at the same ages, muting household growth among this large generation. Over the next decade, it is much more certain that the baby boomers will boost the number of senior households to unprecedented heights.
Immigration will be a major factor in future household growth. If the foreign-born population (which tends to include large shares of young adults) increases at pre-recession rates, it will augment the size of the echo-boom generation and lift the pace of household growth. If the economic recovery is slow and pro-tracted, however, immigration may be relatively low for several years. The JCHS low-series household growth projection of 11.8 million in 2010–20 accounts for this uncertainty by assuming that immigration in the next decade is only half that in the Census Bureau’s baseline projection.
Trends in headship rates among young adults, however, pose an even greater risk that household growth will fall short of projec-tions. If household headship rates by age and race/ethnicity fall below their averages in 2007–9, household growth in 2010–20 could be even slower than in the 2000s.
The prospects for household wealth and income growth are also uncertain. For homeowners, a stronger recovery in household net wealth will depend largely on a rebound in house values, which were still falling in most areas in the first quarter of 2011. For incomes, sustained job growth will be key to a strong and sustainable recovery. Labor markets in fact showed signs of revival in early 2011, with private-sector job growth exceed-ing 200,000 for the third consecutive month in April. This is the first three-month increase of this magnitude since May 2004. Nonetheless, income growth is expected to remain a chal-lenge—particularly for young adults—as the economy struggles to add back the millions of jobs lost during the recession while also keeping pace with labor force growth.
Notes: Younger baby boomers were in their peak earning years of 45–54 in 2010. Older baby boomers were in that age range in 2000.Source: JCHS tabulations of US Census Bureau, 1980–2010 Current Population Surveys.
● Younger Baby Boomers ● Older Baby Boomers
Age of Householder
74
72
70
68
66
64
62
60
5835–44 45–54
At Ages When Earnings Typically Peak, the Incomes of Younger Baby Boomers Are LaggingReal Median Household Income (Thousands of 2009 dollars)
FIGURE 16

17JOINT CENTER FOR HOUSING STUDIES OF HARVARD UNIVERSITY
FALLING HOMEOWNERSHIP RATESThe decline in the national homeownership rate accelerated last year, down another 0.5 percentage point to 66.9 percent. The current rate now stands 2.1 percentage points below the 2004 peak, and 0.5 percentage point below the rate in 2000. The drop from the peak is the largest posted in annual records dat-ing back to 1960, and the more precise estimates from the 2010 Decennial Census may reveal that the decade-long decline was even more severe.
Although lower for all age groups, homeownership rates among younger households took the largest hit. Indeed, rates among 30–34 year-olds fell by some 5.8 percentage points since the peak, compared with just 0.2 percentage point among households aged 75 and older. But while rates for householders under age 40 have dropped the most, those for each five-year age group between 40 and 59 have also reached their lowest levels since data collection began in 1982. With steep declines in home prices and rising rates of loan defaults, millions of middle-aged households have either turned to renting after losing their homes or have forgone the move to homeownership altogether.
The drop in homeownership rates reflects both a net loss of owners and a substantial gain in renters (Figure 17). The num-ber of homeowner households declined by 805,000 in 2006–10, while the number of renters rose steadily for six consecutive years, up 3.9 million since 2004. Many households switch between owning and renting in any given year (Figure 18). But fewer younger renters are now moving to homeownership, and more older homeowners are becoming renters. This is particularly true among 45–54 year-olds, where the number of owner-to-renter moves climbed 42 percent from 2005 to 2009.
The foreclosure crisis is behind much of the trend among middle-aged householders. Some 3.5 million foreclosures were completed in 2008–10, and another 2.2 million home loans—a record 4.2 percent—were in the foreclosure process at the end of last year. Yet another 2.0 million loans were 90 or more days delinquent but not yet in foreclosure.
Government and private-sector interventions have staved off foreclosure of many distressed borrowers. In 2010, more than
Homeownership rates slid again
in 2010 as foreclosures mounted
and the weak economy, house
price volatility, and overall
uncertainty chilled demand from
potential buyers. Tighter lending
standards are also preventing
interested homebuyers with
limited savings or impaired
credit from taking advantage
of improved affordability.
Meanwhile, the changing
government role in the mortgage
market opens up many questions
about future lending costs and
product availability.
4 Homeownership

THE STATE OF THE NATION’S HOUSING 201118
500,000 troubled loans were permanently modified under the Housing Affordable Modification Program (HAMP), and an even greater 1.2 million private-sector modifications were complet-ed. But even borrowers able to qualify for loan modifications remain at high risk of default.
With the volume of distressed loans still so high, foreclo-sures will continue to drag down homeownership rates in 2011. One longer-term factor working in favor of home-ownership, however, is the aging of the US population. Homeownership rates rise significantly with age and do not begin to fall until householders are in their 70s. In fact, the shifting age distribution of the population has prevented the national homeownership rate from falling even more sharply. If age-specific homeownership rates had remained constant in 2005–10, the aging of the population alone would have pushed the overall homeownership rate up 0.8 percent-age point compared with the 2.2 percentage point decline that actually occurred.
A key question is whether the foreclosure crisis will reduce the appeal of homeownership. Even after one of the worst housing crashes in US history, though, Americans still appear to strong-ly prefer owning their homes. According to the Fannie Mae National Housing Survey for the first quarter of 2011, house-holders under age 35 remain optimistic about homeownership, with 65 percent responding that now is a good time to buy a house, 62 percent believing that owning a home is a safe invest-ment, and 57 percent viewing homeownership as an investment with a lot of potential.
Despite a greater appreciation of the financial risks, preferences for homeownership among renters remain strong. Even though the share of renters responding that owning makes more financial sense than renting slipped last year, it was still high at 68 percent in the fourth quarter of 2010. Indeed, the share rebounded sharply to 74 percent in the first quarter of 2011. Considering the fact that the most common reasons cited for buying homes are nonfinancial—including a good place to raise and educate children, feelings of safety, and greater control over one’s living environment—the continued appeal of homeowner-ship is not surprising.
REGIONAL AND STATE PATTERNSMany of the areas that experienced the largest increases in homeownership during the housing boom are now posting the largest declines. The most dramatic shift occurred in the West, where homeownership rates climbed by 5.0 percentage points in 1995–2004 and then fell 2.8 percentage points in 2004–10. The decline in the Midwest, while much more modest, has left the regional homeownership rate below 2000 levels.
Homeownership rates in states hit particularly hard by the foreclosure crisis—such as California, Nevada, and Arizona—have also dropped sharply. In these states, the typical peak-to-trough decline is twice that in the US overall. As of 2010, home-ownership rates in 28 states stood below 2000 levels, with rates in Virginia, New Mexico, Iowa, and Nevada more than 4 percentage points below. In contrast, rates in Massachusetts, New Hampshire, and Washington, DC, are up more than 4 percentage points from 2000.
Notes: Mover households reported having changed residence in the two years since the previous survey. Estimates do not include newly formed households.Source: Table A-7.
● 1999–2001 ● 2001–3 ● 2003–5 ● 2005–7 ● 2007–9
2.502.252.001.751.501.251.000.750.500.250.00
Owners Switching to Renting
Renters Switching to Owning
Net Change in Homeowners Among Movers
Fewer Renters Are Moving into Homeownership,and More Owners Have Turned to Renting Household Moves Per Year (Millions)
FIGURE 18
Source: JCHS tabulations of US Census Bureau, Housing Vacancy Surveys.
● Homeowners ● Renters ■ Homeownership Rate
Homeownership Rate (Percent)
3.0
2.5
2.0
1.5
1.0
0.5
0.0
-0.5
-1.02004–6 2008–10
69.5
69.0
68.5
68.0
67.5
67.0
66.5
66.0
65.52002–4 2006–8
Falling Homeownership Rates Reflect a SharpTurnaround in Owner and Renter Household GrowthChange in Households (Millions)
FIGURE 17

19JOINT CENTER FOR HOUSING STUDIES OF HARVARD UNIVERSITY
The retreat in homeownership has also been relatively greater in principal cities than in suburban and rural areas. With a much lower peak of just 54.2 percent in 2005, homeownership rates in principal cities fell by 2.1 percentage points by 2010. This decline was almost as large as in suburbs, where home-ownership rates were off 2.4 percentage points from a much higher peak of 76.4 percent.
WIDENING HOMEOWNERSHIP GAPS While all household types have been affected, the decline in homeownership rates among families with children has been particularly large. Between the post-2000 peak and 2010, the homeownership rate for married couples was down 2.1 percent-age points while that for single-parent households was down 2.4 percentage points. Meanwhile, the rate for single-person households—especially single male-headed households—fell only modestly.
Homeownership rate declines for black (3.8 percentage points) and Hispanic households (2.1 percentage points) have outpaced those for white households (1.5 percentage points), erasing most of the improvement in the white-minority gap made over the last two decades (Figure 19). The disparity was back to 25.5 percentage points in 2010, up from an all-time low of 24.4 per-centage points in 2008.
Differences in age and income between whites and minori-ties explain only part of this disparity. Even after control-ling for these factors, the homeownership rate gap between
whites and blacks widened by 1.4 percentage points, and between whites and Hispanics by 0.4 percentage point, in the last five years alone.
The homeownership rate for low-income whites fell 3.7 percent-age points to 56.2 percent between 2005 and 2010—a decline of 700,000 owner households. Homeownership among low-income blacks was down by nearly as much, dropping 3.5 percentage points to just 29.9 percent in 2010. Declines among low-income Hispanics, Asians, and other minorities were more modest. In fact, the number of low-income owners among these groups increased slightly, although not nearly as much as the number of renters.
Given the vital role of homeownership in generating house-hold wealth, white-minority gaps in homeownership rates are a public policy concern. A major stumbling block for minority households is that they have significantly lower wealth than white households—a product of differences in current eco-nomic circumstances and the legacy of lower homeownership rates among previous generations. At last measure in 2007, the median minority renter had only $300 in cash savings and $2,700 in net worth, while the median white renter had roughly three times those amounts (Table W-2). As a result, proposed increases in downpayment requirements for qualified residen-tial mortgages and for loans guaranteed by Fannie Mae and Freddie Mac will likely limit the pool of minority households able to secure financing. Attaining homeownership is important not only for individual minority families, but also for the market as a whole—especially as the minority share of the population continues to increase.
WIDESPREAD AFFORDABILITY GAINS FOR BUYERSThe ratio of house prices to household income is a common measure of homebuyer affordability. This metric improved again in 2010 as the median home price fell to about 3.4 times the median household income, the lowest level since 1995 and in line with the 1980–2000 average (Figure 20). Meanwhile, the Freddie Mac 30-year mortgage interest rate slipped from 5.00 percent in the first quarter of last year to 4.41 percent in the fourth. Indeed, the October reading of 4.23 percent was the low-est level since the series began in 1971.
Assuming a 30-year mortgage and a 10-percent downpayment requirement, monthly payments on a median-priced home dipped below $900 last year. This is a substantial improvement from the $1,362 posted as recently as 2007. Payments on the median-priced home as a share of median household income also hit a new low of 18 percent in the fourth quarter of 2010, down from 20 percent a year earlier and from 32 percent at the end of 2005. According to the NAR index, home price affordabil-ity was at an all-time high in the fourth quarter of last year. The number of households able to afford the monthly payments at 28 percent of income thus rose from 48.2 million in 2007 to 70.8 million in 2010 (Table W-1).
Notes: White and black households are non-Hispanic. Hispanic households can be of any race.Source: Table A-3.
0.0
-0.5
-1.0
-1.5
-2.0
-2.5
-3.0
-3.5
-4.0
Race/Ethnicity
White BlackHispanic
Homeownership Rates Have Fallen More Sharply Among Minorities than Among WhitesChange in Homeownership Rate, Peak to 2010 (Percentage point)
FIGURE 19

THE STATE OF THE NATION’S HOUSING 201120
Estimated payment-to-income ratios suggest that the month-ly carrying costs of owning a home improved across much of the country. In the fourth quarter of last year, payments on a median-priced home stood at less than 20 percent of median household income in more than 80 percent of metro areas covered by NAR. This was a marked improvement from the 69 percent share of metros at the end of 2009 and the 33 percent share in 2005. Price declines also helped to moder-ate conditions in the least-affordable coastal metros. For example, payments on a median-priced home dropped from the sky-high level of 69 percent of median income in Los Angeles to 30 percent between the third quarter of 2007 and the fourth quarter of 2010. The drop in San Francisco was equally dramatic, with payments falling from 76 percent of median income to 38 percent.
Payment-to-income ratios for a median-priced home pur-chase in the most distressed housing markets also plum-meted. In Las Vegas, median payments declined from 39 percent to 13 percent of median income. Ratios in Florida also dropped to their lowest recorded levels at the end of 2010, led by the Cape Coral metro area where payments on the median home plunged from 38 percent of median income to 9 percent.
But improved payment-to-income ratios translate into increased affordability only for those households well-positioned enough to obtain mortgages. Would-be homebuyers face a number of finan-cial stresses, including lower incomes, weakened credit scores, and depleted savings. At the same time, lenders have returned to more traditional underwriting standards for debt-to-income ratios and downpayments. Recent buyers are thus limited to households with
high enough wealth and income to qualify for loans or pay cash. Indeed, nearly 3 in 10 sales last year were cash purchases.
While highly qualified first-time homebuyers were thus able to take advantage of lower house prices and interest rates, afford-ability also improved for owners able to refinance last year. Borrowers refinanced their loans not only to reduce their pay-ments, but also to shorten loan durations. Of loans transacted through Freddie Mac, some 31 percent of 30-year fixed-rate mortgages, plus 63 percent of 20-year fixed-rate loans, were refinanced with shorter terms.
According to the 2009 American Housing Survey, however, many cost-burdened homeowners who would have benefited most from refinancing were unable to do so. In particular, own-ers in the bottom income quartile were only half as likely as owners in the top quartile to refinance to lower interest rates (Figure 21). The barriers to refinancing are substantial: unem-ployed homeowners cannot meet required payment-to-income ratios, while those with underwater mortgages lack the equity to meet required debt-to-value ratios.
The Obama Administration’s Home Affordable Refinance Program (HARP), which has just been extended through June 30, 2012, provides underwater homeowners with loans owned or guaranteed by the GSEs some help with this challenge. Borrowers can refinance up to 125 percent of the home value if they have sufficient income to support the new loan. HARP also enables owners whose homes have lost value to refinance without having to pay mortgage insurance even if their equity is less than 20 percent. GSE programs offer additional loan modi-fication options for distressed borrowers ineligible for HAMP.
● Current Ratio ● 1980–2000 Average
Source: JCHS tabulations of National Association of Realtors®, Existing Home Sales Prices; and Moody’s Economy.com, Median Household Income.
5.004.754.504.254.003.753.503.253.002.752.50
1980
1981
1982
1983
1984
1985
1986
1987
1988
1989
1990
1991
1992
1993
1994
1995
1996
1997
1998
1999
2000
2001
2002
2003
2004
2005
2006
2007
2008
2009
2010
The National Median Price-to-Income Ratio Has Returned to Its Long-Run AverageRatio of Median Single-Family Home Price to Median Household Income
FIGURE 20

21JOINT CENTER FOR HOUSING STUDIES OF HARVARD UNIVERSITY
THE STATE OF MORTGAGE LENDING The government footprint in the mortgage market was larger than ever in 2010. Inside Mortgage Finance reports that Freddie Mac, Fannie Mae, and FHA owned or guaranteed approximate-ly 90 percent of single-family mortgage originations last year. Nevertheless, private lending activity without the benefit of a federal backstop has begun to pick up slightly, primarily in the form of jumbo prime loans that exceed the conforming limit. Extension of the temporary increase in the conforming loan limit (from $417,000 to $625,500, and up to $729,750 in high-cost areas) until October 2011 will, however, keep the govern-ment in a dominant role until at least that time.
With Fannie, Freddie, and FHA cutting back on higher-risk loans, borrowers with low credit scores have found it increas-ingly difficult to obtain financing. The share of home-purchase mortgages originated to persons with credit scores below 600 thus dropped from 9.0 percent in 2006 to just 0.5 percent in 2010, while the share originated to persons with scores of 740 or higher increased from about 34 percent to about 44 percent. Even among FHA loans, both the volume and share of low-credit score borrowers fell in 2010 after a surge in 2008–9.
While FHA has filled an important need by lending to those with less cash and weaker credit histories, the cost of this credit has been increasing. After raising its mortgage insur-ance premiums in 2008 to shore up its insurance fund, FHA boosted the price of its loans again in 2010. In addition to a one-time, up-front premium of 1 percent of the loan, FHA charges an annual insurance premium of 1.10–1.15 percent of the mortgage balance, effectively raising borrowers’ interest rates by that amount.
THE OUTLOOK Many unknowns cloud the outlook for homeownership. How the foreclosure crisis will wind down is a major issue since it will determine the extent to which millions of distressed own-ers are forced to forgo homeownership. The longer-term ques-tion is whether these households will buy homes in the future and, if so, how long it will take them to do so. Also unclear is the impact of recent market conditions on younger household-ers and older renters, who may be less inclined to move into homeownership now that the risks are painfully obvious and financing is harder to come by. Nevertheless, renter attitudes about the financial benefits of homeownership improved in the first quarter of 2011, suggesting that concerns about the investment risks of owning may be easing.
While the shifting age distribution of the US population favors growth in homeownership, market conditions could continue to hold down homeownership rates just as they have for the past five years. JCHS projections suggest, howev-er, that if homeownership rates for each five-year age group remain at 2010 levels, the number of homeowners should increase by 8.2 million in 2010–20. And even if homeowner-ship rates fall substantially, overall household growth should restore growth in the number of homeowners over the com-ing decade.
Upcoming changes in the mortgage market will determine what, if any, role the federal government will play in guaran-teeing loans and what restrictions are made on mortgage prod-ucts and the way they are funded. These changes will affect the cost and availability of different types of mortgages for various segments of US society. While the financial crisis has made it abundantly clear that greater oversight of the mortgage market is necessary, the benefits of controlling risk must be balanced against the costs of closing the door to homeownership for those who, under the right conditions, would greatly benefit from this opportunity.
Source: JCHS tabulations of US Census Bureau, 2009 American Housing Survey, using JCHS-adjusted weights.
Household Income Quartile
40
30
20
10
0Upper MiddleBottom Lower Middle Top
High-Income Homeowners Were More than Twice as Likely as Low-Income Households to Refinance in 2008–9 Share of Non-Mover Households with Mortgages that Refinanced(Percent)
FIGURE 21

THE STATE OF THE NATION’S HOUSING 201122
RESURGENCE OF RENTAL DEMANDWhile the homeowner market remains mired in foreclosures and weak demand, rental market conditions have improved. Indeed, renter household growth has outpaced owner household growth for four consecutive years. From 2006 to 2010, the number of renter households jumped by 692,000 annually on average, to 37 million, while the number of owner households fell on net by 201,000 annually. This is a complete reversal from the preceding decade and a half, when homeowners drove the vast majority of household growth and the number of renters stagnated.
Two trends underlie this shift: the rising number of renters who have deferred homebuying, and the rising number of owners who have switched back to renting. In the past few years, an unusu-ally large share of typical first-time buyers—married couples and younger households—have remained renters. Indeed, while the number of households aged 25–34 increased by 1 percent from 2007 to 2009, the number of households in this age group that bought their first homes fell 14 percent during this period. The number of first-time homebuyers in the 35–44 year-old age group fell even more sharply, down 21 percent. The trend among married couples is similar, with a 19 percent drop in first-time homebuyers despite no change in their overall numbers.
With home values still falling in many markets, even would-be homebuyers appear to be waiting on the sidelines until they are convinced that prices have bottomed out. But the improv-ing economy and affordable home prices may be leading more renters to think about buying. The latest Fannie Mae National Housing Survey indicates that the percentage of renters saying they will probably continue to rent the next time they move declined to 54 percent in the first quarter of 2011, down from a peak of 59 percent in June 2010.
Meanwhile, recession-induced income and job losses have forced many former homeowners to turn to renting. According to First American CoreLogic, owners lost some 3.5 million homes to foreclosure from 2008 through 2010. Taking into account that some share of these properties were investor-owned, these foreclosures have displaced millions of renters as well. And although the number of delinquent loans is finally ebbing, the volume of foreclosures and short sales continues to
The rental market has gained
strength over the past year,
bringing good news to investors.
Demand has picked up sharply,
vacancy rates have started to
retreat, and rents are turning
up. With new construction still
depressed, markets are likely to
continue to tighten. But rising
rents, together with ongoing
losses of the low-cost stock,
mean declining affordability for
the millions of lower-income
households that make rental
housing their homes.
5 Rental Housing

23JOINT CENTER FOR HOUSING STUDIES OF HARVARD UNIVERSITY
rise as lenders work through a huge backlog of troubled loans. Thus, many more owners will become renters in the coming years—and will remain so for some time as they build savings and reestablish their credit ratings.
STABILIZING VACANCIES AND RENTSAfter peaking at 10.6 percent in 2009, the national rental vacancy rate edged down to 10.2 percent in 2010. The absorp-tion of excess units appears to be gaining momentum, however, with the overall rate ending the year at 9.4 percent—the lowest quarterly posting since early 2003. The drop in vacancies was concentrated in multifamily buildings, while rates for single-family rentals have held steady since 2005.
Early findings from the 2010 Decennial Census, which provides the most comprehensive count of units and households, suggest that vacancy rates may have been even lower last year than these estimates indicate. Nevertheless, the Housing Vacancy Survey shows that rental vacancy rates vary widely across metropolitan areas, ranging from 4.2 percent in Portland to 19.0 percent in Orlando. Among the metros with the lowest rates
are historically tight rental markets such as Boston, New York, and Los Angeles, where vacancies have been elevated for the past two years but still remain 3–5 percentage points below the national rate.
At the other extreme, vacancy rates are still at record highs in many areas hard hit by both the recession and foreclosures, where many for-sale homes were shifted to the rental market. At the height of the housing boom in 2006, rental vacancy rates in several overheated markets (including Riverside, Tampa, and Las Vegas, along with Phoenix and Orlando) had dipped below the 9.7 percent national average. Since then, though, rates have soared to decade highs. But even in metros such as Memphis that largely avoided housing price bubbles, rates doubled from 2006 to 2009. In these markets, faltering local economies and high unemployment forced more doubling up with friends and family.
Rents, however, appear to be on the rise. After flattening in 2009, nominal rents began to increase in the second half of 2010. According to Axiometrics, rent concessions (free or dis-counted rent incorporated into the lease term) also dropped
● Decline (Up to 5.0%)
● Less than 2% Increase
● 2–5% Increase
● Greater than 5% Increase (Up to 9.6%)
Notes: Rent change is for average effective rents measured from the fourth quarter to the fourth quarter. Estimates are based on a sample of investment-grade properties.Source: JCHS tabulations of MPF Research data.
Rental Markets Are Tightening in Most of the Largest MetrosChange in Nominal Rents, 2009-10 (Percent)
FIGURE 22
Nominal Change in Rents, 2009-10Decline (Up to 5.0%)
Less than 2% Increase
Greater than 5% Increase (Up to 9.6%)
2-5% Increase

THE STATE OF THE NATION’S HOUSING 201124
from 7.6 percent to 5.2 percent of asking rents over the course of last year. Similarly, MPF Research found that nominal rents for professionally managed properties with five or more units (adjusted for concessions) were up 2.3 percent from the fourth quarter of 2009 to the fourth quarter of 2010, outpacing overall price inflation and partially offsetting the 4.1 percent drop in the previous year.
While the overall trend in rents is positive, increases vary across the country (Figure 22). The largest gains are again in metropolitan areas with some of the highest rents and lowest vacancy rates. In traditionally tight markets such as New York, San Jose, and Washington, DC, nominal rents climbed by more than 5 percent in 2010. In contrast, the average increase was just 1.7 percent in the West and 2.5 percent in the South. These regions are home to the only 3 metro markets (of the 64 tracked) where average rents actually fell last year: Las Vegas, Fort Myers, and Tucson.
ADDITIONS TO THE RENTAL SUPPLYDespite the recent growth in rental demand, new multifamily production has lagged. According to the Census of Construction, completions of rental units in multifamily structures (with two or more units) dipped to their lowest level in 17 years, totaling just 124,000 in 2010 after averaging 224,000 per year from 2000 to 2008.
But not all rental housing is in multifamily structures. In fact, single-family homes make up a significant—and growing—share of the stock. Switching of single-family units from the for-sale inventory to the rental stock not only provides needed
housing for renters, but has also helped to stabilize the home-owner market by reducing the excess vacant supply. Between 2005 and 2009, the net addition of 1.7 million households lifted the single-family share of occupied rentals from 31.0 percent to 33.7 percent. Moreover, about 22.6 percent of the 2009 single-family rental stock had been owner units just two years earlier.
Overall, the shift of units from the owner to the rental market has more than offset the slump in new construction, explaining why vacancy rates rose despite the falloff in production and the significant influx of renters. Additions to the rental stock from existing owner units have soared since 2005, exceeding 1.8 mil-lion from 2007 to 2009 and far outpacing the number contrib-uted by new construction (Figure 23).
Although multifamily rental completions declined in 2010, pro-duction may be about to revive. After bottoming out in 2009 at just 92,000 units, a low not seen since World War II, multifamily rental starts picked up slightly to 101,000 units in 2010. While a promising upturn, last year’s starts were less than half the 232,000 units averaged each year in 2000–8, and even further below levels in the 1980s and 1990s.
The recovery in multifamily production is already spreading to a broad range of metros. In fact, markets in some of the states hardest hit by the foreclosure crisis posted some of the largest increases in multifamily permits in 2010, including San Jose, Los Angeles, and Miami. Other metros that saw a large jump in permits were Seattle and Chicago.
MULTIFAMILY MORTGAGE MARKETSMultifamily lending surged from 1998 to 2008, nearly doubling in volume from $430 billion to $830 billion in real terms. By 2009, though, lending activity slowed to a trickle as delin-quency and foreclosure rates soared and credit markets tight-ened. Performance has been particularly dismal for loans held in commercial mortgage backed securities (CMBS), where the share of delinquent or foreclosed loans doubled from about 7 percent in 2009 to 14 percent in 2010. In stark contrast, the share of troubled multifamily rental loans is 5 percent for banks and thrifts, and just 1 percent or less for Fannie Mae, Freddie Mac, and FHA.
The climb in multifamily loan delinquencies has led to strict-er underwriting standards, especially among private lenders. According to the Federal Reserve survey of senior loan officers, standards for multifamily and commercial real estate loans started to tighten in 2005 as mortgage markets began to implode. By 2008, 88 percent of respondents on net reported more strin-gent standards. This share fell back to zero in January 2011, indicating that lenders were no longer tightening (although not necessarily loosening) their underwriting criteria.
With private lenders restricting the flow of credit, the GSEs and FHA have accounted for nearly all of the growth in
Note: New rental completions include both single-family and multifamily units.Source: JCHS tabulations of US Census Bureau, Census of Construction and American Housing Surveys.
● Net Transfers from Owner Stock ● New Rental Completions
2.0
1.5
1.0
0.5
0.0
-0.51999–2001 2003–2005 2007–20092005–20072001–2003
Conversion of Owner-Occupied Units Has Contributed an Increasingly Large Share of Rental Stock Growth Over the Past DecadeNew Rental Units (Millions)
FIGURE 23

25JOINT CENTER FOR HOUSING STUDIES OF HARVARD UNIVERSITY
multifamily lending since 2008. From the fourth quarter of 2007 to the fourth quarter of 2010, their share of outstanding multifamily debt was up 30 percent. In fact, the multifamily loan volume for the GSEs more than doubled over the past decade, making them the largest lender in the market (Figure 24). FHA also expanded its multifamily lending substantially, bringing the total volume to nearly $11 billion in 2010 and accounting for nearly 25 percent of the market last year. With this increase, the number of rental units financed with FHA support tripled from about 49,000 in 2008 to more than 150,000 in 2010.
The GSEs, however, cannot guarantee construction loans and have therefore been unable to prop up lending in this market segment. The limited availability of funding for acquisition, development, and construction (ADC) financing may slow the development of rental housing as demand picks up. The credit crunch has been particularly tough for smaller builders, who generally have more difficulty securing ADC financing because they rely primarily on local banks for loans. Large commercial builders, in contrast, can access credit from capital markets. According to a National Association of Homebuilders (NAHB) survey conducted in the fourth quarter of 2010, 52 percent of smaller builders (with less than $1 million in revenues) had put multifamily rental projects on hold until the financing climate improves, compared with 35 percent of larger builders (with more than $5 million in revenues).
Nonetheless, fewer firms are now delaying new multifamily con-struction projects. From the third quarter of 2009 to the fourth quarter of 2010, the overall share of respondents putting projects on hold fell from 57 percent to 43 percent. FHA may be helping to support this rebound, having raised its multifamily lending for new construction and substantial rehabilitation nearly four-fold, from $1.0 billion to $3.8 billion, between fiscal years 2008 and 2010.
With vacancy rates falling and rents increasing by late 2010, cash flow and property values are improving for the first time in years. The National Council of Real Estate Investment Fiduciaries (NCREIF) reports that net operating income for apartments rose 8.7 percent from the fourth quarter of 2009 to the fourth quarter of 2010. And Moody’s/REAL commercial property price index indicates that, although still 27.6 percent below their 2007 peak, apartment prices jumped 19.7 percent from the trough in the third quarter of 2009 to the fourth quar-ter of 2010. With this turnaround, multifamily delinquencies and foreclosures may recede and owners may find it easier to refinance or extend their loans. Although the multifam-ily mortgage market is still weighed down by thousands of distressed loans, burgeoning demand for rentals should bring better credit conditions for developers.
EROSION OF THE AFFORDABLE SUPPLYNew construction helps to keep the rental supply at sus-tainable levels not only by meeting the needs of additional households, but also by replacing losses from the aging stock. However, newly constructed units are usually more expensive than existing ones, which drives up the average overall cost of rental housing. In 2009, construction and land costs for units in new multifamily structures averaged about $110,000, and the median asking rent was $1,067. To be affordable to the median renter in 2009 (at the 30-percent-of-income standard), however, the rent would have to be much lower at $775 or less.
At the same time, many lowest-cost rentals are being permanently lost from the stock, largely because the rents they earn cannot cover the costs of adequate maintenance. In fact, the American Housing Survey indicates that despite the net addition of 2.6 mil-lion rentals, the number of units with rents of $400 or less in 2009 inflation-adjusted dollars fell from 6.2 million in 1999 to 5.6 million in 2009. Many of the losses were due to demolition and other forms of permanent removal. By 2009, nearly 12 percent of the low-cost rentals that existed in 1999 had been lost—twice the share for units renting for $400–799, and four times the share of units rent-ing for $800 or more (Figure 25). Many of the low-cost rental units that remain are in older, more at-risk buildings.
The growing number of low-income renters adds to the pres-sure on the affordable stock. Between 2003 and 2009, the number of renters with very low incomes (below 50 percent of area medians) jumped from 16.3 million to 18.0 million. Meanwhile, the number of housing units that were afford-
Notes: Holdings are in the form of either multifamily mortgages or securities on loans in mortgage pools. CMBS includes all holdings in privately issued asset-backed securities. All other holders include nonfinancial corporate businesses, nonfarm noncorporate business, private pension funds, insurance companies, finance companies, state and local governments, and REITs. Dollar values are adjusted for inflation by the CPI-U for All Items.Source: JCHS tabulations of Federal Reserve, Flow of Funds.
● Fannie, Freddie, and FHA ● Depositories ● CMBS ● All Other
250
200
150
100
50
0
-501998–2002 2002–2006 Total 1998–20102006–2010
Fannie Mae, Freddie Mac, and FHA Have Fueled a Large Share of Multifamily Lending Growth Since the 1990s Change in Multifamily Mortgage Debt Holdings (Billions of 2010 dollars)
FIGURE 24

THE STATE OF THE NATION’S HOUSING 201126
able to households at that income level, in adequate condi-tion, and not occupied by higher-income renters fell from 12.0 million to 11.6 million. The affordable housing shortage for this group thus widened sharply from 4.3 million to 6.4 million units.
The shortage of affordable rentals was even more acute for extremely low-income renters (earning less than 30 percent of area medians). In 2003, there was one affordable, available, and adequate unit for every 2.5 extremely low-income renters. By 2009, one unit existed for every 2.9 such renters. As the rental market continues to tighten and the competition for low-cost housing intensifies, the gap between the demand for and supply of affordable rentals will only increase.
THE OUTLOOK As the economic recovery takes hold, rental demand is likely to remain strong thanks to the aging of the echo-boom gen-eration into young adulthood—the years when they are most likely to form independent households. The recession has apparently led many young adults to delay living on their own, given that the percentage of households with additional adults (persons age 18 and older other than the household head and spouse) was up 0.9 percentage point in 2008–9. This translates to 1.1 million households, which may even underestimate the extent of doubling up because surveys may miss transient residents. As job growth picks up, more of those under age 30 should head out on their own and add to rental demand.
Although the baby boomers will not contribute much to overall rental demand, they will change the age composition of the renter population. With substantial growth in the number of elderly renters, demand for housing that meets their needs—including subsidized rentals—will increase accordingly.
Future immigration trends will also affect growth in rental households. Immigrants tend to be young adults, and foreign-born households of all ages are more likely than native-born households to rent. After slowing during the 2000s for the first time in more than 30 years, immigration will likely rebound once the economy picks up steam. Stricter government controls may, however, keep future inflows below pre-recession levels.
Attitudes about homeownership are another unknown. The ongoing weakness in house prices appears to be making rent-ers wary about buying. In addition, a multitude of other fac-tors—including impaired credit from the foreclosure crisis and deep recession, stricter mortgage underwriting standards, and continued uncertainty about the direction of the economy—make renting a more common choice. Nevertheless, with home price declines and low interest rates pushing affordabil-ity indexes to record levels, homebuying activity could siphon off some rental demand.
Note: All dollar values are 2009 dollars, adjusted for inflation by the CPI-U for All Items.Source: JCHS tabulations of US Census Bureau, 1999 and 2009 American Housing Surveys.
Real Rent Level
12
10
8
6
4
2
0$400–599 $800 and OverUnder $400 $600–799
Low-Cost Rentals Are at Especially High Risk of Permanent Loss Share of 1999 Rental Units Permanently Removed from the Stock by 2009 (Percent)
FIGURE 25

27JOINT CENTER FOR HOUSING STUDIES OF HARVARD UNIVERSITY
CONTINUING AFFORDABILITY PRESSURESEven though nominal rents flattened temporarily and house prices tumbled as the housing boom ended, the share of households struggling to afford housing rose over the past decade. At last mea-sure in 2009, well over one-third of US households paid more than 30 percent of their incomes for housing, which is a traditional stan-dard of affordability. At the same time, 17.1 percent of American households—an unprecedented 19.4 million—spent more than half their incomes on housing. In 2009 alone, the number of these severely cost-burdened households climbed by 725,000, a larger-than-average jump in a decade marked by sizable increases.
Some 9.3 million owners and 10.1 million renters face severe housing cost burdens (Table A-4). With their generally lower incomes, renters are more than twice as likely as owners to pay more than half their incomes for housing, but shares of both groups rose substantially between 2001 and 2009. The share of severely burdened owners climbed from 9.3 percent to 12.4 percent over the decade, while the share of severely burdened renters increased from 20.7 percent to 26.1 percent.
Today’s affordability problems reflect the long-term rise in housing costs and the ongoing weakness in income growth in the bottom half of the distribution. This trend grew more pro-nounced in 2000–9 when real median income for households in the bottom income quartile fell 7.1 percent while real rents increased 8.9 percent. As a result, the gap between the supply of and demand for affordable homes widened. In 1999, 8.5 mil-lion extremely low-income renter households (with income less than 30 percent of area medians) competed for 3.6 million units that were affordable at that income cutoff and that were not occupied by higher-income renters. By 2009, the mismatch had grown to 10.4 million extremely low-income renter households and just 3.7 million affordable and available units (Figure 26).
While lowest-income households are most likely to have severe housing cost burdens, the problem has moved up the income scale. Among households with real incomes under $15,000, 66.4 percent were severely burdened in 2009—an increase of 4.8 per-centage points from 2001. But shares among households with incomes in the $15,000–30,000 range were also up 6.6 percent-age points over the decade, to 27.7 percent. Households with
The recession exacerbated
longstanding affordability
challenges. High unemployment
has driven up the share of
households with severe cost
burdens, while the ongoing
foreclosure crisis has displaced
families and blighted whole
communities. Meanwhile,
federal housing assistance
programs face cuts as the
nation struggles to address
long-term fiscal imbalances.
With energy costs rising, the
pressures are increasing to
pursue more energy-efficient
housing construction and
more sustainable patterns
of development.
6 Housing Challenges

THE STATE OF THE NATION’S HOUSING 201128
incomes of $30,000–45,000 saw a 4.2 percentage point increase, bringing the severely cost-burdened share to 11.5 percent. Moreover, the share of households with incomes of $45,000–60,000 (roughly three to four times the full-time minimum wage equivalent) nearly doubled to 6.4 percent.
Households with multiple earners are less likely to be cost bur-dened and more able to weather spells of unemployment than households with just a single worker (Figure 27). In 2008–9, how-ever, the recession not only reduced the number of working-age households with two or more earners by nearly 2.0 million, but also lifted the number of households with one or no employed workers by the same amount.
HOUSING BURDENS OF FAMILIES WITH CHILDRENHousehold characteristics also affect the likelihood of having severe housing cost burdens. Low-income families with children have an especially difficult time finding affordable units, with nearly two-thirds paying more than half their incomes for hous-ing in 2009 (Table A-5). The number of children living in such households stood at 9.2 million that year, up 12.2 percent from before the financial crisis in 2007 and fully 35.1 percent from 2001. With so many families struggling to make ends meet, it is no surprise that the number of families using homeless shelters is also on the rise. Although the incidence of chronic homeless-ness fell, the number of families with children that used home-
less shelters at least once increased by about 30 percent from 2007 to 2009, to more than 170,000.
Families with severe housing cost burdens have little to spend on other necessities. After devoting more than half their month-ly outlays to rent, families with children in the bottom expen-diture quartile on average had only $593 left to cover all other expenses. Compared with similar families living in affordable housing, these households spent $160 less on food each month, $28 less on healthcare, $152 less on transportation, and $51 less on retirement savings. In 2010, their total monthly expenditures included just $290 for food, $15 for healthcare, $71 for transpor-tation, and $59 for retirement savings.
HELPING HOUSEHOLDS AT RISKFederal housing assistance programs provide critical support to millions of America’s poorest and most vulnerable households. At roughly $7,000 per year, the average HUD rent subsidy is a significant benefit for some 5 million households. Other federal assistance programs help up to 2 million more struggling house-holds. The Center for Budget and Policy Priorities estimates that counting housing assistance as income would have lifted 1.5 million persons above the poverty level in 2009.
But rent subsidies are not an entitlement and they reach only about one in four of the households that are eligible. And as the
Notes: Extremely low-income households have incomes at or below 30 percent of HUD-adjusted area median family incomes. Affordable rental units have housing costs no more than 30 percent of monthly household income at the extremely low-income threshold.Sources: US Department of Housing and Urban Development, Worst Case Housing Needs 2009; JCHS tabulations of US Census Bureau, 2003 and 2009 American Housing Surveys, using JCHS-adjusted weights.
12
10
8
6
4
2
0
2003
● Vacant or Occupied by Extremely Low-Income Households ● Occupied by Higher Income Renters
1999
Extremely Low-Income
Renter Households
Affordable Rental Units
Extremely Low-Income
Renter Households
Affordable Rental Units
2009
Extremely Low-Income
Renter Households
Affordable Rental Units
AVAILABILITY GAP
AVAILABILITY GAP
SUPPLY GAPSUPPLY GAP
AVAILABILITY GAP
SUPPLY GAP
The Gap Between the Number of Extremely Low-Income Renters And the Supply of Available Units They Can Afford Continues to Widen
FIGURE 26
Millions

29JOINT CENTER FOR HOUSING STUDIES OF HARVARD UNIVERSITY
number of low-income renters has grown over the past decade, federal support for assisted housing has failed to keep pace. Indeed, the number of assisted renters increased by 228,000 a year on average during the 1970s, but additions slowed to 121,000 annually in the 1990s and then to just 74,000 per year in the 2000s.
Prospects for expanding rental assistance programs are dim. With rents on the rise, the costs of serving the 2.1 million households that hold housing vouchers (which make up the difference between 30 percent of incomes and fair mar-ket rents) are climbing. At the same time, the Low Income Housing Tax Credit program, the nation’s principal program for building new and preserving existing affordable rentals, added fewer units after the financial crisis because of weak-ened demand for the credits. Public housing units are also being lost both to disrepair and to redevelopment with less than one-for-one replacement rates. Making matters worse, the stock of privately owned subsidized units is shrinking. Between owners opting out of the program and losses due to physical deterioration, the public and private HUD-assisted stock has dwindled by more than 700,000 units since the mid-1990s.
In an effort to do more with less, the Obama Administration has proposed restructuring the funding mechanism for pub-lic housing to allow local housing agencies to leverage their equity and tap private debt markets. It has also proposed a new Choice Neighborhoods program intended to spark rede-velopment of public housing as well as the distressed areas surrounding the properties.
THE CONTINUING FORECLOSURE CRISISThe number of homeowners that have already lost their homes to foreclosures or short sales is staggering. At least 7.8 million foreclosure proceedings have been started since the crisis took hold in 2007. Of these, First American CoreLogic estimates that 3.5 million foreclosures were completed between 2008 and 2010 alone. With more than 2.2 million loans currently in the pro-cess, foreclosures are likely to remain near record levels in 2011.
Foreclosures have been concentrated in relatively few areas. Indeed, nearly half of foreclosure auctions in 2010 were located in just 10 percent of the nation’s 65,000 census tracts. Not sur-prisingly, the majority of highly distressed neighborhoods, where at least one in ten loans were foreclosed, are in the states at the epicenter of the crisis, including California, Florida, Arizona, Michigan, Georgia, and Nevada. However, the other 40 percent are located in states that have received less attention. For exam-ple, Texas, Ohio, and Indiana together contained nearly 600 high-ly distressed neighborhoods last year. Much of the damage has been in low-income and minority neighborhoods (Figure 28). Even after controlling for income, foreclosure rates in minority tracts are significantly higher than in white tracts.
Reflecting patterns of racial/ethnic and income segregation, center-city neighborhoods have also suffered high foreclosure rates (Table A-6). Yet in the states with the most foreclosures, rates in suburban areas rival those in center cities, and rates in predominantly white neighborhoods differ little by income.
The flood of foreclosures has overwhelmed both the market’s ability to absorb the homes and lenders’ ability to manage the
Notes: Estimates include only households with heads aged 25–64. Cost-burdened households spend more than 30 percent of pre-tax income on housing. Source: JCHS tabulations of US Census Bureau, 2008 and 2009 American Community Surveys.
70
60
50
40
30
20
10
0Zero Two or MoreOne
Number Employed in Household
2.0
1.5
1.0
0.5
0.0
-0.5
-1.0
-1.5
-2.0Zero Two or MoreOne
Number Employed in Household
Households with Multiple Earners Are Less Likely to Be Cost Burdened... Share of Cost-Burdened Households, 2009 (Percent)
FIGURE 27
…But High Unemployment Has Reduced the Number of Such Households Change in Number of Households, 2008-9 (Millions)

THE STATE OF THE NATION’S HOUSING 201130
properties. The number of abandoned homes has thus soared across the country. In 2009, 7.2 million households reported at least one abandoned or vandalized home within 300 feet of their residences—an increase of 1.5 million households from 2007 and 2.0 million from 2005. Nearly half (45.0 percent) of housing units with abandoned properties nearby are in center cities, 30.4 percent are in suburbs, and 24.0 percent are in non-metropolitan areas.
Many communities will suffer the ill effects of the foreclo-sure crisis for years to come. The Neighborhood Stabilization Program (NSP) was intended to provide resources to local governments to acquire foreclosed properties to mitigate the blight caused by widespread abandonment and dis-investment. But with only $7 billion in funding, the scale of the program pales in comparison with the challenges. First American CoreLogic data show that the foreclosure rate in roughly 2,500 neighborhoods exceeded 10 percent in 2010, totaling 176,000 homes. Given the program’s focus on acquiring and rehabilitating foreclosed properties, its level of funding cannot support many transactions even in the worst-affected neighborhoods.
HOUSING, ENERGY, AND SUSTAINABILITYResidential energy use generates about 18 percent of human-made greenhouse gas emissions in the United States, and automotive travel contributes another 18 percent. Making both housing units and residential development patterns more
energy efficient could therefore produce substantial reduc-tions of pollution, in addition to huge savings of time, energy, and money for householders into the future.
New housing already has a much lower carbon footprint than older units, and technological advances in building materials, insulation, heating and cooling systems, and local electric-ity generation should reduce the footprint even further. The federal government estimates that energy-efficient retrofits to existing homes could lower energy use by up to 40 percent per unit, cutting annual greenhouse gas emissions by as much as 160 million metric tons by 2020. And even if pre-2000 homes are just brought up to the same efficiency level per square foot as post-2000 homes in their regions, overall residential energy consumption would fall by 22.5 percent.
Improved energy efficiency would also help blunt the impact of rising energy costs on housing affordability. Among low-income households in particular, utilities account for a significant share of overall housing outlays. Indeed, utility costs for renter house-holds in the bottom income quintile (earning up to $19,300) amount to more than a quarter of total housing costs and nearly a fifth of household income (Figure 29).
Even though energy prices are headed up, homeowners and landlords alike have been slow to implement efficiency mea-sures because of high upfront costs and long, uncertain pay-backs. The fact that the social costs of greenhouse gas emis-
● Low Income ● Middle Income ● High Income
Notes: Foreclosure rates are completed 2010 foreclosure auctions as a share of December 2009 first-lien mortgages, using a measure of mortgages that covers approximately 85% of all loans, and are averages of tract rates for each neighborhood type. High-foreclosure states are the six states—Nevada, Arizona, Michigan, Georgia, Florida, and California—with the highest cumulative foreclosures in 2008–10 as a share of December 2008 mortgages. White/mixed/minority neighborhoods are census tracts with less than 10%/10–50%/more than 50% minority population share. Low-/middle-/high-income neighborhoods are census tracts with median household incomes less than 80%/80–120%/more than 120% of metro area or balance of state median income. Zip code loan and foreclosure data are allocated to census tracts using housing-unit weights.Sources: JCHS tabulations of First American CoreLogic, Market Trends and LoanPerformance Servicing data; US Census Bureau, 2005–9 American Community Survey; US Department of Housing and Urban Development, USPS Zip Code Crosswalk Files; and Missouri Census Data Center, MABLE/Geocorr2K Geographic Correspondence Engine.
8
7
6
5
4
3
2
1
0
Neighborhood Type
HIGH-FORECLOSURE STATES ALL OTHER STATES
Minority Mixed White Minority Mixed White
Low-Income and Minority Communities Have Suffered the Highest Foreclosure RatesForeclosure Rate, 2010 (Percent)
FIGURE 28

31JOINT CENTER FOR HOUSING STUDIES OF HARVARD UNIVERSITY
sions are much higher than the individual costs suggests that federal policy changes may be necessary to stimulate energy-efficient investments. Tax credits have in fact proven quite effective in this respect. At last measure in 2007, some 4.3 mil-lion households took advantage of the federal residential energy efficiency tax credit. The American Reinvestment and Recovery Act expanded and extended the program in 2009 and 2010, but the Obama Administration then reduced the credits back to their original size for 2011.
Changes in residential development patterns could also cut energy consumption sharply. A National Research Council (NRC) study found that doubling the density of three-quarters of new and replacement housing starting in 2000 would gradually reduce greenhouse gas emissions by as much as 11 percent by 2050 compared with current trends. The Urban
Land Institute projected savings of up to 16 percent over the same period.
Achieving aggressive improvements in residential density depends on a balance of forces. On the one hand, rising energy prices and public policy changes such as carbon taxes and stronger state or regional growth management could shift more construction to infill development. On the other hand, land use policies of jurisdictions at the urban fringe, where most residen-tial construction occurs, continue to favor single-family homes on large lots. Consumer preferences for low-density living appear to be another important factor. But preferences are not immutable and could well evolve in response to higher energy prices and to changes in the range of housing options available. Proposed elimination of the mortgage interest deduction and of government guarantees in the mortgage market may also reduce the financial incentives to buy larger homes in lower-density areas.
THE OUTLOOKWith job growth picking up fairly steadily since the summer of 2010, the economic recovery may finally be taking hold. Putting people back to work is a key step in restoring house-hold incomes and slowing the spread of housing cost burdens. Nevertheless, income gains have lagged housing costs for decades for an increasing share of renter households, and affordability pressures are making their way up the income scale. Rising demand is already pushing rents higher while stubbornly high unemployment is keeping the lid on wage increases. If these trends continue, affordability problems will worsen as the economy recovers.
Despite the growing need for rental assistance, the current bud-getary climate makes increased federal support unlikely. In fact, the opening rounds of the debate over the federal deficit make it clear that domestic programs will undergo significant cuts.
While still under the shadow of the foreclosure crisis, the housing market may be starting—however slowly—to turn the corner. The number and share of loans more than 90 days delinquent but not in foreclosure are finally falling. The impact of the crisis will nonetheless linger as millions of loans work their way through the protracted foreclosure process. This will not only blunt the housing recovery, but also reinforce the downward spiral of communities where foreclosures are concentrated.
Notes: Income quintiles are equal fifths of all households sorted by pre-tax income. Total housing costs include contract rent and tenant-paid utilities. Shares shown are the median ratios for each quintile. Analysis includes only households that pay for utilities separately from rent.Sources: JCHS tabulations of US Census Bureau, 2009 American Housing Survey.
Utility Costs as a Share of:
● Total Housing Costs ● Household Income
Household Income Quintile
30
25
20
15
10
5
0Lower Middle
TopBottom Upper Middle
Middle
Utilities Account for a Disproportionately Large Share of Income and Housing Costs for Low-Income RentersPercent
FIGURE 29

THE STATE OF THE NATION’S HOUSING 201132
Table A-1 .........Terms on Conventional Single-Family Home Purchase Mortgage Originations: 1980–2010
Table A-2 .........Housing Market Indicators: 1980–2010
Table A-3 ......... Homeownership Rates by Age, Race/Ethnicity, and Region: 1995–2010
Table A-4 .........Housing Cost-Burdened Households by Tenure and Income: 2001 and 2009
Table A-5 .........Severely Cost-Burdened Households by Household Characteristics: 2009
Table A-6 ......... Location and Characteristics of High-Foreclosure Census Tracts: 2010
Table A-7 .........Mover Households by Tenure Change and Age: 2003–9
Table A-8 .........Metro Area House Price Declines by Price Tier: Peak to December 2010
The following tables can be downloaded in Microsoft Excel format from the Joint Center’s website at www.jchs.harvard.edu.
Table W-1 ........Potential Homebuyer Households, Home Prices, and Mortgage Terms: 2005–10
Table W-2 ........Median Wealth and Debt by Household Income Quartile and Minority Status: 2007
Table W-3 ........Changes in Housing Market Conditions by State: 2009–10
Table W-4 ........Real Median Household Income by Generation Cohort, 1980–2010
Table W-5 ........Metro Area Price-to-Income Ratios: 1995–2010
Table W-6 ........Metro Area Payment-to-Income Ratios: 1995–2010
Table W-7 ........Major Metro Area Home Prices: 1995–2010
Table W-8 ........Foreclosure Rates by Region and Metro Status: 2010
Table W-9 ........ Income and Housing Costs, US Totals: 1980–2010
Terms on Conventional Single-Family Home Purchase Mortgage Originations: 1980–2010Annual Averages
TABLE A-1
7 Appendix Tables

33JOINT CENTER FOR HOUSING STUDIES OF HARVARD UNIVERSITY
Terms on Conventional Single-Family Home Purchase Mortgage Originations: 1980–2010Annual Averages
TABLE A-1
Year
Effective Interest Rate
(Percent)
Term to Maturity(Years)
Mortgage Loan Amount(Thousands of 2010 dollars)
Purchase Price(Thousands of 2010 dollars)
Loan-to-Price Ratio
(Percent)
Percent of Loans with:
Loan-to-Price Ratio Above 90%
AdjustableRates
1980 12.8 27.2 136.8 194.2 72.9 10 na
1981 14.9 26.4 128.8 183.0 73.1 15 na
1982 15.3 25.6 124.3 177.2 72.9 21 41
1983 12.7 26.0 131.1 181.9 74.5 21 40
1984 12.5 26.8 135.4 181.7 77.0 27 62
1985 11.6 25.9 142.3 194.8 75.8 21 51
1986 10.2 25.6 157.8 220.0 74.1 11 30
1987 9.3 26.8 171.0 233.8 75.2 8 43
1988 9.3 27.7 179.5 242.6 76.0 8 58
1989 10.1 27.7 183.8 251.1 74.8 7 38
1990 10.1 27.0 173.5 237.9 74.7 8 28
1991 9.3 26.5 170.2 234.9 74.4 9 23
1992 8.1 25.4 168.9 227.5 76.6 14 20
1993 7.1 25.5 161.5 215.9 77.2 17 20
1994 7.5 27.1 161.7 208.9 79.9 25 39
1995 7.9 27.4 158.0 204.3 79.9 27 32
1996 7.7 26.9 165.0 215.6 79.0 25 27
1997 7.7 27.5 172.0 223.5 79.4 25 22
1998 7.1 27.8 176.3 232.0 78.9 25 12
1999 7.3 28.2 182.3 241.1 78.5 23 21
2000 8.0 28.7 187.8 251.9 77.8 22 24
2001 7.0 27.6 191.7 265.3 76.2 21 12
2002 6.5 27.3 198.1 280.2 75.1 21 17
2003 5.7 26.8 199.0 288.5 73.5 20 18
2004 5.7 27.9 214.1 302.4 74.9 18 35
2005 5.9 28.5 236.6 334.7 74.7 15 30
2006 6.6 29.0 241.1 332.2 76.6 19 22
2007 6.5 29.3 236.3 316.0 79.4 29 11
2008 6.1 28.4 222.6 310.0 76.9 20 7
2009 5.1 28.2 221.4 312.3 74.5 8 na
2010 4.9 27.7 215.8 304.9 74.0 9 5
Notes: The effective interest rate includes the amortization of initial fees and charges. Loans with adjustable rates do not include hybrid products. na indicates data not available. Dollar amounts are adjusted by the CPI-U for All Items.
Source: Federal Housing Finance Agency, Monthly Interest Rate Survey.

THE STATE OF THE NATION’S HOUSING 201134
Housing Market Indicators: 1980–2010
TABLE A-2
Notes: All value series are adjusted to 2010 dollars by the CPI-U for All Items. All links are as of April 2011. na indicates data not available.
Sources: 1. US Census Bureau, New Privately Owned Housing Units Authorized by Building Permits, www.census.gov/pub/const/bpann.pdf.
2. US Census Bureau, New Privately Owned Housing Units Started, www.census.gov/const/startsan.pdf; Placements of New Manufactured Homes, www.census.gov/pub/const/mhs/mhstabplcmnt.pdf. Manufactured housing starts are defined as placements of new manufactured homes.
3. US Census Bureau, Quarterly Starts and Completions by Purpose and Design, www.census.gov/const/www/newresconstindex.html.
4. New home price is the 2010 median price from US Census Bureau, Median and Average Sales Price of New One-Family Houses Sold, www.census.gov/const/uspriceann.pdf, indexed by the US Census Bureau, Price Indexes of New One-Family Houses Sold, www.census.gov/const/price_sold.pdf.
5. Existing home price is the 2010 median sales price of existing single-family homes determined by the National Association of Realtors®, www.realtor.org/research/research/ehsdata, indexed by annual averages of the quarterly Freddie Mac Purchase-Only Conventional Mortgage Home Price Index, www.freddiemac.com/finance/cmhpi.
6. US Census Bureau, Housing Vacancy Survey, www.census.gov/hhes/www/housing/hvs/annual09/ann09ind.html. Rates for 1976–9 are annual averages of quarterly rates.
7. US Census Bureau, Annual Value of Private Construction Put in Place, www.census.gov/const/www/privpage.html. Single-family and multifamily are new construction.
8. US Census Bureau, Houses Sold by Region, www.census.gov/const/soldann.pdf.
9. National Association of Realtors®, Existing Single-Family Home Sales, www.realtor.org/research/research/ehsdata.
Year
Permits 1 (Thousands)
Starts 2 (Thousands)
Size 3 (Median sq. ft.)
Sales Price of Single-Family Homes
(2010 dollars)Vacancy Rates 6
(Percent)Value Put in Place 7
(Millions of 2010 dollars)Home Sales (Thousands)
Single-Family Multifamily Single-Family Multifamily Manufactured Single-Family Multifamily New 4 Existing 5 For Sale For Rent Single-Family Multifamily Owner Improvements New 8 Existing 9
1980 710 480 852 440 234 1,595 915 240,403 128,870 1.4 5.4 140,045 44,215 na 545 2,9731981 564 421 705 379 229 1,550 930 235,173 119,750 1.4 5.0 124,657 41,884 na 436 2,4191982 546 454 663 400 234 1,520 925 226,696 114,142 1.5 5.3 93,690 35,110 na 412 1,9901983 902 704 1,068 636 278 1,565 893 224,292 118,492 1.5 5.7 158,756 49,144 na 623 2,6971984 922 759 1,084 665 288 1,605 871 223,682 117,060 1.7 5.9 181,318 59,228 na 639 2,8291985 957 777 1,072 670 283 1,605 882 218,782 118,303 1.7 6.5 177,019 57,836 na 688 3,1341986 1,078 692 1,179 626 256 1,660 876 222,965 124,926 1.6 7.3 207,175 61,752 na 750 3,4741987 1,024 510 1,146 474 239 1,755 920 226,856 129,766 1.7 7.7 224,997 48,855 na 671 3,4361988 994 462 1,081 407 224 1,810 940 226,020 131,797 1.6 7.7 221,361 41,101 na 676 3,5131989 932 407 1,003 373 203 1,850 940 224,211 133,107 1.8 7.4 212,656 39,222 na 650 3,0101990 794 317 895 298 195 1,905 955 216,807 130,009 1.7 7.2 188,336 32,116 na 534 2,9141991 754 195 840 174 174 1,890 980 210,743 126,734 1.7 7.4 159,182 24,252 na 509 2,8861992 911 184 1,030 170 212 1,920 985 207,415 126,026 1.5 7.4 189,577 20,351 na 610 3,1511993 987 213 1,126 162 243 1,945 1,005 209,138 125,539 1.4 7.3 211,451 16,280 86,421 666 3,4271994 1,069 303 1,198 259 291 1,940 1,015 216,043 126,852 1.5 7.4 238,815 20,718 95,113 670 3,5441995 997 335 1,076 278 319 1,920 1,040 214,799 126,982 1.5 7.6 219,651 25,596 81,151 667 3,5191996 1,070 356 1,161 316 338 1,950 1,030 214,089 127,990 1.6 7.8 237,360 28,246 92,255 757 3,7971997 1,062 379 1,134 340 336 1,975 1,050 214,141 129,505 1.6 7.7 237,999 31,089 90,529 804 3,9641998 1,188 425 1,271 346 374 2,000 1,020 216,072 134,189 1.7 7.9 266,763 32,874 96,801 886 4,4951999 1,247 417 1,302 339 338 2,028 1,041 222,465 139,629 1.7 8.1 292,971 35,907 98,205 880 4,6492000 1,198 394 1,231 338 281 2,057 1,039 223,627 144,817 1.6 8.0 299,843 35,784 102,685 877 4,6032001 1,236 401 1,273 329 196 2,103 1,104 223,908 151,116 1.8 8.4 306,689 37,313 104,685 908 4,7352002 1,333 415 1,359 346 174 2,114 1,070 230,441 160,199 1.7 8.9 322,283 39,941 118,610 973 4,9742003 1,461 428 1,499 349 140 2,137 1,092 237,867 169,575 1.8 9.8 368,058 41,616 118,916 1,086 5,4462004 1,613 457 1,611 345 124 2,140 1,105 250,105 180,900 1.7 10.2 435,831 46,109 133,210 1,203 5,9582005 1,682 473 1,716 353 123 2,227 1,143 260,678 193,233 1.9 9.8 484,022 52,808 146,367 1,283 6,1802006 1,378 461 1,465 336 112 2,259 1,192 264,527 199,479 2.4 9.7 449,954 57,113 156,761 1,051 5,6772007 980 419 1,046 309 95 2,230 1,134 257,668 196,706 2.7 9.7 320,954 51,489 146,291 776 4,9392008 576 330 622 284 81 2,141 1,089 235,277 176,333 2.8 10.0 188,151 44,905 121,679 485 4,3502009 441 142 445 109 52 2,103 1,124 225,675 168,157 2.6 10.6 107,064 28,709 113,877 375 4,5662010 447 151 471 116 50 2,152 1,141 221,800 173,100 2.6 10.2 112,726 14,023 114,943 323 4,309

35JOINT CENTER FOR HOUSING STUDIES OF HARVARD UNIVERSITY
Housing Market Indicators: 1980–2010
TABLE A-2
Year
Permits 1 (Thousands)
Starts 2 (Thousands)
Size 3 (Median sq. ft.)
Sales Price of Single-Family Homes
(2010 dollars)Vacancy Rates 6
(Percent)Value Put in Place 7
(Millions of 2010 dollars)Home Sales (Thousands)
Single-Family Multifamily Single-Family Multifamily Manufactured Single-Family Multifamily New 4 Existing 5 For Sale For Rent Single-Family Multifamily Owner Improvements New 8 Existing 9
1980 710 480 852 440 234 1,595 915 240,403 128,870 1.4 5.4 140,045 44,215 na 545 2,9731981 564 421 705 379 229 1,550 930 235,173 119,750 1.4 5.0 124,657 41,884 na 436 2,4191982 546 454 663 400 234 1,520 925 226,696 114,142 1.5 5.3 93,690 35,110 na 412 1,9901983 902 704 1,068 636 278 1,565 893 224,292 118,492 1.5 5.7 158,756 49,144 na 623 2,6971984 922 759 1,084 665 288 1,605 871 223,682 117,060 1.7 5.9 181,318 59,228 na 639 2,8291985 957 777 1,072 670 283 1,605 882 218,782 118,303 1.7 6.5 177,019 57,836 na 688 3,1341986 1,078 692 1,179 626 256 1,660 876 222,965 124,926 1.6 7.3 207,175 61,752 na 750 3,4741987 1,024 510 1,146 474 239 1,755 920 226,856 129,766 1.7 7.7 224,997 48,855 na 671 3,4361988 994 462 1,081 407 224 1,810 940 226,020 131,797 1.6 7.7 221,361 41,101 na 676 3,5131989 932 407 1,003 373 203 1,850 940 224,211 133,107 1.8 7.4 212,656 39,222 na 650 3,0101990 794 317 895 298 195 1,905 955 216,807 130,009 1.7 7.2 188,336 32,116 na 534 2,9141991 754 195 840 174 174 1,890 980 210,743 126,734 1.7 7.4 159,182 24,252 na 509 2,8861992 911 184 1,030 170 212 1,920 985 207,415 126,026 1.5 7.4 189,577 20,351 na 610 3,1511993 987 213 1,126 162 243 1,945 1,005 209,138 125,539 1.4 7.3 211,451 16,280 86,421 666 3,4271994 1,069 303 1,198 259 291 1,940 1,015 216,043 126,852 1.5 7.4 238,815 20,718 95,113 670 3,5441995 997 335 1,076 278 319 1,920 1,040 214,799 126,982 1.5 7.6 219,651 25,596 81,151 667 3,5191996 1,070 356 1,161 316 338 1,950 1,030 214,089 127,990 1.6 7.8 237,360 28,246 92,255 757 3,7971997 1,062 379 1,134 340 336 1,975 1,050 214,141 129,505 1.6 7.7 237,999 31,089 90,529 804 3,9641998 1,188 425 1,271 346 374 2,000 1,020 216,072 134,189 1.7 7.9 266,763 32,874 96,801 886 4,4951999 1,247 417 1,302 339 338 2,028 1,041 222,465 139,629 1.7 8.1 292,971 35,907 98,205 880 4,6492000 1,198 394 1,231 338 281 2,057 1,039 223,627 144,817 1.6 8.0 299,843 35,784 102,685 877 4,6032001 1,236 401 1,273 329 196 2,103 1,104 223,908 151,116 1.8 8.4 306,689 37,313 104,685 908 4,7352002 1,333 415 1,359 346 174 2,114 1,070 230,441 160,199 1.7 8.9 322,283 39,941 118,610 973 4,9742003 1,461 428 1,499 349 140 2,137 1,092 237,867 169,575 1.8 9.8 368,058 41,616 118,916 1,086 5,4462004 1,613 457 1,611 345 124 2,140 1,105 250,105 180,900 1.7 10.2 435,831 46,109 133,210 1,203 5,9582005 1,682 473 1,716 353 123 2,227 1,143 260,678 193,233 1.9 9.8 484,022 52,808 146,367 1,283 6,1802006 1,378 461 1,465 336 112 2,259 1,192 264,527 199,479 2.4 9.7 449,954 57,113 156,761 1,051 5,6772007 980 419 1,046 309 95 2,230 1,134 257,668 196,706 2.7 9.7 320,954 51,489 146,291 776 4,9392008 576 330 622 284 81 2,141 1,089 235,277 176,333 2.8 10.0 188,151 44,905 121,679 485 4,3502009 441 142 445 109 52 2,103 1,124 225,675 168,157 2.6 10.6 107,064 28,709 113,877 375 4,5662010 447 151 471 116 50 2,152 1,141 221,800 173,100 2.6 10.2 112,726 14,023 114,943 323 4,309
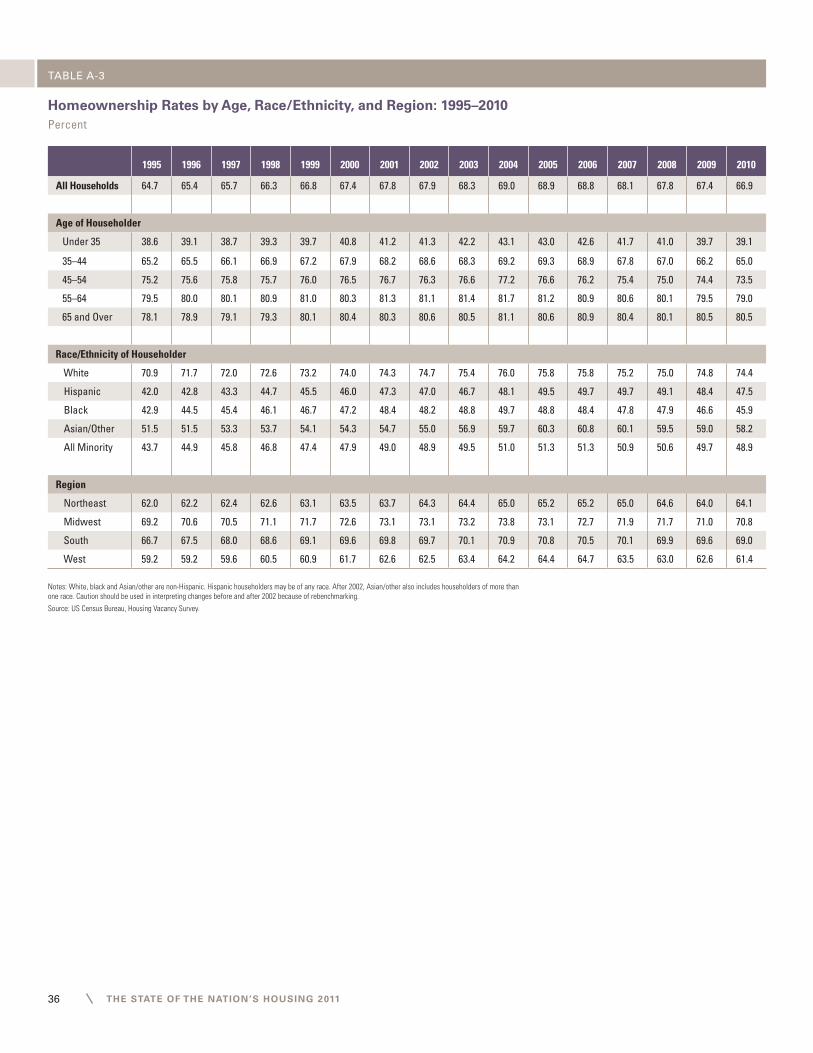
THE STATE OF THE NATION’S HOUSING 201136
Homeownership Rates by Age, Race/Ethnicity, and Region: 1995–2010Percent
TABLE A-3
1995 1996 1997 1998 1999 2000 2001 2002 2003 2004 2005 2006 2007 2008 2009 2010
All Households 64.7 65.4 65.7 66.3 66.8 67.4 67.8 67.9 68.3 69.0 68.9 68.8 68.1 67.8 67.4 66.9
Age of Householder
Under 35 38.6 39.1 38.7 39.3 39.7 40.8 41.2 41.3 42.2 43.1 43.0 42.6 41.7 41.0 39.7 39.1
35–44 65.2 65.5 66.1 66.9 67.2 67.9 68.2 68.6 68.3 69.2 69.3 68.9 67.8 67.0 66.2 65.0
45–54 75.2 75.6 75.8 75.7 76.0 76.5 76.7 76.3 76.6 77.2 76.6 76.2 75.4 75.0 74.4 73.5
55–64 79.5 80.0 80.1 80.9 81.0 80.3 81.3 81.1 81.4 81.7 81.2 80.9 80.6 80.1 79.5 79.0
65 and Over 78.1 78.9 79.1 79.3 80.1 80.4 80.3 80.6 80.5 81.1 80.6 80.9 80.4 80.1 80.5 80.5
Race/Ethnicity of Householder
White 70.9 71.7 72.0 72.6 73.2 74.0 74.3 74.7 75.4 76.0 75.8 75.8 75.2 75.0 74.8 74.4
Hispanic 42.0 42.8 43.3 44.7 45.5 46.0 47.3 47.0 46.7 48.1 49.5 49.7 49.7 49.1 48.4 47.5
Black 42.9 44.5 45.4 46.1 46.7 47.2 48.4 48.2 48.8 49.7 48.8 48.4 47.8 47.9 46.6 45.9
Asian/Other 51.5 51.5 53.3 53.7 54.1 54.3 54.7 55.0 56.9 59.7 60.3 60.8 60.1 59.5 59.0 58.2
All Minority 43.7 44.9 45.8 46.8 47.4 47.9 49.0 48.9 49.5 51.0 51.3 51.3 50.9 50.6 49.7 48.9
Region
Northeast 62.0 62.2 62.4 62.6 63.1 63.5 63.7 64.3 64.4 65.0 65.2 65.2 65.0 64.6 64.0 64.1
Midwest 69.2 70.6 70.5 71.1 71.7 72.6 73.1 73.1 73.2 73.8 73.1 72.7 71.9 71.7 71.0 70.8
South 66.7 67.5 68.0 68.6 69.1 69.6 69.8 69.7 70.1 70.9 70.8 70.5 70.1 69.9 69.6 69.0
West 59.2 59.2 59.6 60.5 60.9 61.7 62.6 62.5 63.4 64.2 64.4 64.7 63.5 63.0 62.6 61.4
Notes: White, black and Asian/other are non-Hispanic. Hispanic householders may be of any race. After 2002, Asian/other also includes householders of more than one race. Caution should be used in interpreting changes before and after 2002 because of rebenchmarking.
Source: US Census Bureau, Housing Vacancy Survey.
Housing Cost-Burdened Households by Tenure and Income: 2001 and 2009Thousands
TABLE A-4

37JOINT CENTER FOR HOUSING STUDIES OF HARVARD UNIVERSITY
Housing Cost-Burdened Households by Tenure and Income: 2001 and 2009Thousands
TABLE A-4
Tenure and Income
2001 2009 Percent Change 2001–9
No Burden
Moderate Burden
Severe Burden Total
No Burden
Moderate Burden
Severe Burden Total
No Burden
Moderate Burden
Severe Burden Total
Owners
Bottom Decile 758 714 2,514 3,987 531 585 2,719 3,836 -29.9 -18.1 8.2 -3.8
Bottom Quintile 3,344 1,913 3,943 9,201 2,582 1,896 4,597 9,074 -22.8 -0.9 16.6 -1.4
Bottom Quartile 5,030 2,564 4,450 12,044 4,002 2,622 5,369 11,993 -20.4 2.3 20.7 -0.4
Lower-Middle Quartile 10,668 3,645 1,465 15,777 10,111 4,355 2,577 17,043 -5.2 19.5 75.9 8.0
Upper-Middle Quartile 15,998 2,896 469 19,363 15,977 4,107 1,080 21,165 -0.1 41.8 130.3 9.3
Top Quartile 21,457 1,206 140 22,803 22,216 2,218 295 24,728 3.5 83.9 110.7 8.4
Total 53,153 10,310 6,523 69,986 52,306 13,302 9,321 74,929 -1.6 29.0 42.9 7.1
Renters
Bottom Decile 1,189 858 4,610 6,657 1,292 758 5,475 7,526 8.7 -11.7 18.8 13.1
Bottom Quintile 2,531 2,876 6,679 12,086 2,531 2,734 8,384 13,649 0.0 -4.9 25.5 12.9
Bottom Quartile 3,459 4,060 7,046 14,565 3,336 4,002 9,072 16,411 -3.6 -1.4 28.8 12.7
Lower-Middle Quartile 7,509 2,876 446 10,831 6,623 3,788 950 11,361 -11.8 31.7 113.0 4.9
Upper-Middle Quartile 6,736 469 41 7,247 6,323 834 82 7,239 -6.1 77.8 100.0 -0.1
Top Quartile 3,724 80 3 3,806 3,576 99 1 3,676 -4.0 23.8 -66.7 -3.4
Total 21,428 7,485 7,537 36,450 19,858 8,724 10,105 38,687 -7.3 16.6 34.1 6.1
All Households
Bottom Decile 1,947 1,572 7,124 10,643 1,824 1,343 8,193 11,361 -6.3 -14.6 15.0 6.7
Bottom Quintile 5,875 4,790 10,622 21,287 5,113 4,629 12,981 22,723 -13.0 -3.4 22.2 6.7
Bottom Quartile 8,489 6,624 11,496 26,609 7,338 6,425 14,441 28,404 -13.6 -3.0 25.6 6.7
Lower-Middle Quartile 18,176 6,521 1,911 26,609 16,734 8,143 3,527 28,404 -7.9 24.9 84.6 6.7
Upper-Middle Quartile 22,735 3,365 510 26,609 22,300 4,942 1,162 28,404 -1.9 46.9 127.8 6.7
Top Quartile 25,181 1,285 143 26,609 25,791 2,316 296 28,404 2.4 80.2 107.0 6.7
Total 74,581 17,795 14,060 106,436 72,164 22,026 19,426 113,616 -3.2 23.8 38.2 6.7
Notes: Income deciles/quintiles/quartiles are equal tenths/fifths/fourths of all households sorted by pre-tax income. Moderate/severe burdens are defined as housing costs of 30-50%/more than 50% of household income. Households with zero or negative income are assumed to be severely burdened, while renters paying no cash rent are assumed to be unburdened.Source: JCHS tabulations of US Census Bureau, 2001 and 2009 IPUMS American Community Surveys.

THE STATE OF THE NATION’S HOUSING 201138
Severely Cost-Burdened Households by Household Characteristics: 2009Share of Households (Percent)
TABLE A-5
Household Characteristics All Households
Household Income Quartile
Bottom Lower Middle Upper Middle Top
All Households 17.1 50.8 12.4 4.1 1.0
Tenure
Owners with Mortgages 14.8 75.3 24.8 6.9 1.5
Owners without Mortgages 7.4 24.0 0.9 0.1 0.0
Renters 26.1 55.3 8.4 1.1 0.0
Age of Householder
Under 25 34.8 63.3 8.2 1.7 0.1
25–44 17.4 61.4 13.7 4.1 1.1
45–64 15.2 54.5 14.3 4.6 1.1
65 and Over 16.4 34.5 8.9 3.2 0.8
Household Type
Married without Children 8.7 43.6 11.1 3.4 0.8
Married with Children 12.2 64.1 20.0 5.9 1.4
Single Parent 32.6 64.0 15.0 5.0 1.8
Other Family 16.7 50.2 11.0 3.3 1.0
Single Person 25.4 45.8 9.6 3.5 1.1
Other Non-Family 16.1 61.9 10.3 2.5 0.5
Race/Ethnicity of Householder
White 14.0 46.8 11.1 3.5 0.9
Black 26.6 56.8 11.9 3.7 1.1
Hispanic 25.0 58.1 17.2 6.3 1.6
Asian/Other 20.5 58.4 20.0 8.9 2.0
Education of Householder
No High School Diploma 27.3 46.0 10.9 4.1 1.2
High School Graduate 18.5 47.2 10.5 3.2 0.8
Some College 17.8 57.0 13.2 3.9 1.0
Bachelor's Degree or More 10.6 62.9 16.3 5.2 1.1
Notes: Households with severe cost burdens spend more than 50% of pre-tax household income on housing. Households with zero or negative income are assumed to be severely burdened, while no-cash renters are assumed to be unburdened. Children are the householder’s own children under the age of 18. White, black and Asian/other householders are non-Hispanic. Hispanics may be of any race. Source: JCHS tabulations of US Census Bureau, 2009 IPUMS American Community Survey.
Location and Characteristics of High-Foreclosure Census Tracts: 2010
TABLE A-6
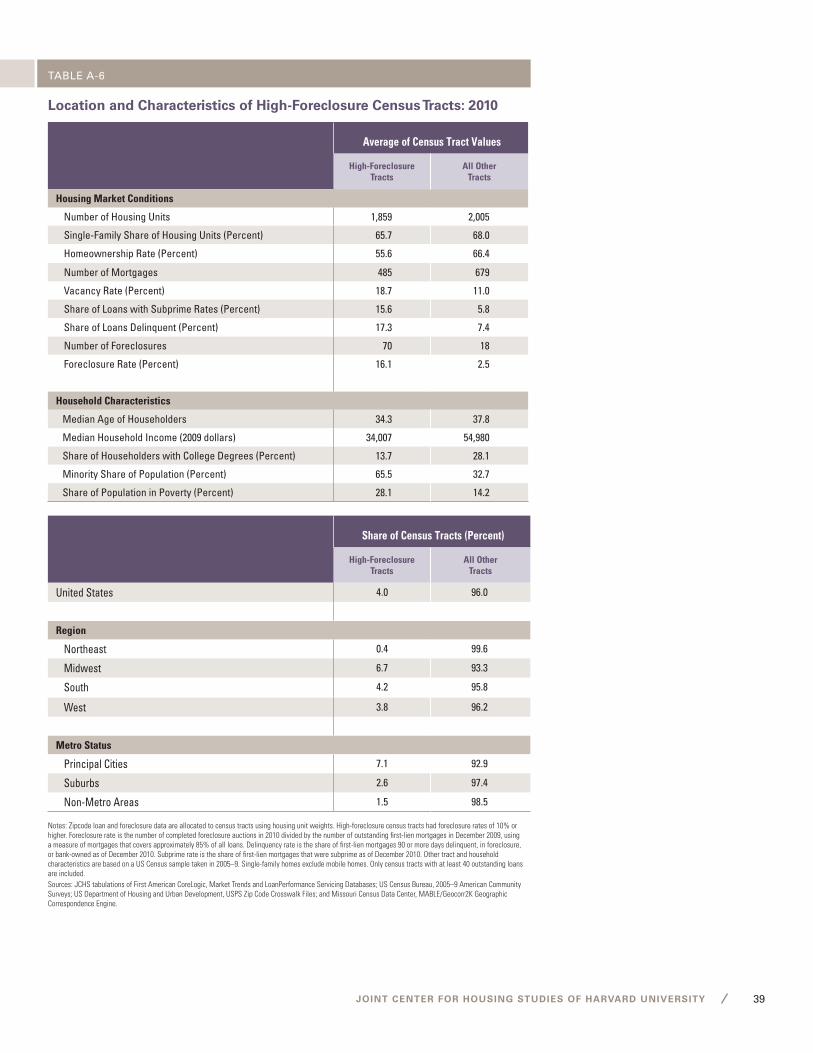
39JOINT CENTER FOR HOUSING STUDIES OF HARVARD UNIVERSITY
Location and Characteristics of High-Foreclosure Census Tracts: 2010
TABLE A-6
Share of Census Tracts (Percent)
High-Foreclosure Tracts
All Other Tracts
United States 4.0 96.0
Region
Northeast 0.4 99.6
Midwest 6.7 93.3
South 4.2 95.8
West 3.8 96.2
Metro Status
Principal Cities 7.1 92.9
Suburbs 2.6 97.4
Non-Metro Areas 1.5 98.5
Notes: Zipcode loan and foreclosure data are allocated to census tracts using housing unit weights. High-foreclosure census tracts had foreclosure rates of 10% or higher. Foreclosure rate is the number of completed foreclosure auctions in 2010 divided by the number of outstanding first-lien mortgages in December 2009, using a measure of mortgages that covers approximately 85% of all loans. Delinquency rate is the share of first-lien mortgages 90 or more days delinquent, in foreclosure, or bank-owned as of December 2010. Subprime rate is the share of first-lien mortgages that were subprime as of December 2010. Other tract and household characteristics are based on a US Census sample taken in 2005–9. Single-family homes exclude mobile homes. Only census tracts with at least 40 outstanding loans are included.Sources: JCHS tabulations of First American CoreLogic, Market Trends and LoanPerformance Servicing Databases; US Census Bureau, 2005–9 American Community Surveys; US Department of Housing and Urban Development, USPS Zip Code Crosswalk Files; and Missouri Census Data Center, MABLE/Geocorr2K Geographic Correspondence Engine.
Average of Census Tract Values
High-Foreclosure Tracts
All Other Tracts
Housing Market Conditions
Number of Housing Units 1,859 2,005
Single-Family Share of Housing Units (Percent) 65.7 68.0
Homeownership Rate (Percent) 55.6 66.4
Number of Mortgages 485 679
Vacancy Rate (Percent) 18.7 11.0
Share of Loans with Subprime Rates (Percent) 15.6 5.8
Share of Loans Delinquent (Percent) 17.3 7.4
Number of Foreclosures 70 18
Foreclosure Rate (Percent) 16.1 2.5
Household Characteristics
Median Age of Householders 34.3 37.8
Median Household Income (2009 dollars) 34,007 54,980
Share of Householders with College Degrees (Percent) 13.7 28.1
Minority Share of Population (Percent) 65.5 32.7
Share of Population in Poverty (Percent) 28.1 14.2

THE STATE OF THE NATION’S HOUSING 201140
Mover Households by Tenure Change and Age: 2003–9
TABLE A-7
Metro Area Home Price Declines by Price Tier: Peak to December 2010Percent
TABLE A-8
Number of Households (Thousands)
Share of All Mover Households (Percent)
2003 2005 2007 2009 2003 2005 2007 2009
Age of Homeowners Switching to Renting
Under 25 78 54 96 102 1.8 1.2 2.5 2.8
25–34 299 352 372 401 2.4 2.7 3.0 3.1
35–44 453 470 509 576 4.6 4.5 4.7 6.1
45–54 348 384 452 544 5.5 5.0 5.8 7.1
55–64 146 231 288 250 4.2 5.4 6.0 5.5
65–74 118 132 152 136 6.5 6.0 7.2 6.8
75 and Over 193 187 225 203 13.6 12.8 14.9 13.2
Total 1,633 1,810 2,094 2,213 8.2 8.3 9.7 10.7
Age of Renters Switching to Homeowning
Under 25 289 364 269 198 6.6 8.0 7.1 5.5
25–34 1,669 1,692 1,544 1,367 13.4 13.1 12.5 10.7
35–44 1,103 1,141 1,102 978 11.1 10.9 10.2 10.4
45–54 699 781 698 766 11.1 10.2 9.0 10.0
55–64 376 434 379 479 10.9 10.1 7.9 10.6
65–74 156 123 127 160 8.6 5.6 6.0 8.0
75 and Over 81 58 73 100 5.7 4.0 4.8 6.5
Total 4,374 4,592 4,192 4,048 22.0 21.1 19.5 19.5
Note: Mover households include only existing households where all members changed residence together in the two years between surveys.Source: JCHS tabulations of US Census Bureau, American Housing Surveys, using JCHS-adjusted weights.
Low-Price Tier Homes High-Price Tier Homes
Peak-to-December 2010 Price Change
(Percent)Peak Date
Peak-to- December 2010 Price Change
(Percent)Peak Date
Atlanta -50.1 2007:1 -22.9 2007:4
Boston -26.8 2006:1 -10.7 2005:4
Chicago -45.4 2007:3 -26.0 2007:3
Denver -18.2 2005:4 -9.5 2006:12
Las Vegas -66.5 2006:7 -54.0 2006:4
Los Angeles -51.6 2007:2 -28.2 2006:5
Miami -64.5 2007:3 -44.2 2006:5
Minneapolis -46.9 2006:4 -28.1 2006:4
Low-Price Tier Homes High-Price Tier Homes
Peak-to-December 2010 Price Change
(Percent)Peak Date
Peak-to- December 2010 Price Change
(Percent)Peak Date
New York -29.7 2007:2 -17.8 2006:2Phoenix -69.8 2006:6 -49.4 2006:5Portland, OR -27.9 2007:5 -25.0 2007:5San Diego -45.1 2006:4 -29.6 2006:4San Francisco -58.4 2006:5 -24.0 2007:3Seattle -32.8 2007:5 -25.0 2007:7Tampa -58.9 2006:7 -42.2 2006:5Washington, DC -39.4 2007:3 -18.4 2006:3
Note: House price data are for existing single-family homes and cover the period from January 2000 to December 2010. Homes are divided into equal thirds and allocated into low-, middle- and high-price tiers based on original sales price.Source: JCHS tabulations of S&P/Case-Schiller Tiered HPI data.

The State of the Nation’s Housing 2011 was prepared by the
Joint Center for Housing Studies of Harvard University
Barbara Alexander
Kermit Baker
Pamela Baldwin
Eric Belsky
Michael Carliner
Yun Chen
Susie Chung
Zhu Xiao Di
Kerry Donahue
Angela Flynn
Christina Harris
Christopher Herbert
Jackie Hernandez
Mary Lancaster
George Masnick
Daniel McCue
Meg Nipson
Nicolas Retsinas
Jordan Roberts
Alexander von Hoffman
Abbe Will
Editor and Project Manager
Marcia Fernald
Designer
John Skurchak
For additional copies, please contact
Joint Center for Housing Studies
of Harvard University
1033 Massachusetts Avenue, 5th Floor
Cambridge, MA 02138
www.jchs.harvard.edu

JOINT CENTER FOR HOUSING STUDIES OF HARVARD UNIVERSITY
Joint Center for Housing Studies of Harvard University
FIVE DECADES OF HOUSING RESEARCH SINCE 1959