Embed Size (px)
Citation preview

State of the Health Funds Report
2009
An independent assessment of the comparative performance & service delivery of Australia’s private health insurance providers.

Private Health Insurance Ombudsman
STATE OF THE HEALTH FUNDS REPORT
2009
(Relating to the financial year 2008-09)
Report required by 238‐5(c) of the Private Health Insurance Act 2007
This work is copyright. Apart from any use permitted under the Copyright Act 1968, no part may be reproduced without written permission. Requests concerning reproduction and rights should be addressed to the Private Health
Insurance Ombudsman Level 7, 362 Kent Street Sydney NSW 2000
© Commonwealth of Australia 2010
1

FOREWORD I am pleased to present the sixth annual State of the Health Funds Report relating to the financial year 2008/2009. The Private Health Insurance Act 2007 requires the Private Health Insurance Ombudsman (PHIO) to publish the State of the Health Funds Report after the end of each financial year, to provide comparative information on the performance and service delivery of all health funds during that financial year. The main aim of publishing the report is to give consumers some extra information to help them make decisions about private health insurance. For existing fund members, the report provides information that will assist them to compare the performance of their fund with all other health funds. For those considering taking out private health insurance, it provides an indication of the services available from each fund and a comparison of some service and performance indicators at the fund level. The information in the report supplements information available on the consumer website, www.privatehealth.gov.au, which was developed and is maintained by the PHIO. The website provides a range of information to assist consumers’ understanding of private health insurance and select or update their private health insurance product. The information on the website, together with the State of the Health Funds Report, greatly increases the information available to consumers about private health insurance. This makes it easier for them to choose health insurance policies that better meet their individual needs. The range of issues and performance information in this year’s report is the same as previous reports, and has been chosen after taking into account the availability of reliable data and whether the information is reasonably comparable across funds. The information included in the report is based on data collected by the Private Health Insurance Administration Council (PHIAC), as part of their role in statistical reporting and monitoring of the financial management of health funds. I would like to acknowledge the significant contribution of PHIO staff member, David McGregor, who has produced the statistical tables. I would also like to thank PHIAC for its assistance and advice in relation to the report. Samantha Gavel Private Health Insurance Ombudsman March 2010
2

CONTENTS Foreword 2
Using the Information in this Report to Compare 4
Key Consumer Concerns, Issues & Developments 6
Health Fund Abbreviations & Contact Details 15
Service Performance 16
Hospital Cover 18
Medical Gap Cover 20
General Treatment (Extras) Cover 22
Financial Management of Health Funds 26
Health Fund Operations by State (Territory) 28
About the Private Health Insurance Ombudsman 34
Tips for Health Insurance Consumers 35
3

Using the Information in this Report to Compare Health Funds The State of the Health Funds Report (SOHFR) compares the performance of health funds in the following aspects:
• Service Delivery • Service Performance • Finances and Costs • Hospital Cover • Ancillary (Extras) Cover • Medical Gap Cover
Consumers can use the i nformation contained in this report either to identify possible funds to join o r to asse ss th eir exi sting fund’s performance as part of a review of their health insurance needs. It is intended that consumers should use the range of indicators included in this report as a menu to choose the factors that may be of importance to them. For in stance, som e c onsumers may p refer t o do business with a health fund in person and so will consider the availability of branch offices to b e an impo rtant con sideration. For consumers wishing to do a s m uch of their business a s possible ov er the intern et, the range of serv ices available through the funds’ websites will be more importa nt than the branches. Some advi ce on why particular in dicators might be more rel evant to particula r consumers i s p rovided i n the expla nations preceding each of the tables in this report. For consumers who are considering taking out private health insurance for the first time, it is suggested that the report be used to identify a number of funds (prefe rably at least three) for further investigation. None of the indicators used in this report should be relied on solely as an indicator of fund performance. In most case s, a se emingly poor p erformance on o ne i ndicator will be offset by a goo d performance on other factors. Some advice on factors to consi der when a ssessing performance on parti cular indi cators is also provided in the explanati ons p receding each table.
The publication “Insure, Not Sure” produced by the Private Health Insurance Admi nistration Council, provides ind ependent inform ation to help consum ers d ecide w hether they want to take out p rivate healt h insu rance. This brochure can be found on www.phio.org.au or obtained on request fro m the Ombud sman’s office. The report doe s n ot inclu de detailed information on price and benefits for particular health in surance pro ducts. Information on these i s available from the consumer website www.PrivateHealth.gov.au, manag ed by the Ombudsman’s office. Disclaimer: Nothing contained in this report should be taken as a recommendation by the Private Health Insurance Ombudsman in favour of any particular health fund or health insurance product.
Fund Names Throughout this rep ort health fund s are referred to by an a bbreviation of their registered name, rather than any b rand name that they might use. Thi s abb reviated name appears on the left side of the hea ding for each fund in the Health Fund Listing section. Some open membe rship funds use several different brand names. CURRENT & RECENT BRAND NAMES BRAND NAME FUND Australian Country Health Medibank-AHM Country Health Medibank-AHM CY Health Healthguard Druids GMHBA Federation Health Latrobe GMF Health Healthguard Goldfields Healthguard Goverment Employeees Medibank-AHM Grant United Australian Unity HBA BUPA-MBF Illawarra Health Fund Medibank-AHM IOOF NIB IOR HCF Mutual Community BUPA-MBF Mutual Health Medibank-AHM NRMA Health BUPA-MBF SGIC (SA) BUPA-MBF SGIO (WA) BUPA-MBF Union Shopper QLD Teachers
4

About the data used in the report Restricted Access Health Insurers Not all he alth funds a re available to all consumers. Membership of some f unds i s restricted to employee s of certai n co mpanies or occu pations or m embers of particular organisations. All registered health fund s are in cluded in the tables for each i ndicator. Open and restricted access fu nds are li sted separately in each of the tables, with restri cted access fund s listed in italics and after open funds. State-Based Differences Most of the information contained in this report is ba sed on national data. Ho wever, the market for h ealth insura nce is la rgely state based. Som e funds h ave little prese nce in most state s but may h ave a large market share in one state or territory; some fund s offer differe nt pro ducts a nd pri ces in different states a nd some fund s use differe nt brand names in different states and territories. Separate ta bles are the refore p rovided for each State/Territo ry with informatio n o n the extent of each fund’ s bu siness in each state, as well as other rele vant state based information such as the number of retail offices and agencies operated by each fund. Information about Products The information included in the re port on fund contributions and be nefits indi cates th e average o utcomes acro ss all of a fund’ s products and shoul d n ot be ta ken as an indicator of the pri ce or b enefit levels that can be expe cted for any parti cular pro duct. Virtually all funds offe r more ex pensive products tha t can be e xpected to provide better th an average benefits an d m ost al so offer cheaper products that provide less. The web site www.PrivateHealth.gov.au enables co nsumers to view standard information outlining the main feature s of their health insurance policy. They are al so able to compare sta ndard info rmation state ments fo r other policies availa ble for pu rchase. The website is a good source of informatio n about particular p olicies avail able for sale, in cluding the level of cove r, ex cess a nd price. In addition, the website i s a good re source of independent and reliabl e inform ation abo ut private health insurance.
The report is intend ed to help co nsumers in deciding which h ealth fu nds to con sider but won’t necessarily help them to decide which of the funds’ products to purchase. Data Collection The need to obtain independent, reliable data has b een a key con sideration in putting together the report. The d ata collected by the industry re gulator, th e Private He alth Insurance A dministration Cou ncil (PHIAC), was cho sen as the m ost app ropriate data available. Funds report to PHIAC for regulatory purposes and not all of the data is publi cly available. Some of this info rmation is u seful to consumers and is th erefore reproduced in this report. Thi s data is co llected primarily for regulatory purposes and not for the pu rposes of the State of the Health Funds Report. Accordingly, it is importa nt that the accompanying text explaining the data is rea d in conjunction with the tables. As funds differ in size, mos t of the statistical information i s p resented as percentages o r dollar am ounts per me mbership, for easi er comparison. No attem pt has been made to weight the importance of various indicators, as this is a subje ctive judgement very much dependent o n the parti cular circumstances, preferences and pri orities of i ndividual consumers. For this reason, it would not be valid to average all the scores in dicated to obtain some form of consolidated performance or service delivery score. The report provides consumers with additional information a bout the b enefits that were paid by each in surer over the last year. The report also p rovides information about the extent of cover p rovided for ho spital, medical and ancillary tre atment, an d any state -based differences i n cove rage. The select ion of indicators used in this report is not intended to represent the full rang e of factors that should be co nsidered when compa ring the performance of health fund s. The range of indicators has been limite d to those for whi ch there i s re liable comp arative information available.
5

Key Consumer Issues and Developments
Level of Complaint to the PHIO
There were 2502 complaints to the Private Health Insurance Ombudsman (PHIO) during 2008/09, which represented a 5% increase on the 2385 complaints received in 2007/08. This increase is due to complaints about fund demutualisation issues, as well as an increase in complaints about the level of cover held and general service issues.
The number of higher level complaints requiring more detailed investigation by the PHIO decreased slightly to 708 during 2008/09, down from 723 the previous year. The continued decline in higher level complaints indicates the industry overall is continuing to improve its own internal complaint handling practices, so that lower numbers of complaints need to be investigated by the PHIO.
This is positive news for consumers, who usually prefer their own insurer to resolve their problem quickly and easily, without them having to escalate it to the Ombudsman. It also means that the PHIO can focus resources on dealing with the more difficult and complex issues and complaints that require more detailed investigation and work to resolve.
Complaint Issues
The issue causing the most complaints to the PHIO in 2008/09 was the amount of benefit received by the member for a
claim. The amount in dispute in these complaints can range from relatively small amounts of money for ancillary claims, up to significant amounts of several thousands of dollars if the claim relates to a hospitalisation.
Other issues that caused significant numbers of complaints were problems with cancelling or suspending memberships, the service provided by fund staff over the telephone or in the branch, premium payment problems and waiting periods.
Complaints about levels of cover held increased to 262 in 2008/09, compared with 156 in 2007/08. These complaints mainly relate to problems that arise when a member is not fully covered for a hospitalisation, due to a restriction or exclusion on their policy. The most common restrictions and exclusions are for more expensive services such as psychiatric care, hip replacements, cardiac surgery, cataract surgery and obstetrics.
Policies with restrictions or exclusions are usually marketed to young people and provide them with a less costly alternative to more comprehensive cover. Problems can arise when a member retains a policy with restrictions or exclusions as they move into their thirties and forties. It then becomes more likely that they will need hospitalisation for a service that is restricted or excluded under their policy.
6

Key Consumer Issues and Developments
The recent report on the Operations of the Private Health Insurers for 2008/09 by the industry regulator, the Private Health Insurance Administration Council (PHIAC) notes that 12.7% of policies have exclusions on some categories of treatment.1 This is similar to the figure of 12.4% reported by PHIAC in 2007/08.
Developing policies with restrictions, or adding restrictions to existing policies, are ways that insurers can manage their benefit payments to keep premiums lower. At the same time, however, it is important that members are aware of the restrictions applying to their policy, because they confer a higher level of risk on the member. In its consumer information the PHIO focuses on the need for consumers to consider taking out the highest level of hospital insurance they can afford and taking a higher level of excess, rather than a restriction or exclusion. It is also important that consumers review their health insurance each year, as they reach different life stages and their health needs change.
The one page Standard Information Statement (SIS) that insurers are required to send to members each year sets out the main features of their policy and is a good tool for reminding
1 Source:” Operations of the Private Health Insurers 2008/09”, PHIAC, p 53
members of any restrictions they may have on their cover.
The Health Care & Insurance Australia 2009 report2 by Ipsos Australia found that a large percentage of members recall receiving their SIS; that the majority found the information on the statement adequate; and that a sizeable number used the statement to review their policy or compare it with other policies available for sale. It is pleasing to see the Ipsos Report confirming that consumers are using their SIS to review their polices as intended when the SIS was introduced in 2007.
When consumers are considering which health insurance policy to purchase, the PHIO recommends that before deciding to take a less comprehensive level of cover, they compare it with policies available in other price brackets. A policy that costs a little more per week can be more comprehensive than one that is only marginally cheaper in price. This is particularly important where consumers may be purchasing health insurance for tax reasons, or to avoid the lifetime health cover penalty loading. Complaints to the PHIO show that in these circumstances, people don’t intend to use their insurance and often opt for the lowest priced cover they can find. 2 Source: Health Care & Insurance Australia 2009, Ipsos Australia, p xxxiv. NB: this report is copyright and available to subscribers only
7

Key Consumer Issues and Developments
therefore important for consumers to think about their future health needs and those of their family before purchasing a policy and look at features as well as price.
Industry Developments
Notable developments impacting on the private health insurance industry during 2008/09 included the Global Financial Crisis, and the significant change in the profile of the industry from one where most insurers were operating on a not-for-profit basis, to one where 71% of the industry is now operating on a for-profit basis.
Insurers, along with all businesses and consumers, were affected by the economic down turn resulting from the Global Financial Crisis (GFC). In particular, the GFC impacted on insurers’ investment income. The industry regulator, PHIAC, has indicated, however, in its most recent report that the industry has weathered the downturn well overall and remains in a sound prudential position.3
The change in the profile of the industry to one where the majority of the market is operating on a for-profit basis should be relatively seamless for consumers. There are a number of important protections available to consumers under legislation that apply regardless of whether an insurer is
3 . Source: Operations of the Private Health Insurers 2008/09, PHIAC, p 2.
operating on a for-profit or not- for-profit basis. These include community rating, strict regulation of the premium increase process and the existence of the Ombudsman’s office as an independent third party to deal with consumer complaints and protect consumers’ interests. The PHIO will however, continue to monitor complaints in order to identify any issues arising out of this change.
The Commonwealth Government has embarked on a significant health reform process and has been consulting widely in relation to this. The private health industry, along with other stakeholders, has engaged in the process in order to highlight areas where the industry can contribute to the reform of the overall health system, in order to meet the challenges posed to both public and private sectors by increasing utilisation of health services, higher technology costs and the ageing of the population.
8

Key Consumer Issues and Developments
Informed Financial Consent
Informed Financial Consent (IFC) is the process of enabling a consumer to understand and consent to incurring any out-of-pocket expenses, prior to receiving treatment. The ability to give IFC is an important consumer right.
As has been noted in previous reports, processes for providing IFC in private hospitals are generally good. Most of the complaints the PHIO receives about lack of IFC relate to gaps for medical services.
In order to obtain a more accurate insight into the concerns consumers have raised about the provision of IFC for medical gaps, the PHIO analysed all complaints about medical practitioners received during 2008/09. There were 46 complaints received in this period where a medical practitioner was the object of the complaint. 25 of these complaints related to a lack of IFC. Of these, 7 complaints related to emergency admissions, where IFC could not reasonably be obtained.
IFC was sought in the remaining 21 cases, but 9 complaints concerned additional fees resulting from more complex procedures being performed in surgery than originally anticipated; in 8 cases IFC had been obtained, but the complaint related to the amount of benefit received from Medicare and the fund; 3 complaints concerned problems with obtaining gap benefits from the fund and one case concerned a misunderstanding about different
payment options and the costs associated with these.
The majority of complaints related to services provided by surgeons and anaesthetists. Eight complaints concerned gaps under $500; 17 concerned gaps under $1,000; 13 concerned gaps between $1,000 and $5,000; 6 concerned gaps between $5,000 and $10,000 and two concerned gaps over $10,000.
It can be seen from this that although the number of IFC complaints received is small, the individual consumers have experienced significant gap amounts. In order to assist consumers with complaints about gaps and lack of IFC, the PHIO produces a brochure about medical gaps and steps for ensuring IFC is provided, as well as options where it hasn’t been provided.
PHIO also investigates complaints about lack of IFC by medical providers. Where the complaint does not relate to an emergency admission (where provision of IFC can be difficult) and is able to be substantiated, the PHIO will recommend the doctor reduce the outstanding account.
Following the termination of a number of Medical Purchaser Provider Agreements between insurers and providers of pathology, radiology and diagnostic imaging services in 2009, the PHIO is closely monitoring and investigating complaints about gaps for these services where IFC has not been provided.
9

Key Consumer Issues and Developments
Contracting Issues
All insurers have contracts with private hospitals for the provision of hospital services to their members. Where an insurer has a contract with a hospital, the member will have very few out of pocket costs to pay for their hospital accommodation and theatre costs, apart from the excess or co-payment on their health insurance policy. Where there is no contract in place, the out-of-pocket costs to the consumer can be significant.
Consumers understandably have a low awareness of hospital contracting issues, but a contract dispute or termination does have the potential to impact adversely on their entitlements under their health insurance if the dispute relates to a hospital they wish to attend.
For this reason, the PHIO has power under legislation to mediate between insurers and hospitals in order to protect consumers’ interests in these situations.
The PHIO assisted in informally mediating a number of these disputes during 2008/09. During 2009, more significant intervention and assistance by the PHIO was required to resolve a small number of contract disputes. This may be related to more difficult economic conditions and the need for insurers to contain costs as much as possible.
The PHIO has a process in place for mediating these disputes, which
includes informal mediation by the Ombudsman, as well as formal mediation with an independent mediator if necessary.
The office recently revised its Transition and Communication Protocols that provide advice to industry on transitional arrangements and communication in relation to contract disputes to ensure the protection consumer interests.
In dealing with contract disputes, it has become apparent that individual contractual agreements could contain better dispute resolution clauses that provide for mediation and arbitration if a dispute arises in relation to contract re-newal. This is a matter the PHIO will be pursuing with the industry in the coming year.
The nature of contracting means that disputes need to be dealt with in a very tight time frame, as contracts generally expire shortly after negotiations break down. This does not allow for more thoughtful and balanced views of the issue by either party and makes it more difficult to ensure appropriate arrangements are in place to protect members and patients if negotiations fail.
While contracting is an important way for insurers and providers to manage costs, it remains true that interests of consumers are best served when their insurer has a contractual arrangement with a wide range of providers.
10

Key Consumer Issues and Developments
Ultimately, it is a commercial arrangement and inevitably, the parties will not always be able to reach agreement. This means there may be periods where they are out of contract with each other. The size of the fund membership in the catchment area for the hospital or hospitals is significant in terms of the impact on members and other insurers if members seek to transfer so they can attend a hospital where their own insurer does not have a contract.
Recently, a number of Medical Purchaser Provider Agreements (MPPAs) for pathology services were terminated between insurers and a large provider of pathology services. The negotiating positions of the parties to these agreements were too far apart to enable mediation between them to succeed. This means that members whose insurer no longer has an agreement with this provider are more likely to incur gaps for pathology services in hospital.
Some pathology providers have also indicated they will be charging gaps for out-patient pathology services as well, although these services do not attract private health insurance benefits.
The move towards gaps for pathology services is of concern, because gaps have a negative impact on consumers’ perceptions of their health insurance. It can also difficult to provide informed financial consent for gaps for in-patient pathology services, which may lead to increased consumer dissatisfaction.
The PHIO will be monitoring and investigating complaints about gaps for in-hospital pathology services. The PHIO will also continue to promote the desirability of MPPAs4 for pathology services to providers and insurers as the most advantageous arrangement for consumers.
Overseas Visitor Cover
For some time, the PHIO has had significant concerns about the suitability of some health insurance policies available for purchase by people visiting Australia from overseas.
These policies provide cover for a small range of services, such as wisdom tooth extraction, but leave the member without cover and financially exposed if any other service is required, including an unexpected hospitalisation. The charges for overseas visitors who are not eligible for Medicare in public hospitals average about $1200 per day. This means that a visitor who is admitted to hospital for several days can incur a bill of several thousand dollars, if they don’t hold appropriate level of overseas visitor cover.
These are significant amounts for visitors to pay and they increase the risk to public hospitals of unpaid debts that impact on their finances.
During 2009, the PHIO assisted the Department of Immigration and
4 Medical Purchaser Provider Agreements
11

Key Consumer Issues and Developments
Citizenship in setting a minimum standard of health insurance for overseas visitors who hold 457 visas. This minimum is now in place and means that visitors holding 457 visas are required to have health insurance that meets the minimum requirements as a condition of their visa.
The PHIO has also provided more comprehensive information on the PrivateHealth.gov.au website to assist visitors to better understand their health insurance needs while in Australia.
The PHIO will continue to monitor complaints from overseas visitors and take them up individually with the funds concerned. PHIO will also work with insurers to encourage the development of more comprehensive policies for overseas visitors.
Consumer Information and Advice
The PHIO has an important role in providing information and advice to consumers to help them understand their health insurance.
To this end, the PHIO produces a number of consumer brochures, the annual State of the Health Funds report and maintains the consumer website www.PrivateHealth.gov.au. The website contains information about individual health insurance policies, information about private health insurance and has an “Ask a Question” section that enables
consumers to quickly and easily seek additional information from PHIO staff.
The recent “Health Care & Insurance Australia” report5 by Ipsos Australia, confirmed again that consumers find health insurance confusing. The level of confusion is perhaps understandable given the number of different policies available for purchase and the extent of services covered. Health insurance is more complex than other forms of insurance but nevertheless, the industry has an obligation to ensure policies are explained as clearly as possible.
PHIO will be focussing over the coming year on assisting consumers to navigate this complexity. The PHIO is currently updating its own website www.phio.org.au. Once this is complete, the PHIO will be releasing a number of fact sheets to assist consumers with information about issues that regularly generate questions and complaints to the office. These will be available for downloading from this website.
In addition, the consumer website PrivateHealth.gov.au is currently being updated and refreshed and will be re-launched in mid 2010. This website already provides very good information and resources for consumers about private health insurance. The website update will improve the look and feel of
5 Source: “Health Care & Insurance Australia 2009”, Ipsos Australia, p xxxiv. NB: this report is copyright and available to subscribers only.
12

Key Consumer Issues and Developments
the site, the location of the information and provide an improved comparison feature to assist consumers in finding and comparing health insurance policies.
Once the version of the site is launched, the office will focus on publicising the website and raising awareness in the community of this important consumer resource.
13

‐This page is intentionally left blank‐
14

Abbreviation Full name or other names Main Office Phone Number Website
AHM Australian Health Management Pty Ltd 13 42 46 www.ahm.com.auAU Australian Unity 13 29 39 www.australianunity.com.auBUPA Bupa Australia Health Pty Ltd, HBA, Mutual Community 13 12 43 www.bupa.com.auCDH CDH Benefits Fund Ltd (02) 4990 1385 www.cdhbf.com.auCUA Health CUA Health Ltd 133 282 www.cuahealth.com.auDruids VIC1
GMHBA GMHBA Limited 1300 446 422 www.gmhba.com.auGU Corporate Grand United Corporate Health Fund 1800 249 966 www.guhealth.com.auHBF HBF Health Funds Inc 13 34 23 www.hbf.com.au HCF The Hospitals Contribution Fund of Australia Limited 131 334 www.hcf.com.au Healthguard GMF Health, Central West Health Fund 1300 653 099 www.healthguard.com.auHealth Partners Health Partners Limited 1300 113 113 www.healthpartners.com.au HIF Health Insurance Fund of WA 1300 134 060 www.hif.com.auLatrobe Latrobe Health Services 1300 362 144 www.lhs.com.auMBF MBF Australia Pty Limited 131137 www.mbf.com.auMBF Alliances MBF Alliances Pty Ltd, NRMA, SGIO, SGIC 133 234 www.nrma.com.au
Medibank Medibank Private 132 331 www.medibank.com.auMildura Mildura District Hospital Fund 03 5023 0269MU Manchester Unity 13 13 72 www.manchesterunity.com.auNIB NIB Health Funds Ltd 131 463 www.nib.com.auOnemedifund National Health Benefits Fund Australia Pty Ltd 1800 148 626 www.onemedifund.com.auPeoplecare Lysaght Peoplecare Limited 1800 808 690 www.peoplecare.com.auQCH Queensland Country Health Fund Ltd 1800 813 415 www.qldcountryhealth.com.auSt Lukes St. Lukes Health 1300 651 988 www.stlukes.com.auWestfund Westfund 1300 552 132 www.westfund.com.au
ACA ACA Health Benefits Fund 1300 368 390 www.acahealth.com.auCBHS CBHS Health Fund Limited 1300 654 123 www.cbhs.com.auDefence Health Defence Health Limited 1800 335 425 www.defencehealth.com.auDoctors' Health The Doctors' Health Fund Limited 1800 226 126 www.doctorshealthfund.com.auHCI Health Care Insurance Limited 1800 804 950 www.hciltd.com.auNavy Navy Health Ltd 1800 333 156 www.navyhealth.com.auPhoenix Phoenix Health Fund 1800 028 817 www.phoenixhealthfund.com.auPolice Health South Australian Police Employees' Health Fund Inc. 1800 603 603 www.policehealth.com.auRT Health Fund Railway and Transport Health Fund Ltd 1300 886 123 www.rthealthfund.com.auReserve Bank Reserve Bank Health Society Limited 1800 027 299Teachers Health Teachers Health Fund 1300 728 188 www.teachershealth.com.auTransport Transport Health 03 8420 1888 www.transporthealth.com.auTUH QLD Teachers' Union Health Fund 1300 360 701 www.tuh.com.au
1. Druids health was acquired by GMBHA in October 2008
Open Health Insurers
HEALTH INSURER LISTING AND CONTACT DETAILS
Restricted Access Health Insurers
15

Service Performance Member Retention The member retention indicator is used as one measure of the comparative effectiveness of health funds and is a measure of member satisfaction. This indicator measures what percentage of fund members (hospital memberships only) have remained with the fund for two years or more. Figures are not adjusted for policies that lapse when a member dies, as these are not reported to PHIAC. Most restricted membership funds rate well on this measure compared to open membership funds. This may be due to the particular features of restricted membership funds, especially their links with employment. Membership Change The membership change indicator shows the change in the number of policy holders over the year from 30 June 2008 to 30 June 2009. Both the percentage change and number are included. Negative figures indicate that the fund has experienced a net reduction in membership over the period. As indicated above, member deaths would account for some of this figure. PHIO Complaints in Context
The number of complaints received by the Private Health Insurance Ombudsman (PHIO) is very small compared to fund membership.
There are a number of factors (other than service performance) that can influence the level of complaints the PHIO receives about a fund. These include the information provided to fund members about the PHIO through general publicity or by the fund and the effectiveness of the fund’s own complaint handling. Nonetheless, the level of complaints that PHIO receives about a fund (relevant to its market share) is a reasonable indicator of the service performance of most funds. Complaints % compared to Market Share %
The first table includes all funds with a national market share of 0.5% or more. In that table each fund’s market share (as at 30 June 2009) is shown in the shaded column. Subsequent columns show the percentage of PHIO complaints in various categories that each fund accounts for. These percentages should be compared with the market share percentage. If a fund has a higher complaints percentage than their percentage market share, it indicates that members of that fund are more likely to complain (about that issue) than the average of all fund members.
Smaller Funds (less than 0.5% National Market Share) For these smaller funds, it is not practical to show the percentage of complaints in each of the above categories because of the very small numbers ofcomplaints. This separate table therefore shows the actual number of all complaints received and the number of complaints investigated, as well as an indicator of whether the number is below the number expected based on the fund’s market share. While these funds have a very low national market share, many are nonetheless very significant in a particular state or region. Code of Conduct A self-regulatory code for health funds was introduced in 2005, dealing with the quality of advice provided to consumers. It sets standards for training of health fund staff and others responsible for advising consumers about private health insurance. It also requires funds to have effective complaint handling procedures. Funds that have completed the compliance processes for becoming a signatory to the code are indicated in the table (as at January 2010).
Benefits complaints include problems of non-payment, delayed payment, the level of benefit paid or the level of gap needing to be paid by the member. Service complaints are about the general quality of service provided by fund staff, the quality of oral and written advice and premium payment problems. All Complaints takes account of all complaints received by PHIO about the fund. All Complaints includes complaints investigated as well as complaints that were finalised without the need for investigation. Complaints Investigated Most complaints to the Ombudsman can be finalised by referral of the matter to fund staff to resolve, or by PHIO staff providing information about the rules applying to health insurance. Complaints which fund staff have not been able to resolve to a member’s satisfaction are investigated by the Ombudsman’s office.The rating on complaints investigated is an indicator of the effectiveness of each fund’s own internal complaints handling.
16

Market Share Benefits Service
All Complaints
Complaints Investigated
AHM 90.3% 4.1% (6404) 3.0% 4.8% 8.6% 6.3% 8.0% ●AU 87.4% -2.4% (-4136) 3.1% 4.4% 4.2% 4.6% 4.5% ●BUPA 89.9% 2.5% (12900) 9.8% 8.8% 7.1% 8.2% 7.7% ●GMHBA 88.4% 10.9% (8433) 1.6% 1.6% 1.7% 1.7% 2.2% ●HBF 89.1% 5.8% (22769) 7.7% 3.0% 1.7% 2.6% 2.7% ●HCF 89.6% 3.2% (14922) 8.9% 5.7% 5.4% 6.5% 3.6% ●Healthguard 85.6% -1.1% (-305) 0.5% 0.2% 0.4% 0.5% 0.3% ●Health Partners 92.0% 4.7% (1549) 0.6% 0.1% 0.3% 0.3% 0.0% ●Latrobe 87.4% 11.3% (3508) 0.6% 0.8% 0.3% 0.6% 0.8% ●MBF 90.1% 3.4% (28036) 15.7% 18.5% 32.2% 23.7% 19.8% ●MBF Alliances 84.5% -3.3% (-3357) 1.9% 3.9% 4.5% 4.3% 3.8% ●Medibank 89.3% 2.8% (41851) 28.6% 24.3% 18.3% 21.1% 23.1% ●MU 84.6% -5.8% (-4579) 1.4% 4.8% 3.2% 3.8% 4.5% ●NIB 88.5% 5.2% (18899) 7.1% 11.7% 7.1% 8.9% 13.0% ●Westfund 92.1% 7.2% (2787) 0.8% 0.3% 0.6% 0.6% 0.8%CBHS 94.3% 7.0% (4353) 1.2% 1.2% 0.3% 0.9% 0.6% ●Defence Health 91.2% 6.0% (4491) 1.5% 0.9% 0.9% 0.9% 0.6% ●Teachers Health 94.1% 4.6% (4174) 1.8% 1.2% 1.1% 1.3% 1.4% ●
CDH 92.3% 12.2% (273) 1 Yes 0 YesCUA Health 89.1% 3.4% (689) 5 Yes 0 Yes ●GU Corporate 97.7% 9.8% (1460) 13 No 6 Yes ●HIF 87.2% 4.7% (1082) 14 No 3 No ●Mildura 90.6% 1.1% (155) 0 Yes 0 YesOnemedifund 57.7% 45.7% (1070) 0 Yes 0 YesPeoplecare 92.7% 8.1% (1438) 7 Yes 0 Yes ●QCH 90.1% 5.2% (632) 4 Yes 0 YesSt. Luke's 89.2% 3.3% (673) 1 Yes 0 Yes ●ACA 93.1% 1.4% (65) 0 Yes 1 No ●Doctors' Health 93.7% 11.7% (603) 2 No 0 Yes ●HCI 94.7% 2.3% (85) 1 Yes 0 Yes ●Navy Health 91.9% 2.4% (311) 4 No 2 No ●Phoenix 93.3% 0.7% (46) 1 Yes 0 Yes ●Police Health 92.2% 11.2% (1487) 2 Yes 0 Yes ●RT Health Fund 93.9% 20.3% (3538) 8 Yes 2 No ●Reserve Bank 92.0% 2.0% (40) 1 Yes 0 Yes ●Transport 92.1% 2.4% (83) 1 Yes 1 No ●TUH 93.5% 4.6% (960) 9 No 2 Yes ●
Below market share?
Smaller Funds (less than 0.5% National Market Share)
Fund Name (Abbreviated)
Member Retention (hospital cover)
Membership Growth %
Number Complaints Received
Below market share?
Number Complaints Investigated
Code of Conduct Member
SERVICE PERFORMANCE - Member Retention & Complaints
Fund Name (Abbreviated)
Member Retention (hospital cover)
Membership Change %
(number)
Complaints % compared to Market Share % Code of Conduct Member

Hospital Cover This table contains information allowing a comparison of some general coverage of health insurance for private hospital treatment (hospital cover) provided by each fund. Hospital cover provides benefits to cover (or partly cover): • hospital fees for accommodation, operating
theatre charges and other charges by private hospitals (or public hospitals for treatment as a private patient);
• the costs of drugs or prostheses required for hospital treatment; and
• the fees charged by doctors (surgeons, anaesthetists etc) for hospital treatment of private patients.
Most funds offer a choice of different products providing hospital cover. These products may differ on the basis of the range of treatments that are covered in full or partly, the level of excess or co-payments required, price and discounts available. Hospital Charges Covered This column indicates what proportion of total charges associated with treatment of private patients are covered by each fund’s benefits. This includes charges for hospital accommodation, theatre costs, prostheses and specialist fees (not including the Medicare benefit) and associated benefits. The figures shown are average outcomes across all of each fund’s hospital products. Higher cost products will generally cover a greater proportion of charges than indicated by this average. Cheaper products may cover less. The use of an average figure applying across all of each fund’s products will mean that funds with a high proportion of their membership in lower cost/reduced cover products will have a lower average figure. Information is not provided for some funds in some states, as there are insufficient numbers reported to PHIAC for states in which the fund does not have a large enough membership.
The information provided in this table presents the position taking account of all of each fund’s products. It is not indicative of any individual product offered by the fund but is an average for the total fund membership.
Additional Information on Hospital Cover The separate Health Fund Operations by State (Territory) tables include information on the number of “agreement” hospitals under contract to each fund in each state. For additional information on the medical gap cover provided through hospital covers refer to the separate Medical Gap Cover section. The brochure Health Insurance Choice - Selecting a Health Insurance Product includes important advice on what to consider and what questions to ask when selecting a hospital cover product. It also includes information on government incentives relating to hospital cover such as the Medicare Levy Surcharge Exemption and Lifetime Health Cover. Available from www.phio.org.au or phone 1800 640 695 The www.privatehealth.gov.au website provides information about all private health insurance products available in Australia, including benefits, prices and which hospitals a health fund has agreements with.
18

NSW & ACT VIC QLD WA SA TAS NT
AHM 86.1% 88.1% 87.8% 86.7% 92.6% 91.6% 86.6%AU 87.1% 90.8% 88.4% 87.3% 93.4% 85.7% 87.2%BUPA 84.0% 93.6% 88.1% 88.6% 95.9% 89.7% 90.8%CDH 94.7% 96.3% 90.6% - 88.4% - 93.4%CUA Health 88.9% 94.0% 92.5% 84.3% 96.5% 92.1% 92.7%GMHBA 84.8% 91.1% 85.0% 87.4% 90.4% 92.1% 65.7%GU Corporate 85.1% 86.8% 85.7% 82.2% 91.1% 82.8% 94.3%HBF 85.3% 90.1% 89.4% 93.5% 92.4% 92.1% 92.3%HCF 91.3% 96.4% 94.3% 93.2% 98.3% 96.0% 93.3%Healthguard 91.4% 96.2% 94.7% 94.0% 97.6% 96.1% 92.6%Health Partners 87.2% 93.6% 91.8% 91.0% 96.5% 93.6% 97.3%HIF 87.3% 87.1% 87.8% 91.3% 94.2% 85.4% 88.7%Latrobe 86.2% 93.4% 84.9% 90.1% 92.5% 83.8% 90.4%MBF 84.8% 87.0% 86.5% 85.8% 92.6% 92.3% 87.1%MBF Alliances 85.7% 89.7% 87.6% 86.7% 95.5% 89.5% 93.1%Medibank 87.2% 92.6% 90.1% 90.8% 94.7% 92.2% 89.0%Mildura 90.6% 90.3% 88.1% 77.9% 92.1% 89.0% 49.1%MU 84.6% 85.3% 83.5% 77.6% 90.1% 80.8% 89.1%NIB 84.1% 84.4% 80.4% 80.2% 87.1% 86.3% 81.9%Onemedifund 86.5% 94.6% 92.9% 89.8% 96.2% 94.7% -Peoplecare 88.4% 92.4% 89.8% 85.6% 94.1% 94.7% 89.8%QCH 88.7% 92.2% 89.7% 89.0% 96.5% 95.4% 92.7%St. Luke's 89.1% 93.6% 87.9% 87.9% 96.5% 93.5% 82.4%Westfund 92.5% 97.5% 90.4% 92.7% 98.8% 92.2% 97.9%ACA 93.6% 94.6% 94.7% 94.0% 97.2% 98.0% 100.0%CBHS 89.6% 94.6% 92.6% 92.7% 96.8% 93.6% 94.2%Defence Health 88.8% 94.4% 92.3% 89.7% 96.5% 91.2% 92.1%Doctors' Health 94.7% 95.8% 95.4% 91.3% 94.5% 96.2% 92.8%HCI 93.9% 96.1% 86.8% 92.6% 96.2% 93.1% 86.8%Navy Health 88.9% 93.2% 91.0% 87.9% 97.3% 93.0% 92.0%Phoenix 94.2% 96.2% 94.8% 94.5% 98.4% 96.2% 89.9%Police Health 93.6% 97.3% 93.1% 90.6% 99.0% 92.1% 92.6%RT Health Fund 93.1% 92.0% 93.5% 94.3% 97.0% 98.2% -Reserve Bank 91.7% 98.1% 97.3% 96.6% 99.6% 99.3% 99.6%Teachers Health 90.3% 93.8% 92.2% 91.4% 96.1% 92.7% 93.9%Transport 91.8% 94.9% 94.0% 93.7% 100.0% - -TUH 92.1% 86.4% 91.2% 93.8% 97.5% 84.9% 81.4%
Hospital Cover
% Hospital Related Charges Covered1
Abbreviated name
1 Includes charges for hospital accommodation, theatre costs, prostheses and specialist fees (not including the Medicare benefit) and associated benefits. 19

Medical Gap Cover Information is not provided for some funds in some states, as the numbers are not reported to PHIAC for states in which the fund does not have a large enough membership (in which case, these figures are counted in the state in which a fund has the largest number of members). Fund Gap Schemes and Agreements
Doctors are free to decide, for each individual patient, whether or not to use a particular fund’s gap cover arrangements.
Factors that can affect the acceptance of the scheme by doctors include: - whether the fund has a substantial share of the
health insurance market in a particular state or region;
- the level of fund benefits paid under the gap arrangements (compared with the doctor’s desired fee); and
- the design of the fund’s gap cover arrangements, including any administrative burden for the doctor.
State Based Differences Information is provided on a state basis because the effectiveness of some funds’ gap schemes can differ between states, and these differences are not apparent in the national figures. In some states, funds are able to provide more effective coverage of gaps, because doctors charge less than the national average. In addition, where a doctor’s fee for an in-hospital service is at or below the MBS fee, there will be no gap to the fund member. In the main, this is due to the level of doctors' fees, which vary significantly between different states in Australia, and between regional areas and capital cities. If a health fund’s percentage of services with no gap is higher than that of a fund in another state, it does not necessarily mean the fund’s scheme is more effective, because state-based differences could be the cause. Comparing Different Gap Schemes If a health fund has a higher percentage of services covered at no gap (in the same state/territory) compared with another fund, it is an indicator of a more effective gap scheme in that state. Over the whole fund, it is more likely that a medical service can be provided at no cost to the consumer, but it is no guarantee that a particular doctor will choose to use the fund’s gap scheme. It is also worth noting that gap schemes are funded by membership premiums, and any increases in coverage of medical gaps may place pressure on premiums for all members of that health fund.
% Of Services With No Gaps
The percentage indicated is the proportion of services for which a gap is not payable after the impact of fund benefits, schemes and agreements. % Of Services With No Gap Or Where Known Gap Payment Made This table includes both the percentage of no gap services and what is called “Known Gap” services. Known gap schemes are an arrangement where the insurer pays an additional benefit on the understanding that the provider advises the patient of costs upfront. These tables present the position taking into account all of the fund’s products. It is not indicative of any individual product offered by the fund but is an average for the total fund membership.
“Access Gap” Participants The Access Gap scheme is the gap cover scheme operated by the Australian Health Services Alliance (AHSA) for its member funds. Because the scheme operates in the same way for all of these participant funds, the effectiveness measures are reported for the Access Gap arrangements as a whole. The measures also take account of any MPPAs established by the ASHA for participant funds. List of Access Gap Participants ACA AU CBHS CUA Health Defence Health GU Corporate HCI Healthguard (except WA) Health Partners HIF Navy Onemedifund Peoplecare Phoenix Police Health Reserve Bank RT Health Fund Teachers Fed Transport TUH QCH Westfund
20

NSW & ACT VIC QLD WA SA TAS NT
FUND / GAP SCHEME
AHM 80.6% 81.6% 81.1% 63.6% 78.6% 81.4% 76.3%BUPA 73.4% 90.2% 77.8% 66.9% 95.0% 78.3% 78.1%CDH 83.7% 67.4% 46.0% - 76.2% - 57.1%GMHBA 68.3% 78.0% 65.9% 60.1% 75.8% 65.5% 50.0%HBF 70.4% 69.3% 59.2% 85.9% 78.1% 73.4% 68.0%HCF 88.8% 95.9% 94.2% 86.2% 99.1% 94.3% 92.1%Healthguard 83.3% 84.9% 84.4% 74.8% 93.1% 80.2% 87.3%Latrobe 69.7% 81.4% 49.7% 42.3% 86.8% 77.2% 53.1%MBF 84.2% 86.7% 87.7% 70.2% 95.4% 91.5% 81.1%MBF Alliances 44.7% 30.2% 37.7% 22.0% 38.5% 20.8% 22.9%Medibank 83.9% 88.6% 82.7% 72.2% 93.8% 87.2% 76.2%Mildura 67.9% 70.4% 52.2% 42.9% 75.0% 30.0% -MU 81.8% 79.0% 73.0% 64.8% 79.7% 81.0% 87.3%NIB 75.8% 70.7% 61.3% 55.1% 67.4% 76.4% 50.2%St Lukes 73.6% 75.7% 61.9% 59.7% 78.4% 86.6% 83.6%
Access Gap Participants1 86.2% 84.9% 84.4% 68.8% 93.1% 80.2% 87.3%Total / Industry outcome 83.3% 87.6% 84.4% 79.9% 87.6% 88.4% 78.6%
FUND / GAP SCHEME
AHM 85.5% 88.2% 87.5% 75.5% 81.5% 88.1% 89.6%BUPA 75.8% 92.5% 79.9% 70.6% 96.7% 83.4% 81.5%CDH 94.7% 92.4% 84.7% - 96.8% - 100.0%GMHBA 75.3% 91.3% 71.4% 66.8% 83.8% 81.7% 63.5%HBF 96.9% 97.5% 97.1% 99.0% 99.3% 98.0% 97.0%HCF 88.8% 95.9% 94.2% 86.2% 99.1% 94.3% 92.1%Healthguard 90.4% 89.3% 90.6% 78.3% 95.5% 87.7% 91.1%Latrobe 93.3% 95.8% 89.6% 88.9% 95.6% 100.0% 96.9%MBF 84.2% 86.7% 87.7% 70.2% 95.4% 91.5% 81.1%MBF Alliances 86.8% 85.6% 88.1% 76.5% 98.2% 85.0% 95.5%Medibank 88.2% 93.6% 88.3% 81.1% 98.1% 94.5% 84.4%Mildura 91.4% 92.5% 77.0% 95.2% 81.9% 60.0% -MU 84.7% 84.2% 78.8% 73.0% 81.9% 91.3% 92.2%NIB 75.8% 70.7% 61.3% 55.1% 67.4% 76.4% 50.2%St Lukes 77.4% 81.8% 69.0% 61.8% 84.6% 94.0% 83.6%
Access Gap Participants1 90.4% 89.3% 90.6% 79.3% 95.5% 87.7% 91.1%Total / Industry outcome 85.8% 92.2% 87.7% 92.1% 96.6% 92.6% 83.8%
% of Services with No Gap
Medical Gap Cover
% of Services with No Gap or Where Known Gap Payment Made
21

General Treatment (Extras) Cover General Treatment cover, also known as “Ancillary” or “Extras” cover1, provides benefits to cover (normally partly cover) a range of health related services not provided by a doctor including: • Dental fees and charges; • Optometry: costs of glasses and lenses; • Physiotherapy, chiropractic services and other
therapies including natural and complementary therapies;
• Prescribed medicines not covered by the Pharmaceutical Benefits Scheme.
% Charges Covered, All Services, By State This column indicates what proportion of total charges, associated with ancillary services, is covered by each fund’s benefits. This averages outcomes across all of each fund’s general treatment products and all ancillary services. Higher cost products will generally cover a greater proportion of charges than indicated by this average. Cheaper products may cover less.
1 Known as “Essentials” cover in WA
The information provided in this table presents the position taking into account of all of each fund’s products. It is not indicative of any individual product offered by the fund but is an average for the total fund membership. Further Information For further Information on General Treatment Cover, please visit www.privatehealth.gov.au which provides information about all private health insurance policies available in Australia, including benefits and prices.
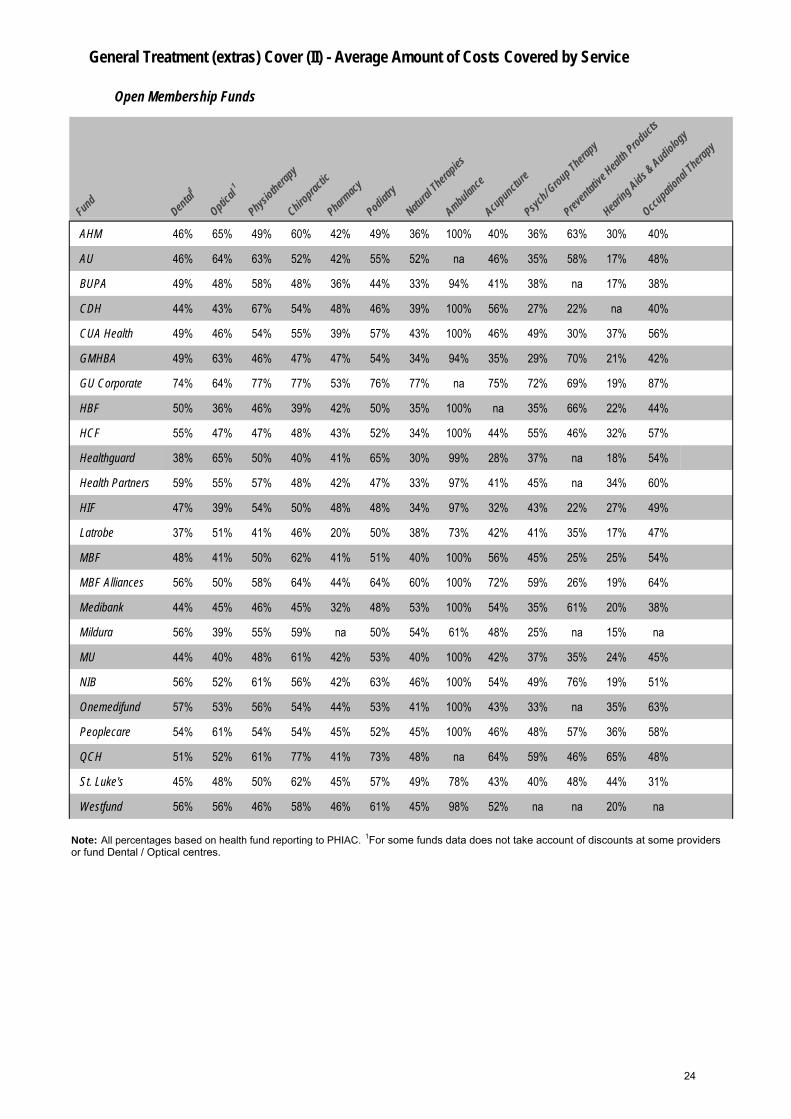
ANCILLARY (EXTRAS) COVER (II) % Costs Covered for each Service Type This additional table provides information on the proportion of the total charge for each service type covered by each fund on average (across all of the fund’s ancillary products). This is intended to provide a broad comparative indicator of fund ancillary benefits to allow comparisons between funds and should not be regarded as an indicator of how much of a bill for any particular service will be covered. In general, this will understate the proportion of an ancillary bill that will be covered for the most common (lower cost services) and will overstate the proportion of the costs covered for some higher cost services. Ambulance Some funds do not provide ambulance cover through any of their ancillary products but offer this as a component of hospital cover. These funds show as 0% under the ambulance column. Most ambulance services in Queensland and Tasmania are provided free to residents of those states.
PREFERRED PROVIDERS FOR EXTRAS SERVICES Many funds establish “preferred provider” or “participating provider” arrangements with some suppliers of extras (general treatment) services. Those providers offer an agreed charge for fund members, resulting in lower out of pocket costs for members after fund benefits are taken into account. It is usually worth checking with your fund to see if a suitable preferred provider is available. FUND DENTAL AND EYECARE CENTRES In some states, some funds operate their own dental and optical centres. These are usually only located in capital cities or major population centres. Consumers who choose to use a fund’s own dental or optical centres will normally get services at a much lower out of pocket cost.
22

NSW & ACT VIC QLD WA SA TAS NT
AHM 48.4% 48.6% 47.7% 47.8% 50.3% 46.8% 47.6%AU 47.5% 50.5% 50.0% 49.9% 52.5% 48.3% 46.3%BUPA 54.5% 46.0% 44.3% 47.9% 51.4% 38.2% 43.7%CDH 43.3% 42.8% 44.2% 45.6% 50.4% 49.1% 42.8%CUA Health 48.7% 50.6% 48.6% 42.6% 61.8% 48.5% 44.9%GMHBA 48.1% 51.0% 48.6% 51.4% 51.0% 45.3% 46.3%GU Corporate 70.4% 73.9% 71.1% 76.9% 74.6% 72.2% 79.0%HBF 38.7% 42.3% 39.0% 47.6% 43.9% 39.5% 43.7%HCF 50.7% 51.9% 51.7% 49.3% 57.3% 47.5% 47.2%Healthguard 46.9% 47.3% 37.1% 46.9% 45.5% 43.6% 40.3%Health Partners 41.8% 47.1% 46.8% 52.5% 57.1% 44.0% 47.1%HIF 44.0% 45.3% 45.3% 47.0% 45.2% 46.2% 46.0%Latrobe 37.0% 41.5% 39.4% 39.8% 43.8% 35.6% 35.5%MBF 45.0% 48.4% 46.9% 49.1% 52.9% 46.5% 45.3%MBF Alliances 60.2% 58.2% 53.8% 51.6% 54.9% 52.0% 47.3%Medibank 45.7% 44.3% 45.4% 44.5% 50.5% 47.0% 42.2%Mildura 53.0% 52.9% 50.4% 49.8% 53.7% 56.6% 48.0%MU 44.4% 48.1% 46.1% 46.3% 50.0% 44.4% 45.9%NIB 52.7% 61.9% 56.2% 60.7% 62.9% 56.7% 51.3%Onemedifund 53.3% 55.2% 53.4% 53.1% 55.9% 58.2% 0.0%Peoplecare 55.1% 55.1% 52.5% 51.1% 56.9% 54.7% 53.0%QCH 52.9% 58.2% 54.8% 53.4% 59.9% 51.5% 51.4%St. Luke's 55.0% 48.1% 48.8% 47.6% 63.3% 46.6% 38.7%Westfund 55.4% 48.3% 54.6% 53.5% 51.9% 43.1% 60.2%ACA 60.0% 60.4% 61.6% 60.8% 62.4% 59.8% 63.7%CBHS 48.9% 52.7% 50.9% 52.0% 54.3% 50.1% 51.5%Defence Health 43.7% 48.9% 46.0% 45.4% 49.6% 45.7% 45.1%Doctors' Health 47.2% 48.5% 50.1% 49.1% 47.8% 57.4% 48.7%HCI 49.2% 58.0% 53.9% 55.0% 47.0% 53.1% 52.1%Navy Health 45.0% 51.5% 48.0% 47.0% 52.1% 48.4% 42.1%Phoenix 53.2% 56.1% 56.0% 53.6% 56.4% 57.9% 53.4%Police Health 64.9% 69.6% 67.5% 67.4% 70.8% 65.3% 68.4%RT Health Fund 50.9% 53.7% 51.6% 50.8% 56.7% 55.7% 43.8%Reserve Bank 73.6% 74.3% 80.3% 79.4% 84.6% 68.6% -Teachers Health 53.5% 53.6% 53.1% 52.7% 56.3% 53.4% 50.9%Transport 50.2% 64.7% 50.2% 52.9% 54.6% 70.4% 59.1%TUH 45.8% 44.5% 52.7% 44.3% 51.9% 41.5% 46.0%
General Treatment (extras) Cover
% General Treatment (extras) Charges CoveredAbbreviated name
23
General Treatment (extras) Cover (II) - Average Amount of Costs Covered by Service
Open Membership Funds
FundDental
1
Optical 1
Physiothera
py
Chiroprac
tic
Pharmacy
Podiatry
Natural
Therapies
Ambulance
Acupuncture
Psych/ G
roup Therapy
Preventati
ve Heal
th Products
Hearing Aids &
Audiology
Occupatio
nal Thera
py
AHM 46% 65% 49% 60% 42% 49% 36% 100% 40% 36% 63% 30% 40%
AU 46% 64% 63% 52% 42% 55% 52% na 46% 35% 58% 17% 48%
BUPA 49% 48% 58% 48% 36% 44% 33% 94% 41% 38% na 17% 38%
CDH 44% 43% 67% 54% 48% 46% 39% 100% 56% 27% 22% na 40%
CUA Health 49% 46% 54% 55% 39% 57% 43% 100% 46% 49% 30% 37% 56%
GMHBA 49% 63% 46% 47% 47% 54% 34% 94% 35% 29% 70% 21% 42%
GU Corporate 74% 64% 77% 77% 53% 76% 77% na 75% 72% 69% 19% 87%
HBF 50% 36% 46% 39% 42% 50% 35% 100% na 35% 66% 22% 44%
HCF 55% 47% 47% 48% 43% 52% 34% 100% 44% 55% 46% 32% 57%
Healthguard 38% 65% 50% 40% 41% 65% 30% 99% 28% 37% na 18% 54%
Health Partners 59% 55% 57% 48% 42% 47% 33% 97% 41% 45% na 34% 60%
HIF 47% 39% 54% 50% 48% 48% 34% 97% 32% 43% 22% 27% 49%
Latrobe 37% 51% 41% 46% 20% 50% 38% 73% 42% 41% 35% 17% 47%
MBF 48% 41% 50% 62% 41% 51% 40% 100% 56% 45% 25% 25% 54%
MBF Alliances 56% 50% 58% 64% 44% 64% 60% 100% 72% 59% 26% 19% 64%
Medibank 44% 45% 46% 45% 32% 48% 53% 100% 54% 35% 61% 20% 38%
Mildura 56% 39% 55% 59% na 50% 54% 61% 48% 25% na 15% na
MU 44% 40% 48% 61% 42% 53% 40% 100% 42% 37% 35% 24% 45%
NIB 56% 52% 61% 56% 42% 63% 46% 100% 54% 49% 76% 19% 51%
Onemedifund 57% 53% 56% 54% 44% 53% 41% 100% 43% 33% na 35% 63%
Peoplecare 54% 61% 54% 54% 45% 52% 45% 100% 46% 48% 57% 36% 58%
QCH 51% 52% 61% 77% 41% 73% 48% na 64% 59% 46% 65% 48%
St. Luke's 45% 48% 50% 62% 45% 57% 49% 78% 43% 40% 48% 44% 31%
Westfund 56% 56% 46% 58% 46% 61% 45% 98% 52% na na 20% na
Note: All percentages based on health fund reporting to PHIAC. 1For some funds data does not take account of discounts at some providers or fund Dental / Optical centres.
24

General Treatment (extras) Cover (II) - Average Amount of Costs Covered by Service
Restricted Membership Funds
FundDental
1
Optical 1
Physiothera
py
Chiroprac
tic
Pharmacy
Podiatry
-tural
Therapies
Ambulance
Acupuncture
Psych/ G
roup Therapy
Preventat
ive Heal
th Products
Hearing Aids &
Audiology
Occupatio
-l Thera
py
ACA 64% 59% 60% 64% 52% 74% 36% 100% 42% 38% na 43% 69%
CBHS 50% 49% 58% 64% 52% 57% 49% 95% 53% 56% 25% 38% 46%
Defence Health 47% 41% 48% 52% 50% 48% 40% 100% 41% 40% 45% 26% 44%
Doctors' Health 49% 56% 49% na 47% 55% na na na 58% na 12% 37%
HCI 54% 49% 56% 63% 52% 63% 53% 100% 48% 45% 57% 51% 63%
Navy Health 47% 43% 54% 58% 49% 50% 49% 100% na 40% na 20% 47%
Phoenix 60% 49% 60% 55% 45% 60% 34% 100% 50% 49% na 40% 64%
Police Health 68% 66% 77% 78% 48% 70% 44% 100% 74% 77% na 30% 67%
RT Health Fund 48% 50% 59% 71% 49% 66% 45% 100% 70% 35% na 33% 50%
Reserve Bank 75% 72% 79% 81% 60% 84% 80% 100% 78% 83% na 70% 81%
Teachers Health 56% 48% 57% 60% 47% 61% 56% 99% 60% 42% 38% 35% 65%
Transport 73% 57% 52% 57% 42% 62% 42% 99% 47% 38% 63% 26% 39%
TUH 53% 46% 58% 62% 42% 68% 54% na 51% 51% 59% 33% 56%
Note: All percentages based on health fund reporting to PHIAC. 1.For some funds data does not take account of discounts at some providers or fund Dental/Optical centres.
25

Financial Management of Health Funds The Regulation of Health Fund Finances The financial performance of health funds is closely regulated to ensure that funds remain financially viable and that contributors’ funds are protected. The Private Health Insurance Act 2007 (the Act) specifies solvency and capital adequacy standards for funds to meet and outlines financial management and reporting requirements for all funds. The Act also establishes the Private Health Insurance Administration Council (PHIAC) – an independent organisation with responsibility for monitoring the financial performance of the funds and ensuring that they meet prudential requirements. PHIAC produces an annual publication providing financial and operational statistics for the funds for each financial year1. Information included in the Financial Performance table is drawn from data collected by PHIAC for that purpose. Benefits as a % of Contributions This column shows the percentage of total contributions, received by the fund, returned to contributors in benefits. Funds will generally aim to set premium levels so that contribution income covers the expected costs of benefits plus the fund’s administration costs. A very high percentage of contributions returned as benefits may not necessarily be a positive factor for consumers, particularly if it means that the fund is making a loss on its health insurance business. This indicator should therefore be considered in conjunction with other factors, such as the Surplus (-Loss) and Management Expenses ratings. Management Expenses Management expenses are the costs of administering the fund. They include rent, staff salaries, marketing costs, etc. As a % of Contribution Income This figure is regarded as a key measure of fund efficiency. In this table management expenses are shown as a proportion of total fund contributions.
1 Operations of the Private Health Insurers. This report is available on the PHIAC website: www.phiac.gov.au
Per Average Policy A comparison of the relative amount each fund spends on administration costs is also demonstrated through provision of information on the level of management expenses per membership by each fund. On average, restricted membership funds have lower management expenses as a proportion of benefits paid, compared to open membership funds. This is partially due to lower expenditure on marketing. However, unusually low management expenses by some restricted membership funds can also be the result of those funds receiving free or subsidised administrative services from the organisations with which they are associated. Surplus (- Loss) from Health Insurance The surplus or loss (indicated as a negative figure) made by the fund in 2007-2008 from their health insurance business is expressed as a percentage of the fund’s contribution income. This does not take account of additional income that the fund may derive from investment or other (non health insurance) activities. All health funds maintain a sufficient level of reserves to cover losses from year to year. However, funds with high or continuing losses might be expected to have to increase premiums by a relatively higher amount than other funds. Overall Profit (-Loss) as a % of Total Revenue The overall profit or loss (indicated as a negative figure) takes account of additional income made by the fund, mainly through investment. This is shown as a % of all revenue received by the fund to allow a comparison of performance between funds of differing sizes. Overall profit takes into account tax that is paid for a small amount of funds. Not for Profit Insurer If a health insurer is listed 'not-for-profit', this means it is a mutual organisation, with the premiums paid into the fund used to operate the business and cover benefits for members. 'For-profit' insurers aim to return a profit to their owners (which may be another health insurer or corporation) or shareholders. They are still required to maintain sufficient funds to operate the company and pay benefits to their members.
26

as % of Contribution
Income
Per Average Policy
AHM 86.1% 12.8% $332 1.1% 3.7% NoAU 85.5% 9.9% $234 4.6% 2.4% NoBUPA 86.1% 9.4% $249 4.5% 5.1% NoCDH 85.6% 12.0% $316 2.4% 2.5% YesCUA Health 86.0% 11.2% $305 2.8% 6.3% YesGMHBA 87.9% 9.6% $223 2.5% 4.1% YesGU Corporate 76.1% 12.6% $516 11.3% 7.5% NoHBF 88.3% 10.0% $212 1.7% -15.8% YesHCF 89.4% 7.8% $196 2.8% 1.9% YesHealthguard 82.2% 10.0% $271 7.8% -11.2% YesHealth Partners 92.8% 9.5% $243 -2.3% -1.8% YesHIF 80.9% 11.9% $286 7.2% 9.7% YesLatrobe 84.8% 10.2% $245 5.0% 12.5% YesMBF 85.8% 12.7% $325 1.5% 3.7% NoMBF Alliances 82.5% 8.8% $236 8.7% 7.4% NoMedibank 87.1% 9.3% $217 3.6% 2.5% Yes*Mildura 86.6% 7.7% $141 5.7% 14.5% YesMU 83.4% 17.5% $521 -1.0% 2.1% NoNIB 85.3% 9.9% $219 4.8% 5.1% NoOnemedifund 78.1% 13.2% $446 8.7% 8.4% NoPeoplecare 87.8% 9.0% $274 3.2% 3.5% YesQCH 80.0% 10.3% $348 9.7% 12.1% YesSt. Luke's 83.7% 10.9% $298 5.4% 9.0% YesWestfund 87.3% 10.9% $245 1.8% 2.9% YesACA 88.4% 7.0% $241 4.6% 8.1% YesCBHS 91.0% 5.9% $164 3.1% 4.7% YesDefence Health 89.6% 6.0% $155 4.5% 2.9% YesDoctors' Health 84.7% 14.9% $504 0.4% 8.1% YesHCI 86.0% 13.2% $362 0.8% 7.0% YesNavy Health 82.2% 9.4% $271 8.4% 7.4% YesPhoenix 88.8% 7.9% $246 3.3% 7.0% YesPolice Health 93.3% 7.5% $258 -0.8% -0.6% YesRT Health Fund 89.4% 13.2% $372 -2.6% 0.5% YesReserve Bank 91.1% 1.2% $42 7.7% 11.2% YesTeachers Health 90.7% 7.0% $200 2.3% 3.8% YesTransport 92.8% 8.0% $206 -0.8% 5.0% YesTUH 85.8% 11.3% $396 2.9% 3.9% Yes*Medibank converted to for-profit status on 1 October 2009
Financial Management of Health Funds
Surplus ( -Loss) from
Health Insurance
Not for Profit
Insurer
Management Expenses
Abbreviated name
Benefits as %
Contribut-ions
Overall Profit(-Loss)
as % Total Revenue
27
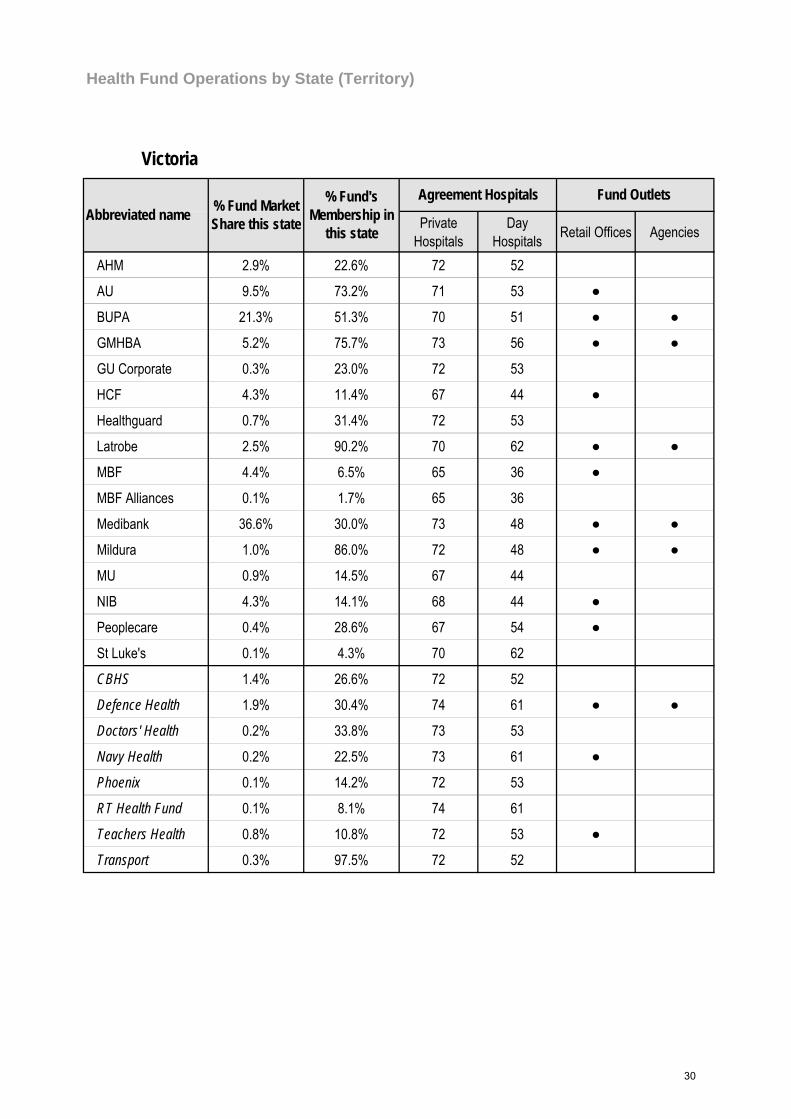
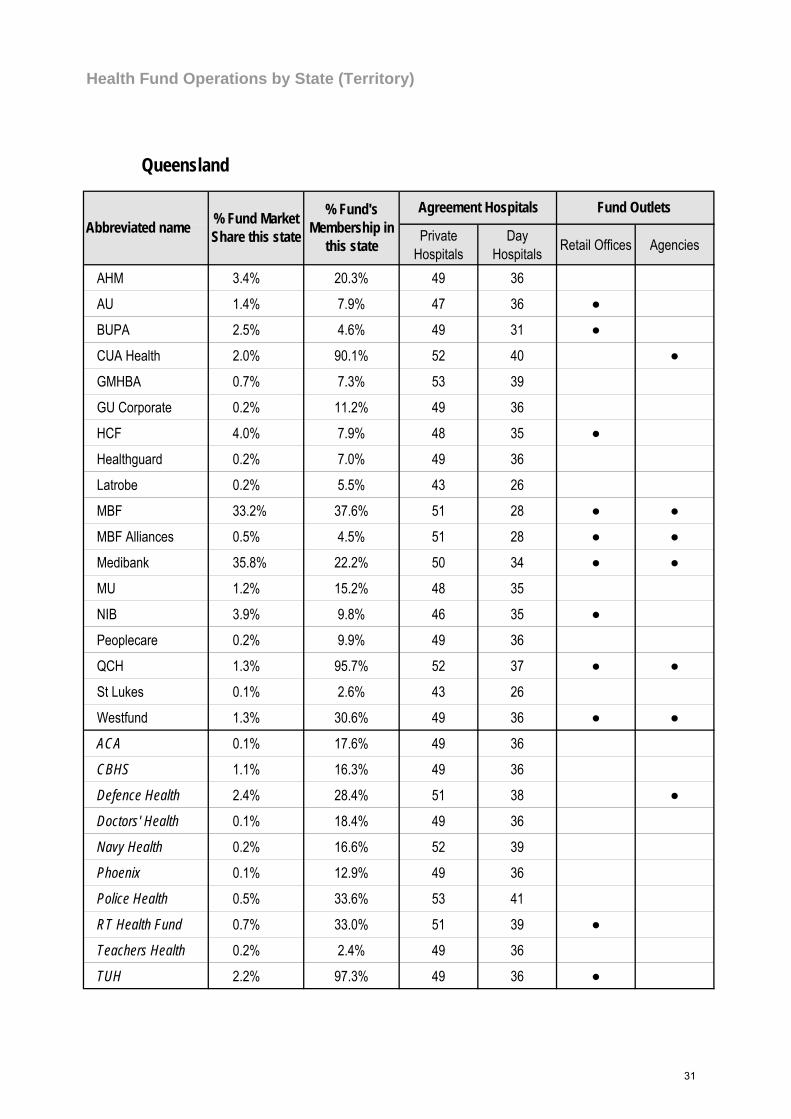
Health Fund Operations by State (Territory) Some funds have little presence in most states but may have a large market share in one state or territory. Some funds use different brand names or offer different products in different states and territories. These separate tables for each state/territory are therefore provided to give an indication of the extent and importance of each fund’s business in each state or territory. Only those funds with a significant operation in the state/territory are listed in the relevant table. Most funds now have websites where members can view information, join or change their product and submit claims. Links to all health fund websites are available at www.privatehealth.gov.au. Percentage Market Share This column indicates how much of the total health insurance business within each state/territory each fund accounts for. It is an indicator of the size and significance of each fund within each state. Funds with a significant market share in the relevant state/territory can normally be expected to have more extensive networks of branch offices, agencies, agreement hospitals and preferred ancillary providers in those states/territories. They are also more likely to obtain the participation of doctors in their gap cover arrangements. However, funds participating in the Australian Health Services Alliance (AHSA) will generally have access to a wide range of agreement hospitals in all states. The Access Gap scheme operated by the AHSA also has a high level of acceptance from doctors in all states. Percentage of Fund’s Membership in State This column indicates how much of each fund’s health insurance membership is within each state. It is an indicator of how significant that state is to each fund’s health insurance business. In general, funds can be expected to design their products (benefits, conditions, contracts etc) to suit the arrangements applying in the states in which they do a significant proportion of business. However, some nationally based funds tailor their products and prices to take account of different state arrangements. Health fund costs differ from state to state, which accounts for the variation in premiums across states. Agreement Hospitals1 All health funds establish agreements with some (or all) private hospitals and day hospitals for the treatment of their members. These agreements 1 Number of hospitals as shown on www.privatehealth.gov.au website 10 January 2010
generally provide for the fund to meet all of the private hospital’s charges for treatment of the fund’s members. The member would then not be required to pay any amount to the hospital, other than any agreed excess or co-payment and any incidental charges that may apply for certain extra services (e.g. television rental).2 Where a fund has a comparatively low number of agreements with private hospitals or private day hospitals, this is an indicator that consumer choice (as to where to be treated) may be more limited. Treatment at a non-agreement hospital will mean a significantly higher out of pocket cost for the patient. While funds do not have agreements with particular public hospitals, all funds will fully cover hospital costs for treatment as a private patient in a public hospital (unless the particular treatment is excluded under the individual’s policy or there is an extra charge for a private room, etc). Fund Outlets – Retail Offices Retail offices are full-service offices operated by health funds with staff employed by the fund. At each retail office fund members (or prospective members) should expect to be able to: • Receive advice about the range of products and
services provided by the fund • Obtain a quote for any of the fund’s
products/services • Obtain and lodge an application to join any of the
fund’s tables/products • Obtain a “cover note” if necessary • Make a personal inquiry about their membership
(contributions, payment arrangements, benefits) • Make a claim for any ancillary benefits payable
on a “refund” basis and have that claim processed and/or paid.
The table indicates whether the fund operates retail offices in the state/territory. Fund Outlets – Agencies Agencies are generally limited service outlets operated by the fund or under arrangements with pharmacies, credit unions, etc. At these agency outlets, members can obtain brochure material and make some transactions but generally can’t have a personal inquiry about their membership finalised or have claims processed on the spot. The table shows whether the fund has agencies in the state/territory.
2 These agreements do not apply to fees charged by private specialist doctors for in-hospital treatment. However, such fees may be covered by a fund’s gap scheme arrangements.
28

Private Hospitals
Day Hospitals Retail Offices Agencies
AHM 4.0% 47.5% 83 80 ●
AU 1.1% 12.6% 83 80 ●
BUPA 1.7% 6.1% 78 58 ●
CDH 0.1% 87.7% 75 40 ●
GMHBA 0.2% 5.5% 89 82
GU Corporate 0.4% 44.3% 83 80
HCF 19.4% 76.7% 83 88 ● ●
Healthguard 0.1% 8.7% 83 80 ●
MBF 19.9% 44.8% 82 70 ● ●
MBF Alliances 2.1% 40.1% 82 70 ● ●
Medibank 23.3% 28.8% 82 72 ● ●
Mildura 0.1% 10.9% 75 41 ●
MU 2.5% 62.7% 84 85
NIB 14.7% 72.9% 87 75 ●
Peoplecare 0.5% 52.8% 84 81 ●
Westfund 1.5% 67.4% 83 80 ● ●
ACA 0.1% 60.9% 83 80 ●
CBHS 1.5% 44.2% 83 80 ●
Defence Health 1.1% 25.2% 87 85 ●
Doctors' Health 0.1% 43.3% 82 80 ●
Navy Health 0.3% 44.3% 84 83
Phoenix 0.2% 51.4% 83 80 ●
RT Health Fund 0.6% 56.9% 86 79 ●
Reserve Bank 0.1% 58.9% 86 84 ●
Teachers Health 4.0% 80.8% 83 80 ●
Health Fund Operations by State (Territory)
Fund Outlets Agreement Hospitals
NSW & ACT
Abbreviated name % Fund Market Share this state
% Fund's Membership in
this state
29
Private Hospitals
Day Hospitals Retail Offices Agencies
AHM 2.9% 22.6% 72 52
AU 9.5% 73.2% 71 53 ●
BUPA 21.3% 51.3% 70 51 ● ●
GMHBA 5.2% 75.7% 73 56 ● ●
GU Corporate 0.3% 23.0% 72 53
HCF 4.3% 11.4% 67 44 ●
Healthguard 0.7% 31.4% 72 53
Latrobe 2.5% 90.2% 70 62 ● ●
MBF 4.4% 6.5% 65 36 ●
MBF Alliances 0.1% 1.7% 65 36
Medibank 36.6% 30.0% 73 48 ● ●
Mildura 1.0% 86.0% 72 48 ● ●
MU 0.9% 14.5% 67 44
NIB 4.3% 14.1% 68 44 ●
Peoplecare 0.4% 28.6% 67 54 ●
St Luke's 0.1% 4.3% 70 62
CBHS 1.4% 26.6% 72 52
Defence Health 1.9% 30.4% 74 61 ● ●
Doctors' Health 0.2% 33.8% 73 53
Navy Health 0.2% 22.5% 73 61 ●
Phoenix 0.1% 14.2% 72 53
RT Health Fund 0.1% 8.1% 74 61
Teachers Health 0.8% 10.8% 72 53 ●
Transport 0.3% 97.5% 72 52
Health Fund Operations by State (Territory)
Fund Outlets Agreement Hospitals
Victoria
Abbreviated name % Fund Market Share this state
% Fund's Membership in
this state
30
Private Hospitals
Day Hospitals Retail Offices Agencies
AHM 3.4% 20.3% 49 36
AU 1.4% 7.9% 47 36 ●
BUPA 2.5% 4.6% 49 31 ●
CUA Health 2.0% 90.1% 52 40 ●
GMHBA 0.7% 7.3% 53 39
GU Corporate 0.2% 11.2% 49 36
HCF 4.0% 7.9% 48 35 ●
Healthguard 0.2% 7.0% 49 36
Latrobe 0.2% 5.5% 43 26
MBF 33.2% 37.6% 51 28 ● ●
MBF Alliances 0.5% 4.5% 51 28 ● ●
Medibank 35.8% 22.2% 50 34 ● ●
MU 1.2% 15.2% 48 35
NIB 3.9% 9.8% 46 35 ●
Peoplecare 0.2% 9.9% 49 36
QCH 1.3% 95.7% 52 37 ● ●
St Lukes 0.1% 2.6% 43 26
Westfund 1.3% 30.6% 49 36 ● ●
ACA 0.1% 17.6% 49 36
CBHS 1.1% 16.3% 49 36
Defence Health 2.4% 28.4% 51 38 ●
Doctors' Health 0.1% 18.4% 49 36
Navy Health 0.2% 16.6% 52 39
Phoenix 0.1% 12.9% 49 36
Police Health 0.5% 33.6% 53 41
RT Health Fund 0.7% 33.0% 51 39 ●
Teachers Health 0.2% 2.4% 49 36
TUH 2.2% 97.3% 49 36 ●
Health Fund Operations by State (Territory)
Fund Outlets Agreement Hospitals
Queensland
Abbreviated name % Fund Market Share this state
% Fund's Membership in
this state
31

Private Hospitals Day Hospitals Retail Offices Agencies
AHM 0.7% 2.9% 18 10AU 0.4% 1.5% 18 10BUPA 1.3% 1.7% 15 13 ●GMHBA 1.3% 9.9% 22 13 ● ●GU Corporate 0.4% 17.6% 18 10HBF 60.9% 97.6% 25 12 ● ●HCF 0.8% 1.1% 5 3Healthguard 2.0% 50.9% 18 10 ● ●HIF 3.5% 95.1% 18 10 ● ●MBF 3.0% 2.3% 15 12 ●MBF Alliances 2.1% 13.9% 15 12 ●Medibank 20.4% 8.8% 23 10 ● ●MU 0.4% 3.3% 6 5NIB 0.7% 1.2% 18 7Peoplecare 0.1% 3.7% 20 10CBHS 0.6% 5.9% 18 10Defence Health 0.5% 4.6% 22 11 ●Navy Health 0.2% 9.2% 22 12Police Health 0.2% 10.8% 23 12Teachers Health 0.1% 0.9% 18 10
Private Hospitals Day Hospitals Retail Offices Agencies
AHM 1.5% 4.0% 31 19AU 1.6% 4.2% 31 19BUPA 42.2% 35.3% 30 19 ● ●GMHBA 0.2% 1.1% 29 20GU Corporate 0.1% 2.3% 31 19HCF 2.7% 2.4% 24 15 ●Healthguard 0.1% 1.1% 31 19Health Partners 7.6% 95.9% 31 23 ● ●MBF 4.9% 2.5% 31 20 ●MBF Alliances 9.0% 39.4% 31 20 ●Medibank 22.4% 6.4% 31 18 ● ●Mildura 0.1% 1.7% 22 6MU 0.6% 3.7% 31 19NIB 1.4% 1.6% 25 17 ●Peoplecare 0.2% 4.2% 31 20St. Lukes' 0.1% 1.4% 22 12CBHS 0.7% 5.1% 31 19Defence Health 1.6% 8.7% 31 21 ●Navy Health 0.2% 5.2% 31 20Phoenix 0.2% 16.9% 31 19Police Health 1.5% 45.7% 31 20 ●Teachers Health 0.8% 3.8% 31 19
Abbreviated name % Fund Market Share this state
% Fund's Membership in
this state
Health Fund Operations by State (Territory)
Fund Outlets Agreement Hospitals
Western Australia
Agreement Hospitals Fund Outlets
South Australia
Abbreviated name % Fund Market Share this state
% Fund's Membership in
this state
32

Private Hospitals Day Hospitals Retail Offices Agencies
AHM 3.0% 2.3% 5 2AU 0.6% 0.4% 5 2BUPA 1.2% 0.3% 7 3GMBHA 0.3% 0.4% 7 2HCF 1.2% 0.3% 5 2MBF 35.5% 5.1% 7 3 ● ●
Medibank 35.0% 2.8% 5 2 ● ●
MU 0.2% 0.4% 5 2NIB 0.9% 0.3% 6 2St Luke's 15.3% 88.3% 7 3 ● ●
CBHS 0.9% 1.7% 5 2
Defence Health 0.7% 1.0% 7 2
HCI 2.4% 77.2% 6 2 ●
Navy Health 0.2% 1.4% 6 2
Police Health 0.3% 2.7% 7 2
Teachers Health 0.8% 1.1% 5 2
Retail Offices Agencies
AHM 2.5% 0.6%BUPA 12.0% 0.9% ● ●
GMHBA 0.2% 0.1%HCF 2.1% 0.2%MBF 27.4% 1.2% ●
Medibank 42.7% 1.1% ● ●
MU 0.5% 0.2%NIB 1.3% 0.1%
Defence Health 3.8% 1.8% ●
Navy Health 0.3% 0.9%
Police Health 2.5% 6.4%
Northern Territory
Abbreviated name % Fund Market Share this state
1
1
Health Fund Operations by State (Territory)
11
1
Tasmania
Abbreviated name % Fund Market Share this state
% Fund's Membership in
this state
% Fund's Membership in
this state
Agreement Hospitals
Agreement Hospitals
Private Hospitals
Fund Outlets
Fund Outlets
1
1
11
1
1
33
About the Private Health Insurance Ombudsman
Protecting the interests of people who are covered by private health insurance The Private Health Insurance Ombudsman (PHIO) deals with inquiries and complaints about any aspect of private health insurance. Our office is independent of the private health funds, private and public hospitals and health service providers. We deal with complaints about private health insurance, including private health funds, brokers, hospitals, medical practitioners, dentists or other practitioners. Generally, anyone can make a complaint as long as it relates to private health insurance. What should I do if I want to make a complaint? You should first contact your health fund or the body you’re complaining about – they may be able to resolve your complaint for you. If not, you can contact us in one of the following ways:
• Call: 1800 640 695 (free call from any Australian land line; charges apply for mobile phones). • Write: Private Health Insurance Ombudsman, Level 7, 362 Kent Street, SYDNEY NSW 2000 • Fax: 02 8235 8778 • Email: [email protected]
Please include a clear description of your complaint; the name of your health fund and your membership number; and what you think would resolve the matter for you. We’ll let you know if any other information is needed. What happens after I make a complaint? Many complaints result from misunderstandings. Your PHIO case officer may be able to resolve your complaint by explaining what has happened and why. Otherwise, we’ll contact your health fund or the body you are complaining about to get their explanation and any suggestions they have for fixing the problem. We deal with most complaints by phone, email and fax, and most can be settled quickly. Where complaints are more complex, we will write to the health fund or other body, seeking further information or recommending a certain course of action. Your case officer will keep you regularly informed, usually by telephone. They will give you their name and contact number in case you need to contact them. What if I just want some information about health insurance? We can help with information about private health insurance arrangements:
• Call our Hotline on 1800 640 695; • Email us at [email protected]; or • Check our websites www.phio.org.au and www.privatehealth.gov.au
We also have brochures and publications about private health insurance arrangements which you can find on our website or which we can post on request. Who can I contact if my complaint is about a medical issue or Medicare? Complaints about the quality of service or clinical treatment provided by a health professional or a hospital should be directed to the health care complaints body for your state or territory. These are listed in the state government section of your telephone directory. Complaints about Medicare should be directed to the Commonwealth Ombudsman on 1300 362 072.
34
Private Health Insurance Ombudsman
Your Health Insurance Checklist
Ten tips for avoiding health insurance problems
Consider taking out the highest level of hospital cover you can afford and choosing a higher excess, rather than restrictions or exclusions, to save money on premiums.
Review your Standard Information Statement (SIS) every year. Think about whether your policy will continue to meet your needs over the coming year. This is particularly important if you are thinking about starting a family, or your health needs are changing as you grow older.
Read all of the information your fund sends you carefully. Important information about your cover will be sent in a personalised letter and should not be ignored.
Ensure your premiums are up to date. If you pay by direct debit, check your bank or credit card statements every month to ensure payments are being correctly deducted.
Tell your fund if you change address, add a partner, have a child, or any other circumstance that might affect your cover.
Make sure you understand any waiting periods, restrictions or limits applying to your cover.
Contact your fund before you go to hospital to check whether you will be covered and what costs you may need to pay yourself.
Talk to your doctors about their fees and ask whether they will bill you under your health fund’s gap scheme.
If you decide to change funds, make sure you understand the difference in benefits before changing.
Visit www.PrivateHealth.gov.au for information and advice about private health insurance.
More information can be found in the “Health Insurance Choice” and “Ten Golden Rules” brochures available at www.PrivateHealth.gov.au or from the office of the Private Health insurance Ombudsman.
35

Other consumer publications available from the Private Health Insurance Ombudsman
Protecting the interests
of people covered by
private health insurance


