Embed Size (px)
Citation preview

2017 STATE OFENVIRONMENTAL HEALTH & SAFETY
INDUSTRY SURVEY
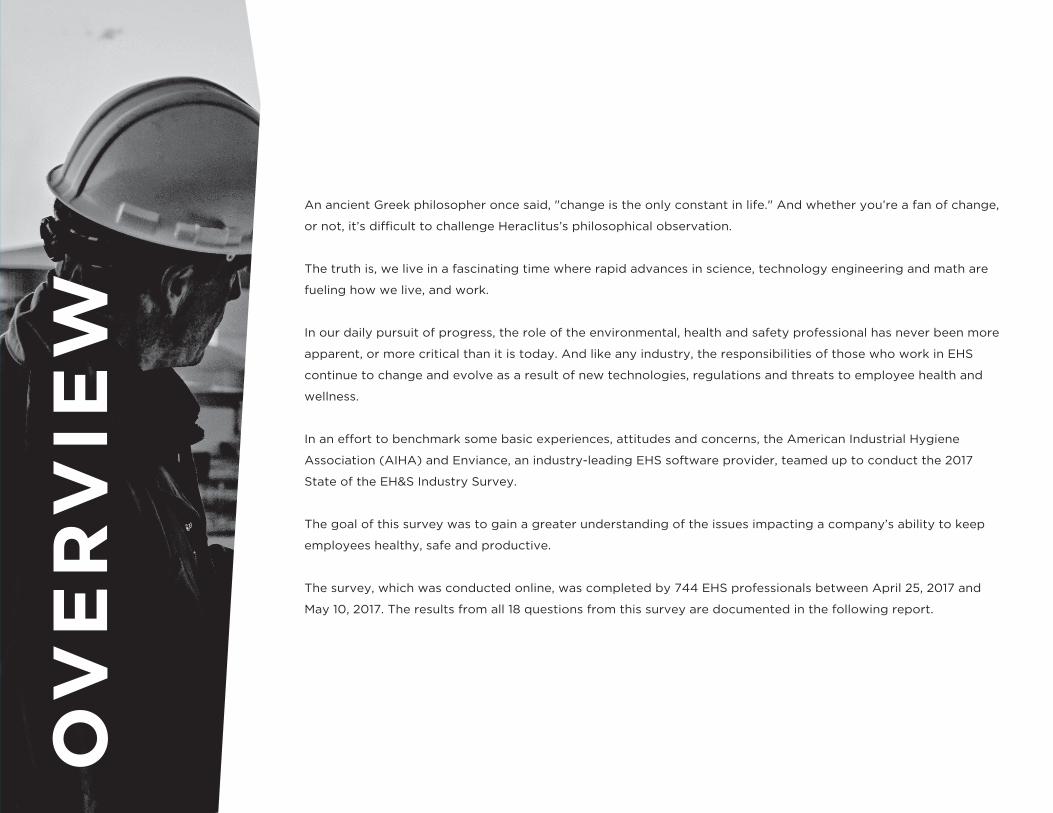
An ancient Greek philosopher once said, "change is the only constant in life." And whether you’re a fan of change,
or not, it’s di�cult to challenge Heraclitus’s philosophical observation.
The truth is, we live in a fascinating time where rapid advances in science, technology engineering and math are
fueling how we live, and work.
In our daily pursuit of progress, the role of the environmental, health and safety professional has never been more
apparent, or more critical than it is today. And like any industry, the responsibilities of those who work in EHS
continue to change and evolve as a result of new technologies, regulations and threats to employee health and
wellness.
In an e�ort to benchmark some basic experiences, attitudes and concerns, the American Industrial Hygiene
Association (AIHA) and Enviance, an industry-leading EHS software provider, teamed up to conduct the 2017
State of the EH&S Industry Survey.
The goal of this survey was to gain a greater understanding of the issues impacting a company’s ability to keep
employees healthy, safe and productive.
The survey, which was conducted online, was completed by 744 EHS professionals between April 25, 2017 and
May 10, 2017. The results from all 18 questions from this survey are documented in the following report.
OV
ER
VIE
W

6.8%
4.0%
9.2%
4.4%
17.0%
58.7%Fewer than 101 employees
101 – 500 employees
501 – 1,000 employees
1,001 – 5,000 employees
5,001 – 10,000 employees
10,001+ employees
COMPANY SIZE(BY EMPLOYEES)
HOW MANY INDIVIDUALS DOES YOUR COMPANY EMPLOY?
The majority of respondents (69.52%) who participated in The 2017 State of EHS Survey represent
companies that employ fewer than 1,000 personnel. Individuals who work for companies that employ less
than 100 personnel represent the largest subsection of this group at 58.7%. Conversely, the second largest
subsection of this survey (17%) is represented by individuals who work for large companies that employee
more than 10,001 personnel.
2017 STATE OFENVIRONMENTAL HEALTH & SAFETY
INDUSTRY SURVEY

INDUSTRY TYPE
WHAT IS THE PRIMARY INDUSTRY (NAICS CODE) YOUR COMPANY SERVES?
(NAICS IS THE ABBREVIATION FOR THE NORTH AMERICAN INDUSTRY CLASSIFICATION SYSTEM)
Representing more than 17 industries, the majority of The 2017
EHS Industry survey participants indicated that they primarily
work in the Professional, Scientific & Technical Services (20.3%),
General Manufacturing (15.8%) and Chemical Manufacturing
(7.4%) industries. Collectively, these 3 industries represented
43.57% of all survey respondents.
2017 STATE OFENVIRONMENTAL HEALTH & SAFETY
INDUSTRY SURVEY
0.1%
0.9%
1.0%
1.3%
1.6%
1.8%
2.6%
2.6%
3.2%
3.4%
3.5%
4.1%
4.1%
7.4%
8.2%
15.8%
18.1%
20.3%
4441 – Building Materials
3391 – Medical Devices
311 – Consumer Products
2211 – Electric power generation,transmission and distribution
5417 – Biotechnology
21 – Mining
3364 – Aerospace & Defense
48 - 49 – Transportation & Warehousing
211 – Oil and gas extraction
23 – Construction
22 – Utilities
3254 – Pharmaceutical
92 – Public Administration
325 – Chemical Manufacturing
61 – Educational Services
31-33 – Manufacturing
Other
54 – Professional, Scientificand Technical Services

PROFESSIONAL AFFILIATIONS
WITH WHICH OF THE FOLLOWINGORGANIZATIONS DO YOU HOLD MEMBERSHIP?
Out of the 744 completed surveys, 94.3% of respondents
indicated that they are a member of a professional
organization. With the majority of respondents (72.3%)
belonging to the American Industrial Hygiene
Association (AIHA), The American Society of Safety
Engineers (ASSE) came in as the second most popular
professional association with 30.10% of participants
indicating that have an active membership.
2017 STATE OFENVIRONMENTAL HEALTH & SAFETY
INDUSTRY SURVEY
22..8800%% 22..8800%% 33..9900%%
77..1100%%99..9900%%
1199..1100%%
3300..1100%%
3344..4400%%
7722..3300%%
American Chemistry Council (ACC)
National Association of Environmental
Management (NAEM)
Alliance of Hazardous Materials
Professionals (AHMP)
National Fire Protection
Association (NFPA)
National Safety Council (NSC)
American Conference of Governmental
Industrial Hygienists (ACGIH)
American Society of Safety Engineers
(ASSE)
Other American Industrial Hygiene Association
(AIHA)

1100%%
88%%5 years or less
1100%%6 –10 years
11 –15 years
1111%%16 – 20 years
1111%%21 –25 years
1177%%26 – 30 years
3333%%Over 30 years
PROFESSIONAL EXPERIENCE
HOW LONG HAVE YOU WORKEDIN THE ENVIRONMENTAL, HEALTH& SAFETY INDUSTRY?
Overall, the 2017 State of the EHS
survey attracted the participation of a
more experienced group of
professionals. This is supported by the
following graphs. As shown on the
graph to the right, we analyzed the
results of the question, “How long have
you worked in the Environmental,
Health & Safety Industry." As you see,
the majority of respondents (72.85%)
claim to have worked in the EHS field
for more than 16 years. On the contrary,
only 8% of respondents indicated that
they’ve been working the in the EHS
industry less than 5 years.
2017 STATE OFENVIRONMENTAL HEALTH & SAFETY
INDUSTRY SURVEY

JOB TITLE
WHAT IS YOUR POSITION WITHIN YOUR ORGANIZATION?
The majority of respondents indicated that they were either a Manager/Director (42.5%).
2017 STATE OFENVIRONMENTAL HEALTH & SAFETY
INDUSTRY SURVEY
Graduate/Trainee
Manager/Director Branch/Division/Regional Manager/Supervisor
Sta�/Engineer Consultant
42.5%
25.5% 19%
11.5%
1.5%

58.6%
6.8%
4.0%
9.2%
4.4%
17.0% Fewer than 100 employees
101 – 500 employees
501 – 1,000 employees
1,001 – 5,000 employees
5,001 – 10,000 employees
10,000+ employees
4.8%6.4%
40.4%
48.4%
25+ employees
11 – 24 employees
1 –10 employees
0 employees
STAFF SIZE
NUMBER OF STAFF YOU SUPERVISE?
It would appear that the size of the company has a direct correlation on the number of professionals who
work in the EHS department, and are managed by senior sta�ers. When asked, “What is the number of sta�
you supervise,” 48.4% of respondents identified that they did not manage anyone. Knowing that 58.6% of
respondents indicated that the company they represent has less than 100 employees, it can be determined
that smaller companies typically have smaller EHS departments.
2017 STATE OFENVIRONMENTAL HEALTH & SAFETY
INDUSTRY SURVEY

9.5%
12.2%
13.1%
40.1%
42.1%
52.4%
52.7%
53.3%
57.3%
72.6%
76.9%
78.9%
81.5%
84.0%
Energy & carbon management
Product liability
Other
Environmental compliance – air, water, waste
Environmental auditing/inspections
Chemical management
Incident management
Emergency preparedness
Program management
Safety auditing/inspections
Industrial hygiene surveys
Job hazard/Risk assessment
Training
Hazard identification/assessment
In an e�ort to gain better insight into the day-to-day operation of an EHS worker, we asked survey participants to
identify all of their responsibilities. As companies from across industries continue to implement a culture of safety,
it’s reassuring to see that the primary responsibilities identified were Hazard Identification (84%), Training (81.5%)
and Job Hazard/Risk Analysis (78.9%).
KEY RESPONSIBILITIES 2017 STATE OFENVIRONMENTAL HEALTH & SAFETY
INDUSTRY SURVEY

49.7%Satisfied
23.1%Very Satisfied
16.6%Neither Satisfied or Dissatisfied
8.7%Dissatisfied
1.8%Very Dissatisfied
59.2%Similarly Secure
22.0%More Secure
18.7%Less Secure
JOB SATISFACTION & SECURITY 2017 STATE OFENVIRONMENTAL HEALTH & SAFETY
INDUSTRY SURVEY
Despite wearing many hats, more
than half of the EHS professionals
who completed the survey
indicated that they were either
“Satisfied” (49.7%) or “Very
Satisfied” (23.1%) with their job.
(See Chart 9 for Results.)
When respondents were asked to rate their
job security compared to two years ago
based on current socio-economic
conditions, 59.2% indicated that they felt
similarly secure. An additional 22% felt that
they their job was even more secure now
than it was two years ago.
JOB SATISFACTION
JOB SECURITY

3.2% 3.7%4.1%
5.2%
5.5%
13.5%
16.1%20.0%
28.7%
Noise and vibrations
Fires and/or explosions
Confined spaces
Electrical hazards
Indoor air quality
Chemical management
Ergonomic stressors
Exposure to toxic chemicals
Other (please specify)
AREAS OF CONCERN
On the path to protecting people, profit and planet, it’s no surprise to find that today’s EHS professionals
have a lot of responsibilities on their plate. With increased responsibilities, EHS professionals are
constantly looking to identify hazards and mitigate risks.
When asked, “What do you consider to be
the most important issue facing your EHS
program?” - survey respondents listed
Exposure to toxic chemicals (20%) and
Ergonomic stressors (16.1%) as their two
highest concerns.
And while both chemical exposure
and chemical management
combined to be the single largest
concern (33.49%) amongst EHS
professionals, there was a broad
list of write-in responses that
mentioned everything from a lack
of GHS compliance and outdated
regulations to a lack of funding and support
by management.
2017 STATE OFENVIRONMENTAL HEALTH & SAFETY
INDUSTRY SURVEY

12.3%
32.1%
21.0%
21.0%
13.5%More emphasis put on health andsafety rather than production
Stronger support andleadership from Executive team
Better training and educationalprograms for employees
More investment intechnology to help
detect, track andmonitor risks
Other (please specify)
AREAS OF IMPROVEMENT
When asked, “In what area would you most like to see improvement in your organization/facility's EHS
program?” – participants identified stronger support and leadership from the executive team (32.1%), then
better training and educational programs for employees (21%), and more investment in technology to
help detect risks (21%).
2017 STATE OFENVIRONMENTAL HEALTH & SAFETY
INDUSTRY SURVEY

33.1%
24.4%
11.8% 17.3%Poor communication
from leadership
13.4%Policies and proceduresare too in-depth or lengthy
Not enough staff or resources to complete a task
Inconsistent implementation of health and safety policies
Other
OPERATIONAL PAIN POINTS
Subsequently, when faced with the question: “What is the most frequent complaint that you hear from
employees about your organization's EH&S program?" – close to one third of respondents (33.1%)
pinpointed the need for the company to hire more sta�/resources as the top concern amongst EHS
professionals. Inconsistent implementation of health and safety policies (24.4%) and poor communication
from company leadership (17.3%) rounded out the most common grievances expressed by EHS
colleagues.
2017 STATE OFENVIRONMENTAL HEALTH & SAFETY
INDUSTRY SURVEY
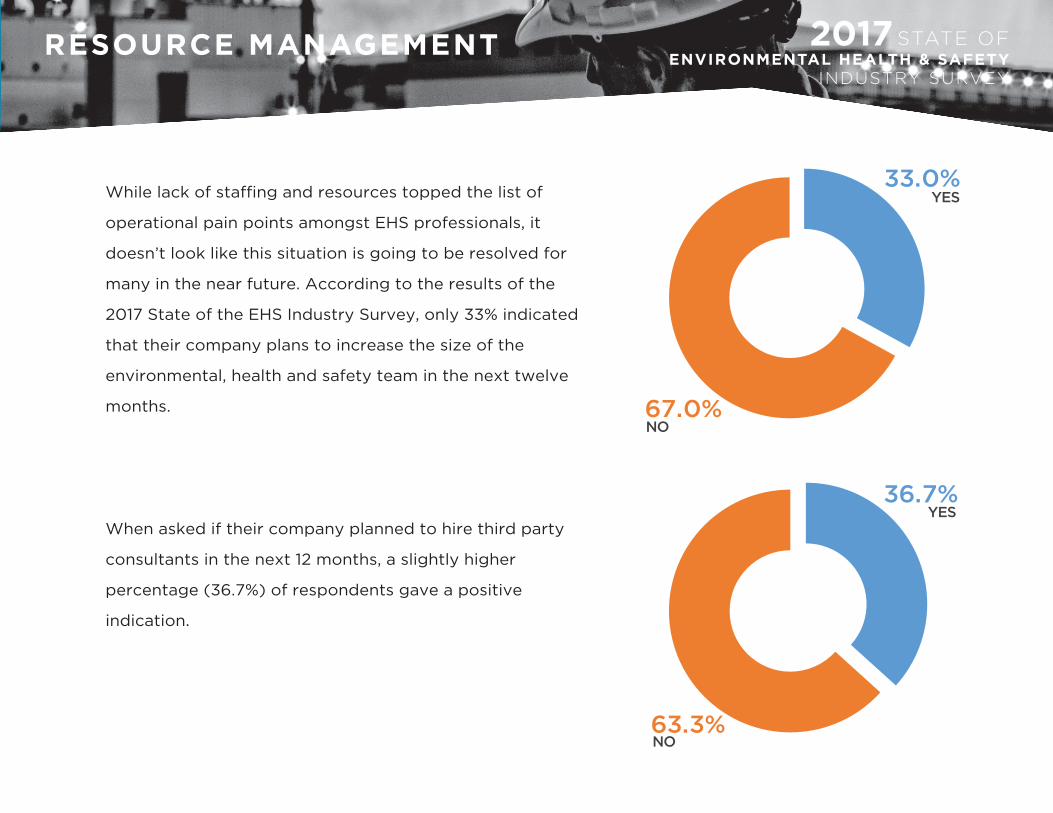
RESOURCE MANAGEMENT
While lack of sta�ng and resources topped the list of
operational pain points amongst EHS professionals, it
doesn’t look like this situation is going to be resolved for
many in the near future. According to the results of the
2017 State of the EHS Industry Survey, only 33% indicated
that their company plans to increase the size of the
environmental, health and safety team in the next twelve
months.
When asked if their company planned to hire third party
consultants in the next 12 months, a slightly higher
percentage (36.7%) of respondents gave a positive
indication.
2017 STATE OFENVIRONMENTAL HEALTH & SAFETY
INDUSTRY SURVEY
36.7%
63.3%
YES
NO
33.0%
67.0%
YES
NO

TECHNOLOGICAL FOOTPRINT
With more and more companies
turning to technology to help
manage everything from safety data
sheets and inspections to monitoring
chemical inventory and maintaining
regulatory compliance, we polled
participants to find out whether or
not their organization used an EHS
software. As it turns out, more than
half (58.51%) indicated that they do in
fact use some sort of EHS software.
2017 STATE OFENVIRONMENTAL HEALTH & SAFETY
INDUSTRY SURVEY
58.5%
41.5%
YES
NO
TECHNOLOGICAL FOOTPRINT
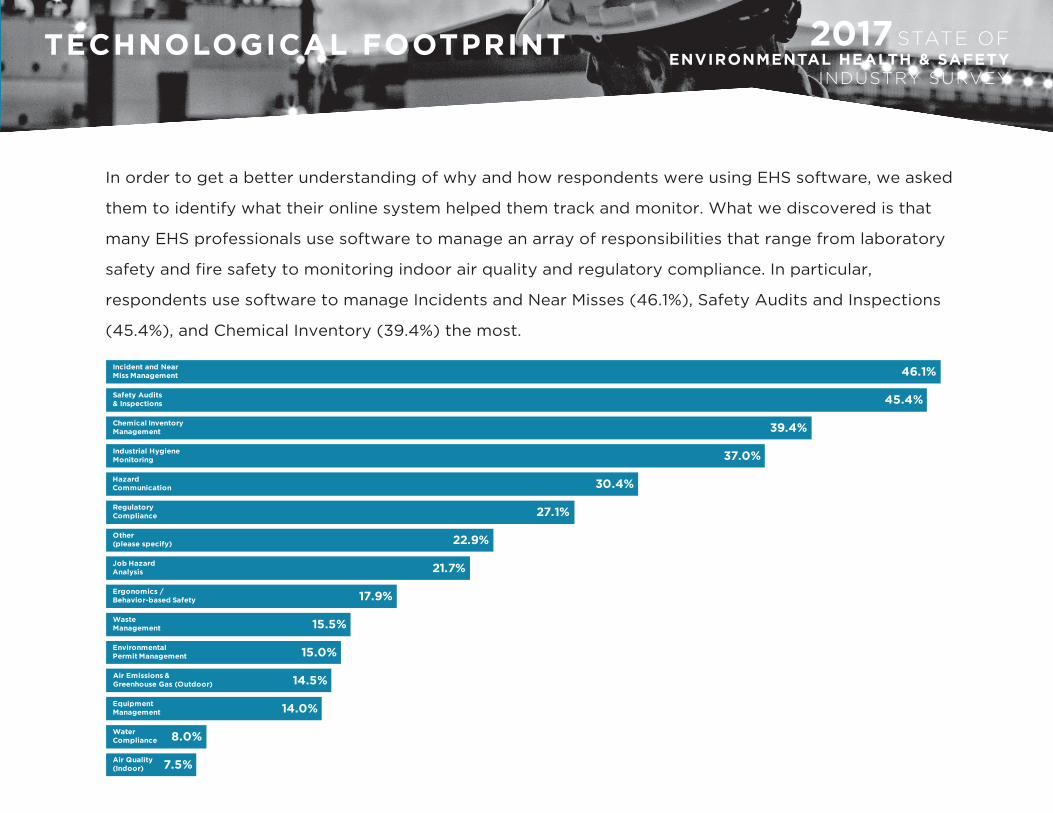
In order to get a better understanding of why and how respondents were using EHS software, we asked
them to identify what their online system helped them track and monitor. What we discovered is that
many EHS professionals use software to manage an array of responsibilities that range from laboratory
safety and fire safety to monitoring indoor air quality and regulatory compliance. In particular,
respondents use software to manage Incidents and Near Misses (46.1%), Safety Audits and Inspections
(45.4%), and Chemical Inventory (39.4%) the most.
2017 STATE OFENVIRONMENTAL HEALTH & SAFETY
INDUSTRY SURVEY
7.5%
8.0%
14.0%
14.5%
15.0%
15.5%
17.9%
21.7%
22.9%
27.1%
30.4%
37.0%
39.4%
45.4%
46.1%
Air Quality(Indoor)
WaterCompliance
Equipment Management
Air Emissions &Greenhouse Gas (Outdoor)
EnvironmentalPermit Management
WasteManagement
Ergonomics /Behavior-based Safety
Job HazardAnalysis
Other(please specify)
RegulatoryCompliance
HazardCommunication
Industrial HygieneMonitoring
Chemical InventoryManagement
Safety Audits& Inspections
Incident and NearMiss Management

SU
RV
EY
SU
MM
AR
YWhile analyzing the results of our inaugural State of the EHS Industry Survey, we can assess that the majority of
respondents are experienced EHS professionals who represent small to mid-size companies in the professional,
scientific, and technical, or manufacturing industry.
While many respondents (69.52%) work for companies with less than 100 employees, the majority of EHS
professionals who completed this survey are accountable for a wide range of functions and responsibilities
regardless of company size. The most commonly shared tasks among EHS professionals include Hazard
Identification (83.98%), Training (81.45%) and Job Hazard/Risk Analysis (78.93%). Though, many other duties
including Safety Audits/Inspections (72.55%), and Chemical Management (52.37%) neared the top of the list.
Despite managing an array of tasks, the majority of EHS professionals who participated in our study are both
satisfied/very satisfied (72.82%) and secure (59.27%) with their job despite the shifting socio-economic conditions
of the past two years.
In addition to being content, the vast majority of participants (94.3%) maintain some sort of membership or
a�liation with a professional organization like the American Industrial Hygiene Association (AIHA), the American
Society of Safety Engineers (ASSE).
Upon closer review, EHS professionals who completed this survey did express their fair share of issues with
chemical exposure and chemical management combined to be the single largest concern amongst the group
(33.49%).
It’s important to note that survey participants believe that many of the challenges they face could be overcome
with stronger support from their leadership team (32.10%), and better training/educational programs and more
investment in technology to help detect, track and monitor risks (both tied with 21%).
However, when asked “What is the most frequent complaint that you hear from employees about your
organization's EH&S program?” – 33.13% of respondents named “Not Enough Sta� or resources” as the top
complaint. With only 33% of respondents indicating that they plan to expand the size of their EHS department,
and 37% planning to hire a third party consultant in the next 12 months, it would seem that this gripe might stick
around for the foreseeable future.