Embed Size (px)
Citation preview

STATE OF THE BANGLADESH ECONOMY IN FY2014
(THIRD READING)
01 JUNE 2014
CPD IRBD 2014 TEAM
2 CPD (2014): State of the Bangladesh Economy in FY2014 (Third Reading)
Mustafizur Rahman Debapriya Bhattacharya
Fahmida Khatun Khondaker Golam Moazzem
Towfiqul Islam Khan Khaleda Akhter
Kishore Kumer Basak Md. Zafar Sadique
Mehruna Islam Chowdhury Mashfique Ibne Akbar
Farzana Sehrin Saifa Raz
Umme Salma Md. Naimul Gani Saif
Mohammad Afshar Ali Shahida Pervin
Mostafa Amir Sabbih Shahzeen Hafiz
Ziad Quader Nadee Naboneeta Imran
Anika Zaman
A H M Ashrafuzzaman Md. Hamidul Hoque Mondal
The CPD IRBD 2014 Team would like to register its sincere gratitude to Professor Rehman Sobhan, Chairman, CPD for his advice and guidance in preparing this report

EXPERT GROUP CONSULTATION The CPD team is grateful to all of those presented at the consultation on 29 May 2014 for sharing their views, insights and
comments on the draft report
CPD (2014): State of the Bangladesh Economy in FY2014 (Third Reading) 3
Dr. Salehuddin Ahmed Former Governor Bangladesh Bank
Dr M Asaduzzaman Professorial Fellow Bangladesh Institute of Development Studies (BIDS)
Dr Zahid Hussain Lead Economist South Asia Finance and Poverty Group The World Bank
Dr A B Mirza Azizul Islam Former Advisor to the Caretaker Government Ministries of Finance and Planning
Dr Ahsan Habib Mansur Executive Director Policy Research Institute of Bangladesh
Mr Muhammad Abdul Mazid Former Chairman National Board of Revenue (NBR)
Dr Mustafa K Mujeri Director General Bangladesh Institute of Development Studies (BIDS)
Mr M Syeduzzaman Member, CPD Board of Trustees and Former Finance Minister
Professor M Tamim Bangladesh University of Engineering and Technology Former Special Assistant to the Chief Advisor of the Caretaker Government
Dr Hassan Zaman Chief Economist Bangladesh Bank

CONTENTS
¡ Section 1: INTRODUCTION
¡ Section II: THE MACROECONOMIC SCENARIO: A TALE OF TWO WOES
¡ Section III: PUBLIC EXPENDITURE: ISSUES AND CONCERNS
¡ Section IV: FINANCING PUBLIC EXPENDITURE: A SMART MIX NEEDED
¡ Section V: SUSTAINABLE POWER SECTOR DEVELOPMENT: WHETHER IN RIGHT DIRECTION
¡ Section VI: EXPORT SECTOR PERFORMANCE: FLUCTUATING FORTUNES
¡ Section VII: CONCLUDING REMARKS
4 CPD (2014): State of the Bangladesh Economy in FY2014 (Third Reading)

1. INTROUCTION ¡ Macroeconomic performance has experienced formidable challenges in the
course of the ongoing FY14
¡ During the first half of FY14, the economy was confronted with severe disruption in production, transport and service delivery that afflicted both domestic and export-oriented activities. In the second half, in the backdrop of the political uncertainties, a deceleration in the investment growth, particularly that of private sector investment, constrained efforts to translate the relative macroeconomic stability into higher economic growth
¡ In the context of these twin developments, reinvigorating the investment environment to regain the lost momentum of accelerated GDP growth has emerged as a major concern from the perspective of macroeconomic management in FY14 and particularly in view of the upcoming budget for FY15
5 CPD (2014): State of the Bangladesh Economy in FY2014 (Third Reading)

1I. THE MACROECONOMIC SCENARIO: A TALE OF TWO WOES
Economic Growth, Investment and Savings ¡ BBS provisionally estimated the GDP growth to be 6.1% in FY14 P which is 1.1 percentage points lower than the target of 7.2% set for FY14
P CPD, in January 2014, predicted GDP growth in the range of 5.6-5.8%
¡ The growth rate of the industry sector is estimated to come down to 8.4% in FY14 from 9.6% in FY13
¡ Agriculture sector is projected to achieve a much improved performance (3.4% growth in FY14)
¡ The services sector’s growth rate is estimated to be 5.8 % in FY14 from 5.5% in FY13
6 CPD (2014): State of the Bangladesh Economy in FY2014 (Third Reading)
Sector FY12 FY13 Provisional FY14 Agriculture 3.0 2.5 3.4 Crop 1.8 0.6 1.9 Industries 9.4 9.6 8.4 Manufacturing 10.0 10.3 8.7 Construction 8.4 8.0 8.6 Services 6.6 5.5 5.8 GDP 6.5 6.0 6.1
GDP GROWTH (%)
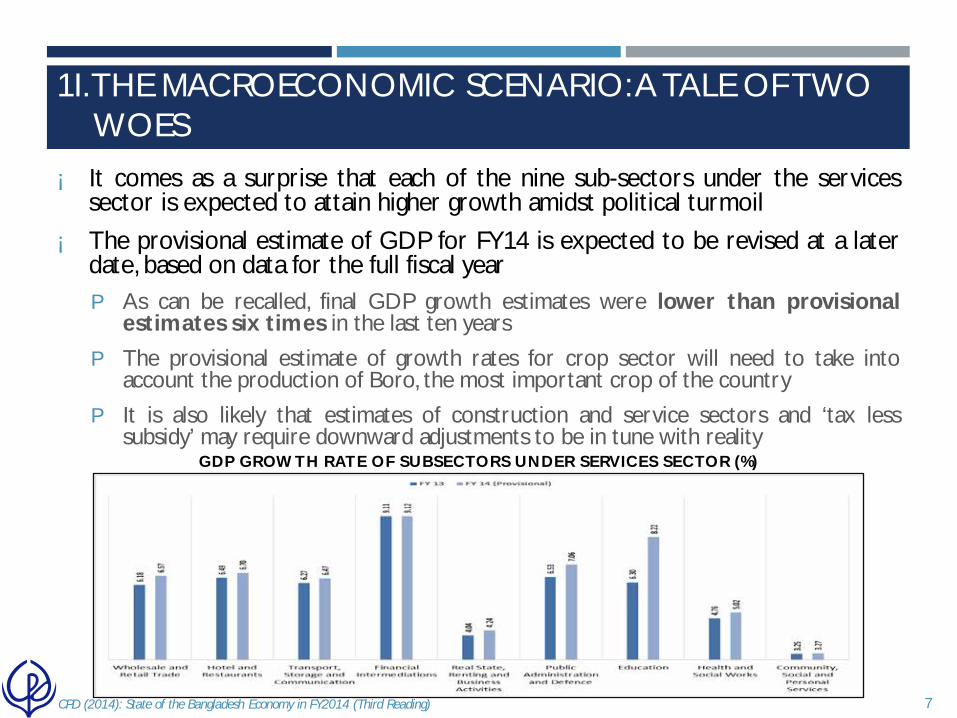
¡ It comes as a surprise that each of the nine sub-sectors under the services sector is expected to attain higher growth amidst political turmoil
¡ The provisional estimate of GDP for FY14 is expected to be revised at a later date, based on data for the full fiscal year P As can be recalled, final GDP growth estimates were lower than provisional
estimates six times in the last ten years P The provisional estimate of growth rates for crop sector will need to take into
account the production of Boro, the most important crop of the country
P It is also likely that estimates of construction and service sectors and ‘tax less subsidy’ may require downward adjustments to be in tune with reality
7 CPD (2014): State of the Bangladesh Economy in FY2014 (Third Reading)
GDP GROWTH RATE OF SUBSECTORS UNDER SERVICES SECTOR (%)
1I. THE MACROECONOMIC SCENARIO: A TALE OF TWO WOES

¡ In FY14, per capita GNI of Bangladesh has been estimated to be about USD 1,190 (indicating a 12.9 % growth) P Improved per capita GNI estimates has indeed increased the likelihood of
Bangladesh graduating to a lower middle income country in the near future
P In view of this possible scenario, Bangladesh will need to prepare itself to face new challenges
P Not being a low-income country anymore, Bangladesh may not be considered for concessional credit lines (in addition to other demerits)
¡ In FY14, domestic savings as % of GDP experienced a significant increase – to 23.4% in FY14 from 22.0% in FY13 (1.4 percentage points) P The rising trend has continued since FY11. But it should be noted that this
trend is a quite different one when juxtaposed to old national accounts estimates
¡ Provisional GDP figure for FY14 indicates an improved public investment performance (7.3% as against 6.6% in FY13) with a distinctive fall in private investment’s share in the GDP (21.4% as compared to 21.7% in FY13).
CPD (2014): State of the Bangladesh Economy in FY2014 (Third Reading) 8
1I. THE MACROECONOMIC SCENARIO: A TALE OF TWO WOES

An attempt to discern the trend of GDP
¡ While there is an ongoing conjecture regarding the growth rate of GDP and its components, an attempt to decompose GDP has been made
CPD (2014): State of the Bangladesh Economy in FY2014 (Third Reading) 9
¡ The Hodrick-Prescott (HP) high-pass filter has been employed to decompose total GDP and those of the three major sectors - agriculture, industry and services sectors of a year into its growth (trend) and cyclical components.
¡ It can be inferred that the Bangladeshi GDP could not elevate to a higher potential during the early years of this decade (2010s). Enhancement of labour productivity, capital deepening, and higher total factor productivity by a way of skills development and capital and labour productivity enhancement have been identified as the correcting measures.
OUTPUT GAP PERCENTAGE OF GDP MEASURED BY THE HP FILTER
1I. THE MACROECONOMIC SCENARIO: A TALE OF TWO WOES

¡ From the analysis, a number of observations may be made. P First, it is observed that GDP has experienced breakthroughs in each of the past three
decades. With volatility reduced by a significant margin over the decades, GDP remained below the potential level in FY09 and FY10, a notion which could be attributed to the global financial crisis. Actual GDP performance went below its potential (-0.07%) in FY13, which can be attributed to the political turmoil.
P Second, as regards value added in agricultural sector, output gap remained negative (realised output being less than potential output) for the majority of the fiscal years during the last decade. In FY13, the output gap was -1.02% of the potential GDP in the agricultural sector.
P Third, in contrast to the agricultural sector, value added from the industrial sector experienced lower troughs but higher peaks during the course of the last decade, which helped the sector to move to a higher growth trajectory. Industrial sector’s actual output remained 0.78% higher than its potential in FY13.
P Fourth, changes in output gap in services has been the most volatile. The services sector performed above potential between FY07 and FY12. However, the potential output of the services sector remained (-) 0.31% lower compared to the potential GDP from this sector.
Infrastructure bottlenecks, market and product diversification and regulatory reforms exist as urgent priorities facing the policymakers over the short to medium terms
CPD (2014): State of the Bangladesh Economy in FY2014 (Third Reading) 10
1I. THE MACROECONOMIC SCENARIO: A TALE OF TWO WOES

Public Finance Revenue earnings
¡ During the first ten months of FY2014, NBR attained 9.2% growth over the same period of FY13 (against the annual target of 25.3%) P NBR continues to struggle for the second consecutive year in FY14
P In December 2013 and January 2014, NBR failed to attain positive growth figures ((-) 1.6% and (-) 0.8% respectively) on a month-on-month (MoM) basis
CPD (2014): State of the Bangladesh Economy in FY2014 (Third Reading) 11
P NBR targets have been revised downward in FY14 for the first time since FY09 (by Tk. 11,900 crore)
P NBR collection will need to grow at 34.4% in the last two months to attain the revised target
P Efforts from non-NBR and non-tax sources also lagged behind the target growth in FY14 (need to grow at 63.6% and 89.3% respectively over last three months)
P In view of the above, it is critically important to readjust the fiscal parameters
MOM GROWTH (%) OF NBR REVENUE COLLECTION
1I. THE MACROECONOMIC SCENARIO: A TALE OF TWO WOES

Public expenditure
¡ Public expenditure (including both development and non-development expenditure) recorded 18.8% growth for the first three quarters of FY14, while the annual target was set to increase by 28.4%
P The sluggish growth can be attributed mainly to low implementation of the ADP and limited subsidy requirements
¡ Net non-development revenue expenditure in the first three quarters of FY14 increased by 10.1% while the annual target was set at 15.1%
P Domestic interest payment accounted for a significant incremental share (about 24.4%) in this growth
P High negative growth for the ‘Subsidies and Current Transfer’ head (by (-) 14.3%) kept the overall non-development expenditure growth in check
P Disbursement of Tk. 4,168 crore for recapitalisation of the state-owned banks constituted a major expenditure item
¡ About 49.8 % ADP was spent during Jul-Apr FY14 (56.3% in Jul-Apr FY13)
P ADP has been slashed by 8.9 percentage points (or Tk. 5,872 crore) to Tk. 60,000 crore (more than Tk. 4,500 crore was reduced from Padma bridge allocation)
CPD (2014): State of the Bangladesh Economy in FY2014 (Third Reading) 12
1I. THE MACROECONOMIC SCENARIO: A TALE OF TWO WOES

Budget deficit and its financing
¡ At the end of Q1-Q3 of FY14, amount of deficit remained at only 1.4% of planned GDP. However, the margin was large compared to the same period of FY13 P The surge was evident in the backdrop of falling revenue performance in FY14
P According to MoF data, revenue mobilisation as share of annual target fell by 6.8 percentage points compared to the matched figures of FY13
¡ As regards financing of the deficit, 91.6% of the total deficit was financed from domestic sources during the first three quarters of FY14 P Net sale of NSD certificates already surpassed the budget target by a significant
margin (1.5 times higher than the target)
P The utilisation of foreign finances (in terms of both foreign grants and foreign net borrowing) were not encouraging
P Government borrowing from banking sources remained within the limit
¡ In view of interest payments emerging as one of the major sources of non-development expenditures, it will be advisable to keep the high cost domestic borrowing within the manageable limit
CPD (2014): State of the Bangladesh Economy in FY2014 (Third Reading) 13
1I. THE MACROECONOMIC SCENARIO: A TALE OF TWO WOES

Monetary Sector Inflation
¡ Average annual inflation stands at 7.5% as of April 2014, while the target for June 2014 is 7.0% P Food inflation was on the rise since February 2013. However, food supply chain was
severely disrupted due to nation-wide and regional strikes (hartals) and blockades. Rising trend of food inflation in recent months is largely explained by the higher rice price at the retail level
CPD (2014): State of the Bangladesh Economy in FY2014 (Third Reading) 14
ANNUAL AVERAGE INFLATION RATE (%) P Conversely, non-food inflation has sharply declined to 5.9% in April 2014 (from 9.2% in June 2013) in the face of lower domestic demand
P Of the 7.5% inflation in April 2014, 5.3% was contributed by food inflation and 2.2% was account for by non-food inflation
P Contribution of food commodity prices (about 2.0 percentage points) was higher than the incremental inflation between the two periods (by 1.2 percentage points)
1I. THE MACROECONOMIC SCENARIO: A TALE OF TWO WOES

Monetary Aggregates
¡ Growth of money supply at the end of March 2014 (15.3%) remained below the target of 17.0% for end of June, 2014
P Much of this is explained by the high growth of net foreign assets
CPD (2014): State of the Bangladesh Economy in FY2014 (Third Reading) 15
Indicator Target FY13 Jun 2013 Target FY14 Mar 2014 Broad Money 17.7 16.7 17.0 15.3 Net Foreign Assets 14.0 43.9 10.0 36.1 Domestic Credit 18.9 11.0 17.8 11.3 Credit to Public Sector 20.3 11.7 22.9 10.8 Net Credit to the Govt. Sector NA 20.1 NA 16.4 Credit to the Other Public Sector NA (-) 38.4 NA -21.9 Credit to the Private Sector 18.5 10.8 16.5 11.5
GROWTH OF MONETARY INDICATORS
¡ The growth of private sector credit stood at 11.5% at end of March FY2014; which was 10.8% at the end of June FY2013 P Lack of credit demand for new investment is also demonstrated by lower disbursement
of industrial term loan
P Lack of demand for private sector credit also resulted in substantial excess liquidity in the banking system
1I. THE MACROECONOMIC SCENARIO: A TALE OF TWO WOES

Monetary policy Stance
¡ Interest spread has continued to remain high at 5.1 percentage points in February 2014 (which was the same in June 2013)
¡ Government has allowed the private sector to go for significant amounts of commercial borrowing from foreign sources P It was felt that this would infuse more competition in the domestic financial market
¡ Whilst private sector borrowing from foreign sources was not bad per se at a time of high excess liquidity in the banking system and high forex reserves, the rationale of this policy may need to be revisited
¡ CPD has earlier suggested that the private sector’s commercial lending from overseas should be allowed on a limited scale and to foreign exchange earning industries only P The risk of possible illicit financial outflow also needs to be assessed
¡ On the other hand, large amounts of classified loan are hurting the banking system P Share of classified loan to total outstanding loan registered another rise at the end of March
FY2014, when it increased to 10.5%
¡ With mega projects such as the Padma Bridge to be implemented in the coming days, the central bank will need to carefully examine the likely pressure on foreign exchange to maintain exchange rate stability
CPD (2014): State of the Bangladesh Economy in FY2014 (Third Reading) 16
1I. THE MACROECONOMIC SCENARIO: A TALE OF TWO WOES

External Sector
Export earnings
¡ Export earnings registered 13.2% growth during Jul-Apr of FY14 over the corresponding months of FY13 (annual target was 12.9%) P RMG exports led the overall export growth (RMG share increased from
79.5% to 81.0% during Jul-Apr FY14)
¡ Accelerated growth of RMG products in the early months sustained in the EU market to reach 18.6% growth during Jul-Apr FY14
¡ In case of the US market, early robust RMG growth did not sustain P RMG export declined by (-) 5.6% during Jan-Apr FY14 (which was 13.3%
during Jul-Dec of FY14). Particularly, export of woven garments experienced significant setback (3.6% in Jul-Apr FY14)
¡ Overall growth in major non-traditional markets (19.6%) continued to be higher compared to traditional ones (13.9%)
CPD (2014): State of the Bangladesh Economy in FY2014 (Third Reading) 17
1I. THE MACROECONOMIC SCENARIO: A TALE OF TWO WOES

Import ¡ Import growth was sluggish in the early months of FY14, with growth
reaching (-) 0.1% during first six months ¡ Import growth stands at 11.1% after the first nine months of FY14 P The higher import of intermediate goods and capital goods significantly
contributed to this growth (41.0% and 43.3% growth respectively)
¡ In March FY14, the state of affairs changed drastically and import shipment figures recorded a historically high 54.5% growth in a single month
¡ Capital machinery import was USD 731 mln in March 2014, which was more than five times the amount of import in March 2013
¡ Data received from Bangladesh Bank shows that a number of crane items were imported from France in the month of March 2014, amounting to about USD 433 mln P Import of such large amounts of cranes in a single month warrants a double
check
CPD (2014): State of the Bangladesh Economy in FY2014 (Third Reading) 18
1I. THE MACROECONOMIC SCENARIO: A TALE OF TWO WOES

¡ CPD examined detailed import shipment data for the Jul-Mar period of FY14
¡ It was identified that 17 import items (at HS 8-digit level) accounted for about 40% of total import and 93.5% of incremental growth during Jul-Mar of FY14
¡ Three of the items contributed about 73.4% of the incremental growth in imports during the period
CPD (2014): State of the Bangladesh Economy in FY2014 (Third Reading) 19
¡ Such exceptional pattern of import figures call for appropriate scrutiny on the part of the NBR
¡ It is perhaps worth mentioning that customs duty on crane products was only 2.0%; while on aeroplanes and other aircrafts it was zero
HSCODE Items Jul-Mar
FY13 Jul-Mar
FY14 Share (%)
Growth (%)
Incremental Growth (%)
AV (in mln USD)
73101000 Tanks, casks, drums, cans (excl. for Gas) of Iron/Steel, 50-300 L 1 329 1.6 32,079.7 21.7
84261900 Transporter cranes, Gantry cranes, Bridge cranes, Overhead travelling cranes n.e.s. 7 466 2.3 6,225.7 30.3
88022000 Aeroplanes and other aircraft, n.e.s, of an Unladen weight =<2000kg 2 326 1.6 17,605.4 21.4
SUM OF 17 PRODUCTS 6,713 8,127 39.7 21.1 93.5 Total Customs Shipment 18,937 20,450 100.0 8.0 100.0
MAJOR IMPORTED ITEMS IN JUL-MAR FY2014
1I. THE MACROECONOMIC SCENARIO: A TALE OF TWO WOES
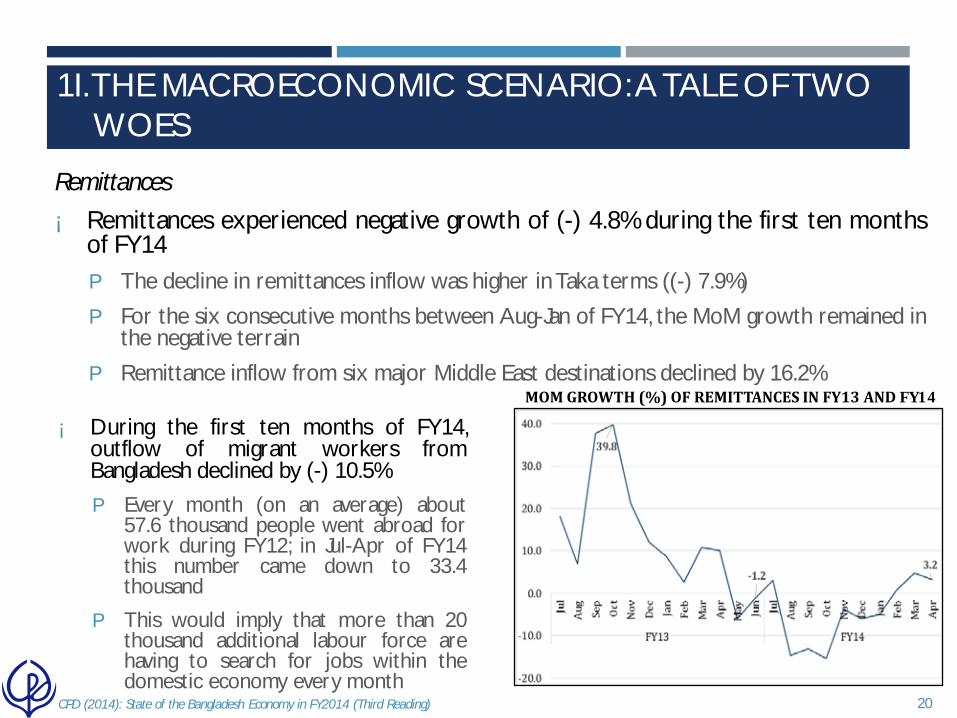
Remittances
¡ Remittances experienced negative growth of (-) 4.8% during the first ten months of FY14 P The decline in remittances inflow was higher in Taka terms ((-) 7.9%)
P For the six consecutive months between Aug-Jan of FY14, the MoM growth remained in the negative terrain
P Remittance inflow from six major Middle East destinations declined by 16.2%
CPD (2014): State of the Bangladesh Economy in FY2014 (Third Reading) 20
¡ During the first ten months of FY14, outflow of migrant workers from Bangladesh declined by (-) 10.5% P Every month (on an average) about
57.6 thousand people went abroad for work during FY12; in Jul-Apr of FY14 this number came down to 33.4 thousand
P This would imply that more than 20 thousand additional labour force are having to search for jobs within the domestic economy every month
MOM GROWTH (%) OF REMITTANCES IN FY13 AND FY14
1I. THE MACROECONOMIC SCENARIO: A TALE OF TWO WOES

Balance of Payments (BoP)
¡ Overall BoP in Jul-Mar FY14 experienced favourable balance of USD 3,885 mln (USD 3,948 mln in Jul-Mar FY13) because of sustained export performance
¡ Current account balance was USD 1,517 mln during Jul-Mar FY14. However, this was higher at USD 2,606 mln during Jul-Mar FY13
¡ The large surplus in BoP pushed the foreign exchange reserve to newer height of USD 20.2 bln (as of 27 May 2014)
¡ The central bank rightly maintained the stability of exchange rate of BDT against USD by augmenting foreign exchange reserves
¡ The outlook of external balance suggests that the recent pick up of import payments may be maintained during the remaining months of FY2014. The present trends in remittance inflow, foreign aid disbursement and FDI are likely to be maintained
¡ Under such a scenario, the central bank should continue its current policy stance of keeping exchange rate stable and allow foreign exchange reserves to adjust accordingly
CPD (2014): State of the Bangladesh Economy in FY2014 (Third Reading) 21
1I. THE MACROECONOMIC SCENARIO: A TALE OF TWO WOES

III. PUBLIC EXPENDITURE: ISSUES AND CONCERNS
¡ Public expenditure has increased significantly over the last five years (both nominal and real terms). This can be analysed from following perspectives: P a) aggregate fiscal discipline, b) resource allocation based on strategic
priorities and c) Efficiency of operational performance Total Expenditure: Aggregate Efficiency ¡ Public expenditure has increased significantly over the last five years P Tk.90,696 crore to Tk.1,73,340 crore during FY08 to FY13 (increase: 91%
in nominal term; 36% in constant term) P Rise in expenditure-GDP ratio by one percentage point P Budget deficit kept to a moderate level (5-6% of the GDP) P Deficit is increasingly being financed by domestic resources (domestic debt
is equivalent to 21.5% of GDP in FY14) ¡ MTBF was introduced to improve public expenditure management P Targets have been revised a number of times: actual expenditure varied
with the revised targets (see Table in the next slide) P Frequent revisions of targets has weakened its efficacy
22 CPD (2014): State of the Bangladesh Economy in FY2014 (Third Reading)

III. PUBLIC EXPENDITURE: ISSUES AND CONCERNS
¡ Composition of public expenditure experienced changes along with the change in size: non-dev. expenditure declined over time (61% in FY09 to 54% in FY13)
¡ Expenditure for subsidies and others including for SoEs have significantly increased (though declined in FY14): no visible progress in overall performance of SoEs
CPD (2014): State of the Bangladesh Economy in FY2014 (Third Reading) 23
Components
Target set for FY2013 Actual in FY2013
MTBF (FY2011)
MTBF (FY2012)
MTBF (FY2013)
Total Revenue 13.1 13.4 13.4 13.4 Tax Revenue 10.8 11.2 11.2 11.2 Non-Tax Revenue 2.3 2.2 2.2 2.2
Total Expenditure 17.4 18.4 18.4 18.2 Revenue Expenditure 11.8 13.1 13.1 13.2 ADP 5.6 5.3 5.3 5.0
Overall Balance -4.3 -5.0 -5.0 -4.8 Financing 4.3 5.0 5.0 4.8
Domestic Borrowing 2.3 3.0 3.2 3.1 Banking System 1.7 2.7 Non-Bank 0.6 0.4
External Financing 2.1 2.0 1.8 1.7
Medium Term Fiscal Framework Projected/Revised for FY2013

III. PUBLIC EXPENDITURE: ISSUES AND CONCERNS Non-Development Expenditure: Priorities in Resource Allocation ¡ Non-dev. expenditure has registered significant rise (nominal and constant
terms) - share in GDP has remained within 11-13% ¡ Sectoral priorities are same - interest payment, education and technology,
defense, general public services and agriculture: share has increased further from 59.4% to 66% P Structural rigidities tend to leave only limited space for undertaking the
required changes in short run P Intersectoral allocation should reflect that change over medium to long term
¡ Rise in expenditures for top 5 sectors had to accommodate significant trade offs P Allocations for social infrastructure other than education has come down
significantly over the years
CPD (2014): State of the Bangladesh Economy in FY2014 (Third Reading) 24
0.0
20.0
40.0
60.0
Pay and Allowances Goods and Services Interest payments Subsidies and CurrentTransfers
Investment in Share &Equities
% o
f Tot
al N
on-
Deve
lopm
ent
Expe
nditu
re
FY2008-09 FY2009-10 FY2010-11 FY2011-12 FY2012-13 FY2013-14 (March)
Non-Development Expenditure during FY13 And FY14

III. PUBLIC EXPENDITURE: ISSUES AND CONCERNS ¡ Priority issues in terms of economic classification: pay and allowances (24.2%),
interest payment (24.5%) and subsidy payment (28.4%)
¡ Rise in domestic borrowing for deficit financing led to higher share in allocation for interest payment (Tk.18,169 crore vis-à-vis Tk. 1,274.8 crore for foreign interest payment)
P Contradicted the strategy set in the Medium Term Debt Strategy (MDTS) putting more emphasis on borrowings from the external sources (MoF, 2013).
¡ The dynamics and changes in allocation is indicative of government’s policy perspective and priorities regarding public expenditure
P There is a need to examine closely this shifting dynamics from the perspective of development strategy, implications and efficiency
CPD (2014): State of the Bangladesh Economy in FY2014 (Third Reading) 25

III. PUBLIC EXPENDITURE: ISSUES AND CONCERNS Non-Development Expenditure: Operational Performance ¡ Prevailing high share of non-development expenditure particularly for pay and
allowances is likely to continue in the coming years P New pay scale for public sector employees will cause additional fiscal
burden: raising additional revenue and by measuring against expected improvements in productivity and efficiency of public services
¡ Declining share of social infrastructure (other than education) has emerged as a cause for concern P It is difficult to balance the urgent needs and medium to long term needs
concerning social priorities ¡ A significant rise in expenditure on ‘recapitalization’ under the category of
investment in shares and equities has raised concern in recent times P Without addressing the core weaknesses of the SoCBs mere injection of
capital will hardly make any change in their sorrow state of affairs ¡ Issues related to allocational and operational efficiency of the non-
development expenditure needs to be closely aligned with those of development expenditure
CPD (2014): State of the Bangladesh Economy in FY2014 (Third Reading) 26

III. PUBLIC EXPENDITURE: ISSUES AND CONCERNS
Development Expenditure: Priorities in Resource Allocation ¡ Allocation has increased from Tk.19,050 crore (actual) in FY08 to Tk.67,327
crore (budget) in FY14 P Persistent gap between budgetary allocation and actual utilization but it has
narrowed over the years P Some improvements in development administration and changes in the
procurement rules and regulations ¡ With the rise in expenditure, composition of allocation has also changed. P Top 10 ministries received about 77% of total allocation in FY14 (84% in
FY09): e.g. LGRD, transport and communication and fuel and energy P This is indicative of some changes in allocative priorities from the core
ministries to other ministries ¡ Such allocative priorities are by and large consistent with the medium to long
term needs of an emerging economy P Enhanced allocation for public investment in these sectors have assumed
greater urgency in the emerging context CPD (2014): State of the Bangladesh Economy in FY2014 (Third Reading) 27

III. PUBLIC EXPENDITURE: ISSUES AND CONCERNS
¡ The priority given in the allocation for physical infrastructure has important trade-offs (Figure) P Allocation for social infrastructure sectors remain low both in non-
development and development expenditure which is a concern ¡ Bangladesh remains behind the level of South Asia in terms of health
expenditure in the budget; but above in terms of expenditure in education ¡ Large number of projects often undermine the implementation as they create
pressure on development administration ¡ No. of unapproved projects has risen significantly – (14% of total revised
projects in FY09 to 63.2% in FY14: undermine overall allocative efficiency CPD (2014): State of the Bangladesh Economy in FY2014 (Third Reading) 28
0
5
10
15
20
25
30
GPS LGRD Defense POS Edn Hlth SSW HCS RCRA FE Agr IES TC
Actu
al a
s % o
f de
velo
pmen
t exp
endi
ture
FY10 FY11 FY12 FY13 FY14 (March)
Sector-wise Actual Development Expenditure as a % of Total Development Expenditure

III. PUBLIC EXPENDITURE: ISSUES AND CONCERNS Development Expenditure: Efficiency in Operational Performance • Utilisation of ADP lags behind the target set in the budget
• The rate of implementation of ADP projects has improved in recent years • Even after allowing 75% of funds of approved projects released upfront, pace
of implementation could not be enhanced because of other bottlenecks • Increasing domestic finance for ADP does not necessarily portray an increased
capacity to implement development projects • Greater reliance on local financing was not due to lack of availability of low-
cost funding from foreign aid • Preference for relaxed monitoring and evaluation mechanism
• Operational efficiency depends on completion of projects on time and maintaining the needed quality of project • Average amount of cost-overrun for projects was 9-227% and time overrun
was to the tune of 40-266% for projects completed under top ministries in FY2010 (please see the next slide)
• Reasons behind low implementation: lack of proper feasibility study and proper planning, weak budgeting, inefficient monitoring, poor disbursement of funds.
CPD (2014): State of the Bangladesh Economy in FY2014 (Third Reading) 29
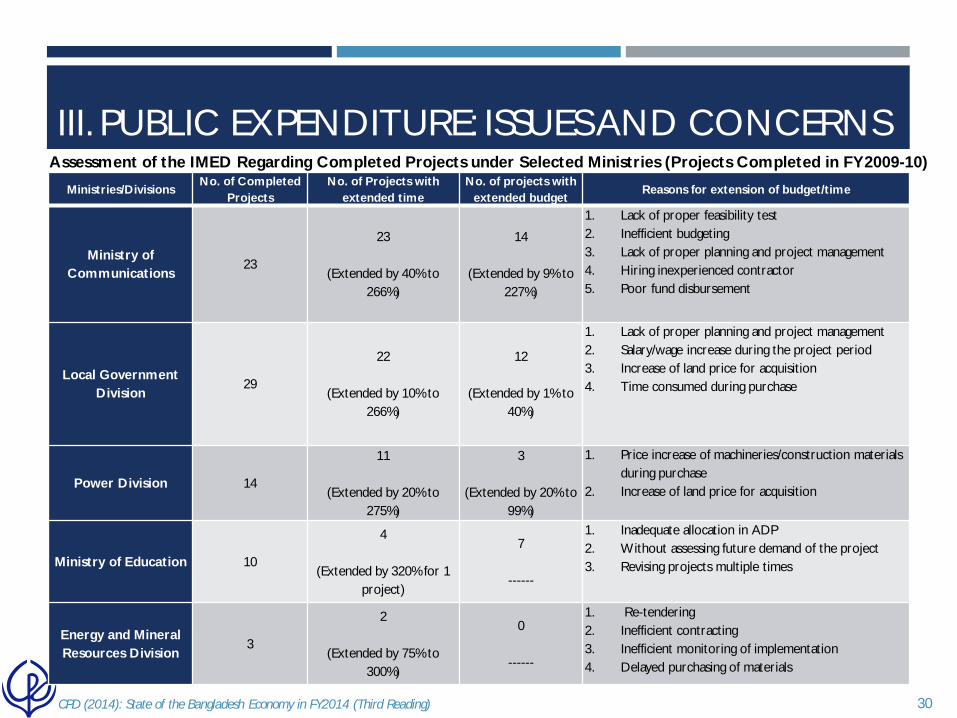
III. PUBLIC EXPENDITURE: ISSUES AND CONCERNS
Ministries/Divisions No. of Completed
Projects No. of Projects with
extended time No. of projects with
extended budget Reasons for extension of budget/time
Ministry of Communications
23
23
(Extended by 40% to 266%)
14
(Extended by 9% to 227%)
1. Lack of proper feasibility test 2. Inefficient budgeting 3. Lack of proper planning and project management 4. Hiring inexperienced contractor 5. Poor fund disbursement
Local Government Division
29
22
(Extended by 10% to 266%)
12
(Extended by 1% to 40%)
1. Lack of proper planning and project management 2. Salary/wage increase during the project period 3. Increase of land price for acquisition 4. Time consumed during purchase
Power Division 14
11
(Extended by 20% to 275%)
3
(Extended by 20% to 99%)
1. Price increase of machineries/construction materials during purchase
2. Increase of land price for acquisition
Ministry of Education 10
4
(Extended by 320% for 1 project)
7
------
1. Inadequate allocation in ADP 2. Without assessing future demand of the project 3. Revising projects multiple times
Energy and Mineral Resources Division
3
2
(Extended by 75% to 300%)
0
------
1. Re-tendering 2. Inefficient contracting 3. Inefficient monitoring of implementation 4. Delayed purchasing of materials
CPD (2014): State of the Bangladesh Economy in FY2014 (Third Reading) 30
Assessment of the IMED Regarding Completed Projects under Selected Ministries (Projects Completed in FY2009-10)

III. PUBLIC EXPENDITURE: ISSUES AND CONCERNS
¡ Current practice of assessment of operational efficiency concerned the narrow focus put in on financial auditing only. P Does not tell much about quality of projects, achievement of objectives
and targets, and outcome of the projects ¡ Time has come for the IMED to put the spotlight on performance-based
auditing along with financial auditing. P Overall monitoring and assessment processes should be geared towards
guaranteeing ‘value for money’ as regards completed projects P This will ensure that actual returns are commensurate with those in the
project proposal ¡ Work efficiency of M/O Finance and M/O Planning has direct implications for
improving both fiscal and development management P Need to syncrhronise developmental and non-developmental expenditures P Follow through the strategies in the MTBF P Required adequate and innovative human resources to address the
loopholes and bottlenecks CPD (2014): State of the Bangladesh Economy in FY2014 (Third Reading) 31

1V. FINANCING PUBLIC EXPENDITURE: A SMART MIX NEEDED
¡ The nature and composition of resource mobilisation efforts indicate some changes in recent years
¡ Over the past years, revenue collection has been on the rise, but the pace has varied, with significant slowdown in FY13 and FY14
¡ To offset the budget deficit the government is resorting to increasing domestic borrowing, particularly from the banking system
CPD (2014): State of the Bangladesh Economy in FY2014 (Third Reading) 32

1V. FINANCING PUBLIC EXPENDITURE: A SMART MIX NEEDED
Revenue Collection Grows at a Lower Rate
¡ Till April 2014, achievement in NBR collection was 72.2 per cent of the revised budget while the growth of NBR revenue was about 9.2 per cent during July – April of FY14 as opposed to 16.1 per cent during the same period in the previous year.
¡ A comparison among various components of NBR revenue collection indicates that all components of tax revenue except for import duty and local supplementary duty have experienced a lower growth rate in FY14 (up to April) compared to the same period in FY13; however, both these were less than the targets for FY14
CPD (2014): State of the Bangladesh Economy in FY2014 (Third Reading) 33

Particulars Actual Growth
FY13
Original Growth
Target FY14
Revised Growth
Target FY14
Achieved Growth
Jul-Apr FY13
Achieved Growth
Jul-Apr FY14
Required Growth May-Jun
FY14 External Total 3.2 10.7 1.6 4.4 1.1 3.8
Import Duty 1.2 9.9 1.0 -1.9 0.1 4.8
VAT Import 7.3 8.9 0.1 12.3 2.9 -12.0
SD Import -3.8 18.8 9.1 0.6 -1.3 63.7
Local Total 13.2 30.3 19.7 12.9 13.5 41.3
VAT Local 19.9 23.6 13.6 17.7 13.3 14.5
SD Local 0.5 47.2 35.2 3.9 14.4 126.5
Total Direct Tax 27.5 32.7 21.9 35.8 13.5 45.8
Income Tax 27.6 32.1 21.3 36.0 12.5 42.9
Grand Total 14.3 25.3 15.1 16.1 9.2 34.4
GROWTH (%) COMPOSITION OF NBR SOURCED TAXES
1V. FINANCING PUBLIC EXPENDITURE: A SMART MIX NEEDED
CPD (2014): State of the Bangladesh Economy in FY2014 (Third Reading) 34

New Tax Measures Require Institutional Strengthening Ø In spite of the success in generating higher revenue, tax-GDP ratio continues to remain a concern as it is yet to pick up to the targeted level.
ØTargeted efforts have been undertaken to raise the share of direct taxes in total tax.
ØMobilising resources through the new VAT act will require significant strengthening of institutions such as the NBR, redesigning of the VAT administration processes, automation of NBR, and recruitment and capacity building of new staff.
Ø Efforts should be taken to raise awareness of taxpayers, tax advisors and people in general about the new VAT law before it starts to be implemented.
1V. FINANCING PUBLIC EXPENDITURE: A SMART MIX NEEDED
CPD (2014): State of the Bangladesh Economy in FY2014 (Third Reading) 35

TARGET AND COLLECTION GROWTH AND TAX-GDP RATIO
Source: MoF and BBS Data.
1V. FINANCING PUBLIC EXPENDITURE: A SMART MIX NEEDED
CPD (2014): State of the Bangladesh Economy in FY2014 (Third Reading) 36
0.0
2.0
4.0
6.0
8.0
10.0
12.0
5.0
10.0
15.0
20.0
25.0
30.0
FY09 FY10 FY11 FY12 FY13 FY14*Target growth (%) Actual growth (%) Tax-GDP Ratio
*Up to March

Increased Dependence on Domestic Sources for Deficit Financing Ø The pattern of deficit financing since FY2006 indicates that Bangladesh is becoming increasingly dependent on domestic resources to finance her expenditures (Figure 4.2).
Ø In recent years the gap between financing from domestic and foreign sources has widened further.
Ø For FY2014, deficit finance has been targeted at 4.6 per cent of GDP. Though up to March 2014 deficit finance was 1.4 per cent of GDP but this is expected to rise significantly towards the end of FY2014.
Ø In terms of financing the deficit, about 72.1 per cent of total budget deficit was financed by domestic resources in FY2013. The dependence on domestic resources as a source of financing has increased even further to more than 91.6 per cent in FY2014 (up to March 2014).
1V. FINANCING PUBLIC EXPENDITURE: A SMART MIX NEEDED
CPD (2014): State of the Bangladesh Economy in FY2014 (Third Reading) 37

FINANCING FROM DOMESTIC AND FOREING (%OF GDP)
0
0.5
1
1.5
2
2.5
3
3.5
4
4.5
FY02 FY03 FY04 FY05 FY06 FY07 FY08 FY09 FY10 FY11 FY12 FY13
Per
cent
of G
DP
Domestic financing Foreign financing
Source: MoF Data.
1V. FINANCING PUBLIC EXPENDITURE: A SMART MIX NEEDED
CPD (2014): State of the Bangladesh Economy in FY2014 (Third Reading) 38

¡ Since FY2008, bank borrowing started to outpace non-bank borrowing.
COMPOSITION OF DOMESTIC SOURCES OF BUDGET FINANCING
1V. FINANCING PUBLIC EXPENDITURE: A SMART MIX NEEDED
CPD (2014): State of the Bangladesh Economy in FY2014 (Third Reading) 39

Changing Pattern of Foreign Aid ¡ The amount of grant component has been on the decline since
FY2006, excepting FY2011.
¡ In FY2014 (first nine months), grants was Tk. 799.4 crore which was about 12% of proposed total grant and 0.7% of total expenditure
¡ A significant part of foreign aid goes as amortization payment, making the net foreign loan even smaller. In FY2014 (up to March), an amount of Tk 7002.6 crore has been paid as amortisation as against a loan of Tk 7606.5 crore
¡ Over the years, disbursement as percentage of commitment is declining while this has been somewhat recovering from FY12
1V. FINANCING PUBLIC EXPENDITURE: A SMART MIX NEEDED
CPD (2014): State of the Bangladesh Economy in FY2014 (Third Reading) 40

0.00
20.00
40.00
60.00
80.00
100.00
120.00
140.00
160.00
180.00
0
1000
2000
3000
4000
5000
6000
7000
FY01 FY02 FY03 FY04 FY05 FY06 FY07 FY08 FY09 FY10 FY11 FY12 FY13
Total_Commitment Total_Disbursment %of disbursement
Source: Ministry of Finance data.
COMMITMENT AND DISBURSEMENT OF FOREIGN AID
1V. FINANCING PUBLIC EXPENDITURE: A SMART MIX NEEDED
CPD (2014): State of the Bangladesh Economy in FY2014 (Third Reading) 41

Way forward • Financing public expenditure will continue to be a challenge for the government if
the current trends of revenue collection and foreign aid disbursement continue in future.
• Indeed, the involved problems could accentuate if carefully crafted strategies are not put in place now.
• Resource needs will likely rise at a fast pace in the coming years and smart mix of domestic and foreign resources will be needed to underwrite the increasing demands.
• In its budget recommendations for FY2014-15 (CPD 2014), CPD made a number of proposals in order to rejuvenate the revenue mobilisation effort and strengthen its fiscal policy framework.
• Some of these recommendations include: (i) revisit and rationalise the tax incentive structure (ii) improve NBR’s vigilance to curb tax evasion emerging from trade mispricing, re-invoicing and misdeclaration and strengthen Transfer Pricing Cell; (iii) put emphasis on collection of wealth tax surcharge; (v) chalk out an implementation strategy of the forthcoming VAT law; (vi) explore new ways to tap non-tax revenues; (vii) capacity development and institutional reform as regards revenue mobilisation and decentralise the revenue collection efforts for widening the outreach and identify new sources.
1V. FINANCING PUBLIC EXPENDITURE: A SMART MIX NEEDED
CPD (2014): State of the Bangladesh Economy in FY2014 (Third Reading) 42

43 CPD (2014): State of the Bangladesh Economy in FY2014 (Third Reading)
• Development of the power sector is one of the major policy priorities of the government. • Various initiatives have been undertaken in this regard: contributed to improving the
power generation capacity, its availability and accessibility • Important to examine development of the power sector from sustainability point of view Access to Electricity • According to the BPDB, power generation capacity has increased to 10,341 MW in April,
2014 which was 9,151 MW in FY2013 and 5,166 in FY2009 • Actual generation did not rise in tandem with the rise in the generation capacity; gap
has widened over successive years (1,004 MW in FY09 to 2,985 MW in Apr, FY14) • There is large unmet demand for electricity in the country
• Incremental share of generated electricity has been supplied more to domestic and agriculture activities and relatively less to SMEs and for commercial activities (Table)
V. SUSTAINABLE POWER SECTOR DEVELOPMENT: WHETHER IN RIGHT DIRECTION
Changes in Number of Connections for Different Categories of Consumers (%)
Year Domestic Agriculture Small
Industry Small Commercial
Large Inds. & Comm. REB Others Total
2009-2010 8.5 14.1 4.6 3.5 6.1 0.0 4.9 7.5 2010-2011 5.1 6.3 1.7 1.8 5.8 0.0 0.8 4.5 2011-2012 14.2 19.6 3.9 5.8 11.9 -62.2 4.0 12.6 2012-2013 10.2 9.1 3.6 3.9 8.8 0.0 10.3 9.1

CPD (2014): State of the Bangladesh Economy in FY2014 (Third Reading) 44
Particulars Derated capacity (MW)
(as of April, 14) Additional generation in
FY2014 (till April, 14) (MW) Share of total derated capacity
(MW) Cost (Tk/ kWh) 2012-
2013 Public sector 5381 562 55.3 3.8 IPP/SIPP 1750 128 18.0 4.08 Rental 2096 0 21.5 10.99 Import 500 500 5.1 6.00-6.35 Total 9727 1190 100 5.47
POWER GENERATION THROUGH DIFFERENT SOURCES
Source: BPDB
Generation of Electricity • Public sector power plants still generate the major share of electricity (55%),
• Rental and quick rental power plants have overtaken the IPPs and its share has reached to 21.5% (2096 MW) as of April, 2014 (Table)
• Average generation cost has considerably increased over the years (111.2% between FY2010 and FY2013)
• Existing mix of sources cannot be considered ‘sustainable’ • The costly rental and quick rental power plants could only met the temporary
demands • Need to be replaced by low cost, large scale power plants and other alternate
sources • Existing rental and quick rental plants will be one of the major sources of electricity,
at least till 2018 • Likelihood of exit of rental power plants in immediate future is rather low
V. SUSTAINABLE POWER SECTOR DEVELOPMENT: WHETHER IN RIGHT DIRECTION

CPD (2014): State of the Bangladesh Economy in FY2014 (Third Reading) 45
Efficiency in the Power Sector • Fuel-mix in Power Generation • Gas continues to be the major fuel for power generation.
• Reducing the current dependence on liquid fuel (such as HFO and HSD) from the existing level by 2016 appears to be highly unlikely given the limited progress in power generation through alternate sources such as coal and LNG (Table)
• Existing pattern of fuel-mix is likely to continue to have implications for generation cost of electricity
• PDB has set the long term target for diversifying the fuel-mix by 2030 • About 18000 MW (50% of total generation) will be generated by coal; of which
about 60% is targeted to be generated by local coal • Given the slow progress in developing the local coal base the targeted level of
change in fuel mix will be difficult to attain Fuel-mix at
present (FY2014) Plan for fuel-mix
2013-14 2014-15 2015-16 Import Based 2.5 4.8 4.5 LNG based 1.6 Liquid Energy Based 16.5 16.7 12.5 6.1 Hydro 2.3 1.9 1.7 1.5 Coal 3.1 1.9 1.7 6.9 Gas 78.1 77.0 79.4 79.4 Total (%) 100.0 100.0 100.0 100.0
Fuel-Wise Power Generation Plan
V. SUSTAINABLE POWER SECTOR DEVELOPMENT: WHETHER IN RIGHT DIRECTION

CPD (2014): State of the Bangladesh Economy in FY2014 (Third Reading) 46
• Operational Efficiency – PDB • The choice of fuel use has significant impact in the generation cost of the PDB’s
power plants. • Of the total capacity of BPDB (5,088 MW), about 50% is generated by gas, 15.3%
by HFO, 4.9% by coal and 4.5 per cent by water (Table) • Generation cost significantly varies for different types of fuel - from as low as
Tk.0.88/kwh in hydropower and Tk.1.97 in gas-based power-plants to as high as Tk.17.8 in HFO and even Tk.43.9 in case of use of diesel
Generation
plant under power station Capacity
Share (%)
Plant Factor
(%)
Variable cost
Fixed cost Tk/ Kwh
Generation cost
Tk/Kwh
Fuel cost Tk/kWh
O & M cost Tk/
kWh Water 230 4.5 44 0.14 0.74 0.88 Gas 2537 49.9 42 1.03 0.17 0.77 1.97 Coal 250 4.9 53 4.65 0.25 0.81 5.71 HFO 791 15.5 15 15.15 0.29 2.41 17.85 Diesel 146 2.9 6 28.78 9.26 5.88 43.91 Sub-total 3954 77.7 36 2.63 0.24 0.94 3.8 Public Co. 1134 22.3 54 0.26 0.75 1 2.01 Grand total
5088 100.0 1.9 0.4 1.0 3.3
Generation Costs for BPDB’s Power Plants
Source: BPDB
• Failure to use more (low plant factor) of the low cost gas, water and coal-based power plants (low plant factor) at the required high level
• Low level of efficiency of the plants due to outdated machineries and lack of adequate supply of gas
• Resulting in incurring the burden of additional cost.
V. SUSTAINABLE POWER SECTOR DEVELOPMENT: WHETHER IN RIGHT DIRECTION

CPD (2014): State of the Bangladesh Economy in FY2014 (Third Reading) 47
• Operational efficiency – IPP • Over 80% electricity generated by IPP and SIPP power plants is by gas and the rest 20%
is by HFO • The cost structure of BPDB and IPP/SIPP of similar fuel-based plants are not same -
overall generation cost in the IPP is about Tk.0.22 per kwh higher than that of BPDB • Generation cost in HFO-based plants is Tk.0.08 per kwh less than that of BPDB
and that of gas-based plants is Tk.0.3 per kwh higher than that of BPDB (Table) • The plant factor for gas-based IPP is about 26.1 percentage points higher than that of
BPDB although the generation cost in the former is higher than that of the latter • Given the limited supply of gas, it is better to supply gas to well-maintained BPDB plants
to generate electricity at lower cost
Generation plant under
power station Capacity
Share Plant Factor
(%)
Variable cost Fixed cost Tk/ kwh
Generation cost
Tk/kwh
Fuel cost Tk/ kWh
Variable O & M Tk/
kWh Total IPP &
SIPP 1516 100.0
69 2.91 0.12 1.76 4.08 HFO 297 19.6 41 13.81 3.95 17.77 Gas 1219 80.4 76 0.65 0.14 1.47 2.27
Difference in costs (IPP/SIPP is less/greater than PDB) HFO -297 -1.34 -0.29 1.54 -0.08 Gas -1318 0.68 0.03 -0.7 0.3
Generation Costs for IPP’s Power Plants
• Needed changes are difficult to attain in most cases because of locational and other constraints
V. SUSTAINABLE POWER SECTOR DEVELOPMENT: WHETHER IN RIGHT DIRECTION

CPD (2014): State of the Bangladesh Economy in FY2014 (Third Reading) 48
• Operational efficiency – Rental/QRR • Rental power plants generate electricity by using gas (40%), HFO (42%) & diesel (18.7%) • There is wide difference in the plant factor for different types of plants reflecting
operational priorities in fuel-mix based on the differences in the generation cost (Table) • Rental power plants generate electricity in HFO and diesel-based power plants at lower
cost; but they generate electricity in gas-based power plants at higher cost. • With high generation cost in gas-based rental and QRR power plants, an average plant
factor of 71% indicates inefficiency in operation when low cost plants of BPDB and IPP remain underutilised
• However, this is difficult to attain because of locational and other constraints
Generation plant under power station
Capacity
Share Plant
Factor (%)
Variable cost Fixed cost Tk/ kwh
Generation cost Tk/kwh
Fuel cost Tk/ kWh Variable O & M
Tk/ kWh
Total IPP & SIPP 1516 100.0
69 2.91 0.12 1.76 4.08 HFO 297 19.6 41 13.81 3.95 17.77 Gas 1219 80.4 76 0.65 0.14 1.47 2.27
Difference in costs (IPP/SIPP is less/greater than PDB) HFO -297 -1.34 -0.29 1.54 -0.08 Gas -1318 0.68 0.03 -0.7 0.3
Generation Costs for IPP’s Power Plants
V. SUSTAINABLE POWER SECTOR DEVELOPMENT: WHETHER IN RIGHT DIRECTION

CPD (2014): State of the Bangladesh Economy in FY2014 (Third Reading) 49
• It appears that there is operational inefficiency involving various types of power plants which is contributing towards higher cost burden to the users (Table)
• Public entities entasked to maintain operational efficiency (e.g. NLDC) needs to be strengthened to cope with and more efficient in order to reduce the overall generation cost.
• A major challenge for the power sector is to take into account the rapid changes in the structure of demand for electricity and thereby to generate adequate amount of electricity accordingly
• BPDB will need to cater to the growing demand for electricity by using more low-cost power plants as well as by bringing down the share of high cost power plants
• By ensuring the right balance between base load and peaking plants
BPDB IPP/SIPP Rental/QRR
Plant factor Generation
cost Plant factor Generation
cost Plant factor Generati
on cost Gas 49.9 1.97 80.4 2.27 40.3 4.58 HFO 15.5 17.85 19.6 17.77 42.3 17.58 Diesel 2.9 43.91 18.7 27.24
Inefficiency in Power Plant Operation
V. SUSTAINABLE POWER SECTOR DEVELOPMENT: WHETHER IN RIGHT DIRECTION

CPD (2014): State of the Bangladesh Economy in FY2014 (Third Reading) 50
Exit issue of QRRs • A total of 18 quick rental power plants are currently in operation and the majority of
these plants are supposed to exit by 2014-17 • A total of six plants have been contracted for the second term (with a generation
capacity of 434 MW) with the same contractual arrangements • The contracts of the rest of the rental and quick rental plants are likely to be
renewed for yet another term • There is little justification to renew the contracts with same contractual arrangement
• Alternate estimates shows that average tariff would be reduced by as low as Tk.3.20 to as high as Tk.4.22 (Table)
Name of plants
Under the new contractual arrangement Possible alternatives for adjustment of costs
Tariff Before Renewal
Tariff after renewal
Changes in tariff (Tk./kwh) Liberalized
tariff (fixed cost=zero)
Liberalized tariff (fixed
cost=20 % of the initial
rental cost)
Changes in tariff (Tk./kwh) (fixed cost=zero)
Changes in tariff
(Tk./kwh) (fixed cost=20 % of the initial rental cost)
1 2 3 4= (3-2) 5 6 7 = (5-2) 8=(6-2) Siddhirganj 100 MW QRPP 19.57 19.54 -0.03 16.4 17.1 -3.17 -2.47
Ghorarshal 78.5 MW QRPP 5.41 3.29 -2.12 1.22 2.0 -4.19 -3.41
Khulna 55 MW QRPP 21.26 19.55 -1.71 18.1 18.6 -3.16 -3.16
B Baria 70 MW QRPP 5.42 5.36 -0.06 1.2 2.0 -4.22 -3.42
Ashuganj 80 MW QRPP 5.4 5.4 0.0 1.2 2.0 -4.2 -3.4
Pagla 50 MW QRPP 20.4 20.0 -0.41 17 17.2 -3.4 -3.2
Estimated Tariff under Different Terms and Conditions
V. SUSTAINABLE POWER SECTOR DEVELOPMENT: WHETHER IN RIGHT DIRECTION

CPD (2014): State of the Bangladesh Economy in FY2014 (Third Reading) 51
• The progress of power generation plants currently being implemented under the BPDB is not satisfactory (Table).
• A total of 14 ADP-projects is supposed to be completed in FY2014: only two projects are likely to be completed; another two projects have made considerable progress (50 – 70%). Rest has made only insignificant progress.
• Lack of planning in project implementation is a major weakness which is partly related to failure to get confirmation about supply of gas from the Petrobangla.
• Because of the delay of public sector projects, the likelihood of discontinuing the QRRs after the existing phase was rather bleak.
Name of Project Expected time of Implementation
Total Cost Cumulative Expenditure up to March, 2014
% Expenditure of total Cost
Total Cost GOB Project Aid Total GOB Project Aid
Bhola 225 MW Duel Fuel Combined Cycle Power Plant
9/30/2014 200141.69 59561.88 140579.812 37632.86 32908.09 4724.77 18.8
Shahjibazar 330 MW Combined Cycle Power Plant
12/30/2015 271642.93 84063.64 194579.29 0.52 0 0.52 0.0
Bheramara Combined Cycle Power Plant (360MW) Development
12/31/2014 414048 91937.59 322108.42 31672.88 2316.24 27486.69 7.6
Implementation Status of Selected Power Sector related ADP Projects
V. SUSTAINABLE POWER SECTOR DEVELOPMENT: WHETHER IN RIGHT DIRECTION

CPD (2014): State of the Bangladesh Economy in FY2014 (Third Reading) 52
Generation of Electricity through Alternate Sources • According to the renewable energy policy, about 5% of total electricity was planned to be
supplied by 2015 from alternate sources: this will be increased to 10% by 2020 • Targeted level of renewable energy is about 800 MW to be generated through solar
and biogas • Progress made so far has been insignificant- about 139 MW of renewable energy
generation capacity has been installed till FY2014 (Table) • Another 39MW of capacity was to be installed in FY2015 (projected)
• The progress with respect to other programmes is rather slow • Solar mini grid (100 KW till FY14 against target of 1434 KW by FY15) and solar
irrigation pump program (till 38.9Kw against target 1789 kW by FY15) • Scarcity of resources is one of the major problems in implementing renewable energy
related projects; more grants and subsidized credit are needed
Sources Installed Capacity
Till FY2013-14 During FY2013-14 FY2014-15 (Projected) Solar Home System 137MW 29.21MW 38.61 MW
Biogas Plant for Cooking 33,166 4,745 15,400 Solar Mini Grid 100kW 382kW 1434kW Solar Irrigation Pump 38.92kW 217.45kW 1789.46kW Biogas based Power Plant 518kW 64kW 207.5kW Biomass based Power Plant 650kW 0 0
Renewable Energy: Installed Capacity
V. SUSTAINABLE POWER SECTOR DEVELOPMENT: WHETHER IN RIGHT DIRECTION

CPD (2014): State of the Bangladesh Economy in FY2014 (Third Reading) 53
• Availability of Gas as Primary Energy • Domestic gas reserve has been depleted over the past years which reduced the scope
of using gas for the power sector • Petrobangla will be able to supply gas only till 2017 to the BPDB
• Using different levels of consumption of gas as suggested by the Petrobangla, an exercise has been carried out to understand the possible duration of availability of gas
• The remaining gas reserve under the three different scenarios of consumption level was likely to be as low as 14 years (with the projected demand level of 1.45 tcf for FY 2016) to as high as 26 years (with the current level of production of 0.8 tcf) (Figure)
• Under such a scenario the remaining available gas reserve will be exhausted between 2028 and 2040.
Possible Years of Gas Reserve in the Country
V. SUSTAINABLE POWER SECTOR DEVELOPMENT: WHETHER IN RIGHT DIRECTION
VI. EXPORT SECTOR PERFORMANCE: FLUCTUATING FORTUNES
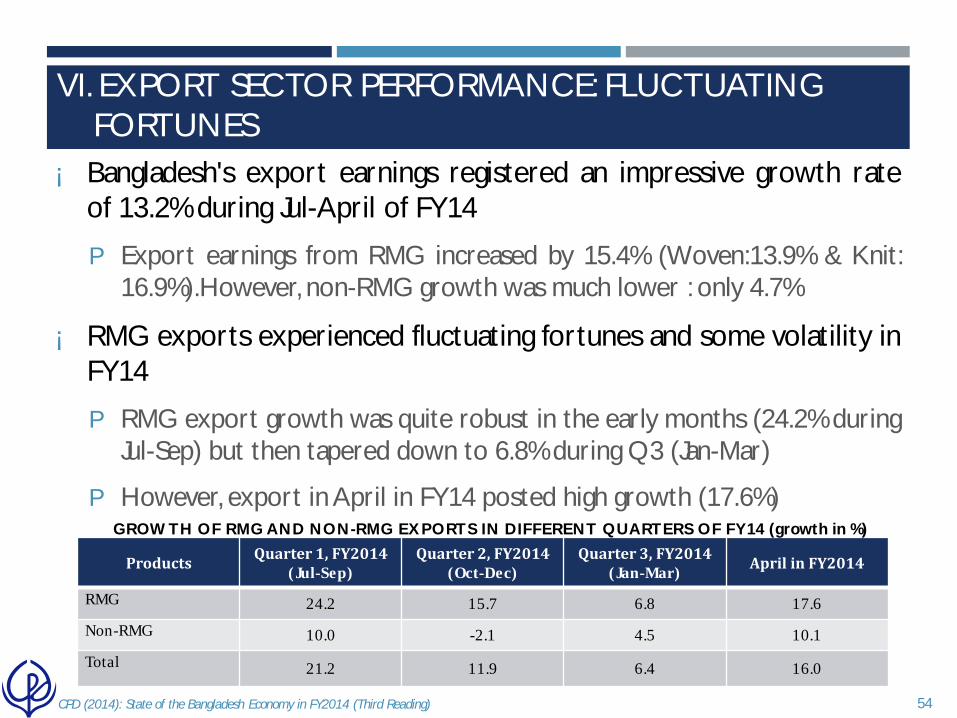
¡ Bangladesh's export earnings registered an impressive growth rate of 13.2% during Jul-April of FY14
P Export earnings from RMG increased by 15.4% (Woven:13.9% & Knit: 16.9%).However, non-RMG growth was much lower : only 4.7%
¡ RMG exports experienced fluctuating fortunes and some volatility in FY14
P RMG export growth was quite robust in the early months (24.2% during Jul-Sep) but then tapered down to 6.8% during Q3 (Jan-Mar)
P However, export in April in FY14 posted high growth (17.6%)
54 CPD (2014): State of the Bangladesh Economy in FY2014 (Third Reading)
Products Quarter 1, FY2014 (Jul-Sep)
Quarter 2, FY2014 (Oct-Dec)
Quarter 3, FY2014 (Jan-Mar) April in FY2014
RMG 24.2 15.7 6.8 17.6
Non-RMG 10.0 -2.1 4.5 10.1
Total 21.2 11.9 6.4 16.0
GROWTH OF RMG AND NON-RMG EXPORTS IN DIFFERENT QUARTERS OF FY14 (growth in %)

Market Decomposition
¡ Market decomposition data for the RMG exports showed that exports in the US market posted a moderate growth (8.4%) during Jul-Mar of FY14 P USITC (2014) data showed that woven items registered 6.5% growth
where as knitwear experienced 8.4% growth
P In the US, Vietnam (16.1%), India (10.2%) and Turkey (12.0%) performed better than Bangladesh (USITC, 2014)
¡ In the EU market, RMG sector achieved higher growth (14.6%) during Jul-Feb in FY14 P In the EU, Bangladesh's performance is better than her major
competitors such as Vietnam (6.3%), Turkey (1.3%) and India (5.6%)
P However, Cambodia was able to post a significantly high growth of 27.3% for RMG exports
55 CPD (2014): State of the Bangladesh Economy in FY2014 (Third Reading)
VI. EXPORT SECTOR PERFORMANCE: FLUCTUATING FORTUNES

Compliance Issues in the RMG Sector ¡ Despite the impressive growth performance, the RMG industry is facing formidable
challenges in view of the Rana Plaza tragedy
¡ The government has come up with a number of measures (tax cut, incentives, provision of low cost funds). Support measures should be contingent on compliance assurance steps, enforcement of TU rights, implementation of minimum ways
¡ Over the years, the fate of the export-oriented RMG sector will critically hinge on the successful implementation of the various elements of the Action Plan
¡ BGMEA also had provided a list of 176 factories which were closed down during post-Rana Plaza Period P However, initial findings of CPD’s survey of these 176 factories indicate that several
factories were closed down due to several reasons including ownership problems, wage hikes, lack of competitiveness, infrastructural issues and other reasons
56 CPD (2014): State of the Bangladesh Economy in FY2014 (Third Reading)
Initiatives Total number of factories Number of Factories Inspected
Factories Closed Down
ACCORD 1500 550 16
ALLIANCE 626 519 3
ILO & BUET 1300 252 2
Total 3426 1321 21
Factory Inspection Report By Accord, Alliance and ILO &BUET
VI. EXPORT SECTOR PERFORMANCE: FLUCTUATING FORTUNES

¡ It has been reported that about 14 thousand workers have lost jobs as a result of the closure of RMG factories
P Alliance has agreed to pay 50% of the salary of workers in those factories
P Accord and ILO are yet to agree to pay any compensation to the workers
¡ In view of the emerging issues an effective mechanism of financial supports for the laid-off workers should be put in place
¡ Low cost fund and soft loans should be provided to the factories to help them to take necessary corrective measures
¡ Particular attention ought to be given to the needs of subcontracting firms which will need technical and financial support
57 CPD (2014): State of the Bangladesh Economy in FY2014 (Third Reading)
VI. EXPORT SECTOR PERFORMANCE: FLUCTUATING FORTUNES

Non-RMG Export: Short of Target
¡ Despite the higher growth target (15.5%) for non-RMG sector, the actual growth performance was much lower (4.7%)
P Over the next two months the required growth rate, 62.5%, will be impossible to achieve
P Leather (33.9%), footwear (30.2%) and frozen food (23.3%) experienced very high growth in the first ten months of FY14
P The performance of home textiles (0.22 per cent growth), jute and jute goods (-21.1 per cent), petroleum Bi products (-42.4 per cent) and cotton (-2.7 per cent) were discouraging
P Performance of jute and jute goods exports has continued to slow downward trend with concomitant adverse multiplier effects in the economy
58 CPD (2014): State of the Bangladesh Economy in FY2014 (Third Reading)
VI. EXPORT SECTOR PERFORMANCE: FLUCTUATING FORTUNES

Non-RMG : South-South Trade
¡ Bangladesh’s South-South trade has been on the rise P Bangladesh’s non-RMG export experienced commendable growth in
China (66.0%) and Korea (74.4%) during Jul-Apr period of FY14 where as non-RMG exports registered negative growth in Brazil (-26.4%), UAE (-19.1%), Hong Kong (-19.7 %) and India (- 40.3%)
P India has emerged as an important trading partner of Bangladesh
P Despite the higher growth in recent years, Bangladesh’s export to India decreased by (-) 33.2% during Jul-Apr of FY14, in spite of the recently offered duty free market access initiative of India
P Trade facilitation related measures including infrastructure related bottlenecks, customs and port related facilities and non-tariff barriers are crucial to take full advantage of India’s market access offer (CPD Study, 2014)
59 CPD (2014): State of the Bangladesh Economy in FY2014 (Third Reading)
VI. EXPORT SECTOR PERFORMANCE: FLUCTUATING FORTUNES
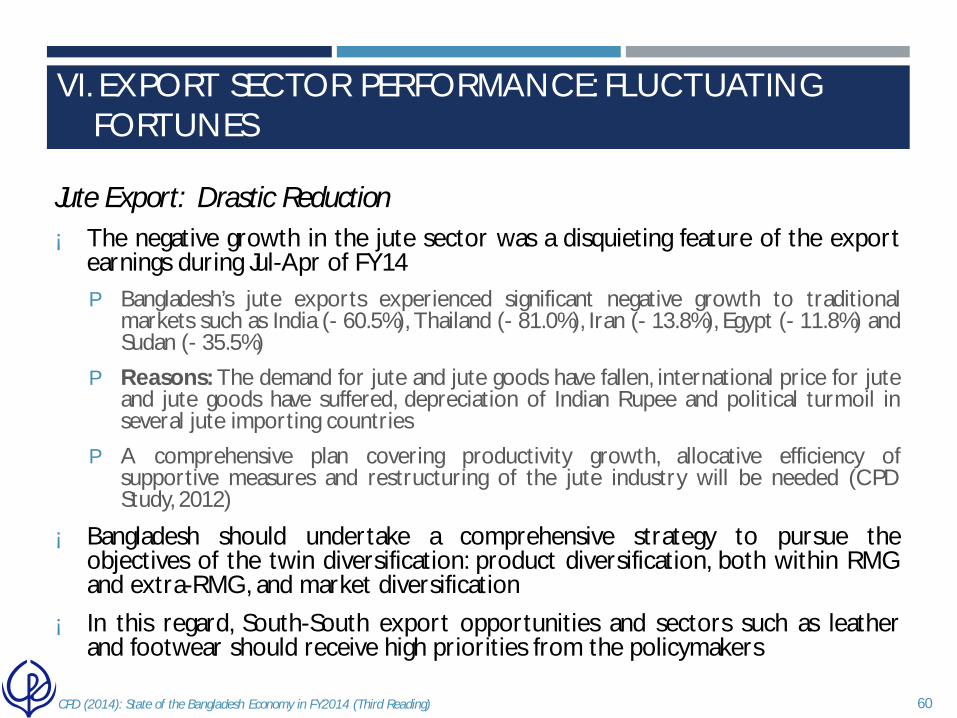
Jute Export: Drastic Reduction ¡ The negative growth in the jute sector was a disquieting feature of the export
earnings during Jul-Apr of FY14 P Bangladesh’s jute exports experienced significant negative growth to traditional
markets such as India (- 60.5%), Thailand (- 81.0%), Iran (- 13.8%), Egypt (- 11.8%) and Sudan (- 35.5%)
P Reasons: The demand for jute and jute goods have fallen, international price for jute and jute goods have suffered, depreciation of Indian Rupee and political turmoil in several jute importing countries
P A comprehensive plan covering productivity growth, allocative efficiency of supportive measures and restructuring of the jute industry will be needed (CPD Study, 2012)
¡ Bangladesh should undertake a comprehensive strategy to pursue the objectives of the twin diversification: product diversification, both within RMG and extra-RMG, and market diversification
¡ In this regard, South-South export opportunities and sectors such as leather and footwear should receive high priorities from the policymakers
60 CPD (2014): State of the Bangladesh Economy in FY2014 (Third Reading)
VI. EXPORT SECTOR PERFORMANCE: FLUCTUATING FORTUNES

VII. CONCLUDING REMARKS ¡ As our analyses reveal, the fiscal framework envisioned in the budget for FY2014 has
weakened to a considerable degree P domestic resource mobilisation has been losing its buoyancy and has underperformed
P the value for money spent for public expenditure has suffered erosion in view of weak implementation record of projects
P private sector credit is not picking up
P because of reasons of lower net aid flow, dependence on domestic resources to underwrite deficit financing has been on the rise
¡ The first half of FY2014 saw significant disruption in macroeconomic management
¡ However, in the second half of FY2014, despite the relative respite, uncertainties continued to adversely affect private sector investment
¡ Both the above woes had undermined the performance of key macroeconomic performance indicators and attainment of medium term developmental targets of the economy
¡ The economy is somewhat stable, manifested in contained inflation, sustained exchange rates and high foreign exchange reserves, but structural weaknesses continue to persist
¡ The key challenge for FY15 is to translate macroeconomic stability into accelerated growth
61 CPD (2014): State of the Bangladesh Economy in FY2014 (Third Reading)

VII. CONCLUDING REMARKS
¡ Many of the concerns flagged by this report are of medium to long term in nature and will not be providing the benchmark of FY15, but will be also shaping its outcomes
¡ The evolving situation may be addressed through institutional strengthening, targeted reforms, good governance at all levels and by putting in place an inclusive and participatory political culture.
¡ The three ‘traditional’ non-economic factors identified by CPD’s report titled ‘A Set of Proposals for the National Budget FY2015’ (released on 4 May 2014
P weak implementation capacity of the state relating to, inter-alia, human resource management, devolution of power and autonomy
P weak oversight capacity relating to, inter-alia, rule of law, democracy and representativeness and control of corruption and leakages
P weak capacity for reforms relating particularly to regulatory, administrative and legal and institutional reforms
62 CPD (2014): State of the Bangladesh Economy in FY2014 (Third Reading)

VII. CONCLUDING REMARKS
¡ These ‘traditional’ factors have been further accentuated by newly emerging ones P a result of aggravation of the old ones
P emanating from the ongoing political scenario triggered by non-participatory elections that have produced a government whose legitimacy is truncated and moral foundation questionable
¡ For Bangladesh, it will become increasingly challenging to – P restore investor confidence
P undertake and enforcing regulatory reforms
P enhance service delivery capacity of institutions
P take advantage of the window of opportunities of strengthened global market integration
P address the ever increasing infrastructure demand in cost-effective manner
P realize the ambition of attaining the status of a middle income country
63 CPD (2014): State of the Bangladesh Economy in FY2014 (Third Reading)

VII. CONCLUDING REMARKS
¡ CPD emphasised five following aspects in the aforesaid report– P Setting up of a Task Force to address pending reform measures including enactment of the
Civil Service Act
P Local governments to be vested with more effective devolution of power and fiscal autonomy
P Enhancement of capacities of agencies involved with implementation of major public investment projects
P Reduction of transaction costs of contract enforcement
P Concrete initiatives towards promotion of a participatory and pluralistic democratic polity, driven by inclusive and credible national elections
¡ It is maintained that the aforesaid recommendations remain crucial as we move towards a new fiscal year, with new ambitious targets as regards resource mobilisations, resource allocation, project implementation and growth performance
¡ The experience of macroeconomic management and likely economic performance record of FY14 strongly suggest that both accelerated GDP growth and distributive justice will critically hinge on how strategically Bangladesh is able to address these formidable tasks, which are often beyond the ambit of budgetary measures
64 CPD (2014): State of the Bangladesh Economy in FY2014 (Third Reading)

THANK YOU