Embed Size (px)
Citation preview

STATE-OF-THE-ART REVIEW OF ECONOMIC EVALUATION OF NON-CONVENTIONAL ENERGY ALTERNATIVES
Meta Systems Inc
December 1980
Bioresources for Energy Project US Department of Agriculture Forest Service Contract No 53-319R-0-137
Table of Contents
Economic Evaluation of Non-Conventional Energy Alternative An Overview i
I Introduction 1
II Social Benefit Cost Analysis 7
1 Social Benefit Cost Analysis An Overview 7 2 UNIDO and Little-Mirrlees Approaches to
Project Evaluation A Comparative Analysis 28 3 The Limits to Project Level Analysis -- Linkage
to Subsector (Industry) and Sector and Intersector Level Analysis 33
4 A Brief Review of Recent Contributions 40
III Technological Alternatives and Efficiency in Energy Use 41
1 Choice of Technology 42 2 Efficiency 47
IV Case Studies in Evaluation of Non-conventional Energy Technologies 56
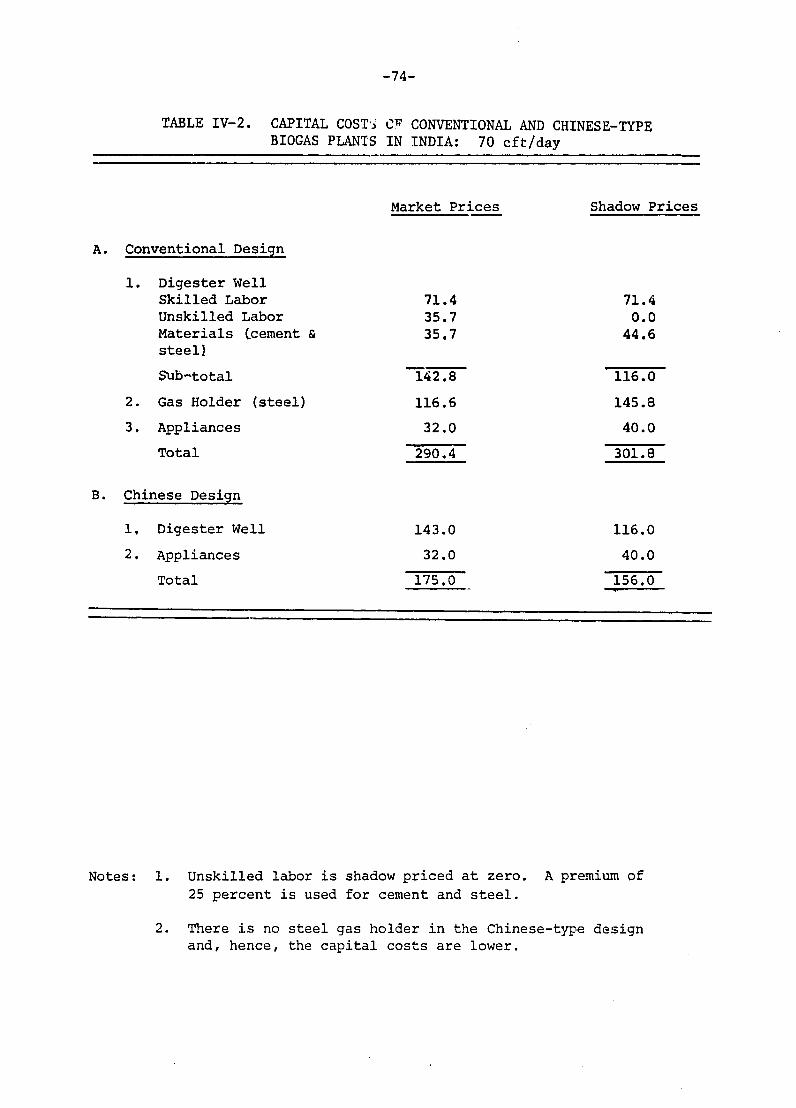
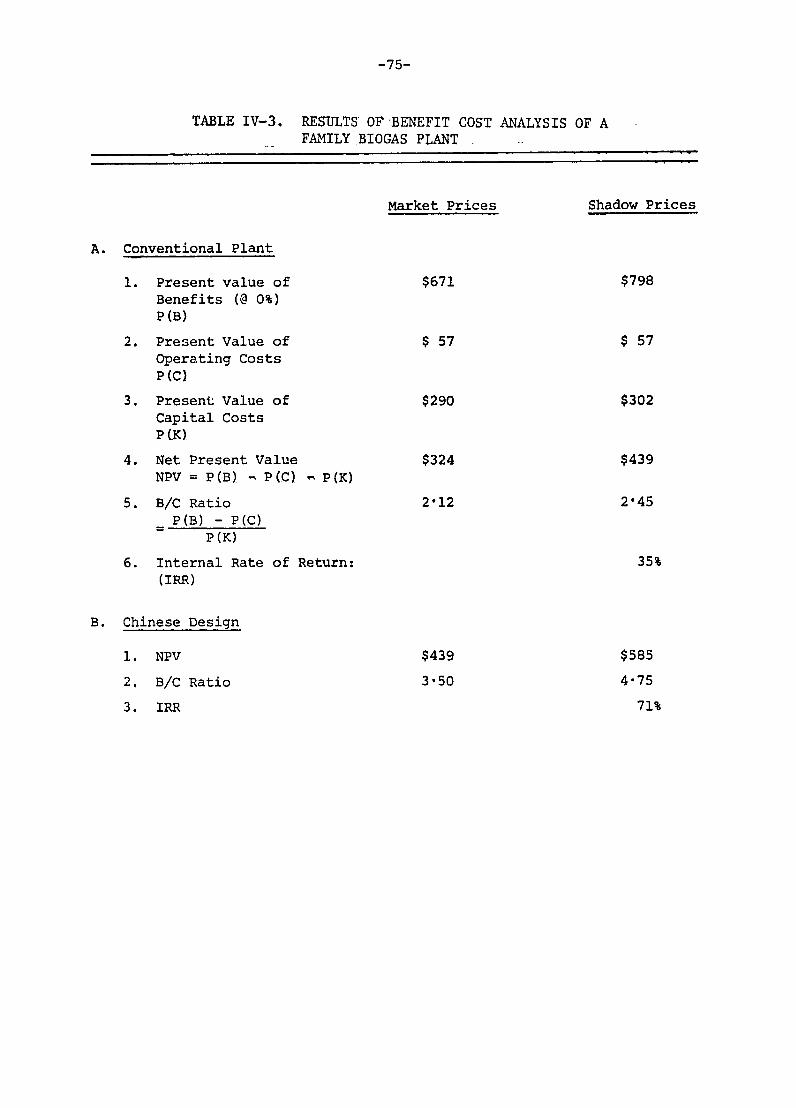
1 Social Benefit Cost Analysis of a Family Biogas Plant 62
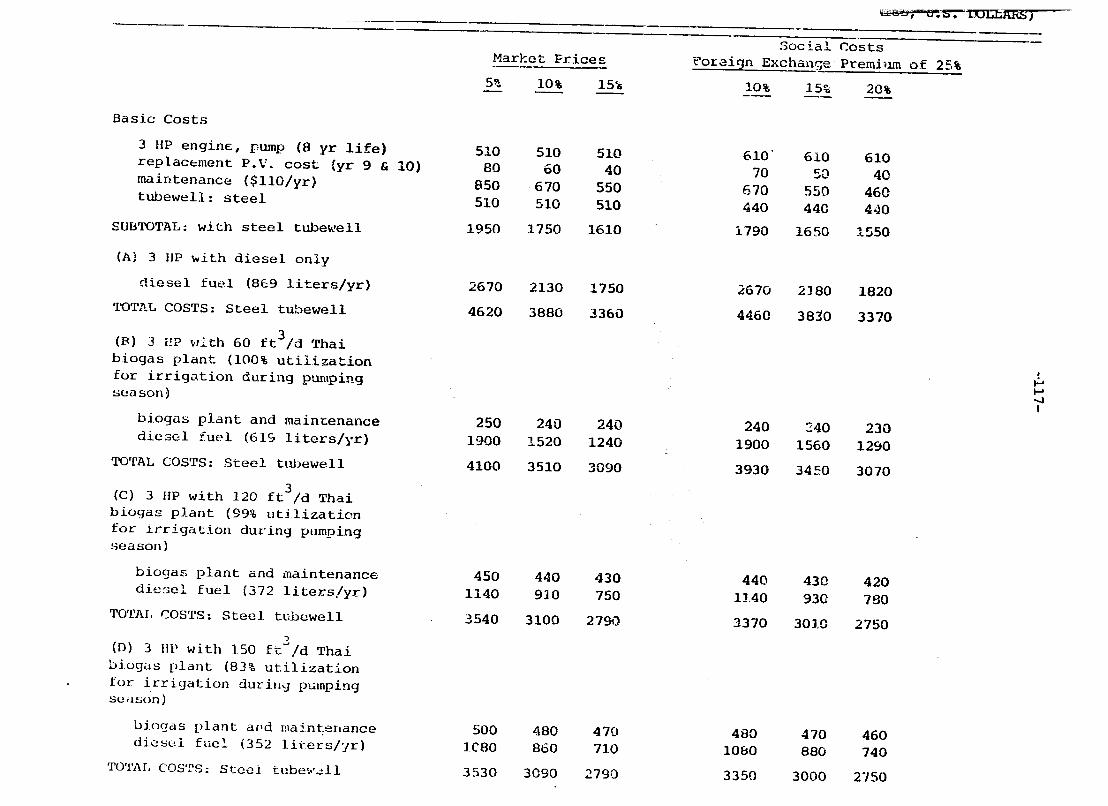
2 Rural Energy SystnmsSample Analysis of Irrigation Plans 76
V Annotated Biblioaraphv on Social Benefit Cost Analysis and Energy Planning135
i eneral Biblicqr5 162
Annexes
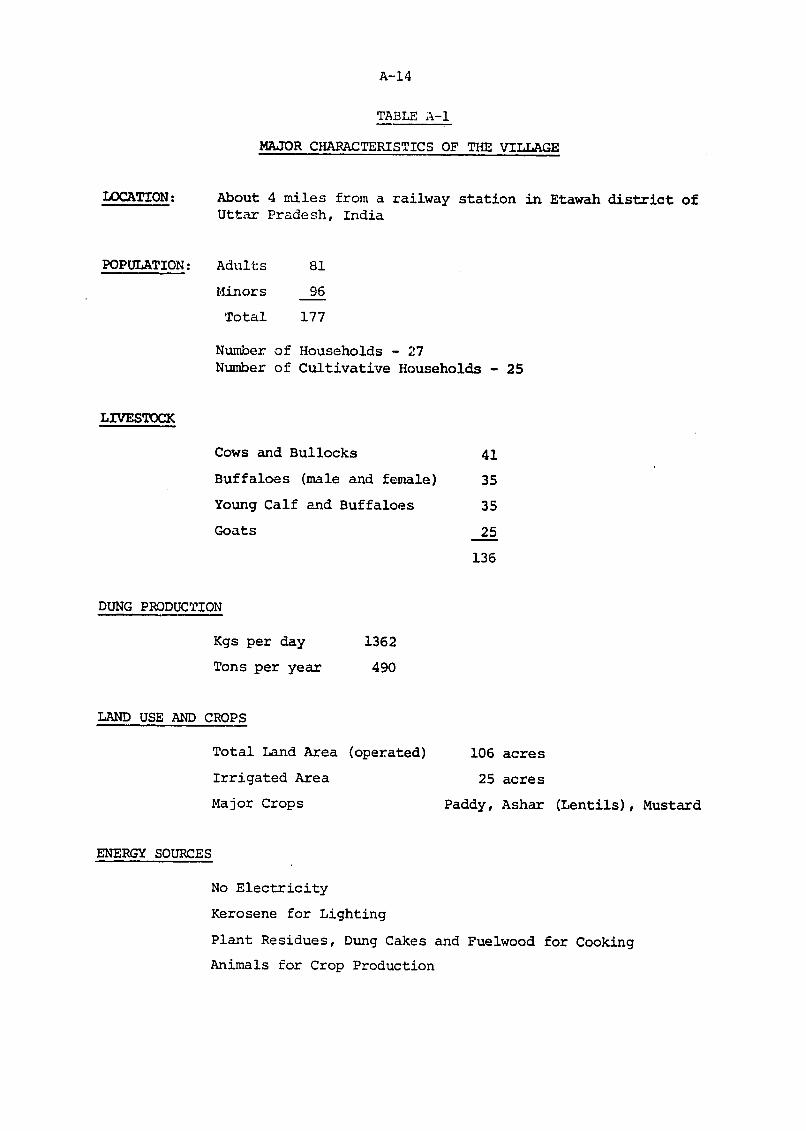
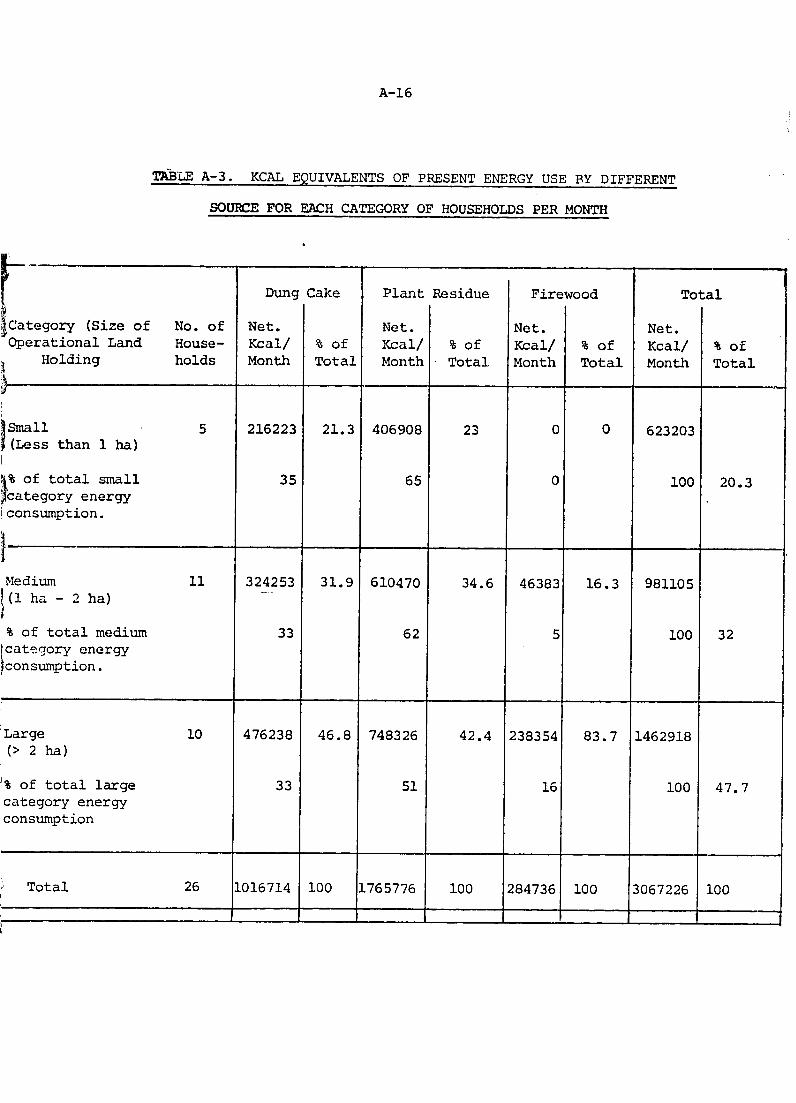
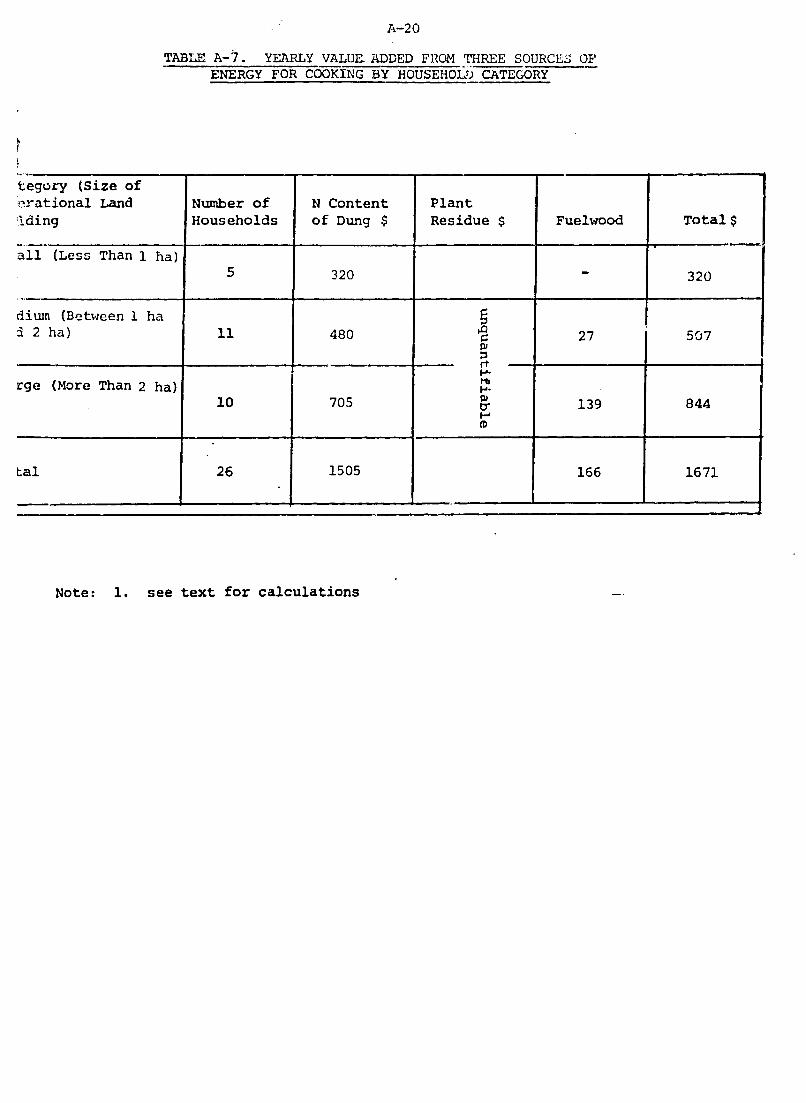
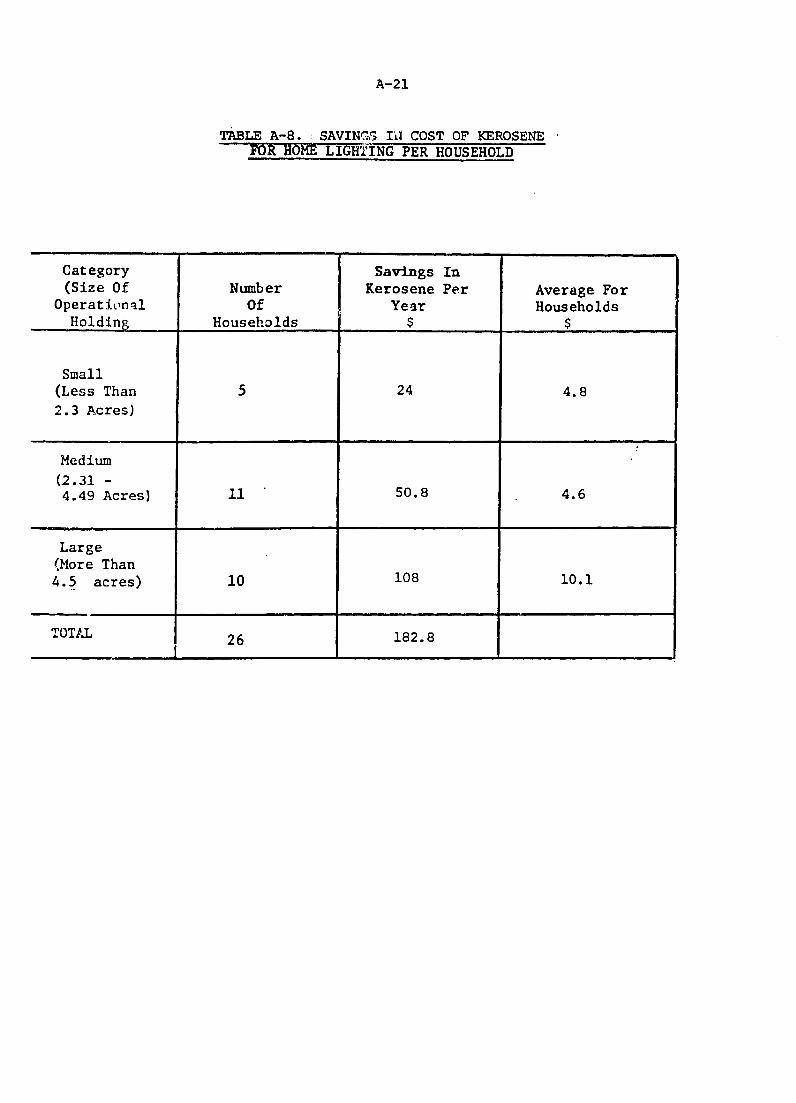
A Economic Evaluation of a Village Level Community Biogas Plant A-1
B Electricity Generation from Biomass B-1 C Appendix to Section IV Estimation of
Calorific Value Parameers C-1
Economic Evaluation of Non-Conventional Energy Alternatives An Overview
1 The economic evaluation of biomass-based renewable energy
technologies would consist of the following three steps
(a) Financial analysis using market prices for inputs
and outputs
(b) Economic analysis in which market prices are replaced
by shadow prices (or accounting prices) which
reflect the real value of outputs to the society
and real resource costs of inputs to the society
The objective used in this analysis is the economshy
ically efficient allocation of resources
(c) A comprehensive social benefit cost analysis which
includes secondary benefits and indirect costs as
well as incorporates the social objectives of
employment income distribution and regional
development This analysis differs from (b) in
that policy objectives other than economic
efficiency are taken into account
2 The financial analysis of a renewable energy project would use
available market prices andor projected market prices for valuation of
outputs and inputs However in developing countries the markets for
The soecific details of these st-s are detailed in thc reorts iisshycussed in Section VA of the main report te ncia hic]iohv
commodities such as biogas fuelwood cow dung organic manure etc
may not exist In such situations market prices for their substitutes
such as kerosene charcoalsoftcoke or commercial fertilizers may be
used after making suitable adjustments The value of direct outputs
and inputs during the life of the project can then be discounted to the
present by using the market interest rate The available decision
criteria of Net Present Value Benefit Cost Ratio and Internal Rate
of Return cn be used to select or rank the project in hand
3 In many developing countries market prices do not represent
the real value (resource cost of an output or input to the society)
on account cf various distortions as a result of taxessubsidies
government controls and income distribution For example price of
kerosene or softcoke used in rural areas may be subsidized for political
reasons while gasoline in urban areas may be taxed for the same reasons
Minimum wage regulations may result in market wages being higher than
the real cost of unskilled labor determined by demand and supply
conditions Similarly foreign exchange market may be regulated by the
government and hence tne official exchange rate may be lower than the
real value of foreign exchange to the society Besides imperfections
in the capital market may result in a multiplicity of distorted interest
rates in the market
4 Due to these and th r c-tortions in factnr markets
and commodity markets it has been suggested c-at in ie-ecz2nzcountries
benefits and costs of a project should be calculated usina shadow
-iiishy
prices (or accounting prices) in place of market prices These shadow
prices would reflect the true value or cost of these outputs and
inputs to the society so that a consistent method of comparison and
ranking of various projects can be used
5 Although the need for using shadow prices in place of market
prices is recognized by many developing countries as well as intershy
national aid agencies there are only a few countries where consistent
estimates of these prices have been made The potential sources for
shadow prices in different countries include the National Economic
Planning Units the National Central Banks international lending
agencies such as the IBRD ADB and the Inter-American Development Bank
UN agencies such as FAO and UNDP and international aid agencies such
as AID and ODA Wherever such numbers are obtained it is always
advisable to review them with the appropriate ministries in the
country concerned
A review of some of the efforts made at estimating shadow prices
in India Ghana Colombia Ivory Coast and Korea are present in
Section 3B the annotated bibliography in the main report
6 In the absence of any available estimates for various shadow
prices the following approximate values or range of values are
suggested below for use in evaluating a renewable energy project
However it must be kept in mind that sensitivity analysis of the
Besides there are alternative theoretical aprnAches available for estimation of these shadow prices Section II pp 8-1t)
-ivshy
project to these parameters should be performed to determine which
parameters need detailed studies
(a) Shadow wage rate Shadow wage rates should be used
for unskilled labor employed in the project over
different seasons For the sake of convenience two
seasons may be distinguished a busy season for
agriculturalforest related activities and a slack
season during which there is relatively very little
employment available Since shadow wage rate would
also depend on the extent of unemployment of unshy
skilled labor it may be useful to divide the country
region on this basis also As an approximation the
following values for shadow wages may be used (i)
In areas of chronic unemployment during slack season
a shadow wage equal to one-fourth (25) of market
wage may be used (ii) In areas of chronic unemployment
during agricultural peak season a shadow wage equal
to one-half (50) of market wage may be used (iii)
In areas of relatively lower unemployment during slack
season a shadow wage equal to three-fourths (75) of
market wage may be used and (iv) In areas where unshy
eiployment levels are relatively low a shadow wage
eaual to market wage during the peak season of agrishy
cultural or forest related activities may be used
(b) Shadow Foreign Exchange It may be correct to assume
that shadow exchange rate would be higher than the
official exchange rate in most developing countries
However the extent of premium to be used would vary
from country to country and from one period to the
other As an approximation if the country concerned
is not experiencing very serious balance of payments
difficulties it is suggested that a shadow price
which is 25 higher than the official rate may be
used In countries which have serious foreign
exchange problems (reflected in low exchange reserves)
a shadow price which is 50 higher than the official
price may be used
Shadow Price of Land Using a correct shadow price of land may
be very important for renewable energy projects especially those
concerned with social forestry scheme or charcoal production In
general the shadow price of land should be equated vo the opportunity
cost of land The opportunity cost of land may be calculated on the
basis of benefits foregone in the alternative use of this land The
benefits foregone may relate to the existing or potential uses of land
for agricultural forest pasture or other industrial uses As an
approximation one can use the benefit foregone in terms of the value
(as shadow Prices) of agricultural commodities which could be grown on
the Piece of land durina the life time of the -roIect The simplest
method may be to assume that one rain-fed foodgrain croc could be
-vishy
potentially grown on this land if not diverted to the project in question
It is recognized that opportunity cost of land can be very project
specific and a lot of subjective judgement may be involved However
it is better to indicate the range of relevant values than to use the
convenient value of zero as the opportunity cost of land
Sociai Rate of Discount and Opportunity Cost of Capital There
are different viewpoints with regard to use of social rate of discount
for projects One approach uses a low social rate of discount along
with a shadow price of investment Another approach uses a relatively
higher rate of discount (Section II p 12) For practical purposes
it would be appropriate to use a range of values 8 10 and 12 for
discounLing without making any adjustments for shadow price of investshy
ment Since estimating opportunity cost of capital is a rather complex
matter in developing countries using a range of values would be
appropriate If a project is found to be sensitive to the rate of
discount ie the choices switch with higher discount rate it may be
necessary to do a detailed analysis of opportunity cost of capital in
that country
Commodity Prices The first correction required is for taxes and
subsidies -- since these are only transfer payments and do not represent
use of real resources If an inputoutput is taxed the tax component
should be removed while using the price for valuation of benefits
In this discussion the discount rates refer to an analysis in constant value The effects of inflation are discounted rior to the calculashytion of these discount rates
-viishy
costs Similarly the element of subsidy should be added to the price
o7 inputoutput concerned
Even after corrections for taxessubsidies the inputoutput prices
may not reflect their opportunity costsvalues For tradable commodities
the relevant exportimport price adjusted for shadow exchange rate should
be used It is necessary to determine whether a commodity is imported
or exported at the margin For example if kerosene (or crude oil
which yields kerosene) is imported (or importable) at the margin the
shadow price to be used will be cif price of kerosene multiplied by
the premium (25 or 50) on foreign exchange However if steel or
cement are exported (or exportable) at the margin the shadow price
would be equal to fob price multiplied by premium on foreign exchange
In the case of non-tradables (electricif-l transport etc) an
attempt should be made to express the costs of non-tradables in terms
of those of tradables For exampie the costs of hydro-electricity may
be expressed in terms of the costs of thermal electricity based on
tradables such as fuel oil or natural gas
7 It should be noted that the above corrections would require
breakdown of costs and benefits into different categories of labor by
season and different materials (steel cement oil products fertilizers
etc) Besides it is important to take a view of the future trends
in the composition of these costs and the prices of various inputs
and outputs This may require a lot of effort on the part of the
analyst However if the benefits and costs have to be viewed from
the perspective of the society (and not frcm the perspective of a
-viiishy
consumerfarmer) this type of data collection and adjustment may be
necessary
8 After the corrections for distortions in factor and commodity
markets have been used in valuation of benefits and costs it may be
necessary to incorporate indirect benefitscosts and other social
objectives of development For example in the case of biogas units
health benefits from cleaner fuel better sanitation better lighting
and the convenience of cooking may have to be evaluated Similarly
the indirect (or secondary) benefits of social forestry projects may
be obtained in terms of control of soil erosion better environmental
conditions and more ground water However if indirect benefits are
added indirect costs of depriving the poorer sections of free cow
dung or free pasture land should also be included on the cost side
9 Since different projects may have different implications on
local employment income distribution among households and regional
development it may be necessary to incorporate these objectives
explicitly into the analysis One of the ways is to put explicit
weights on benefits going to poor households and backward regions
It is suggested that a premium of 10 to 20 may be attached for the
ratio of benefits going to poor householdsregions Since shadow
wage rate for unskilled labor may have been already used it may not be
necessary to put explicit weightage on employment created by the croject
Similarly the preference for the use of indigenous resources vis-ashy
vis importable (or exortable) resources would be reflected through
shadow exchange rate However an explicit premium on the use of local
-ixshy
resources and security and certainty of supplies may be incorporated in
the analysis
10 Even if all the information is available it may not be easy
to estimate the benefits and costs from the societys viewpoint on
account of tle special problems of quantification and valuation in
renewable energy technologies A variety of such problems are illustrated
through the four case studies hich are presented in Section IV and
Annexes A and B It should be recognized that in addition to a wide
variety of information at project and nationalregion levels economic
evaluation would require considerable judgement on the part of the
analyst Thus the quality of economic evaluation of biomass-based
renewable energy technologies would depend as much on the analyst as
on the data base used for analysis
Sample Application
It may be useful to recapitulate the above points by providing a
sample check-list of parameters on which data may have to be obtained for
a village fuelwood plantations project This checklist is based on a
FAO case study of village fuelwood plantations in Korea As a detailed
review of this case study is also available in Section V B an annotated
bibliography
The main parameters on which data are required are as follows
Scone and Technical Specifications
Planting sites and coverage
Type of species and planting
Maintenance and organization
2 Project Costs
Shadow Price of Land
Shadow Wage Rate for Unskilled Labor in Different Seasons
Shadow Price of Foreign Exchange
Costs of Materials (Fertilizers Seedlings)
Costs of Transport
Costs of Supervision and Management
3 Project Output and Benefits
Quantification of Fuelwood ProductionYield
Shadow Price of Fuelwood in terms of value of fuels that it
would replace (eg crop residues coal or kerosene)
Reduction in Soil Erosion and Flood Damages
Improvement of Environment and Weather
Groundwater Quality and Quality
4 Comparing Costs and Benefits
Social Rate of Discount
Decision Criteria NPV BC Ratio and IRR
5 Sensitivity Analysis
Relevant of Shadow Prices of Land and Labor
Range of Social Rate of Discount
Panae for Yield of Fuelwood
Range for Shadow Price of Fuelwood (or substitutes)
-xi-
Although the Korean case study referred to above provides a good
format for carrying out similar studies one must keep in mind some
of its limitations It should have spent more effort on estimation
of shadow prices of land labor and fuelwood
The study has assumed that land under the project would have no
alternative economic use for the period of the project and therefore
land is valued at zero It is inconceivable that an area of 127000
hectares can be found which has no potential alternative economic
use in the next twenty years Hence it may be necessary to estimate
the opportunity cost of land in terms of benefits foregone
The opportunity cost of unskilled labor is calculated on the basis
of average earnings of self-employed workers during November-March
This does not seem to be satisfactory since it is not clear as to how
many people in the region can earn the amount used as opportunity cost
of labor during the entire period If many workers remain unemployed
or earn less than the average earnings a lower shadow wage rate should
be used
Similarly the valuation of fuelwood is arbitrary It is mentioned
that since fuelwood is not traded at present the fuelwood has been
valued in terms of the value of fuels that it would replace handy
agricultural residues and coal Although the methodology used is
correct the prices of alternative fuels used are arbitrary The
entire economics of the project would be very different if prices other
than those assumed in the report are used
-xii-
The Korean case study furthermore does not attempt to quantify and
value the indirect (secondary and tertiary) benefits of fuelwood
plantation projects which accrue to the society in terms of a reduction
in soil erosion and flood damages and an improvement in quantity and
quality of groundwater As some research work on these aspects is
underway in India Nepal and the Philippines it should be possible
to incorporate these benefits in the economic evaluation of similar
projects in the future
Section I
INTRODUCTION
The economic viability and social profitability of a renewable
energy technology or a program are necessary conditions for success
A consumer will not invest in an improved stove or a biogas unit if
this is not considered a financially viable proposition Similarly
a project or a program would have to be shown socially profitable
before substantial subsidaries may be given to individual users or
large scale public investments may be committed Social Benefit
Cost Analysis (SBCA) has traditionally been used as a method of
selection andor ranking of projects
An overview of the salient features of this methodology is
presented here as a background to illustrate the complex problems of
economic evaluation of renewable energy technologies Briefly an
economic evaluation of a project would consist of the following steps
(i) calculating the financial viability of the project when benefits and costs are valued at market prices and market interest rate is used for the opportunity cost of capital
(ii) making corrections in financial costs and benefits by eliminating taxes and subsidiaries which are treated as transfer payments and do not reflect real resource costs
(iii) recognizing the distortions in market prices on account of price and quantity controls minimum wage regulations imperfect capital markets and regulations of trade and foreign exchange by the government and hence replacing the market prices by accounting prices or shadow prices which reflect the real values of inputs and outputs of each project
-2shy
(iv) incorporating considerations of income distribution regional development and employment through explicit weights on these objectives and
(v) calculating the social profitability of the project by using appropriate values of social rate of disshycount and shadow price of investment to estimate Net Present Value Benefit Cost Ratio and the Internal Rate of Return
Although these components of social benefit cost analysis are
known and many governments wish to use these for economic evaluation
of projects it is common to find that not much effort has been made
to estimate a consistent set of values for national and regional
parameters such as social rate of discount shadow price of investment
shadow price of foreign exchange shadow wage rates for various labor
categories over various seasons in different regions and shadow prices
of many other inputs (eg electricity cement goods transport)
Thus as a part of (or rather a prelude to) doing an economic evaluashy
tion of non-conventional energy sources one has to estimate values
of parameters such as social rate of discount as well as various
shadow prices listed above Although this takes the evaluator much
beyond the scope of his work such estimates acceptable to the
planners of the country as well as to others concerned with the
project are prerequisite to the evaluation of the project under
consideration Similarly considerations of income distribution
regional development and employment are rarely included in actual
analyses of any projects (not just non-conventional energy projects)
on account of difficulties of measurement andor problems of finding
acceptable or desirable weights on these objectives Hence such
-3shy
social considerations have to be explicitly included as an important
component of the economic evaluation of non-conventional energy sources
The economic evaluation becomes particularly complex in the case
of non-conventional energy sources in developing countries because
of the following reasons
(i) In many cases valuation of benefits and costs cannot be done at market prices since markets for major outshyputs and inputs may not exist For example in evaluating the benefits from a biogas plant willingshyness to pay of the consumers cannot be measured since it has not been expressed in a market place At the same time the costs of major input such as cow dung cannot be expressed in monetary terms since cow dung is usually not bought and sold in the market Hence the usual methods of evaluation at market prices break down in such cases
(ii) Not only are there no markets for major outputs and inputs it is also difficult to estimate the value of substitutes or opportunity costs of resources used in producing inputs In the same example of biogas plant the benefit of biogas could be estimated indirectly in terms of the value of commodities for which biogas is used as a substitute If biogas is used mainly for lighting or running an engine the benefits can be estimated in terms of the value of kerosene and diesel oil saved However if biogas is used for cooking and replaces fuelwood or dungcakes (not kerosene) valuation of gas becomes rather difficult since neither fuelwood nor dungcakes might have been purchased in the market The situation becomes further complicated if one tries to estimate the cost of labor input that goes into collection of fuelwood andor dungcakes If these fuel sources are collected by men women and children in their spare time it would not be correct to value their time at the going market wage rate which may be relevant only for the peak agricultural season This would require estimating the cost of using leisure time for these activities and would become rather subjective Valuation of other inputs such as land in terms of opportunity costs is equally difficult For example it may be very difficult to estimate the opportunity cost of land in growing sugarcane which in turn is used for producing fuel alcohol
-4-
The opportunity cost of land would be equal to zero if it is not being currently used and does not have other potential uses It would be equal to the value of benefits foregone if diversion of land to sugarshycane reduces agricultural output milk output andor draft power Similar issues become important while evaluating the benefits and costs of fuelwood plantation6 improved charcoal production or improved stoves
(iii) It is important to realize that introduction of an energy technology will alter a multitude of resource flows on account of interdependent use patterns of different resources in the rural setup More specifishycally each technological option has different impacts on various economic groups such as small farmers or landless laborers and hence such income distribution issues would have to be incorporated in the evaluation of each alternative Besides various groups in rural areas have differential access to and ownership of resources such as land labor trees cattle and investshyment funds as is also the case with political power Since successful adoption of an energy technology depends on the access to these resources it is important to consider these issues explicitly1
In the case of non-conventional energy technologies there are also some special types of uncertainties In many cases the cost and performance characteristics of many of these technologies are not known to the same degree of accuracy (and confidence) as in the case of conventional technologies The examples in this category are gasifiers gas engines and Stirling engines of appropriate sizes
Whenever costs and performance characteristics are known as in the case of biogas plants these may be rather site-specific and hence cannot be projected fcr other regionsconditions with the same level of confidence This gives rise to the problem of estimating the various levels of reliability and availability of these technologies This introduces an element of subjective judgement when these nonshyconventional Lechnologies are compared with convenshytional technologies (such as diesel engines)
IThe importance of understanding these interrelations and the significance of analyzing the processes of generation and use of energy in rural areas have been discussed in Briscoe (1979) deLucia and Tabors in deLucia Jacobv et al (1980) and Bhatia (1980)
-5-
These complexities and the various means of dealing with them
are the principal focus of the remaining sections of this report
Organization of the Report
This report is divided into the following sections Section II
presents a brief review of the recent contributions to the methodology
of social benefit cost analysis In Section III a discussion of
various issues connected with range of technical alternatives technoshy
economic aspects of scale and reliability and measurement of efficiency
is presented
In view of the special problems and issues in economic evaluation
of non-conventional energy sources as discussed earlier major
principles involved in quantification and valuation of benefits and
costs have been illustrated through a set of case studies Section IV
and the Annexes present the following case studies
(i) The focus of the first case study on social benefit
cost analysis of a biogas plant is on quantification and
valuation of benefits
(ii) The second study is an economic analysis of various
irrigation systems which can use alternative energy
sources for pumping of water The emphases in this case
study are on defining the range of available technical
alternatives and evaluating their uncertainties via
sensitivity analysis of the various parameter values
-6shy
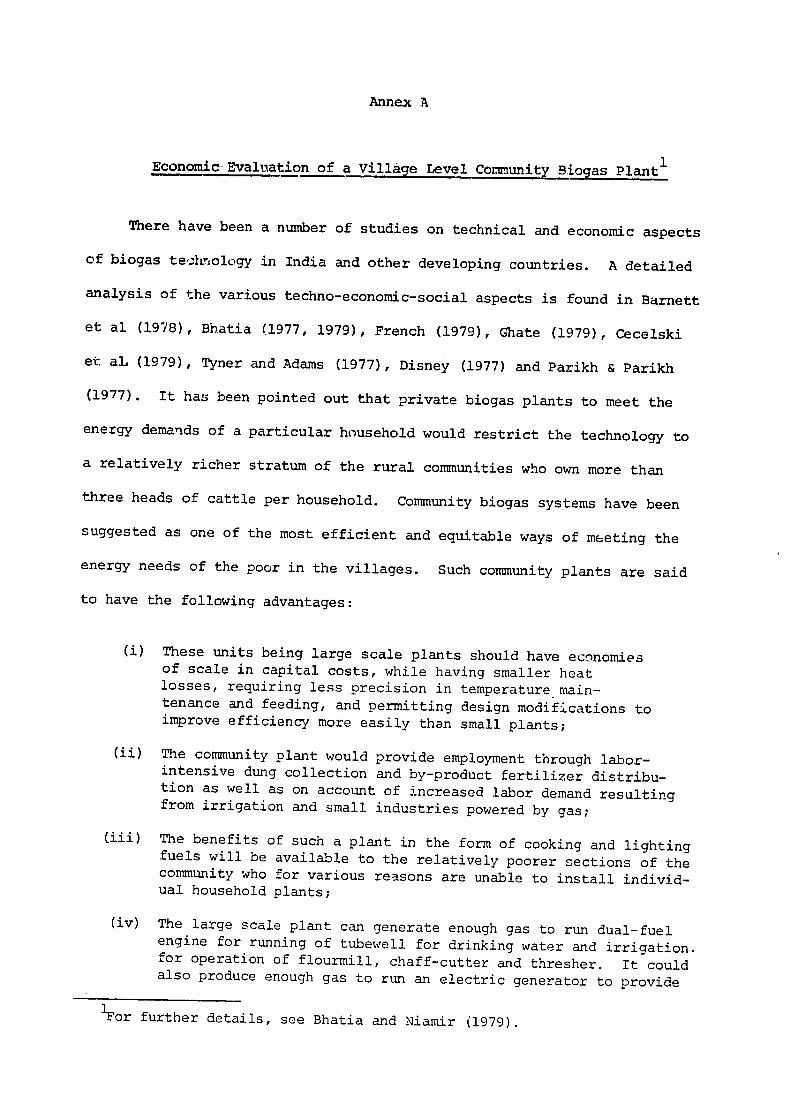
(iii) The first Annex is a social cost benefit analysis of
a community biogas plant It focusses on quantification
and valuation of benefits and should be considered with
the first case study to compare the relative advantages
and disadvantages of the two schemes
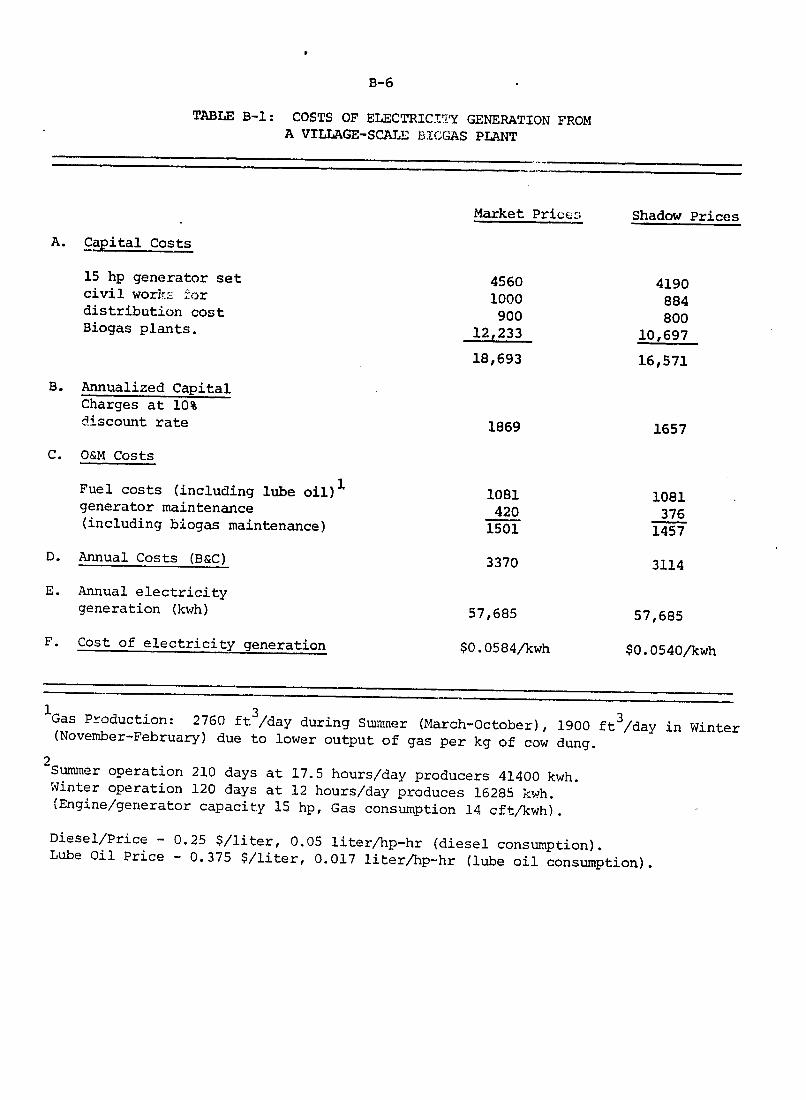
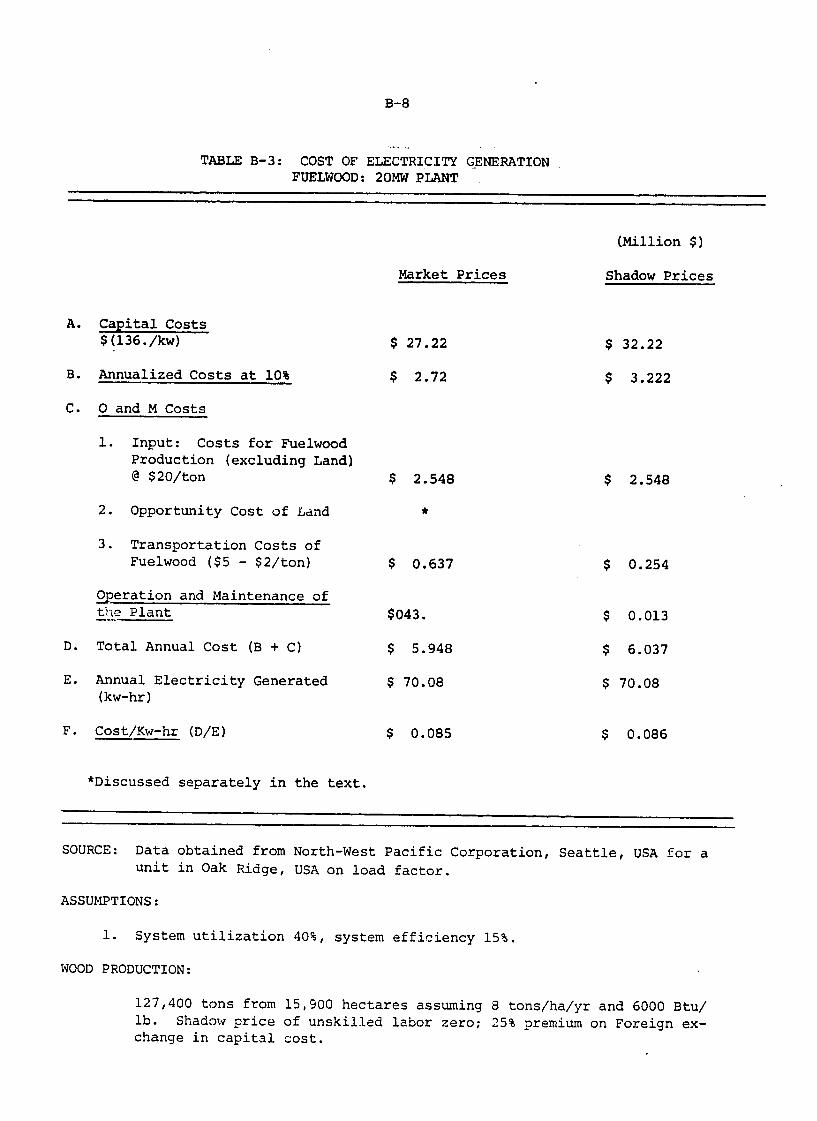
(iv) The study in Annex 2 demonstrates the problems of
estimating the economic costs or resource costs
of generating electricity from a village-scale biogas plant
Considered are a 2 MW unit fuelwood grown under a social
forestry scheme and a 20 MW unit based on fuelwood (from
existing forests) and supplying electricity to a large
number of village and small-town households and industries
Finally Section V provides an annotated bibliography on social
benefit cost analysis and energy planning
Section II
SOCIAL BENEFIT COST ANALYSIS
This section provides an overview of social benefit cost analysis
The first part focuses upon methodology and the economic principles
underlying the methodology (although it does not fully explore the
various theoretical issues involved) The second part is a comparative
analysis of the UNIDO and the Little-Mirrlees approaches to project
evaluation Part three is a brief literature review which provides
the interested reader with a means to become aquainted with some of
the more important works in the field1
II1 Social Benefit Cost Analysis An Overview
The following is an outline of social benefit cost analysis
As outlined in the Guide to Practical Project Appraisal (1978)
the UNIDO method of project appraisal can be broken down into the
following five stages each of which leads toward a measure of the
social benefit of the project
(i) Calculation of financial profitability at market prices
(ii) Shadow pricing of input-output to obtain the net benefit at economic (efficiency) prices
(iii) Adjustment for the projects impact on savings and investshyments
(iv) Adjustment for the projects impact on income distribushy
tion and
(v) Adjustment for the projects production of goods whose social values are less than cr areater than their
These z - l3 grahv It may also -e mz iore a_trgt_ e
c rTh
n n o
Studies and
cli-r_ and nncar T--zd cIrresT
i =__ ti ht Lirle
-8-
A good technical and financial analysis of a project is required
before a meaningful economic evaluation can be made The analysis
should use available market prices andor projected market prices
for valuation of the inputs and outputs Where markets do not exist
(ie for commodities such as cow dung or fuel wood) prices of substitute
material (perhaps kerosene or charcoal softcoke) should be used The
value of direct outputs and inputs during the life of the project can
then be discounted to the present by using the market discount rate
The available dcision criteria of Net Present Value Benefit Cost Ratio
and Internal Rate of Return can be used to select or rank the project
Since market prices in developing countries are distorted in the
sense that these do not reflect the relative scarcity values of various 1
goods and services the economic-benefit analysis requires that inputs
and outputs are assigned their efficiency shadow prices Theoretically
all shadow prices should be derived from a comprehensive mathematical
model of the economy However in practice simultaneous application
of the following two criteria have been suggested for selective shadow
pricing (a) which resources figure most prominently in the benefits
and costs of the project at market prices and (b) For all resources
involved in the F--oject which market prices are farthest out of line
with their respective shadow prices The most obvious candidates for
shadow pricing are (a) main outouts if these are oftent sold at protected
Jtrices (b) inr ort=hbe materials which mav
In a perfect narki- s-azc r for any resource oampd i-s
market tri e - in the real A-orle mar i-rrections such as tariffs auctas restrictions and monorclies create d-stortions _n demZnd - e is i tl ch a 7r ef -- - i _ e cnr4~m i v a l a n d o f - -n n s u r11_ s
produced under substantial protecion or may be imported at high customs
duties (c) major non-imported material inputs which may involve signifshy
icant tradable material content and (d) unskilled labour whose market
wage often exceeds its shadow wage
Since goods which are imported or exported at the margin may
constitute a substantial component of the project it may become
necessary to evaluate the foreign exchange impact of the project so
that an adjustment can be made by an appropriate premium assuming that
foreign exchange is more valuable than indicatm-d by the official exchange
rate This adjustment may require estimation of shadow price of foreign
exchange in the present as well as over time and the foreign exchange
(direct and indirect) content of inputs over time
In order to measure the impact of a project on savings and consumpshy
tion it becomes necessary to determine the distribution of income by
different income groups and use their corresponding marginal propenshy
sities to save If the present level of savings is considered less than
optimal the planners may place a premium on the additional savings the
project will induce by its impact on income distribution This could
be done by an adjustment factor which may be calculated by the planners
on the basis of a subjective valuation of the difficulty the country
has in raisina the capital ruid r its investment programme The
net imact on savings and the ipremium on savinas (or shadow price of
investment) may be of vital consideration in the choice between a
capital intensive and labour-intensive project or between different
desins of the same rroject
If it is considered that income going to some groups and some
regions is more valuable than that going to others from the point of
view of income distribution it becomes necessary to use adjustment
factors that reflect these differential values This may require giving
explicit weights that reflect the percentage premium (or penalty)
attached by society to income flows to groups below or above some refshy
erence level of income For example the benefits of a project going
to people with income less than $100 per month may be given a premium
which would increase the net benefits of the project thus improving
its chances of selection These distributional adjustment factors may
be determined as implicit weights from the projects that have been
accepted or rejected by the planners or through an elaborate formula
using various values of the elasticity of maiginal utility of income
However the value placed on the income distribution objective through
project selection has to be examined carefully and applied uniformly so
that a better appreciation of the alternatives in terms of broader social
objectives may be obtained
Where the products of a project are valued at greater or less than
their economic value they are considered to be merit or demerit
goods and can be weighted to reflect their relative social value For
example goods such as food or energy that meet basic needs may be
adjusted upward in value Luxury goods such as tobacco or alcohol may
be adjusted downward in value The procedure is quite similar to that
of regional or income redistribution weight in fact one ofzen has a
-11shy
choice of using merit weights or income weights to accomplish the same
adjustment (and must therefore take care to avoid double-counting)
Generally merit weights have a more explicit impact and are accordingly
easier to apply and interpret
Estimation of Key National and Regional Parameters
The above discussion suggests that for a social benefit cost analysis
of a non-conventional energy project one needs the values or reasonable
estimates of the following nationalregional parameters (i) Social Rate
of Discount (ii) Shadow Price of Labour (in some cases for different
categories by season and by region) (iii) Shadow Foreign Exchange Rate
(iv) Shadow Price of Investment (Savings) (v) Income Distribution
Weights (which may also take account of regional income differentials)
In many cases the estimates of these parameter values are specified by
the nationalregional planning agencies and the project authorities have
to use these values on a uniform basis However in the ibsence of any
officially specified values for the variables mentioned above efforts
may have to be made to estimate these for individual countries The
principles involved in estimation of these nationalregional parameters
-re adiscuss-e beJcw
1Th is beyond the score cf this t3 outline the methodolccog f estimation of these parameters for a given country A few studies cn estimation of these parameters notably those by Mishra and Beyer (1976 Appendix III) for India Roemer and Stern (1975) for Ghana and World Bank (1975) for Ivory Coast World Bank (1979) for Colombia and FAO 1_-9) for Korea have been a---17 --ooiai- -_ ashy
-12shy
(i) Social Rate of Discount As discussed earlier benefits and
costs occur at different time periods in the life of the project Beneshy
fits received and costs incurred in different years have different values
for the society since present consumption would be preferred over future
consumption For a comparison of aggregate benefits of the project with
aggregate costs it would be necessary to discount the benefits and costs
of different periods to a given year say the initial year of the project
The present value of a projects benefits and costs will depend very much
on the magnitude of the social rate of discount A higher social rate of
discount will reduce the net present value of a project and a lower rate
will increase it Hence the choice of an appropriate social rate of
discount is of vital significance especially when projects with long
gestation periods are being considered
Conceptually the social rate of discount can be defined as the
marginal rate of substitution between consumption at consecutive points
of time It reflects the weight that the society puts on future conshy
sumption vis-a-vis present consumption The factors which are commonly
accepted as determining Social Rate of Discount (SRD) are several
1) societys present level of consumption 2) the expected growth of
consumption 3) the expected growth of population 4) the rate at which
marginal utility of consumption diminishes and 5) societys pure time
preference If per capita consumption is expected to grow society will
be better off in the future compared to present and hence society will
attach less value to additional consumption The higher the rate of
growth of consumption the lower the value assigned to future consumption
as seen from todays viewpoint
-13-
Although the rate of growth of per capita consumption is important the
societys weights on present and future consumption would crucially
depend on the present level of consumption in the country It is
reasonable to assume that many developing countries with low levels of
present consumption will place a high premium on present consumption
vis-a-vis future consumption To some extent a lower level of consumpshy
tion would also reflect societys impatience for current consumption
ie pure time preference
If a value (or a range of values) of social rate of discounts used
at the national level is not available a range of SRD values can be
estimated by using the conceptual framework outlined above The
economic parameters required for such an effort would be 1) the
projected rate of growth of per capital consumption over time which may
be explicitly given in planning documents or may be implicit in developshy
ment objectives 2) a probable value of the elasticity of marginal
utility with respect to per capita consumption (ie the rate at which
marginal social significance of extra consumption declines over time)
and an idea of the pure time preference which is purely a normative
judgment For example if estimated rate of growth of per capita
consumption is taken at 3 percent and the elasticity of marginal
utility with respect to consumption (e) is taken at e = 15 the
resulting estimate of SRD would be 47 or 5 percent ignoring pure time
preference When pure time preference is also to be considered in the
value judgment of SRD the resulting value may range between 8 percert
to 10 percent or even higher It is expected that more than one value
of social rate of discount would be used to perform sensitivity analysis
in the case of a renewable energy project
-14shy
(ii) Shadow Price of Labor A project increases employment of unshy
skilled semi-skilled and skilled labour during the period of construction
as well as after its completion One of the ways in which employment obshy
jectives can be incorporated in project selection is through the use of
shadow wage rate (or accountIng price of labour) in place of market wage
rate
It has been pointed out in project evaluation literature that one
of the common forms of distrotion is in the labour markets of surplus
labour economies such that the wage rate does not equal the social
opportunity cost of labour The components traditionally identified
in the social opportunity cost of labour are (i) the output foregone
elsewhere in the economy as a result of employing labour on the proshy
jectl (ii) the costs of migration training and additional consumption
when a worker is moved from a rural area to the project site (iii) the
potential disutility of effort which this worker may incur by moving
to a new job and new area and by increasing his level of work ie by
reducing his leisure and (iv) the costs in terms of increased aggreshy
gate consumption (caused by increasing employment as a result of the
project) if savings (or investment) are socially more valuable than
current consumption due to non-optimality of savings2
iThe opportunity cost in terms of output loss would be zero if there were surplus labor as long as the project was marginal For large withdrawals of labor it may be positive Existence of surplus labor and evaluation of the so-called marginal product in agriculture have been matters of intense debate See Sen (1975) for an examination of conceptual issues involved and a sumary discussion
2-This is based on the assumption that savings out of wages are lower than those out of profit For a one-sector analysis of this problem of employment-versus-savings dilemma see Sen (1975) or Marglin (1976) The formula used by Mishra and Beyer (1976) for Shadow Wage Rate (SWR) is AWR or SW = m + s(I-l)w where w is the market wage --aid to a laborer in a new job m is the marcinal product in present
-15-
In most traditional analyses the output foregone has been identified
with the marginal project of the relevant labour in its previous employshy
ment The estimation of marginal productivity of labour is a difficult
task Traditionally it was assumed that the marginal product of the
labourer withdrawn from agriculture would be zero and hence m = 01
The use of agricultural wage rates as a proxy for marginal product (or
opportunity cost) has been suggested as the indicator of the shadow
wage rate of unskilled labour However the important thing to be kept
in mind is that the shadow wage rate should reflect the benefit foregone
elsewhere in the economy when a particular worker is employed in a
project If the worker is a migrant from a rural area the opportunity
cost of unskilled labour will range from zero in the off-season to the
full market wage at harvestplanting time 2 If most of the construction
work related to the non-conventional project can be completed during
the agricultural off-season it may be correct to assume a shadow wage
rate of zero for unskilled labour since the output foregone would be
very low (or almost equal to zero) Thus if a project is located in
areas where there is large scale unemployment or underemployment and
the project uses unskilled labour during the off-season the shadow
wage rate for this category of labour can be taken notionally as
equal to zero The shadow wage rates for other categories of workers
and during the agricultural season would be site specific and hence
would require use of location specific values
employment s is the rate of savings from profit and I is the accounting price of investment The costs of migration and disutilityof effort are ignored on account of difficulties of measurement See Lal (1974)
iThe marginal product is rarely zero rather just quite low For an interesting discussion of the effect of marginal labour inputs in traditional agriculture see Geertz (1963)
2 Assuming that the market wage at harvestplanting time equalsthe marginal product of labor
-16shy
(iii) Shadow Foreign Exchange Rate In most of the developing
countries foreign exchange is always a scarce resource on account of
balance-of-payments problems The usual administrative solution to the
balance of payments deficits is to resort to exchange control However
the official exchange rate under these circumstances does not represent
the true value of foreign exchange earned or spent To evaluate the
real foreign exchange impact of policy options involving exports and imshy
ports it is important to make adjustments by using a premium on foreign
exchange outflow or inflow Invariably this premium to reflect scarcity
of foreign exchange is given by using a shadow exchange rate which is
higher than the official exchange rate
If a range of estimates of shadow exchange rate for a country is
not available it may have to be calculated using one or more of the
methodologies discussed in literature Beyer (1975) has reviewed
seven different methodologies employed in an attempt to derive a preshy
liminary estimate of the shadow price of foreign exchange in India
The available methodologies include use of economy-wide programming
models determination of the equilibrium rate of exchange and estimashy
tion of effective rate of protection (ERP) and domestic resource costs
(DRC) per unit of foreign exchange earned or saved The range of values
for India was from Rs 98 to Rs 120 per US dollar compared with
an official exchange rate of Rs 75$100 Although this range is
modest it is probably too wide to avoid the switching of project
decisions for values within this range especially projects which are
mainly of import-substitution or export-promotion types
-17-
UNIDO (1978) gives a simple formula for calculating an average
shadow exchange rate based on a given years data as follows
(M + T) + (X + S MSER = OER x
Where SER is Shadow Exchange Rate OER is Official Exchange Rate M =
cif value of imports X = fob value of exports T = import tax1
revenues and S = export subsidies (export taxes treated as negativex
subsidies)
(iv) Shadow Price of Investment (Savings) In many developing
countries the present level of savings is considered less than optimal
and hence the planners may place a premium on savings vis-a-vis consumpshy
tion The accounting price of investment (savings) is a measure of this
premium defined as the present value of additional consumption generated
by a unit of investment It reflects the social value for the resources
a project draws from an alternative investment (a project cost) and for
income generated by the project which is reinvested (a project benefit)
If savings-investment are optimal the market value and social value will
be the same with the accounting price of investment equal to 10 The
divergence between the opportunity cost of capital and the social rate of
discount is an indicator of the divergence between the market and social
value of investment Under simplifying assumptions the shadow price of
investment is given by the ratio of opportunity cost of capital (r) and
the social rate of discount (i) Thus if oucortunity cost (or marginal
-roductivity) of ca-ital iS aken as 7 and social rate Ccercent
discount is taken as 10 percent the shadow price of investment I
is equal to 0 = 15 A more realistic formula which incorporates
reinvestment or share of saving from incremental income can be given as
= (1-a) r i-ar
Where I is shadow price of investment i is the social rate of discount
r is the opportunity cost of capital and a is the rate of reinvestment
If the rate of reinvestment which corresponds to the marginal savings
rate for the economy as a whole is taken as 02 r - 015 and i - 01
the shadow price of investment would be I = 17 It should be emphasized
that if opportunity cost of capital is higher than social rate of disshy
count and the latter is used for discounting benefits and costs it
would be necessary to adjust both project costs and benefits by using
shadow price of investment
However some practical difficulties in the use of shadow price of
investment are encountered Although it is easier to revalue (upwards)
the capital costs of the project by using the shadow price of investshy
ment it is difficult to estimate that proportion of the income stream
generated by the project which is reinvested and should be revalued by
the accounting price of investment (the additional value constituting
an additional benefit of the project) Estimation of reinvestment
benefit requires the knowledge (or estimation) of how a projects
benefits will be distributed among various groups and institutions and
what their respective rates of saving and investment are expected to be
-19-
In view of these difficulties shadow price of investment has not
been used in many studies1 which have used the UNIDO or analagous
approaches Instead a sensitivity analysis of the project to higher
values of social rate of discount (up to the level of opportunity cost
of capital) have been presented This is considered as a method of
incorporating shadow price of investment in practice although this may
lead to some theoretical complications
(v) Income Distribution Weights Since income from a project may
pass on to groups or regions representing different social priorities
the value of the income to some groups should be weighed differently
than the value of the same income to other groups For example where
income to a poor group has more social value than income to a wealthy
group the income to the poor group should be adjusted upward Upon
adjusting the incomes properly the net benefits can again be tabulated
this time with appropriate regard to income redistribution objectives
The prescribed methods for identifying the appropriate weights are
to 1) accept an upper level policy decision 2) observe and quantify
the policy preferences implicit in past projects Where only two groups
are involved it is possible to infer relative weights (or switching
values) by examining which projects were accepted and which were reshy
jected and by assuming some consistent decision rules With multiple
groups it is more appropriate to select a numeraire (commonly a group
or region which is neither taxed nor subsidized) against which all
See for examzle Mishra and Beyer (1976) and Sinha and Bhatia (1976)
-2Q_shy
other groups are to be compared The other groups can then be conshy
sidered in terms of the elasticity of the marginal utility of income
or the percentage by which the social value placed on additional inshy
come falls within a 1 percent rise in income A more detailed desshy
cription of these methods is presented in UNIDO (1978)
Development of income or regional distribution weights can be a
major undertaking too costly or time consuming to be considered for
the purposes of evaluating a single project In such a case and
where relevant weights are not readily available rough estimates may
suffice Generally a premium of 10 percent to 20 percent on the beneshy
fits to poor household and backward regions is appropriate
Since shadow wage rate for unskilled labor may have already been
used it may not be necessary to put explicit weights on employment
created by the project Likewise the preference for the use of inshy
digenous resources vis-a-vis importable (or exportable) resources would
be reflected through shadow exchange rate and an explicit premium on
the use of local resources and the security and certainty of supplies
may be incorporated in the analysis at another stage
Decision Criteria1
Although several decision criteria are available for project choice
and ranking the following three are most commonly used in social
1 UNIDO (1978) pnze 70 2The discussion in this section decends mainly on a similar disshy
cussion by Mishra and Bever (1976 p 32-35) For a more detailed discussion of decision criteria see Eckstein (1D53) and Dasupta and Pearce (172)
-21shy
benefit cost analyses These are (i) Net Present Value (NPV) or Net
Present Worth (NPW) (ii) Benefit Cost Ratio or BC ratio and (iii)
Internal Rate of Return IRR)
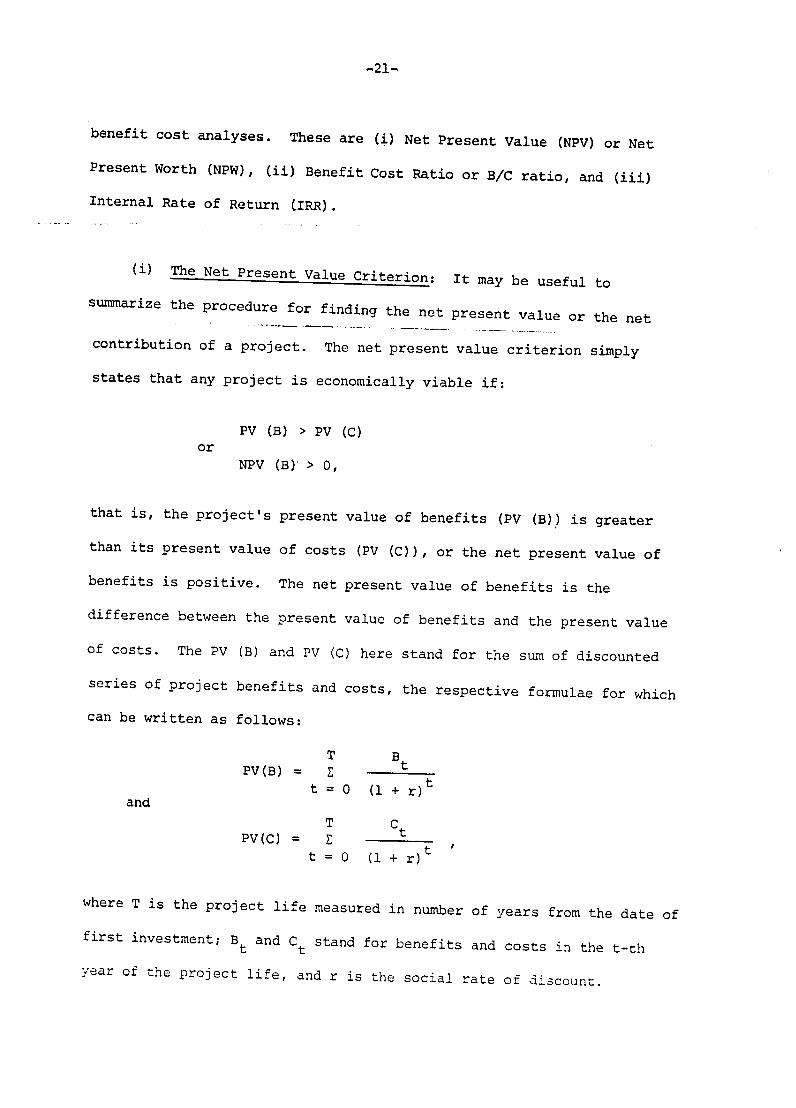
(i) The Net Present Value Criterion It may be useful to
summarize the procedure for finding the net present value or the net
contribution of a project The net present value criterion simply
states that any project is economically viable if
PV (B) gt PV (C) or
NPV (B) gt 0
that is the projects present value of benefits (PV (B)) is greater
than its present value of costs (PV (C)) or the net present value of
benefits is positive The net present value of benefits is the
difference between the present value of benefits and the present value
of costs The PV (B) and PV (C) here stand for the sum of discounted
series of project benefits and costs the respective formulae for which
can be written as follows
T Bt PV(B) = t
t = 0 ( + r)t and
T Ct PV(C) = t
t = 0 (1 + r)t
where T is the project life measured in number of years from the date of first investment Bt and Ct stand for benefits and costs in the t-th
year of the project life and r is the social rate of discount
-22-
The net present value criterion states that the flow of social
benefits and costs over the life time of the project should all be
discounted to the present at the social rate of discount and the project
should be acceptedrejected according to whether its NPV is positive
or negative
However the NPV criterion gives us an absolute measure of the
economic profitability of the project So long as our attention is
confined to a single project or two or more projects whose costs are
the same this criterion is adequate Where there are more than one
project with different costs this absolute measire of worthinesF fails
to produce a correct choice In the following table the relevant inshy
formation is given for two hypothetical projects A and B On the basis
of present value criterion both projects are worthy of selection If
however one is asked to choose between A and B the choice will be B
which offers a larger net present value of benefits as seen from
Column 4 But it is clear from Column 3 that the cost of project B is
double the cost of A while it offers only 10 units more of net benefits
than A Hence the choice B is misleading 1
uz in roject selection For exanle see RJ deLucia and HD JacobyS ais a12s2 gora7 gtsIcn c1LCr J(0 in
i m aai so marginal onet
1 deLucia Jacoby et al (1980)
-23-
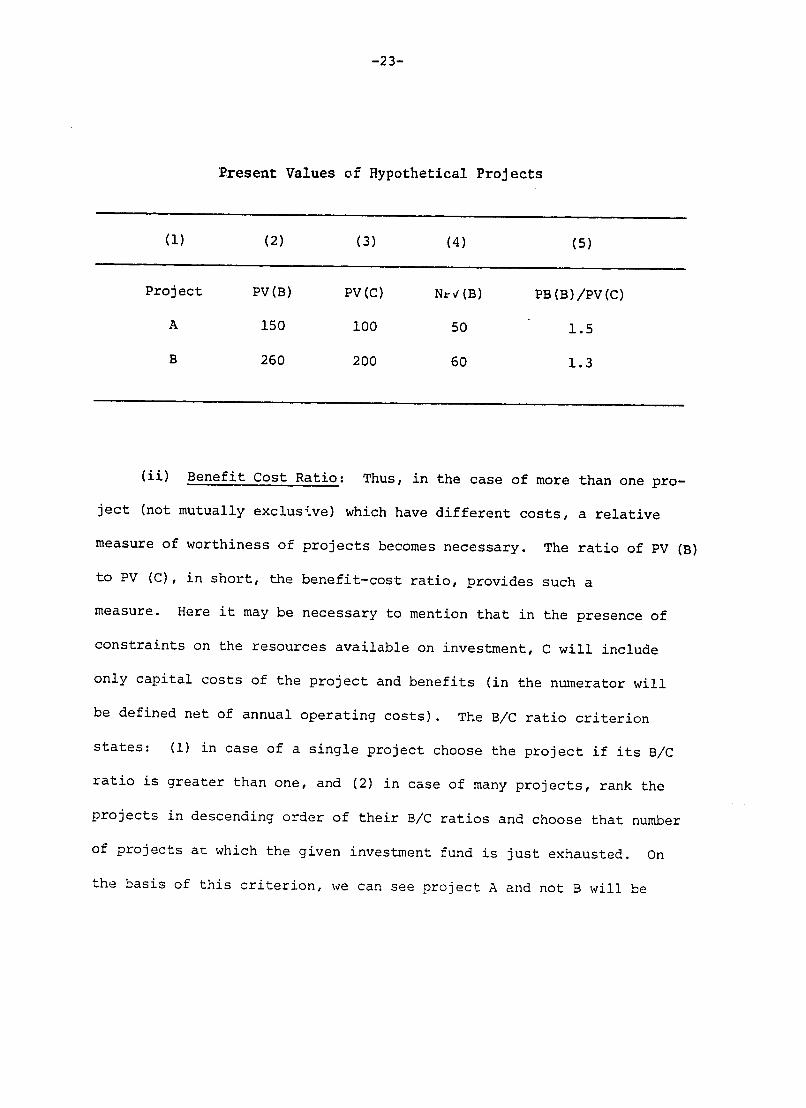
Present Values of Hypothetical Projects
(1) (2) (3) (4) (5)
Project PV(B) Nr(B)PV(C) PB(B)PV(C)
A 150 100 50 15
B 260 200 60 13
(ii) Benefit Cost Ratio Thus in the case of more than one proshy
ject (not mutually exclusive) which have different costs a relative
measure of worthiness of projects becomes necessary The ratio of PV (B)
to PV (C) in short the benefit-cost ratio provides such a
measure Here it may be necessary to mention that in the presence of
constraints on the resources available on investment C will include
only capital costs of the project and benefits (in the numerator will
be defined net of annual operating costs) The BC ratio criterion
states (1) in case of a single project choose the project if its BC
ratio is greater than one and (2) in case of many projects rank the
projects in descending order of their BC ratios and choose that number
of projects at which the given investment fund is just exhausted On
the basis of this criterion we can see project A and not B will be
-24shy
chosen because its BC ratio (refer to Column 5 of the table) is higher
than that of B There are numerous difficulties with this rule One
fundamental point is that no rule should be sensitive to the classifishy
cation of a project effect as a cost rather than a benefit and vice
versa Thus all costs can be treated as negative benefits and all
benefits as negative costs For the NPV rule it should be obvious that
the outcome will be the same however the division is made But the
benefit cost ratio rule will be affected by this division since it will
affect the magnitudes which are entered as denominator and as numerator
Thus if a project has (discounted) benefits of 10 20 and 30 units
and costs of 10 and 20 the benefit-cost ratio is 20 But if the cost
of 10 is treated as negative benefits the ratio becomes 5020 = 25
On the other hand benefits minus costs (ie NPV) remains the same
at 30 units regardless of the transfer
Apart from being sensitive to the classification of costs and
benefits the ratio rule is incorrect when applied to mutually exclusive
context Thus a project costing 100 units with discounted benefits
of 130 has a NPV of 30 This is to be preferred to a project costing
40 with benefits of 60 a NPV of 20 But in ratio terms B is preferred
since B has a ratio of 15 compared to A which is 18
(iii) The Internal Rate of Return Criterion One shortcoming of
the net present value and the BC ratio criteria is that they depend
upon an externally given social rate of discount With the difficulties
in finding an appropriate social rate of discount the internal rate of
return criterion has an advantage in that it does not depend at least
-25shy
in the initial stages upon an externally given social rate of discount
The internal rate of return is that rate of discount at which the net
present value of benefits of a project becomes equal to zero Thus if
r is a rate of discount at which
NPV (B) = 0
then r is said to be the internal rate of return More explicitly the
formula for the internal rate of return can be written as follows
T NPV(B) = E Bt - 0tt=0t =0
t =0 (1 + r)t
where r is the internal rate of return
The internal rate of return is determined through a trial and error
procedure Given the time stream of benefits and costs the project
evaluator arbitrarily chooses a value for r discounts the two streams
sums them up respectively and finds the difference between the two sums
If the difference is positive ie the net present value of benefits
is positive he raises the value of r and repeats the process until the
net present value has approached zero This discount rate r at which
NPV is zero is the IRR The internal rate of return thus calculated
does not on its own provide a decision rule for choosing a project It
requires a standard for comparison -- a predetermined social rate of
discount or a private rate of return which approximates the social
rate or a rate of interest at which the social investment fund is
available If r is such a rate of interest then the decision rule for
project choice is formulated as follows
-26shy
(i) For a single project choose the project if
r gt r
(ii) With many projects rank the projects in a descending order of values of r and choose that set of projects from the top for which r gt r until the given investshyment fund is exhausted
It is necessary to note that while r can be calculated purely
from the project data for the project choice rule it still requires
an externally determined parameter like r As with the NPV rule it
remains essential to choose some acceptable discount rate
The internal rate of return approach suffers from a number of
limitations In the first place it may not exist or if it does it
may be non-unique Only if the net flow of benefits changes sign no
more than once is the internal rate of return unique It is tedious
to calculate without the help of the project It says nothing about
the aims of the project one may prefer a bigger project with greater
absolute net benefits to a smaller one with a higher internal rate of
return but lower absolute net benefits In comparing two mutually
exclusive projects it cannot be applied without further adjustment
On the other hand it has some advantages also for example it appears
to be more easily acceptable to administrators
Thus it would seem that in the case of an -icceptreject case of a
single project NPV or IRR may be used In the case of mutually
exclusive projects (eg two different ways of achieving the same
objective) NPV may be used as the decision criterion However in the
-27shy
case of rationing a given investment fund BC ratios of projects may be
used for ranking projects It is useful to calculate all three -- NPV
BC ratio and IRR -- since each one can provide some useful information
for a particular purpose
-28shy
112 UNIDO and Little-Mirrless Approaches to Project Evaluation A
Comparative Analysis
Although details of the two approaches can be found in the literashy
ture cited earlier it may be useful to summarize their salient features
before a comparison is attempted The UNIDO method2 discusses various
objectives of national planning and suggests that all items involved in
a project should be valued in terms of present aggregate consumption
Since valuation of goods and services in terms of market prices is
considered inadequate in reflecting societal benefits and costs these
goods and services are valued in terms of shadow prices which in fact
reflect societal benefits and costs If the goods and services produced
by the project add to the supply of these goods and services available
in the economy then they may be regarded as being the net output of the
project However if these goods and services merely substitute for an
alternative source of supply leaving the total supply constant then
the net output of the project is really reflected by the resources
released from the alternative source of supply In each case the value
of benefits is measured by the willingness to pay of the purchaser
If the output substitutes for imports or adds to exports the procedure
is to estimate the impact of foreign exchange availability by making
explicit assumptions about foreign markets and also about policies of
the government The shadow price of foreign exchange is used to convert
the foreign exchange benefits (and costs) into units of aggregate conshy
sumption in domestic currency Costs are equivalent to maximum benefits
iYost of the discussion in this section is based on Dasgupta (1977) Sen (1972) and Lal (1974)
2Although this method has been discussed in detail in the earlier section a few concepts are repeated to provide a basis for comparison
-29shy
foregone If the use of input in a project causes a decline in the
amount of that input available to the economy by an equal amount then
the value of the input should be measured in terms of benefits foregone
in the alternative use(s) If the availability of this input to the
rest of the economy does not decline by its use in the project because
say domestic production of this good increases then the cost of input
is to be measured by the resource cost of the increased production If
an input is imported or is a potential export then cost is measured by
the sacrifice in foreign exchange involved converted by shadow price
of foreign exchange The benefits and costs of a project are estimated
for the future years and are discounted to the present by using a social
rate of discount Various decision criteria for project selection and
ranking are used as discussed in the earlier section
In the Little-Mirrlees or OECD approach the components of a proshy
ject are divided into three broad categories
1) Traded goods and services ie goods and services which are actually exported or imported and goods that would be exported or imported had the country followed policies that would have resulted in optimum industrial development
2) Non-traded goods and services and
3) Unskilled labour
In the case of traded goods and services as defined above the shadcw
prices are easy to calculate for an imported product it is its
marginal import cost while for an exported good it is its marginal
export revenue Use of world prices in the evaluation of commodities
(traded) is a distinguishing feature of this method In the case of
non-traded goo4s the marginal social cost of providing a little more
of this good is considered as the shadow price of the commodity The
accounting price of unskilled labour or shadow wage rate depends on
(i) labours opportunity cost (ii) the industrial wage rate and (iii)
shadow price of investment a national parameter In a given year in
the life of the project the algebraic sum of the social value of inputs
and outputs in the year yields the social profit (in terms of investment)
for that year The social profit of each year is discounted to the
present by using an accounting rate of interest and this sum yields the
social value of the project which is the index by which to judge its
profitability
One common feature of the UNIDO and Little-Mirrlees approaches is
that both deal with evaluation of industrial projects Although the two
approaches pursue somewhat different sets of exercises for the evaluashy
tion of these projects they are basically similar1 First both
approaches recognize the distortions in market prices and recommend the
use of appropriate shadow prices to measure the social value of benefits
and costs Secondly both recommend the use of present value as the
correct criterion in judging industrial projects Thirdly it has been
shown that the choice of numeraire in the two cases makes no difference
to project evaluation The UNIDO approach recommends measuring benefits
and costs in terms of aggregate consumption while the Little-Mirrlees
lit has been pointed out in the UNIDO Guide to Practical Project Appraisal(1978) with the changes in the Little-Mirrlees method embodied in the revised (1974) edition and with the changes in the UNIDO method embodied in this Guide there is really very little difference between the methods in terms of their fundamental perspectives on economic project evaluation pp 3
-31shy
approach uses investment (expressed in free foreign exchange) as the
unit of measurement Thus in the UNIDO approach one revalues investment
in terms of consumption using the shadow price of investment In the
OECD approach consumption is revalued in terms of investment using the
shadow price of consumption in terms of investment Fourthly in both
approaches traded goods play an important role in determining the evalshy
uation of the project In the case of the UNIDO approach it is
considered important to estimate the direct and indirect foreign exshy
change inflows and outflows as a result of the project and the same are
valued using border prices along with shadow price of foreign exchange
In the OECD case the shadow prices for traded goods are equated to
marginal import cost of an imported good and to marginal export revenue
for an exported good
However there are some differences in the two approaches and it
may be useful to point these out The differences in the two approaches
can be explained in terms of the differences in judgment about the kinds
of constraints that are important in the economies and the role that
planning organizations can play in influencing economic policies
especially trade and tariff policies in the developing countries The
UNIDO method is more realistic in assuming that in many developing
countries there are many restrictions on economic activities and prices
reflected as quotas tariffs subsidies and administered prices of
capital labour foreign exchange and many scarce commodities It
further recognizes that the project evaluator may not be in a position
to get these restrictions removed or changed and hence the control
areas of the project evaluator may be rather limited On the other
-32shy
hand the Little-Mirrlees approach assumes that the project evaluator is
in a position not merely to suggest changes in trade tariff and tac
policies but also to ensure that these policies are in fact chosen
This would suggest that the agency involved in project evaluation in the
country is powerful enough to ensure modifications in various policies
of other ministriesdepartments of the government concerned The
correct assumption may vary from country to country and from case to
case and may also alter over time since the projects sometimes have a
long life and political and social influences on tax and trade policies
may change during the lifetime of a project
Thus the particular method to be used would depend crucially on
the nature of the restrictions in the economy in question and the ability
of the planner to get these policies adjusted Since most of the develshy
oping countries have imposed pricequantity restrictions especially in
foreign exchange markets it would be useful to recognize these restricshy
tions as such The UNIDO method would have a more realistic approach to
project evaluation under these circumstances
-33-
II 3 The Limits to Project Level Analysis -- Linkage to Subsector (Industry) and Sector and Intersectoral Level Analysis
Analysis of the attractiveness of renewable energy alternatives
sometimes requires more than project level analysis This can stem
from a variety of factors most important of which are the scale of the
alternative relative to the size of the market critical interdependencies
often associated with the substitutability of fuels or energy sources
other interrelations based on use of limited resources (such as agrishy
cultural land) and whether or not the project is an isolated project or
conceived as part of a larger program1 In these cases the project
level analysis should be immersed in broader subsector (industry) or
sector level analysis and perhaps even close examination of intershy
sectoral issues
It is beyond the scope of this document to discuss in detail overshy
all energy sector planning and the role of project analysis in such
efforts However some discussion of these issues is warranted The
problems associated with the appropriate selection of projects and
programs for the energy sector in many developing countries are freshy
quently similar Many developing countries are in transition from the
use of traditional energy (vegetable waste cattle dung firewood etc)
iWhile a single small dentro-thermal plant for a particular town may not require broad analysis a program conceived as a repeat of this model for tens or hundreds of towns should
2 For an extensive discussion see R deLucia and H Jacoby EnergyPlanning in Bangladesh Chapter 1 in deLucia Jacoby et al (1980) this section draws on that chapter
-34shy
to commercial energy Rising demand for commercial energy results from
increasing energy-intensive production and the substitution of commershy
cial for traditional fuels The latter substitute is sometimes the
result of decreasing (absolute or per capita) traditional fuel (partishy
cularly firewood) availability or income and price effects
There are numerous choices involved in sectoral investment planning
production versus importation choice of production process selection
of size (scale) timing and location of investments and the role of
traditional energy sources The appropriate choices regarding energy
supply facilities in developing countries are often dependent on analyzshy
ing a number of interdependencies within the energy sector as well as
interdenpendencies with other sectors The interdependencies are
relatively more important in developing countries in which both the
regional and total energy markets are less developed In such markets
single facilities constructed large enough to capture the economies of
scale may not be justified by the existing or projected growth in energy
demand In cases in which the existing or projected market size is
limited althouqh the market size may justify the use of a large facility
on a cost basis the large facility may be too large when technical
balance criteria are considered Given the strong substitutability of
alternative fuels especially when the energy markets (and hence the
different mix of energy-consuming technology) are still in flux
potential major supply facilities for one fuel must be analyzed with
other fuel supply facilities
-35-
Examples of such important interrelationships will frequently exist
when there is an existing refinery system with limited flexibility in
the mix of productsI and a biomass-based program (eg ethanol or
charcoal) is aimed at suitability for some but not all products Partial
or full substitution for only some products such as charcoal for fuel
oil may result in significant influence in the system -- perhaps surplus
of new oil If the refining system is not capable of processing the
new surplus into other products the options may be unattractive -shy
selling the surplus at discount in the international market cutting
back overall refining production until it is more in line with demand
for heavy products and importing light products etc Major renewable
energy programs require more than project level analsis and there are
other strong arguments for sector level analysis
A sector study analysis should lead to a sector investment plan
and to the determination of operational procedures and pricing policies
This is in contrast to a more limited type of effort -- which may be
referred to as an assessment -- that surveys supplies and demands and
identifies investment options but lacks sufficient analysis to support
decisions by officials and international lending authorities about
specific investments A sectoral plan requires enough project and subshy
sector detail to allow for recommendations regarding timing size and
location of facilities Some of the necessary project-level work may
have been done separately from the sector exercise and can be integrated
1in many developing countries refineries are smaller and do not have catalytic cracking and other high cost processing that allow extensive flexibility in the production of alternative products
-36shy
into a plan If the project level detail is not available from earlier
efforts it must be part of the exercise1
Project- and subsector-level detail is a key aspect of investment
analysis A good sector analysis will integrate alternatives that are
based on project-level information and examine interrelationships among
the size location and timing of alternatives and combine the best
elements into ai overall investment plan The process includes the
consideration of combinations of projects in a subsector of industry
(ie all the alternatives for the electricity subsector) as well as
the integration of oil gas electricity traditional fuels etc into
an analysis which considers trade-offs between subsectors As the
example above suggests given the strong substitutability of alternative
fuels or energy types especially when the energy markets are still in
flux potential supply facilities for one fuel or energy type must be
analyzed jointly with other fuel systems (Another example is a new
railway system where decisions regarding electrification or diesel
clearly require joint consideration of different energy subsectors)
Often a sector planning exercise builds a catalog of projects that
characterize scale and process alternatives and integrates them into
consistent sectoral schemes that reflect a number of different project
and energy source mixes sizes and locations Thus there is critical
information flow between project-subsector analysis and sector-level
10n the other hand in an assessment that does not include an investment plan representative costs and technical descriptions can be used to identify which options warrant further investigation
-37shy
planning Sometimes there will be much to build on --many of the alternshy
atives will have had prior technical and economic analysis at the project
level others will have had none
The process of integrating alternatives to the subsector and
sectoral level can help prevent undue focus on investments that may seem
attractive at a project level but are less so in a broader context The
procedure usually starts by integrating existing information (costs
performance characteristics etc) regarding some alternatives and
making preliminary estimates where this information is not available
The initial integrated analysis indicates which alternatives appear
more attractive If they have not had detailed prior study additional
technical and cost analysis can proceed but only after this sectorshy
level evaluation has been undertaken
There are also important linkages to regional planning activities
Here the critical issues are location and scale Choices among energy
supply facilities often involve economies of scale or indivisibilities
of technological alternatives1 Moreover these issues are relatively
important in developing countries where regional and total energy demands
and markets may not be large Single facilities large enough to capture
economies of scale However in such cases it is necessary to analyze
transport and production costs simultaneously
The issue of market-versus-societal demands and the location of
both supply and transport facilities touches on one relationship between
iThese issues are more pertinent to conventional than to renewable resource based technologies
-38shy
sectoral and regional planning activities Another important linkage
relates to decisions regarding the location of major energy supply and
transportation facilities which may predetermine regional development
possibilities In many developing countries the composition of existing
demand reflects the urban-rural split
Decisions regarding project and sectoral supply investment alternashy
tives influence future intra-urban and urban-rural divisions of developshy
ment The process of energy sector planning must include some concern
with regional issues because the location of many energy facilities is
going to predetermine development patterns in many sectors particularly
manufacturing
There also may be important inter-sectoral issues In many biomass
based alternatives the interaction with agricultural andor forestry
sectors is significant Major programs utilizing significant agriculshy
tural andor forestry land must be evaluated with measures of the real
opportunity costs of the resources This will require analysis of
agricultural or forestry-related activities which utilize the resource
if such studies have not already been undertaken
One last linkage between different planning activities is worth
mentioning -- that relating to information from operational planning
Operational planning encompasses the analysis of such elements as the
operation of refineries and system dispatch for electric power systems
Sectoral investment planning should integrate some characterization of
how the system is actually operated and of the possiblo rate of operating
-39shy
improvement Too often studies are based on manufacturers literature
or experience elsewhere Careful consideration of this issue can help
prevent misallocation of capital through decisions that do not reflect
the real operating conditions and constraints on the rate at which
problems can be overcome
-40shy
114 A Brief Review of Recent Contributions
In the recent past there has appeared a considerable volume of
literature on social benefit cost analysis as the analytical methodology
for project evaluation There are basic texts which present complete
systems of project evaluation such a6 the UNIDO Guidelines for Project
Evaluation (1972) and Guide to Practical Project Appraisal (1978) and
the two volumes by Professors Little and Mirrlees (1968 1974) Theoreshy
tical discu3sions relating to cost-benefit analysis as well as case
studies are available1 in Roemer and Stern (1975) Dasgupta and Pearce
(1972) Marglin (1967) Mishan (1976) Lal (1974) and Harberger (1971)
Manuals and guidelines for project appraisal have been issued by the
World Bank (L Squire and HG Van der Tak 1975) Overseas Development
Administration London (1972) and the US Agency for International
Development (1974) There have been a number of contributions on various
topics by Sen (1968 1972) Bruno (1972) Lal (1972 1973) Balassa
(1976) Harberger (1968) Bacha and Taylor (1971) Beyer (1975) and
World Bank (1977 1979) Several sectoral case studies are now availshy
able the principal among them being those by Adler (1971) Gittinger
(1972) Dattachaudhuri and Sen (1970) Mishra and Beyer (1976)
Eckstein (1958) and Lal (1972) However there are only a few case
studies in the field of renewable energy technologies eg Bhatia
(1977) deLucia and Lesser (1980) French (1979) and Barnett et al
(1978)
1The more important of these contributions are reviewed as a part of the annotated bibliography
Section III
TECHNOLOGICAL ALTERNATIVES AND
EFFICIENCY IN ENERGY USE
It should be clear from the discussion in sections I and II that
social cost-benefit analysis is an appropriate means of comparing different
energy-related technology alternatives Economics of scale can be reshy
flected in the capital cost and in tie operating and maintenance costs
Uncertain fuel prices can be considered through sensitivity analysis of
the operating costs Equipment reliability can be shown in the maintenance
costs and perhaps in the need for additional capacity or back-up systems
Shadow pricing social discount rates and appropriate decision criteria
could be employed as discussed in these earlier sections The first part
of this section is a discussion of the dynamics of this type of technological
choice
The second part of this section deals with mechanical efficiency
a concept which is particularly relevant to selection of the range technology
alternatives which are to be compared Consider for example the option
of using electrical resistance as a mode of space heating The first
law efficiency (ie the amount of energy delivered divided by the amount
of energy supplied) is probably on the order of 90 percent However the
second law efficiency (ie the minimum amount of energy needed to perform
a function divided by the actual amount of energy used to perform a
function) is probably about 5 percent By definition the same job could
be accomplished with less energy consumed This argues for consideration
of more efficient options
This soace heating alternative is used widely in the US due to he extremely low cost of petroleu= and other fossil fuels When one deals with more realistic shadow prices though this mismatch between energy use and end-use becomes less attractive
-42-
III1 Choice of Technology
In the August 1902 issue of Country Life In America there were on
one page three advertisements for automobiles The top picture showed
an electric automobile the second picture was for a steam automobile
and the third was for a gasoline engine automobile
Eighty years later the range of technical choices for automobiles
is much more severely constrained then it was in 1902 Why is this
incidentally the same issue of Country Life In America also carried
advertisements for hydraulic rams and also for Stirling engines both
for use in pumping water at remote locations It is not possible today
to buy these technologies off the shelf for water pumping
The choice as to which technology to use for which particular end-use
activity depends upon the relative prices and availability of fuels and other
inputs In periods of relative stabilisty of prices a well-working market
tends to eliminate the technologies with higher costs and favors those with the
lower costs For example over the main bulk of this century the ready availashy
bility of petroleum fuels at low costs predicated a particular set of technologies
relying heavily upon the internal combustion engine as the prime mover
Since 1973 however the prices of petroleum-based fuels have been rising
rapidly relative to other fuels This implies that some other types of
motive power may be more appropriate for use with many engine devices
under the current situation
-43-
What then are the things which have a major impact on the choice of
technology It seems that the major parameter is the availability of the
energy sources It does not help as in many countries to say that diesel
fuel is available at a government-controlled price when it is only available
intermittently at those prices Hence the persons imaking a choice of techunology
cannot have confidence that the fuels will be available when required The second
aspect is the availability of the technology itself The literature is full of
the availability of the technology itself The literature is full of
discussions of a tremendously wide variety of energy-using technologies
But what we find quite often is that these technologies are available
only as prototypes or as bench-testing devices and have never been available
on any broad scale It is not possible to pick up a telephone and order
many of these devices even in small numbers Hence the technology that one
is choosing must amplso be available at some reasonable cost and on some
reasonable deliv cy schedule
-ne of the most important aspects of technology choices deals with
the matching up of the quality of the energy needed at the end-use and
the quality and type of energy used by the technologies It is important
to achieve as close as possible thermodynamic matching of the quality of
the energy use For example it makes little sense tc use electricity or
petroleum-based fuels directly for process heat in industry unless that
process heat is required at extremely high temperatures For most process
heating and space heating requirements lower thermodynamic quality energy
sources can be used What this means is that energy is not merely 2TUs
but BT2s at some particular temperature level Low c3ss of hiah
quality petroleum based fuels in the recent past has led in many cases
tn a severe mismatch between the energy used and the ond-use
-44-
Unfortunately there are no easy rules that enable the engineer or
economist assessing technology choice under the current conditions that
would enable him to move quickly to the match of energy qualities In
order to do this they will have to rely on the scientific assessment
of each individual situation
From the point of view of economic evaluation of technology choice
there are a series of parameters which are more directly approached
1 Initial Costs The capital cost of the technology is obviously
a very important determinant of the technical choice However one must
remember that the initial cost in many cases is achieved by trading off
a variety of other parameters such as reliability fuel use and size
Moreover in dealing with the initial cost the capital cost of a
particular technologythe economist will also need to assess a breakdown
of these initial costs into those dealing with foreign exchange and those
with local exchange The economist also will need to assess whether all
of the aspects of this particular technology are required for the end-use
For example is the pumphouse a necessary component for use in a particular
situation is the truck chassis an integral part of the required technology
for that particular transportation system and so on
2 Life-Cycle Costs The life cycle costs deal with the costs of
fuel and maintenance of the technology over its working life Obviously
these costs are directly related to some of the components of the initial
cost or the captial cost One 7an put mcre materials into a machine and
-45shy
reduce the amount of maintenance necessary to keep the machine in operation
or one can develop a high-technology machine that will require less energy
than a less highly developed machine but has a significantly higher initial
cost (The mechanical efficiency aspect of this tradeoff is discussed in
some detail in the second part of this section) As with the initial cost
the economist must assess the breakdown of the life-cycle costs into local
and foreign costs The life-cycle costs are quite difficult to estimate
with any degree of certainty Maintenance costs are usually not well
documented and even if they were it is often quite difficult to transfer
those into developing country contexts where the availability of skilled
mechanics etc is unknown A more difficult problem with the life cycle
costs is to make reasonable estimates of the energy input costs over the
life of the device One only has to look at the recent history of
petroleum prices to observe that it is a thoroughly hazardous task to
estimate future prices for petroleum products
3 Reliability The reliability of a technology i a very important
parameter from the point of view of the user and is un rtunately quite
difficult to assess Are diesel engines reliable Thk answer to that
question would be to take a look at the widespread use of diesel engines
throughout the developing world even though diesel engines do require
heavy maintenance and a substantial cost in keeping them going they probably
are a thoroughly reliable technology From the users point of view
however reliability is the one paraneter which utlimately clinches the
decision to choose or not choose a particular technology It is interesting
to note however that the concept of reliability is not just based
-46shy
upon the technology itself but upon the context in which it is being
used For example in parts of northern India many farmers consider
eletric pumpsets as being very unreliable The unreliability of the
pumpsets in this particular case stems from the unreliability of the
electricity supply and from any technical defects in the pumpsets
themselves Electric pumpsets in other contexts would be considered very
reliable Should one accept a lower level of reliability for devices
that have either lower first costs or lower first life cycle costs This
type of question needs to be addressed in any assessment of the choice
of technology
4 Scale This is possibly the most important parameter in the
choice of technology Unfortunately this is one parameter which is in
many cases quite difficult to define particularly at the ends ofthe
scale For example many large heat engine systems are available over
a wide range of prices starting from 50 kilowatts up to 60000 kilowatts
These can often be ordered directly from catalogs in that range of
sizes As one might expect there are economies of scale associated with
these types of devices and that over the typical ranges available the
larger tend to be the more fuel-efficient than the smaller However
when one gets down to the lower end of the scale one finds the tremendous
shortage of information about the size and performance of different heat
engines The effects of scale also have important economic and social
consequences Not only do larger devices cost more in terms of initial costs
they also typically require much larger tasks to be performed If there
is a mismatch betwen the scale of the device and the end-use then the
devices typically run at much lower efficiencies and theirhence lfe-cvcle
-47shy
costs increase rapidly Hence there is little sense in using a 15 HP
motor for a job that requires only 3 HP Moreover a small user may not
be able to meet the initial costs for such large technology Therefore
the choice of a larger technology than is absolutely needed implies a need
for some form of social organization to take advantage of the excess capacity
In many countries this has been the rationale for the formation of pump
groups and tubewell cooperatives However the analyst must be aware of
the social problems in making such organizations work effectively The
costs in such cases for the actual usage of the technology may be conshy
siderably lower than if the technology were commanded by a single
individual who needed it at that scale Other questions arise as to where
the economies of scale decline to insignificance Is there some level
of device where the transportation costs balance out the advantages of
increasing size For example one might expect that with biomass-fueled
some upper limit on the size of the generatingelectric generators there is
plant beyond which the transportation of the biomass to the plant will
predominate over the scale efficiencies of a larger plant Indeed this
importanttradeoff between transportation and increased scale is an
of many types of purchasing and manufacturing technologyfeature
1112 Efficiency
In considering the economic attractiveness of renewable energy
alternatives the ultimate criteron should be one of economic efficiency
as incorporated in a measure such as the benefit cost ratio discussed
earlier in this report When appropriately calculated this measure
includes appropriate weighting of both costs and benefits that have
different impacts or importance But considering the attractiveness cf
-48shy
energy alternatives there is also a role for incorporating into the analysis
efficiency concepts based on a technical focus The importance of including
such considerations is an integral part of the choice of technologies
Consideration of technical energy efficiency concepts aids both in the
selection between alternatives and in determining wh ir one is considering
an appropriate andor wide enough set of alternatives
There are two energy efficiency concepts that should be considered
These are frequently referred to as the first and second law (of thershy
modynamics) efficiencies1
The first law efficiency is defined as follows
amount of energy delivered = n efficiency = in form required (output)
amount of energy that must
be supplied to achieve the desired effect (input)
This concept can incorporate energy in all forms (heat work fuel
potential or kinetic energy etc) It does not explicitly account for
the thermodynamic quality or special characteristics of the energy being
utilized The first law is eiily concerned with the quantity of energy
being used
But the quality of energy is very important Some tasks such as those
requiring very high temperatures can only be done by certain energy types
While task requirements that require lower quality energl (such as low
I A thorougih discussion of these concents is rresentc in American PhySical Society (1975)
-49shy
temperature task eg cooking) can be met with high quality sources
tasks requiring higher quality (eg high temperature)(eg liquid fuels)
often cannot be met with lower quality sources (eg wood) except withshy
out some conversion as the conversion usually entails considerable losses
In selecting the energy alternatives it is usefulquantities of energy
Whileto include alternatives which match (in qualit-) the task needs
these alternatives may not in the end be selected due to other economic
(used in the broad sense) factors they hould be considered
The second law efficiency is a useful concept in examining the degree
to which the alternatives match the requirements of the task It is
defined as follows
minimum amount of energy (work) required to perform
the desired function actual amount of energy (available work) used to perform the function
But the concept of the second law is applicable to an examination
of the preference of any device process or system and the degree
to which these attain that which is theoretically achievable
This requires not just the measurement of the energy per se but
the availability of the energy type to do work (and the measureshy
ment of the exhaustion of this availability in the course of
performing the function The term available work used in the
second law definitions above represents the availability of an
1 energy type to do useful work
I The concept of available work is discussed in detail
in APS ibid For fuels this is approximatelv ecual to the
fuels neat of combustion
-50-
The measure of efficiency is very much dependent on the boundaries of
the system being analyzed First and second law efficiencies are calculated
either for devices or systems with prescribed boundaries but in actual
operation devices are usually components in a larger system The house
furnace example often used to demonstrate marked differences between first
and second law efficiencies (see below) is only one part of an entire heating
system which in turn is part of a house
The difference between the first and second law efficiencies cpn be
demonstrated by example Consider the ordinary house furnace operating
under non-extreme conditions (desired indoor temperature the new standard
680F outdoor temperature just at freezing 0degC 320F) An ordinary
furnace could deliver to the rooms about one unit of energy for every
125 - 15 unics of energy used Thus the first law efficiency is
1 = 67 to 80
125 to 150
Consider the second law efficiency To do this we must first calculate
the mean theoretical work energy needed The minimum amount of energywork
to determine a unit of heat to the room can be calculated from extending
Carnots theory of heat engines considering the house as one resevoir
and the outside air the other The minimum work to deliver q units of
heat from (2731)20C is 007 gto (2930K)
Usinq Carnots Law w = a 2930 - 2730 = 007 q
2930
This is the amount of work that an ideal heat pump would require
The furnace therefore has the following second law efficiency
minimum energy = 01 X 1- 47 to 56 efficiency= actual energy 125 to 15
While the ideal heat pump would have a first law efficiency of 1
1400 actual heat pumps have first law efficiencies of 100 to 300
2depending on various factors Heat pumps work best when the temperature
difference is small Assume for the above condition that the heat pump
has a first law efficiency of 225 ie to deliver one uxit of heat
(output) it requires 0444 units of energy The second law efficiency
would then be
E- 07 1616pound = 444
The concept of these efficiencies when applied to systems of devices
is not immediately straightforward Consider the following example for
pumping which build an analysis presented in a companion report In this
case a series of biomaFs based alternatives for water pumping are considered
The concept of second law efficiency can also be applied to other
cases However the results are not as satisfactory as that for space
heating as the following application to heat engines demonstrates
q
007q
For a detailed discussion see APS ibid p 13
-52-
As stated previously the second law efficiency is defined as
minimum amount of energy required = to perform the desired task
actual amount of energy required to perform the desired task
The problem in using this equation with heat engines comes in
specifying the minimum amount of energy required There are three
alternatives that seem equally valid and these are discussed below
(i) One justifiable choice of the minimum energy required (equivalent
to the engine system with maximum efficiency) could be to use the
most efficient engine that exists now This would be the diesel
engine (marginally superior to the Stirling engine) with a typical
efficiency of 40 percent In this case the second law efficiency
for a gasoline engine (efficiency nu 25 percent) would be 2540 =
625 percent
(ii) An alternative choice would be to assume the maximum efficiency
of any engine is the maximum ideal efficiency (ie ignoring frictional
and other losses) of all engines existing now The ideal efficiency
is limited by the temperatures of heat absorption and rejection of
the engine and the maximum is that for the Stirling engine (70 percent)
Now the denominator in the second law efficiency expression is 70
and c for a gasoline engine would be 2570 = 36 percent
minimum amount of efficiency of 1 energy required actual process
actual energy used
maximum efficiency obtainable
-53shy
(iii) A final alternative is to suggest that neither of the above
are appropriate The problem with the first is that presumably
research and development will reduce the frictional and other losses
in an engine and some years from now it is conceivable that a
Stirling engine with an efficiency of 50 percent will be available
It can therefore hardly be appropriate to speak in absolute terms
of a maximum available efficiency of 40 percent A similar argument
applies to the second alternative above The ideal efficiency is
directly related to the operating temperature of heat input to the
system (ie fuel burning) At present the maximum temperatures
obtainable are limited by the temperature resistant properties of the
materials used It is again conceivable that in the future ceramic
Stirling engines will be available with ideal efficiencies of 90
percent The logical extension of this is that the maximum efficiency
that can be obtained is in fact 100 percent for an ideal engine
operating from an extremely high temperature (to a low of atmospheric
or less)1
The APS defines the minimum amount of energy required as the work
available in the fuel Since the work available is actually almost
the same as the heat of combustion (or energy input) of the fuel burnt
this approach is 100 percent (as in (iii) above)
Efficiencies of a biomass-engine-pumping system are shown in
Table Ill 1 As discussed the first and second law efficiencies are
identical
1 With this assumption first and second law efficiencies will be the same (eg for a gasoline engine E = 25100 = 25 percent)
-54-
TABLE III1
EFFICIENCIES OF COMBUSTION ENGINE SYSTEMS
Overall Biomass System Conversion Engine Pumping Efficiency
System Efficiency Efficiency Efficiency (1st amp 2nd law)
Diesel 40-70 25-40 80 8 - 22
Otto Gasoline 40-70 15-25 80 5 - 14 Gas 40-70 20-40 80 6 shy 22
Stirling 40-65 30-40 70 8 shy 18
Steam turbine 40-65 5-10 80 15 - 5 (lt50 kw)
Source Adapted from Meta Systems Inc State-of-the-Art Review of Biomass Fueled Heat Engines August 1980
-55-
The concept of a second law efficiency is particularly appropriate for
space heating where the operating temperature ranges for a heat pump are
specified (atmospheric and room temperature) and where the heat pump has
a seemingly unreasonable efficiency of 1400 percent However when the
concept is transferred to heat engines some subjectiveness enters The
conclusion that the minimum energy required for a given task is equivalent
to the work available (approximately the heat of combustion) in the fuel
effectively implies that the first and second law efficiencies are the
same and supplies no new information
SECTION IV
CASE STUDIES IN EVALUATION OF
NON-CONVENTIONAL ENERGY TECHNOLOGIES
The previous two sections have presented a discussion of the
methodology of economic evaluation of projects of the choice of techshy
nologies and technical issues involved in the efficient use of different
energy sources In this section two case studies in economic evaluashy
tion of some of the non-conventional energy technologies are presented
(Two additional case studies are provided as Annexes A and B)
The first case study is concerned with economic evaluation of a
family-sized biogas plant in Indian context It is explicitly
concerned with conceptual and practical problems arising in social
cost benefit analysis and in evaluating different procedures for the
estimation of or assumptions regarding shadow prices for inputs and
outputs The analysis recognizes that quantification of several m=jor
indirect costs and benefits is a major problem limiting the overzl
validity of the analysis however it does throw considerable liht on
the ranking of alternative designs for biogas plants Comparison with
Annex A (a similar study concerned with community-sized plants) shows the
relative social advantages and disadvantages of family-size and communityshy
size plants
The seccnd study is an econcm anai-sis of various irriiation
systems using different energy sources for the pumping of water it is
based on work in a representative villa- in Northeast Thailand The
-57shy
emphasis here is on examining technical alternatives on the evaluation
of uncertainty and on a sensitivity analysis for various parameter
values Four technological options -- diesel engine and diesel pump
dual fueldiesel engine and dieselbiogas pump gas engine and pyrolysis
gas pump and free piston Stirling engine using biogas -- are considered
and their appropriateness to the needs and resources of different farm
classes is examined This study neglects the issues of social cost beneshy
fit analysis in that economic accounting using shadow prices and
appropriate discount rates is not performed the only component of social
cost benefit analysis attended tc here refers to the savings in foreign
exchange Two different values of foreign exchange premium have been used
in a hypothetical import-component proportion for these calculations
The second Annex focuses on electricity generation using a villageshy
scale biogas plant comparing the costs of central electricity generation
and transmission for this technology with other conventional technologies
on the one hand and those for units of two different sizes -- 3 MW and
20 MW -- using biogas plant on the other (The 3 MW unit is assuied to
be using fuelwood under a social forestry scheme and the 20 MW unit is
assumed to be based on fuelwood from existing forests)
As discussed earlier in Section II the estimation of opportunity
costs of land and biogas inputs in the non-conventional energy technologies
present a far more difficult conceptual and practical problem than say
-58shy
in the case of foreign exchange or unskilled labor where some simplishy
fying assumptions and approximations may be made For traditional agrishy
culture it is not just that markets for land does not exist or is very
weak for in that case it may be possible to assign an imputed value to
land in terms of output price The problem is that markets in labor may
not exist either and labor allocation in traditional self-farming agrishy
culture does not take place according to economic rules Thus while
imputing value to inputs in traditional agricultures it is impossible
to separate the values that may be imputed to land and labor separately1
Further even if this problem could be resolved estimation of the
shadow price of land in terms of opportunity costs of foregone altershy
natives is difficult if such alternatives are not clearly defined For
example consider a biomass-fueled energy project where non-crop vegeshy
table residues (tree twigs lakri etc) are used as fuel It is possible
that the land in question lies fallow at particular periods when it is
practically impossible to put it to other use In this case the opporshy
tunity cost is zero since no social product is loct However consider
an irrigation project along with this energy project which can put this
land to agricultural use There the opportunity cost would be positive
and the opportunity costs to the private user and to the society as a
whole may well differ More this opportunity cost shall be dependent
on the particular crop that may be produced ideally the most profitable
crop will be produced and opportunity costs should be considered in terms
of the value added of the produced crop But when in actuality the land
is being put to another use it is difficult to choose between the hyposhy
thetical alternatives One has to consider alternative technologies
1 See Lloyd G Reynolds Introduction in Reynolds ed (1975) fcr furtier iscussion
-59shy
(and hence costs) of production for each crop alternative methods of
production and use and the estimated opportunity costs in addition to
being non-unique would be both locationally and temporally specific
Consider another example where the fuel in biomass energy project
is crop residues (For simplicity neglect the question of alternative
crops andor their material value for residue weights and quality)
These residues may otherwise be lying waste in which case the opportunity
costs for using them as fuel is zero if there were substantial labor
effort in collecting and disposing of them this opportunity cost would
even be negative But suppose they were used as animal feed in varying
proportion It is not just that these residues are not marketed and
hence do not have a price we often do not know what substitutes may be
used as feed at what price and what their availability is
Now suppose some of the residues for one crop were to be used as
fuel It is clear that the losses in animal feed use can be met either
by using another crops residues if available or by substituting a
commercial feed At a given level and composition of livestock the
kcal as well as nutrient requirements are approximately determined
Using data on kcal and nutrient composition of initial feeds one can
in principle construct a feed balance and then estimate the shortfalls
in kcal and nutrients for a given type of animal Depending upon the
level of aggregation one can also examine the distributive impacts of
such shortfalls
-60-
It needs to be pointed out that calculations of such feed balances
based upon nutritional values of different feeds and feed requirements
of different animals does not by itself answer the question of economic
opportunity costs it simply gives us a physical measure of shortfalls
in availability However given such calculations one can in principle
identify the proper substitute feeds for a particular crop residue and
estimate its cost
There are practical problems with these procedures too Data on
nutritional values of particular crop residue may not always be available
Only recently were nutritional data on some of the tropical feeds published1
by FAO Feed requirement data for animals in US or Western Europe are
not necessarily applicable to animals in the Third World agriculture2
However either of the two principle systems - the Swedish one used more
extensively in Europe and Northern Africa an the US one used in
Northern America - for calculation of feed balances may in principle be
used to create similar systems in the Third World as well
The discussion so far has assumed a static scenario in the sense
that feedback and second-round effects are not considered And these
considerations usually are the important motivation in planning for
non-conventional energy technologies For example while diversion of
crop residues to fuel use may result in a shortfall in the present
availability of animal feed one must consider that such fuel use in
an irrigation technology actually leads to increases in crop production
and hence in availability of residues in the next period In fact not
1 IAO (1)75)
2 Cullison (1975) for examnle
-61shy
only should we consider these additions to crop and residues in physical
balances and in cost benefit analysis but also that-they make possible
additions to livestock increases in quality of livestock and so on
For a large enough project a systematic study of such interrelationshy
ships should be made crop studies feed nutritive studies feed balance
studies etc need to be conducted At a sufficient level of disaggreshy
gation combined with detailed information on social structure and reshy
lations one can also use such studies to forecast distributive impacts
of technological change
It should be noted that neither the case studies presented here
nor the additional case studies in Annexes 1 and 2 are supposed to be
complete each one has different focus highlighting one aspect at a
time For reasons discussed above it has not been possible to include
the analysis of opportunity costs estimation of shadow prices or to
incorporate explicit value judgements in assigning parameter values to
distributional or other social non-efficiency criteria As should also
be obvious the cases are not readily comparable in their contexts costs
benefits appropriateness of selection criteria or technological design
And yet the case studies present different aspects of applicable
methodologies for the economic valuation of non-conventional energy
technologies Whereas the results cannot be transferable in toto to
other contexts and problems it is hoped that at the present level of
knowledge and data availability these methods can be used in more
general fashion
-62shy
IV1 Social Benefit Cost Analysis of a Family Biogas Plant1
In this case study of a family biogas plant in Indian conditions we
attempt to present the principles which could be used for similar case
studies elsewhere The example below shows that the most difficult aspect
of social cost analysis in the renewable energy field is the quantification
and valuation of-direct and indirect benefits and costs However for
any appraisal of appropriateness of a mix of technological alternatives
it is absolutely necessary to trace through its impact on the rest of the
economic and social system Since resources going to a given technology
say biogas plants have alternative uses one should be able to demonstrate
that not only are the aggregate benefits to the society in this particular
use higher than aggregate costs but that benefits per unit of capital
costs in this case are higher than those obtained in other activities
Thus efficient use of resources would require benefits to be higher than
costs in such a way that a reallocation of resources away from this
particular use does not increase the total welfare of the society
(Figure IV-l)
An economic appraisal (from the point of view of society) of investment
in a biogas unit would require quantification and valuation of primary
benefits as well as of the direct and indirect costs associated with the
installation of the plant
iFor details see Bhatia (1977) and Bhatia (1980) This section draws heavily on the latter
-63-
These benefits and costs may be enumerated as follows
A Primary Benefits
1 Biogas as a source of fuel 2 Digested manure or slurry as fertilizer
B Secondary Benefits
1 Convenience of cooking with a clean fuel 2 Reduction in uncertainty of energy supply 3 Renewable source of energy 4 Self-sufficiency in terms of reduction of imports 5 Employment to the local people 6 Possibility of using vegetable wastes and human wastes 7 Reduction in health costs due to anaerobic digestion
C Dirc- Costs
1 Capital costs
a cost of land b civil construction c gas holder d pipes and appliances
2 Operating Costs
a cow dung used as major input b labor for dung collection c labor for operating the unit d cost of painting and hosepipe etc e cost of water
D Indirect Costs
1 Depriving poor classes of cow dung
2 Management problems
3 Inconvenience of mixing cow dung with water and feeding the slurry
Valuation of Primary Benefits
Biogas units are available in various sizes ranging from capacities
of 2 cubic meters (70 cubic feet) of gas per day to 140 cubic meters
(4948 cubic feet) er day The smallest sized unit of 2 cubic meters
Figure IV-I
FRAMEWORK FOR ESTIMATION OF COSTS AND BENEFITS
Estimation of Costs
Shadow Prices of
NationalRegional Resources
- Capital
-7
Outu
Estimation of Benefits
Weights on Distribution of Benefits
Agricultural Workers
- Skilled Labor
- Foreign Exchange
(To account for all imported or exportable inputs such as steel cement PVC machinery etc )
Energy Technologies
[Poor Farmers
Artisans
Local Resources
- Unskilled Labor
- Bricks
Energy Using Equipment tput
Large and Medium Farmers
- BambooWood
Others
-65shy
(cu m) requires about four to five animals and can produce enough gas
to meet the cooking requirements of seven persons We present here a
detailed social benefit cost analysis of investment in a family size
biogas unit of 2 cu m per day 1
Two major benefits from a family-size biogas unit are (1) gas to
be used for cooking and lighting and (2) digested slurry to be used as
fertilizer manure The valuation of these benefits involves estimation
of the quantity of gas obtained quantity as well as quality of digested
manure obtained and the monetary values which can be assigned to gas
and fertilizer nutrients to reflect the benefits to society The details
of estimation of benefits are described below as well as given in Table 14
A 2 cu m per day (70 cftday) plant can produce enough gas to light
2 lamps of 100 candle power (each for two hours) and to provide for the
cooking needs of 5 persons assuming the requirements 5 cfthour for
each lamp and 10 cftpersonday for cooking The value of this gas
to society can be measured in terms of the economic cost of providing
alternative sources of energy for lighting and cooking if investment
in biogas is not made2 The source of energy for lighting would be
kerosene in villages without electrification while it would be electricity
or kerosene in electrified villages Now 20 cft of gas used in lighting
can be replaced by either 32 kwh of electricity or 037 litres of
rosrn Te cost of t i- io rtakin
For details see Bhatia (1977)
2-This assumes that cow dung fuelwood and kerosene currently being used have to be replaced by other fuels on account of considerations of social productivity of cow dung as manure deforestation problems caused by fuelwood and high foreign exchange costs of imported kerosene Valuation of bencfits Lcomes more complex if thtse assumptions are not valid as shown later in the case of community plant
-66shy
the economic costs of electricity at $0022 kwh to account for the
variable costs of generation assuming that the costs of generation
transmission and distribution are fully allocated to energize wells
The equivalent cost of kerosene at $04 per litre is $015 per day
Thus if bioqas is available for lighting society would not have to
incur $015 per day in terms of equivalent quantity of kerosene Hence
the benefit to society from using 20 cft gas for lighting can be taken
to $015 per day or $53 per year
On the same lines it would be economic for the society if soft
coke instead of kerosene is used for cooking Assuming a delivered
price of soft coke at $8 per ton the resource cost of 125 tons of
soft coke for cooking (equivalent to the use of gas for cooking 50
cftday) would be $10 per year Thus in the absence of gas from a
biogas unit the costs to the society of providing alternative fuels
would be $63 per annum This can be used as a measure of the benefit
that the society derives from gas from the unit This analysis so far
assumes that there is no additional benefit from additional quantity or
better quality of slurry from the unit If it is assumed that there is
an improvement in the form of nitrogen available the annual benefits
will be higher by $55 per year (See Table IV-I
Valuation of direct costs is relatively straight forward Both the
capital costs and operating costs can be broken down in trhee components
steel cement and unskilled labor For each of these items one can use
appropriate shadow prices to obtain the estimates of cost form the viewpoint
of the society It may be noted that use of shadow prices of steel and
cement recuires use Of shadow lprice of foreign exchange which is used to
-67shy
reflect the premium that the society attaches to foreign exchange on account
of its scarcity Use of shadow prices thus takes explicitly into account
the self-reliance objective of development planning Similarly the
objective of providing additional employment of unskilled workers has
been taken into account by the use of shadow wage rate for unskilled
labor which is lower than the market wage rate This gives the estimated
capital cost of a biogas unit (conventional KVIC design) at $290 and
annual operating costs (excluding cow dung) as $9 per year The
corresponding costs for a Chinese-design unit are $175 and $9 respectively
(See Table IV-2)
In accordance with the earlier discussion on decision criteria we
utilize an appropriate social rate of discount to calculate net present
value (NPV) and benefit cost (BC) ratio
The results of the benefit cost analysis of a family biogas unit are
presented in Table IV-3 It may be noted that NPVs are positive in all the
cases and BC ratios are much above unity As was expected BC ratios are
higher in the case of shadow prices (due to zero shadow wage rate and 25
percent premium on imported kerosene and area on the benefit side) than
under the market price assumptions Since the capital costs of a
Chinese-type design are considerably lower and benefits are assumed to
be the same as in the case of conventional design the BC ratios with
the Chinese-design units are relatively higher If however it is
assumed that there would not be appreciable increase in the nitrogen
content of biogas slurry due to handling practices of farmers and hence
manure benefit is ignored the BC ratio would drop to 124 in the case
-68shy
of conventional design The IRR in this case is 13 percent indicating
that the project would be socially unprofitable if social rate of discount
is higher than 13 percent or shadow price of investment is used along with
a lower discount rate
It may also be useful to perform sensitivity analysis of the results
with respect to (a) nationalregional parameters such as social rate of
disount shadow price of foreign exchange or shadow wage rates (b) commodity
prices such as the price of kerosene soft coke urea dtc (c) technical
parameters such as methane content of gas calorific values of kerosenesoft
coke NPK content of slurry etc These sensitivity analysis results
would show how robust the earlier results are and which are the parameters
which are important in determining the social profitability of the
technology
Care should be taken to incorporate the secondary benefits as well
as indirect costs of biogas units in social benefit cost analysis Even
if these cannot be quantified it would be useful to list all such
benefitscosts along with the BC ratios such that the policy maker can
compare and evaluate different technologiecal or policy options For
example it is said that availability of pollution free clean fuel is
expected to improve the quality of rural life Besides instant
availability of gas makes cooking more convenient and faster Since
these benefits are important considerations in persuading a prospective
user to opt for a biogas unit these would significantely affect the
private benefit cost analysis it would not be appropriate to put a
specific premium on these benefits as these family biogas units are to
-69shy
be installed by relatively richer farmers In fact a smokeless fuel
such as LTC (low temperature carbonization) coke isavailable in the
market which can provide the equivalent benefits Similarly it is not
considered necessary to attach special premium to the fact that the biogas
unit reduces the uncertainty of energy supply since adequate stocks of
alternative fuels (eg soft coke and kerosene) can be maintained by
the prospective owners of biogas units
Another benefit of these units generally mentioned is that reliance
on the use of biogas as fuel involves neither dependence on import of
foreign energy resources nor dependence on a diminishing supply of domestic
energy resources The first point is already taken into account by giving
a premium on foreign exchange for the import of kerosene The second
consideration would require a special premium on soft coke if the reserves
of non-coking coal were relatively small Since India has more than 12000
million tonnes of proved reserves and over 48000 million tonnes of indicated
and inferred reserves of non-coking coal (enough to last 150-200 years) it
does not seem appropriate to put a special premium on the cost of soft coke
The decentralized technology of biogas production would provide
employment to the skilled and unskilled laborers in construction of these
units in maintaining the units as well as in the collection of dung These
employment benefits have already been quantified and incorporated in the
social cost benefit analysis in terms of zero shadow wage rate of
unskilled labor
Possibilities of using vegetable waste and human excreta would be
additional benefits of biogas units if these astes cannot be utilized
-70shy
either in compost manure or direct in the field Given the inhibition
regarding use of hunan excreta for producing gas for cooking it is too
early to quantify and attribute these benefits to biogas technology The
other vegetable wastes can be used both in scientific composting and in
biogas units
The only significant indirect benefit of biogas technology seems
to be in terms of health benefits The smokeless flame of the gas
contributes to eliminating eye troubles and environmental polliftion
It has been indicated that other health costs are also probably diminished
since the process of anaerobic digestion is known to kill many of the
pathogens transmitted in cattle dung Besides the manure pit which
is often the cause of flies and mosquitoes becomes free as the outlet
slurry (digested manure) does not attract these insects Rather they run
away from the pit due to some repelling odor that comes from the slurry
The health benefits of biogas technology are confined to those units
where latrines are attached to the gas plants It has been found that
only a small percentage of the individual family gas plants were connected
with latrines It is also observed in a study that almost the whole
sample irrespective of the socio-economic status was prejudiced against
laterine connections and had experienccd problems in this connection
With this bias against the use of night soil in a gas plant most of the
plants are not in a position to get the associated health benefits
Besides even in plants with attached latrines it has not been shuwn
that the health benefits of anaerobic digestion are better than those of
aerobic digestion However there is a need for a detailed analysis and
1TK Moulik and UK Srivastava (1978)
-71shy
quantification of health benefits of biogas technology as compared with
the scientific compost technology In the absence of such knowledge it
would be inappropriate to give credit to biogas technology for indirect
health benefits associated with the installation of these plants
The main element in indirect costs may be that the installation of
biogas units by rich farmers would result in an increasing tendancy to
have stable-bound cattle in order to augment the collection of dung and
urine This would deprive the poorer sectioncs in rural society (landless
laborers and marginal and small farmers) of a cheap source of fuel for
their energy needs The effect of installation of biogas units on the
availability of fuels to other sections of the society has not yet been
studied in detail This would require a comprehensive survey of villages
where these plants have been installed There would also be regional
variations in the practices followed regarding collection and disposal
of cow dung Hence these effects would have to be quantified and
incorporated in the context of some specific investiment in biogas units
On aspect of social benefit cost analysis which has to be kept in
mind is that even though many objectives such as employment generation
regional development income distribution self-sufficiency and use of
local resources etc can be taken into account by using shadow prices
instead of market prices there may still be intangible benefits and
indirect costs (arising on account of externalities) which cannot be
quantified Such benefits may deal with convenience ease of operation
flexibility mobility versatility which though difficult to quantify can
be expressed in terms of preference scales of the users If social benefit
It has been reported in studies on Chinese biogas programs that one of the important motivations of the Chinese program was the health benefits from disposal of human excreta and pig manure
1
-72shy
cost analysis is modified to incorporate these preference scales along
with use of benefit cost ratios it can still be used to evaluate
technological and other alternatives The strategy suggested here is
to broaden the methodology of social benefit cost anslysis by incorporating
these considerations
It may also be useful to consider some special resource requirements
or special adaptability problems of some technologies In the case of
family biogas plants availability of land and water in adequate
quantities near the kitchen may be a serious constraint for many villages
and may well be an important reason for its non-adoption In the case
of the photovoltaic system it may be the difficulties of leaving these
in the open spaces in the field under heavy monsoon conditions resulting
in damage or theft
-73-
TABLB IV-l ESTIMATION OF BENEFITS OF A 70 CFT (2 CUBIC METER) PER DAY FAMILY BIO(A5 PLAIT
Market Prices Shadow Prices
Annual Benefits
1 Lighting
Gas used at 20 cftday $40 $53 and valued at equivalent kerosene prices
2 Cooking
Gas used at 50 cftday $31 $10 and valued at equivalent soft coke prices
3 Manure (Additional)
Additional N content $35 $55 of 06 in 1336 tons of biogas slurry valued at urea prices
4 Total $106 $118
Present Value over 10 years
At 8 interest rate or $671 $798 discount rate
Notes 1 The following conversion factors have been used Lighting Conversion Factors
37 liter kerosene = 32 kwh of light 20 cft gas = 32 kwh of light 1 liter kerosene = 5405 cft gas
Cooking Conversion Factors
1 cft gas = 70 kcal (125 kcal at 56 efficiency) 1 liter kerosene = 1720 kcal at 217 efficiency) 1 kg soft coke = 5772 kcal (177) = 10216 kcal (5772 kcal
at 177 efficiency) 1 cft gas = 70
10216 kg sfot coke
2 K(osene Prices $025 per liter market price $040 per liter shadow price Soft Coke Prices $25 per ton market price $8 per ton shadow price assuming that two-third of coal costs are unskilled labor valued at zero Urea Prices $02 per kg at market price $030 per kg shadow price Assuming N content of 16 in biogas slurry or agains 1 N in cow dung (dried basin)
-74-
TABLE IV-2 CAPITAL COST C CONVENTIONAL AND CHINESE-TYPE BIOGAS PLANTS IN INDIA 70 cftday
Market Prices Shadow Prices
A Conventional Design
1 Digester Well Skilled Labor 714 714 Unskilled Labor 357 00 Materials (cement amp 357 446 steel)
Sub-total 1428 1160
2 Gas Holder (steel) 1166 1458
3 Appliances 320 400
Total 2904 3018
B Chinese Design
1 Digester Well 1430 1160
2 Appliances 320 400
Total 1750 1560
Notes 1 Unskilled labor is shadow priced at zero A premium of 25 percent is used for cement and steel
2 There is no steel gas holder in the Chinese-type design and hence the capital costs are lower
-75-
TABLE IV-3 RESULTS OF BENEFIT COST ANALYSIS OF A FAMILY BIOGAS PLANT
Market Prices Shadow Prices
A Conventional Plant
1 Present value of $671 $798 Benefits ( 0) P(B)
2 Present Value of $ 57 $ 57 Operating Costs P(C)
3 Present Value of $290 $302 Capital Costs P M)
4 Net Present Value $324 $439 NPV = P(B) - P(C) - P(K)
5 BC Ratio 2bull12 245 P(B) - P(C)
P(K)
6 Internal Rate of Return 35 (IRR)
B Chinese Design
1 NPV $439 $585
2 BC Ratio 350 4-75
3 IRR 71
-76shy
IV-2 Rural Energy Systems Sample Analysis of Irrigation Plans
The complexity of the rural energy system arises from the variety
of energy sources often available and used as well as of the many different
uses to which these resources are put for both energy and nonenergy purshy
poses Thus attempting to intervene in this system in an optimal
manner requires understanding of the system and how its equilibrium will
be changed This understanding should be based on a detailed picture of
resource endowment of the areas and the resource flows between and within
the different village sectors which take into account variations by seashy
son and by economic class It is thus necessary to identify current
energy use levels and patterns the magnitude of potential energy
resources and to collect important socio-economic information
The purpose of this analysis is to identify the most attractive
or beneficial new energy technologies for introduction to the system
First the technical and socio-economic feasibility of the different
candidate technologies must be assessed Then a more precise analysis
should be performed to determine the most attractive yet feasible techshy
nologies The first step here relies on resource assessment information for
the aggregate village or locale For wind and solar technologies the
resource availability is primarily a technical issue For biomass techshy
nologies there is a significant socio-economic factor concerning access to
and ownership of these resources Biomass technologies have added comshy
plications in that the availability of biomass can be purposely increased
if sufficient benefits can be obtained In this case such a use of
1 This discussion draws heavily from deLucia and Lesser (1980)
-77shy
resources must be examined in comparison theto altershy
natives Furthermore biomass resources often have existing uses and
the diversion costs must be assessed1
land and other
The second aspect of the analysis examines the costs andbeneshy
fitdof the technologies Overall this work evaluates the technologies
in light of the different energy demands and their characteristics quality
magnitude time pattern by day and season This framework requires
a systems approach -- examining the different supplies and demands toshy
gether
The following is a sample analysis that will examine various intershy
ventions in a representative village in Northeast Thailand The analysis
will estimate the benefits and costs of different irrigation schemes
under varying economi and technical conditions It will specifically
examine the situation of three classes of farm size Tha relative attracshy
tiveness of the different technologies will be compared for varying costs
of capital shadow prices for foreign exchange and reliability assumptions
There will also be discussion of the feasibility of the technologies
such as availability of and access to the necessary resources
This example is limited in that it does not address all energy
uses or technologies A more complete analysis would include examination
of the value of additiona or substitute energy sourceL or technologies
for other uses such as cooking agricultural processing or tilling
In light of the work done examining the potential for irrigation in the
Northeast and the need for increasing agricultural production in this
1 For reasons discussed earlier estimation of opportunity costs of land and forest products is an extremely difficult task requiring information which is not available at present Hence these would be ignored in what follows
-78shy
area this issue is considered to be of high priority
First a picture of the economic and demographic situation and
of the resource flows will be presented This picture will represent
the kind of information often necessary to analyze the impacts of intershy
vention Then in the ensuing sample analysis it will be shown how
this information can be used
Northeast Thailand Village Model
This village is representative in the sense that the per capita
resource endowments land use patterns and general economic conditions
reflect those for the Northeast in general Therefore much of the inforshy
mation used was aggregate figures for the entire Northeast that were
scaled down to village-level quantities These aggregate data were supshy
plemented by several village-level studies of locations in the Northeast
as well as elsewhere is the country
For regional information the sources generally used were the reports
by Russell Brannon Agricultural Sector Assessment -- Thailand (January
1978) and by the World Bank Thailand Toward a Development Strategy
of Full Participation A Basic Economic Report (September 1978) Also
used were several Agricultural Economics Research Bulletins prepared
by the Division of Agricultural Economics MOAC as background work
for Thailands Fourth Five-Year Agricultural Development Plan (BE 2520-2524)
The distribution of farm sizes is based on data from the General Farm
Survey 197374 by the Division of Agricultural Economics MOAC which
-79shy
was presented in the Brannon report The village-level cropping pattern
is based on information from all of these reports
Village level livestock population figures were derived from MOAC
and Brannon Farm and household level information was available from
the studies by the Chulalongkorn University Social Research Institute
such as Village Khon Kaen -- Social and Economic Conditions of a Rural
Population in Northeast Thailand by Amara Pongsapich with the collaboshy
ration of Jacques Amyot and Friedrich W Fuhs (Bangkok 1976) This
study surveyed village and household level data for four villages in
Khon Kaen province duuring the late 1960s Other descriptions of vilshy
lage life were also examined For information on woodfuel supply and
demand the FAO study Timber Trends Stud Thailand (Rome 1972) was used
The Village Model
This village has 105 families and a total population of 677 people
Of the 105 households in the village 100 are primarily farmers while
the remaining five include the miller two teachers a store owner and
possibly a Government official The farmers can be divided into three
classes small medium and large according to farm land and livestock
resources The average household size for the village is nearly 65
people Slightly more than half of the families are nuclear rather than
extended however this varies over time as families pass through the
cycle of nuclear to extended to nuclear as the family size expands when
the children and their spouses set up separate households Table IV-4 shows
the basic demographic data along with average land ahd livestock resources
by class Average farm size is 23 rai
1 hectare = 63 rai
-80-
TABLE IV-4 VILLAGE DEMOGRAPHIC LAND AND LIVESTOCK RESOURCES BY CLASS
PER HOUSEHOLD
Family Type Person Average Parm No of Animals
Class Nuclear Extended Household Size (rai) Cattle Buffalo Pig
Nonshy
agricultural 100 0 4 - - - 1
Poor 80 20 5 94 0 1 0
Middle 50 50 65 254 1 2 025
Rich 25 75 85 625 2 25 1
TOTALS
Number NumberTotal Number of Animals Number of of Total Farm
Class Households Persons Land (rai) Cattle Buffalo Pig
Nonshy
agricultural 5 20 - 0 0 5
Poor 23 115 216 0 23 0
Middle 56 364 1400 56 112 14
Rich 21 178 1313 42 53 21
TOTAL 105 677 2929 98 188 40
Net of two percent for household structures
-81-
With regard to agricultural production although rice (glutinous
with some non-glutinous) is the primary crop the principal upland crop
varies depending on location in the Northeast In this village as is
typical of the Northeast there is no double cropping and all rice is
rain-fed only The cropping intensity (percent of farm land actually
planted or harvested) was assumed to be about 60-65 percent with 70 pershy
cent of the crop land planted with rice The cropping intensity was
varied slightly by farm class being higher for the poor and lower for
the rieh Despite the availability of aggregate cropping pattern data
for the Northeast no detailed information was located on how cropping
patterns vary by farm size It was assumed that small farms grow only
rice that medium farms plant 80 percent of their farmed land with rice
and that the large farms plant slightly over half their land with rice
When a village-level average is calculated the regional average of about
70 percent of planted land in rice is met Table IV-5 shows the cropping
patterns and the levels of agricultural production for the different
classes The yields per rai used were 220 kg rice 1980 kg cassava
340 kg maize and 1L0 kg kenaf
As can be seen from Table IV3 the village as a whole produces a
surplus of rice however on a class level some transfer will be reshy
quired possibly in the form of income for agricultural work or for sershy
vices such as rice milling The level of this surplus reflects the fact
that reportedly the Northeast as a whole presently produces a five-percent
surplus and that the farm households must also -upply the non-agricultural
households which are about 25 percent of the total households in the
Northeast
TABLE IV-5 VILLAGE AND CLASS CROPPING PATTERNS AND AGRICULTURAL PRODUCTION
I Cropping Pattern
Per Farm Per Class
Cropping Land Harvested (rai) Land Harvested (rai) Class Land (rai) Intensity Total Paddy Other No of Farms Total Paddy Other
Poor 94 70 658 6-58 0 23 1513 1513 0
middle 254 65 1625 1300 325 56 9100 7280 1820
rich 625 60 3750 1976 1774 21 7875 4149 3726
VILLAGE TOTAL shy 105 18488 12942 5546
Village Cropping Intensity 63
co Percent of Land Harvested in Paddy 70 (assumption based on NE cropping patterns) a
II Agricultural Production (metric tons annually)
Per Farm Per Class
Other Other
Class Paddy Cassava or Maize or Kenaf Paddy Cassava or Maize or Kenaf
poor 145 0 0 0 333 0 0 0 middle 286 645 or 109 or 049 1701 361 or 61 or 28
ri ch 435 352 or 596 or 270 813 739 or 125 or 57
VILLAGE TOTALS 285 1100 or 186 or 85
These cropping patterns do not take into account vegetable gardens The other category for the NE could I( cassava maize or kenaf depending on location and market conditions
The yields were taken from Brannon for the NE they were assumed to be constant over farm size thoughtLcru is some evidence that the smaller farms obtain higher yields
TABLE IV-6 VILLAGE AND CLASS FOOD BALANCES (RICE ONLY)
Per Household Per Class
Paddy Net Rice Annual Surplus (+) Net Rice Annual Surplus (+) Production Availabi- Demandt Deficit (-)tt Availabi- Demand Deficit (-)
Class (tons) lity (tons) (tons) (tons) lity (tons) (tons) (tons)
non-agricultural 0 0 066 -066 0 33 -33
poor 145 080 083 -003 184 190 -06
middle 286 167 107 +060 937 599 +338
rich 435 254 140 +114 534 295 +239
VILLAGE TOTALS 1655 1117 +538
Due to the varying availability of a second food crop and since it appears that possibly 00 percent of a rural NE Thai caloric intake is in the form of rice a daily caloric intake of rice was assumed to be 1600 kcal or one pound of rice daily This intake level amounts to 165 metric ton of rice per capita annually this figure nearly matches the average apparent domestic per capita intake nationally over the past 10 years Although there are undoubtedly variations in food and rice consumption across class this was not included due to lack of specific data An NESDB nutrition study caloric figure nationally was 1900 kcal per person 95 percent of which was from non-meat and dairy sources This would be comparable to the 80 percent1600 kcal figure for rice for the NE taking into account the probably lower average intake (if tilu NE in comparison to the national average
Net rice availability is assumed to be the total amount of rice produced on the farm (65 percent of
paddy production) less 10 percent for losses and seed requirements
[Annual demand is 165 for rice per capita multiplied by number of persons per household
ViSurplus or deficit is net rice availability less annual demand
-84-
Table IV-7 and IV-8 examine the availability and demand for animal feed
This situation could vary significantly depending on location in the
Northeast Villages growing maize will have an abundant source of feed
from crop residues whereas cassava or kenaf producing villages may
require pastureland off-take to supplement their supplies of paddy residues
These tables slmnarize the present agricultural situation of this
village Although a detailed calculation of the conditions of the village
in the future was not undertaken some trends seem likely based on the
results of the National Crop Model of Thailand for the present Agricultural
Development Plan Two of the major pressures on the Northeast agricultural
situation will be increasing population growth and decreasing soil fertility
The forecasts for 1981 indicate decreasing rice yields and an overall
decrease in total crop income The Northeast is expected to become a
net importer of rice to meet household needs Therefore on the village
level the rice surplus will decrease as the ratio of farmland to populashy
tion decreases The poor will need to earn more income in order to be
able to purchase rice In general the per capita availability of resources
will be less
With regard to the availability of wood fuel in the Northeast
a regional average would be misleading in light of the wide variation
in actual availability in different parts of the Northeast Whereas
the northern and western parts of the region still have forests much
of the rest has few forest resources
-85-TABLE IV-7 VILLAGE AND CLASS FOOD AND FEED BALANCES
Villaqe Feed Requirements
Crop Residue
Equivalent to Number of Total ResidueAnimal Annual IntakeNeed 60 of Intakel Head Demand
(tons) (tons)
Cattle 52 x 106 kcal 16 98 157 Buffalo 83 x 106 kcal 25 188 470 Pig 20 x 106 kcal 06 40 24
60 Annual Feed Requirement 651 tons An approximation based on the nutrient balance example examined in Table 5
Village Feed Availability from Crop Residues Crop Production Residues Total Crop
Crop Residue (tons) Crop Ratio Residues (tons) Paddy Straw 285 20 570 Paddy bran 285 005 14 Maize residues 186 25 465 Cassava leaves 1100 02 220
Total kenaf growing villages 584 cassava growing villages 804 maize growing villages 1049
illage Balance
For maize growing villages crop residues exceed 60 of the annual feed requirements The remainder can be met by offshytake from grazing
For cassava growing villages crcp residues exceed 60 of the animal feed requirements Since cassava leaves are highin protein and nutrients (see Table 3) these satisfy some 75 of the feed requirements the remainder to be met by offshytake from grazing
For kenaf growing villages only 40 of the feed requirements maybe met by residue (The possible use of kenaf residue adds some unknown quantity) The remainder must be met by offtake from grazing
)usehold Feed Balances (including only paddy straw) Annual Deniand of On-Farm Rice Straw Shortage(-) Straw for Feed Availability or Surplus (+)
CJass (tons) (tons) (tons)
non-agricultural Only animals in the class are the 40 pigs which are not fed straw (they are fed bran by the miller who owns them)
Poor 25 29 +04 Middle 67 57 -10 Rich 100 3 -13
-86-
TABLE IV-8 FEED CHARACTERISTICS AND FEEDING REQUIREMENTS
A Feed Characteristics for Digestion by Cattle or Buffalo
Digestable Crude Total Digestable Feed Protein () Nutrients ()
Paddy Straw 04 371 Paddy Bran 93 649 Maize Stalks 21 567 Cassava Leaves 150 600 Pasture Grasses 40 600
The numbers in this table are representative of the chosen Thai feeds This type of information varies among different crop variety different cultivation and harvesting practices different climates and different animals The principal sources used were Tropical Feeds (GOhl FAO Rome 1975) and Feeds and Feeding (Cullison Reeston Pub Co Reston Va 1975) The pasture grass characteristics are rough averages of the various grasses native to Thailand noted in Gohl (1975)
B Example Feed Balance for a 500 Kg Buffalo
Dry Matter Digestable Crude Total Digestable (kg) Protein (kg) Nutrients (kg)
Daily Feeding Requirement 125 06 635
Feeds Paddy Straw 70 028 260 Cassava Leaves 30 45 18 Pasture Grasses 25 1 15
Total Feed Characteristics 125 58 590
This is an analogy to bullock maintenance in India (SP Arora The Role of Treated Roughage in Animcal Production Systems in Developing Countries in New Feed Resources FAO Rome 1977) This weight is equal to that of the mature buffalo in Thailand so it is somewhat larger than the appropriate average weight
Note Even with significant intake of cassava leaves and pasture grasses
the protein and nutrient in the feed fall short of the assumed feeding
The Thai village livestock are assumedrequirement in this example to have somewhat deficient diets but their exact feed parameters have not
been investigated For the crop residue balance in Table 2 a 60
intake of paddy straw and maize residues was deemed appropriate
-87-
According to the 1972 FAO timber study Northeast forest land had
on the average about 43 m per hectare standing stock with an annual
increment of about 10 m3 This compares to the reestimated country
averages of 715 and 18 m per hectare respectively The total Northshy
east demand for residential wood fuel in 1970 according to the FAO study
was 163 million cubic meters (115 fuelwood and 48 charcoal) Comshy
paring this demand with the total annual increment of Northeast forests
of about 8 million cubic meters the infeasibility of meeting the deficit
from non-forest land clearly indicates at least one motivation for the
apparent deforestation of this region In fact according to recent
statistics the forest area of the Northeast was reduced to 510 million
hectares in 1973 according to the Royal Forest Department from the
estimated 78 million hectares in the FAO study
The sources of non-crop biomass for-a village or household in the
Northeast generally fall into the following categories
1 forested and deforested public land
2 farm or private land and
3 imported or purchased biomass
At present information concerning the sources of wood fuel is
very limited The FAO Timber Trends study had national demand met by
the annual increment of small-size forest timber plus a variety of other
sources such as mangrove forests rubber plantations removals by shifting
These figures were adapted to reflect both sawlog size and small timber
Division of Agricultural Economics MOAC Fourth Five-Year Agrishycultural Development Plan BE 2520-2524 Guidelines AgriculturalEconomics Research Bulletin No 114 August BE 2519 Chap 2 D 7
-88shy
agriculture falling losses off crows (falling timber tops) and proshy
duction from farmlands The latter source farmland production was 3
the largest of these other sources at 8 million m in 1970 Given the
total area of farmlands in 1970 of about 155 million hectares the
average off-take was about 05 m3 per hectare from farmland No regional
estimates of this off-take were presented but in light of the relatively
low productivity of Northeast forest land for the purposes of this
exercise it will be assumed that Northeast farmland yields 03 m3 of
wood fuel per hectare annually For grazing or animal feed purposes
it will be assumed that deforested public land and non-cropped private
land yields one ton per hectare of feed annually This figure is meant
to be conservative to represent the fact that if such land were signishy
ficantly more productiveit would be planted however no actual figures
concerning the productivity of this land were located
Based on these estimates of useful biomass productivity the arious
land requirements involved in meeting domestic wood fuel and grazing
can be examined First the resources available from the village farmshy
land will be summarized Non-cropped farm land amounts to 35 percent
of total farm land )after netting out 2 percent for household structures)
Therefore about 1025 rai or 164 hectares of land is available for
some animal grazing with a potential yield of about 164 tons of feed
annually this amount appears to be adequate to meet the feed requireshy
ments not met by rice straw and bran On the household level based on
this possible off-take of feed from non-cropped land the medium and large
-89shy
farms are able to supply themselves with sufficient feed for their
livestock from their residues and their non-cropped land
With regard to wood fuel annual domestic demand in the Northeast
3 according to the FAO study is 135 m per person therefore the total
3 model village demand is 914 m annually If the annual yield from farmshy
3 3 land is 03 m per hectare this source would contribute 141 m or about
3 15 percent of the total demand The remaining 773 m must be met by
either forested public land or imported wood fuel If this amount were
supplied by the annual increment of the forests about 770 hectares of
forest would be needed -- an area equal to about 165 times the area
of the village For the Northeast forest land area in 1970 was about
85 percent of the farmland and since forest land has been decreasing
this ratio (165) of accessible forest to farmland is only rarely availshy
able The remaining options for wood fuel supply are imports or deforesshy
tation If total forest clearing were practiced about 18 hectares of
Northeast forest land would be deforested annually to meet village
level requirements
Figure IV-2 is a flowchart outlining the major resource flows within
the village The quantities indicated are all based on Tables IV-4 through
IV-8 and the accompanying text The circles in the figure represent opporshy
tunities for the introduction of village-level energy technologies
Technology A could be improved charcoal production improved stoves
a micro-hydropower project or a village woodlot Technology B could
FIGURE IV-2 VILLAGE ENERGY-RELATED RESOURCE FLOWS NORTHEAST THAILAND
___________allery_(fuel domesllic labor Ao (1iouseholds 105 flamllic 677 peopla
domeslir loriov lot fuel collecilon - e rdoiealabor auppty dlnklng wolct sc - 9gicullu |allabor upply 3
4 |- fuel use (cooking) dcmond- 914 m wooduicsPrwolc luel (825 mdwood) food IWake 112t rice meat vcaatiblc$
- catailsconaliuclion maoltrloI f oo
- alonds Ionapoelollon ogulcullulol wohfoQlhod Co
-pasLurciand 6lO0t ceV or lenergy 85t L1co or
Li veilocta IS8 buffalo 98 cpq L40 pigsCsIurplus food (54L rice - dalpoweA cash claps
I Clb~ bo manure ISampDurCI r ______i __upplies- Crop processing o
food (Ie 1lcc lhic thing drying enrydraft powe fue a odI ukn$
(alicd villoge i rt
584t atra bran tchnology
- a lry Cio lonslucilon (alerl crop + rcladushy
to iduca energy o tertlize ryn
chemi~cl Culllvaed land 1850 rat pea icldesamp ci cuIda - load Ciops rice vegatable
Cncr yY f~ ~ y i
- Cash GlQp61 cassava- or maiza or kenat fdegogwth
energ
tcop rastdues
_tchnolo
-91shy
be biogas or pyrolysis or gassification (or even composting) Techshy
nology C could be solar pumping or solar drying Because of the diverse
but interdependent use pattern of different resources the introduction
of an energy technology will alter a multitude of resource flows
The Benefits and Water Requirements of Irrigation
In this village agricultural production is clearly the primary
sector however in recent years this sector has exhibited some stagshy
nation Unit productivity or yields have remained relatively constant
and in some cases have decreased The growth in agricultural output
is mainly due to the expansion of the land farmed which in turn along
with wood fuel demand has contributed to deforestation as well as to
use of land marginally suited to agriculture In order to increase
yields a large increase of the inputs to agriculture has been attempted
high yielding varieties mechanization fertilization irrigation pesshy
ticides Most of these inputs reflect or require the use of greater
amounts of energy
Irrigation can increase yields of agricultural production when
applied separately as well as in conjunction with other new inputs
All indications are that at least for a significant proportion of
the developing workd pumping of water for domestic and irrigation supplies will be of paramount concern during the next ten to fifteen years In an excellent paper on small farmers and landless in South Asia Singh (79) argues that the most critical input into the agricultural system in Sou+-h Asia is irrigation water He presents data from India which show that despite the dismally low average fertilizer applications the fertilizer use on the irrigated areas is more than twice as much as on the nonshyirrigated areas This implies that the binding constraint is irrigated area not the farmers technical know-how or fertilizer use
-92-
Irrigation can be achieved in many ways and scalesranging from large
reservoir and irrigation canal systems supplying a large area to a
single pump for a farmer Irrigation from pumping has significant advantages
over other methods involving reservoir or tanks in that it doesnt require
dam costruction land acquisition extensive canal systems or the
establishment of a complex organizational structure Furthermore it
can be scaled to most levels -- household village etc However pumping
(cont)
Singh focuses upon the small farmers and claims that the majority of the worlds poor are among the 625 million people who live in the rural area of Bangladesh India and Pakistan He shows that in 1977 more than 52 million households in these three countries fell into the category of small owner and tenant cultivators with operational holdings less than 5 acres (L2 hectares) This implies a population of more than 250 million people living on marginal holdings If we assume that all the Bangladesh and Pakistani households and 50 percent of the Indian households have a need for irrigation and have available shallow groundshywater or nearby streams then we arrive at a staggering 30 rillion households in the market for low-cost irrigation water pumps In Indonesia the island of Java is home for 100 million people The average farm size is cnly about 12 hectare Because of land scarcity double cropping and use of high yielding varieties are widespread The percentage of farm land which is irrigated is well over 50 In the rest of Asia Africa and Latin America there is probably a demand for a further 10 million water-supplying devices of the same size then a potential market of 40 million small irrigation pumping systems exists
--93shy
has several drawbacks which are only recently being overcome These
problems are concerned with the issues of high maintenance and operating
costs dependence on fossil fuels (whose costs are rising and whose
availability is uncertain) and minimum economies of scale which are
beyond the reach of many
The benefits of irrigation in Northeast Thailand were estimated
in a study by the Asian Institute of Technology (AIT) for the National
Economic and Social Development Board From this work comes a possible
irrigation scheme involving pumping for both growing a dry season crop
and supplementing wet season rainfall The benefit of this setup was
estimated to be about $200 for each hectare1 For this analysis it
was assumed that the per-hectare benefits are constant for all farm
sizes
In analyzing the irrigation potential of an area a variety of
economic social and physical aspects must be considered In addition
to the resource endowments and demographic and socio-economic data inshy
formation is needed that is more detailed and site specific such as
the degree of land holding fragmentation and the local topography These
issues would affect the feasibility and cost of irrigating with a farmers
fields from a single tubewell In this sample analysis it was assumed
that a farmers land formed one contiguous parcel and that the topography
of the land did not require or involve a significant investment in a
1 Asian Institute of Technology Water for the Northeast A Strategyfor Develocnent of Small Scale Water Resources prepared for the National Economic and Social Development Board
-94shy
distribution system An approximation used that is related to this
latter issue is the efficiency of pumping and delivery which is a
function of the distribution setup and its losses In this analysis the
field irrigation efficiency assumed is 60 percent (ie 60 percent of the
quantity of water pumped is available to the plants in the field)
Another set of considerations is the site-specific hydrological
conditions such as the depth of water table the size of the aquifer
and recharge rates These factors affect the depth and therefore the
cost of the well and the feasibility of widespread pumping In this
analysis groundwater was considered to be available at such depths that
the dynamic head of 25 feet could be used in calculating pumping capacities
As to the size of the aquifer and recharge rates it was assumed that these
factors were not constraints In any actual analysis these factors should
be considered to account for any drawdown of the water table as a conseshy
quence of irrigation and to assist in the design of the well
The two major technical components of the demand for irrigation
water are the quantity and seasonality of the water needed by the crops
According to the AIT study under the scenario used in this analysis
3the water needs are 12500 m for each hectare annually The seasonality
of this need was defined by two peak periods and then a flat demand
over the rest of the growing period The number of pumping days annually
was taken to be 250 The water demands were as follows for one hectare
-95shy
1 peak period 200 mm over a 20-day period (100 m3day)
2 secondary peak period 150 mm over a 20-day period (75 m3day)
3 rest of year 900 mm over a 210-day period (43 m3 day)
Based on this irrigation demand and the farm size the minimum
size or power of the pump required can be calculated For some techshy
nologies an assumption has to be made concerning the maximum daily
operation of the pump which in turn affects the total amount of work
which can be performed in a day Theie are both technical and social
aspects to this issue such as recharge rates and work schedules In
the analysis the maximum was assumed to be 10 hours per day As will
be seen because of the limited selection of commercially available
engines the choice of size is almost insensitive to this issue For
other technologies -- solar or wind --this issue is different since
the total amount of daily work is a function of theweather and climate
It is important to note that the basic parameters defining the
benefits and requirements of irrigation in the Northeast are less atshy
tractive or more severe than those commonly used in this type of analysis
Often the benefits are considered or assumed to be significantly higher
$250 rather than $200 for each irrigated hectare Furthermore only
310000 m of water is required as opposed to the 12500 m3 required
in this example These differences make this analysis of the overall
attractiveness of irrigation much more stringent than is found elsew--e
-96-
With this information the pumping power required to irrigate one
hectare can be calculated
3 33 (624 lbft water)(25 ft) (353 ft3M x (100 m pwrd) = 046 HPha
(06 fe)(550 ft-lbsec 10 hd max oper hphr
Note fe is field efficiency pwr is peak water requirement max oper is maximum operation
3
during the peak period when 100 m must be pumped in at most a 10-hour
day The three farm sizes or classes of farms being examined and their
peak pumping requirements are as follows
Cultivated Peak pumping Land Requirement
Small 105 ha 05 HP
Medium 264 ha 12 HP
Large 600 ha 28 HP
Identification of Irrigation Options
Given this irrigation demand the next steps are to determine and
then evaluate the feasible resources and technologies for supplying the
needed pumping energy The feasibility is based on the availability
of the energy resource (fuel) and the technology of utilization The
evaluation involves estimating the capital and operating costs of the
different pairings of fuel and technology
-97-
Irrigation by pumping can be fueled by a wide variety of energy
sources human animal solar (photovoltaic) wind gaseous liquid
and solid fuels and electricity Defining the potential technologies
for use in this Thai village requires examination of the resource
availabilities In the case at hand human and animal energy would be
inadequate Given the demand for these energies in other aspects of
farming and rural life and the depth and amount of water involved
these sources would be insufficient Under different resource conditions
these options might require consideration Solar energy such as photoshy
voltaics would be feasible however the cost of the technology is
presently quite high In addition assessment of this possibility would
also need some site specific solar insulation data However using
representative figures the approximate cost per peak watt of photoshy
voltaics that would make it attractive is about $1-2 Another form of
solar energy hydropower is rarely available in most of the Northeast
and therefore was not considered
Wind energy is another possible source that is very strongly site
specific There are portions of Northeast Thailand with significant
wind velocities However for this example wind energy has not been
considered
As to gaseous fuels whereas there is no natural gas available in
Northeast Thailand there is the potential to generate low BTU methane
and synthesis gas via in the former case biogas or in the latter
-98shy
gassification The animal populations of this part of Thailand are
large enough to consider the widespread use of biogas As for syntheshy
sis gas from pyrolysis of cellulose the raw materials are available
though their relative scarcity is increasing
With regard to liquid faals petroleum products such as diesel fuel
are transported into this region (there are no local oil deposits) alshy
though their reliability and increasing cost are problems Alcohol
fuels are not very feasible because of a lack of available sugar feedshy
stocks There is the possibility of growing a crop for alcohol proshy
duction whose use in turn would lead to a sufficiently greater overall
crop production1 However reliable cost and performance data of smallshy
scale alcohol production are not available and as a result this posshy
sibility was not considered Alcohol production is also hampered by the
lack of a relatively simple process by which cellulose a much more
available commodity could be used as a feedstock
The only solid fuels available in this area are -ellulosic wood
and crop residues As was described above these resources are scarce
Wood once a plentiful fuel from forests has become increasingly more
difficult to obtain Agricultural residues dependin9 on the second
crop planted are often in high demand as animal feed The availability
of these residues is strongly influenced by the existence and productivity
of pastureland which reduces the feed demand for residue No fossil fuel (coal peat lignite) deposits are located nearbyr Lignite is mined
in Thailand but the reser-s ar not very arg
hcthouh asva (nandioca) could also be considered as feed for hel alcohol it has not heen included on account of lack of adequate experiencein this techolcgy of producing alcohol from casava
1
-99-
The last possible energy source is electricity which is not often
available in rural Thailand unless it is locally generated In this
analysis it is assumed that the village is not connected to the grid
nor does it have a generator
In summary feasible energy sources are biogas pyrolysis gas
and diesel fuel
Although this discussion focuses primarily on the availability of
different energy sources these sources are obviously intertwined with
the technologies of utilization (eg pumping) and transformation (ie
pyrolysis biogas ) resulting in a fuel being available even though
the utilizing technology may be presently impractical An example of
this is the steam engine This engine could allow farmers to take
advantage of a range of solid fuels which otherwise would have to be
converted into a liquid or gas However at t-he present time there is
not much information available on a well-tested practical application of
this technology at scale required therefore this possibilit is not considered
On the basis of the source and technologies assessment the following
irrigation options will be examined
1 diesel engine and pump run on only diesel fuel
2 dual-fuel (diesel) engine and pump run on either diesel fuel or biogas
3 gas engine and pump run on pyrolysis gas
4 free piston Stirling engine using crop residues in a furnace
All of these options require the construction of a tubewell These
1 Intermediate Technology Development Group (ITDG) London has conducted a study on the demand for steam engines (5-50 hp units) in developing countries under the direction of Drummond Hislop Professor Graham Rice at the University of Reading UK is currently involved in an irrigation pump study sponsored by the United Nations Development Program (UNDP) and undertaken jointly by Halcrow Engineering and ITDG
-100shy
options need to be designed to fit the needs and resources of the
different farm classes
As to the first option for each farm size the smallest diesel pump
that meets the peak power demand will be used Unfortunately given the
limited availability of small horsepower engines both the small and medium
farmers are forced to puichase a 2 hp engine -- much larger than needed-
For the large farm this probilem does not arise and a 3 hp engine is
considered
The second option involves supplementing the diesel option with a
biogas plant Because a dual-fuel engine can be run on a variable mix
of diesel and biogas (with a maximum of 23 biogas 2) there is some
flexibility in the selection of the size of biogas plant
Plant size selection is a function of animal holdings and the tradeshy
offs between incremental capital cost of larger plants and the resulting
diesel fuel savings Since the demand for biogas for pumping is not
constant over time constructing a plant to meet the peak demand will
result in a large gas surplus over much of the year it is important
therefore to analyze a range of biogas plant sizes if the livestock
holdings permit For the small farm a plant with a daily gas production
of 40 ft the smallest plant considered in this analysis recuires
1 The peak power requirements for small and medium farms are 05 and 12 hp respectively
2 Technically it is possible to run on a higher biogas mixture but present results have been able to attain only a 23 maximum mix over the long term
-101shy
as is discussed below the equivalent of at least 17 large animals which is
larger than averagefor this group1 Therefore this plant is possible only if
a farmer has two large animals or the equivalent manure available through
either other small animal holdings buying manure or cooperation among several
small farmers For the medium-size farm with about 3 large animals 40 and
60 ft3d plants are feasible For the large farms the 45 large animals and
1 pig can support a plant size up to nearly 120 ft 3d However with some sort
of manure market (either outright selling and buying or exchanging manure for
digester slurry) these size limitations could possibly be exceeded if found
to be sufficiency attractive
The third option involves using a small gassifier to run the diesel pump
Based on conversations with people who have experience with large gassifiers
the impression is that the gassifier for 2 and 3 hp engines are quite feasible
and would not be significantly different Despite the uncertainty around this
option it was assumed that the same gassifier would be able to meet all the
fuel needs of the gas engine for all three farm sizes The availability of
residues for gassification is a complex and site-specific issue In the repshy
resentative village the availability of residues is dependent on the specific
cropping pattern and therefore can vary considerably Furthermore this availshy
ability is significantly affected by the nature of the dry season crop From
this perspective the choice of a second crop or even rice variety is not only
a function of the grain or crop yield and value but also of the residue yield
and energy value As will be shown below the residue yield frol the additional
production due to irrigation does not have to be very large in order to supply
sufficient residues for running the gassifier This conclusion holds true for
all farm classes
1 It is important to recall that the animal holdings per farm type were 4eshyveloped solely by assuming (due to lack of actual data) that larger farm sizes own more animals For biogas analysis it is important to collect accurate deshytailed data on livestock holdings as well as information on livestock managmentpractices to assess collectabiliv of 7v nure
-102-
The fourth option is the use of agricultural residues to run
a Free Piston Stirling Engine (FPSE) The advantages oZ including
Stirling engine in the analysis are (i) Small scale Stirling
engines of capacities equal to 03 KW (040 hp) to about 1 KW are
likely to be available which means that scale-disadvantage of
small farmers can be overcome (ii) The Stirling engine is an
external combustion air engine can be run on a variety of fuels
and has a minimum of moving parts These advantages are crucial
in view of difficulties of repairs and maintenance and uncertainties
of fuel availability in developing countries
In the analysis of the irrigation system discussed earlier
the Stirling engine is to be considered in place of a diesel (or
dual-fuel) engine while a furnace is to be considered in place
of a gasifier or a biogas unit The rest of the irrigation system
including tubewell pumpset etc remains the same
-103-
Estimation of the Cost of Feasible Irrigation Options
Estimation of the cost of these different options requires the
the capital and the operating costs for each technology
Capital Costs
The capital costs of the technologies assessed were based on rather
limited cost data from Thailand and other relevant countries in parshy
ticular India The tubewell is integral to irrigation schemes The
costs used are based on a 100-foot depth of tubewellland were estimated
for both steel and bamboo These figures were based on an Indian study2
The bamboo tubewell has limited applicability in Northeast Thailand beshy
cause there are areas where bamboo is not readily available and where
soil type makes it infeasible The tubewell costs are presented in
Table 5 Local labor was shadow priced at 25 percent of its market
value whereas all metal components were assumed to have a foreign exshy
change component of 100 percent The lifetime of the steel tubewell is
10 years for the bamboo 5 years No maintenance costs were considered
The smallest diesel pumps were examined and it appeared that the
only commercially available sizes were 2 hp or larger No smaller pumps
were considered to be available and if they were their cost would not
be significantly less For diesel and matching pumpsets the costs used
are presented in Table IV-9 The social costs are based on groundwater
1 Again the depth is a site-specific factor based on groundwaterand aquifer hydrology and soil type
2 Project report on Supplementary Minor Irrigation Scheme for Purnia Saharsa and Katihar Government of Bihar 1977 as quoted in Bhatia (1979)
-104-
TABLE IV-9 CAPITAL COST DATA (US DOLLARS)
Social Cost
At 25 At 50 Foreign Foreign Exchange Exchange
Equipment Market Price Premium Premium
Tubewell
steel 510 440 510 bamboo 160 100 100
Diesel engines and pumps
2 HP 400 480 560 3 HP 510 610 710
Thai biogas plants (daily gas production)
340 ft3l2 m 160 160 190 360 ft3l7 m 200 200 240 3120 ft334 m 375 375 445 3150 ft3425 m 420 420 500
Chinese Janata biogas plant
40 ft3 daily gas production 85 85
Gas Engine (2 HP) 400 480 560 Gasifier 140 165 190
Stirling Engine and Pump 05 KW 225 270 315 10 KW 450 540 630 225 KW 1125 1350 1575
Furnace 100 120 140
-105shy
indirect foreign exchange component of 80 percent These costs were
developed from various estimates and checked for consistency using
the six-tenths rule It was assumed that these pumps have a lifeshy
time of 10 years or 10000 hours The annual maintenance cost was
assumed to be $110 annually This cost is very approximate since an imshy
portant aspect of this issue is the availability of maintenance a facshy
tor which is hard to quantify Because of the lack of detailed inforshy
mation on maintenance costs this simple approach was taken as opposed
to others that might include a cost per operating hour The fuel conshy
sumption of these pumps was taken to be 025 liters of diesel fuel per
horsepower-hour Again this figure is an approximation that matches
the various figures found in other work It assumed an engine efficiency
of about 28 percent The capital costs of dual fuel engines which are able
to run on diesel and biogas and of gas engines which run on pyrolysis gas
are the same as for diesel engines
The costs for the biogas plants were based on a review of costs found in
Thailand in reports and through personal communications and of costs found 2
in India The designs and costs of biogas plants in these countries
seem relatively similar The costs used are presented in Table 5 The
social costs are based on a foreign exchange component of 75 percent
The reiaining 25 percent of the costs is local labor and was shadow
priced at 25 percent of its cost The daily gas production
1 6Size A _ Cost A Size B Cost B
2The primary source for Indian costs is Ramesh Bhatia Energy Alternatives for Irrigation Pumping Some Results for Small Farms in North Bihar
-106shy
was assumed to be an average value for the entire year Since mean temshy
peratures in this region are fairly constant gas production will not
vary significantly However in some areas it is important to take into
account seasonal temperatures and their consequent effects on gas proshy
duction and the ability of biogas to meet seasonal energy demands
Maintenance costs were assumed to be $7 annually for the two smaller
plants and $10 annually for the two larger plants
In the analysis below the case of using an alternative biogas
design with significantly lower capital costs was examined These costs
1 were based on the Chinese-type Janata design This alternative was
explored for the small farm situation becuase of the relatively high capital
costs the farmer faces for the engine and pump The cost for a 40 ft3d
plant of this type is also presented in Table 5 The maintenance costs
wera assumed to be $7 annually
The feasibility of biogas plants on the farm level is dependent on
the supply of and demand for animal residues Based on several surveys
of the literature it was assumed that 165 kilograms of wet manure
(from buffalo cows etc) can produce 1 cubic foot of biogas 2 Assuming
the average large animal excretes 14 kg of wet manure daily (about
5000 kg annually) the animal manure required for running a biogas
plant (assuming 100 percent collectability) are
1 The costs for 100 150 and 200 ft3d plants were also presented in Bhatias report and were scaled down for a 40 ft3d plant
2This figure was presented in ESCAP Biogas Newsletter (August 1978)and is an average of summer gas production rates in Bhatia and Niamir (1979)
-107shy
biogas plant required daily number of large(daily gas production) wet manure input animals required
340 ft d 24 1kg 17 60 36 26
120 73 52 150 91 65
Since the gas production per unit of pig manure is about twice
as much as from cattlebuffalo and pigs produce about one-fourth the
manure daily one pig is equivalent to one-half large animal for biogas
potential estimations Based on these results and the average animal
resources for different farm classes as noted above there are signishy
ficant limitations on the size of plant which can be operated Furthershy
more the required animals assume 100 percent collectability of manure
This constraint can be lessened if manure is purchased 1
With minor engine adjustments biogas can be used to fuel dual-fuel
engines but only as part of a mixture of two-thirds biogas and one-third
diesel Higher gas mixtures are possible The fuel mix used to produce
1 horsepower-hour was 10 cubic feet biogas and 008 liter diesel fuel
The costs of the gasifier are extremely uncertain because of a lack
of experimentation and use of this technology with very small engines
(under 5-10 HP) Worldwide there has been much successful use of larger
engines such as a 100 HP and it appears that the designs could be
adapted for small ones although it is recognized that some redesign will
be necessary It was assumed that the small engines considered in this
1 The price could be as little as the collection cost if manure isused as fertilizer because the corresponding digestor slurry could be returned thereby returning the fertilizer value
-108shyanalysis could be powered by a gassifier which would cost about $100
in materials and an additional $40 of skilled labor The foreign exshy
change component was considered to be equal to the total materials cost
or 70 percent of total cost Being skilled the labor was not shadow
priced The capital costs are presented in Table 5 The lifetime was
assumed to be 10 years and annual maintenance costs to be $10 Represhy
sentative efficiencies were assumed to be 1) a conversion efficiency
of agricultural residues to gas of 60 percent and 2) an engine efficiency
of 15 to 20 percent This second efficiency takes into account the downshy
rating effect pyrolysis gas has on engine horsepower For diesel engines
this effect could be about 10 percent Based on these efficiencies
about 2 kg of agricultural residues could provide 1 horsepower-hour1
The Stirling engine especially the Free Piston Stirling Engine
is currently in the experimental stage and indications are that these
engines will soon be commercially produced Table IV-9 presents the
best available estimates of capital and annual costs of Stirling
engines of different sizes The average costs are of the order of
$450 per KW as compared with approximately $270 per KW in the case of
a diesel (or dual-fuel) engine However since smaller units of 05
KW capacity Stirling engines are available the capital cost for the
small farmer is lower ($225) in the case of a Stirling engine than
in the case of a 2 hp diesel engine ($400) This makes Stirling
engine relatively attractive for small farmers a conclusion supported
by the results of calculations The capital costs of a furnace are
assumed independent of the engine capacity and are taken at $100 per
unit
Given that 1 hp-hr = 269 x 106 Joules and that 1 Kg of agriculshytural residues can potentially produce 13 x 10 Joules
269 x 10 6Jh-hr - 2 Kg raslduE per hp-hr
(13 x 100 JKg residue) (06) (0175)
-109-
Operating Costs
Since fuel costs are the only variable operating cost in this example
an important input is the unit fuel costs The fuels involved are diesel
fuel manure and agricultural residues For diesel fuel a simplified
approach was taken because of the tremendous uncertainty of forecasting
petroleum prices even over a ten-year period The current price of
diesel fuel at the Persian Gulf was taken to be $025 per liter a
figure based on $25 per barrel of oil It was assumed that transporshy
tation and distribution would bring the price in Northeast Thailand to
$30 per liter presently Then by assuming a 5 percent annual increase in the real cost of petroleum products over the next ten years (a 65 pershy
cent increase over the decade) the average price of diesel over this
ten-year period was estimated to be $040 per liter in present dollars
This price represents the social cost of diesel fuel and is used in the
economic analysis
Unfortunately the future policy concerning diesel prices is not
clear while there is growing alarm over the oil import bill and the
cost of subsidies oil prices were recently reduced As a result the
diesel fuel cost used for the financial analysis was also the average
price of $04liter In the economic analysis when using different
shadow prices for foreign exchange the foreign exchange component
of diesel fuel was taken to be 100
The cost for manure can be a complicated issue because of its value
as fuel fertilizer or input to composting The fertilizer value is
usually higher but is very uncertain because the nutrient value is very
sensitive to handling procedures Presently in Northeast Thailand dung
is used to varying degrees as a fertilizer directly and there does not
appear to be any market for it This valuation problem was handled by
equating the fertilizer value of the dung to that of the digester slurry
Therefore no cost is assigned to the dung and on the benefit side no
-110shy
credit is given for the removed digester slurry In areas where dung
use is more extensive a more detailed approach could be used but it
is important to note that the procedure does attribute a cost or value
to manure
The cost of agricultural residues was considered to be zero beshy
cause of their apparent underutilization in Thailand presently The
representative village shows them being used for animal feed yet the
extent of this activity in reality is unknown Survey work is necessary
to determine the degree of residue utilization If the residues are
or did become fully utilized for feed because of pastureland limitations
or for the extensive use of gassifiers then the residue would be valued
on its primary or its marginal use
The operating costs were estimated by simulating the operation of
each technology Estimating the fuel usage for the first option of using
only diesel fuel involved calculating the capacity of the pump selected
for each farm size and then given the pumping requirement determining
the number of operating hours necessary Then on the basis of the
fuel consumption of 025 litershorsepcwer and the engine size the hourshy
ly fuel use and the annual fuel use were calculated The fuel use for
this option can be calculated without consideration of the seasonality
or daily amounts of water required because the fuel is in theory always
available without any seasonal or daily limits
Estimating the fuel use for the biogas options is more complicated
because of the daily limit on gas production and therefore consumption
1 Please see the discussion on opportunity costs at the beginning of this section
-111-
Simulating the operating costs involved calculating the minimum daily
horsepower-hour requirements for each of the three irrigation periods
(the primary and secondary peaks and the remainder of the pumping
year) The biogas was assumed to meet these requirements up to either
the capacity of the plant or two-thirds of the total requirement Diesel
fuel consumption was determined by the energy demand not met by biogas
The pumping period is 250 days the biogas was assumed to be available
at capacity for this period In the sensitivity analysis presented
below reliabilities of less than 100 percent are examined
Biogas in other words is the baseline fuel which depending on
the plant size and farm size supplies a significant portion of the fuel
needed during most of the pumping season However during peak periods
it often becomes necessary to use a great deal of additional diesel fuel
because of the daily limit on gas production For a given farm size
as larger biogas plants are considered the point is reached when the
additional gas production is only used for irrigation during the peak
periods As will be seen in the results below the increased cost of
a larger biogas is not matched by fuel costs foregone during the relashy
tively limited peak periods
Calculating the fuel costs for the third or fourth options of
using a gassifier or a Stirling engine are simplified by the assumption
that agricultural residue costs are zero Therefore these options
have no fuel costs except when limited reliability is considered in the
sensitivity analysis below Maintenance costs for the Stirling engine
It is important to point out a simplifying assumption that biocas proshyduction was assumed to be constant throughout the year The benefits of biogas can be more or less depending on the deqree of conincidence between the peak gas production and peak pumping requirement seasons
-112shy
are estimated at $5 per year for the furnace and $50 per year for the
engine for the range of 05 to 25 KW The furnace efficiency is
assumed as 60 percent the engine efficiency as 30 percent and the
pump efficiency at 80 percent This gives an overall efficiency of
approximately 15 percent
The present value costs for the different irrigation options are
shown in Tables IV-10-12 For each farm class there are the basic
costs of the diesel engine the pump engine and pump maintenance and
the tubewell To these basic costs are added the fuel costs and additional
capital costs for either the biogas plant or the gassifier depending on
the option
Table IV-12 shows an additional capital cost for the large farm for
a second diesel engine and pump The lifetime of these pumps was 10 years
or 10000 hours On a large farm the annual operating hours are 1160
therefore after about 8 years a replacement pump will be needed Since
the analysis pertains to a ten-year period the additional capital costs
for a new pump for years 9 and 10 are one-fourth the cost of a new one
present valued as a cost occurring at the beginning of year 9 The annual
operating hours of pumps on small and medium farms are 305 and 770 reshy
spectively
Results
As mentioned earlier the analysis is based on benefit cost ratios 1
The benefits from irrigation are reported to be $200 per hectare Table IV-13
presents the present value of the benefits for the farm classes under
varying costs of social rates of discount and values of shadow price of
foreign exchange
The discussion )n different decision criteria has been uresented earlier in S on II
TABLE IV-10 PRESENT VALUE OF TOTAL COSTS OF IRRIGATION SCHEMES ON SMALL FARMS (10-YR PERIOD US DOLLARS)
Basic Costs
2 HP engine pump
maintenance ($110yr)
tubewell (steelbamboo)
Subtotal with steel tubewell
with bamboo tubeweil
(A) 2 1IP pj5 with diesel only fuel (152 litecsyr)
TOTAL COST steel tubewell
Market Prices Social Coss
Foreign-Exchange Premium of 25
5 10 15 10 15 20
400 400 400 480 480 480
850 670 550 670 550 460
510290 510260 510250 440160 440150 440140
1760 1580 1460 1590 1470 1380
1540 1330 1200 1310 1180 1080
470 370 310 470 380 320 1
2230 1950 1770 2060 1850 1700
(B) 2 liP with 40 ft 3d Thai bioqas plant (59 utilization for irrigation during pumping season)
biogas plant amp maintenance 210 200 200 200 200 190 diesel fuel (54 litrsyr) 170 130 110 170 140 110
TOTAL COST steel tubewell 2140 1910 1770 1960 1810 1680
(C) 2 liP with 40 ft3d Janata Chinesetype) biogas plant (59 utilization for irrigation during pumping season) biogas plant amp maintenance 140 130 120 130 120 110
TOTAL COST steel 2070 1840 1690 1890 1720 1600
TABLE IV-10 (CONTINUJED
Market Prices Social Costs
Foreign Exchange Premium of 25
5 10 15 10 15 20
(D) 2 lIP with hypothetical gasifiershy
gasifier amp maintenance 220 200 190-11 230 220 210 TOTAL COST steel 1980 1780 1650 1620 1690 1590
(E) 2 HiP diesel oniy with selliag water to_ another small farm TOTAL COST steel 2700 2320 2080 2530 2230 2020
(F) 2 liP with 40 ft 3d Thai bioqas plant -- selling water to another small farm (100 utilization for irrigation durii pumingseason)
additioijal diesel fuel (85 yr) 260 210 170 250 210 180 TOTAL COST steelbamboo 24002180 21201870 194016110 222i1940 20201730 18601560
TABLE IV-1l PRESENT VALUE COST OF IRRIGATION SCHEMES ON MEDIUM-SIZED FARMS
Market Prices Foteign Social CostF
Exchange Premium of 25
5 10 15 10 15 20
Basic Costs
2 HP engne pump maintenanze stael tabewell 1760 1590 ]3460 1590 1470 1380
2 IWengine pump maintenance bairboo tubowel 1540 1330 1200 1310 1180 1080
(A) 2 HIF pump vith diesel only diesel fuel (383 litersyr) 1180 940 770 1170 960 800
TOTAL COSTS Steel tubewell 2940 2520 2230 2760 2430 2180
3 (3) 2 HP with 40 ft d Thai biogas plant (100 utilization for irrigation during pumping sea son)
biogas plant and maintenance diesel fuel (216 litersyr)
210 660
200 530
200 430
200 660
200 540
190 450
TOTAL COSTS Steel tubewell 2630 2310 2090 2450 2210 2010
(C) 2 lip with 6 ft3d Thai biogas plant (89 utilization for irrigation during pumping season)
biogas plant and maintenance diesel fuel (159 litersyr)
250
490 240
390 240
320 240
490 240
400 230
330
TOTAL COSTS 3teel tubewell 2500 2210 2020 2320 2110 1940
10-year period US dollars
TABLE IV-li (CONTINUED)
Social Costs Market Prices Foreign Exchange Premium of 25
5 10 15 10 15 20
(D) 2 11P with 120 ft3d Thai biogas plant (51 utilization for irrigation during p-amping s-ason)
biogas plait and maintenance diesel fuel (128 litersyr)
450 390
440 310
430 260
440 390
430 320
420 270
TOTAL COSTS Steel tubewell 2600 2330 2150 2420 2220 2070
(E) 2 liP with hypothetical gasifier
gasifier and maintenance 220 200 190 230 220 210
TOTAL COSTS Steel tubewell 1980 1780 1650 1820 1690 1590 O
Social CostsMarket Prices Foreign Exchance Premium of 25
5 10 15 i0 15 20
Basic Costs
3 HP engine pump (8 yr life) replacement PV cost (yr 9 amp 10) maintenance ($110yr) tubewell steel
510 80
850
510
510 60
670
510
510 40
550
510
610 70
670
440
610 50
550
440
610 40
460
440
SUBTOTAL with steel tubewell 1950 1750 1610 1790 1650 1550
(A) 3 lIP with diesel only
diesel fuel (869 litersyr)
TPTAL COSTS Steel tubewell
2670
4620
2130
3880
1750
3360
2670
4460
2180
3810
1820
3370
(B) 3 HP with 60 ft3d Thai biogas plant (100 utilization for irrigation during pumping season)
biogas plant and maintenance
diesel fuel (619 litersyr)
TOTAL COSTS Steel tt)ewell
250
1900
4100
240
1520
3510
240
1240
3090
240
1900
3930
240
1560
3450
230
1290
3070
(C) 3 lIP with 120 ft 3d Thai biogas plant (99 utilization for irrigation during pumping season)
biogas plant and maintenance disel fuel (372 litersyr)
TOTAL COSTS Steel tubewell 2
450
1140
3540
440
930
3100
430
750
2790
440
1140
3370
430
930
3010
420
780
2750
(D) 3 IIP with 150 ftd Thai biogas plant (83 utilization for irrigation during pumping seison)
bioqas plant arid inaintenance diesel fuel (352 litersyr)
TOTAL COSTS Steel tubev1l
500
]C80
3530
480
860
3090
470
710
2790
480
1080
3350
470
880
3000
460
740
2750
TABLE IV-13 PRESENT VALUE OF IR-RIGATION BENEFITS (10-YEAR PERIOD US DOLLARS)
Market Prices Social Costsk
Foreign Exchange Premium Foreign Exchange Premium
Farm Cultivated of 25 of 50 Class Land 5 10 15 10 12 15 20 10 12 15 20
small 105 ha 1620 1290 1060 1610 1480 1320 1100 1930 1780 1590 1320
medium 264 ha 4080 3250 2660 4060 3740 3330 2770 -4850 4490 3790 3330
large 600 ha 9230 7360 6030 9200 8470 7540 6280 11000 0170 9050 7530
Annual benefits are $200 per hectare
Assuming the foreign exchange component of 100
-119-
Using the in6ormation on Tables IV-10-13 the cost-benefit ratios
presented in Table IV-14 were calculated The ratios assumed 100 percent
availability or reliability of thc techxical options and include only
the banefits from irrigation As can be seen all irrigation opshy
tions are attractilre for the medium and large farms with the gassishy
fier being more attractive than bioga which in turn is more attracshy
tive than diese-l unly The small farm results show a much different
picture in that none of the first four options appears attractive
These results reflect the high cost of a 2 hp pump which is sigshy
nificantly oversized for the small jazms needs of only a minimutm of
05 hp The significantly higher ratios for large farms over medium
farms reflect the higher pump utilization on the large farm since
the meditn farm was also forced to use and oversized pump (2 hp vershy
sus a need of 12 hp) The capital costs faced by the large farm
also benefit from some economies of scale
The results show decreasing ratio as the discount rate inshy
creases reflecting the increasing cost of capital required for all
of these options The ratios for the economic analysis (social
costs) are higher than those for the financial analysis (market prices)
due to the higher foreign exchange component of the benefits side (100
percent) as compared to the items on the cost side (ranging from 0 to
100 percent)
The gassifier is understandably the most attractive since its costs
are relatively low and no cost for its fuel was used It~eliminates
the need for any diesel use if it is suIficienbly reliable a point
-120-
TABIE iV-14 BENMEFIT-COST RATIOS FOR IRPIGATION SCIEES
Utilization Market Prices Social Costs Rate
Pumping Foreign ExchangeIuring Premium of 25s
Season 5 10 15 10 15 20
I Small Farn
A 2 HP diesel only 073 066 060 078 071 065
B 2 HP + 40 ft3d Thai biogas 59 075 068 060 082 073 065
C 2 I-r4 + 40 Chinese biogas 59 078 070 063 085 077 069
D 2 HIP + hypothe- tical gasifier 081 072 064 088 078 069
E 2 HP + sellinP water (13160 ilyr) 100 090 083 076 095 089 082
F 2 HP + 40 ft 3d Thai biogas + A
selling water 100 101 -091 082 109 098 089
G 2 HP + 40 ft3d Thai biogas + selling water + 1- 24 1 i4 0 bamboo tUbewell 00 1 1 103 095 124 414 106
I Medium Farm -
A 2 HP diesel only 1 39 29 119 147 137 127
B 2 HP + 40 ftd -gt w0
Thai biogas I00 1 5 1 41 12 7 166 8
C 2HP + 60 ft 3d Thai biogas 89 163 147 3 32 175 4E1 J 43
D 2 HP + 120 ft3d 39 1 24 gt Thai biogas 51 157 3 24 168 50 134
E 2 HP + hypothe-shy
tical gasifier 206 1 83 1 61 - 223 197 1174
Ill Large Farm A 3 HP diesel only 200 0 179 206 197 186
B 3 HP 4 60 ft3d Thai biogas 100 - 5Tha b s2 2 2q101 A5 234 419 205
C 3 HP + 120 ft 3d 4 U - A
Thai biogas 26l 21699 n 38 273 250 228
D 3 HP + 150 ft 3d Thai biogas 83 261 233 216 275 23i 228
to h dscuzszid detal1below
The biogas plants all appear to be attractive Table IV-15 shws the
benefit-cost ratio for biogas plant investment once the engine pump
and tubewell are already purchased These investments are even attracshy
tive for the small farms that already have the other equipment needed
for irrigation The ratios are higher for the economic analyses beshy
cause the foreign exchange component of the fuel costs is 100 percent
whereas for t1e biogas plants it is only 75 percent Furthermore in
the economic analysis the unskilled rural Labor is shadow priced at
one-fourth its market cost The analyses for medium and large farms
show the diminishing returns to biogas after a point The pumping deshy
mand utilizes most or all of the gas produced by the 40 and 60 ft 3d
plants on a mediumn farm and by the 60 and 120 ft3d plants on a large
farm The next larger plants fur each farm size only result in small
decreases in diesel fuel use all of which occur during the relatively
brief peak periods In fact the increased cost of a 120 ft3d plant
on a medium farm is not recouped by the fuel saving It should be
recognized that if te excess gas can be economically utilized then the
largest plants could be justified
The unattractiveness of irrigation on the small farm is due to
the large cost of the oversized 2 hp pump Even signficantly reducing
the cost of the biogas plant (the Chinese Janata design) and of the
tubewell (bamboo) is not sufficient to make irrigation attractive under
any case in the financial analysis Only at lower costs of capital and
premiums on foreign exchange does irrigation become attractive The
TABLE IV--15 COMPARISON OF CAPITAL COSTS AND PV DIESEL FUEL SAVINGS RESULTING FROM PIOGAS INVESTMENTS OR IRRIGATION ONLY
Utiliza tion Rate
During Dumpi ng Season
I SMALL FARM
40 ft 3 d Thai biogas plant 59
40 ft 3 dhiinese- bio-shy
qas [lant 59
11 I1hDIIJM FARM 40 ft3dj
Thai biogas 100
60 ft 3 d Thai biogas 89
120 ft3d Thiai biogas 51
I[T LARIGE FARM
60 f0td Thai biogas 1_00
120 fL 3dli hiogas 99
150 ft 3 dThai bio(jas 83
5 Diesel Fuel
Savings Biogas Cost
300210
300140
520210
690250
790450
770250
1530450
1590500
Market Prices
10 15 Diesel Diesel Fuel Fuel
Savings Savings B-C Biogas B-C Biogas B-C
Ratiol Cost Ratio Cc-- Ratio
14 240200 12 200200 10
21 240130 18 200120 17
25 410200 20 340200 17
28 550240 23 450240 19
18 1630440 14 510430 12
31 610250 24 510240 21
34 1220440 28 1000430 23
32 1270430 26 1040470 22
Social CoIts
Foreign Exchange Premium of 25
10 15 20 Diesel Diesel Diesel Fuel Fuel Fuel
Savings Savings Savings Siogas B-C IBiogas B-C Bioga3 B-C Cost Ratio Cost Ratio Cost Ratio
300200 15 240200 12 210190 11
300130 23 240120 20 (210110 19
510200 26 420200 21 350190 18
680240 28 560240 23 470230 20
780440 18 640430 15 530420 13
770240 32 620240 26 530230 23
1530440 35 11250430 29 1040420 25
1590480 33 1300470 28 1080460 23
i
-123shyunderutilization of the small farras pump leads to consideration forashy
water market in which irrigation (an be supplied for a fee for another
farm The 2 hp pump is actually capable of supplying nearly 4 small
farms if always operational The last two options on Tables IV-10 and IV-13
for a small farm are based on supply of irrigation water for an additional
small farm The fee for such a service could be anywhere between the
additional operating cost for the pump owner and the total irrigation
benefits for the purchasing small farm as in Table IV-12 For this example
it was assumed that the pump owner charged one-half the total irrigation
benefits therefore the benefits for the pump omer for the benefit-cost
ratios are 50 percent higher Under these conditions irrigation becomes
marginally attractive at lower costs of capital These results still
reflect the burden of underutilization of the pump and they indicate
the need for research into the cost of smaller engines (12 to 2 HP) as
to whether they could be produced and marketed at a significantly lower
cost than those presently available These possible diseconplusmnomies of
scale underline the need for accelerated work in other technologies such
as solar and wind in order to alleviate the plight of the small farmer
These technologies appear to be more adaptable without these economies
for the small farmer
Tables IV-16 and IV-17 present the results of cost benefit analysis of
irrigation systems which include Stirling engine It is assumed as
before that agricultural residues have a zero cost to the society
Since all the energy inputs for the Stirling engine can come from
biumass (residues) the fuel costs for the Stirling engine case are
zero However to provide a better understanding of the system a
(maximum) fuel cost as represented by the cost of diesel oil is also
used in alternative calculations The results bring out the following
-124shy
(i) Benefit cost ratios are greatez than one (unity) in all cases except when fuel costs equivalent to diesel oil costs are -used for small farms
(ii) Benefit cost ratios are higher as the farm size increases for example the BC ratios range between 254 and 473 in the case of social costs using a 10 percent social rate of discount
(iii) A comparison of different systems shows that Stirling engine system consistently dominates both at market prices and at sociil costs (Table IV-16)
(iv) Even in the uase of small farms the irrigation is profitshyable only in the case of Stirling engine system This happens if a small scale Stirling engine can be made avail-shyable at the estimated cost (Table IV-17)
It should be mentioned that both with Stirling engines and
gasifiers the strong attractiveness is overshadowed by two considershy
ations (1) the lack of technical certainty and (2) the availability
and value of residues The implications of both these issues will be
discussed in further detail in connection with gasifiers If adequate
quantities of fuelwood are available at the same cost as crop
residue the economics of Stirling engines would remain the same
However in the case of fuelwood it may be easier to produce charcoal
n a central facility and then use the costlier charcoal as input for
a gasification unit or furnace The economics of these alternatives
would be site-specific and hence have not been considered here
TABLE IV-16 BEiEFIT-COST RATIOS FOR IRRIGATION SCHEMES
IN STIRLING ENGINE CASE
Market Prices Social Costs
Foreign Exchange 25 STIRLING ENGINE 5 10 15 10 15 20
I Small Farm
zero fuel cost 140 121 110 154 134 117
diesel fuel cost 099 090 083 106 097 087
(05 KW engine)
II Medium Farm
zero fuel cost 295 251 224 320 275 238
diesel fuel cost 159 145 136 166 153 141
(1 KW engine)
III Large Farm
zero fuel cost 448 374 324 473 400 341
diesel fuel cost 195 180 167 254 186 171
(225 KW engine)
-126-
TABLE IV-17 A COMPARISON OF BENEFIT COST RATIOS UNDER FOUR DIFFERENT SYSTEMS
Market Price
10
Social Costs
10
I Small Farms
(a) 2 hp diesel only 066 078
(b) 2 hp amp 40 ft 3d Thai biogas
068 -082
(c) 2 hp amp hypothetical gasifier
072 088
(d) 067 hp hypothetical Stirling engine amp furnace
121 154
II Medium Farms
(a) 2 hp diesel only 129 147
(b) 2 hp diesel amp 40 ft 3d Thai biogas
141 166
(c) 2 hp amp hypothetical igasifier
183 223
(d) 133 hp hypothetical
Stirling engine
251 320
III Large Farms
(a) 3 hp diesel only 200 206
(b) 3 hp amp 60 ft 3d 225 234
(c)
(d) 3 hp Stirling engine 473
-127-
Sensitivity Analysis
In this section the irrigation options will bc examined under altershy
native assumptions concerning the t-eliab1lity of their operation or of
their operating and capit-l costs The approach taken is to calculate
the extent to which the reliability or cost can or must be changed in
order to remnain or becnme attractive investments in other words to
determine the break-even points
Option 1 Diesel Only
For the diesel only option severalpoints can be examined For
the medium and large farms where this option is attractive the maximum
average fuel costs and the maximum capital costs tander which diesel only
wcuId break even were calculated The maximum market fuel costs per liter
(as an average price over a 10-year period in present dollars) in US
dollars are
Market Prices Social Costs (foreign exchange premium of 25)
5 10 15 10 15 20
Medium 079 071 062 084 078 070
Large 109 105 101 111 108 104
Considering that the average market fuel price projected for this analysis
was $04 per liter this option would remain attractive with significantly
higher fuel prices As to higher capital and maintenance costs the
following table presents the estimated cost of the engine pump and steel
tubewell as well as the additional cost (cost overrun) which would reduce
the attractiveness of this option to the break-even point
-128shy
Market (US dollars)
Pri-es Social Costs
5 Medium Farm
10 15 10 15i 20
est costs 1760 1580 1460 1590 1470 1380
cost overrun 1140 730 1300 590430 870
increase 65 46 29 82 59 43
Large Farm
est costs 1950 1750 1610
cost overru 461 3480 2670
increase 236 199 166
Again the attractiveness of this option for the two larger farm classes
is deiionstrated by the significant leeway possible in the basic costs
At higher costs of capital onthe medium farm this cushion is not very
large
With regard to the actual operational reliability of the diesel
pumtp whether it be limiLed by fuel or engine availability there are
several points First of all the number of hours of required operation
is relatively small compared to the hours available for pumping 770 and
1160 hours for medium and large farnis respectively out of a pumping
season of 250 10-hour days or 2500 hours However the actual flexishy
bility as to when the pumping is required is somewhat less than indicated
by these figires because there are periods where the water is needed
over a short period of time A problem with estimating the effects
of unavailability is how to assume the benefits of irrigation are dimin-ished
Loss of water during peak periods could nearly wipe out the crop altogether
More information is needed to do an accurate analysis especially on the
reliability of diesel pumps
-129-
The issue ror the small farm situation is the reverse how much lower
must capital or operatig costs fall to the dlesel onIly option to become
attractive The results for the small fa-m may be overly conservative
because of the significant maintenance cost imposed despite the low level
of annual us (305 hours) This cost was assumed constant for all farm
sizes independent of pump use The following table shows the reduction
in this cost that would make diesel only irrigation attractive
PV in US $ Market Price Social Costs
5 10 15 10 15 20 Small farm est diesel pump
cost 400 400 400 480 480 480 est maintenance 850 670 550 670 550 460
break-even maint cost 240 10 -160 220 20 -140 (steel Lubewell)
(bamboo tubewell) 460 260 00100 310 160
Only at low costs of capital and assuming a bamboo tubewell would a less
costly but still feaf3ible maintenance cost estimate make a significant
difference in the attractiveiie of this option However this cost
reduction in conjunction with the possible availability of smaller
and proportionally less costly engines could make diesel attractive
With regard to lower fuel prices or engine costs the two costs woud
have to approach zero before diesel only becomes attractive on small
farms
Option 2 Biogas and Diesel
or the option of biocas and diesel reliability issues take on a
different light because the uncertainty as to the actual availability
-130shy
invastnents can be attractive even if the plants reliability is relatively
low
All of the above analyses only attribute benefits to bioga3 used
for irrigation and in all cases there is extra gas available for other
uses If 4t is the minimum thds gas is only available during the nonshy
pumping part of the year Therefore the attractiveness of biogas is
underestimated significantly in soma cases
Option 3 Gassifer and Diesel
The above analysis of gassification assumed 100 percent reliability
of the gassiffr when needed The practicability of this assumption is
different for the three farm classes It can be realisLic for the small
farm because the gassifer is only needed for 305 hours over a 230-day
pumping period The need is more intensive during the peak period but
there is still room for flexibility since the pump only requires 25 pershy
cent of the maximum pumping time available during this period On the
other hand on a large farm the annual operating hours are 1160 over
the 250-day period and therefore the assumption of 100 percent availshy
ability may be unrealistic Yet even in this case the flexibility in
puping times mitigates this problem In order to determine the minimum
reliability levels required for gassification to be attractive the minishy
mum number of hour-s of operation which results in a fuel savings equal
to the gassifier cost were calculated For small and medium farms that
number is
Market Prices Social Costs
5 10 156 10 15 20
140 160 190 150 180 200
over the 250-day pumpizg season On the large farms the number of hours
would be less since a larger engine is used and cherefore the fuel savshy
ings per hcur are greater
Another uncertainty concerning gassification is the capital and
maintenance cost Due to lack of worldwide experience with gassifiers
of this size and for this puxpcse there is a great deal of uncershy
tainty about these costs The costs used in present value terms
were
i for capital costs market price of $140 social costs at 25 percent foreign exchange premium of $165
2 for maintenance cost ($10 annually) ranges from $75 at 5 percent discount rate dcwn to $40 at 20 percent
In order to determine the sensitivity of the analysis results to
these costs the additional present value cost of gassification which
would make it only break-even with the diesel only option was calculated
Assuming 100 percent availability this additional cost is
Market Price Social Costs 5 10 15 10 15 20
small farm 250 170 120 240 360 110 medium farm 960 740 580 940 740 590
These figures show that even with significantly higher costs or
lower availabilities gassification would be attractive However one
problem with gassification in addition to the availability and cost
would be the storage of the residues The extent of this problem is
-132shy
based on the time between pumping and harvest the suitability of
the residues to storage and the local experience or adaptability to
storing crop residues
The strong attractiveness of gassifiers on medium and large farms
is overshadowed by two considerations 1) the lack of technical cershy
tainty and to a lesser extent 2) the availability and value of residues
The first issue can only be resolved through a program of experimentation
and demonstration The second issue has several aspects One is that
gassifiers are clearly attractive when feed use of agricultural residues
is inot large such as where livestock are small where extensive pastureshy
land is availablej or where intensive agriculture yields large amounts
ot residue Central Thailand appears to be a likely candidate possibly
fitting into the first and third of these conditions On the other hand
it is important to examine the feed value of different residues and other
materials versus their energy value to determine optimal uses for these
resources Furthermore the availability of feed substitutes must be
considered so that the use of residues for fuel does not cause further
deforestation through overgrazing An additional point for further reshy
search is the residue production factors eg the amount of straw to
product for different crops and harvesting methods
For irrigation in the representative village the residues
needed to fuel the gassifiers annually are about
small farm 12 metric tons medium farms 31 metric tons large farms 70 metric tons
These requirements reduce to that of almost 12 metric tons of residue
for every hectare irrigated Supplying this residue need as well as
fuel requirements is dependent on the cropping pattern and livestock
-133shy
holdings Production of the 12 tons of residue per hectare is quite
feasible for many crops Paddy residue equivalent to the production
levels in Table i1-7 would be 26 MTha Other grains (eg wheat
maize orchum and harley) are generally in this range (Arora 1977)
Analysis would on the other hand be necessary to consider the
tradeoffs between the cash value and energy value of different
crops The small farmer has a residue surplus of 04 tons annually
(Table IV-7) and therefore needs to generate an additional 08 tons from
the additional production from irrigation This additional residue
could quite easily be produced from the small farms 105 hectares The
medium and large farms in some cases such as where maize is grown alshy
ready generate additional residues however only on thie large farm are
these residues sufficient to meet both feed and gassifier requirements
on the medium farm growing maize the additional annual residues needed
are 14 tons or about 05 tons per hectare Aln important variable in
determining the availability of residues is the availability and producshy
tivity of pastureland To accurately assess the attractiveness of gassishy
fiers in comparison to ocher technologies would require further analysis
into these issues
-134shy
Distribttional issues
The results indicate clearly significant economies of scale and
therefore some distributional prohlems since the wefarg forus of these
interventions should be on the rural poor or small farm class In fact
due to the limited availability of small engines the small farmer canshy
not reap the benefits of irrigatin 2 A crucial issue is whether very
small engines will cost significantly less and then whether this possible
lower cost becomes available to the consumers The small farmer also
faces this problem with regard to the tubewell cost The poor or small
farmer can only reap the benefits of irrigation by the developments of
significantly lower cost equipment or by cooperative behavior among
several small farms
With regard to the biogas plants whereas the small farm may be
able to find this investment attractive this class may be constrained
by its limited animal holdings Nevertheless it appears that this
limitation is less severe since the plants can be easily scaled to
size
Gassification might be more attractive for small farmers given
straw potential from increased agricultural production but still the
costs of the engine and tubewel are major constraints for the single
farm
1 Ignoring in this analysis the landless and issues of job creationwithirrigation
2 Except under the use of water markets thereby reducing the disshyeconomies of scale
SECTION V
Annotated Bibliography on Social Benefit
Cost Analysis and Energy Planning
A ApproacThes and Methodologies
B Estimation of Shadow Prices
C Case Studies on Renewable Energy Projects
-136-
A Approaches and Methodologies
OECD Manual of Industrial Project Analysis Volume II by IMD Little and JA Mirrlees OECD Development Center Paris 1963
IMD Little and JA Mirrlees Project Appraisal and Planning for Developing Countries Basic Books inc New York 1974
The details of the OECD or LitLle--Mirrlees approach along with its comparison wich UNIDA Guidelinec have been provided in the text As noted in the second 7olume (1974) the basic foncepts and principlesused in the two volumes are basically similar The additions of material in the second volume include a discussion of relationship among projectsectoral and macro levels the measurement of benefits of the productionof non-traded goods and services and the treatment of shadow wagerate Income distributionalconsiderations in project analysis are dealt with more explicitly and at much greater length iii the second volume
The Little-Mirrlees (L-14) approach begins with the premise that prices are seriously distorted in many developing countries and some of the worst distortions have arisen as a result of government policies and bad investment planning The policies may relate to trade policies(tariffs quotas subsidies) or commodity and resource prices (laborcapital and foreign exchange) The L-M approach cousists of guidelinesfor the construction of a whole set of self-consistent accountingprices to be used as better guides to project selection than actual market prices Oneof theimportant suggestions made is to use border prices (inport ox export prices) as accounting prices
The main limitations of the approach are
(i) The crucial assumption in the L-H approach is that there are no important political constraints preventing reform of the price system - and that the governments are willing and able to manage trad~e predominantly though not necessarily entirely by prices rather than quantity controls In manydeveloping countries for various reasons this assumption may not be valid If the project evaluator is not powerfulenough to ensure that the desired changes in trade and taxsubsidypricing policies are in fact made it would b2 inshyappropriate to use border prices for project evaluation
(ii) Although concepts of value of public income and numerical weights for personal income distribution have been presented the discussion is fpr from complete
-137-
United Nations Industrial Development Organization (UNIDO) Guidelines for Project Evaluation New York 1972
UNIDO Guide to Practical Project Appraisal Social Benefit-Cost Analysis in Developing Countries New York 1978
The dctails of the UiNIDO approach and its compazison with the OECDManual have been presented in the text The above two volumes present a complete system of project evaluation in developing countries includingtie required theoretical background practical aspects and case studies
The major thrust of -he argument is that valuation of goods andservices in terms of market prices is inadequate in reflecting national benefits and costs and hence project inputs and outputs should be valued at shadow prices Procedures and principles for quantification and valuation of outputs are discussed at length along with the methods ofestimating social rate of discount and shadow prices for investmentforeign exchange and unskilled labor One of the important aspect ofshadow pricing which receives considerable emphasis in the UNIDO approachis the distinction between social rate of discount and opportunity cost of capital In fact it is the divergence between the values of these two parameters that determines the value of shadow price of investment Although other approaches have also taken this into account the UNIDO approach is consistent with the rest of their methodology
Another important advantage of the UNIDO approach is that it explicitlyrecognizes the limitations of the role the planning organizations can playin influencing trade price and tax policies in developing countries The UNIDO method recognizes the presence of political and administrative constraints in adjusting tariffs and taxsubsidiaries and suggests use ofshadow prices in that context There is also a greater importance givento the issues of income distribution among groups and regions than in OECD Manual
The UNIDO approach has been used in many studies and incase estimation of nationalregional parameters There have been difficulties in the useof parameters such as shadow price of investment The methodology may be found too academic or too difficult by some people who dc not have the necessary background
One of the authors of the UNIDO Manual has presented a complete theoretical analysis of a labor surplus economy see Marglin (1976)and Sen (1975)
-138-
Michael Roemer and Joseph J Stern The Appraisal of Development ProjectsA Practical Guide to Project Analysis with Case Studies and Solutions Praeger 1975 New York
This manual is oriented to three types of users economics studentswho can use the manual for supplementary reading and case work for courses in development economics government technicians responsible for analyzingprojects and government officials who make investment decisions and need to become familiar with this decision-making tool The theoretical discussions are kept relatively brief and major emphasis has been placed on developing a realistic fram work for prject analysis setting forth practical rules for evaluating project costs and benefits Apart from the theoretical discussions on shadow prices details of estimation of valuesfor these parameters for Ghana have also been given The book also presents case studies on a bauxite ines expansion a cooperative rice project a manufacturing and spinning mill and a feeder road (transportation) project
The book discusses the need for project analysis divergence betweensocial and market prices and presents problems of measurement aid valuation of benefits and costs It presents a useful discussion of the role of disshycounting in comparing costs and benefits but uses the opportunity cost of capital(or shadow interest rate) as the appropriate discount rate Unlike U14IDOGuidelines (1972) and other theoretical literature the opportunity cost of capital is not considered different from the discount rate The estimatedvalue for opportunity cost of capital in Ghana (1972) is taken as 12 percent based on available rates for investment demand and supply of savingsThe shadow wage rate for unskilled labor is estimated as 50 percent of average urban wage rate based on estimates of agricultural wages for casual workers and adjustments for subsistance production The shadow rate for foreign exchange is taken as cedis 175 per dollar (against the official exchange rate of cedis 128)
The main limitations of the book are
(i) One of the major advantages as well as the drawbacks is itssimplicity For the economist who is to estimate the values of national or regional parameters for a given country the book is too simplistic For the economist who is appraising a project and has to use the available values for various parameters the book is Lather superfluous It is a useful initial orientation to the nonshyeconomist Planner who is told convincingly about the need for usingshadow prices instead of market prices However even for him the book seems to indicate that the adjustments made are very simple and gives a too simplified perspective of the complex problem of shadow pricing The reader should be cautioned against thinking that the concept and methodology of estimation of shadow prices is just a simple matter of increasing or zeducing some values
-139shy
(ii) Although reference to the important question of distribution has been made the authors have succumbed to the traditional and most widely accepted practice of excluding equity considerations from cost-benefit calculations
-140-
Russell J deLucia Henry D Jadoby et al LDC Energy Planning A Study of Bangladesh Cambridge MA June1980 Draft for Review and Comment
This book covers a broad range of issues associated with energyplanning in developing ceuntrie6 Although drawn primarily from the Bangladesh EnerayStud it presents mitch methodology that has broad conceptual applications While the book does not focus purely on renewshyable energy issues there are a number of sections in the individuallyauthored chapters that are particularly relevant Chapter 1 EnergyPlanning in Bangladesh by deLucia and Jacoby presents a useful disshycussion of the characteristics of aa Energy Sector study Chapter 3Agricultural Analysis for Energy Planning by James Gavan and Rodney Tyers and Chapter 4 Traditional and Renewable Encrgy Sources by Russell deLucia and Richard Tabors present ideas relevant to the consideration of bioniass based energy alternatives including approachesto estimating agrieultural residue availability through agricultural sector analysis difficulties in firewood and other survey techniquesand approaches to examining technical economic and social factors _n analysis of rural ene -qy options The chapter by henry Jacoby and Joseph Stern Economic Objectives Parameters and Assumptions givesexamples of the estimations of economic parameters including shadow prices necessary for investment analysis of either renewable or conshyventional technology alternatives
The book has been submitted for publication review it is available from the authors co R deLucia Meta Systems Inc 10 Holworthy St Cambridge MA 02138
Bangladesh Energy Study for the Government of the Peoples Republic of Bangladesh administered by the Asian Development Bank under United Nations Development Program Project BGD73038B0l45 prepared bythe Montreal Engineering Co Ltd Snanprogetti SpA Meta SystemsInc and C Lotti amp Associates SpA November 1976
-141-
Efficiert Use of Energy (The APS Studies on the Technical Aspects of theMore Ef4icient Use of Enerqy) AIP Conference Proceedings No 25American Institute of PhysicsAmerican Physical Society Wasnington DC 1975
This 1onograph focuses on technical issues of efficient energy useIt is an important coprehensive effort by a group of physicirts Themonograph takes a physics perpective establishing norms or -tandaidsof performance against which uses of energy can be evaluated Thediscussion is heavily theoretical but also practical in t~rm of basingefficiency measures in the laws of thermodynamii and presenting disshycussicis of energy usE examples in a fashion that encourages practicalanalysis Tae approach fccuses on the use to which the energy isapplied rather than the energy-using device This focus on task or energy end-use pervades the monograph First and second law (ofthermodynamics) efficiency definitions are ptesented including theconcept of available work which makes possible the measuzement of the APS second law efficiency
Discussion and examples including coverage of such issues as houseshyhold energy using tasks (heating lighting etc) transportation and the automotive and industrial processes
-142-
B Estimation of Phadow Prices
SN Mishra and John Beyer Cost Benefit Axalysis A Casj-Study of the Ratnagiri Fisheries Project (India [Appendix III on Methodology and Estimates for Social Rate of Discount Accounting Price of In-vestment (Savings) Accounting Price of Foreign Exchange and Accounting Price of Unskilled Labor] Hindistan Publishing Co Delhi 1976
John Beyer Estimating Lhe Shadow Price of Foreign Exchmge An Illusshytration in India Journal oi Development Stuidies July 1975
This a1pendi has been provided to describe the basis on which the particular values used in the case study in India have been selected The results reported here are based on one of the most detailed exercises done by professional economists for an individual country The methodologyused broadly follows the UNIDO Guidelines (1972) and the effort is towards a review and adoption of aiternative methods of estinmation of shadow pricesDetails of alternative estimates for India have been given in the two studies The most important contribution of the studies is to show that suggested methodologies fo estimating social rate of discount and shadow prices can in fact be used to calculate these parameter values for a given country
The major limitations of the study are
(i) in estimating the social rate of discount they have used estimates for 5 (the elasticity of marginal utility of consumption) ranging between -15 and -30 They have not given much thought to the fact that in a poor country where even the necessities for the entire population may not be available in the next one or two decades the marginal social significance of additional constumption may not decline over time Besides they have ignored the role of PTP ie pure time preference in estimating the social rate of discount
(ii) The range of estimates for all the parameters is too wide to bea used for actual projectselection and ranlking A lot of subjective judgjments are involved in picking up values for variables (growth of consumption opportunity uosL of capital rate of reinvestment etc)which have -compounding effect on the estimates of nationalregional parameters Thus the planner is left with the use of intuitive reasoning and value judgments in selecting values for these parameters In this context -1t becomes eebatable if it is worthwhile to soend the effort on using eIaborate methods to calculate range of values for these parameters if they are uniusable for project analysis
(iii) Their estimates for shadow wage rate are rather unsatisfactory They have used the Little-Mirrlees approach of calculating marginalproduct of labor from market wage rates and average product This is rather unsatisfactory as the literature on difficulties of estimation of marginal product would suggest They have also not calculated the seasonal variations in shadow wage rates which is rather crucial in the context of rural-oriented projects
(iv) These studies have compietely ignored the problem of giving explicit weights for income distribution and regicnal developmentIf project selection is to be used directly to correct the unequaldisLribution of inccme among groups and regions this becomes quite an important aspect of the economic framework fcr project analysis
-144-
World Bank Estimating Shadow Prices for Colombia in an Input-OutputTable Framework World Bank Staff Workfng Paper 357 Sept 1979 Washington DC
This paper explains the calculation of shadow prices at the national level using the Input-Output technique The methodology outlined herepezmits easy calculation of Border-Price-Ratios (accounting prices forcommodities) for a large number of traded commodities and non-traded commodity sectors The values for 22 tradedL sectors and 9 non-traded sectors for Colombia have been given in the report The advantages ofthe 1-0 approach are easy calculation of conversion factors and quicksensitivity analysis of results using computerized I-0 approach Thelimitations relate to non-availability of I-0 tables in some countriesthe problem of classification of sectors and updating of 1-0 tables Even in this approach the basic problems in estimation of opportunitycost of capital and other parameters in social pricing eg theelasticity of marginal utility of consumption and the rate of pure time preference reaain
Other limitations of this study are the same as discussed in the context of the paper on Ivory Coast Although multi-sector conversion coefficients can be mechanically calculated and applied the real issues relating to social pricing consumption distribution weights the valueof public income and derivations of marginal propensities to save are as difficult to handle under this approach as in any other
-145-
World Bank Economic and Social Analysis of Projects A Case Study of Ivory Coast World Bank Staff Paper No 253 May 1977 Washington D C
This paper is a good attempt to demonstrate in a specific countrycontext the application of the methodology for economic and social analysis of projects developed by Lyn -lire and Herm-n G van der TakTwo steps in project evaluation are recogized efficiency analysiswhich is designed to select projects compatil)e with an optimal allocashytion of resources and social analysis which explicitly allows for thedistributive and growth objectives by attaching appropriate weights to private costs and benefits The study presents estimates of the parashymeters required for efficiency and social analysis and applies the results to threj projects in Ivory Coast
The approach outlines the following steps adjustment for transfer payments such as all tariffs duties and taxes fiom the costs and benefits use of snadow exchange rate shadow wage rate and of conversion factors for converting each particular input from domestic prices to norder prices The social analysis uses mcrginal consumption distribution weights for various income groups and the value of public income which is estimated in terms of the consumption stream generated by a unit of public investment
The World Bank approach seems to use ideas from the Little-Mirrlees method as well as the UNIDO Guidelines The result is a combination of concepts which are difficult to evaluate on a priori basis Althoughthe efficiency pricing step borrows heavily from Little-Mirrlees theIsocial pricing aspects use discributional weights and shadow price ofinvestment from the other approaches The real merit of the World Bankapproach would depend on the results of its application for a varietyof projects As is evident from the three case studies presented in this report the use of this methodology would require a correct specification of the private sector savings propensities as well as identification of beneficiary families and subjective weights on disshytribution If this information is not available the use of suggestedmethodology would not give any different answers
-146-
Food and Agriculture Organization of the UN (FAO) Economic Analsisof Forestry Projects FAO Forestry Paper 17 Rome 1979
The purpose of this volume on Economic Analysis of Forestry Proshyjects (EAFP) is (as stated in the Preface) to provide P practicalworkable approach and hence [it] does not contain a rigorousmethodology which has to be followed step by step in order to come outwith a good economic analysis of a project It contains chapters onidentification and valuation of inputs and outputs It also presentssections on the role of discounting decision criteria treatment ofuncertainty and the use of economic analysis in project design
This document provides a good discussion of the problems of 1faluashytion of output when rroject output is substituting for existing domesticsupply Especially interesting is the discussion where a fuelwood proshyject output substitutes for animal dung and crop residues andor fuelshywood presently being collected by people from nearby forests Similarlya simplified presentation of valuation of import substitutes or exportcommodities is helpful for the non-economist In valuation of inputsespecially land and unskilled labor the document gives a lucid preshysentation of the several issues involved including the possibilitiesof over-valuation of land in estimating its opportunity cost
The major limitations of the document are
(i) It does not give details of the methodology of estimatingnationalregional parameters and assumes that these values are available from the planners
(ii) The approach Dutlined is not based on social benefit cost analysis in the sense of using social rate of discount or shadow price of investment and putting weights on disshytribution of income to groups or regions However it does use the concepts of opportunity costs and shadow prices andlooks at the benefits and costs from the viewpoint of thesociety Thus the approach can be described as economic analysis as distinguished from financial analysis butstill does not incorporate all the concerns of social benefit cost analysis
(iii) The discussion on rate of discount and decision criteria is rather elementary and does not go beyond what is usuallydone in financial analysis The document neglects the use ofbenefit cost ratios and suggest that consideration of cnoices among projects for a limited budget ie decision making isbeyond the subject of EAFP It is difficult to acceptthis view of the authors because ranking projects in the same sector as well as providing BC ratio for comparison with oroshyjects in other sectors should be an important aspect of the Economic Analysis of Forestry Projects
-147-
C Case Studies on Renewable Energy Projects
David French The Economics of Renewable Energy Systems for DevelopingCountries Draft Washington DC January 1979
This paper provides most detailed benefit-cost analyses for threerepresentative renewable energy systems (i) a 40-hp solar thermal irrigation pump neaz Bakel Senegal (ii) a family-szale Indian biogasplant and (iii) a 55 kw solar cell irrigation pump on the borders of Lake Chad
The study presents details of financial analysis and suggests themajor adjustments required for economic analysis eg shadow pricingthe calculation of social costs and benefits and consideration ofsecondary effects The results show that neither the solar thermal pump nor the family-scale biogas plant appears to be profitable ineither financial or economic terms under any plausible set of assumpshytions The solar cell pump has positive net benefit by economic Rieashysures but is unlikely to be competitive with diesel power for anotherdecade There is also a good discussion of the analytical issues whicharise in pursuing benefit-cost analyses of renewable-energy devices
The main limitations of the study are
(i) Theru is a misunderstanding in valuation of benefits in two studies In the case of the 40 hp solar thermal irrigation pump as well as the 55 kw solar cell irrigation pump economic benefits have been calculated in terms of the value of outputof rice maize sorghum wheat or cotton grown by using the irrigation water supplied by the pump The NPVs and IRRs have been calculated using these benefits adjusted for shadow prices This method iz termed as viewed strictly in its own terms without reference to ccmpeting systemsi Howeverthis method is nor appropriate if the choice for the societyis to use either a solar irrigacton pump or a diesel irrigation pump for providing irrigation water to the crops regardless of the additional benefits from irrigation (The valuation ofirrigation water is a separate and a more complex matter) The introduction of a solar system replaces an existing (or potential)diesel system and hence the true benefit of the solar systemis the savings in resources (capital foreign exchange and labor)which would otherwise have been devoted to the diesel systemThus the correct method of estimation of benefits from a solar system is in terms of the costs (saved) of the competing systemand not in its own terms The latter in fact would involve attributing the benefits from the use of irrigation water to solar system although the same quantity (and quality) of irrigation water could be provided by a competing diesel system
-148shy
(ii) The cost data used as well as the available technologies have undergone zigrificant changes in the last four years For example the economics of family biogas units in the report arg reversed if higher kerosene prices and lower capital costs of Chine3e-type biogas units are taken into account
(iii) There is no effort to include distributio i l -- personal or regional -- considerations into project analysis and ranking
-149-
Douglas V Smith Photovoltaics in less Developed Countries MIT EnergyLaboratory Vlarch 1977 (revised August 1979) Cambridge MA
Douglas V Smith and Steven Allison Micro-Irrigation with Photovoltaics MIT Energy Laboratory April 1978 Cambridge MA
The above two studies present two alternative methods of economicevalution of non-conventional ener7y altrcnatives such as photovoltaicpowered irrigation pumpsets In the first study the photovoltaic systemis compaxed with diesel system and i is concluded that at a diesel fuelprice of 35 cents per litre photovoltaic power is competitive at solar array costs of $13CO per peak w In the second study by Smith and Allisonthey have used an alternative method of evaluating the economic viabilityof solar pumping of irrigation water They estimate the potential incre-ment to income from irrigated rice as $250hayear (assuming 25 tonshaof additional output due to irrigation) ard from this they calculatethe affordable unit costz of a pumping energy package which lies between$76 and $86 per peak watt Taking $8 Der peak watt as the current(1978) price they find solar pumping of irrigation water as economic
It may be rioted that of the two methods presented above the firstmethod of comparing it with diesel alternative is the correct procedureThe second method of calculating economic viability or affordablecost is misleading becuase this method attributes the benefits from use of irrigation water to photovoltaic power Since photovoltaic arrays(and the system) provide an alternative energy source for pumping wz erit would b necessary to analyze the economic viability of photovoltiacsin terms of the costs to the society of the lowest-cost energy alternativeavailable for pumping the benefit of using photovoltaics is the savingin the resource costs of diesel (-r other) alternative for pumpingthe same quantity of water
-150shy
Annex 1 Lake Chad Project Pumping Matrix in Working Daft ReoortAnalysis of Revelle Polder Development Scheme and Design for a LongRange Lake Chad Basin Study Prepared for US Agency for InternationalDevelopment by Meta Systems Inc Cambridge Mass October 1974
This is an example of analysis in which a very wide range of techshynical alternatives was considered Alternative individual devices(engines pumps) and combinations to produce pumping systems were inshycluded The range of systems included human power based systemsShadoofl animal powered systems (eg camel-power Persian pushingwheel) and a number of gasoline diesel and electricity powered altershynatives Limits on residue and firewood prevented consideration ofother alternatives (Stirling engine etc) Subsequent work by indishyviduals engaged in the project examined photovoltaic alternatives Theanalysis included both economic and financial analysis with consideration of some shadow prices
A version of this work is available from Dr R Tabors MIT Energy Laboratory Cambridge Mass
See Tabors (1979) and Smith (1979)
-151-
John Briscoe The Political Economy of Energy Use in Rural BangladeshHarvard University Environmental Systems Program August 1979 (Also published in Population and Development Review December 1979)
This study was conducted using the method of participant observation for 48 families of Ulipur village in Bangladesh The study sheds light on the relationship between ownership of energy-producing assets and the processes of generation and use of energy by various households of different economic statusoccupation
One of the most important contributions of the study is to highlightthe complex system of alternative uses of crop and animal residues and the pattern of their present and future uses Each crop produces several products each of which can be used for several purposes Food grains can be used as human food or animal feed crop residues as fodder fuel fertilizer or construction material animal residues as fertilizer fuel or cleaning material
He has also pointed out that social organization of the villagedetermines the control and distribution of energy resources and shows that ownership of energy producing assets is highly concentrated Given this unequal distribution rich farmezs have no incentives to improvethe efficiency of utilization of fuels since these fuels are surplusfor them anyhow Another chief merit of the study is to show the dynashymics of energy availability and use over time and to speculate how poorer villages would be adversely affected by introduction of irrigashytion high yield variety seeds and other development projects
The main limitations of the study are that no effort was made to estimate the actual energy content of different type of fuels and adequate emphasis not put on estimating the efficiency of various end-use devices Nevertheless the study provides a rich backgroundof the type of information that has to be collected to evaluate socioshyeconomic impacts of non-conventional energy technologies
-152-
US Agency for International Development (AID) Philippines ReforestashytionRural Energy Project AID Project Paper July 1980 Washington DC
This project covers the techno-economic and financial anaylsis of reforestation in the Philippines both as an ecological necessity tc present erosion and as a source of energy The proposed power generashytion plant (3Mw) is by means of a steam turbine fueled by the direct combustion of harvested wood It is estimated that in a 3 Mw plant usingfuelwood the costs of electricity generation would be $008kwh as compared to the power cost of $0091kwh frcm a diesel plant
The economic analysis gives considerable details of the capital costs required for the forestry project and includes income estimates for a tree farmer as well as the profitability of the power plantThe national economic benefits have been calculated as a net savingsin foreign exchange of the order of $08 million per year for a 3 MW unit The social soundness analysis has also been included in the reshyport and project beneficiary families and groups have been identified There is an attempt to quantify details of income housing settlement environmental industrial and power benefits to various categories of beneficiaries
The major drawbacks of the analysis in the report are
(i) The entire issue of economic cost of producing fuelwood especially the opportunity cost of land labor and other inshyputs into fuelwood plantations has been bypassed It isshyassumed that the cost of fuel to the power plant (including tzansportation) will be $25green ton and the tree farmer will be paid at $17ton The basis for estimates of fuelwood yield per hectare and labor inputs have also not been proshyvided The results of economic analysis would be verydifferent if the cpporLunity cost of land is included in the costs of fuelwood
(ii) Capital costs of the power plant have been assumed at $1400kw although there are indications that similar plants(excluding installation) $800kw No attempt has been made to get more representative estimates of the capital costs Detailed breakdown of capital costs of the power plant have not been provided
(iii) A 60 percent load factor for the power plant has been assumed This seems to be much higher than the achieved load factors in various countries where electricity is prishymarily used for lighting irrigation and small industries owing to seasonality of demand If a lower load factor is considered and if the fuelwood cost includes the opportunity
-152shy
cost of land in terms of benefit foregone (value ofagricultural output or fodder) the generation cost ofelectricity would be much higher than the estimate of$008 per kwh In fact the corrected costs may showthat generation from a diesel plant is cheaper than abiomass-based thernal plant If this turns out to betrue the whole economic analysis of this project reportwould be misleading
(iv) There is no effort to use shadow pzices in economicanalysis or performing sensitivity analysis to importanttechno-economic parameters
-154-
Hodam Associates California Cogeneration of Process Heat and Electricityfrom Rice Hulls in the Philippines Report prepared fox the USAID January 1980 Washington D C
This report covers the techno-eonomic feasibility of conversion of rice hulls to energy in the Philippines Two technologies -- direct combustion follo 4ed by a steam cycle and gasification follcwed by a diesel cycle -- have been discussed Issues of equipment - availability ofappropriate scale at reasonable cost the availability of skilled labor and experience with rice hulls as fuel have been ccnsidered in definingfeasibility Economic analysis presents a comparison of costs15-yearof current system gasification system and steam cycle system The gasishyfication system with cogeneration is found more economic although its tecinical reliability is in doubt The nation--ide benefits in terms of savings of diesel fuel are mentioned but not quantified
The following limitations of the analysis must be noted
(i) Although technical details have been covered in detail the efficiency estimates especially those for gasifiers and turbines are open to debate
(ii) The entire economics of the project depend on the sale of excess power to the utility since this accounts for 60 percent of the total savings There is very little analysis of this aspect exshycept for emphasizing its importance If lower load factor or capacity factor reduces this savings thce economics would be seriously affped
(iii) Wen diesel engines are run on gaseous fuels diesel 6uel is (generally) still used for ignition This diesel oil conaumpshytion (ranying between 10 to 30 percent of that for diesel oil alone option) has not been included in the annual costs
(iv) Although rice hulls are the major input these have not been included on the cost side From the societys point of view rice hulls definitely have an opportunity cost which can be estimated in terms of the benefit in alternative uses This would considerably alter the economics of power generation
(v) No effort has been made to do social benefit cost analysis or perform sensitivity analysis to important techno-economic parameters
-155-
Ramesh Bhatia Economic Appraisal of Biogas Units in India Framework for Social Benefit Cost Analysis Economic and Political Weekly 1977
This paper is based on an extensiw review of the literature ontechno-econo-mc and social aspects of bioea technology in india The article discusses valuation of capital costs operating costs (dung andlabor) and major benefits (gas slurry) as well as secondary benefits and indirect costs Using shadow prices t results of NPV estimates of systems to produce two or three cubic meters of gas per day (familyunits) have been presented The study indicates that (i) the economics of biogas crucially depends on the patter-n of utilization of gas for cooking or lighting Since use of gas for lighting replaces importedkerosene it is more economic to use gas for lighting rather than forcooking (ii) the technolo-economic paramcters for biogas technology are not based on proper field testing and scientific monitoring of bioshygas plants There is need to do RampD work on firming up details of gasavailability gas consumption for various actwvities optimization of the design of the plant estimation of the quality of slurry etc
The main limitations of the study are
(i) The data used are for the years 1976 and 1977 Price increasesin kerosene and diesel have increased the profitability of biogasunits if gas is used for lighting and for pumping water for irrigashytiondrinking
(ii) Technological breakthroughs such as adoption of drumless Chinese-type biogas plants in India have reduced the capital costs by 40-50 percent This has resulted in a higher benefit-cost ratio for investment in biogas plants
--
-156-
Food and Aricultural Organization of the UN (FAO) Economic Analysisof Forestzy Projectj Case Study No 2 Village Fuelwo6dPlanjtationsin Korea FAO Rome 1979-_
This xeport is one of the case studies of forestry aid forest indusshytries projects prepaxed by the FAO in order to demonstrate methods ofpreparing and appraising projects in the forest sector The fuelwoodproject discussed is a part of an integrated rural development programin Korea and is aimed at establishing about 11000 village fuelwood blocks covering 127000 hectarces
The case study p--ovides a good format for the detailed assessmentof technical considerations project costs and benefits Shadow pricesfor foreign exchange and labor as well as direct and indizeet projectbenefits have been considered Detailed sensitivity analysis of resultso the cnanges in a raxnrer of assumiLptions has been presented The studyis very useful as a prototype for carrying out similar studies providedtho drawbacks mentioned below are taken into consideration
(i) The cost of land which is the Lnst important component infuelwood plantation scheme has not been given due importance Theproject just mentions two lines It is considered that land under the project would have no alternative economic use for the periodof the project Therefore land is valued at zero There is no justification provided for this assumption It is inconceivablethat an area of 127000 hectares (approximately 11 hectares pervillage) can be found which is not being used currently as marginalagricultural or pasture land Even if it is currently not beingused it is difficult to accept the assumption that this land has no potential alternative economic use in the next twenty yearsinclusion of land costs in opporunity cost terms is expected to change the economics considerably
(ii) Although a shadow wage rate for unskilled labor is usedits estimation is rather unsaLisfactory Since there is someself-employment notably the weaving of bags from rice strawfor which the net value of production is about won 450daythis value has neen used to represent the opportunity cost ofunskilled labor durcing the period November to March It is not clear as to how many people in the region can earn thismuch money per day during the entire period If many workers (higher than the number employed by the project remain unshyemployed or earn less than won 450day a lower shadow wage rate should be used
(iii) The valuation of fuelwood is very arbitrary It ismentioned that since fuelwood is not traded at present the
-157shy
fuelwood has been valued in terms of the value of fuels that it would replace namely agricultural residues and coal Although the methodology ased is correct the details of the values of proportion of agricnltural residues replacing fuelwood the calorific contents of residue of fuelwood and the price of agricultural residue have not been given The price of both fuels (residue and coal) is taken as won 12kg without providing any basis or source of data The entire economics may be different if this estimate of benefit is changed Similarly no basis for fuelwood yields of 5 tonsha have been provided As shown in sensitivity analysis the project is uneconomic if benefit is reduced by 40 percent
Ramesh Bhatia Energy Alternatives For Irrigation Pumping Some Results for Small Farms in North Bihar India Paper presentedat the International Seminar on Energy Hyderabad India January 1979
This paper presents a detailed economic analysis of usingbiogas photovoltaics diesel and electricity (regional grid) for pumping irrigation water for small farms in Bihar India Apartfrom providing a literature review the paper also outlines technoshyeconomic and social aspects of using renewable energy sources for irrigation pumping The methodology used is
(i) To define alternative irrigation systems which are equivalent in the sense that each provides the same quantity and quality (timing) of irrigation water Each system includes tubewell a pump a prime-mover (adiesel engine or a duel-fuel engine or an electric motor) and an energy source (a biogas unit or regional electricity grid)
(ii) To rank these technical alternatives on the basis of the sum of the present value of investment and operating atcosts a given social rate of discount Since benefits from irrigation are the same (since the systems are equivalent) the alternativewith the lowest present value of total costs is considered the best ie giving the highest benefit-cost ratio The analysisis done both at market prices and shadow prices The results indicate that use of biogas for irrigation pumping is economic at current prices since it reduces the consumption of diesel by 20 to 100 percent while the use of photovoltaics (solar cells)would become economic only if capital costs can be reduced significarltly
One of the imnportant points made in the paper is about the use of the correct mocthodology of benefit-cost analysis One should be cautious against attributing benefits from the use of water to benefits from aparticular irrigation alternative as has been indicated in the review of some other studies The correct procedure is either to defineequivalent irrigation system and use the method of cost effectiveness as used in this paper or estimate the benefits of one system in terms of savings in the costs of the least expensive alternative The main limitation of the paper is that the alternatives covered do not include micro-hydel windmills village level electricity generation from biomass or human and animal power A more comprehensive coverage of energy alternatives along with a number of methods of conveyance and distribution of water in the fc1ld will be a useful extension of the present study
-159-
Russell J deLucia and Michael Lesser Energy from Organic Residues in Developing Countries Present Use Potential and Observations on Feasibility Paper presented at Bio-Energy World Congress and Exposition Bio-Enecgy 80 April 1980 Atlanta Georgia
This paper reviews the existing energy uses of crop and animal residues with particular reference to their use in rural areas The present role of these energy sources in relation to both other tradishytional (woodfuel) and commercial energy sources is then presented
An illustration of the complexity of irillage resource systems is presented outlining the diverse often competing uses of organicresidues food fertilizer fiber and fuel In this context the issues and probleas associated with the use of traditional energy sources are discussed
The potential for increased use of organic residues for energy ispresented for a variety of alternative country settings In light of this potential a framework for examining village energy needs and energy related technologies is discussed The presentation indicates the importance of integrating physical environmental social and economic issues in the evaluation of proposed intervention usingorganic residues (such as biogas) A sample analysis of such an intershyvention is presented based on recent work on Thailand with particular emphasis on differential class impacts
Paper available from R deLucia Meta Systems Inc
-160-
Alcohol Production from Biomass Potential and Prospects in the Developin- Countries Report No 3021 Industrial Project Department World Bank June 4 1980
This monograph is an extensive review of many of the issues assocshyiated with the potential for biomass based alcohol production in develshyoping countries Its focus is ethanol methanol is not discussed in any detail The treatment includes a discussion of ethanol charactershyistics in relation to current and potential uses such as boiler fuel gasoline substitute diesel substitute and chemical feedstock (or final product) The report reviews historic production and consumption figures of ethanol and discusses both alternative raw materials (sugarsstarches celluloses) and production technology The economics of ethanol production and use are considered for a series of generalized cases (high mnedium and low cost country groupings) based on capital costs for different raw material based alternatives and scales of production The analysiF includes a discussion of the relative attracshytiveness of ethanol depending on use A discussion of overall prospectsfor alcohol production is presented While the document does include a limited discussion of some wider econonic policy issues such as the food-versus-energy crop competition and the need for integrated policiesthe report does not sufficiently highlight these broad questions they are left to the closing section of the document
At that date this was a Gray Colored Cover ForltOfficialUse Only document It may subsequently receive aider distributiion
-161-
MJ Groeneveld and KR Westerterp Social and Economic Aspects of the Introduction of Gasification Technology in Rural Areas of Developing Countries (Tanzania) in Thermal Conversion of Solid Wastes and Biomass Jerry L Jones and Shirley B Radding editorzi ACS Symposium Series 130 American Chemical Society Washington DC 1980
This study describes gasification processes in general terms outshylines how a system can be assembied and organized and reports on a pilotplant using 25 Kg fuel per Kwh (mechanical) The authors have presented a sketch of the gasifier unit but no dimensions or scale are shown thus making it difficult to judge on the size of the unit In analyzing the social and economic costs and benefits of adoption of such a plant the authors argue the following evaluation criteria should be used a) that wastes for use as a fuel are available and useable without damaging the agricultural system of the environment b) that the technology be congraent with the existing social and cultural system so as to facilitate adoption c) that among the alternatives available the technology chosen has the largest positive impact on the conditions of the poorest stratum in the society d) that profitability criteria for the owners and users of technology are met and finally e) general and overall considerations of national interest and agreement with national economic and other objectivesThey then describe the applicability of such a technology in a Tanzanian village -1hey examine different production possibilities (of different crops) for their potential useability in the biomass fueled plant they report that three products -- corn (cobs) coffee (skin) and wood (sawshymill wastes) -- look promising whereas the other five -- sorghum (straw plume) millet (strawchaff) cotton (strawseedspress residue) wheat (strawchaff) and groundnuts (shells) -- need further study Since currently there is no other use for corncobs they argue they are suitshyable candidates for use as fuel The authors then carry out a social benefit cost analysis for a20 Kw corn mill run on a gasifier costingabout $300 (1977) The analysis and presentation are fairly confusing but they result in showing (i) a net benefit of $118125 per year (atmarket price) and (ii) a net benefit of $]94730 per year (at estimated shadow prices) Hence they conclude that gasification of corncobs is economically and socially beneficial in Tanzania this particularly so since the technology presented here is relatively simple and can be locally manufactured While the study shows no great light on the ecoshynomic evaluation methodologies for either biogas projects or for choice of technology in general its chief merit lies in being a relatively rare and certainly new attempt at asking such questions in African contexts
SECTION VI
GENERAL BIBLIOGRAPHY
Adler HA Economic Appraisal of Transport Projects A Manual with Case Studies Indiana University Press 1971
Averical Physical SocietyAmerican Institute of PhysiLs Efficient Use of Ener (The APS Studies on the Technical Aspects of the More Efficiert Use of Energy) AIP Conference Proceedings No 25 Washington DC 1975
Bacha E and L Taylor Foreign Exchange Shadow Prices A Critical Review of Current Theories Quarterly Journal of Economics 1971
Balassa B The Effects Method of Project Evaluation Oxford Bulletin of Economics and Statistics November 1976 pp 219-231
Barnett A L Pyle and SK Subramanian Biogas Technology in the Third World A Multidisciplinary Review International Development Research Center Ottawa 1978
Beyer J An Economic Framework for P2oject Analysis in India Mineo Ford Foundation New Delhi 1972
bull Estimating the Shadow Price for Foreign Exchange An Illusshytration from India Journal of Development Studies July 1975 pp 302-315
Bhatia JR Economic Appraisa of Biogas Units in India Framework for Social Benefit Cost Analysis Economic and Political Weekly August 1977
Energy Alternatives for Irrigation Pumping Some Results for Small Farms in North Bihar Paper presented at International Seminar on Energy Hyderbad January 1979
_ An Analytical Framework for Socio-Econcmic Assessments of Technological and Policy Alternatives Paper prepared for the East-West Center Honolulu January 1980 (Draft)
and M Mehta Tubewell Irrigation in India An Economic Analysis of Technical Alternatives Economic and Political Weekly August 1977
and M Niamir Renewable Energy Sources The CommunityBiogas Plant Paper presented in a seminar at Harvard Univershysity Department of City and Regional Planning November 1979
Bhavani S Biogas for Fuel and Fertilizers in Rural India -- A Social Benefit Cost Analysis Indian Journal of Agricultural Economics July-September 1976
-163-
Biswas TD Cow Dung Gas Plant for Energy Manure Fertilizer News September 1974
Brannon R Agricultural Sector Assessment -- Thailand January 1978
Briscoe J The Political Economy of Energy Use in Rural Bangladesh Population and Development Review December 1979
Bruno M Domestic Resource Costs and Effective Protection Clarifishycation and Synthesis Journal of Political Economy 1972 pp 16-33
Cecelski E J Dunkerley and W Ramsay Household Energy and the Poor in the Third World Resources for the Future Washington DC July 1979
Cullison AE Feeds and Feeding Reston Publishing Co Restcn VA 1975
Dasgupta A and SW Peace Cost Benefit Analysis Theory and Practice MicMillan London 1972
Dasgupta P A Comparative Analysis of the UNIDO Guidelines and the OECD Manual Bulletin of the Oxford University Institute of Economic Statistics pp 33-51
Dattachandhuri M and AK Sen An Economic Evaluation of the Durgapur Fertilizer Project Indian Economic Review April 1970
deLucia RJ HD Jacoby etal LDC Energy Planning A Study of Bangladesh Submitted for prepublication review Manuscript available from RJ deLucia President Meta Systems Inc Cambridge MA June 1980
and Sector-wide Analysis and Investment Program Design Chapter 10 in deLucia Jacoby etal opcit June 1980
and M Lesser Energy from Organic Residues in Developshying Countries Present Use Potentials and Observations on Feasibility Paper presented at the World Bio-Energy Conference Atlanta GA April 1980 To be published in the proceedings
and R Tabors Traditional and Renewable Energy Reshysources Chapter 4 in deLucia Jacoby etal op cit June 1980
Disney R Economics of Gobar-Gas versus Fertilizer A Critique of Intermediate Technology Development and Change Vol 8 (1977) pp 77-102
-164-
Eckstein 0 Water Resources Deelo ment The Economics of ProjectEvaluation Harvard University Press Cambridge MA 1958
Food and Agricultural Organization of the UN (FAO) Timber Trends Study Thailand Rome 1972
rTropical Feeds Feeds Information Services and Nutritive Values (by Bo Gchl) Rome 1975
_ Economic Analysis of Forestry Projects FAO Forestry Paper 17 and Case Study No 2 Village Fuelwood Plantations in Korea Rome 1979
French D The Economics of Renewable Energy Systems for Developing Countries mimeo US Agency for International Development January 1979
Geertz C Agricultural Involution University of California Press Berkeley 1963
Ghate PB Biogas A Pilot Project to Investigate a Decentralized Energy System Paper presented at the International Seminar on Energy Hyderabad January 1979
Biogas A Decentralized Energy System Economic and Political Weekl July 7 1979
Gittinger JP Economic Analysis of Agricultural Projects Johns Hopkins University Press Baltimore for the World Bank Washington DC 1972
Groeneveld MJ and KR Westerterp Social and Economic Aspectsof the Introduction of Gasification Technology in Rural Areas of Developing Countries (Tanzania) in Thermal Conversion of Solid Wastes and Biomass JL Jones and SB Radding ed ACS Symposium Series 130 American Cheinical Society Washingshyton DC 1980
Harberger AE On the Uses of Distributional Weights in Social Cost Benefit Analysis Journal of Political Economy September 1968 pp 87-120
_ Project Evaluation Collected Papers Markham Publishing Co Chicago 1971
_ Taxation and Welfare Chicago University of Chicago Press 1978
Harrington J Alternative Sources of Energy in the Rural Environment mimeo Paper presented at Seminar on Energy Conversion and Audit Madras July 1977
Hodam Associates California Cogeneration of Process Heat andElectricity from Rice Hulls in the Philippines Reportprepared for USAID Washington DC January 1980
Indian Council of AgriculturalResearch The Economics of Cow Dun Gas Plants A Report New Delhi 1976
Jacoby HD and JJ Stern Economic Cbjectives Parameters andAssumptions Chapter 7 in deLucia Jacoby et al 92 citJune 1980
Jenkins GP Theozy and Estimation of the Social Cost of ForeignExchange Using a General Equilibrium Model with Distortionsin All Markets miriteo HIID Development Discussion Paper 26Cambridge MA 1979
KVIC (Khadi and Village Industries Commission) India Gobar GasWhy and How (Revised) New Delhi January 1977
Lal D Wells and Welfare Organization of Economic Cooperation and Development Paris 1972
Disutility of Effort Irrigation and the Shadow Wage Rate Oxford Economic Papers March 1973
_ Methods of Project Analysis A Review World Bank StaffOccasional Papers No 16 Johns Hopkins University Press Baltishymore for the World Bank Washington DC 1974
Little IMD and JA Mirrlees Project Appraisal and Plaining forDeveloping Countries Basic Books Inc New York 1974
and M Fg Scott Using Shadow Prices Heinemann Edushycational Banks London 1976
Marglin SA Public Investment Criteria Allen and Unwin London 1967
Value and Price in theLabor Surplus Economy Oxford at the Clarendon Press 1976
McGauhey SE Investment Criteria for Agricultural and Rural Developshyment Projects The Measurement of Their Multiple Economic andSocial Consequences pp 1-62 in Economic Analysis of ForestryProjects Readings FAO Forestry Paper 17 Supplement 2 Policyand Planning Service Forestry Department FAO of the UN Rome 1980
Mishan EJ Cost Benefit Analysis Praeger New York 1976
-166-
Mishra SN and J Beyer Cost Benefit Analysis A Case-Study of the Ratnagiri Fisheries Project (India) [Appendix III on Methodology and Estimates for Social Rate of Discount Accountshying Price of Investment (Savings) Accounting Price of ForeignExchange and Accounting Price of Unskilled Labor] Hindustan Publishing Co Delhi 1976
Moulik TK and UK Srivastava Biogas Plants at the Village Level Problems and Prospects in Gujarat Indian Institute of Manageshyment Ahmedabad 1976
Mubayi V J Lee and R Chatterjee The Potential of Biomass Conshyversion in Meeting the Energy Needs of the Rural Populations of Developing Countries An Overview Brookhaven National Laborshyatory September 1979 mimeo
National Council for Applied Economic Research (NCAER) India Domestic Fuel Consumption in Rural India New Delhi 1965
Organization for Economic Cooperation and Development (OECD) Manual of Industrial Project Analysis Volume II by IMD Little and JA Mirrlees OECD Development Center Paris 1968
Overseas Development Administration UK A Guide to Project Appraisal in DevelopingCountries London 1972
Oxford Economic Papers Symposium on Shadow Exchange Rates July 1974
Parikh J Assessment of Solar Applications for Transfer of Technology Solar Energy 1978
Parikh KS and J Parikh Potential of Biogas Technology IASA Vienna 1977
Prasad CR K Krishna Prasad and AKN Reddy Biogas Plants Prospects Problems and Tasks Economic and Political Weekly August 1974
Reynolds LG ed Agriculture in Development Theory Yale University 2ress New Haven 1975
Roemer M and JJ Stern The Appraisal of Development ProjectsA Practical Guide to Project Analysis with Case Studies and Solutions Praeger New York 1975
Reutlinger S Techniques for Project Appraisal under UncertaintyWorld Bank Occasional Staff Paper Johns Hopkins University Press Baltimore 1970
Sanghi AK and Dekle Day A Cost Benefit Analysis of Biogas Producshytion in Rural India Some Policy Issues in W Lockeretz edProceedings of the Conference on Energy and Agriculture Academic Press New York 1977
-167-
Sathianathan MA Bio-gas - Achievements and Challenges AVARD New Delhi 1975
Schwartz H and R Berney eds Social and Economic Dimensions of Project Evaluation Inter-American Development BankWashington DC 1977
Sen Amartya K 1972 Control Areas and Accounting Prices An Approach to Economic Evaluation Economic Journal pp 486-501
bull Employment Technology and Development Oxford at the Clarendon Press 1975
Singh Inderjit Smiall Farmers and the Landless in South Asia World Bank Staff Working Paper No 320 February 1979
Sinha B and R Bhatia Economic Appraisal of Irrigation Projectsin India A Social Benefit Cost Analysis of Auranga Reservoir
Hopkins University Press Baltimore for the World Bank Washington
Project in Bihar mimeo Harvard University Cambridge MA 1976
Squire L and HG Van der Tak Economic Analysis of Projects Johns
DC 1975
Smith Douglas V Photovoltaics in the Third World MIT Energy Labshyoratory Working Paper 79-045 Cambridge MA 1979
Subramaniam SK (1976) Biogas System in Asia Management Development Institute 1977
Tabors R The Economics of Water Lifting for Small Scale Irrigation in the Third World Traditional and Photovoltaic Techniques MIT Energy Laboratory Report No 79-011 (Available from NIIS) 1979
Tyner Wallace E and John Adams Rural Electrification in India Biogas versus Large-Scale Power Asian Survey August 1977
United Nations Industrial Development Organization (UNIDO) Guidelines for Project Evaluation New York 1972
_ Guide to Practical Projecct Appraisal Social Benefit Cost Analysis in Developing Countries New York 1978
United States Agency for International Development (USAID) Appraisal for Development Washington DC 1979
_ Philippines ReforestationRural Energy Project AID Project Paper Washington DC July 1980
World Bank Economic and Social Analysis of Projects A Case Study of Ivor Coast Staff Working Paper No 253 Washington DC 1977
World Bank Thailand Toward a Development Strategy of Full Partici_a tion - A Basic Economic Report Washington DC September 1978
Estimatin Shaduw PFcices for Colombia in an Input-Output Table Framework Staff Working Paper No 357 Washington DC 1979
_ Alcohol Production from Biomass Potential and Prospects in the Developing Countries Report No 3021 Industrial Projects Department Washington DC 1980
ANNEXES
A Economic Evaluation of a Village Level Community Biogas Plant
B Electricity Generation from a Village-Scale Biogas Plant
C Estimates of Calorific Value Parameters
Annex A
Economic-Evaluation of a Village Level Community Biogas Plant 1
There have been a number of studies on technical and economic aspects
cf biogas technolugy in India and other developing countries A detailed
analysis of the various techno-economic-social aspects is found in Barnett
et al (1978) Bhatia (1977 1979) French (1979) Ghate (1979) Cecelski
et aL (1979) Tyner and Adams (1977) Disney (1977) and Parikh amp Parikh
(1977) It has been pointed out that private biogas plants to meet the
energy demands of a particular household would restrict the technology to
a relatively richer stratum of the rural communities who own more than
three heads of cattle per household Community biogas systems have been
suggested as one of the most efficient and equitable ways of meeting the
energy needs of the poor in the villages Such community plants are said
to have the following advantages
(i) These units being large scale plants should have economies of scale in capital costs while having smaller heat losses requiring less precision in temperature mainshytenance and feeding and permitting design modifications to improve efficiency more easily than small plants
(ii) The community plant would provide employment through laborshyintensive dung collection and by-product fertilizer distribushytion as well as on account of increased labor demand resultingfrom irrigation and small industries powered by gas
(iii) The benefits of such a plant in the form of cooking and lightingfuels will be available to the relatively poorer sections of the community who for various reasons are unable to install individshyual household plants
(iv) The large scale plant can generate enough gas to run dual-fuel engine for running of tubewell for drinking water and irrigationfor operation of flourmill chaff-cutter and thresher It could also produce enough gas to run an electric generator to provide
For further details see Bhatia and Niamir (1979)
A-2
electricity for street lighting house lighting and television as well as for running various machines
cv) The comunity plants can serve as a vehicle for the cooperativecommunity action and can provide a forum for decision-making for the benefit of a large number of people
As against these advantages it is mentioned that community plants
have significant diseconomies of scale on account of higher costs of
distribution of gas and collection of cow dung and there would be considshy
erable problems in implementing a scheme which requires management skills
cooperative action and decision-making in a rural setup characterized by
unequal access to resources
Although there have been reports of successful operation of large
scale biogas plants in India Korea and Philippines (See Barnett et al
1978) there are relatively few known cases of comnunity biogas plants
in operation Researchers have pointed out that the organizational and
technical problems of establishing and running either private or cooperashy
tive biogas systems are formidable but there is absolutely no literature
based on an actual experience in the field Although the problems connected
with collecting cow dung maintenance of the plants and collection of gas
are recognized there is no documentation available on the nature of these
problems in different community settings It is imperative to analyze the
techno-economic and social aspects of this technology if the great potential
of community biogas plants as an efficient and equitable source of energy in
rural area tQ be exploited The present case study is an attempt to
fill this crucial gap in the available literature on renewable energy sources
A-3
Tables A-1 and A-2 provide data on the major characteristics of the
village as well as sore main components of the project It is recognized
that these conditions will vary from one region to the other and a project
can be varied from one location to the other on the basis of the perceptions
of the planners as to which aspects are important for the village in question
It is hoped that this case study will provide some lessons for determining
the various cowponents of the project on the basis of explicit priorities
in allocation of gas for different activities
Benefit Cost Analysis
The methodology of Social benefit cost analysis has been used to
answer some of the questions raised above The analysis is done in two
stages first it is assumed that the maximum amount of cow dung (100)
will be diverted to the community biogas plant and the allocation of gas
is done as stipulated in the project In other words the plant is
analyzed under best conditions In the second stage of analysis an
attempt is made to study the case when there is a reduction in available
cow dung This can happen in situations where the number of cattle
decreases Another possibility is that villagers contribute less than the
total available dung to the plant because of their preference for using
dungcake for specific cooking needs
In the cases of Benefit Cost Analysis (BCA) of a biogas plant estimashy
tion of benefits is very crucial Since the capital and operating costs
are quite straightforward the results of BCA depend on the assumptions
A-4
made regarding benefits For the purposes of demonstration we have
discussed alternative measures of benefits both from the point of view
of the users as well as from that of the society The objective of this
is to make explicit all the assunptions involved and to see their implications
for different plans of utilization of gas from the plant
Tables A-3 and A-4 give details of present pattern of energy use in the
village Table A-5 provides per hour gas requirements for the operation of
different activities These are standardized requirements and do not equal
the present use of gas for different operations necessarily It can be
seen that cooking requires the heaviest use of gas followed by flour
milling and threshing The percentages vary slightly in daily use
because of the varying hours of use It can be seen from Table 22 that
cooking (by all households) uses more than half of the daily gas availability
in the summer but almost 34 of the availability in the winter
Quantification and Valuation of Benefits
Estimation of Benefits of Cooking
Alternative estimates of benefits of using gas for cooking under
different assumptions are detailed below
Assumption 1 Saving in Labor Cost or Time
The opportunity cost of laborhours released from collecting
firewood and plant residue and for making dungcakes cannot be quantishy
fied since there is no reliable data for how much labor energy is
A-5
expended on these activities Besides labor will still be used in
transporting cow dung daily to the biogas plant and removing slurry
from the plant to the slurry pits This method has not been used
in order to avoid the arbitrariness involved in quantification and
valuation of labor
Assumption 2 Opportunity Cost in Terms of Value of Alternative Use Plant Residue Firewood and Dung
In this context the basic question to be answered is what is
the benefit of using these resources when these are released from
their present use as a consequence of availability of biogas
a Plant Residue A total amount of 27334 kgmonth or an equivalent of 18 million kilocalories (net) are currently used for all households This constitutes approximately 60 of the total net energy used for cooking If this quantity of plant residues is released from cooking there will not be any economic value added since the villagersdo not perceive a market for it It can be used for liveshystock fodder but no data are available on fodder consumpshytion to assess this benefit Finally a possible benefit is the agricultural use of the plant residue but again there are not enough data to evaluate this benefit It is not known whether the villagers perceive a need for using plant residue as organic fertilizer It may be that there is no alternative use for plant residue since soil characteristics and cropping patterns may not indishycate any benefit from it and so burning plant residue for cooking may be the most efficient use of these resources
b Fuelwood A total of 442 kgmonth of fuelwood (or equivalent of 028 million kcal) is presently used If this amount is released from cooking there can be two forms of benefits The first would depend on whether the wood which is still being collected is now sold in the market The price of firewood in small towns (including transportation costs) is estimated at $038 per kg therefore the total value
A-6
1added is $166 per year This represents the maximum gain although it is nct known whether all the firewood released will be sold and hence this benefit will in fact be attained by the villagers
The second form of benefit is the ecological benefits of not cutting the wood There are no data to evaluate this benefit It is not known what t of firewood is collected Cutting branches collecting fallen branches and twigs or cutting bushes may not have as much of an adverse impact on the ecology as is generally associated with felling trees for firewood
c Dung With the total dung production of 1392 kgday 445 or 619 kgday dung was used for producing dungcakes (1238 kg dry dung x 5) Thus with the biogas plant this quantity of 619 kgday is released and can potentially be used for manure Assuming that approximately 4 is still used for cleaning and other domestic uses 1336 kgday is the total slurry available for manure which is the equivalent of 126 kgacrc of operashytional agricultural landholding per day whereas before the introduction of the biogas plant a total of 700 kgday of dung or 66 kgacre was used For each household it would have differential impact since size of holding varies from one to the other It must be noted that all of the dung released may not necessarily be used as manure This will depend on whether he farmers were using the dung primarily for its NPK content or for its soil building characteristics (in which case they may use more dung if it is released) Alternatively if their priority was on using dung for manure then presumably the use of 555 of the dung proshyduced may be the optimal amount and so the farmers may not use more dung for manure than they already do In case all of the dung released is assumed to be used as manure there will be a value added in terms of N which is estimated as follows N content is 1 per kg of slurry dung therefore with a total o- 619 kgday or 18570 kg per month of wet dung or 1857 kg of nitrogen per month is available The net import cost of N is $07 per kg Assuming N content
IAi the calculations here as well as those made in Tables A-7 to A-13 were originally made using figures in Rupees These have been converted into US dollar figures using $1 = Rs8 rate Due to rounding the numbers here and in tables do not match exactly
A-7
of urea is 45 and import cost of 1 kg urea is $025 per kg and local transport and distribution cost is $012 per kg Therefore the value added by N is $125 per nionth or $1500 per year3 (See
Talle A-7Y
However it should be mentioned that with the present information on hand it is difficult to judge which resource has a perceived benefit in alternative uses If however there are no alternative uses for any of the released reshysources then it would be more efficient not to intervene at all into the village energy system and to allow present cooking habits to continue The usual argument used to justify biogas plants namely that gas must be used for cooking o that the valuable manure can be diverted for use as fertilizer would no longer apply And the biogas plant would provide much higher benefits if gas is used for other operations such as tubewell etc The details of the latter assumption are examined later in this case study
Assumption 3 Resource Cost in Terms of Equivalent Soft Coke
Under this assumption benefits from the use of biogas in cooking
are estimated in terms of the resource costs of providing alternative
fuels for plant residue dung and firewood This method assumes that
plant residues and dung have better uses than being burnt and hence
the society should provide some alternative fuel (say soft coke) to
villagers Since the choice from the viewpoint of the society is to
employ either soft coke or biogas for cooking and if both fuels are
Thishowever assumes that the N content per kg of digested slurry (1) is the same as that for ordinary organic manure (non-scientific composted) since 96 of total dry dung produced is used as opposed to 527 (or the amount added to existing use) There is some disagreement on this point as discussed in detail in Bhatia (1977) Besides it is also pointed out even though the quantity of N per kg remains the same it is the quality that is improved Digested slurry is reported to have more ammoniated N (which is picked up easier by the plant than ordinary manure Since the quality of N in biogas slurry will depend on the handling practices and in dry farming slurry is usually dried for months before it is used on the field we have assumed that N content remains the same as in cow dung
A-8
considered of equal quality by planners (not by users) the
benefits to the society from biogas used in cooking are the
savings in resources
a Cost of Soft Coke -- Plant Residue Assuming that there is a definite benefit in releasing all of the plant residue from cooking we can convert the energy from the plant residue (1765766 kcalmonth) to an eauivalent of 17285 kg of soft coke per month or 20742 kgyear (Soft coke has a gross energy content of 5772 kcalkg which at an effishyciency rate of 177 gives a net energy content of 10216 kcalkg) The cost of soft coke (including transportation) has been estimated at $17 per ton (see Ehatia 1977) TIerefore the resource cost of equivalent quantity of soft coke is $350 per year and this can be used as the benefit to the society of providing gas for cooking
b Fuelwood A total of 442 kg of fuelwcod is used monthly by all households Most of this is used for cooking but an insignificant amount is also used for crafts and conshystruction It is not at all certain what type of fuelwood is collected Probably most of it is in the formof twigs and branches which do not create as much of an environmental hazard as cutting logs From the societal point of view the benefits of replacing fuelwood with biogas can be quantified by finding the cost of the equivalent amount of soft coke required 442 Kg of fuelwood is equivalent to 284736 kcal of energy every month This is equal to 2787 kg of soft coke per month or 33446 kg of soft coke per pear At a cost of $17 per ton the benefits amount to $57 per year
c Dung The resource cost of dung from a societal point of view is substantially higher than for fuelwood A total of 37147 kg of dry dung is used by all households per month This is the equivalent of 1 million kcal of net energy Converted to soft coke it would take 995 kg of soft coke per month to replace it giving the resource cost of $200 per year The resulting estimates of benefits in terms of resource costs of substitute (soft coke) are given in Table A-13
A-9
Estimation of Benefits in Lighting
Table A-4 shows actual use of kerosene for lighting In total there
is a need for an equivalent of 4916 cft of gas per day for lighting in
the houses A total of 5994 litres of kerosene was used per month At
a purchase cost of $025 per litre (including transportation and marketing)
the total saving in the cost of kerosene is $15 per month $180 per year
Furthermore there is the additional benefit of having street lightshy
ing Street lighting if provided through petromaxes using kerosene may
be assumed to give equivalent quality of lighting as is available from
electricity The resource cost in terms of kerosene is as follows with
the assumption that one litre kerosene produces the same lighting requireshy
ment as two kwh of electricity and the total energy required for street
lighting is 288 kwh per day (72 kw for four hours) therefore 144 litres
of kerosene per day or 5184 litres per year are needed Thus the equivashy
lent resource cost is $130 per year for street lighting To this we should
add the annualized capital costs of petromaxes However this is ignored
since no data is available
Another important benefit that cannot be quantified is that kerosene
used for lighting may be seen as a superior product than electricity or
lighting Kerosene is more flexible and can be turned on and off by each
individual household at will and there is less wastage of the resource
Besides kerosene lamp is more mobile and can be easily taken outdoors for
various uses Biogas lighting whether from the generator or direct gas
lamps is controlled by a central committee The houts of operation are
open to collective discussion but it can never have the flexibility that
kerosene can provide
A-10
Estimation of Benefits from Tubewell Irrigation
Before the introduction of the community biogas plant a man from
outside the village was supplying water for irrigation by hooking his
pump to the existing stream He was charging $125 per hour for his
services In the winter period the tubewell run by biogas will supply
irrigation for 25 hours per day therefore the savings for the village
is $3 per day or $365 for four winter months The savings will be less
in the summer time since normally the canal would overflow and provide
free irrigation for at least half the acreage theretore the savings can
be estimated to be $365 for the eight summer months giving a total of
$730 per year
Another way of estimating the benefits from biogas is in terms of
savings (to the society) of diesel oil estimated as follows a total of
1560 litres of diesel fuel is used per year in the pump Since the
tubewell continues to use 20 diesel (ie 312 liter per year) the total
savings are 1248 liter of diesel and at a cost of $025 per liter a
total of $312 per year is saved But the annualized capital and 0 amp M
cost of the diesel engine are $115 which should be excluded from operating
costs or added to the benefit side Therefore the benefit from the tubeshy
well is $427 per year The second alternative is used since in the former
case the hours of operation used are potential and not necessarily the
actual use Furthermore computing by wage may give the wrong impression
that there is a cost in terms of one less person employed although the
pump man does not belong to the village in any case
ln the project report it was assumed that a mixture of 20 diesel and 80 gas will be used for running for dual-fuel engine for the tubewell Actual consumption of diesel turned out to be different A mix of oneshythird diesel and two-thirds gas
A-Il
Table A-10 provides a breakdown of the quantificable benefits of the
community biogas plant under the two assumptions discussed above
Estimation of Costs
Table A-II presents capital costs of the plants while Table A-12 gives
details of operating costs It may be noted that of the total capital
costs of $17293 at shadow prices biogas plants (including gas distribushy
tion network) account for 60 percent Electricity generatox and the
distribution network account for another 20 percent In the case of
operating costs skilled labor for supervision accounts for about half
the costs while fuel costs (diesel plus lubricating oil) account only
for about 14 percent
Benefit Cost Ratios
Table A-13 presents the Net Present Values (NPV) and Benfit Cost Ratios
for the two alternatives The results show that under the assumptions outshy
lined above from the societys point of view investment in community
biogas plant is not profitable If Assumption 3 is considered ie if
the value of gas is taken in terms of resource costs of providing equivalent
soft coke the B-C ratio is very low ie only 0012 The NPV will be
marginally positive if the annual benefit is on the order of $3386
in place of $1585 This would be the case if the price of soft coke is
doubled and the import cost of kerosenediesel also increases approximately
by 100 Hence the investment in community biogas plant would become
socially profitable only when fuel costs increase by 100 from their present
levels In the case of Assumption 2 the BC ratio is 0596 and it would be
A-12
marginally greater than unity if the annual benefit is higher by $
or so ie by about 27 of the present estimate However it must be
remembered that in this method of Assumption 2 sbout half of the estishy
mated annual benefits are from value of additional N content of manure
which may or may not be available to the farms or may not be as beneficial
to the farms as is assumed here This indicated that there is immediate
need to firming up data on NPK contents of cow dung dried cow dung manure
dried slurry from biogas plant etc under field conditions
Conclusion
The analysis above shows that if priority is given to cooking and
lighting in utilization of gas the benefits of a community biogas plant
do not outweigh its costs
The method of Alternative Uses in estimating benefits provides a
better BC ratio than using Resource Cost Analysis but both methods are
based on equally shaky assumptions It is clear that there is a need
for more in-depth observation of the circumstances surrounding the
introduction of this community biogas plant
The present analysis was based on the assumption that there will be
a 100 availability of dung to be used in the biogas plant Such an
assumption may be unrealistic If the dung is reduced less gas is
supplied and thus already precarious benefits from the plant are reduced
even further while the costs will remain the same
A-1 3
It is interesting to note that the economics of biogas technology
depend- on the following assumptions
(i) The calorific content of different fuels such as cow dungcakes fuelwood used in cooking plant residues kerosene and biogas
(ii) The efficiencies with which these fuels are being used currently or the possible equipments which could lead to higher efficiencies
(iii) The NPK contents of different organic fertilizers and the yieldshyfertilizer response functions for organic fertilizers under different agronomic conditions and crop rotations
(iv) The behavioral aspects of use of energy sources or organic fertilshyizers such as present use pattern-s actual and perceived conshystraints to their use etc
It is not clear how the benefits of the project are perceived and
received by different beneficiaries The richer farmers view lighting
benefits as most important while others do not attach too much importance
to lighting and are not willing to payRs five per month per household for
the bulbs Benefits from cooking and tubewell operation are also distributed
It must be keptin id tliatthis village is not a typical village
in India It provides particularly favorable conditions in which a biogas
plant was implemented There are ample supplies of cow dung the distribution
of land and income is relatively even and the literacy rate is higher than
average If a conmunity biogas plant is uneconomic and difficult to
operate in such favorable conditions it is difficult to justify its use
in other situations
A-14
TABLE A-I
MAJOR CHARACTERISTICS OF THE VILLAGE
LOCATION About 4 miles from a railway station in Etawah district of Uttar Pradesh India
POPULATION Adults 81
Minors 96
Total 177
Number of Households - 27 Number of Cultivative Households - 25
LIVESTOCK
Cows and Bullocks 41
Buffaloes (male and female) 35
Young Calf and Buffaloes 35
Goats 25
136
DUNG PRODUCTION
Kgs per day 1362
Tons per year 490
LAND USE AND CROPS
Total Land Area (operated) 106 acres
Irrigated Area 25 acres
Major Crops Paddy Ashar (Lentils) Mustard
ENERGY SOURCES
No Electricity
Kerosene for Lighting
Plant Residues Dung Cakes and Fuelwood for Cooking
Animals for Crop Production
A-15
TABLE A-2
MAJOR OMPONENTS 01 THE VILLAGE LEVEL
CC$4MUNITY PIOGAS PROJECT
A BiOas Plants
Two units 35 M3 + 45 M3 per day capacity
or 2800 F3 (cft) per day capacity
B Dual-Fuel Engine and Related Machinery
Duel-Fuel Engine
Tubewell
Flour Mill
Thresher
Chaff-cutter
C Electricity Generator
Electricity generator
a dual-fuel engine
5 HP
4 HP
5 HP
5 HP
2 HP
coupled with
35 HP
D Distribution System
Gas through pipes for cooking for 27 households and
electricity through distribution lines for street
lighting and houses
A-16
TABiLE A-3 KCAL EQUIVALENTS OF PRESENT ENERGY USE BY DIFFERENT
SOURCE FOR EACH CATEGORY OF HOUSEHOLDS PER MONTH
Dung Cake Plant Residue Firewood Total
Category (Size of No of Net Net Net Net Operational Land House- Kcal of Kcal of Kcal of Kcal of
Holding holds Month Total Month Total Month Total Month Total
Small 5 216223 213 406908 23 0 0 623203 (Less than 1 ha)
of total small 35 65 0 100 203 category energy consumption
Medium 11 324253 319 610470 346 46383 163 981105 J( ha - 2 ha)
of total medium 33 62 5 100 32 category energy consumption
Large 10 476238 468 748326 424 238354 837 1462918 (gt 2 ha)
1 of total large 33 51 16 100 477 category energy consumption
Total 26 1016714 100 1765776 100 284736 100 3067226 100
A-17
TABLE A-4 CONSUMPTION OF FUELS FOR COOKING AND LIGHTING
PER MONTH PER HOUSEHOLD
Cooking Needs Lighting
Category of Net Farmer (Size Plant Total Useful Useful of Operational Dung Cakes Residues Fuelwood Energy (Net) Kerosene EnergyHolding) (kilograms) (kgs) (kgs) (Thousand kcals) (litres) (Kcal)
Small 1580 1260 1246 160 2752 (Less than 23 acres)
Medium 1077 899 36 892 154 2649 (231 to 449 acres)
Large 2175 1448 74 1463 350 6020 (More than 45 acres)
Total 4832 3607 110 3601 11421664
NOTES 1 Effective heat available is estimated on following assumptions
Dungcakes 2444 kcalkg 122 efficiency = 2737 kcalkg
Plant Residues 3800 kcalkg at 17 efficiency = 646 kcalkg
Fuelwood 4702 kcalkg at 137 efficiency = 6442 kcalkg
Kerosene 11110 kcalkg or 7936 kcallitre 217 = 1720 kcallitre
2 For assumptions and further discussion SEE Bhatia (1977) Harrington (1977) NCAER (1965)
3 Every Household does not consume each fuel in the same quantities Hence the totals only indicate average consumption
A-18
TABLE A-5 GAS REQUIREMENTS PER HOUR OF
DIFR=ENT OPERATIONS (IN CUBIC FEET)
Case II Case I Without With (Using 1 Of the total water in over-
Operation I____
Electricitv Generator
Gas For Lighting
head tank 53f 3 is uJed to mix wich slurry - sbince it takell total of 66f 3 zof
Cooking 2 126 Burners I_
Licfting (26 I
Homes)
247
41
247
117
gas (60f gashr 66 minutes to fill tank then only 04f3 of gas is used for slurry water and restfor drinking water
i(l 0 Watt) 4 2 Each burner requires 95
2ighting (Streets)f(20 Watt)4
115 63
3
cfthour of operation
Flour milling threshing
jrinking Water 7From Tubewell
1 656 656 chaff cuttng and tubewell require 15fiHPhr estimated total based on
___HP actually used
Slurry Water 1 04 04 From Tubewell 4 Generator -es total of
525 cft gashr - ie
Tubewell For tIrrigation
534 534 15cftHPhr and only 35 HP used For gas lamps 45 cftlamp hr is used
o 4 HP Used)5
5 In the first hour of Flour Milling i(5 HP Actually Used)
75 75 operation 66 cft used for drinking and slurry water and 534 cft for
Threshing (5HP)
75 75 irrigation shy in all other remaining hours of day all of tubewell operates(60cft) is used for irrishy
-haff-Cutting 30 30 gation
(2 HP Used)
A-19
TABLE A-6 DAILY USE OF GAS BY TYPE OF ACTIVITY IN
SUMMER AND WINTER
SUMMER WINTER (Mar-Oct ) (Nov - Feb )
of of
Type Of Total Total Total Total OTES Activity (cftday) Demand (cftday) Demand 1 Dual-fuel engine runs a
thresher (4 hrsday in summer
Cooking7L 482 543 13585 729 chaffcutter (2hrsday in summ and winter each) flour mill (4 hrsday in winter and
Genernr 261 or Lighting
r oject case 210 77 2363 127
_rjctcae1
hrday in summer) and tubeshywell (25 hrsday in winter 6 hrsday in summer) and hrday (winter) 5 hrday
Tubewell (Sumzmer) extra thus the totil
For irrigation 3204 117 1335 7 gas required for dual-fuel enshygine in summer is 885 cft and
Flour MillA3 1125 41 75 4 in winter is 285 cft
09 2 46 x 40 watt bulbs for houses
and 18 x 40 watt tubelights
for street lighting 2560 Chaff Cutter 60 22 60 32
watt = (746 kwHP) =3
100 1863 100 or 35 HP (+ loss) x 15fTotal Demand 2485 = 525 cft gashr used by
1893 generatorTotal Supplyw 2728
3 75 f3hr
4 30 f3 hr each
Only 66 minutes used for filling overhead sank of 357 f3 capacity (9 f3sec) assumption still held that it requires 60 f gashr to run tubewell
Alternative 2 One lamp per household used 4 hrsday requiring 45 f3
of gashr that is 468 cftday in both swnmer amp winter
1 burner per household used 6 hrsday requiring 95 f3 hr
From 2 plants (one of 35 m and other 45m3) - summe5 conversion rate of 196 f kgday winter conversion rate of 136 f kg and total of 1392 kg gobarday
Total capacity of plants is 2857 f3day but since gas is being continually used and generated more gas than above can be produced
A-20
TABLE A-17 YEARLY VALUE ADDED FROM THREE SOURCES OF
ENERGY FOR COOKING BY HOUSEHOLD CATEGORY
tegory (Size of irational Land 1ding
all (Less Than 1 ha)
Number of Households
5
N Content of Dung $
320
Plant Residue $ Fuelwood Total$
320
ditun (Between 2 ha)
1 ha 11 480 27 507
rge (More Than 2 ha) 10 705 139 844
tal 26 1505 166 1671
Note 1 see text for calculations
A-21
TABLE A-8 SAVINGS IA COST OF KEROSENE FOR HOME LIGHTING PER HOUSEHOLD
Category Savings In (Size Of Number Kerosene Per Average For
Operationql Of Year Households Holding Households $ $
Small (Less Than 5 24 48 23 Acres)
Medium (231 -449 Acres) 11 508 46
Large (More Than 45 acres) 10 108 101
TOTAL 26 1828
A-22
TABLE A-9 YEARLY RESOURCE COSTS BY HOUSEHOLD CATEGORIES FOR COOKING
Category (size of number soft coke soft coke soft coke Total
operational land of replacing replacing replacing
holding) households dung plant fuelwood cakes residue $
$ $
Small (less than 1 ha) 5 66 1145 184 1989
Medium (between 1 ha-2 ha)
11 45 78 1216 1356
Large (more
than 2 ha) 10 907 1575 254 2736
Total 26 2017 3S0 564 6081
A-23
TABLE A-10 YEARLY QUANTIFIABLE BENEFITS BY ACTIVITY
Activity Alternative Resource Use Method Cost Method$ $
Cooking 1670 608
Lighting 281 281
Tubewell 427 427
Flour Mill2 272 272
Total 2650 1588
Notes 1 See text for calculations
2 Assuming that Rs 5 or $063 will be earned for grinding a quintal of
wheat in an hour It is assumed that the flour mill will be operated
for 435 hours per year
A-24
TABLE A-Il CAPITAL COSTS OF VARIOUS UNITS AT MARKET AND SHADOW PRICES
At Market Prices At Shadow Prices
Per cent
Unit(s) Per cent of of Total $ Total Costs _ _ _ Costs
1 Bio-Gas Plants 8908 455 7159 414
2 Gas Distribution 3325 1 3540 205
3 Dual-fuel Engine and Related Machinery 3598 184 3265 189
4 Electricity Generator 2794 143 2533 146
5 Electricity 46Distribution 938 48 797
Total 19563 100 17294 100
SOURCE For details of assumptions see Annex Table 1 in Bhatia and Niamir (1979)
1 There is a subsidy for 54 burners (two per household) at an
approximate cost of Rs 20-25 (or $25-3) each which is not included in the capital cost since it is relatively marginal
2 Excludes cost of chaff cutter and threasher
A-25
TABLE A-12 ANNUAL OPERATING COSTS OF COMMUNITY BIO-GAS PLANT
At Market Prices At Shadow Prices
Units $ Percent of Total Percent of Total
1 Bio-Gas Plants 700 343 256 164
2 Fuel Cost of Duel Fuel Engine and Related Machinery 2 1082 53 1066 68
3 Fuel Cost of Generator and Electricity Generation 246 12 228 146
4 Kerosene Cost For One Month of Lighting 15 7 15 1
Total 2043 100 1565 100
A-26
TABLE A-13 NET PRESENT VALUES AND BENEFIT COST RATIOS UNDER ALTERNATIVE ASSUMPTIONS
Assumption 2 Alternative 3 (Benefits in Alter- (Resource Cost of native Use) Soft Coke)
1 Annual Benefits (B) $ 2649 1587
2 Present Value of Benefits Over a 20 Year Life PV (B) $ 25169 15077
3 Annual Operating Costs (C) $ 1565 1565
4 Present Value of Operating Costs PV (C) $ 14869 14869
5 Present Value of Capital Costs PV (I) $ 17292 17292
6 Net Present Value NPV=P(B)-P(C)-P(I) $ 6992 17084
7 Benefit Cost Ratio B P(B)-P(C) C P(I) $ 596 012
Excluding the costs of chaffcutter and thresher machines except the fuel costs which are treated as benefits from the bio-gas plant
Annex B
Electricity Generation from a Village-Scale Biogas Plant
In this case study we-will present some results of the economic analysis
of electricity generation from a village-scale biogas plant It may be
mentioned that the size of the electricity generation equipment in this
village is limited by the availability of cow dung and other animal wastes
in the village since the present technology does not enable the use of
crop residues or water hyacinth as biogas input Based on the availabilshy
ity of 1400 kgs of wet dung per day the gas production in summer has been
calculated as 2760 ft3day ( 196 ft3kg) and in winter as 1900 ft3day
( 136 ft3kg) If it is assumed that a 15 HP dual-fuel engine coupled
with an electricity generator will be used and fuel inputs would be in
the ratio of one-third diesel and two-thirds biogas then the available
quantity of gas can be used to run a 15 HP engine for 12 hoursday during
winter and 175 hoursday during summer
The capital and operating costs of electricity generation are set out
in Table B-1 It may be noted that annualized capital charges account for
a little over 50 percent of the total annual costs Using the figures of
annual electricity generation (implying a load factor of 66 percent) the
unit costs of Llectricity generation from biogas are $00584kwh at market
prices and $0054kwh at shadow prices
For the sake of comparison one can estimate the costs of central
electricity generation from a conventional coal-based thermal power plant
(100-200 IN capacity) in India Average capital costs of generation and
high voltage transmission are assumed at $1000kw while the capital costs
B-2
of distribution lines (LT lines) are estimated at $2000 per kilometer
Assuming a 66 load factor (5880 hoursyear as in biogas unit) 114 kgs of
coalkwh and $20 per ton of coal the average costs of generation and
transmission can be estimated at $0046 per kwh excluding the costs of
LT distribution lines The effect of costs of LT lines on the unit cost
of electricity generation would he site specific and wouPK -pend on the
additional power demand that is served by this LT line If it is assumed
that the extension of the LT line for a distance of one kilometer is
undertaken exclusively for the village where the biogas plant is to be
installed the entire capita cost of $2000 (for a length of one km)
should be attributed to the delivered cost of electricity made available
to this village from a central generating staticn The additional annual
costs on this account are estimated as $00031kwh giving a total cost
of $00494kwh which is somewhat lower than the costs of generation
of $00584kwh at market prices using biogas for electricj2 generation
The costs of central electricity generation would be lower than those for
electricity from biogas unit if the length of distribution (LT) lines is
less than 35 kilometers This shows that under the assumptions outlined
above decentralized electricity generation from biogas will be economic
vis-a-vis central generation based on coal if biogas plant is located
more than 35 kilometers away from the nearest HTLT distribution line
Similar calculations can be made for regionalcentral electricity generation
based on fuel oil or biomass or with hydroelectric power
It is recognized that the above cost estimates as well as load factor
assumptions may have to be modified for other regionscountries However
the above calculations are intended to show the type of economic calculations
B-3
that should be made in order to pr6vide background for the role of
biomass-based electricity generation
Electricity Generation from Biomass Comparative Cost Estimates for 3MW
and 20 MW Units
In this section an attempt is made to illustrate the use of economic
principles involved in estimating costs of electricity generation from
biomass sources especially fuelwood Two examples have been studied
(i) A 3MW unit using fuelwood produced under a Social Forestry type of scheme and meeting the electricity demand of a few villages and
(ii) A 20MW unit using fuelwood from a forest area and catering to the electricity demand of one or two large scale industrial units a few small scale units and agricultural demand of a few villages
Ideally the illustrative economic analysis performed below should be
done in the context of location-specific details about capital costs of
equipment and transmission fuelwood costs 0 amp M costs costs of transshy
portation of fuelwood etc However such information for site-specific
projects in developing countries is not readily available Hence the
calculations made below on the basis of available project reports have to
be considered in the nature of order of magnitude figures and should be
modified for specific projects
The following points may be noted from the data on costs of electricity
generation from fuelwocrdpresented in Tables B-2 and B-3
i) In the case of capital costs per kw the figures used are $1400kw for a 3MW unit and $1361kw for a 20MW unit This does not show any appreciable economies of scale which are known to exist in
B-4
power plants of this range This may be due to differences in sources of data number of items included in capital costs andthe methods of calculation of costs and differences in locationGiven the lack of disag~regation in available data it was notpossible to make these data comparable However these data do indicate order of magnitude figures
One other aspect of cost data that needs to be looked into carefully is the mark-ups of capital costs which are builtinto the estimates of capital costs of imported machinery in adeveloping country For example in this case the cost figureused is $1400kw which may be inclusive of these mark-ups
Cii) The major difference in costs is in terms of fuelwood costs Inthe case of a 3MW plant it is assumed that it will use fuelwoodwhich will be specially grown for this unit in a social forestrytype of scheme This would require diversion of existing landfrom other uses to fuelwood plantations It is generally assumed that marginal land for fuelwood is available free of cost sincethis land would have no alternative economic use for the periodof the project It must be emphasized that this is a very imshyportant assumption since in the case of most of the land-scarcedeveloping countries land may be in current use as pastures or as low-yielding crop land In the case of 2389 hectares of landrequired to produce fuelwood for the 3MW plant it is difficult to assume that such land would be available which has no altershynative economic use Hence it is assumed that land is either being used or can be potentially used to grow low-yielding food crops (or equivalent fodder) giving a cropfodder output of one ton per hectare valued at $200ha This is the figure that has been used in these calculations The costs would be locationshyspecific and would have to be modified in the context of a particular siteproject2
In the case of a 20MW plant which is using fuelwood availableby cutting existing forests the valuation of opportunity cost offuelwood becomes very difficult If wood from the concerned forshyest area could be used for timber or paper industries the opporshytunity cost of this wood be equal to benefit foregone in thesealternative use(s) If however the quality of wood is such that it can be used only as fuelwood the opportunity cost offuelwood has to be estimated in terms of opportunity costs ofinputs used in fuelwood ie land labor and other resources
For example see the FAO case study on Village Fuelwood Plantations inKorea FAO Forestry Paper 17 FAO Rome 1979
2he estimation of opportunity cost of land and other inputs used is a very complex issue and is discussed elsewhere in the report
B-5
The opportunity cost of land would in turn depend on the value added in using this land for growing crops or for growing fodder for livestock The opportunity cost of labor can be estimated in terms c4iits shadow price Since such valuation would require a detailed economic analysis of alternative uses of land labor and other resources it is considered beyond the scope of this case study For the sake of illustration we have used a figureof $20 per ton as the cost of fuel as indicated in the PhilippinesReforestationRural Energy Project cited earlier In addition we have used a transport cost of fuelwood of $5ton in line with the data used in the case of a 3MW unit
(iii) The 0 amp M costs of electricity generation plants have been taken from their individual source reports
The results of the cost estimates in the two cases are presented in
Tables B-I and B-2 The following points about these results may be noted
Ci) The costs for 3MW unit range between 1087 centskwh at market prices to 96 centskwh at shadow prices This difference is mainly on account of shadow wage rate of zero used for unskilled labor for weeding maintenance and transport
(ii) The costs for a 20MW unit are 85 centskwh at market pricesabout 20 percent lower than in the case of a 3MW unit As was pointed out earlier this difference is not on account of economies of scale in capital costs This is arising mainly on account of costs of input which go into fuelwood productionIn the case of a 3MW unit opportunity cost of land was valued as benefit foregone in terms of value of agricultural cropsHowever in the case of the 20MW unit similar estimates were not used and a national figure of $20ton was used reflecting the costs of inputs in fuelwood production
(iii) The costs of electricity from fuelwood in the above examples is considerably higher (40-50 percent) than the cost of electrictiy from biogas in the earlier example Although capital costs andother assumptions are not strictly comparable and an analysis for a site-specific case should be done the above results do indicate the need for a careful comparison of available alternatives
B-6
TABLE B-I COSTS OF ELECTRICITaY GENERATION FROM A VILLAGE-SCALE BI(GAS PLANT
Market Prices Shadow Prices
A Capital Costs
15 hp generator set 4560 4190civil works for 1000 884distribution cost 900 800Biogas plants 12233 10697
18693 16571
B Annualized Capital Charges at 10 discount rate 1869 1657
C OampM Costs
Fuel costs (including lube oil)1 10811081 generator maintenance 420 376(including biogas maintenance) 1457150
D Annual Costs (BampC) 3370 3114
E Annual electricitygeneration (kwh) 57685 57685
F Cost of electricity generation $00584kwh $00540kwh
iGas Production 2760 ft3day during Sunmer (March-October) 1900 ft3day in Winter (November-February) due to lower output of gas per kg of cow dung
2Summer operation 210 days at 175 hoursday producers 41400 kwh Winter operation 120 days at 12 hoursday produces 16285 kwh
(Enginegenerator capacity 15 hp Gas consumption 14 cftkwh)
DieselPrice - 025 $liter 005 literhp-hr (diesel consumption)Lube Oil Price shy 0375 $liter 0017 literhp-hr (lube oil consumption)
B-7
TABLE B-2 COSTS OF-ELECTRICITY GENERATION FROM FUELWOOD 3MW PLANT
Market Prices Shadow Prices
A Capital Cost
$1400kw $ 42 million $ 495 million
B Annualized Capital Cost $ 042 million $ 0495 million
(at 10 discount rate)
C 0 and M Costs
Fuelwood Costs
Opportunity Cost of Land $ 477800 $ 477800 ($200ha for 2389 ha)
Labour Costs $ 143340 0 ($60ha)
Transportation of Fuelwood $ 95550 $ 38220 ($5 - $2ton)
Operation and Maintenance of
the Plant $ 6517 $ 1997
D Total Annualized Cost (C + B) $ 11428 million $1013017
E Annual Electricity Generation $10512 million $10512 million (kwhr)
F Overall Cost $kwhr $ 01087 $ 0096
SOURCE ReforestationRural Energy Project for Phillippines USAID ProjectPaper July 1980 and Survey of Rural Energy Consumption in Northern India by NCAER (1978)
ASSUMPTIONS
1 Foreign exchange is given a premium of 25 under shadow prices while unskilled labor is valued at zero
2 Wood production 8 tonshayear 6000 Btulb of wood load factor 40 system efficiency 151
3 It has been assumed that benefit foregone from land used for fuelwood is one ton per hectare of food grains valued at $200ton
B-8
TABLE B-3 COST OF ELECTRICITY GENERATION FUELWOOD 20MW PLANT
(Million $)
Market Prices Shadow Prices
A Capital Costs
$(136kw) $ 2722 $ 3222
B Annualized Costs at 10 $ 272 $ 3222
C 0 and M Costs
1 Input Costs for Fuelwood Production (excluding Land) $20ton $ 2548 $ 2548
2 Opportunity Cost of Land
3 Transportation Costs of Fuelwood ($5 - $2ton) $ 0637 $ 0254
o2peration and Maintenance of the Plant $043 $ 0013
D Total Annual Cost (B + C) $ 5948 $ 6037
E Annual Electricity Generated $ 7008 $ 7008 (kw-hr)
F CostKw-hr (DE) $ 0085 $ 0086
Discussed separately in the text
SOURCE Data obtained from North-West Pacific Corporation Seattle USA for a unit in Oak Ridge USA on load factor
ASSUMPTIONS
1 System utilization 40 system efficiency 15
WOOD PRODUCTION
127400 tons from 15900 hectares assuming 8 tonshayr and 6000 Btulb Shadow price of unskilled labor zero 25 premium on Foreign exshychange in capital cost
Annex C
stimates of Calorific Value Parameter
In this appendix we descri[ the various estimates of values of
important parameters used in different studies The objective of this
note is to show that the available information is rather inadequate
on crucial parameters which determine the social profitability of biogas
plants The estimates of the following parameters are discussed
calorific value of biogas efficiency of biogas utilization calorific
value of soft coke and its utilization efficiency calorific value of
cow dung cake and its utilization
Calorific Values of Gas
The fuel value of biogas is directly proportional to the amount
of the methane it contains since other gases (carbon dioxide hydrogen
nitrogen) are not combustible Most of the studies assume a thermal
value of biogas instead of indicating how much combustible methane is
in the gas ICAR (1976) has quoted fzcm a paper by Biswas (1974) saying
that the appropriate composition (by volume) of the gas evolved from
a cow dung gas plant is as follows Methane 50-60 Carbon dioxide 30-40
hydrogen 5-10 and nitrogen 4-6 The gas burns with a smokeless blue
flame and has a calorific value of 550 BTUs per ft3 or 135 kilocalories
-3 per ft
1 On an average methane has a fuel value of 950-1050 BTUs (BritishThermal Units) per cubic foot (cft or ft3 ) If the biogas contains 60 percent methane its value will be between 570-630 BTUs (One BTU is the amount of heat required to raise the temperature of onepound of water by 10 F at STP)
-171shy
C-2
No experimental data has been reported in the paper indicating calorific
value of biogas actually obtained from the plant
Parikh (1976) has also accepted the assumption of 135 kcal per
ft NCAER (1965) have assumed a methane content of 60 percent implying
a calorific value of 575 BTUcft or 141 kcal per ft3 KVIC (1975) says
that gobar gas consists of approximately 55 percent methane and 45
percent carbon dioxide
Sathianathan (1975) has pointed out that compared with other gases
biogas has very low fuel value though like most other gases the efficiency
is 60 percent He has indicated a range for fuel value of biogas as
540-700 BTUs per ct3 as against the ft3 the fuel value of 2900-3400 BTUs per
ft3 for butane He has quoted J Patel who gives the following calorific
values for the various compositions of digestion gas
Net Calorifi9S No Proportion Value per ft
CH4 H2 CO2 (Methane) (Hydrogen) (Carbon dioxide) BTU Kcal
1 60 10 30 5792 145
2 50 10 40 4922 124
3 45 10 45 4412 110
4 40 10 50 3592 90
5 35 10 55 3492 87
It is not very clear if these values have been estimated from some exshy
perimental data or these are just hypothetical estimates He has also
mentioned that in many so-called family plants about half of the total
C-3
gas produced is carbon dioxide and sometimes its proportion is even
higher This would imply a 40 percent methane ratio giving a calorific
value of 359 BTUs (90 Kcal) per ft3 Bhavani (1976) has calculated
a median value of the figures given by Sathianathan and used a calorific
value of 1112 kcalft3 Harrington (1977) has noted that calorific
values range between 87 and 145 kcalft3 and pointed out that an assumption
of 135 kcalft3 would imply rather good digestion conditions
Efficiency of Gas Utilization
Regarding the efficiency of gas utilization no estimates of actual
utilization are available Alnost all the studies have assumed a 60
percent thermal efficiency KVIC (1975) indicates that special burners
developed by the Commission have to be used to get 60 percent efficiency
It has also pointed out that if coal gas or Burshane burners are used
for gobar gas the efficiency is very low (35 percent instead of 60 pershy
cent) NCAER (1965 p 114) gives results of two experiments on fuel
efficiency in which the calorific value of gas is taken as 473 BTU (or
118 kcal) per ft3 and utilization efficiency ranges between 548 percent
and 559 percent In view of lack of reliable data on the actual efficiency
of utilization with the burners being used currently it is difficult
to accept the assumed value of 60 percent However we have not changed
the value of this parameters in our sensitivity analysis Instead
we have assumed an effective heat utilization of 70 kcalft 3 in one
which may be obtained by a number of combinations such as 1177 kcalft3
with 60 percent efficiency or 1208 kcalft3 with 55 percent efficiency
and so on
C-4
Calorific Value of Soft Coke and the Efficiency of Utilization
KVIC (1975 p 13) has used a calorific value of 6292 kilocalories
per kilogram The Commission has not indicated any source for these figires
It has indicated a thermal efficiency of 28 percent NCAER (1965 p 112)
has quoted figures for efficiency of various appliances as per experiments in
Shri Ram Research Institute New Delhi Out of the ten experiments conducted
on soft coke the calorific value in nine experiments was taken as 6297 kcalkg
(or calgms) The percentage of heat utilized in eight out of ten experiments
ranged between 222 percent and 287 percent Parikh (1976) has also used a
figure of 28 percent efficiency of coal burning However NCAER (1965 p 110)
has given the following figures one tonne soft coke heat content of 5772000
kilocalories (ie 5772 kcalkg) and the efficiency of utilization in domestic
oven is 177 percent These figures are also in line with those used in the Reshy
-ort of the Energy Survey Committee of India submitted in 1965 On account of
the significant variations in these two estimates we have used the first estimate
in our Reference Results and the second estimate (lower figures) in our
sensitivity analysis
Calorific Value of Cow Dung Cakes and Efficiency of Utilization
KVIC (1975 p i3) has assumed that the calorific value of cow dung cakes
is 2092 kcalkg and the efficiency of utilization in open chulah is 11 percent
NCAER (1975 p 114) uses a figure of 2130 kcalkg and gives efficiency figures
of 107 and 101 percent In its conversion factors given on p 110 NCAER (1965)
gives a value of 2440 kcalkg and 112 efficiency of utilizations Parikh
(1976 p 98) has given a calorific value of 3300 kcal per kg (dry weight) for
dung cakes and burning efficiency of 11 percent
C-5
It may be seen from the above discussion that there is need to conduct
experiments under different field conditions and standardize the values of
these parameters for various regions in the country
In addition the calorific content of other energy sources are as
follows
plant residue = 3800 kcalkg at 17 efficiency = 646 kcalkg
fuel wood = 4702 kcalkg at 137 efficiency = 6442 kcalkg
kerosene = 11110 kcalkg or 7936 kcallitre at 217 = 1720 kcallitre
The other assumptions made in the paper are summarized below
1 Daily dung production rates by type of animal by household
category
cowbullock 1273 kg (small category)
12 7 kg (medium category)
1275 kg (large category)
buffalo 1845 kg (small category
1442 kg (medium category)
1843 kg (large category)
young cattle 9 kg (small category)
9 kg (medium category)
75 kg (large category)
2 Gas requirements per operation
cooking burner 95 cfthour
to fill water tank 66 cftday
tubewell irrigation 534 cft for first hour of day 60 cfthour
rest of day
flour milling threshing and chaff cutting each 15 cftHPhour
generator 15 cftHPhour
gas lamps 45 cftlamphour
C-6
3 Gas production from a combined capacity of 35m3 plant and 45m3
plant
summer ccnversion rate =
winter conversion rate =
4 1 kg dry dung = 5 kg wet
5 Nitrogen content of dung
196 cftkgday
136 cftkgday
dung
N content = 1 per kg of wet dung (since it is used after being
dried in the open)
6 1 litre kerosene = 2 kwathrs of lighting
7 Costs (including transportation)
net import cost of nitrogen = Rs 54kg
net import cost of urea = Rs 2kg
price of fuel wood in small towns = Rs 25kg
cost of soft coke = Rs 135kg
cost of kerosene = Rs 2litre
Table of Contents
Economic Evaluation of Non-Conventional Energy Alternative An Overview i
I Introduction 1
II Social Benefit Cost Analysis 7
1 Social Benefit Cost Analysis An Overview 7 2 UNIDO and Little-Mirrlees Approaches to
Project Evaluation A Comparative Analysis 28 3 The Limits to Project Level Analysis -- Linkage
to Subsector (Industry) and Sector and Intersector Level Analysis 33
4 A Brief Review of Recent Contributions 40
III Technological Alternatives and Efficiency in Energy Use 41
1 Choice of Technology 42 2 Efficiency 47
IV Case Studies in Evaluation of Non-conventional Energy Technologies 56
1 Social Benefit Cost Analysis of a Family Biogas Plant 62
2 Rural Energy SystnmsSample Analysis of Irrigation Plans 76
V Annotated Biblioaraphv on Social Benefit Cost Analysis and Energy Planning135
i eneral Biblicqr5 162
Annexes
A Economic Evaluation of a Village Level Community Biogas Plant A-1
B Electricity Generation from Biomass B-1 C Appendix to Section IV Estimation of
Calorific Value Parameers C-1
Economic Evaluation of Non-Conventional Energy Alternatives An Overview
1 The economic evaluation of biomass-based renewable energy
technologies would consist of the following three steps
(a) Financial analysis using market prices for inputs
and outputs
(b) Economic analysis in which market prices are replaced
by shadow prices (or accounting prices) which
reflect the real value of outputs to the society
and real resource costs of inputs to the society
The objective used in this analysis is the economshy
ically efficient allocation of resources
(c) A comprehensive social benefit cost analysis which
includes secondary benefits and indirect costs as
well as incorporates the social objectives of
employment income distribution and regional
development This analysis differs from (b) in
that policy objectives other than economic
efficiency are taken into account
2 The financial analysis of a renewable energy project would use
available market prices andor projected market prices for valuation of
outputs and inputs However in developing countries the markets for
The soecific details of these st-s are detailed in thc reorts iisshycussed in Section VA of the main report te ncia hic]iohv
commodities such as biogas fuelwood cow dung organic manure etc
may not exist In such situations market prices for their substitutes
such as kerosene charcoalsoftcoke or commercial fertilizers may be
used after making suitable adjustments The value of direct outputs
and inputs during the life of the project can then be discounted to the
present by using the market interest rate The available decision
criteria of Net Present Value Benefit Cost Ratio and Internal Rate
of Return cn be used to select or rank the project in hand
3 In many developing countries market prices do not represent
the real value (resource cost of an output or input to the society)
on account cf various distortions as a result of taxessubsidies
government controls and income distribution For example price of
kerosene or softcoke used in rural areas may be subsidized for political
reasons while gasoline in urban areas may be taxed for the same reasons
Minimum wage regulations may result in market wages being higher than
the real cost of unskilled labor determined by demand and supply
conditions Similarly foreign exchange market may be regulated by the
government and hence tne official exchange rate may be lower than the
real value of foreign exchange to the society Besides imperfections
in the capital market may result in a multiplicity of distorted interest
rates in the market
4 Due to these and th r c-tortions in factnr markets
and commodity markets it has been suggested c-at in ie-ecz2nzcountries
benefits and costs of a project should be calculated usina shadow
-iiishy
prices (or accounting prices) in place of market prices These shadow
prices would reflect the true value or cost of these outputs and
inputs to the society so that a consistent method of comparison and
ranking of various projects can be used
5 Although the need for using shadow prices in place of market
prices is recognized by many developing countries as well as intershy
national aid agencies there are only a few countries where consistent
estimates of these prices have been made The potential sources for
shadow prices in different countries include the National Economic
Planning Units the National Central Banks international lending
agencies such as the IBRD ADB and the Inter-American Development Bank
UN agencies such as FAO and UNDP and international aid agencies such
as AID and ODA Wherever such numbers are obtained it is always
advisable to review them with the appropriate ministries in the
country concerned
A review of some of the efforts made at estimating shadow prices
in India Ghana Colombia Ivory Coast and Korea are present in
Section 3B the annotated bibliography in the main report
6 In the absence of any available estimates for various shadow
prices the following approximate values or range of values are
suggested below for use in evaluating a renewable energy project
However it must be kept in mind that sensitivity analysis of the
Besides there are alternative theoretical aprnAches available for estimation of these shadow prices Section II pp 8-1t)
-ivshy
project to these parameters should be performed to determine which
parameters need detailed studies
(a) Shadow wage rate Shadow wage rates should be used
for unskilled labor employed in the project over
different seasons For the sake of convenience two
seasons may be distinguished a busy season for
agriculturalforest related activities and a slack
season during which there is relatively very little
employment available Since shadow wage rate would
also depend on the extent of unemployment of unshy
skilled labor it may be useful to divide the country
region on this basis also As an approximation the
following values for shadow wages may be used (i)
In areas of chronic unemployment during slack season
a shadow wage equal to one-fourth (25) of market
wage may be used (ii) In areas of chronic unemployment
during agricultural peak season a shadow wage equal
to one-half (50) of market wage may be used (iii)
In areas of relatively lower unemployment during slack
season a shadow wage equal to three-fourths (75) of
market wage may be used and (iv) In areas where unshy
eiployment levels are relatively low a shadow wage
eaual to market wage during the peak season of agrishy
cultural or forest related activities may be used
(b) Shadow Foreign Exchange It may be correct to assume
that shadow exchange rate would be higher than the
official exchange rate in most developing countries
However the extent of premium to be used would vary
from country to country and from one period to the
other As an approximation if the country concerned
is not experiencing very serious balance of payments
difficulties it is suggested that a shadow price
which is 25 higher than the official rate may be
used In countries which have serious foreign
exchange problems (reflected in low exchange reserves)
a shadow price which is 50 higher than the official
price may be used
Shadow Price of Land Using a correct shadow price of land may
be very important for renewable energy projects especially those
concerned with social forestry scheme or charcoal production In
general the shadow price of land should be equated vo the opportunity
cost of land The opportunity cost of land may be calculated on the
basis of benefits foregone in the alternative use of this land The
benefits foregone may relate to the existing or potential uses of land
for agricultural forest pasture or other industrial uses As an
approximation one can use the benefit foregone in terms of the value
(as shadow Prices) of agricultural commodities which could be grown on
the Piece of land durina the life time of the -roIect The simplest
method may be to assume that one rain-fed foodgrain croc could be
-vishy
potentially grown on this land if not diverted to the project in question
It is recognized that opportunity cost of land can be very project
specific and a lot of subjective judgement may be involved However
it is better to indicate the range of relevant values than to use the
convenient value of zero as the opportunity cost of land
Sociai Rate of Discount and Opportunity Cost of Capital There
are different viewpoints with regard to use of social rate of discount
for projects One approach uses a low social rate of discount along
with a shadow price of investment Another approach uses a relatively
higher rate of discount (Section II p 12) For practical purposes
it would be appropriate to use a range of values 8 10 and 12 for
discounLing without making any adjustments for shadow price of investshy
ment Since estimating opportunity cost of capital is a rather complex
matter in developing countries using a range of values would be
appropriate If a project is found to be sensitive to the rate of
discount ie the choices switch with higher discount rate it may be
necessary to do a detailed analysis of opportunity cost of capital in
that country
Commodity Prices The first correction required is for taxes and
subsidies -- since these are only transfer payments and do not represent
use of real resources If an inputoutput is taxed the tax component
should be removed while using the price for valuation of benefits
In this discussion the discount rates refer to an analysis in constant value The effects of inflation are discounted rior to the calculashytion of these discount rates
-viishy
costs Similarly the element of subsidy should be added to the price
o7 inputoutput concerned
Even after corrections for taxessubsidies the inputoutput prices
may not reflect their opportunity costsvalues For tradable commodities
the relevant exportimport price adjusted for shadow exchange rate should
be used It is necessary to determine whether a commodity is imported
or exported at the margin For example if kerosene (or crude oil
which yields kerosene) is imported (or importable) at the margin the
shadow price to be used will be cif price of kerosene multiplied by
the premium (25 or 50) on foreign exchange However if steel or
cement are exported (or exportable) at the margin the shadow price
would be equal to fob price multiplied by premium on foreign exchange
In the case of non-tradables (electricif-l transport etc) an
attempt should be made to express the costs of non-tradables in terms
of those of tradables For exampie the costs of hydro-electricity may
be expressed in terms of the costs of thermal electricity based on
tradables such as fuel oil or natural gas
7 It should be noted that the above corrections would require
breakdown of costs and benefits into different categories of labor by
season and different materials (steel cement oil products fertilizers
etc) Besides it is important to take a view of the future trends
in the composition of these costs and the prices of various inputs
and outputs This may require a lot of effort on the part of the
analyst However if the benefits and costs have to be viewed from
the perspective of the society (and not frcm the perspective of a
-viiishy
consumerfarmer) this type of data collection and adjustment may be
necessary
8 After the corrections for distortions in factor and commodity
markets have been used in valuation of benefits and costs it may be
necessary to incorporate indirect benefitscosts and other social
objectives of development For example in the case of biogas units
health benefits from cleaner fuel better sanitation better lighting
and the convenience of cooking may have to be evaluated Similarly
the indirect (or secondary) benefits of social forestry projects may
be obtained in terms of control of soil erosion better environmental
conditions and more ground water However if indirect benefits are
added indirect costs of depriving the poorer sections of free cow
dung or free pasture land should also be included on the cost side
9 Since different projects may have different implications on
local employment income distribution among households and regional
development it may be necessary to incorporate these objectives
explicitly into the analysis One of the ways is to put explicit
weights on benefits going to poor households and backward regions
It is suggested that a premium of 10 to 20 may be attached for the
ratio of benefits going to poor householdsregions Since shadow
wage rate for unskilled labor may have been already used it may not be
necessary to put explicit weightage on employment created by the croject
Similarly the preference for the use of indigenous resources vis-ashy
vis importable (or exortable) resources would be reflected through
shadow exchange rate However an explicit premium on the use of local
-ixshy
resources and security and certainty of supplies may be incorporated in
the analysis
10 Even if all the information is available it may not be easy
to estimate the benefits and costs from the societys viewpoint on
account of tle special problems of quantification and valuation in
renewable energy technologies A variety of such problems are illustrated
through the four case studies hich are presented in Section IV and
Annexes A and B It should be recognized that in addition to a wide
variety of information at project and nationalregion levels economic
evaluation would require considerable judgement on the part of the
analyst Thus the quality of economic evaluation of biomass-based
renewable energy technologies would depend as much on the analyst as
on the data base used for analysis
Sample Application
It may be useful to recapitulate the above points by providing a
sample check-list of parameters on which data may have to be obtained for
a village fuelwood plantations project This checklist is based on a
FAO case study of village fuelwood plantations in Korea As a detailed
review of this case study is also available in Section V B an annotated
bibliography
The main parameters on which data are required are as follows
Scone and Technical Specifications
Planting sites and coverage
Type of species and planting
Maintenance and organization
2 Project Costs
Shadow Price of Land
Shadow Wage Rate for Unskilled Labor in Different Seasons
Shadow Price of Foreign Exchange
Costs of Materials (Fertilizers Seedlings)
Costs of Transport
Costs of Supervision and Management
3 Project Output and Benefits
Quantification of Fuelwood ProductionYield
Shadow Price of Fuelwood in terms of value of fuels that it
would replace (eg crop residues coal or kerosene)
Reduction in Soil Erosion and Flood Damages
Improvement of Environment and Weather
Groundwater Quality and Quality
4 Comparing Costs and Benefits
Social Rate of Discount
Decision Criteria NPV BC Ratio and IRR
5 Sensitivity Analysis
Relevant of Shadow Prices of Land and Labor
Range of Social Rate of Discount
Panae for Yield of Fuelwood
Range for Shadow Price of Fuelwood (or substitutes)
-xi-
Although the Korean case study referred to above provides a good
format for carrying out similar studies one must keep in mind some
of its limitations It should have spent more effort on estimation
of shadow prices of land labor and fuelwood
The study has assumed that land under the project would have no
alternative economic use for the period of the project and therefore
land is valued at zero It is inconceivable that an area of 127000
hectares can be found which has no potential alternative economic
use in the next twenty years Hence it may be necessary to estimate
the opportunity cost of land in terms of benefits foregone
The opportunity cost of unskilled labor is calculated on the basis
of average earnings of self-employed workers during November-March
This does not seem to be satisfactory since it is not clear as to how
many people in the region can earn the amount used as opportunity cost
of labor during the entire period If many workers remain unemployed
or earn less than the average earnings a lower shadow wage rate should
be used
Similarly the valuation of fuelwood is arbitrary It is mentioned
that since fuelwood is not traded at present the fuelwood has been
valued in terms of the value of fuels that it would replace handy
agricultural residues and coal Although the methodology used is
correct the prices of alternative fuels used are arbitrary The
entire economics of the project would be very different if prices other
than those assumed in the report are used
-xii-
The Korean case study furthermore does not attempt to quantify and
value the indirect (secondary and tertiary) benefits of fuelwood
plantation projects which accrue to the society in terms of a reduction
in soil erosion and flood damages and an improvement in quantity and
quality of groundwater As some research work on these aspects is
underway in India Nepal and the Philippines it should be possible
to incorporate these benefits in the economic evaluation of similar
projects in the future
Section I
INTRODUCTION
The economic viability and social profitability of a renewable
energy technology or a program are necessary conditions for success
A consumer will not invest in an improved stove or a biogas unit if
this is not considered a financially viable proposition Similarly
a project or a program would have to be shown socially profitable
before substantial subsidaries may be given to individual users or
large scale public investments may be committed Social Benefit
Cost Analysis (SBCA) has traditionally been used as a method of
selection andor ranking of projects
An overview of the salient features of this methodology is
presented here as a background to illustrate the complex problems of
economic evaluation of renewable energy technologies Briefly an
economic evaluation of a project would consist of the following steps
(i) calculating the financial viability of the project when benefits and costs are valued at market prices and market interest rate is used for the opportunity cost of capital
(ii) making corrections in financial costs and benefits by eliminating taxes and subsidiaries which are treated as transfer payments and do not reflect real resource costs
(iii) recognizing the distortions in market prices on account of price and quantity controls minimum wage regulations imperfect capital markets and regulations of trade and foreign exchange by the government and hence replacing the market prices by accounting prices or shadow prices which reflect the real values of inputs and outputs of each project
-2shy
(iv) incorporating considerations of income distribution regional development and employment through explicit weights on these objectives and
(v) calculating the social profitability of the project by using appropriate values of social rate of disshycount and shadow price of investment to estimate Net Present Value Benefit Cost Ratio and the Internal Rate of Return
Although these components of social benefit cost analysis are
known and many governments wish to use these for economic evaluation
of projects it is common to find that not much effort has been made
to estimate a consistent set of values for national and regional
parameters such as social rate of discount shadow price of investment
shadow price of foreign exchange shadow wage rates for various labor
categories over various seasons in different regions and shadow prices
of many other inputs (eg electricity cement goods transport)
Thus as a part of (or rather a prelude to) doing an economic evaluashy
tion of non-conventional energy sources one has to estimate values
of parameters such as social rate of discount as well as various
shadow prices listed above Although this takes the evaluator much
beyond the scope of his work such estimates acceptable to the
planners of the country as well as to others concerned with the
project are prerequisite to the evaluation of the project under
consideration Similarly considerations of income distribution
regional development and employment are rarely included in actual
analyses of any projects (not just non-conventional energy projects)
on account of difficulties of measurement andor problems of finding
acceptable or desirable weights on these objectives Hence such
-3shy
social considerations have to be explicitly included as an important
component of the economic evaluation of non-conventional energy sources
The economic evaluation becomes particularly complex in the case
of non-conventional energy sources in developing countries because
of the following reasons
(i) In many cases valuation of benefits and costs cannot be done at market prices since markets for major outshyputs and inputs may not exist For example in evaluating the benefits from a biogas plant willingshyness to pay of the consumers cannot be measured since it has not been expressed in a market place At the same time the costs of major input such as cow dung cannot be expressed in monetary terms since cow dung is usually not bought and sold in the market Hence the usual methods of evaluation at market prices break down in such cases
(ii) Not only are there no markets for major outputs and inputs it is also difficult to estimate the value of substitutes or opportunity costs of resources used in producing inputs In the same example of biogas plant the benefit of biogas could be estimated indirectly in terms of the value of commodities for which biogas is used as a substitute If biogas is used mainly for lighting or running an engine the benefits can be estimated in terms of the value of kerosene and diesel oil saved However if biogas is used for cooking and replaces fuelwood or dungcakes (not kerosene) valuation of gas becomes rather difficult since neither fuelwood nor dungcakes might have been purchased in the market The situation becomes further complicated if one tries to estimate the cost of labor input that goes into collection of fuelwood andor dungcakes If these fuel sources are collected by men women and children in their spare time it would not be correct to value their time at the going market wage rate which may be relevant only for the peak agricultural season This would require estimating the cost of using leisure time for these activities and would become rather subjective Valuation of other inputs such as land in terms of opportunity costs is equally difficult For example it may be very difficult to estimate the opportunity cost of land in growing sugarcane which in turn is used for producing fuel alcohol
-4-
The opportunity cost of land would be equal to zero if it is not being currently used and does not have other potential uses It would be equal to the value of benefits foregone if diversion of land to sugarshycane reduces agricultural output milk output andor draft power Similar issues become important while evaluating the benefits and costs of fuelwood plantation6 improved charcoal production or improved stoves
(iii) It is important to realize that introduction of an energy technology will alter a multitude of resource flows on account of interdependent use patterns of different resources in the rural setup More specifishycally each technological option has different impacts on various economic groups such as small farmers or landless laborers and hence such income distribution issues would have to be incorporated in the evaluation of each alternative Besides various groups in rural areas have differential access to and ownership of resources such as land labor trees cattle and investshyment funds as is also the case with political power Since successful adoption of an energy technology depends on the access to these resources it is important to consider these issues explicitly1
In the case of non-conventional energy technologies there are also some special types of uncertainties In many cases the cost and performance characteristics of many of these technologies are not known to the same degree of accuracy (and confidence) as in the case of conventional technologies The examples in this category are gasifiers gas engines and Stirling engines of appropriate sizes
Whenever costs and performance characteristics are known as in the case of biogas plants these may be rather site-specific and hence cannot be projected fcr other regionsconditions with the same level of confidence This gives rise to the problem of estimating the various levels of reliability and availability of these technologies This introduces an element of subjective judgement when these nonshyconventional Lechnologies are compared with convenshytional technologies (such as diesel engines)
IThe importance of understanding these interrelations and the significance of analyzing the processes of generation and use of energy in rural areas have been discussed in Briscoe (1979) deLucia and Tabors in deLucia Jacobv et al (1980) and Bhatia (1980)
-5-
These complexities and the various means of dealing with them
are the principal focus of the remaining sections of this report
Organization of the Report
This report is divided into the following sections Section II
presents a brief review of the recent contributions to the methodology
of social benefit cost analysis In Section III a discussion of
various issues connected with range of technical alternatives technoshy
economic aspects of scale and reliability and measurement of efficiency
is presented
In view of the special problems and issues in economic evaluation
of non-conventional energy sources as discussed earlier major
principles involved in quantification and valuation of benefits and
costs have been illustrated through a set of case studies Section IV
and the Annexes present the following case studies
(i) The focus of the first case study on social benefit
cost analysis of a biogas plant is on quantification and
valuation of benefits
(ii) The second study is an economic analysis of various
irrigation systems which can use alternative energy
sources for pumping of water The emphases in this case
study are on defining the range of available technical
alternatives and evaluating their uncertainties via
sensitivity analysis of the various parameter values
-6shy
(iii) The first Annex is a social cost benefit analysis of
a community biogas plant It focusses on quantification
and valuation of benefits and should be considered with
the first case study to compare the relative advantages
and disadvantages of the two schemes
(iv) The study in Annex 2 demonstrates the problems of
estimating the economic costs or resource costs
of generating electricity from a village-scale biogas plant
Considered are a 2 MW unit fuelwood grown under a social
forestry scheme and a 20 MW unit based on fuelwood (from
existing forests) and supplying electricity to a large
number of village and small-town households and industries
Finally Section V provides an annotated bibliography on social
benefit cost analysis and energy planning
Section II
SOCIAL BENEFIT COST ANALYSIS
This section provides an overview of social benefit cost analysis
The first part focuses upon methodology and the economic principles
underlying the methodology (although it does not fully explore the
various theoretical issues involved) The second part is a comparative
analysis of the UNIDO and the Little-Mirrlees approaches to project
evaluation Part three is a brief literature review which provides
the interested reader with a means to become aquainted with some of
the more important works in the field1
II1 Social Benefit Cost Analysis An Overview
The following is an outline of social benefit cost analysis
As outlined in the Guide to Practical Project Appraisal (1978)
the UNIDO method of project appraisal can be broken down into the
following five stages each of which leads toward a measure of the
social benefit of the project
(i) Calculation of financial profitability at market prices
(ii) Shadow pricing of input-output to obtain the net benefit at economic (efficiency) prices
(iii) Adjustment for the projects impact on savings and investshyments
(iv) Adjustment for the projects impact on income distribushy
tion and
(v) Adjustment for the projects production of goods whose social values are less than cr areater than their
These z - l3 grahv It may also -e mz iore a_trgt_ e
c rTh
n n o
Studies and
cli-r_ and nncar T--zd cIrresT
i =__ ti ht Lirle
-8-
A good technical and financial analysis of a project is required
before a meaningful economic evaluation can be made The analysis
should use available market prices andor projected market prices
for valuation of the inputs and outputs Where markets do not exist
(ie for commodities such as cow dung or fuel wood) prices of substitute
material (perhaps kerosene or charcoal softcoke) should be used The
value of direct outputs and inputs during the life of the project can
then be discounted to the present by using the market discount rate
The available dcision criteria of Net Present Value Benefit Cost Ratio
and Internal Rate of Return can be used to select or rank the project
Since market prices in developing countries are distorted in the
sense that these do not reflect the relative scarcity values of various 1
goods and services the economic-benefit analysis requires that inputs
and outputs are assigned their efficiency shadow prices Theoretically
all shadow prices should be derived from a comprehensive mathematical
model of the economy However in practice simultaneous application
of the following two criteria have been suggested for selective shadow
pricing (a) which resources figure most prominently in the benefits
and costs of the project at market prices and (b) For all resources
involved in the F--oject which market prices are farthest out of line
with their respective shadow prices The most obvious candidates for
shadow pricing are (a) main outouts if these are oftent sold at protected
Jtrices (b) inr ort=hbe materials which mav
In a perfect narki- s-azc r for any resource oampd i-s
market tri e - in the real A-orle mar i-rrections such as tariffs auctas restrictions and monorclies create d-stortions _n demZnd - e is i tl ch a 7r ef -- - i _ e cnr4~m i v a l a n d o f - -n n s u r11_ s
produced under substantial protecion or may be imported at high customs
duties (c) major non-imported material inputs which may involve signifshy
icant tradable material content and (d) unskilled labour whose market
wage often exceeds its shadow wage
Since goods which are imported or exported at the margin may
constitute a substantial component of the project it may become
necessary to evaluate the foreign exchange impact of the project so
that an adjustment can be made by an appropriate premium assuming that
foreign exchange is more valuable than indicatm-d by the official exchange
rate This adjustment may require estimation of shadow price of foreign
exchange in the present as well as over time and the foreign exchange
(direct and indirect) content of inputs over time
In order to measure the impact of a project on savings and consumpshy
tion it becomes necessary to determine the distribution of income by
different income groups and use their corresponding marginal propenshy
sities to save If the present level of savings is considered less than
optimal the planners may place a premium on the additional savings the
project will induce by its impact on income distribution This could
be done by an adjustment factor which may be calculated by the planners
on the basis of a subjective valuation of the difficulty the country
has in raisina the capital ruid r its investment programme The
net imact on savings and the ipremium on savinas (or shadow price of
investment) may be of vital consideration in the choice between a
capital intensive and labour-intensive project or between different
desins of the same rroject
If it is considered that income going to some groups and some
regions is more valuable than that going to others from the point of
view of income distribution it becomes necessary to use adjustment
factors that reflect these differential values This may require giving
explicit weights that reflect the percentage premium (or penalty)
attached by society to income flows to groups below or above some refshy
erence level of income For example the benefits of a project going
to people with income less than $100 per month may be given a premium
which would increase the net benefits of the project thus improving
its chances of selection These distributional adjustment factors may
be determined as implicit weights from the projects that have been
accepted or rejected by the planners or through an elaborate formula
using various values of the elasticity of maiginal utility of income
However the value placed on the income distribution objective through
project selection has to be examined carefully and applied uniformly so
that a better appreciation of the alternatives in terms of broader social
objectives may be obtained
Where the products of a project are valued at greater or less than
their economic value they are considered to be merit or demerit
goods and can be weighted to reflect their relative social value For
example goods such as food or energy that meet basic needs may be
adjusted upward in value Luxury goods such as tobacco or alcohol may
be adjusted downward in value The procedure is quite similar to that
of regional or income redistribution weight in fact one ofzen has a
-11shy
choice of using merit weights or income weights to accomplish the same
adjustment (and must therefore take care to avoid double-counting)
Generally merit weights have a more explicit impact and are accordingly
easier to apply and interpret
Estimation of Key National and Regional Parameters
The above discussion suggests that for a social benefit cost analysis
of a non-conventional energy project one needs the values or reasonable
estimates of the following nationalregional parameters (i) Social Rate
of Discount (ii) Shadow Price of Labour (in some cases for different
categories by season and by region) (iii) Shadow Foreign Exchange Rate
(iv) Shadow Price of Investment (Savings) (v) Income Distribution
Weights (which may also take account of regional income differentials)
In many cases the estimates of these parameter values are specified by
the nationalregional planning agencies and the project authorities have
to use these values on a uniform basis However in the ibsence of any
officially specified values for the variables mentioned above efforts
may have to be made to estimate these for individual countries The
principles involved in estimation of these nationalregional parameters
-re adiscuss-e beJcw
1Th is beyond the score cf this t3 outline the methodolccog f estimation of these parameters for a given country A few studies cn estimation of these parameters notably those by Mishra and Beyer (1976 Appendix III) for India Roemer and Stern (1975) for Ghana and World Bank (1975) for Ivory Coast World Bank (1979) for Colombia and FAO 1_-9) for Korea have been a---17 --ooiai- -_ ashy
-12shy
(i) Social Rate of Discount As discussed earlier benefits and
costs occur at different time periods in the life of the project Beneshy
fits received and costs incurred in different years have different values
for the society since present consumption would be preferred over future
consumption For a comparison of aggregate benefits of the project with
aggregate costs it would be necessary to discount the benefits and costs
of different periods to a given year say the initial year of the project
The present value of a projects benefits and costs will depend very much
on the magnitude of the social rate of discount A higher social rate of
discount will reduce the net present value of a project and a lower rate
will increase it Hence the choice of an appropriate social rate of
discount is of vital significance especially when projects with long
gestation periods are being considered
Conceptually the social rate of discount can be defined as the
marginal rate of substitution between consumption at consecutive points
of time It reflects the weight that the society puts on future conshy
sumption vis-a-vis present consumption The factors which are commonly
accepted as determining Social Rate of Discount (SRD) are several
1) societys present level of consumption 2) the expected growth of
consumption 3) the expected growth of population 4) the rate at which
marginal utility of consumption diminishes and 5) societys pure time
preference If per capita consumption is expected to grow society will
be better off in the future compared to present and hence society will
attach less value to additional consumption The higher the rate of
growth of consumption the lower the value assigned to future consumption
as seen from todays viewpoint
-13-
Although the rate of growth of per capita consumption is important the
societys weights on present and future consumption would crucially
depend on the present level of consumption in the country It is
reasonable to assume that many developing countries with low levels of
present consumption will place a high premium on present consumption
vis-a-vis future consumption To some extent a lower level of consumpshy
tion would also reflect societys impatience for current consumption
ie pure time preference
If a value (or a range of values) of social rate of discounts used
at the national level is not available a range of SRD values can be
estimated by using the conceptual framework outlined above The
economic parameters required for such an effort would be 1) the
projected rate of growth of per capital consumption over time which may
be explicitly given in planning documents or may be implicit in developshy
ment objectives 2) a probable value of the elasticity of marginal
utility with respect to per capita consumption (ie the rate at which
marginal social significance of extra consumption declines over time)
and an idea of the pure time preference which is purely a normative
judgment For example if estimated rate of growth of per capita
consumption is taken at 3 percent and the elasticity of marginal
utility with respect to consumption (e) is taken at e = 15 the
resulting estimate of SRD would be 47 or 5 percent ignoring pure time
preference When pure time preference is also to be considered in the
value judgment of SRD the resulting value may range between 8 percert
to 10 percent or even higher It is expected that more than one value
of social rate of discount would be used to perform sensitivity analysis
in the case of a renewable energy project
-14shy
(ii) Shadow Price of Labor A project increases employment of unshy
skilled semi-skilled and skilled labour during the period of construction
as well as after its completion One of the ways in which employment obshy
jectives can be incorporated in project selection is through the use of
shadow wage rate (or accountIng price of labour) in place of market wage
rate
It has been pointed out in project evaluation literature that one
of the common forms of distrotion is in the labour markets of surplus
labour economies such that the wage rate does not equal the social
opportunity cost of labour The components traditionally identified
in the social opportunity cost of labour are (i) the output foregone
elsewhere in the economy as a result of employing labour on the proshy
jectl (ii) the costs of migration training and additional consumption
when a worker is moved from a rural area to the project site (iii) the
potential disutility of effort which this worker may incur by moving
to a new job and new area and by increasing his level of work ie by
reducing his leisure and (iv) the costs in terms of increased aggreshy
gate consumption (caused by increasing employment as a result of the
project) if savings (or investment) are socially more valuable than
current consumption due to non-optimality of savings2
iThe opportunity cost in terms of output loss would be zero if there were surplus labor as long as the project was marginal For large withdrawals of labor it may be positive Existence of surplus labor and evaluation of the so-called marginal product in agriculture have been matters of intense debate See Sen (1975) for an examination of conceptual issues involved and a sumary discussion
2-This is based on the assumption that savings out of wages are lower than those out of profit For a one-sector analysis of this problem of employment-versus-savings dilemma see Sen (1975) or Marglin (1976) The formula used by Mishra and Beyer (1976) for Shadow Wage Rate (SWR) is AWR or SW = m + s(I-l)w where w is the market wage --aid to a laborer in a new job m is the marcinal product in present
-15-
In most traditional analyses the output foregone has been identified
with the marginal project of the relevant labour in its previous employshy
ment The estimation of marginal productivity of labour is a difficult
task Traditionally it was assumed that the marginal product of the
labourer withdrawn from agriculture would be zero and hence m = 01
The use of agricultural wage rates as a proxy for marginal product (or
opportunity cost) has been suggested as the indicator of the shadow
wage rate of unskilled labour However the important thing to be kept
in mind is that the shadow wage rate should reflect the benefit foregone
elsewhere in the economy when a particular worker is employed in a
project If the worker is a migrant from a rural area the opportunity
cost of unskilled labour will range from zero in the off-season to the
full market wage at harvestplanting time 2 If most of the construction
work related to the non-conventional project can be completed during
the agricultural off-season it may be correct to assume a shadow wage
rate of zero for unskilled labour since the output foregone would be
very low (or almost equal to zero) Thus if a project is located in
areas where there is large scale unemployment or underemployment and
the project uses unskilled labour during the off-season the shadow
wage rate for this category of labour can be taken notionally as
equal to zero The shadow wage rates for other categories of workers
and during the agricultural season would be site specific and hence
would require use of location specific values
employment s is the rate of savings from profit and I is the accounting price of investment The costs of migration and disutilityof effort are ignored on account of difficulties of measurement See Lal (1974)
iThe marginal product is rarely zero rather just quite low For an interesting discussion of the effect of marginal labour inputs in traditional agriculture see Geertz (1963)
2 Assuming that the market wage at harvestplanting time equalsthe marginal product of labor
-16shy
(iii) Shadow Foreign Exchange Rate In most of the developing
countries foreign exchange is always a scarce resource on account of
balance-of-payments problems The usual administrative solution to the
balance of payments deficits is to resort to exchange control However
the official exchange rate under these circumstances does not represent
the true value of foreign exchange earned or spent To evaluate the
real foreign exchange impact of policy options involving exports and imshy
ports it is important to make adjustments by using a premium on foreign
exchange outflow or inflow Invariably this premium to reflect scarcity
of foreign exchange is given by using a shadow exchange rate which is
higher than the official exchange rate
If a range of estimates of shadow exchange rate for a country is
not available it may have to be calculated using one or more of the
methodologies discussed in literature Beyer (1975) has reviewed
seven different methodologies employed in an attempt to derive a preshy
liminary estimate of the shadow price of foreign exchange in India
The available methodologies include use of economy-wide programming
models determination of the equilibrium rate of exchange and estimashy
tion of effective rate of protection (ERP) and domestic resource costs
(DRC) per unit of foreign exchange earned or saved The range of values
for India was from Rs 98 to Rs 120 per US dollar compared with
an official exchange rate of Rs 75$100 Although this range is
modest it is probably too wide to avoid the switching of project
decisions for values within this range especially projects which are
mainly of import-substitution or export-promotion types
-17-
UNIDO (1978) gives a simple formula for calculating an average
shadow exchange rate based on a given years data as follows
(M + T) + (X + S MSER = OER x
Where SER is Shadow Exchange Rate OER is Official Exchange Rate M =
cif value of imports X = fob value of exports T = import tax1
revenues and S = export subsidies (export taxes treated as negativex
subsidies)
(iv) Shadow Price of Investment (Savings) In many developing
countries the present level of savings is considered less than optimal
and hence the planners may place a premium on savings vis-a-vis consumpshy
tion The accounting price of investment (savings) is a measure of this
premium defined as the present value of additional consumption generated
by a unit of investment It reflects the social value for the resources
a project draws from an alternative investment (a project cost) and for
income generated by the project which is reinvested (a project benefit)
If savings-investment are optimal the market value and social value will
be the same with the accounting price of investment equal to 10 The
divergence between the opportunity cost of capital and the social rate of
discount is an indicator of the divergence between the market and social
value of investment Under simplifying assumptions the shadow price of
investment is given by the ratio of opportunity cost of capital (r) and
the social rate of discount (i) Thus if oucortunity cost (or marginal
-roductivity) of ca-ital iS aken as 7 and social rate Ccercent
discount is taken as 10 percent the shadow price of investment I
is equal to 0 = 15 A more realistic formula which incorporates
reinvestment or share of saving from incremental income can be given as
= (1-a) r i-ar
Where I is shadow price of investment i is the social rate of discount
r is the opportunity cost of capital and a is the rate of reinvestment
If the rate of reinvestment which corresponds to the marginal savings
rate for the economy as a whole is taken as 02 r - 015 and i - 01
the shadow price of investment would be I = 17 It should be emphasized
that if opportunity cost of capital is higher than social rate of disshy
count and the latter is used for discounting benefits and costs it
would be necessary to adjust both project costs and benefits by using
shadow price of investment
However some practical difficulties in the use of shadow price of
investment are encountered Although it is easier to revalue (upwards)
the capital costs of the project by using the shadow price of investshy
ment it is difficult to estimate that proportion of the income stream
generated by the project which is reinvested and should be revalued by
the accounting price of investment (the additional value constituting
an additional benefit of the project) Estimation of reinvestment
benefit requires the knowledge (or estimation) of how a projects
benefits will be distributed among various groups and institutions and
what their respective rates of saving and investment are expected to be
-19-
In view of these difficulties shadow price of investment has not
been used in many studies1 which have used the UNIDO or analagous
approaches Instead a sensitivity analysis of the project to higher
values of social rate of discount (up to the level of opportunity cost
of capital) have been presented This is considered as a method of
incorporating shadow price of investment in practice although this may
lead to some theoretical complications
(v) Income Distribution Weights Since income from a project may
pass on to groups or regions representing different social priorities
the value of the income to some groups should be weighed differently
than the value of the same income to other groups For example where
income to a poor group has more social value than income to a wealthy
group the income to the poor group should be adjusted upward Upon
adjusting the incomes properly the net benefits can again be tabulated
this time with appropriate regard to income redistribution objectives
The prescribed methods for identifying the appropriate weights are
to 1) accept an upper level policy decision 2) observe and quantify
the policy preferences implicit in past projects Where only two groups
are involved it is possible to infer relative weights (or switching
values) by examining which projects were accepted and which were reshy
jected and by assuming some consistent decision rules With multiple
groups it is more appropriate to select a numeraire (commonly a group
or region which is neither taxed nor subsidized) against which all
See for examzle Mishra and Beyer (1976) and Sinha and Bhatia (1976)
-2Q_shy
other groups are to be compared The other groups can then be conshy
sidered in terms of the elasticity of the marginal utility of income
or the percentage by which the social value placed on additional inshy
come falls within a 1 percent rise in income A more detailed desshy
cription of these methods is presented in UNIDO (1978)
Development of income or regional distribution weights can be a
major undertaking too costly or time consuming to be considered for
the purposes of evaluating a single project In such a case and
where relevant weights are not readily available rough estimates may
suffice Generally a premium of 10 percent to 20 percent on the beneshy
fits to poor household and backward regions is appropriate
Since shadow wage rate for unskilled labor may have already been
used it may not be necessary to put explicit weights on employment
created by the project Likewise the preference for the use of inshy
digenous resources vis-a-vis importable (or exportable) resources would
be reflected through shadow exchange rate and an explicit premium on
the use of local resources and the security and certainty of supplies
may be incorporated in the analysis at another stage
Decision Criteria1
Although several decision criteria are available for project choice
and ranking the following three are most commonly used in social
1 UNIDO (1978) pnze 70 2The discussion in this section decends mainly on a similar disshy
cussion by Mishra and Bever (1976 p 32-35) For a more detailed discussion of decision criteria see Eckstein (1D53) and Dasupta and Pearce (172)
-21shy
benefit cost analyses These are (i) Net Present Value (NPV) or Net
Present Worth (NPW) (ii) Benefit Cost Ratio or BC ratio and (iii)
Internal Rate of Return IRR)
(i) The Net Present Value Criterion It may be useful to
summarize the procedure for finding the net present value or the net
contribution of a project The net present value criterion simply
states that any project is economically viable if
PV (B) gt PV (C) or
NPV (B) gt 0
that is the projects present value of benefits (PV (B)) is greater
than its present value of costs (PV (C)) or the net present value of
benefits is positive The net present value of benefits is the
difference between the present value of benefits and the present value
of costs The PV (B) and PV (C) here stand for the sum of discounted
series of project benefits and costs the respective formulae for which
can be written as follows
T Bt PV(B) = t
t = 0 ( + r)t and
T Ct PV(C) = t
t = 0 (1 + r)t
where T is the project life measured in number of years from the date of first investment Bt and Ct stand for benefits and costs in the t-th
year of the project life and r is the social rate of discount
-22-
The net present value criterion states that the flow of social
benefits and costs over the life time of the project should all be
discounted to the present at the social rate of discount and the project
should be acceptedrejected according to whether its NPV is positive
or negative
However the NPV criterion gives us an absolute measure of the
economic profitability of the project So long as our attention is
confined to a single project or two or more projects whose costs are
the same this criterion is adequate Where there are more than one
project with different costs this absolute measire of worthinesF fails
to produce a correct choice In the following table the relevant inshy
formation is given for two hypothetical projects A and B On the basis
of present value criterion both projects are worthy of selection If
however one is asked to choose between A and B the choice will be B
which offers a larger net present value of benefits as seen from
Column 4 But it is clear from Column 3 that the cost of project B is
double the cost of A while it offers only 10 units more of net benefits
than A Hence the choice B is misleading 1
uz in roject selection For exanle see RJ deLucia and HD JacobyS ais a12s2 gora7 gtsIcn c1LCr J(0 in
i m aai so marginal onet
1 deLucia Jacoby et al (1980)
-23-
Present Values of Hypothetical Projects
(1) (2) (3) (4) (5)
Project PV(B) Nr(B)PV(C) PB(B)PV(C)
A 150 100 50 15
B 260 200 60 13
(ii) Benefit Cost Ratio Thus in the case of more than one proshy
ject (not mutually exclusive) which have different costs a relative
measure of worthiness of projects becomes necessary The ratio of PV (B)
to PV (C) in short the benefit-cost ratio provides such a
measure Here it may be necessary to mention that in the presence of
constraints on the resources available on investment C will include
only capital costs of the project and benefits (in the numerator will
be defined net of annual operating costs) The BC ratio criterion
states (1) in case of a single project choose the project if its BC
ratio is greater than one and (2) in case of many projects rank the
projects in descending order of their BC ratios and choose that number
of projects at which the given investment fund is just exhausted On
the basis of this criterion we can see project A and not B will be
-24shy
chosen because its BC ratio (refer to Column 5 of the table) is higher
than that of B There are numerous difficulties with this rule One
fundamental point is that no rule should be sensitive to the classifishy
cation of a project effect as a cost rather than a benefit and vice
versa Thus all costs can be treated as negative benefits and all
benefits as negative costs For the NPV rule it should be obvious that
the outcome will be the same however the division is made But the
benefit cost ratio rule will be affected by this division since it will
affect the magnitudes which are entered as denominator and as numerator
Thus if a project has (discounted) benefits of 10 20 and 30 units
and costs of 10 and 20 the benefit-cost ratio is 20 But if the cost
of 10 is treated as negative benefits the ratio becomes 5020 = 25
On the other hand benefits minus costs (ie NPV) remains the same
at 30 units regardless of the transfer
Apart from being sensitive to the classification of costs and
benefits the ratio rule is incorrect when applied to mutually exclusive
context Thus a project costing 100 units with discounted benefits
of 130 has a NPV of 30 This is to be preferred to a project costing
40 with benefits of 60 a NPV of 20 But in ratio terms B is preferred
since B has a ratio of 15 compared to A which is 18
(iii) The Internal Rate of Return Criterion One shortcoming of
the net present value and the BC ratio criteria is that they depend
upon an externally given social rate of discount With the difficulties
in finding an appropriate social rate of discount the internal rate of
return criterion has an advantage in that it does not depend at least
-25shy
in the initial stages upon an externally given social rate of discount
The internal rate of return is that rate of discount at which the net
present value of benefits of a project becomes equal to zero Thus if
r is a rate of discount at which
NPV (B) = 0
then r is said to be the internal rate of return More explicitly the
formula for the internal rate of return can be written as follows
T NPV(B) = E Bt - 0tt=0t =0
t =0 (1 + r)t
where r is the internal rate of return
The internal rate of return is determined through a trial and error
procedure Given the time stream of benefits and costs the project
evaluator arbitrarily chooses a value for r discounts the two streams
sums them up respectively and finds the difference between the two sums
If the difference is positive ie the net present value of benefits
is positive he raises the value of r and repeats the process until the
net present value has approached zero This discount rate r at which
NPV is zero is the IRR The internal rate of return thus calculated
does not on its own provide a decision rule for choosing a project It
requires a standard for comparison -- a predetermined social rate of
discount or a private rate of return which approximates the social
rate or a rate of interest at which the social investment fund is
available If r is such a rate of interest then the decision rule for
project choice is formulated as follows
-26shy
(i) For a single project choose the project if
r gt r
(ii) With many projects rank the projects in a descending order of values of r and choose that set of projects from the top for which r gt r until the given investshyment fund is exhausted
It is necessary to note that while r can be calculated purely
from the project data for the project choice rule it still requires
an externally determined parameter like r As with the NPV rule it
remains essential to choose some acceptable discount rate
The internal rate of return approach suffers from a number of
limitations In the first place it may not exist or if it does it
may be non-unique Only if the net flow of benefits changes sign no
more than once is the internal rate of return unique It is tedious
to calculate without the help of the project It says nothing about
the aims of the project one may prefer a bigger project with greater
absolute net benefits to a smaller one with a higher internal rate of
return but lower absolute net benefits In comparing two mutually
exclusive projects it cannot be applied without further adjustment
On the other hand it has some advantages also for example it appears
to be more easily acceptable to administrators
Thus it would seem that in the case of an -icceptreject case of a
single project NPV or IRR may be used In the case of mutually
exclusive projects (eg two different ways of achieving the same
objective) NPV may be used as the decision criterion However in the
-27shy
case of rationing a given investment fund BC ratios of projects may be
used for ranking projects It is useful to calculate all three -- NPV
BC ratio and IRR -- since each one can provide some useful information
for a particular purpose
-28shy
112 UNIDO and Little-Mirrless Approaches to Project Evaluation A
Comparative Analysis
Although details of the two approaches can be found in the literashy
ture cited earlier it may be useful to summarize their salient features
before a comparison is attempted The UNIDO method2 discusses various
objectives of national planning and suggests that all items involved in
a project should be valued in terms of present aggregate consumption
Since valuation of goods and services in terms of market prices is
considered inadequate in reflecting societal benefits and costs these
goods and services are valued in terms of shadow prices which in fact
reflect societal benefits and costs If the goods and services produced
by the project add to the supply of these goods and services available
in the economy then they may be regarded as being the net output of the
project However if these goods and services merely substitute for an
alternative source of supply leaving the total supply constant then
the net output of the project is really reflected by the resources
released from the alternative source of supply In each case the value
of benefits is measured by the willingness to pay of the purchaser
If the output substitutes for imports or adds to exports the procedure
is to estimate the impact of foreign exchange availability by making
explicit assumptions about foreign markets and also about policies of
the government The shadow price of foreign exchange is used to convert
the foreign exchange benefits (and costs) into units of aggregate conshy
sumption in domestic currency Costs are equivalent to maximum benefits
iYost of the discussion in this section is based on Dasgupta (1977) Sen (1972) and Lal (1974)
2Although this method has been discussed in detail in the earlier section a few concepts are repeated to provide a basis for comparison
-29shy
foregone If the use of input in a project causes a decline in the
amount of that input available to the economy by an equal amount then
the value of the input should be measured in terms of benefits foregone
in the alternative use(s) If the availability of this input to the
rest of the economy does not decline by its use in the project because
say domestic production of this good increases then the cost of input
is to be measured by the resource cost of the increased production If
an input is imported or is a potential export then cost is measured by
the sacrifice in foreign exchange involved converted by shadow price
of foreign exchange The benefits and costs of a project are estimated
for the future years and are discounted to the present by using a social
rate of discount Various decision criteria for project selection and
ranking are used as discussed in the earlier section
In the Little-Mirrlees or OECD approach the components of a proshy
ject are divided into three broad categories
1) Traded goods and services ie goods and services which are actually exported or imported and goods that would be exported or imported had the country followed policies that would have resulted in optimum industrial development
2) Non-traded goods and services and
3) Unskilled labour
In the case of traded goods and services as defined above the shadcw
prices are easy to calculate for an imported product it is its
marginal import cost while for an exported good it is its marginal
export revenue Use of world prices in the evaluation of commodities
(traded) is a distinguishing feature of this method In the case of
non-traded goo4s the marginal social cost of providing a little more
of this good is considered as the shadow price of the commodity The
accounting price of unskilled labour or shadow wage rate depends on
(i) labours opportunity cost (ii) the industrial wage rate and (iii)
shadow price of investment a national parameter In a given year in
the life of the project the algebraic sum of the social value of inputs
and outputs in the year yields the social profit (in terms of investment)
for that year The social profit of each year is discounted to the
present by using an accounting rate of interest and this sum yields the
social value of the project which is the index by which to judge its
profitability
One common feature of the UNIDO and Little-Mirrlees approaches is
that both deal with evaluation of industrial projects Although the two
approaches pursue somewhat different sets of exercises for the evaluashy
tion of these projects they are basically similar1 First both
approaches recognize the distortions in market prices and recommend the
use of appropriate shadow prices to measure the social value of benefits
and costs Secondly both recommend the use of present value as the
correct criterion in judging industrial projects Thirdly it has been
shown that the choice of numeraire in the two cases makes no difference
to project evaluation The UNIDO approach recommends measuring benefits
and costs in terms of aggregate consumption while the Little-Mirrlees
lit has been pointed out in the UNIDO Guide to Practical Project Appraisal(1978) with the changes in the Little-Mirrlees method embodied in the revised (1974) edition and with the changes in the UNIDO method embodied in this Guide there is really very little difference between the methods in terms of their fundamental perspectives on economic project evaluation pp 3
-31shy
approach uses investment (expressed in free foreign exchange) as the
unit of measurement Thus in the UNIDO approach one revalues investment
in terms of consumption using the shadow price of investment In the
OECD approach consumption is revalued in terms of investment using the
shadow price of consumption in terms of investment Fourthly in both
approaches traded goods play an important role in determining the evalshy
uation of the project In the case of the UNIDO approach it is
considered important to estimate the direct and indirect foreign exshy
change inflows and outflows as a result of the project and the same are
valued using border prices along with shadow price of foreign exchange
In the OECD case the shadow prices for traded goods are equated to
marginal import cost of an imported good and to marginal export revenue
for an exported good
However there are some differences in the two approaches and it
may be useful to point these out The differences in the two approaches
can be explained in terms of the differences in judgment about the kinds
of constraints that are important in the economies and the role that
planning organizations can play in influencing economic policies
especially trade and tariff policies in the developing countries The
UNIDO method is more realistic in assuming that in many developing
countries there are many restrictions on economic activities and prices
reflected as quotas tariffs subsidies and administered prices of
capital labour foreign exchange and many scarce commodities It
further recognizes that the project evaluator may not be in a position
to get these restrictions removed or changed and hence the control
areas of the project evaluator may be rather limited On the other
-32shy
hand the Little-Mirrlees approach assumes that the project evaluator is
in a position not merely to suggest changes in trade tariff and tac
policies but also to ensure that these policies are in fact chosen
This would suggest that the agency involved in project evaluation in the
country is powerful enough to ensure modifications in various policies
of other ministriesdepartments of the government concerned The
correct assumption may vary from country to country and from case to
case and may also alter over time since the projects sometimes have a
long life and political and social influences on tax and trade policies
may change during the lifetime of a project
Thus the particular method to be used would depend crucially on
the nature of the restrictions in the economy in question and the ability
of the planner to get these policies adjusted Since most of the develshy
oping countries have imposed pricequantity restrictions especially in
foreign exchange markets it would be useful to recognize these restricshy
tions as such The UNIDO method would have a more realistic approach to
project evaluation under these circumstances
-33-
II 3 The Limits to Project Level Analysis -- Linkage to Subsector (Industry) and Sector and Intersectoral Level Analysis
Analysis of the attractiveness of renewable energy alternatives
sometimes requires more than project level analysis This can stem
from a variety of factors most important of which are the scale of the
alternative relative to the size of the market critical interdependencies
often associated with the substitutability of fuels or energy sources
other interrelations based on use of limited resources (such as agrishy
cultural land) and whether or not the project is an isolated project or
conceived as part of a larger program1 In these cases the project
level analysis should be immersed in broader subsector (industry) or
sector level analysis and perhaps even close examination of intershy
sectoral issues
It is beyond the scope of this document to discuss in detail overshy
all energy sector planning and the role of project analysis in such
efforts However some discussion of these issues is warranted The
problems associated with the appropriate selection of projects and
programs for the energy sector in many developing countries are freshy
quently similar Many developing countries are in transition from the
use of traditional energy (vegetable waste cattle dung firewood etc)
iWhile a single small dentro-thermal plant for a particular town may not require broad analysis a program conceived as a repeat of this model for tens or hundreds of towns should
2 For an extensive discussion see R deLucia and H Jacoby EnergyPlanning in Bangladesh Chapter 1 in deLucia Jacoby et al (1980) this section draws on that chapter
-34shy
to commercial energy Rising demand for commercial energy results from
increasing energy-intensive production and the substitution of commershy
cial for traditional fuels The latter substitute is sometimes the
result of decreasing (absolute or per capita) traditional fuel (partishy
cularly firewood) availability or income and price effects
There are numerous choices involved in sectoral investment planning
production versus importation choice of production process selection
of size (scale) timing and location of investments and the role of
traditional energy sources The appropriate choices regarding energy
supply facilities in developing countries are often dependent on analyzshy
ing a number of interdependencies within the energy sector as well as
interdenpendencies with other sectors The interdependencies are
relatively more important in developing countries in which both the
regional and total energy markets are less developed In such markets
single facilities constructed large enough to capture the economies of
scale may not be justified by the existing or projected growth in energy
demand In cases in which the existing or projected market size is
limited althouqh the market size may justify the use of a large facility
on a cost basis the large facility may be too large when technical
balance criteria are considered Given the strong substitutability of
alternative fuels especially when the energy markets (and hence the
different mix of energy-consuming technology) are still in flux
potential major supply facilities for one fuel must be analyzed with
other fuel supply facilities
-35-
Examples of such important interrelationships will frequently exist
when there is an existing refinery system with limited flexibility in
the mix of productsI and a biomass-based program (eg ethanol or
charcoal) is aimed at suitability for some but not all products Partial
or full substitution for only some products such as charcoal for fuel
oil may result in significant influence in the system -- perhaps surplus
of new oil If the refining system is not capable of processing the
new surplus into other products the options may be unattractive -shy
selling the surplus at discount in the international market cutting
back overall refining production until it is more in line with demand
for heavy products and importing light products etc Major renewable
energy programs require more than project level analsis and there are
other strong arguments for sector level analysis
A sector study analysis should lead to a sector investment plan
and to the determination of operational procedures and pricing policies
This is in contrast to a more limited type of effort -- which may be
referred to as an assessment -- that surveys supplies and demands and
identifies investment options but lacks sufficient analysis to support
decisions by officials and international lending authorities about
specific investments A sectoral plan requires enough project and subshy
sector detail to allow for recommendations regarding timing size and
location of facilities Some of the necessary project-level work may
have been done separately from the sector exercise and can be integrated
1in many developing countries refineries are smaller and do not have catalytic cracking and other high cost processing that allow extensive flexibility in the production of alternative products
-36shy
into a plan If the project level detail is not available from earlier
efforts it must be part of the exercise1
Project- and subsector-level detail is a key aspect of investment
analysis A good sector analysis will integrate alternatives that are
based on project-level information and examine interrelationships among
the size location and timing of alternatives and combine the best
elements into ai overall investment plan The process includes the
consideration of combinations of projects in a subsector of industry
(ie all the alternatives for the electricity subsector) as well as
the integration of oil gas electricity traditional fuels etc into
an analysis which considers trade-offs between subsectors As the
example above suggests given the strong substitutability of alternative
fuels or energy types especially when the energy markets are still in
flux potential supply facilities for one fuel or energy type must be
analyzed jointly with other fuel systems (Another example is a new
railway system where decisions regarding electrification or diesel
clearly require joint consideration of different energy subsectors)
Often a sector planning exercise builds a catalog of projects that
characterize scale and process alternatives and integrates them into
consistent sectoral schemes that reflect a number of different project
and energy source mixes sizes and locations Thus there is critical
information flow between project-subsector analysis and sector-level
10n the other hand in an assessment that does not include an investment plan representative costs and technical descriptions can be used to identify which options warrant further investigation
-37shy
planning Sometimes there will be much to build on --many of the alternshy
atives will have had prior technical and economic analysis at the project
level others will have had none
The process of integrating alternatives to the subsector and
sectoral level can help prevent undue focus on investments that may seem
attractive at a project level but are less so in a broader context The
procedure usually starts by integrating existing information (costs
performance characteristics etc) regarding some alternatives and
making preliminary estimates where this information is not available
The initial integrated analysis indicates which alternatives appear
more attractive If they have not had detailed prior study additional
technical and cost analysis can proceed but only after this sectorshy
level evaluation has been undertaken
There are also important linkages to regional planning activities
Here the critical issues are location and scale Choices among energy
supply facilities often involve economies of scale or indivisibilities
of technological alternatives1 Moreover these issues are relatively
important in developing countries where regional and total energy demands
and markets may not be large Single facilities large enough to capture
economies of scale However in such cases it is necessary to analyze
transport and production costs simultaneously
The issue of market-versus-societal demands and the location of
both supply and transport facilities touches on one relationship between
iThese issues are more pertinent to conventional than to renewable resource based technologies
-38shy
sectoral and regional planning activities Another important linkage
relates to decisions regarding the location of major energy supply and
transportation facilities which may predetermine regional development
possibilities In many developing countries the composition of existing
demand reflects the urban-rural split
Decisions regarding project and sectoral supply investment alternashy
tives influence future intra-urban and urban-rural divisions of developshy
ment The process of energy sector planning must include some concern
with regional issues because the location of many energy facilities is
going to predetermine development patterns in many sectors particularly
manufacturing
There also may be important inter-sectoral issues In many biomass
based alternatives the interaction with agricultural andor forestry
sectors is significant Major programs utilizing significant agriculshy
tural andor forestry land must be evaluated with measures of the real
opportunity costs of the resources This will require analysis of
agricultural or forestry-related activities which utilize the resource
if such studies have not already been undertaken
One last linkage between different planning activities is worth
mentioning -- that relating to information from operational planning
Operational planning encompasses the analysis of such elements as the
operation of refineries and system dispatch for electric power systems
Sectoral investment planning should integrate some characterization of
how the system is actually operated and of the possiblo rate of operating
-39shy
improvement Too often studies are based on manufacturers literature
or experience elsewhere Careful consideration of this issue can help
prevent misallocation of capital through decisions that do not reflect
the real operating conditions and constraints on the rate at which
problems can be overcome
-40shy
114 A Brief Review of Recent Contributions
In the recent past there has appeared a considerable volume of
literature on social benefit cost analysis as the analytical methodology
for project evaluation There are basic texts which present complete
systems of project evaluation such a6 the UNIDO Guidelines for Project
Evaluation (1972) and Guide to Practical Project Appraisal (1978) and
the two volumes by Professors Little and Mirrlees (1968 1974) Theoreshy
tical discu3sions relating to cost-benefit analysis as well as case
studies are available1 in Roemer and Stern (1975) Dasgupta and Pearce
(1972) Marglin (1967) Mishan (1976) Lal (1974) and Harberger (1971)
Manuals and guidelines for project appraisal have been issued by the
World Bank (L Squire and HG Van der Tak 1975) Overseas Development
Administration London (1972) and the US Agency for International
Development (1974) There have been a number of contributions on various
topics by Sen (1968 1972) Bruno (1972) Lal (1972 1973) Balassa
(1976) Harberger (1968) Bacha and Taylor (1971) Beyer (1975) and
World Bank (1977 1979) Several sectoral case studies are now availshy
able the principal among them being those by Adler (1971) Gittinger
(1972) Dattachaudhuri and Sen (1970) Mishra and Beyer (1976)
Eckstein (1958) and Lal (1972) However there are only a few case
studies in the field of renewable energy technologies eg Bhatia
(1977) deLucia and Lesser (1980) French (1979) and Barnett et al
(1978)
1The more important of these contributions are reviewed as a part of the annotated bibliography
Section III
TECHNOLOGICAL ALTERNATIVES AND
EFFICIENCY IN ENERGY USE
It should be clear from the discussion in sections I and II that
social cost-benefit analysis is an appropriate means of comparing different
energy-related technology alternatives Economics of scale can be reshy
flected in the capital cost and in tie operating and maintenance costs
Uncertain fuel prices can be considered through sensitivity analysis of
the operating costs Equipment reliability can be shown in the maintenance
costs and perhaps in the need for additional capacity or back-up systems
Shadow pricing social discount rates and appropriate decision criteria
could be employed as discussed in these earlier sections The first part
of this section is a discussion of the dynamics of this type of technological
choice
The second part of this section deals with mechanical efficiency
a concept which is particularly relevant to selection of the range technology
alternatives which are to be compared Consider for example the option
of using electrical resistance as a mode of space heating The first
law efficiency (ie the amount of energy delivered divided by the amount
of energy supplied) is probably on the order of 90 percent However the
second law efficiency (ie the minimum amount of energy needed to perform
a function divided by the actual amount of energy used to perform a
function) is probably about 5 percent By definition the same job could
be accomplished with less energy consumed This argues for consideration
of more efficient options
This soace heating alternative is used widely in the US due to he extremely low cost of petroleu= and other fossil fuels When one deals with more realistic shadow prices though this mismatch between energy use and end-use becomes less attractive
-42-
III1 Choice of Technology
In the August 1902 issue of Country Life In America there were on
one page three advertisements for automobiles The top picture showed
an electric automobile the second picture was for a steam automobile
and the third was for a gasoline engine automobile
Eighty years later the range of technical choices for automobiles
is much more severely constrained then it was in 1902 Why is this
incidentally the same issue of Country Life In America also carried
advertisements for hydraulic rams and also for Stirling engines both
for use in pumping water at remote locations It is not possible today
to buy these technologies off the shelf for water pumping
The choice as to which technology to use for which particular end-use
activity depends upon the relative prices and availability of fuels and other
inputs In periods of relative stabilisty of prices a well-working market
tends to eliminate the technologies with higher costs and favors those with the
lower costs For example over the main bulk of this century the ready availashy
bility of petroleum fuels at low costs predicated a particular set of technologies
relying heavily upon the internal combustion engine as the prime mover
Since 1973 however the prices of petroleum-based fuels have been rising
rapidly relative to other fuels This implies that some other types of
motive power may be more appropriate for use with many engine devices
under the current situation
-43-
What then are the things which have a major impact on the choice of
technology It seems that the major parameter is the availability of the
energy sources It does not help as in many countries to say that diesel
fuel is available at a government-controlled price when it is only available
intermittently at those prices Hence the persons imaking a choice of techunology
cannot have confidence that the fuels will be available when required The second
aspect is the availability of the technology itself The literature is full of
the availability of the technology itself The literature is full of
discussions of a tremendously wide variety of energy-using technologies
But what we find quite often is that these technologies are available
only as prototypes or as bench-testing devices and have never been available
on any broad scale It is not possible to pick up a telephone and order
many of these devices even in small numbers Hence the technology that one
is choosing must amplso be available at some reasonable cost and on some
reasonable deliv cy schedule
-ne of the most important aspects of technology choices deals with
the matching up of the quality of the energy needed at the end-use and
the quality and type of energy used by the technologies It is important
to achieve as close as possible thermodynamic matching of the quality of
the energy use For example it makes little sense tc use electricity or
petroleum-based fuels directly for process heat in industry unless that
process heat is required at extremely high temperatures For most process
heating and space heating requirements lower thermodynamic quality energy
sources can be used What this means is that energy is not merely 2TUs
but BT2s at some particular temperature level Low c3ss of hiah
quality petroleum based fuels in the recent past has led in many cases
tn a severe mismatch between the energy used and the ond-use
-44-
Unfortunately there are no easy rules that enable the engineer or
economist assessing technology choice under the current conditions that
would enable him to move quickly to the match of energy qualities In
order to do this they will have to rely on the scientific assessment
of each individual situation
From the point of view of economic evaluation of technology choice
there are a series of parameters which are more directly approached
1 Initial Costs The capital cost of the technology is obviously
a very important determinant of the technical choice However one must
remember that the initial cost in many cases is achieved by trading off
a variety of other parameters such as reliability fuel use and size
Moreover in dealing with the initial cost the capital cost of a
particular technologythe economist will also need to assess a breakdown
of these initial costs into those dealing with foreign exchange and those
with local exchange The economist also will need to assess whether all
of the aspects of this particular technology are required for the end-use
For example is the pumphouse a necessary component for use in a particular
situation is the truck chassis an integral part of the required technology
for that particular transportation system and so on
2 Life-Cycle Costs The life cycle costs deal with the costs of
fuel and maintenance of the technology over its working life Obviously
these costs are directly related to some of the components of the initial
cost or the captial cost One 7an put mcre materials into a machine and
-45shy
reduce the amount of maintenance necessary to keep the machine in operation
or one can develop a high-technology machine that will require less energy
than a less highly developed machine but has a significantly higher initial
cost (The mechanical efficiency aspect of this tradeoff is discussed in
some detail in the second part of this section) As with the initial cost
the economist must assess the breakdown of the life-cycle costs into local
and foreign costs The life-cycle costs are quite difficult to estimate
with any degree of certainty Maintenance costs are usually not well
documented and even if they were it is often quite difficult to transfer
those into developing country contexts where the availability of skilled
mechanics etc is unknown A more difficult problem with the life cycle
costs is to make reasonable estimates of the energy input costs over the
life of the device One only has to look at the recent history of
petroleum prices to observe that it is a thoroughly hazardous task to
estimate future prices for petroleum products
3 Reliability The reliability of a technology i a very important
parameter from the point of view of the user and is un rtunately quite
difficult to assess Are diesel engines reliable Thk answer to that
question would be to take a look at the widespread use of diesel engines
throughout the developing world even though diesel engines do require
heavy maintenance and a substantial cost in keeping them going they probably
are a thoroughly reliable technology From the users point of view
however reliability is the one paraneter which utlimately clinches the
decision to choose or not choose a particular technology It is interesting
to note however that the concept of reliability is not just based
-46shy
upon the technology itself but upon the context in which it is being
used For example in parts of northern India many farmers consider
eletric pumpsets as being very unreliable The unreliability of the
pumpsets in this particular case stems from the unreliability of the
electricity supply and from any technical defects in the pumpsets
themselves Electric pumpsets in other contexts would be considered very
reliable Should one accept a lower level of reliability for devices
that have either lower first costs or lower first life cycle costs This
type of question needs to be addressed in any assessment of the choice
of technology
4 Scale This is possibly the most important parameter in the
choice of technology Unfortunately this is one parameter which is in
many cases quite difficult to define particularly at the ends ofthe
scale For example many large heat engine systems are available over
a wide range of prices starting from 50 kilowatts up to 60000 kilowatts
These can often be ordered directly from catalogs in that range of
sizes As one might expect there are economies of scale associated with
these types of devices and that over the typical ranges available the
larger tend to be the more fuel-efficient than the smaller However
when one gets down to the lower end of the scale one finds the tremendous
shortage of information about the size and performance of different heat
engines The effects of scale also have important economic and social
consequences Not only do larger devices cost more in terms of initial costs
they also typically require much larger tasks to be performed If there
is a mismatch betwen the scale of the device and the end-use then the
devices typically run at much lower efficiencies and theirhence lfe-cvcle
-47shy
costs increase rapidly Hence there is little sense in using a 15 HP
motor for a job that requires only 3 HP Moreover a small user may not
be able to meet the initial costs for such large technology Therefore
the choice of a larger technology than is absolutely needed implies a need
for some form of social organization to take advantage of the excess capacity
In many countries this has been the rationale for the formation of pump
groups and tubewell cooperatives However the analyst must be aware of
the social problems in making such organizations work effectively The
costs in such cases for the actual usage of the technology may be conshy
siderably lower than if the technology were commanded by a single
individual who needed it at that scale Other questions arise as to where
the economies of scale decline to insignificance Is there some level
of device where the transportation costs balance out the advantages of
increasing size For example one might expect that with biomass-fueled
some upper limit on the size of the generatingelectric generators there is
plant beyond which the transportation of the biomass to the plant will
predominate over the scale efficiencies of a larger plant Indeed this
importanttradeoff between transportation and increased scale is an
of many types of purchasing and manufacturing technologyfeature
1112 Efficiency
In considering the economic attractiveness of renewable energy
alternatives the ultimate criteron should be one of economic efficiency
as incorporated in a measure such as the benefit cost ratio discussed
earlier in this report When appropriately calculated this measure
includes appropriate weighting of both costs and benefits that have
different impacts or importance But considering the attractiveness cf
-48shy
energy alternatives there is also a role for incorporating into the analysis
efficiency concepts based on a technical focus The importance of including
such considerations is an integral part of the choice of technologies
Consideration of technical energy efficiency concepts aids both in the
selection between alternatives and in determining wh ir one is considering
an appropriate andor wide enough set of alternatives
There are two energy efficiency concepts that should be considered
These are frequently referred to as the first and second law (of thershy
modynamics) efficiencies1
The first law efficiency is defined as follows
amount of energy delivered = n efficiency = in form required (output)
amount of energy that must
be supplied to achieve the desired effect (input)
This concept can incorporate energy in all forms (heat work fuel
potential or kinetic energy etc) It does not explicitly account for
the thermodynamic quality or special characteristics of the energy being
utilized The first law is eiily concerned with the quantity of energy
being used
But the quality of energy is very important Some tasks such as those
requiring very high temperatures can only be done by certain energy types
While task requirements that require lower quality energl (such as low
I A thorougih discussion of these concents is rresentc in American PhySical Society (1975)
-49shy
temperature task eg cooking) can be met with high quality sources
tasks requiring higher quality (eg high temperature)(eg liquid fuels)
often cannot be met with lower quality sources (eg wood) except withshy
out some conversion as the conversion usually entails considerable losses
In selecting the energy alternatives it is usefulquantities of energy
Whileto include alternatives which match (in qualit-) the task needs
these alternatives may not in the end be selected due to other economic
(used in the broad sense) factors they hould be considered
The second law efficiency is a useful concept in examining the degree
to which the alternatives match the requirements of the task It is
defined as follows
minimum amount of energy (work) required to perform
the desired function actual amount of energy (available work) used to perform the function
But the concept of the second law is applicable to an examination
of the preference of any device process or system and the degree
to which these attain that which is theoretically achievable
This requires not just the measurement of the energy per se but
the availability of the energy type to do work (and the measureshy
ment of the exhaustion of this availability in the course of
performing the function The term available work used in the
second law definitions above represents the availability of an
1 energy type to do useful work
I The concept of available work is discussed in detail
in APS ibid For fuels this is approximatelv ecual to the
fuels neat of combustion
-50-
The measure of efficiency is very much dependent on the boundaries of
the system being analyzed First and second law efficiencies are calculated
either for devices or systems with prescribed boundaries but in actual
operation devices are usually components in a larger system The house
furnace example often used to demonstrate marked differences between first
and second law efficiencies (see below) is only one part of an entire heating
system which in turn is part of a house
The difference between the first and second law efficiencies cpn be
demonstrated by example Consider the ordinary house furnace operating
under non-extreme conditions (desired indoor temperature the new standard
680F outdoor temperature just at freezing 0degC 320F) An ordinary
furnace could deliver to the rooms about one unit of energy for every
125 - 15 unics of energy used Thus the first law efficiency is
1 = 67 to 80
125 to 150
Consider the second law efficiency To do this we must first calculate
the mean theoretical work energy needed The minimum amount of energywork
to determine a unit of heat to the room can be calculated from extending
Carnots theory of heat engines considering the house as one resevoir
and the outside air the other The minimum work to deliver q units of
heat from (2731)20C is 007 gto (2930K)
Usinq Carnots Law w = a 2930 - 2730 = 007 q
2930
This is the amount of work that an ideal heat pump would require
The furnace therefore has the following second law efficiency
minimum energy = 01 X 1- 47 to 56 efficiency= actual energy 125 to 15
While the ideal heat pump would have a first law efficiency of 1
1400 actual heat pumps have first law efficiencies of 100 to 300
2depending on various factors Heat pumps work best when the temperature
difference is small Assume for the above condition that the heat pump
has a first law efficiency of 225 ie to deliver one uxit of heat
(output) it requires 0444 units of energy The second law efficiency
would then be
E- 07 1616pound = 444
The concept of these efficiencies when applied to systems of devices
is not immediately straightforward Consider the following example for
pumping which build an analysis presented in a companion report In this
case a series of biomaFs based alternatives for water pumping are considered
The concept of second law efficiency can also be applied to other
cases However the results are not as satisfactory as that for space
heating as the following application to heat engines demonstrates
q
007q
For a detailed discussion see APS ibid p 13
-52-
As stated previously the second law efficiency is defined as
minimum amount of energy required = to perform the desired task
actual amount of energy required to perform the desired task
The problem in using this equation with heat engines comes in
specifying the minimum amount of energy required There are three
alternatives that seem equally valid and these are discussed below
(i) One justifiable choice of the minimum energy required (equivalent
to the engine system with maximum efficiency) could be to use the
most efficient engine that exists now This would be the diesel
engine (marginally superior to the Stirling engine) with a typical
efficiency of 40 percent In this case the second law efficiency
for a gasoline engine (efficiency nu 25 percent) would be 2540 =
625 percent
(ii) An alternative choice would be to assume the maximum efficiency
of any engine is the maximum ideal efficiency (ie ignoring frictional
and other losses) of all engines existing now The ideal efficiency
is limited by the temperatures of heat absorption and rejection of
the engine and the maximum is that for the Stirling engine (70 percent)
Now the denominator in the second law efficiency expression is 70
and c for a gasoline engine would be 2570 = 36 percent
minimum amount of efficiency of 1 energy required actual process
actual energy used
maximum efficiency obtainable
-53shy
(iii) A final alternative is to suggest that neither of the above
are appropriate The problem with the first is that presumably
research and development will reduce the frictional and other losses
in an engine and some years from now it is conceivable that a
Stirling engine with an efficiency of 50 percent will be available
It can therefore hardly be appropriate to speak in absolute terms
of a maximum available efficiency of 40 percent A similar argument
applies to the second alternative above The ideal efficiency is
directly related to the operating temperature of heat input to the
system (ie fuel burning) At present the maximum temperatures
obtainable are limited by the temperature resistant properties of the
materials used It is again conceivable that in the future ceramic
Stirling engines will be available with ideal efficiencies of 90
percent The logical extension of this is that the maximum efficiency
that can be obtained is in fact 100 percent for an ideal engine
operating from an extremely high temperature (to a low of atmospheric
or less)1
The APS defines the minimum amount of energy required as the work
available in the fuel Since the work available is actually almost
the same as the heat of combustion (or energy input) of the fuel burnt
this approach is 100 percent (as in (iii) above)
Efficiencies of a biomass-engine-pumping system are shown in
Table Ill 1 As discussed the first and second law efficiencies are
identical
1 With this assumption first and second law efficiencies will be the same (eg for a gasoline engine E = 25100 = 25 percent)
-54-
TABLE III1
EFFICIENCIES OF COMBUSTION ENGINE SYSTEMS
Overall Biomass System Conversion Engine Pumping Efficiency
System Efficiency Efficiency Efficiency (1st amp 2nd law)
Diesel 40-70 25-40 80 8 - 22
Otto Gasoline 40-70 15-25 80 5 - 14 Gas 40-70 20-40 80 6 shy 22
Stirling 40-65 30-40 70 8 shy 18
Steam turbine 40-65 5-10 80 15 - 5 (lt50 kw)
Source Adapted from Meta Systems Inc State-of-the-Art Review of Biomass Fueled Heat Engines August 1980
-55-
The concept of a second law efficiency is particularly appropriate for
space heating where the operating temperature ranges for a heat pump are
specified (atmospheric and room temperature) and where the heat pump has
a seemingly unreasonable efficiency of 1400 percent However when the
concept is transferred to heat engines some subjectiveness enters The
conclusion that the minimum energy required for a given task is equivalent
to the work available (approximately the heat of combustion) in the fuel
effectively implies that the first and second law efficiencies are the
same and supplies no new information
SECTION IV
CASE STUDIES IN EVALUATION OF
NON-CONVENTIONAL ENERGY TECHNOLOGIES
The previous two sections have presented a discussion of the
methodology of economic evaluation of projects of the choice of techshy
nologies and technical issues involved in the efficient use of different
energy sources In this section two case studies in economic evaluashy
tion of some of the non-conventional energy technologies are presented
(Two additional case studies are provided as Annexes A and B)
The first case study is concerned with economic evaluation of a
family-sized biogas plant in Indian context It is explicitly
concerned with conceptual and practical problems arising in social
cost benefit analysis and in evaluating different procedures for the
estimation of or assumptions regarding shadow prices for inputs and
outputs The analysis recognizes that quantification of several m=jor
indirect costs and benefits is a major problem limiting the overzl
validity of the analysis however it does throw considerable liht on
the ranking of alternative designs for biogas plants Comparison with
Annex A (a similar study concerned with community-sized plants) shows the
relative social advantages and disadvantages of family-size and communityshy
size plants
The seccnd study is an econcm anai-sis of various irriiation
systems using different energy sources for the pumping of water it is
based on work in a representative villa- in Northeast Thailand The
-57shy
emphasis here is on examining technical alternatives on the evaluation
of uncertainty and on a sensitivity analysis for various parameter
values Four technological options -- diesel engine and diesel pump
dual fueldiesel engine and dieselbiogas pump gas engine and pyrolysis
gas pump and free piston Stirling engine using biogas -- are considered
and their appropriateness to the needs and resources of different farm
classes is examined This study neglects the issues of social cost beneshy
fit analysis in that economic accounting using shadow prices and
appropriate discount rates is not performed the only component of social
cost benefit analysis attended tc here refers to the savings in foreign
exchange Two different values of foreign exchange premium have been used
in a hypothetical import-component proportion for these calculations
The second Annex focuses on electricity generation using a villageshy
scale biogas plant comparing the costs of central electricity generation
and transmission for this technology with other conventional technologies
on the one hand and those for units of two different sizes -- 3 MW and
20 MW -- using biogas plant on the other (The 3 MW unit is assuied to
be using fuelwood under a social forestry scheme and the 20 MW unit is
assumed to be based on fuelwood from existing forests)
As discussed earlier in Section II the estimation of opportunity
costs of land and biogas inputs in the non-conventional energy technologies
present a far more difficult conceptual and practical problem than say
-58shy
in the case of foreign exchange or unskilled labor where some simplishy
fying assumptions and approximations may be made For traditional agrishy
culture it is not just that markets for land does not exist or is very
weak for in that case it may be possible to assign an imputed value to
land in terms of output price The problem is that markets in labor may
not exist either and labor allocation in traditional self-farming agrishy
culture does not take place according to economic rules Thus while
imputing value to inputs in traditional agricultures it is impossible
to separate the values that may be imputed to land and labor separately1
Further even if this problem could be resolved estimation of the
shadow price of land in terms of opportunity costs of foregone altershy
natives is difficult if such alternatives are not clearly defined For
example consider a biomass-fueled energy project where non-crop vegeshy
table residues (tree twigs lakri etc) are used as fuel It is possible
that the land in question lies fallow at particular periods when it is
practically impossible to put it to other use In this case the opporshy
tunity cost is zero since no social product is loct However consider
an irrigation project along with this energy project which can put this
land to agricultural use There the opportunity cost would be positive
and the opportunity costs to the private user and to the society as a
whole may well differ More this opportunity cost shall be dependent
on the particular crop that may be produced ideally the most profitable
crop will be produced and opportunity costs should be considered in terms
of the value added of the produced crop But when in actuality the land
is being put to another use it is difficult to choose between the hyposhy
thetical alternatives One has to consider alternative technologies
1 See Lloyd G Reynolds Introduction in Reynolds ed (1975) fcr furtier iscussion
-59shy
(and hence costs) of production for each crop alternative methods of
production and use and the estimated opportunity costs in addition to
being non-unique would be both locationally and temporally specific
Consider another example where the fuel in biomass energy project
is crop residues (For simplicity neglect the question of alternative
crops andor their material value for residue weights and quality)
These residues may otherwise be lying waste in which case the opportunity
costs for using them as fuel is zero if there were substantial labor
effort in collecting and disposing of them this opportunity cost would
even be negative But suppose they were used as animal feed in varying
proportion It is not just that these residues are not marketed and
hence do not have a price we often do not know what substitutes may be
used as feed at what price and what their availability is
Now suppose some of the residues for one crop were to be used as
fuel It is clear that the losses in animal feed use can be met either
by using another crops residues if available or by substituting a
commercial feed At a given level and composition of livestock the
kcal as well as nutrient requirements are approximately determined
Using data on kcal and nutrient composition of initial feeds one can
in principle construct a feed balance and then estimate the shortfalls
in kcal and nutrients for a given type of animal Depending upon the
level of aggregation one can also examine the distributive impacts of
such shortfalls
-60-
It needs to be pointed out that calculations of such feed balances
based upon nutritional values of different feeds and feed requirements
of different animals does not by itself answer the question of economic
opportunity costs it simply gives us a physical measure of shortfalls
in availability However given such calculations one can in principle
identify the proper substitute feeds for a particular crop residue and
estimate its cost
There are practical problems with these procedures too Data on
nutritional values of particular crop residue may not always be available
Only recently were nutritional data on some of the tropical feeds published1
by FAO Feed requirement data for animals in US or Western Europe are
not necessarily applicable to animals in the Third World agriculture2
However either of the two principle systems - the Swedish one used more
extensively in Europe and Northern Africa an the US one used in
Northern America - for calculation of feed balances may in principle be
used to create similar systems in the Third World as well
The discussion so far has assumed a static scenario in the sense
that feedback and second-round effects are not considered And these
considerations usually are the important motivation in planning for
non-conventional energy technologies For example while diversion of
crop residues to fuel use may result in a shortfall in the present
availability of animal feed one must consider that such fuel use in
an irrigation technology actually leads to increases in crop production
and hence in availability of residues in the next period In fact not
1 IAO (1)75)
2 Cullison (1975) for examnle
-61shy
only should we consider these additions to crop and residues in physical
balances and in cost benefit analysis but also that-they make possible
additions to livestock increases in quality of livestock and so on
For a large enough project a systematic study of such interrelationshy
ships should be made crop studies feed nutritive studies feed balance
studies etc need to be conducted At a sufficient level of disaggreshy
gation combined with detailed information on social structure and reshy
lations one can also use such studies to forecast distributive impacts
of technological change
It should be noted that neither the case studies presented here
nor the additional case studies in Annexes 1 and 2 are supposed to be
complete each one has different focus highlighting one aspect at a
time For reasons discussed above it has not been possible to include
the analysis of opportunity costs estimation of shadow prices or to
incorporate explicit value judgements in assigning parameter values to
distributional or other social non-efficiency criteria As should also
be obvious the cases are not readily comparable in their contexts costs
benefits appropriateness of selection criteria or technological design
And yet the case studies present different aspects of applicable
methodologies for the economic valuation of non-conventional energy
technologies Whereas the results cannot be transferable in toto to
other contexts and problems it is hoped that at the present level of
knowledge and data availability these methods can be used in more
general fashion
-62shy
IV1 Social Benefit Cost Analysis of a Family Biogas Plant1
In this case study of a family biogas plant in Indian conditions we
attempt to present the principles which could be used for similar case
studies elsewhere The example below shows that the most difficult aspect
of social cost analysis in the renewable energy field is the quantification
and valuation of-direct and indirect benefits and costs However for
any appraisal of appropriateness of a mix of technological alternatives
it is absolutely necessary to trace through its impact on the rest of the
economic and social system Since resources going to a given technology
say biogas plants have alternative uses one should be able to demonstrate
that not only are the aggregate benefits to the society in this particular
use higher than aggregate costs but that benefits per unit of capital
costs in this case are higher than those obtained in other activities
Thus efficient use of resources would require benefits to be higher than
costs in such a way that a reallocation of resources away from this
particular use does not increase the total welfare of the society
(Figure IV-l)
An economic appraisal (from the point of view of society) of investment
in a biogas unit would require quantification and valuation of primary
benefits as well as of the direct and indirect costs associated with the
installation of the plant
iFor details see Bhatia (1977) and Bhatia (1980) This section draws heavily on the latter
-63-
These benefits and costs may be enumerated as follows
A Primary Benefits
1 Biogas as a source of fuel 2 Digested manure or slurry as fertilizer
B Secondary Benefits
1 Convenience of cooking with a clean fuel 2 Reduction in uncertainty of energy supply 3 Renewable source of energy 4 Self-sufficiency in terms of reduction of imports 5 Employment to the local people 6 Possibility of using vegetable wastes and human wastes 7 Reduction in health costs due to anaerobic digestion
C Dirc- Costs
1 Capital costs
a cost of land b civil construction c gas holder d pipes and appliances
2 Operating Costs
a cow dung used as major input b labor for dung collection c labor for operating the unit d cost of painting and hosepipe etc e cost of water
D Indirect Costs
1 Depriving poor classes of cow dung
2 Management problems
3 Inconvenience of mixing cow dung with water and feeding the slurry
Valuation of Primary Benefits
Biogas units are available in various sizes ranging from capacities
of 2 cubic meters (70 cubic feet) of gas per day to 140 cubic meters
(4948 cubic feet) er day The smallest sized unit of 2 cubic meters
Figure IV-I
FRAMEWORK FOR ESTIMATION OF COSTS AND BENEFITS
Estimation of Costs
Shadow Prices of
NationalRegional Resources
- Capital
-7
Outu
Estimation of Benefits
Weights on Distribution of Benefits
Agricultural Workers
- Skilled Labor
- Foreign Exchange
(To account for all imported or exportable inputs such as steel cement PVC machinery etc )
Energy Technologies
[Poor Farmers
Artisans
Local Resources
- Unskilled Labor
- Bricks
Energy Using Equipment tput
Large and Medium Farmers
- BambooWood
Others
-65shy
(cu m) requires about four to five animals and can produce enough gas
to meet the cooking requirements of seven persons We present here a
detailed social benefit cost analysis of investment in a family size
biogas unit of 2 cu m per day 1
Two major benefits from a family-size biogas unit are (1) gas to
be used for cooking and lighting and (2) digested slurry to be used as
fertilizer manure The valuation of these benefits involves estimation
of the quantity of gas obtained quantity as well as quality of digested
manure obtained and the monetary values which can be assigned to gas
and fertilizer nutrients to reflect the benefits to society The details
of estimation of benefits are described below as well as given in Table 14
A 2 cu m per day (70 cftday) plant can produce enough gas to light
2 lamps of 100 candle power (each for two hours) and to provide for the
cooking needs of 5 persons assuming the requirements 5 cfthour for
each lamp and 10 cftpersonday for cooking The value of this gas
to society can be measured in terms of the economic cost of providing
alternative sources of energy for lighting and cooking if investment
in biogas is not made2 The source of energy for lighting would be
kerosene in villages without electrification while it would be electricity
or kerosene in electrified villages Now 20 cft of gas used in lighting
can be replaced by either 32 kwh of electricity or 037 litres of
rosrn Te cost of t i- io rtakin
For details see Bhatia (1977)
2-This assumes that cow dung fuelwood and kerosene currently being used have to be replaced by other fuels on account of considerations of social productivity of cow dung as manure deforestation problems caused by fuelwood and high foreign exchange costs of imported kerosene Valuation of bencfits Lcomes more complex if thtse assumptions are not valid as shown later in the case of community plant
-66shy
the economic costs of electricity at $0022 kwh to account for the
variable costs of generation assuming that the costs of generation
transmission and distribution are fully allocated to energize wells
The equivalent cost of kerosene at $04 per litre is $015 per day
Thus if bioqas is available for lighting society would not have to
incur $015 per day in terms of equivalent quantity of kerosene Hence
the benefit to society from using 20 cft gas for lighting can be taken
to $015 per day or $53 per year
On the same lines it would be economic for the society if soft
coke instead of kerosene is used for cooking Assuming a delivered
price of soft coke at $8 per ton the resource cost of 125 tons of
soft coke for cooking (equivalent to the use of gas for cooking 50
cftday) would be $10 per year Thus in the absence of gas from a
biogas unit the costs to the society of providing alternative fuels
would be $63 per annum This can be used as a measure of the benefit
that the society derives from gas from the unit This analysis so far
assumes that there is no additional benefit from additional quantity or
better quality of slurry from the unit If it is assumed that there is
an improvement in the form of nitrogen available the annual benefits
will be higher by $55 per year (See Table IV-I
Valuation of direct costs is relatively straight forward Both the
capital costs and operating costs can be broken down in trhee components
steel cement and unskilled labor For each of these items one can use
appropriate shadow prices to obtain the estimates of cost form the viewpoint
of the society It may be noted that use of shadow prices of steel and
cement recuires use Of shadow lprice of foreign exchange which is used to
-67shy
reflect the premium that the society attaches to foreign exchange on account
of its scarcity Use of shadow prices thus takes explicitly into account
the self-reliance objective of development planning Similarly the
objective of providing additional employment of unskilled workers has
been taken into account by the use of shadow wage rate for unskilled
labor which is lower than the market wage rate This gives the estimated
capital cost of a biogas unit (conventional KVIC design) at $290 and
annual operating costs (excluding cow dung) as $9 per year The
corresponding costs for a Chinese-design unit are $175 and $9 respectively
(See Table IV-2)
In accordance with the earlier discussion on decision criteria we
utilize an appropriate social rate of discount to calculate net present
value (NPV) and benefit cost (BC) ratio
The results of the benefit cost analysis of a family biogas unit are
presented in Table IV-3 It may be noted that NPVs are positive in all the
cases and BC ratios are much above unity As was expected BC ratios are
higher in the case of shadow prices (due to zero shadow wage rate and 25
percent premium on imported kerosene and area on the benefit side) than
under the market price assumptions Since the capital costs of a
Chinese-type design are considerably lower and benefits are assumed to
be the same as in the case of conventional design the BC ratios with
the Chinese-design units are relatively higher If however it is
assumed that there would not be appreciable increase in the nitrogen
content of biogas slurry due to handling practices of farmers and hence
manure benefit is ignored the BC ratio would drop to 124 in the case
-68shy
of conventional design The IRR in this case is 13 percent indicating
that the project would be socially unprofitable if social rate of discount
is higher than 13 percent or shadow price of investment is used along with
a lower discount rate
It may also be useful to perform sensitivity analysis of the results
with respect to (a) nationalregional parameters such as social rate of
disount shadow price of foreign exchange or shadow wage rates (b) commodity
prices such as the price of kerosene soft coke urea dtc (c) technical
parameters such as methane content of gas calorific values of kerosenesoft
coke NPK content of slurry etc These sensitivity analysis results
would show how robust the earlier results are and which are the parameters
which are important in determining the social profitability of the
technology
Care should be taken to incorporate the secondary benefits as well
as indirect costs of biogas units in social benefit cost analysis Even
if these cannot be quantified it would be useful to list all such
benefitscosts along with the BC ratios such that the policy maker can
compare and evaluate different technologiecal or policy options For
example it is said that availability of pollution free clean fuel is
expected to improve the quality of rural life Besides instant
availability of gas makes cooking more convenient and faster Since
these benefits are important considerations in persuading a prospective
user to opt for a biogas unit these would significantely affect the
private benefit cost analysis it would not be appropriate to put a
specific premium on these benefits as these family biogas units are to
-69shy
be installed by relatively richer farmers In fact a smokeless fuel
such as LTC (low temperature carbonization) coke isavailable in the
market which can provide the equivalent benefits Similarly it is not
considered necessary to attach special premium to the fact that the biogas
unit reduces the uncertainty of energy supply since adequate stocks of
alternative fuels (eg soft coke and kerosene) can be maintained by
the prospective owners of biogas units
Another benefit of these units generally mentioned is that reliance
on the use of biogas as fuel involves neither dependence on import of
foreign energy resources nor dependence on a diminishing supply of domestic
energy resources The first point is already taken into account by giving
a premium on foreign exchange for the import of kerosene The second
consideration would require a special premium on soft coke if the reserves
of non-coking coal were relatively small Since India has more than 12000
million tonnes of proved reserves and over 48000 million tonnes of indicated
and inferred reserves of non-coking coal (enough to last 150-200 years) it
does not seem appropriate to put a special premium on the cost of soft coke
The decentralized technology of biogas production would provide
employment to the skilled and unskilled laborers in construction of these
units in maintaining the units as well as in the collection of dung These
employment benefits have already been quantified and incorporated in the
social cost benefit analysis in terms of zero shadow wage rate of
unskilled labor
Possibilities of using vegetable waste and human excreta would be
additional benefits of biogas units if these astes cannot be utilized
-70shy
either in compost manure or direct in the field Given the inhibition
regarding use of hunan excreta for producing gas for cooking it is too
early to quantify and attribute these benefits to biogas technology The
other vegetable wastes can be used both in scientific composting and in
biogas units
The only significant indirect benefit of biogas technology seems
to be in terms of health benefits The smokeless flame of the gas
contributes to eliminating eye troubles and environmental polliftion
It has been indicated that other health costs are also probably diminished
since the process of anaerobic digestion is known to kill many of the
pathogens transmitted in cattle dung Besides the manure pit which
is often the cause of flies and mosquitoes becomes free as the outlet
slurry (digested manure) does not attract these insects Rather they run
away from the pit due to some repelling odor that comes from the slurry
The health benefits of biogas technology are confined to those units
where latrines are attached to the gas plants It has been found that
only a small percentage of the individual family gas plants were connected
with latrines It is also observed in a study that almost the whole
sample irrespective of the socio-economic status was prejudiced against
laterine connections and had experienccd problems in this connection
With this bias against the use of night soil in a gas plant most of the
plants are not in a position to get the associated health benefits
Besides even in plants with attached latrines it has not been shuwn
that the health benefits of anaerobic digestion are better than those of
aerobic digestion However there is a need for a detailed analysis and
1TK Moulik and UK Srivastava (1978)
-71shy
quantification of health benefits of biogas technology as compared with
the scientific compost technology In the absence of such knowledge it
would be inappropriate to give credit to biogas technology for indirect
health benefits associated with the installation of these plants
The main element in indirect costs may be that the installation of
biogas units by rich farmers would result in an increasing tendancy to
have stable-bound cattle in order to augment the collection of dung and
urine This would deprive the poorer sectioncs in rural society (landless
laborers and marginal and small farmers) of a cheap source of fuel for
their energy needs The effect of installation of biogas units on the
availability of fuels to other sections of the society has not yet been
studied in detail This would require a comprehensive survey of villages
where these plants have been installed There would also be regional
variations in the practices followed regarding collection and disposal
of cow dung Hence these effects would have to be quantified and
incorporated in the context of some specific investiment in biogas units
On aspect of social benefit cost analysis which has to be kept in
mind is that even though many objectives such as employment generation
regional development income distribution self-sufficiency and use of
local resources etc can be taken into account by using shadow prices
instead of market prices there may still be intangible benefits and
indirect costs (arising on account of externalities) which cannot be
quantified Such benefits may deal with convenience ease of operation
flexibility mobility versatility which though difficult to quantify can
be expressed in terms of preference scales of the users If social benefit
It has been reported in studies on Chinese biogas programs that one of the important motivations of the Chinese program was the health benefits from disposal of human excreta and pig manure
1
-72shy
cost analysis is modified to incorporate these preference scales along
with use of benefit cost ratios it can still be used to evaluate
technological and other alternatives The strategy suggested here is
to broaden the methodology of social benefit cost anslysis by incorporating
these considerations
It may also be useful to consider some special resource requirements
or special adaptability problems of some technologies In the case of
family biogas plants availability of land and water in adequate
quantities near the kitchen may be a serious constraint for many villages
and may well be an important reason for its non-adoption In the case
of the photovoltaic system it may be the difficulties of leaving these
in the open spaces in the field under heavy monsoon conditions resulting
in damage or theft
-73-
TABLB IV-l ESTIMATION OF BENEFITS OF A 70 CFT (2 CUBIC METER) PER DAY FAMILY BIO(A5 PLAIT
Market Prices Shadow Prices
Annual Benefits
1 Lighting
Gas used at 20 cftday $40 $53 and valued at equivalent kerosene prices
2 Cooking
Gas used at 50 cftday $31 $10 and valued at equivalent soft coke prices
3 Manure (Additional)
Additional N content $35 $55 of 06 in 1336 tons of biogas slurry valued at urea prices
4 Total $106 $118
Present Value over 10 years
At 8 interest rate or $671 $798 discount rate
Notes 1 The following conversion factors have been used Lighting Conversion Factors
37 liter kerosene = 32 kwh of light 20 cft gas = 32 kwh of light 1 liter kerosene = 5405 cft gas
Cooking Conversion Factors
1 cft gas = 70 kcal (125 kcal at 56 efficiency) 1 liter kerosene = 1720 kcal at 217 efficiency) 1 kg soft coke = 5772 kcal (177) = 10216 kcal (5772 kcal
at 177 efficiency) 1 cft gas = 70
10216 kg sfot coke
2 K(osene Prices $025 per liter market price $040 per liter shadow price Soft Coke Prices $25 per ton market price $8 per ton shadow price assuming that two-third of coal costs are unskilled labor valued at zero Urea Prices $02 per kg at market price $030 per kg shadow price Assuming N content of 16 in biogas slurry or agains 1 N in cow dung (dried basin)
-74-
TABLE IV-2 CAPITAL COST C CONVENTIONAL AND CHINESE-TYPE BIOGAS PLANTS IN INDIA 70 cftday
Market Prices Shadow Prices
A Conventional Design
1 Digester Well Skilled Labor 714 714 Unskilled Labor 357 00 Materials (cement amp 357 446 steel)
Sub-total 1428 1160
2 Gas Holder (steel) 1166 1458
3 Appliances 320 400
Total 2904 3018
B Chinese Design
1 Digester Well 1430 1160
2 Appliances 320 400
Total 1750 1560
Notes 1 Unskilled labor is shadow priced at zero A premium of 25 percent is used for cement and steel
2 There is no steel gas holder in the Chinese-type design and hence the capital costs are lower
-75-
TABLE IV-3 RESULTS OF BENEFIT COST ANALYSIS OF A FAMILY BIOGAS PLANT
Market Prices Shadow Prices
A Conventional Plant
1 Present value of $671 $798 Benefits ( 0) P(B)
2 Present Value of $ 57 $ 57 Operating Costs P(C)
3 Present Value of $290 $302 Capital Costs P M)
4 Net Present Value $324 $439 NPV = P(B) - P(C) - P(K)
5 BC Ratio 2bull12 245 P(B) - P(C)
P(K)
6 Internal Rate of Return 35 (IRR)
B Chinese Design
1 NPV $439 $585
2 BC Ratio 350 4-75
3 IRR 71
-76shy
IV-2 Rural Energy Systems Sample Analysis of Irrigation Plans
The complexity of the rural energy system arises from the variety
of energy sources often available and used as well as of the many different
uses to which these resources are put for both energy and nonenergy purshy
poses Thus attempting to intervene in this system in an optimal
manner requires understanding of the system and how its equilibrium will
be changed This understanding should be based on a detailed picture of
resource endowment of the areas and the resource flows between and within
the different village sectors which take into account variations by seashy
son and by economic class It is thus necessary to identify current
energy use levels and patterns the magnitude of potential energy
resources and to collect important socio-economic information
The purpose of this analysis is to identify the most attractive
or beneficial new energy technologies for introduction to the system
First the technical and socio-economic feasibility of the different
candidate technologies must be assessed Then a more precise analysis
should be performed to determine the most attractive yet feasible techshy
nologies The first step here relies on resource assessment information for
the aggregate village or locale For wind and solar technologies the
resource availability is primarily a technical issue For biomass techshy
nologies there is a significant socio-economic factor concerning access to
and ownership of these resources Biomass technologies have added comshy
plications in that the availability of biomass can be purposely increased
if sufficient benefits can be obtained In this case such a use of
1 This discussion draws heavily from deLucia and Lesser (1980)
-77shy
resources must be examined in comparison theto altershy
natives Furthermore biomass resources often have existing uses and
the diversion costs must be assessed1
land and other
The second aspect of the analysis examines the costs andbeneshy
fitdof the technologies Overall this work evaluates the technologies
in light of the different energy demands and their characteristics quality
magnitude time pattern by day and season This framework requires
a systems approach -- examining the different supplies and demands toshy
gether
The following is a sample analysis that will examine various intershy
ventions in a representative village in Northeast Thailand The analysis
will estimate the benefits and costs of different irrigation schemes
under varying economi and technical conditions It will specifically
examine the situation of three classes of farm size Tha relative attracshy
tiveness of the different technologies will be compared for varying costs
of capital shadow prices for foreign exchange and reliability assumptions
There will also be discussion of the feasibility of the technologies
such as availability of and access to the necessary resources
This example is limited in that it does not address all energy
uses or technologies A more complete analysis would include examination
of the value of additiona or substitute energy sourceL or technologies
for other uses such as cooking agricultural processing or tilling
In light of the work done examining the potential for irrigation in the
Northeast and the need for increasing agricultural production in this
1 For reasons discussed earlier estimation of opportunity costs of land and forest products is an extremely difficult task requiring information which is not available at present Hence these would be ignored in what follows
-78shy
area this issue is considered to be of high priority
First a picture of the economic and demographic situation and
of the resource flows will be presented This picture will represent
the kind of information often necessary to analyze the impacts of intershy
vention Then in the ensuing sample analysis it will be shown how
this information can be used
Northeast Thailand Village Model
This village is representative in the sense that the per capita
resource endowments land use patterns and general economic conditions
reflect those for the Northeast in general Therefore much of the inforshy
mation used was aggregate figures for the entire Northeast that were
scaled down to village-level quantities These aggregate data were supshy
plemented by several village-level studies of locations in the Northeast
as well as elsewhere is the country
For regional information the sources generally used were the reports
by Russell Brannon Agricultural Sector Assessment -- Thailand (January
1978) and by the World Bank Thailand Toward a Development Strategy
of Full Participation A Basic Economic Report (September 1978) Also
used were several Agricultural Economics Research Bulletins prepared
by the Division of Agricultural Economics MOAC as background work
for Thailands Fourth Five-Year Agricultural Development Plan (BE 2520-2524)
The distribution of farm sizes is based on data from the General Farm
Survey 197374 by the Division of Agricultural Economics MOAC which
-79shy
was presented in the Brannon report The village-level cropping pattern
is based on information from all of these reports
Village level livestock population figures were derived from MOAC
and Brannon Farm and household level information was available from
the studies by the Chulalongkorn University Social Research Institute
such as Village Khon Kaen -- Social and Economic Conditions of a Rural
Population in Northeast Thailand by Amara Pongsapich with the collaboshy
ration of Jacques Amyot and Friedrich W Fuhs (Bangkok 1976) This
study surveyed village and household level data for four villages in
Khon Kaen province duuring the late 1960s Other descriptions of vilshy
lage life were also examined For information on woodfuel supply and
demand the FAO study Timber Trends Stud Thailand (Rome 1972) was used
The Village Model
This village has 105 families and a total population of 677 people
Of the 105 households in the village 100 are primarily farmers while
the remaining five include the miller two teachers a store owner and
possibly a Government official The farmers can be divided into three
classes small medium and large according to farm land and livestock
resources The average household size for the village is nearly 65
people Slightly more than half of the families are nuclear rather than
extended however this varies over time as families pass through the
cycle of nuclear to extended to nuclear as the family size expands when
the children and their spouses set up separate households Table IV-4 shows
the basic demographic data along with average land ahd livestock resources
by class Average farm size is 23 rai
1 hectare = 63 rai
-80-
TABLE IV-4 VILLAGE DEMOGRAPHIC LAND AND LIVESTOCK RESOURCES BY CLASS
PER HOUSEHOLD
Family Type Person Average Parm No of Animals
Class Nuclear Extended Household Size (rai) Cattle Buffalo Pig
Nonshy
agricultural 100 0 4 - - - 1
Poor 80 20 5 94 0 1 0
Middle 50 50 65 254 1 2 025
Rich 25 75 85 625 2 25 1
TOTALS
Number NumberTotal Number of Animals Number of of Total Farm
Class Households Persons Land (rai) Cattle Buffalo Pig
Nonshy
agricultural 5 20 - 0 0 5
Poor 23 115 216 0 23 0
Middle 56 364 1400 56 112 14
Rich 21 178 1313 42 53 21
TOTAL 105 677 2929 98 188 40
Net of two percent for household structures
-81-
With regard to agricultural production although rice (glutinous
with some non-glutinous) is the primary crop the principal upland crop
varies depending on location in the Northeast In this village as is
typical of the Northeast there is no double cropping and all rice is
rain-fed only The cropping intensity (percent of farm land actually
planted or harvested) was assumed to be about 60-65 percent with 70 pershy
cent of the crop land planted with rice The cropping intensity was
varied slightly by farm class being higher for the poor and lower for
the rieh Despite the availability of aggregate cropping pattern data
for the Northeast no detailed information was located on how cropping
patterns vary by farm size It was assumed that small farms grow only
rice that medium farms plant 80 percent of their farmed land with rice
and that the large farms plant slightly over half their land with rice
When a village-level average is calculated the regional average of about
70 percent of planted land in rice is met Table IV-5 shows the cropping
patterns and the levels of agricultural production for the different
classes The yields per rai used were 220 kg rice 1980 kg cassava
340 kg maize and 1L0 kg kenaf
As can be seen from Table IV3 the village as a whole produces a
surplus of rice however on a class level some transfer will be reshy
quired possibly in the form of income for agricultural work or for sershy
vices such as rice milling The level of this surplus reflects the fact
that reportedly the Northeast as a whole presently produces a five-percent
surplus and that the farm households must also -upply the non-agricultural
households which are about 25 percent of the total households in the
Northeast
TABLE IV-5 VILLAGE AND CLASS CROPPING PATTERNS AND AGRICULTURAL PRODUCTION
I Cropping Pattern
Per Farm Per Class
Cropping Land Harvested (rai) Land Harvested (rai) Class Land (rai) Intensity Total Paddy Other No of Farms Total Paddy Other
Poor 94 70 658 6-58 0 23 1513 1513 0
middle 254 65 1625 1300 325 56 9100 7280 1820
rich 625 60 3750 1976 1774 21 7875 4149 3726
VILLAGE TOTAL shy 105 18488 12942 5546
Village Cropping Intensity 63
co Percent of Land Harvested in Paddy 70 (assumption based on NE cropping patterns) a
II Agricultural Production (metric tons annually)
Per Farm Per Class
Other Other
Class Paddy Cassava or Maize or Kenaf Paddy Cassava or Maize or Kenaf
poor 145 0 0 0 333 0 0 0 middle 286 645 or 109 or 049 1701 361 or 61 or 28
ri ch 435 352 or 596 or 270 813 739 or 125 or 57
VILLAGE TOTALS 285 1100 or 186 or 85
These cropping patterns do not take into account vegetable gardens The other category for the NE could I( cassava maize or kenaf depending on location and market conditions
The yields were taken from Brannon for the NE they were assumed to be constant over farm size thoughtLcru is some evidence that the smaller farms obtain higher yields
TABLE IV-6 VILLAGE AND CLASS FOOD BALANCES (RICE ONLY)
Per Household Per Class
Paddy Net Rice Annual Surplus (+) Net Rice Annual Surplus (+) Production Availabi- Demandt Deficit (-)tt Availabi- Demand Deficit (-)
Class (tons) lity (tons) (tons) (tons) lity (tons) (tons) (tons)
non-agricultural 0 0 066 -066 0 33 -33
poor 145 080 083 -003 184 190 -06
middle 286 167 107 +060 937 599 +338
rich 435 254 140 +114 534 295 +239
VILLAGE TOTALS 1655 1117 +538
Due to the varying availability of a second food crop and since it appears that possibly 00 percent of a rural NE Thai caloric intake is in the form of rice a daily caloric intake of rice was assumed to be 1600 kcal or one pound of rice daily This intake level amounts to 165 metric ton of rice per capita annually this figure nearly matches the average apparent domestic per capita intake nationally over the past 10 years Although there are undoubtedly variations in food and rice consumption across class this was not included due to lack of specific data An NESDB nutrition study caloric figure nationally was 1900 kcal per person 95 percent of which was from non-meat and dairy sources This would be comparable to the 80 percent1600 kcal figure for rice for the NE taking into account the probably lower average intake (if tilu NE in comparison to the national average
Net rice availability is assumed to be the total amount of rice produced on the farm (65 percent of
paddy production) less 10 percent for losses and seed requirements
[Annual demand is 165 for rice per capita multiplied by number of persons per household
ViSurplus or deficit is net rice availability less annual demand
-84-
Table IV-7 and IV-8 examine the availability and demand for animal feed
This situation could vary significantly depending on location in the
Northeast Villages growing maize will have an abundant source of feed
from crop residues whereas cassava or kenaf producing villages may
require pastureland off-take to supplement their supplies of paddy residues
These tables slmnarize the present agricultural situation of this
village Although a detailed calculation of the conditions of the village
in the future was not undertaken some trends seem likely based on the
results of the National Crop Model of Thailand for the present Agricultural
Development Plan Two of the major pressures on the Northeast agricultural
situation will be increasing population growth and decreasing soil fertility
The forecasts for 1981 indicate decreasing rice yields and an overall
decrease in total crop income The Northeast is expected to become a
net importer of rice to meet household needs Therefore on the village
level the rice surplus will decrease as the ratio of farmland to populashy
tion decreases The poor will need to earn more income in order to be
able to purchase rice In general the per capita availability of resources
will be less
With regard to the availability of wood fuel in the Northeast
a regional average would be misleading in light of the wide variation
in actual availability in different parts of the Northeast Whereas
the northern and western parts of the region still have forests much
of the rest has few forest resources
-85-TABLE IV-7 VILLAGE AND CLASS FOOD AND FEED BALANCES
Villaqe Feed Requirements
Crop Residue
Equivalent to Number of Total ResidueAnimal Annual IntakeNeed 60 of Intakel Head Demand
(tons) (tons)
Cattle 52 x 106 kcal 16 98 157 Buffalo 83 x 106 kcal 25 188 470 Pig 20 x 106 kcal 06 40 24
60 Annual Feed Requirement 651 tons An approximation based on the nutrient balance example examined in Table 5
Village Feed Availability from Crop Residues Crop Production Residues Total Crop
Crop Residue (tons) Crop Ratio Residues (tons) Paddy Straw 285 20 570 Paddy bran 285 005 14 Maize residues 186 25 465 Cassava leaves 1100 02 220
Total kenaf growing villages 584 cassava growing villages 804 maize growing villages 1049
illage Balance
For maize growing villages crop residues exceed 60 of the annual feed requirements The remainder can be met by offshytake from grazing
For cassava growing villages crcp residues exceed 60 of the animal feed requirements Since cassava leaves are highin protein and nutrients (see Table 3) these satisfy some 75 of the feed requirements the remainder to be met by offshytake from grazing
For kenaf growing villages only 40 of the feed requirements maybe met by residue (The possible use of kenaf residue adds some unknown quantity) The remainder must be met by offtake from grazing
)usehold Feed Balances (including only paddy straw) Annual Deniand of On-Farm Rice Straw Shortage(-) Straw for Feed Availability or Surplus (+)
CJass (tons) (tons) (tons)
non-agricultural Only animals in the class are the 40 pigs which are not fed straw (they are fed bran by the miller who owns them)
Poor 25 29 +04 Middle 67 57 -10 Rich 100 3 -13
-86-
TABLE IV-8 FEED CHARACTERISTICS AND FEEDING REQUIREMENTS
A Feed Characteristics for Digestion by Cattle or Buffalo
Digestable Crude Total Digestable Feed Protein () Nutrients ()
Paddy Straw 04 371 Paddy Bran 93 649 Maize Stalks 21 567 Cassava Leaves 150 600 Pasture Grasses 40 600
The numbers in this table are representative of the chosen Thai feeds This type of information varies among different crop variety different cultivation and harvesting practices different climates and different animals The principal sources used were Tropical Feeds (GOhl FAO Rome 1975) and Feeds and Feeding (Cullison Reeston Pub Co Reston Va 1975) The pasture grass characteristics are rough averages of the various grasses native to Thailand noted in Gohl (1975)
B Example Feed Balance for a 500 Kg Buffalo
Dry Matter Digestable Crude Total Digestable (kg) Protein (kg) Nutrients (kg)
Daily Feeding Requirement 125 06 635
Feeds Paddy Straw 70 028 260 Cassava Leaves 30 45 18 Pasture Grasses 25 1 15
Total Feed Characteristics 125 58 590
This is an analogy to bullock maintenance in India (SP Arora The Role of Treated Roughage in Animcal Production Systems in Developing Countries in New Feed Resources FAO Rome 1977) This weight is equal to that of the mature buffalo in Thailand so it is somewhat larger than the appropriate average weight
Note Even with significant intake of cassava leaves and pasture grasses
the protein and nutrient in the feed fall short of the assumed feeding
The Thai village livestock are assumedrequirement in this example to have somewhat deficient diets but their exact feed parameters have not
been investigated For the crop residue balance in Table 2 a 60
intake of paddy straw and maize residues was deemed appropriate
-87-
According to the 1972 FAO timber study Northeast forest land had
on the average about 43 m per hectare standing stock with an annual
increment of about 10 m3 This compares to the reestimated country
averages of 715 and 18 m per hectare respectively The total Northshy
east demand for residential wood fuel in 1970 according to the FAO study
was 163 million cubic meters (115 fuelwood and 48 charcoal) Comshy
paring this demand with the total annual increment of Northeast forests
of about 8 million cubic meters the infeasibility of meeting the deficit
from non-forest land clearly indicates at least one motivation for the
apparent deforestation of this region In fact according to recent
statistics the forest area of the Northeast was reduced to 510 million
hectares in 1973 according to the Royal Forest Department from the
estimated 78 million hectares in the FAO study
The sources of non-crop biomass for-a village or household in the
Northeast generally fall into the following categories
1 forested and deforested public land
2 farm or private land and
3 imported or purchased biomass
At present information concerning the sources of wood fuel is
very limited The FAO Timber Trends study had national demand met by
the annual increment of small-size forest timber plus a variety of other
sources such as mangrove forests rubber plantations removals by shifting
These figures were adapted to reflect both sawlog size and small timber
Division of Agricultural Economics MOAC Fourth Five-Year Agrishycultural Development Plan BE 2520-2524 Guidelines AgriculturalEconomics Research Bulletin No 114 August BE 2519 Chap 2 D 7
-88shy
agriculture falling losses off crows (falling timber tops) and proshy
duction from farmlands The latter source farmland production was 3
the largest of these other sources at 8 million m in 1970 Given the
total area of farmlands in 1970 of about 155 million hectares the
average off-take was about 05 m3 per hectare from farmland No regional
estimates of this off-take were presented but in light of the relatively
low productivity of Northeast forest land for the purposes of this
exercise it will be assumed that Northeast farmland yields 03 m3 of
wood fuel per hectare annually For grazing or animal feed purposes
it will be assumed that deforested public land and non-cropped private
land yields one ton per hectare of feed annually This figure is meant
to be conservative to represent the fact that if such land were signishy
ficantly more productiveit would be planted however no actual figures
concerning the productivity of this land were located
Based on these estimates of useful biomass productivity the arious
land requirements involved in meeting domestic wood fuel and grazing
can be examined First the resources available from the village farmshy
land will be summarized Non-cropped farm land amounts to 35 percent
of total farm land )after netting out 2 percent for household structures)
Therefore about 1025 rai or 164 hectares of land is available for
some animal grazing with a potential yield of about 164 tons of feed
annually this amount appears to be adequate to meet the feed requireshy
ments not met by rice straw and bran On the household level based on
this possible off-take of feed from non-cropped land the medium and large
-89shy
farms are able to supply themselves with sufficient feed for their
livestock from their residues and their non-cropped land
With regard to wood fuel annual domestic demand in the Northeast
3 according to the FAO study is 135 m per person therefore the total
3 model village demand is 914 m annually If the annual yield from farmshy
3 3 land is 03 m per hectare this source would contribute 141 m or about
3 15 percent of the total demand The remaining 773 m must be met by
either forested public land or imported wood fuel If this amount were
supplied by the annual increment of the forests about 770 hectares of
forest would be needed -- an area equal to about 165 times the area
of the village For the Northeast forest land area in 1970 was about
85 percent of the farmland and since forest land has been decreasing
this ratio (165) of accessible forest to farmland is only rarely availshy
able The remaining options for wood fuel supply are imports or deforesshy
tation If total forest clearing were practiced about 18 hectares of
Northeast forest land would be deforested annually to meet village
level requirements
Figure IV-2 is a flowchart outlining the major resource flows within
the village The quantities indicated are all based on Tables IV-4 through
IV-8 and the accompanying text The circles in the figure represent opporshy
tunities for the introduction of village-level energy technologies
Technology A could be improved charcoal production improved stoves
a micro-hydropower project or a village woodlot Technology B could
FIGURE IV-2 VILLAGE ENERGY-RELATED RESOURCE FLOWS NORTHEAST THAILAND
___________allery_(fuel domesllic labor Ao (1iouseholds 105 flamllic 677 peopla
domeslir loriov lot fuel collecilon - e rdoiealabor auppty dlnklng wolct sc - 9gicullu |allabor upply 3
4 |- fuel use (cooking) dcmond- 914 m wooduicsPrwolc luel (825 mdwood) food IWake 112t rice meat vcaatiblc$
- catailsconaliuclion maoltrloI f oo
- alonds Ionapoelollon ogulcullulol wohfoQlhod Co
-pasLurciand 6lO0t ceV or lenergy 85t L1co or
Li veilocta IS8 buffalo 98 cpq L40 pigsCsIurplus food (54L rice - dalpoweA cash claps
I Clb~ bo manure ISampDurCI r ______i __upplies- Crop processing o
food (Ie 1lcc lhic thing drying enrydraft powe fue a odI ukn$
(alicd villoge i rt
584t atra bran tchnology
- a lry Cio lonslucilon (alerl crop + rcladushy
to iduca energy o tertlize ryn
chemi~cl Culllvaed land 1850 rat pea icldesamp ci cuIda - load Ciops rice vegatable
Cncr yY f~ ~ y i
- Cash GlQp61 cassava- or maiza or kenat fdegogwth
energ
tcop rastdues
_tchnolo
-91shy
be biogas or pyrolysis or gassification (or even composting) Techshy
nology C could be solar pumping or solar drying Because of the diverse
but interdependent use pattern of different resources the introduction
of an energy technology will alter a multitude of resource flows
The Benefits and Water Requirements of Irrigation
In this village agricultural production is clearly the primary
sector however in recent years this sector has exhibited some stagshy
nation Unit productivity or yields have remained relatively constant
and in some cases have decreased The growth in agricultural output
is mainly due to the expansion of the land farmed which in turn along
with wood fuel demand has contributed to deforestation as well as to
use of land marginally suited to agriculture In order to increase
yields a large increase of the inputs to agriculture has been attempted
high yielding varieties mechanization fertilization irrigation pesshy
ticides Most of these inputs reflect or require the use of greater
amounts of energy
Irrigation can increase yields of agricultural production when
applied separately as well as in conjunction with other new inputs
All indications are that at least for a significant proportion of
the developing workd pumping of water for domestic and irrigation supplies will be of paramount concern during the next ten to fifteen years In an excellent paper on small farmers and landless in South Asia Singh (79) argues that the most critical input into the agricultural system in Sou+-h Asia is irrigation water He presents data from India which show that despite the dismally low average fertilizer applications the fertilizer use on the irrigated areas is more than twice as much as on the nonshyirrigated areas This implies that the binding constraint is irrigated area not the farmers technical know-how or fertilizer use
-92-
Irrigation can be achieved in many ways and scalesranging from large
reservoir and irrigation canal systems supplying a large area to a
single pump for a farmer Irrigation from pumping has significant advantages
over other methods involving reservoir or tanks in that it doesnt require
dam costruction land acquisition extensive canal systems or the
establishment of a complex organizational structure Furthermore it
can be scaled to most levels -- household village etc However pumping
(cont)
Singh focuses upon the small farmers and claims that the majority of the worlds poor are among the 625 million people who live in the rural area of Bangladesh India and Pakistan He shows that in 1977 more than 52 million households in these three countries fell into the category of small owner and tenant cultivators with operational holdings less than 5 acres (L2 hectares) This implies a population of more than 250 million people living on marginal holdings If we assume that all the Bangladesh and Pakistani households and 50 percent of the Indian households have a need for irrigation and have available shallow groundshywater or nearby streams then we arrive at a staggering 30 rillion households in the market for low-cost irrigation water pumps In Indonesia the island of Java is home for 100 million people The average farm size is cnly about 12 hectare Because of land scarcity double cropping and use of high yielding varieties are widespread The percentage of farm land which is irrigated is well over 50 In the rest of Asia Africa and Latin America there is probably a demand for a further 10 million water-supplying devices of the same size then a potential market of 40 million small irrigation pumping systems exists
--93shy
has several drawbacks which are only recently being overcome These
problems are concerned with the issues of high maintenance and operating
costs dependence on fossil fuels (whose costs are rising and whose
availability is uncertain) and minimum economies of scale which are
beyond the reach of many
The benefits of irrigation in Northeast Thailand were estimated
in a study by the Asian Institute of Technology (AIT) for the National
Economic and Social Development Board From this work comes a possible
irrigation scheme involving pumping for both growing a dry season crop
and supplementing wet season rainfall The benefit of this setup was
estimated to be about $200 for each hectare1 For this analysis it
was assumed that the per-hectare benefits are constant for all farm
sizes
In analyzing the irrigation potential of an area a variety of
economic social and physical aspects must be considered In addition
to the resource endowments and demographic and socio-economic data inshy
formation is needed that is more detailed and site specific such as
the degree of land holding fragmentation and the local topography These
issues would affect the feasibility and cost of irrigating with a farmers
fields from a single tubewell In this sample analysis it was assumed
that a farmers land formed one contiguous parcel and that the topography
of the land did not require or involve a significant investment in a
1 Asian Institute of Technology Water for the Northeast A Strategyfor Develocnent of Small Scale Water Resources prepared for the National Economic and Social Development Board
-94shy
distribution system An approximation used that is related to this
latter issue is the efficiency of pumping and delivery which is a
function of the distribution setup and its losses In this analysis the
field irrigation efficiency assumed is 60 percent (ie 60 percent of the
quantity of water pumped is available to the plants in the field)
Another set of considerations is the site-specific hydrological
conditions such as the depth of water table the size of the aquifer
and recharge rates These factors affect the depth and therefore the
cost of the well and the feasibility of widespread pumping In this
analysis groundwater was considered to be available at such depths that
the dynamic head of 25 feet could be used in calculating pumping capacities
As to the size of the aquifer and recharge rates it was assumed that these
factors were not constraints In any actual analysis these factors should
be considered to account for any drawdown of the water table as a conseshy
quence of irrigation and to assist in the design of the well
The two major technical components of the demand for irrigation
water are the quantity and seasonality of the water needed by the crops
According to the AIT study under the scenario used in this analysis
3the water needs are 12500 m for each hectare annually The seasonality
of this need was defined by two peak periods and then a flat demand
over the rest of the growing period The number of pumping days annually
was taken to be 250 The water demands were as follows for one hectare
-95shy
1 peak period 200 mm over a 20-day period (100 m3day)
2 secondary peak period 150 mm over a 20-day period (75 m3day)
3 rest of year 900 mm over a 210-day period (43 m3 day)
Based on this irrigation demand and the farm size the minimum
size or power of the pump required can be calculated For some techshy
nologies an assumption has to be made concerning the maximum daily
operation of the pump which in turn affects the total amount of work
which can be performed in a day Theie are both technical and social
aspects to this issue such as recharge rates and work schedules In
the analysis the maximum was assumed to be 10 hours per day As will
be seen because of the limited selection of commercially available
engines the choice of size is almost insensitive to this issue For
other technologies -- solar or wind --this issue is different since
the total amount of daily work is a function of theweather and climate
It is important to note that the basic parameters defining the
benefits and requirements of irrigation in the Northeast are less atshy
tractive or more severe than those commonly used in this type of analysis
Often the benefits are considered or assumed to be significantly higher
$250 rather than $200 for each irrigated hectare Furthermore only
310000 m of water is required as opposed to the 12500 m3 required
in this example These differences make this analysis of the overall
attractiveness of irrigation much more stringent than is found elsew--e
-96-
With this information the pumping power required to irrigate one
hectare can be calculated
3 33 (624 lbft water)(25 ft) (353 ft3M x (100 m pwrd) = 046 HPha
(06 fe)(550 ft-lbsec 10 hd max oper hphr
Note fe is field efficiency pwr is peak water requirement max oper is maximum operation
3
during the peak period when 100 m must be pumped in at most a 10-hour
day The three farm sizes or classes of farms being examined and their
peak pumping requirements are as follows
Cultivated Peak pumping Land Requirement
Small 105 ha 05 HP
Medium 264 ha 12 HP
Large 600 ha 28 HP
Identification of Irrigation Options
Given this irrigation demand the next steps are to determine and
then evaluate the feasible resources and technologies for supplying the
needed pumping energy The feasibility is based on the availability
of the energy resource (fuel) and the technology of utilization The
evaluation involves estimating the capital and operating costs of the
different pairings of fuel and technology
-97-
Irrigation by pumping can be fueled by a wide variety of energy
sources human animal solar (photovoltaic) wind gaseous liquid
and solid fuels and electricity Defining the potential technologies
for use in this Thai village requires examination of the resource
availabilities In the case at hand human and animal energy would be
inadequate Given the demand for these energies in other aspects of
farming and rural life and the depth and amount of water involved
these sources would be insufficient Under different resource conditions
these options might require consideration Solar energy such as photoshy
voltaics would be feasible however the cost of the technology is
presently quite high In addition assessment of this possibility would
also need some site specific solar insulation data However using
representative figures the approximate cost per peak watt of photoshy
voltaics that would make it attractive is about $1-2 Another form of
solar energy hydropower is rarely available in most of the Northeast
and therefore was not considered
Wind energy is another possible source that is very strongly site
specific There are portions of Northeast Thailand with significant
wind velocities However for this example wind energy has not been
considered
As to gaseous fuels whereas there is no natural gas available in
Northeast Thailand there is the potential to generate low BTU methane
and synthesis gas via in the former case biogas or in the latter
-98shy
gassification The animal populations of this part of Thailand are
large enough to consider the widespread use of biogas As for syntheshy
sis gas from pyrolysis of cellulose the raw materials are available
though their relative scarcity is increasing
With regard to liquid faals petroleum products such as diesel fuel
are transported into this region (there are no local oil deposits) alshy
though their reliability and increasing cost are problems Alcohol
fuels are not very feasible because of a lack of available sugar feedshy
stocks There is the possibility of growing a crop for alcohol proshy
duction whose use in turn would lead to a sufficiently greater overall
crop production1 However reliable cost and performance data of smallshy
scale alcohol production are not available and as a result this posshy
sibility was not considered Alcohol production is also hampered by the
lack of a relatively simple process by which cellulose a much more
available commodity could be used as a feedstock
The only solid fuels available in this area are -ellulosic wood
and crop residues As was described above these resources are scarce
Wood once a plentiful fuel from forests has become increasingly more
difficult to obtain Agricultural residues dependin9 on the second
crop planted are often in high demand as animal feed The availability
of these residues is strongly influenced by the existence and productivity
of pastureland which reduces the feed demand for residue No fossil fuel (coal peat lignite) deposits are located nearbyr Lignite is mined
in Thailand but the reser-s ar not very arg
hcthouh asva (nandioca) could also be considered as feed for hel alcohol it has not heen included on account of lack of adequate experiencein this techolcgy of producing alcohol from casava
1
-99-
The last possible energy source is electricity which is not often
available in rural Thailand unless it is locally generated In this
analysis it is assumed that the village is not connected to the grid
nor does it have a generator
In summary feasible energy sources are biogas pyrolysis gas
and diesel fuel
Although this discussion focuses primarily on the availability of
different energy sources these sources are obviously intertwined with
the technologies of utilization (eg pumping) and transformation (ie
pyrolysis biogas ) resulting in a fuel being available even though
the utilizing technology may be presently impractical An example of
this is the steam engine This engine could allow farmers to take
advantage of a range of solid fuels which otherwise would have to be
converted into a liquid or gas However at t-he present time there is
not much information available on a well-tested practical application of
this technology at scale required therefore this possibilit is not considered
On the basis of the source and technologies assessment the following
irrigation options will be examined
1 diesel engine and pump run on only diesel fuel
2 dual-fuel (diesel) engine and pump run on either diesel fuel or biogas
3 gas engine and pump run on pyrolysis gas
4 free piston Stirling engine using crop residues in a furnace
All of these options require the construction of a tubewell These
1 Intermediate Technology Development Group (ITDG) London has conducted a study on the demand for steam engines (5-50 hp units) in developing countries under the direction of Drummond Hislop Professor Graham Rice at the University of Reading UK is currently involved in an irrigation pump study sponsored by the United Nations Development Program (UNDP) and undertaken jointly by Halcrow Engineering and ITDG
-100shy
options need to be designed to fit the needs and resources of the
different farm classes
As to the first option for each farm size the smallest diesel pump
that meets the peak power demand will be used Unfortunately given the
limited availability of small horsepower engines both the small and medium
farmers are forced to puichase a 2 hp engine -- much larger than needed-
For the large farm this probilem does not arise and a 3 hp engine is
considered
The second option involves supplementing the diesel option with a
biogas plant Because a dual-fuel engine can be run on a variable mix
of diesel and biogas (with a maximum of 23 biogas 2) there is some
flexibility in the selection of the size of biogas plant
Plant size selection is a function of animal holdings and the tradeshy
offs between incremental capital cost of larger plants and the resulting
diesel fuel savings Since the demand for biogas for pumping is not
constant over time constructing a plant to meet the peak demand will
result in a large gas surplus over much of the year it is important
therefore to analyze a range of biogas plant sizes if the livestock
holdings permit For the small farm a plant with a daily gas production
of 40 ft the smallest plant considered in this analysis recuires
1 The peak power requirements for small and medium farms are 05 and 12 hp respectively
2 Technically it is possible to run on a higher biogas mixture but present results have been able to attain only a 23 maximum mix over the long term
-101shy
as is discussed below the equivalent of at least 17 large animals which is
larger than averagefor this group1 Therefore this plant is possible only if
a farmer has two large animals or the equivalent manure available through
either other small animal holdings buying manure or cooperation among several
small farmers For the medium-size farm with about 3 large animals 40 and
60 ft3d plants are feasible For the large farms the 45 large animals and
1 pig can support a plant size up to nearly 120 ft 3d However with some sort
of manure market (either outright selling and buying or exchanging manure for
digester slurry) these size limitations could possibly be exceeded if found
to be sufficiency attractive
The third option involves using a small gassifier to run the diesel pump
Based on conversations with people who have experience with large gassifiers
the impression is that the gassifier for 2 and 3 hp engines are quite feasible
and would not be significantly different Despite the uncertainty around this
option it was assumed that the same gassifier would be able to meet all the
fuel needs of the gas engine for all three farm sizes The availability of
residues for gassification is a complex and site-specific issue In the repshy
resentative village the availability of residues is dependent on the specific
cropping pattern and therefore can vary considerably Furthermore this availshy
ability is significantly affected by the nature of the dry season crop From
this perspective the choice of a second crop or even rice variety is not only
a function of the grain or crop yield and value but also of the residue yield
and energy value As will be shown below the residue yield frol the additional
production due to irrigation does not have to be very large in order to supply
sufficient residues for running the gassifier This conclusion holds true for
all farm classes
1 It is important to recall that the animal holdings per farm type were 4eshyveloped solely by assuming (due to lack of actual data) that larger farm sizes own more animals For biogas analysis it is important to collect accurate deshytailed data on livestock holdings as well as information on livestock managmentpractices to assess collectabiliv of 7v nure
-102-
The fourth option is the use of agricultural residues to run
a Free Piston Stirling Engine (FPSE) The advantages oZ including
Stirling engine in the analysis are (i) Small scale Stirling
engines of capacities equal to 03 KW (040 hp) to about 1 KW are
likely to be available which means that scale-disadvantage of
small farmers can be overcome (ii) The Stirling engine is an
external combustion air engine can be run on a variety of fuels
and has a minimum of moving parts These advantages are crucial
in view of difficulties of repairs and maintenance and uncertainties
of fuel availability in developing countries
In the analysis of the irrigation system discussed earlier
the Stirling engine is to be considered in place of a diesel (or
dual-fuel) engine while a furnace is to be considered in place
of a gasifier or a biogas unit The rest of the irrigation system
including tubewell pumpset etc remains the same
-103-
Estimation of the Cost of Feasible Irrigation Options
Estimation of the cost of these different options requires the
the capital and the operating costs for each technology
Capital Costs
The capital costs of the technologies assessed were based on rather
limited cost data from Thailand and other relevant countries in parshy
ticular India The tubewell is integral to irrigation schemes The
costs used are based on a 100-foot depth of tubewellland were estimated
for both steel and bamboo These figures were based on an Indian study2
The bamboo tubewell has limited applicability in Northeast Thailand beshy
cause there are areas where bamboo is not readily available and where
soil type makes it infeasible The tubewell costs are presented in
Table 5 Local labor was shadow priced at 25 percent of its market
value whereas all metal components were assumed to have a foreign exshy
change component of 100 percent The lifetime of the steel tubewell is
10 years for the bamboo 5 years No maintenance costs were considered
The smallest diesel pumps were examined and it appeared that the
only commercially available sizes were 2 hp or larger No smaller pumps
were considered to be available and if they were their cost would not
be significantly less For diesel and matching pumpsets the costs used
are presented in Table IV-9 The social costs are based on groundwater
1 Again the depth is a site-specific factor based on groundwaterand aquifer hydrology and soil type
2 Project report on Supplementary Minor Irrigation Scheme for Purnia Saharsa and Katihar Government of Bihar 1977 as quoted in Bhatia (1979)
-104-
TABLE IV-9 CAPITAL COST DATA (US DOLLARS)
Social Cost
At 25 At 50 Foreign Foreign Exchange Exchange
Equipment Market Price Premium Premium
Tubewell
steel 510 440 510 bamboo 160 100 100
Diesel engines and pumps
2 HP 400 480 560 3 HP 510 610 710
Thai biogas plants (daily gas production)
340 ft3l2 m 160 160 190 360 ft3l7 m 200 200 240 3120 ft334 m 375 375 445 3150 ft3425 m 420 420 500
Chinese Janata biogas plant
40 ft3 daily gas production 85 85
Gas Engine (2 HP) 400 480 560 Gasifier 140 165 190
Stirling Engine and Pump 05 KW 225 270 315 10 KW 450 540 630 225 KW 1125 1350 1575
Furnace 100 120 140
-105shy
indirect foreign exchange component of 80 percent These costs were
developed from various estimates and checked for consistency using
the six-tenths rule It was assumed that these pumps have a lifeshy
time of 10 years or 10000 hours The annual maintenance cost was
assumed to be $110 annually This cost is very approximate since an imshy
portant aspect of this issue is the availability of maintenance a facshy
tor which is hard to quantify Because of the lack of detailed inforshy
mation on maintenance costs this simple approach was taken as opposed
to others that might include a cost per operating hour The fuel conshy
sumption of these pumps was taken to be 025 liters of diesel fuel per
horsepower-hour Again this figure is an approximation that matches
the various figures found in other work It assumed an engine efficiency
of about 28 percent The capital costs of dual fuel engines which are able
to run on diesel and biogas and of gas engines which run on pyrolysis gas
are the same as for diesel engines
The costs for the biogas plants were based on a review of costs found in
Thailand in reports and through personal communications and of costs found 2
in India The designs and costs of biogas plants in these countries
seem relatively similar The costs used are presented in Table 5 The
social costs are based on a foreign exchange component of 75 percent
The reiaining 25 percent of the costs is local labor and was shadow
priced at 25 percent of its cost The daily gas production
1 6Size A _ Cost A Size B Cost B
2The primary source for Indian costs is Ramesh Bhatia Energy Alternatives for Irrigation Pumping Some Results for Small Farms in North Bihar
-106shy
was assumed to be an average value for the entire year Since mean temshy
peratures in this region are fairly constant gas production will not
vary significantly However in some areas it is important to take into
account seasonal temperatures and their consequent effects on gas proshy
duction and the ability of biogas to meet seasonal energy demands
Maintenance costs were assumed to be $7 annually for the two smaller
plants and $10 annually for the two larger plants
In the analysis below the case of using an alternative biogas
design with significantly lower capital costs was examined These costs
1 were based on the Chinese-type Janata design This alternative was
explored for the small farm situation becuase of the relatively high capital
costs the farmer faces for the engine and pump The cost for a 40 ft3d
plant of this type is also presented in Table 5 The maintenance costs
wera assumed to be $7 annually
The feasibility of biogas plants on the farm level is dependent on
the supply of and demand for animal residues Based on several surveys
of the literature it was assumed that 165 kilograms of wet manure
(from buffalo cows etc) can produce 1 cubic foot of biogas 2 Assuming
the average large animal excretes 14 kg of wet manure daily (about
5000 kg annually) the animal manure required for running a biogas
plant (assuming 100 percent collectability) are
1 The costs for 100 150 and 200 ft3d plants were also presented in Bhatias report and were scaled down for a 40 ft3d plant
2This figure was presented in ESCAP Biogas Newsletter (August 1978)and is an average of summer gas production rates in Bhatia and Niamir (1979)
-107shy
biogas plant required daily number of large(daily gas production) wet manure input animals required
340 ft d 24 1kg 17 60 36 26
120 73 52 150 91 65
Since the gas production per unit of pig manure is about twice
as much as from cattlebuffalo and pigs produce about one-fourth the
manure daily one pig is equivalent to one-half large animal for biogas
potential estimations Based on these results and the average animal
resources for different farm classes as noted above there are signishy
ficant limitations on the size of plant which can be operated Furthershy
more the required animals assume 100 percent collectability of manure
This constraint can be lessened if manure is purchased 1
With minor engine adjustments biogas can be used to fuel dual-fuel
engines but only as part of a mixture of two-thirds biogas and one-third
diesel Higher gas mixtures are possible The fuel mix used to produce
1 horsepower-hour was 10 cubic feet biogas and 008 liter diesel fuel
The costs of the gasifier are extremely uncertain because of a lack
of experimentation and use of this technology with very small engines
(under 5-10 HP) Worldwide there has been much successful use of larger
engines such as a 100 HP and it appears that the designs could be
adapted for small ones although it is recognized that some redesign will
be necessary It was assumed that the small engines considered in this
1 The price could be as little as the collection cost if manure isused as fertilizer because the corresponding digestor slurry could be returned thereby returning the fertilizer value
-108shyanalysis could be powered by a gassifier which would cost about $100
in materials and an additional $40 of skilled labor The foreign exshy
change component was considered to be equal to the total materials cost
or 70 percent of total cost Being skilled the labor was not shadow
priced The capital costs are presented in Table 5 The lifetime was
assumed to be 10 years and annual maintenance costs to be $10 Represhy
sentative efficiencies were assumed to be 1) a conversion efficiency
of agricultural residues to gas of 60 percent and 2) an engine efficiency
of 15 to 20 percent This second efficiency takes into account the downshy
rating effect pyrolysis gas has on engine horsepower For diesel engines
this effect could be about 10 percent Based on these efficiencies
about 2 kg of agricultural residues could provide 1 horsepower-hour1
The Stirling engine especially the Free Piston Stirling Engine
is currently in the experimental stage and indications are that these
engines will soon be commercially produced Table IV-9 presents the
best available estimates of capital and annual costs of Stirling
engines of different sizes The average costs are of the order of
$450 per KW as compared with approximately $270 per KW in the case of
a diesel (or dual-fuel) engine However since smaller units of 05
KW capacity Stirling engines are available the capital cost for the
small farmer is lower ($225) in the case of a Stirling engine than
in the case of a 2 hp diesel engine ($400) This makes Stirling
engine relatively attractive for small farmers a conclusion supported
by the results of calculations The capital costs of a furnace are
assumed independent of the engine capacity and are taken at $100 per
unit
Given that 1 hp-hr = 269 x 106 Joules and that 1 Kg of agriculshytural residues can potentially produce 13 x 10 Joules
269 x 10 6Jh-hr - 2 Kg raslduE per hp-hr
(13 x 100 JKg residue) (06) (0175)
-109-
Operating Costs
Since fuel costs are the only variable operating cost in this example
an important input is the unit fuel costs The fuels involved are diesel
fuel manure and agricultural residues For diesel fuel a simplified
approach was taken because of the tremendous uncertainty of forecasting
petroleum prices even over a ten-year period The current price of
diesel fuel at the Persian Gulf was taken to be $025 per liter a
figure based on $25 per barrel of oil It was assumed that transporshy
tation and distribution would bring the price in Northeast Thailand to
$30 per liter presently Then by assuming a 5 percent annual increase in the real cost of petroleum products over the next ten years (a 65 pershy
cent increase over the decade) the average price of diesel over this
ten-year period was estimated to be $040 per liter in present dollars
This price represents the social cost of diesel fuel and is used in the
economic analysis
Unfortunately the future policy concerning diesel prices is not
clear while there is growing alarm over the oil import bill and the
cost of subsidies oil prices were recently reduced As a result the
diesel fuel cost used for the financial analysis was also the average
price of $04liter In the economic analysis when using different
shadow prices for foreign exchange the foreign exchange component
of diesel fuel was taken to be 100
The cost for manure can be a complicated issue because of its value
as fuel fertilizer or input to composting The fertilizer value is
usually higher but is very uncertain because the nutrient value is very
sensitive to handling procedures Presently in Northeast Thailand dung
is used to varying degrees as a fertilizer directly and there does not
appear to be any market for it This valuation problem was handled by
equating the fertilizer value of the dung to that of the digester slurry
Therefore no cost is assigned to the dung and on the benefit side no
-110shy
credit is given for the removed digester slurry In areas where dung
use is more extensive a more detailed approach could be used but it
is important to note that the procedure does attribute a cost or value
to manure
The cost of agricultural residues was considered to be zero beshy
cause of their apparent underutilization in Thailand presently The
representative village shows them being used for animal feed yet the
extent of this activity in reality is unknown Survey work is necessary
to determine the degree of residue utilization If the residues are
or did become fully utilized for feed because of pastureland limitations
or for the extensive use of gassifiers then the residue would be valued
on its primary or its marginal use
The operating costs were estimated by simulating the operation of
each technology Estimating the fuel usage for the first option of using
only diesel fuel involved calculating the capacity of the pump selected
for each farm size and then given the pumping requirement determining
the number of operating hours necessary Then on the basis of the
fuel consumption of 025 litershorsepcwer and the engine size the hourshy
ly fuel use and the annual fuel use were calculated The fuel use for
this option can be calculated without consideration of the seasonality
or daily amounts of water required because the fuel is in theory always
available without any seasonal or daily limits
Estimating the fuel use for the biogas options is more complicated
because of the daily limit on gas production and therefore consumption
1 Please see the discussion on opportunity costs at the beginning of this section
-111-
Simulating the operating costs involved calculating the minimum daily
horsepower-hour requirements for each of the three irrigation periods
(the primary and secondary peaks and the remainder of the pumping
year) The biogas was assumed to meet these requirements up to either
the capacity of the plant or two-thirds of the total requirement Diesel
fuel consumption was determined by the energy demand not met by biogas
The pumping period is 250 days the biogas was assumed to be available
at capacity for this period In the sensitivity analysis presented
below reliabilities of less than 100 percent are examined
Biogas in other words is the baseline fuel which depending on
the plant size and farm size supplies a significant portion of the fuel
needed during most of the pumping season However during peak periods
it often becomes necessary to use a great deal of additional diesel fuel
because of the daily limit on gas production For a given farm size
as larger biogas plants are considered the point is reached when the
additional gas production is only used for irrigation during the peak
periods As will be seen in the results below the increased cost of
a larger biogas is not matched by fuel costs foregone during the relashy
tively limited peak periods
Calculating the fuel costs for the third or fourth options of
using a gassifier or a Stirling engine are simplified by the assumption
that agricultural residue costs are zero Therefore these options
have no fuel costs except when limited reliability is considered in the
sensitivity analysis below Maintenance costs for the Stirling engine
It is important to point out a simplifying assumption that biocas proshyduction was assumed to be constant throughout the year The benefits of biogas can be more or less depending on the deqree of conincidence between the peak gas production and peak pumping requirement seasons
-112shy
are estimated at $5 per year for the furnace and $50 per year for the
engine for the range of 05 to 25 KW The furnace efficiency is
assumed as 60 percent the engine efficiency as 30 percent and the
pump efficiency at 80 percent This gives an overall efficiency of
approximately 15 percent
The present value costs for the different irrigation options are
shown in Tables IV-10-12 For each farm class there are the basic
costs of the diesel engine the pump engine and pump maintenance and
the tubewell To these basic costs are added the fuel costs and additional
capital costs for either the biogas plant or the gassifier depending on
the option
Table IV-12 shows an additional capital cost for the large farm for
a second diesel engine and pump The lifetime of these pumps was 10 years
or 10000 hours On a large farm the annual operating hours are 1160
therefore after about 8 years a replacement pump will be needed Since
the analysis pertains to a ten-year period the additional capital costs
for a new pump for years 9 and 10 are one-fourth the cost of a new one
present valued as a cost occurring at the beginning of year 9 The annual
operating hours of pumps on small and medium farms are 305 and 770 reshy
spectively
Results
As mentioned earlier the analysis is based on benefit cost ratios 1
The benefits from irrigation are reported to be $200 per hectare Table IV-13
presents the present value of the benefits for the farm classes under
varying costs of social rates of discount and values of shadow price of
foreign exchange
The discussion )n different decision criteria has been uresented earlier in S on II
TABLE IV-10 PRESENT VALUE OF TOTAL COSTS OF IRRIGATION SCHEMES ON SMALL FARMS (10-YR PERIOD US DOLLARS)
Basic Costs
2 HP engine pump
maintenance ($110yr)
tubewell (steelbamboo)
Subtotal with steel tubewell
with bamboo tubeweil
(A) 2 1IP pj5 with diesel only fuel (152 litecsyr)
TOTAL COST steel tubewell
Market Prices Social Coss
Foreign-Exchange Premium of 25
5 10 15 10 15 20
400 400 400 480 480 480
850 670 550 670 550 460
510290 510260 510250 440160 440150 440140
1760 1580 1460 1590 1470 1380
1540 1330 1200 1310 1180 1080
470 370 310 470 380 320 1
2230 1950 1770 2060 1850 1700
(B) 2 liP with 40 ft 3d Thai bioqas plant (59 utilization for irrigation during pumping season)
biogas plant amp maintenance 210 200 200 200 200 190 diesel fuel (54 litrsyr) 170 130 110 170 140 110
TOTAL COST steel tubewell 2140 1910 1770 1960 1810 1680
(C) 2 liP with 40 ft3d Janata Chinesetype) biogas plant (59 utilization for irrigation during pumping season) biogas plant amp maintenance 140 130 120 130 120 110
TOTAL COST steel 2070 1840 1690 1890 1720 1600
TABLE IV-10 (CONTINUJED
Market Prices Social Costs
Foreign Exchange Premium of 25
5 10 15 10 15 20
(D) 2 lIP with hypothetical gasifiershy
gasifier amp maintenance 220 200 190-11 230 220 210 TOTAL COST steel 1980 1780 1650 1620 1690 1590
(E) 2 HiP diesel oniy with selliag water to_ another small farm TOTAL COST steel 2700 2320 2080 2530 2230 2020
(F) 2 liP with 40 ft 3d Thai bioqas plant -- selling water to another small farm (100 utilization for irrigation durii pumingseason)
additioijal diesel fuel (85 yr) 260 210 170 250 210 180 TOTAL COST steelbamboo 24002180 21201870 194016110 222i1940 20201730 18601560
TABLE IV-1l PRESENT VALUE COST OF IRRIGATION SCHEMES ON MEDIUM-SIZED FARMS
Market Prices Foteign Social CostF
Exchange Premium of 25
5 10 15 10 15 20
Basic Costs
2 HP engne pump maintenanze stael tabewell 1760 1590 ]3460 1590 1470 1380
2 IWengine pump maintenance bairboo tubowel 1540 1330 1200 1310 1180 1080
(A) 2 HIF pump vith diesel only diesel fuel (383 litersyr) 1180 940 770 1170 960 800
TOTAL COSTS Steel tubewell 2940 2520 2230 2760 2430 2180
3 (3) 2 HP with 40 ft d Thai biogas plant (100 utilization for irrigation during pumping sea son)
biogas plant and maintenance diesel fuel (216 litersyr)
210 660
200 530
200 430
200 660
200 540
190 450
TOTAL COSTS Steel tubewell 2630 2310 2090 2450 2210 2010
(C) 2 lip with 6 ft3d Thai biogas plant (89 utilization for irrigation during pumping season)
biogas plant and maintenance diesel fuel (159 litersyr)
250
490 240
390 240
320 240
490 240
400 230
330
TOTAL COSTS 3teel tubewell 2500 2210 2020 2320 2110 1940
10-year period US dollars
TABLE IV-li (CONTINUED)
Social Costs Market Prices Foreign Exchange Premium of 25
5 10 15 10 15 20
(D) 2 11P with 120 ft3d Thai biogas plant (51 utilization for irrigation during p-amping s-ason)
biogas plait and maintenance diesel fuel (128 litersyr)
450 390
440 310
430 260
440 390
430 320
420 270
TOTAL COSTS Steel tubewell 2600 2330 2150 2420 2220 2070
(E) 2 liP with hypothetical gasifier
gasifier and maintenance 220 200 190 230 220 210
TOTAL COSTS Steel tubewell 1980 1780 1650 1820 1690 1590 O
Social CostsMarket Prices Foreign Exchance Premium of 25
5 10 15 i0 15 20
Basic Costs
3 HP engine pump (8 yr life) replacement PV cost (yr 9 amp 10) maintenance ($110yr) tubewell steel
510 80
850
510
510 60
670
510
510 40
550
510
610 70
670
440
610 50
550
440
610 40
460
440
SUBTOTAL with steel tubewell 1950 1750 1610 1790 1650 1550
(A) 3 lIP with diesel only
diesel fuel (869 litersyr)
TPTAL COSTS Steel tubewell
2670
4620
2130
3880
1750
3360
2670
4460
2180
3810
1820
3370
(B) 3 HP with 60 ft3d Thai biogas plant (100 utilization for irrigation during pumping season)
biogas plant and maintenance
diesel fuel (619 litersyr)
TOTAL COSTS Steel tt)ewell
250
1900
4100
240
1520
3510
240
1240
3090
240
1900
3930
240
1560
3450
230
1290
3070
(C) 3 lIP with 120 ft 3d Thai biogas plant (99 utilization for irrigation during pumping season)
biogas plant and maintenance disel fuel (372 litersyr)
TOTAL COSTS Steel tubewell 2
450
1140
3540
440
930
3100
430
750
2790
440
1140
3370
430
930
3010
420
780
2750
(D) 3 IIP with 150 ftd Thai biogas plant (83 utilization for irrigation during pumping seison)
bioqas plant arid inaintenance diesel fuel (352 litersyr)
TOTAL COSTS Steel tubev1l
500
]C80
3530
480
860
3090
470
710
2790
480
1080
3350
470
880
3000
460
740
2750
TABLE IV-13 PRESENT VALUE OF IR-RIGATION BENEFITS (10-YEAR PERIOD US DOLLARS)
Market Prices Social Costsk
Foreign Exchange Premium Foreign Exchange Premium
Farm Cultivated of 25 of 50 Class Land 5 10 15 10 12 15 20 10 12 15 20
small 105 ha 1620 1290 1060 1610 1480 1320 1100 1930 1780 1590 1320
medium 264 ha 4080 3250 2660 4060 3740 3330 2770 -4850 4490 3790 3330
large 600 ha 9230 7360 6030 9200 8470 7540 6280 11000 0170 9050 7530
Annual benefits are $200 per hectare
Assuming the foreign exchange component of 100
-119-
Using the in6ormation on Tables IV-10-13 the cost-benefit ratios
presented in Table IV-14 were calculated The ratios assumed 100 percent
availability or reliability of thc techxical options and include only
the banefits from irrigation As can be seen all irrigation opshy
tions are attractilre for the medium and large farms with the gassishy
fier being more attractive than bioga which in turn is more attracshy
tive than diese-l unly The small farm results show a much different
picture in that none of the first four options appears attractive
These results reflect the high cost of a 2 hp pump which is sigshy
nificantly oversized for the small jazms needs of only a minimutm of
05 hp The significantly higher ratios for large farms over medium
farms reflect the higher pump utilization on the large farm since
the meditn farm was also forced to use and oversized pump (2 hp vershy
sus a need of 12 hp) The capital costs faced by the large farm
also benefit from some economies of scale
The results show decreasing ratio as the discount rate inshy
creases reflecting the increasing cost of capital required for all
of these options The ratios for the economic analysis (social
costs) are higher than those for the financial analysis (market prices)
due to the higher foreign exchange component of the benefits side (100
percent) as compared to the items on the cost side (ranging from 0 to
100 percent)
The gassifier is understandably the most attractive since its costs
are relatively low and no cost for its fuel was used It~eliminates
the need for any diesel use if it is suIficienbly reliable a point
-120-
TABIE iV-14 BENMEFIT-COST RATIOS FOR IRPIGATION SCIEES
Utilization Market Prices Social Costs Rate
Pumping Foreign ExchangeIuring Premium of 25s
Season 5 10 15 10 15 20
I Small Farn
A 2 HP diesel only 073 066 060 078 071 065
B 2 HP + 40 ft3d Thai biogas 59 075 068 060 082 073 065
C 2 I-r4 + 40 Chinese biogas 59 078 070 063 085 077 069
D 2 HIP + hypothe- tical gasifier 081 072 064 088 078 069
E 2 HP + sellinP water (13160 ilyr) 100 090 083 076 095 089 082
F 2 HP + 40 ft 3d Thai biogas + A
selling water 100 101 -091 082 109 098 089
G 2 HP + 40 ft3d Thai biogas + selling water + 1- 24 1 i4 0 bamboo tUbewell 00 1 1 103 095 124 414 106
I Medium Farm -
A 2 HP diesel only 1 39 29 119 147 137 127
B 2 HP + 40 ftd -gt w0
Thai biogas I00 1 5 1 41 12 7 166 8
C 2HP + 60 ft 3d Thai biogas 89 163 147 3 32 175 4E1 J 43
D 2 HP + 120 ft3d 39 1 24 gt Thai biogas 51 157 3 24 168 50 134
E 2 HP + hypothe-shy
tical gasifier 206 1 83 1 61 - 223 197 1174
Ill Large Farm A 3 HP diesel only 200 0 179 206 197 186
B 3 HP 4 60 ft3d Thai biogas 100 - 5Tha b s2 2 2q101 A5 234 419 205
C 3 HP + 120 ft 3d 4 U - A
Thai biogas 26l 21699 n 38 273 250 228
D 3 HP + 150 ft 3d Thai biogas 83 261 233 216 275 23i 228
to h dscuzszid detal1below
The biogas plants all appear to be attractive Table IV-15 shws the
benefit-cost ratio for biogas plant investment once the engine pump
and tubewell are already purchased These investments are even attracshy
tive for the small farms that already have the other equipment needed
for irrigation The ratios are higher for the economic analyses beshy
cause the foreign exchange component of the fuel costs is 100 percent
whereas for t1e biogas plants it is only 75 percent Furthermore in
the economic analysis the unskilled rural Labor is shadow priced at
one-fourth its market cost The analyses for medium and large farms
show the diminishing returns to biogas after a point The pumping deshy
mand utilizes most or all of the gas produced by the 40 and 60 ft 3d
plants on a mediumn farm and by the 60 and 120 ft3d plants on a large
farm The next larger plants fur each farm size only result in small
decreases in diesel fuel use all of which occur during the relatively
brief peak periods In fact the increased cost of a 120 ft3d plant
on a medium farm is not recouped by the fuel saving It should be
recognized that if te excess gas can be economically utilized then the
largest plants could be justified
The unattractiveness of irrigation on the small farm is due to
the large cost of the oversized 2 hp pump Even signficantly reducing
the cost of the biogas plant (the Chinese Janata design) and of the
tubewell (bamboo) is not sufficient to make irrigation attractive under
any case in the financial analysis Only at lower costs of capital and
premiums on foreign exchange does irrigation become attractive The
TABLE IV--15 COMPARISON OF CAPITAL COSTS AND PV DIESEL FUEL SAVINGS RESULTING FROM PIOGAS INVESTMENTS OR IRRIGATION ONLY
Utiliza tion Rate
During Dumpi ng Season
I SMALL FARM
40 ft 3 d Thai biogas plant 59
40 ft 3 dhiinese- bio-shy
qas [lant 59
11 I1hDIIJM FARM 40 ft3dj
Thai biogas 100
60 ft 3 d Thai biogas 89
120 ft3d Thiai biogas 51
I[T LARIGE FARM
60 f0td Thai biogas 1_00
120 fL 3dli hiogas 99
150 ft 3 dThai bio(jas 83
5 Diesel Fuel
Savings Biogas Cost
300210
300140
520210
690250
790450
770250
1530450
1590500
Market Prices
10 15 Diesel Diesel Fuel Fuel
Savings Savings B-C Biogas B-C Biogas B-C
Ratiol Cost Ratio Cc-- Ratio
14 240200 12 200200 10
21 240130 18 200120 17
25 410200 20 340200 17
28 550240 23 450240 19
18 1630440 14 510430 12
31 610250 24 510240 21
34 1220440 28 1000430 23
32 1270430 26 1040470 22
Social CoIts
Foreign Exchange Premium of 25
10 15 20 Diesel Diesel Diesel Fuel Fuel Fuel
Savings Savings Savings Siogas B-C IBiogas B-C Bioga3 B-C Cost Ratio Cost Ratio Cost Ratio
300200 15 240200 12 210190 11
300130 23 240120 20 (210110 19
510200 26 420200 21 350190 18
680240 28 560240 23 470230 20
780440 18 640430 15 530420 13
770240 32 620240 26 530230 23
1530440 35 11250430 29 1040420 25
1590480 33 1300470 28 1080460 23
i
-123shyunderutilization of the small farras pump leads to consideration forashy
water market in which irrigation (an be supplied for a fee for another
farm The 2 hp pump is actually capable of supplying nearly 4 small
farms if always operational The last two options on Tables IV-10 and IV-13
for a small farm are based on supply of irrigation water for an additional
small farm The fee for such a service could be anywhere between the
additional operating cost for the pump owner and the total irrigation
benefits for the purchasing small farm as in Table IV-12 For this example
it was assumed that the pump owner charged one-half the total irrigation
benefits therefore the benefits for the pump omer for the benefit-cost
ratios are 50 percent higher Under these conditions irrigation becomes
marginally attractive at lower costs of capital These results still
reflect the burden of underutilization of the pump and they indicate
the need for research into the cost of smaller engines (12 to 2 HP) as
to whether they could be produced and marketed at a significantly lower
cost than those presently available These possible diseconplusmnomies of
scale underline the need for accelerated work in other technologies such
as solar and wind in order to alleviate the plight of the small farmer
These technologies appear to be more adaptable without these economies
for the small farmer
Tables IV-16 and IV-17 present the results of cost benefit analysis of
irrigation systems which include Stirling engine It is assumed as
before that agricultural residues have a zero cost to the society
Since all the energy inputs for the Stirling engine can come from
biumass (residues) the fuel costs for the Stirling engine case are
zero However to provide a better understanding of the system a
(maximum) fuel cost as represented by the cost of diesel oil is also
used in alternative calculations The results bring out the following
-124shy
(i) Benefit cost ratios are greatez than one (unity) in all cases except when fuel costs equivalent to diesel oil costs are -used for small farms
(ii) Benefit cost ratios are higher as the farm size increases for example the BC ratios range between 254 and 473 in the case of social costs using a 10 percent social rate of discount
(iii) A comparison of different systems shows that Stirling engine system consistently dominates both at market prices and at sociil costs (Table IV-16)
(iv) Even in the uase of small farms the irrigation is profitshyable only in the case of Stirling engine system This happens if a small scale Stirling engine can be made avail-shyable at the estimated cost (Table IV-17)
It should be mentioned that both with Stirling engines and
gasifiers the strong attractiveness is overshadowed by two considershy
ations (1) the lack of technical certainty and (2) the availability
and value of residues The implications of both these issues will be
discussed in further detail in connection with gasifiers If adequate
quantities of fuelwood are available at the same cost as crop
residue the economics of Stirling engines would remain the same
However in the case of fuelwood it may be easier to produce charcoal
n a central facility and then use the costlier charcoal as input for
a gasification unit or furnace The economics of these alternatives
would be site-specific and hence have not been considered here
TABLE IV-16 BEiEFIT-COST RATIOS FOR IRRIGATION SCHEMES
IN STIRLING ENGINE CASE
Market Prices Social Costs
Foreign Exchange 25 STIRLING ENGINE 5 10 15 10 15 20
I Small Farm
zero fuel cost 140 121 110 154 134 117
diesel fuel cost 099 090 083 106 097 087
(05 KW engine)
II Medium Farm
zero fuel cost 295 251 224 320 275 238
diesel fuel cost 159 145 136 166 153 141
(1 KW engine)
III Large Farm
zero fuel cost 448 374 324 473 400 341
diesel fuel cost 195 180 167 254 186 171
(225 KW engine)
-126-
TABLE IV-17 A COMPARISON OF BENEFIT COST RATIOS UNDER FOUR DIFFERENT SYSTEMS
Market Price
10
Social Costs
10
I Small Farms
(a) 2 hp diesel only 066 078
(b) 2 hp amp 40 ft 3d Thai biogas
068 -082
(c) 2 hp amp hypothetical gasifier
072 088
(d) 067 hp hypothetical Stirling engine amp furnace
121 154
II Medium Farms
(a) 2 hp diesel only 129 147
(b) 2 hp diesel amp 40 ft 3d Thai biogas
141 166
(c) 2 hp amp hypothetical igasifier
183 223
(d) 133 hp hypothetical
Stirling engine
251 320
III Large Farms
(a) 3 hp diesel only 200 206
(b) 3 hp amp 60 ft 3d 225 234
(c)
(d) 3 hp Stirling engine 473
-127-
Sensitivity Analysis
In this section the irrigation options will bc examined under altershy
native assumptions concerning the t-eliab1lity of their operation or of
their operating and capit-l costs The approach taken is to calculate
the extent to which the reliability or cost can or must be changed in
order to remnain or becnme attractive investments in other words to
determine the break-even points
Option 1 Diesel Only
For the diesel only option severalpoints can be examined For
the medium and large farms where this option is attractive the maximum
average fuel costs and the maximum capital costs tander which diesel only
wcuId break even were calculated The maximum market fuel costs per liter
(as an average price over a 10-year period in present dollars) in US
dollars are
Market Prices Social Costs (foreign exchange premium of 25)
5 10 15 10 15 20
Medium 079 071 062 084 078 070
Large 109 105 101 111 108 104
Considering that the average market fuel price projected for this analysis
was $04 per liter this option would remain attractive with significantly
higher fuel prices As to higher capital and maintenance costs the
following table presents the estimated cost of the engine pump and steel
tubewell as well as the additional cost (cost overrun) which would reduce
the attractiveness of this option to the break-even point
-128shy
Market (US dollars)
Pri-es Social Costs
5 Medium Farm
10 15 10 15i 20
est costs 1760 1580 1460 1590 1470 1380
cost overrun 1140 730 1300 590430 870
increase 65 46 29 82 59 43
Large Farm
est costs 1950 1750 1610
cost overru 461 3480 2670
increase 236 199 166
Again the attractiveness of this option for the two larger farm classes
is deiionstrated by the significant leeway possible in the basic costs
At higher costs of capital onthe medium farm this cushion is not very
large
With regard to the actual operational reliability of the diesel
pumtp whether it be limiLed by fuel or engine availability there are
several points First of all the number of hours of required operation
is relatively small compared to the hours available for pumping 770 and
1160 hours for medium and large farnis respectively out of a pumping
season of 250 10-hour days or 2500 hours However the actual flexishy
bility as to when the pumping is required is somewhat less than indicated
by these figires because there are periods where the water is needed
over a short period of time A problem with estimating the effects
of unavailability is how to assume the benefits of irrigation are dimin-ished
Loss of water during peak periods could nearly wipe out the crop altogether
More information is needed to do an accurate analysis especially on the
reliability of diesel pumps
-129-
The issue ror the small farm situation is the reverse how much lower
must capital or operatig costs fall to the dlesel onIly option to become
attractive The results for the small fa-m may be overly conservative
because of the significant maintenance cost imposed despite the low level
of annual us (305 hours) This cost was assumed constant for all farm
sizes independent of pump use The following table shows the reduction
in this cost that would make diesel only irrigation attractive
PV in US $ Market Price Social Costs
5 10 15 10 15 20 Small farm est diesel pump
cost 400 400 400 480 480 480 est maintenance 850 670 550 670 550 460
break-even maint cost 240 10 -160 220 20 -140 (steel Lubewell)
(bamboo tubewell) 460 260 00100 310 160
Only at low costs of capital and assuming a bamboo tubewell would a less
costly but still feaf3ible maintenance cost estimate make a significant
difference in the attractiveiie of this option However this cost
reduction in conjunction with the possible availability of smaller
and proportionally less costly engines could make diesel attractive
With regard to lower fuel prices or engine costs the two costs woud
have to approach zero before diesel only becomes attractive on small
farms
Option 2 Biogas and Diesel
or the option of biocas and diesel reliability issues take on a
different light because the uncertainty as to the actual availability
-130shy
invastnents can be attractive even if the plants reliability is relatively
low
All of the above analyses only attribute benefits to bioga3 used
for irrigation and in all cases there is extra gas available for other
uses If 4t is the minimum thds gas is only available during the nonshy
pumping part of the year Therefore the attractiveness of biogas is
underestimated significantly in soma cases
Option 3 Gassifer and Diesel
The above analysis of gassification assumed 100 percent reliability
of the gassiffr when needed The practicability of this assumption is
different for the three farm classes It can be realisLic for the small
farm because the gassifer is only needed for 305 hours over a 230-day
pumping period The need is more intensive during the peak period but
there is still room for flexibility since the pump only requires 25 pershy
cent of the maximum pumping time available during this period On the
other hand on a large farm the annual operating hours are 1160 over
the 250-day period and therefore the assumption of 100 percent availshy
ability may be unrealistic Yet even in this case the flexibility in
puping times mitigates this problem In order to determine the minimum
reliability levels required for gassification to be attractive the minishy
mum number of hour-s of operation which results in a fuel savings equal
to the gassifier cost were calculated For small and medium farms that
number is
Market Prices Social Costs
5 10 156 10 15 20
140 160 190 150 180 200
over the 250-day pumpizg season On the large farms the number of hours
would be less since a larger engine is used and cherefore the fuel savshy
ings per hcur are greater
Another uncertainty concerning gassification is the capital and
maintenance cost Due to lack of worldwide experience with gassifiers
of this size and for this puxpcse there is a great deal of uncershy
tainty about these costs The costs used in present value terms
were
i for capital costs market price of $140 social costs at 25 percent foreign exchange premium of $165
2 for maintenance cost ($10 annually) ranges from $75 at 5 percent discount rate dcwn to $40 at 20 percent
In order to determine the sensitivity of the analysis results to
these costs the additional present value cost of gassification which
would make it only break-even with the diesel only option was calculated
Assuming 100 percent availability this additional cost is
Market Price Social Costs 5 10 15 10 15 20
small farm 250 170 120 240 360 110 medium farm 960 740 580 940 740 590
These figures show that even with significantly higher costs or
lower availabilities gassification would be attractive However one
problem with gassification in addition to the availability and cost
would be the storage of the residues The extent of this problem is
-132shy
based on the time between pumping and harvest the suitability of
the residues to storage and the local experience or adaptability to
storing crop residues
The strong attractiveness of gassifiers on medium and large farms
is overshadowed by two considerations 1) the lack of technical cershy
tainty and to a lesser extent 2) the availability and value of residues
The first issue can only be resolved through a program of experimentation
and demonstration The second issue has several aspects One is that
gassifiers are clearly attractive when feed use of agricultural residues
is inot large such as where livestock are small where extensive pastureshy
land is availablej or where intensive agriculture yields large amounts
ot residue Central Thailand appears to be a likely candidate possibly
fitting into the first and third of these conditions On the other hand
it is important to examine the feed value of different residues and other
materials versus their energy value to determine optimal uses for these
resources Furthermore the availability of feed substitutes must be
considered so that the use of residues for fuel does not cause further
deforestation through overgrazing An additional point for further reshy
search is the residue production factors eg the amount of straw to
product for different crops and harvesting methods
For irrigation in the representative village the residues
needed to fuel the gassifiers annually are about
small farm 12 metric tons medium farms 31 metric tons large farms 70 metric tons
These requirements reduce to that of almost 12 metric tons of residue
for every hectare irrigated Supplying this residue need as well as
fuel requirements is dependent on the cropping pattern and livestock
-133shy
holdings Production of the 12 tons of residue per hectare is quite
feasible for many crops Paddy residue equivalent to the production
levels in Table i1-7 would be 26 MTha Other grains (eg wheat
maize orchum and harley) are generally in this range (Arora 1977)
Analysis would on the other hand be necessary to consider the
tradeoffs between the cash value and energy value of different
crops The small farmer has a residue surplus of 04 tons annually
(Table IV-7) and therefore needs to generate an additional 08 tons from
the additional production from irrigation This additional residue
could quite easily be produced from the small farms 105 hectares The
medium and large farms in some cases such as where maize is grown alshy
ready generate additional residues however only on thie large farm are
these residues sufficient to meet both feed and gassifier requirements
on the medium farm growing maize the additional annual residues needed
are 14 tons or about 05 tons per hectare Aln important variable in
determining the availability of residues is the availability and producshy
tivity of pastureland To accurately assess the attractiveness of gassishy
fiers in comparison to ocher technologies would require further analysis
into these issues
-134shy
Distribttional issues
The results indicate clearly significant economies of scale and
therefore some distributional prohlems since the wefarg forus of these
interventions should be on the rural poor or small farm class In fact
due to the limited availability of small engines the small farmer canshy
not reap the benefits of irrigatin 2 A crucial issue is whether very
small engines will cost significantly less and then whether this possible
lower cost becomes available to the consumers The small farmer also
faces this problem with regard to the tubewell cost The poor or small
farmer can only reap the benefits of irrigation by the developments of
significantly lower cost equipment or by cooperative behavior among
several small farms
With regard to the biogas plants whereas the small farm may be
able to find this investment attractive this class may be constrained
by its limited animal holdings Nevertheless it appears that this
limitation is less severe since the plants can be easily scaled to
size
Gassification might be more attractive for small farmers given
straw potential from increased agricultural production but still the
costs of the engine and tubewel are major constraints for the single
farm
1 Ignoring in this analysis the landless and issues of job creationwithirrigation
2 Except under the use of water markets thereby reducing the disshyeconomies of scale
SECTION V
Annotated Bibliography on Social Benefit
Cost Analysis and Energy Planning
A ApproacThes and Methodologies
B Estimation of Shadow Prices
C Case Studies on Renewable Energy Projects
-136-
A Approaches and Methodologies
OECD Manual of Industrial Project Analysis Volume II by IMD Little and JA Mirrlees OECD Development Center Paris 1963
IMD Little and JA Mirrlees Project Appraisal and Planning for Developing Countries Basic Books inc New York 1974
The details of the OECD or LitLle--Mirrlees approach along with its comparison wich UNIDA Guidelinec have been provided in the text As noted in the second 7olume (1974) the basic foncepts and principlesused in the two volumes are basically similar The additions of material in the second volume include a discussion of relationship among projectsectoral and macro levels the measurement of benefits of the productionof non-traded goods and services and the treatment of shadow wagerate Income distributionalconsiderations in project analysis are dealt with more explicitly and at much greater length iii the second volume
The Little-Mirrlees (L-14) approach begins with the premise that prices are seriously distorted in many developing countries and some of the worst distortions have arisen as a result of government policies and bad investment planning The policies may relate to trade policies(tariffs quotas subsidies) or commodity and resource prices (laborcapital and foreign exchange) The L-M approach cousists of guidelinesfor the construction of a whole set of self-consistent accountingprices to be used as better guides to project selection than actual market prices Oneof theimportant suggestions made is to use border prices (inport ox export prices) as accounting prices
The main limitations of the approach are
(i) The crucial assumption in the L-H approach is that there are no important political constraints preventing reform of the price system - and that the governments are willing and able to manage trad~e predominantly though not necessarily entirely by prices rather than quantity controls In manydeveloping countries for various reasons this assumption may not be valid If the project evaluator is not powerfulenough to ensure that the desired changes in trade and taxsubsidypricing policies are in fact made it would b2 inshyappropriate to use border prices for project evaluation
(ii) Although concepts of value of public income and numerical weights for personal income distribution have been presented the discussion is fpr from complete
-137-
United Nations Industrial Development Organization (UNIDO) Guidelines for Project Evaluation New York 1972
UNIDO Guide to Practical Project Appraisal Social Benefit-Cost Analysis in Developing Countries New York 1978
The dctails of the UiNIDO approach and its compazison with the OECDManual have been presented in the text The above two volumes present a complete system of project evaluation in developing countries includingtie required theoretical background practical aspects and case studies
The major thrust of -he argument is that valuation of goods andservices in terms of market prices is inadequate in reflecting national benefits and costs and hence project inputs and outputs should be valued at shadow prices Procedures and principles for quantification and valuation of outputs are discussed at length along with the methods ofestimating social rate of discount and shadow prices for investmentforeign exchange and unskilled labor One of the important aspect ofshadow pricing which receives considerable emphasis in the UNIDO approachis the distinction between social rate of discount and opportunity cost of capital In fact it is the divergence between the values of these two parameters that determines the value of shadow price of investment Although other approaches have also taken this into account the UNIDO approach is consistent with the rest of their methodology
Another important advantage of the UNIDO approach is that it explicitlyrecognizes the limitations of the role the planning organizations can playin influencing trade price and tax policies in developing countries The UNIDO method recognizes the presence of political and administrative constraints in adjusting tariffs and taxsubsidiaries and suggests use ofshadow prices in that context There is also a greater importance givento the issues of income distribution among groups and regions than in OECD Manual
The UNIDO approach has been used in many studies and incase estimation of nationalregional parameters There have been difficulties in the useof parameters such as shadow price of investment The methodology may be found too academic or too difficult by some people who dc not have the necessary background
One of the authors of the UNIDO Manual has presented a complete theoretical analysis of a labor surplus economy see Marglin (1976)and Sen (1975)
-138-
Michael Roemer and Joseph J Stern The Appraisal of Development ProjectsA Practical Guide to Project Analysis with Case Studies and Solutions Praeger 1975 New York
This manual is oriented to three types of users economics studentswho can use the manual for supplementary reading and case work for courses in development economics government technicians responsible for analyzingprojects and government officials who make investment decisions and need to become familiar with this decision-making tool The theoretical discussions are kept relatively brief and major emphasis has been placed on developing a realistic fram work for prject analysis setting forth practical rules for evaluating project costs and benefits Apart from the theoretical discussions on shadow prices details of estimation of valuesfor these parameters for Ghana have also been given The book also presents case studies on a bauxite ines expansion a cooperative rice project a manufacturing and spinning mill and a feeder road (transportation) project
The book discusses the need for project analysis divergence betweensocial and market prices and presents problems of measurement aid valuation of benefits and costs It presents a useful discussion of the role of disshycounting in comparing costs and benefits but uses the opportunity cost of capital(or shadow interest rate) as the appropriate discount rate Unlike U14IDOGuidelines (1972) and other theoretical literature the opportunity cost of capital is not considered different from the discount rate The estimatedvalue for opportunity cost of capital in Ghana (1972) is taken as 12 percent based on available rates for investment demand and supply of savingsThe shadow wage rate for unskilled labor is estimated as 50 percent of average urban wage rate based on estimates of agricultural wages for casual workers and adjustments for subsistance production The shadow rate for foreign exchange is taken as cedis 175 per dollar (against the official exchange rate of cedis 128)
The main limitations of the book are
(i) One of the major advantages as well as the drawbacks is itssimplicity For the economist who is to estimate the values of national or regional parameters for a given country the book is too simplistic For the economist who is appraising a project and has to use the available values for various parameters the book is Lather superfluous It is a useful initial orientation to the nonshyeconomist Planner who is told convincingly about the need for usingshadow prices instead of market prices However even for him the book seems to indicate that the adjustments made are very simple and gives a too simplified perspective of the complex problem of shadow pricing The reader should be cautioned against thinking that the concept and methodology of estimation of shadow prices is just a simple matter of increasing or zeducing some values
-139shy
(ii) Although reference to the important question of distribution has been made the authors have succumbed to the traditional and most widely accepted practice of excluding equity considerations from cost-benefit calculations
-140-
Russell J deLucia Henry D Jadoby et al LDC Energy Planning A Study of Bangladesh Cambridge MA June1980 Draft for Review and Comment
This book covers a broad range of issues associated with energyplanning in developing ceuntrie6 Although drawn primarily from the Bangladesh EnerayStud it presents mitch methodology that has broad conceptual applications While the book does not focus purely on renewshyable energy issues there are a number of sections in the individuallyauthored chapters that are particularly relevant Chapter 1 EnergyPlanning in Bangladesh by deLucia and Jacoby presents a useful disshycussion of the characteristics of aa Energy Sector study Chapter 3Agricultural Analysis for Energy Planning by James Gavan and Rodney Tyers and Chapter 4 Traditional and Renewable Encrgy Sources by Russell deLucia and Richard Tabors present ideas relevant to the consideration of bioniass based energy alternatives including approachesto estimating agrieultural residue availability through agricultural sector analysis difficulties in firewood and other survey techniquesand approaches to examining technical economic and social factors _n analysis of rural ene -qy options The chapter by henry Jacoby and Joseph Stern Economic Objectives Parameters and Assumptions givesexamples of the estimations of economic parameters including shadow prices necessary for investment analysis of either renewable or conshyventional technology alternatives
The book has been submitted for publication review it is available from the authors co R deLucia Meta Systems Inc 10 Holworthy St Cambridge MA 02138
Bangladesh Energy Study for the Government of the Peoples Republic of Bangladesh administered by the Asian Development Bank under United Nations Development Program Project BGD73038B0l45 prepared bythe Montreal Engineering Co Ltd Snanprogetti SpA Meta SystemsInc and C Lotti amp Associates SpA November 1976
-141-
Efficiert Use of Energy (The APS Studies on the Technical Aspects of theMore Ef4icient Use of Enerqy) AIP Conference Proceedings No 25American Institute of PhysicsAmerican Physical Society Wasnington DC 1975
This 1onograph focuses on technical issues of efficient energy useIt is an important coprehensive effort by a group of physicirts Themonograph takes a physics perpective establishing norms or -tandaidsof performance against which uses of energy can be evaluated Thediscussion is heavily theoretical but also practical in t~rm of basingefficiency measures in the laws of thermodynamii and presenting disshycussicis of energy usE examples in a fashion that encourages practicalanalysis Tae approach fccuses on the use to which the energy isapplied rather than the energy-using device This focus on task or energy end-use pervades the monograph First and second law (ofthermodynamics) efficiency definitions are ptesented including theconcept of available work which makes possible the measuzement of the APS second law efficiency
Discussion and examples including coverage of such issues as houseshyhold energy using tasks (heating lighting etc) transportation and the automotive and industrial processes
-142-
B Estimation of Phadow Prices
SN Mishra and John Beyer Cost Benefit Axalysis A Casj-Study of the Ratnagiri Fisheries Project (India [Appendix III on Methodology and Estimates for Social Rate of Discount Accounting Price of In-vestment (Savings) Accounting Price of Foreign Exchange and Accounting Price of Unskilled Labor] Hindistan Publishing Co Delhi 1976
John Beyer Estimating Lhe Shadow Price of Foreign Exchmge An Illusshytration in India Journal oi Development Stuidies July 1975
This a1pendi has been provided to describe the basis on which the particular values used in the case study in India have been selected The results reported here are based on one of the most detailed exercises done by professional economists for an individual country The methodologyused broadly follows the UNIDO Guidelines (1972) and the effort is towards a review and adoption of aiternative methods of estinmation of shadow pricesDetails of alternative estimates for India have been given in the two studies The most important contribution of the studies is to show that suggested methodologies fo estimating social rate of discount and shadow prices can in fact be used to calculate these parameter values for a given country
The major limitations of the study are
(i) in estimating the social rate of discount they have used estimates for 5 (the elasticity of marginal utility of consumption) ranging between -15 and -30 They have not given much thought to the fact that in a poor country where even the necessities for the entire population may not be available in the next one or two decades the marginal social significance of additional constumption may not decline over time Besides they have ignored the role of PTP ie pure time preference in estimating the social rate of discount
(ii) The range of estimates for all the parameters is too wide to bea used for actual projectselection and ranlking A lot of subjective judgjments are involved in picking up values for variables (growth of consumption opportunity uosL of capital rate of reinvestment etc)which have -compounding effect on the estimates of nationalregional parameters Thus the planner is left with the use of intuitive reasoning and value judgments in selecting values for these parameters In this context -1t becomes eebatable if it is worthwhile to soend the effort on using eIaborate methods to calculate range of values for these parameters if they are uniusable for project analysis
(iii) Their estimates for shadow wage rate are rather unsatisfactory They have used the Little-Mirrlees approach of calculating marginalproduct of labor from market wage rates and average product This is rather unsatisfactory as the literature on difficulties of estimation of marginal product would suggest They have also not calculated the seasonal variations in shadow wage rates which is rather crucial in the context of rural-oriented projects
(iv) These studies have compietely ignored the problem of giving explicit weights for income distribution and regicnal developmentIf project selection is to be used directly to correct the unequaldisLribution of inccme among groups and regions this becomes quite an important aspect of the economic framework fcr project analysis
-144-
World Bank Estimating Shadow Prices for Colombia in an Input-OutputTable Framework World Bank Staff Workfng Paper 357 Sept 1979 Washington DC
This paper explains the calculation of shadow prices at the national level using the Input-Output technique The methodology outlined herepezmits easy calculation of Border-Price-Ratios (accounting prices forcommodities) for a large number of traded commodities and non-traded commodity sectors The values for 22 tradedL sectors and 9 non-traded sectors for Colombia have been given in the report The advantages ofthe 1-0 approach are easy calculation of conversion factors and quicksensitivity analysis of results using computerized I-0 approach Thelimitations relate to non-availability of I-0 tables in some countriesthe problem of classification of sectors and updating of 1-0 tables Even in this approach the basic problems in estimation of opportunitycost of capital and other parameters in social pricing eg theelasticity of marginal utility of consumption and the rate of pure time preference reaain
Other limitations of this study are the same as discussed in the context of the paper on Ivory Coast Although multi-sector conversion coefficients can be mechanically calculated and applied the real issues relating to social pricing consumption distribution weights the valueof public income and derivations of marginal propensities to save are as difficult to handle under this approach as in any other
-145-
World Bank Economic and Social Analysis of Projects A Case Study of Ivory Coast World Bank Staff Paper No 253 May 1977 Washington D C
This paper is a good attempt to demonstrate in a specific countrycontext the application of the methodology for economic and social analysis of projects developed by Lyn -lire and Herm-n G van der TakTwo steps in project evaluation are recogized efficiency analysiswhich is designed to select projects compatil)e with an optimal allocashytion of resources and social analysis which explicitly allows for thedistributive and growth objectives by attaching appropriate weights to private costs and benefits The study presents estimates of the parashymeters required for efficiency and social analysis and applies the results to threj projects in Ivory Coast
The approach outlines the following steps adjustment for transfer payments such as all tariffs duties and taxes fiom the costs and benefits use of snadow exchange rate shadow wage rate and of conversion factors for converting each particular input from domestic prices to norder prices The social analysis uses mcrginal consumption distribution weights for various income groups and the value of public income which is estimated in terms of the consumption stream generated by a unit of public investment
The World Bank approach seems to use ideas from the Little-Mirrlees method as well as the UNIDO Guidelines The result is a combination of concepts which are difficult to evaluate on a priori basis Althoughthe efficiency pricing step borrows heavily from Little-Mirrlees theIsocial pricing aspects use discributional weights and shadow price ofinvestment from the other approaches The real merit of the World Bankapproach would depend on the results of its application for a varietyof projects As is evident from the three case studies presented in this report the use of this methodology would require a correct specification of the private sector savings propensities as well as identification of beneficiary families and subjective weights on disshytribution If this information is not available the use of suggestedmethodology would not give any different answers
-146-
Food and Agriculture Organization of the UN (FAO) Economic Analsisof Forestry Projects FAO Forestry Paper 17 Rome 1979
The purpose of this volume on Economic Analysis of Forestry Proshyjects (EAFP) is (as stated in the Preface) to provide P practicalworkable approach and hence [it] does not contain a rigorousmethodology which has to be followed step by step in order to come outwith a good economic analysis of a project It contains chapters onidentification and valuation of inputs and outputs It also presentssections on the role of discounting decision criteria treatment ofuncertainty and the use of economic analysis in project design
This document provides a good discussion of the problems of 1faluashytion of output when rroject output is substituting for existing domesticsupply Especially interesting is the discussion where a fuelwood proshyject output substitutes for animal dung and crop residues andor fuelshywood presently being collected by people from nearby forests Similarlya simplified presentation of valuation of import substitutes or exportcommodities is helpful for the non-economist In valuation of inputsespecially land and unskilled labor the document gives a lucid preshysentation of the several issues involved including the possibilitiesof over-valuation of land in estimating its opportunity cost
The major limitations of the document are
(i) It does not give details of the methodology of estimatingnationalregional parameters and assumes that these values are available from the planners
(ii) The approach Dutlined is not based on social benefit cost analysis in the sense of using social rate of discount or shadow price of investment and putting weights on disshytribution of income to groups or regions However it does use the concepts of opportunity costs and shadow prices andlooks at the benefits and costs from the viewpoint of thesociety Thus the approach can be described as economic analysis as distinguished from financial analysis butstill does not incorporate all the concerns of social benefit cost analysis
(iii) The discussion on rate of discount and decision criteria is rather elementary and does not go beyond what is usuallydone in financial analysis The document neglects the use ofbenefit cost ratios and suggest that consideration of cnoices among projects for a limited budget ie decision making isbeyond the subject of EAFP It is difficult to acceptthis view of the authors because ranking projects in the same sector as well as providing BC ratio for comparison with oroshyjects in other sectors should be an important aspect of the Economic Analysis of Forestry Projects
-147-
C Case Studies on Renewable Energy Projects
David French The Economics of Renewable Energy Systems for DevelopingCountries Draft Washington DC January 1979
This paper provides most detailed benefit-cost analyses for threerepresentative renewable energy systems (i) a 40-hp solar thermal irrigation pump neaz Bakel Senegal (ii) a family-szale Indian biogasplant and (iii) a 55 kw solar cell irrigation pump on the borders of Lake Chad
The study presents details of financial analysis and suggests themajor adjustments required for economic analysis eg shadow pricingthe calculation of social costs and benefits and consideration ofsecondary effects The results show that neither the solar thermal pump nor the family-scale biogas plant appears to be profitable ineither financial or economic terms under any plausible set of assumpshytions The solar cell pump has positive net benefit by economic Rieashysures but is unlikely to be competitive with diesel power for anotherdecade There is also a good discussion of the analytical issues whicharise in pursuing benefit-cost analyses of renewable-energy devices
The main limitations of the study are
(i) Theru is a misunderstanding in valuation of benefits in two studies In the case of the 40 hp solar thermal irrigation pump as well as the 55 kw solar cell irrigation pump economic benefits have been calculated in terms of the value of outputof rice maize sorghum wheat or cotton grown by using the irrigation water supplied by the pump The NPVs and IRRs have been calculated using these benefits adjusted for shadow prices This method iz termed as viewed strictly in its own terms without reference to ccmpeting systemsi Howeverthis method is nor appropriate if the choice for the societyis to use either a solar irrigacton pump or a diesel irrigation pump for providing irrigation water to the crops regardless of the additional benefits from irrigation (The valuation ofirrigation water is a separate and a more complex matter) The introduction of a solar system replaces an existing (or potential)diesel system and hence the true benefit of the solar systemis the savings in resources (capital foreign exchange and labor)which would otherwise have been devoted to the diesel systemThus the correct method of estimation of benefits from a solar system is in terms of the costs (saved) of the competing systemand not in its own terms The latter in fact would involve attributing the benefits from the use of irrigation water to solar system although the same quantity (and quality) of irrigation water could be provided by a competing diesel system
-148shy
(ii) The cost data used as well as the available technologies have undergone zigrificant changes in the last four years For example the economics of family biogas units in the report arg reversed if higher kerosene prices and lower capital costs of Chine3e-type biogas units are taken into account
(iii) There is no effort to include distributio i l -- personal or regional -- considerations into project analysis and ranking
-149-
Douglas V Smith Photovoltaics in less Developed Countries MIT EnergyLaboratory Vlarch 1977 (revised August 1979) Cambridge MA
Douglas V Smith and Steven Allison Micro-Irrigation with Photovoltaics MIT Energy Laboratory April 1978 Cambridge MA
The above two studies present two alternative methods of economicevalution of non-conventional ener7y altrcnatives such as photovoltaicpowered irrigation pumpsets In the first study the photovoltaic systemis compaxed with diesel system and i is concluded that at a diesel fuelprice of 35 cents per litre photovoltaic power is competitive at solar array costs of $13CO per peak w In the second study by Smith and Allisonthey have used an alternative method of evaluating the economic viabilityof solar pumping of irrigation water They estimate the potential incre-ment to income from irrigated rice as $250hayear (assuming 25 tonshaof additional output due to irrigation) ard from this they calculatethe affordable unit costz of a pumping energy package which lies between$76 and $86 per peak watt Taking $8 Der peak watt as the current(1978) price they find solar pumping of irrigation water as economic
It may be rioted that of the two methods presented above the firstmethod of comparing it with diesel alternative is the correct procedureThe second method of calculating economic viability or affordablecost is misleading becuase this method attributes the benefits from use of irrigation water to photovoltaic power Since photovoltaic arrays(and the system) provide an alternative energy source for pumping wz erit would b necessary to analyze the economic viability of photovoltiacsin terms of the costs to the society of the lowest-cost energy alternativeavailable for pumping the benefit of using photovoltaics is the savingin the resource costs of diesel (-r other) alternative for pumpingthe same quantity of water
-150shy
Annex 1 Lake Chad Project Pumping Matrix in Working Daft ReoortAnalysis of Revelle Polder Development Scheme and Design for a LongRange Lake Chad Basin Study Prepared for US Agency for InternationalDevelopment by Meta Systems Inc Cambridge Mass October 1974
This is an example of analysis in which a very wide range of techshynical alternatives was considered Alternative individual devices(engines pumps) and combinations to produce pumping systems were inshycluded The range of systems included human power based systemsShadoofl animal powered systems (eg camel-power Persian pushingwheel) and a number of gasoline diesel and electricity powered altershynatives Limits on residue and firewood prevented consideration ofother alternatives (Stirling engine etc) Subsequent work by indishyviduals engaged in the project examined photovoltaic alternatives Theanalysis included both economic and financial analysis with consideration of some shadow prices
A version of this work is available from Dr R Tabors MIT Energy Laboratory Cambridge Mass
See Tabors (1979) and Smith (1979)
-151-
John Briscoe The Political Economy of Energy Use in Rural BangladeshHarvard University Environmental Systems Program August 1979 (Also published in Population and Development Review December 1979)
This study was conducted using the method of participant observation for 48 families of Ulipur village in Bangladesh The study sheds light on the relationship between ownership of energy-producing assets and the processes of generation and use of energy by various households of different economic statusoccupation
One of the most important contributions of the study is to highlightthe complex system of alternative uses of crop and animal residues and the pattern of their present and future uses Each crop produces several products each of which can be used for several purposes Food grains can be used as human food or animal feed crop residues as fodder fuel fertilizer or construction material animal residues as fertilizer fuel or cleaning material
He has also pointed out that social organization of the villagedetermines the control and distribution of energy resources and shows that ownership of energy producing assets is highly concentrated Given this unequal distribution rich farmezs have no incentives to improvethe efficiency of utilization of fuels since these fuels are surplusfor them anyhow Another chief merit of the study is to show the dynashymics of energy availability and use over time and to speculate how poorer villages would be adversely affected by introduction of irrigashytion high yield variety seeds and other development projects
The main limitations of the study are that no effort was made to estimate the actual energy content of different type of fuels and adequate emphasis not put on estimating the efficiency of various end-use devices Nevertheless the study provides a rich backgroundof the type of information that has to be collected to evaluate socioshyeconomic impacts of non-conventional energy technologies
-152-
US Agency for International Development (AID) Philippines ReforestashytionRural Energy Project AID Project Paper July 1980 Washington DC
This project covers the techno-economic and financial anaylsis of reforestation in the Philippines both as an ecological necessity tc present erosion and as a source of energy The proposed power generashytion plant (3Mw) is by means of a steam turbine fueled by the direct combustion of harvested wood It is estimated that in a 3 Mw plant usingfuelwood the costs of electricity generation would be $008kwh as compared to the power cost of $0091kwh frcm a diesel plant
The economic analysis gives considerable details of the capital costs required for the forestry project and includes income estimates for a tree farmer as well as the profitability of the power plantThe national economic benefits have been calculated as a net savingsin foreign exchange of the order of $08 million per year for a 3 MW unit The social soundness analysis has also been included in the reshyport and project beneficiary families and groups have been identified There is an attempt to quantify details of income housing settlement environmental industrial and power benefits to various categories of beneficiaries
The major drawbacks of the analysis in the report are
(i) The entire issue of economic cost of producing fuelwood especially the opportunity cost of land labor and other inshyputs into fuelwood plantations has been bypassed It isshyassumed that the cost of fuel to the power plant (including tzansportation) will be $25green ton and the tree farmer will be paid at $17ton The basis for estimates of fuelwood yield per hectare and labor inputs have also not been proshyvided The results of economic analysis would be verydifferent if the cpporLunity cost of land is included in the costs of fuelwood
(ii) Capital costs of the power plant have been assumed at $1400kw although there are indications that similar plants(excluding installation) $800kw No attempt has been made to get more representative estimates of the capital costs Detailed breakdown of capital costs of the power plant have not been provided
(iii) A 60 percent load factor for the power plant has been assumed This seems to be much higher than the achieved load factors in various countries where electricity is prishymarily used for lighting irrigation and small industries owing to seasonality of demand If a lower load factor is considered and if the fuelwood cost includes the opportunity
-152shy
cost of land in terms of benefit foregone (value ofagricultural output or fodder) the generation cost ofelectricity would be much higher than the estimate of$008 per kwh In fact the corrected costs may showthat generation from a diesel plant is cheaper than abiomass-based thernal plant If this turns out to betrue the whole economic analysis of this project reportwould be misleading
(iv) There is no effort to use shadow pzices in economicanalysis or performing sensitivity analysis to importanttechno-economic parameters
-154-
Hodam Associates California Cogeneration of Process Heat and Electricityfrom Rice Hulls in the Philippines Report prepared fox the USAID January 1980 Washington D C
This report covers the techno-eonomic feasibility of conversion of rice hulls to energy in the Philippines Two technologies -- direct combustion follo 4ed by a steam cycle and gasification follcwed by a diesel cycle -- have been discussed Issues of equipment - availability ofappropriate scale at reasonable cost the availability of skilled labor and experience with rice hulls as fuel have been ccnsidered in definingfeasibility Economic analysis presents a comparison of costs15-yearof current system gasification system and steam cycle system The gasishyfication system with cogeneration is found more economic although its tecinical reliability is in doubt The nation--ide benefits in terms of savings of diesel fuel are mentioned but not quantified
The following limitations of the analysis must be noted
(i) Although technical details have been covered in detail the efficiency estimates especially those for gasifiers and turbines are open to debate
(ii) The entire economics of the project depend on the sale of excess power to the utility since this accounts for 60 percent of the total savings There is very little analysis of this aspect exshycept for emphasizing its importance If lower load factor or capacity factor reduces this savings thce economics would be seriously affped
(iii) Wen diesel engines are run on gaseous fuels diesel 6uel is (generally) still used for ignition This diesel oil conaumpshytion (ranying between 10 to 30 percent of that for diesel oil alone option) has not been included in the annual costs
(iv) Although rice hulls are the major input these have not been included on the cost side From the societys point of view rice hulls definitely have an opportunity cost which can be estimated in terms of the benefit in alternative uses This would considerably alter the economics of power generation
(v) No effort has been made to do social benefit cost analysis or perform sensitivity analysis to important techno-economic parameters
-155-
Ramesh Bhatia Economic Appraisal of Biogas Units in India Framework for Social Benefit Cost Analysis Economic and Political Weekly 1977
This paper is based on an extensiw review of the literature ontechno-econo-mc and social aspects of bioea technology in india The article discusses valuation of capital costs operating costs (dung andlabor) and major benefits (gas slurry) as well as secondary benefits and indirect costs Using shadow prices t results of NPV estimates of systems to produce two or three cubic meters of gas per day (familyunits) have been presented The study indicates that (i) the economics of biogas crucially depends on the patter-n of utilization of gas for cooking or lighting Since use of gas for lighting replaces importedkerosene it is more economic to use gas for lighting rather than forcooking (ii) the technolo-economic paramcters for biogas technology are not based on proper field testing and scientific monitoring of bioshygas plants There is need to do RampD work on firming up details of gasavailability gas consumption for various actwvities optimization of the design of the plant estimation of the quality of slurry etc
The main limitations of the study are
(i) The data used are for the years 1976 and 1977 Price increasesin kerosene and diesel have increased the profitability of biogasunits if gas is used for lighting and for pumping water for irrigashytiondrinking
(ii) Technological breakthroughs such as adoption of drumless Chinese-type biogas plants in India have reduced the capital costs by 40-50 percent This has resulted in a higher benefit-cost ratio for investment in biogas plants
--
-156-
Food and Aricultural Organization of the UN (FAO) Economic Analysisof Forestzy Projectj Case Study No 2 Village Fuelwo6dPlanjtationsin Korea FAO Rome 1979-_
This xeport is one of the case studies of forestry aid forest indusshytries projects prepaxed by the FAO in order to demonstrate methods ofpreparing and appraising projects in the forest sector The fuelwoodproject discussed is a part of an integrated rural development programin Korea and is aimed at establishing about 11000 village fuelwood blocks covering 127000 hectarces
The case study p--ovides a good format for the detailed assessmentof technical considerations project costs and benefits Shadow pricesfor foreign exchange and labor as well as direct and indizeet projectbenefits have been considered Detailed sensitivity analysis of resultso the cnanges in a raxnrer of assumiLptions has been presented The studyis very useful as a prototype for carrying out similar studies providedtho drawbacks mentioned below are taken into consideration
(i) The cost of land which is the Lnst important component infuelwood plantation scheme has not been given due importance Theproject just mentions two lines It is considered that land under the project would have no alternative economic use for the periodof the project Therefore land is valued at zero There is no justification provided for this assumption It is inconceivablethat an area of 127000 hectares (approximately 11 hectares pervillage) can be found which is not being used currently as marginalagricultural or pasture land Even if it is currently not beingused it is difficult to accept the assumption that this land has no potential alternative economic use in the next twenty yearsinclusion of land costs in opporunity cost terms is expected to change the economics considerably
(ii) Although a shadow wage rate for unskilled labor is usedits estimation is rather unsaLisfactory Since there is someself-employment notably the weaving of bags from rice strawfor which the net value of production is about won 450daythis value has neen used to represent the opportunity cost ofunskilled labor durcing the period November to March It is not clear as to how many people in the region can earn thismuch money per day during the entire period If many workers (higher than the number employed by the project remain unshyemployed or earn less than won 450day a lower shadow wage rate should be used
(iii) The valuation of fuelwood is very arbitrary It ismentioned that since fuelwood is not traded at present the
-157shy
fuelwood has been valued in terms of the value of fuels that it would replace namely agricultural residues and coal Although the methodology ased is correct the details of the values of proportion of agricnltural residues replacing fuelwood the calorific contents of residue of fuelwood and the price of agricultural residue have not been given The price of both fuels (residue and coal) is taken as won 12kg without providing any basis or source of data The entire economics may be different if this estimate of benefit is changed Similarly no basis for fuelwood yields of 5 tonsha have been provided As shown in sensitivity analysis the project is uneconomic if benefit is reduced by 40 percent
Ramesh Bhatia Energy Alternatives For Irrigation Pumping Some Results for Small Farms in North Bihar India Paper presentedat the International Seminar on Energy Hyderabad India January 1979
This paper presents a detailed economic analysis of usingbiogas photovoltaics diesel and electricity (regional grid) for pumping irrigation water for small farms in Bihar India Apartfrom providing a literature review the paper also outlines technoshyeconomic and social aspects of using renewable energy sources for irrigation pumping The methodology used is
(i) To define alternative irrigation systems which are equivalent in the sense that each provides the same quantity and quality (timing) of irrigation water Each system includes tubewell a pump a prime-mover (adiesel engine or a duel-fuel engine or an electric motor) and an energy source (a biogas unit or regional electricity grid)
(ii) To rank these technical alternatives on the basis of the sum of the present value of investment and operating atcosts a given social rate of discount Since benefits from irrigation are the same (since the systems are equivalent) the alternativewith the lowest present value of total costs is considered the best ie giving the highest benefit-cost ratio The analysisis done both at market prices and shadow prices The results indicate that use of biogas for irrigation pumping is economic at current prices since it reduces the consumption of diesel by 20 to 100 percent while the use of photovoltaics (solar cells)would become economic only if capital costs can be reduced significarltly
One of the imnportant points made in the paper is about the use of the correct mocthodology of benefit-cost analysis One should be cautious against attributing benefits from the use of water to benefits from aparticular irrigation alternative as has been indicated in the review of some other studies The correct procedure is either to defineequivalent irrigation system and use the method of cost effectiveness as used in this paper or estimate the benefits of one system in terms of savings in the costs of the least expensive alternative The main limitation of the paper is that the alternatives covered do not include micro-hydel windmills village level electricity generation from biomass or human and animal power A more comprehensive coverage of energy alternatives along with a number of methods of conveyance and distribution of water in the fc1ld will be a useful extension of the present study
-159-
Russell J deLucia and Michael Lesser Energy from Organic Residues in Developing Countries Present Use Potential and Observations on Feasibility Paper presented at Bio-Energy World Congress and Exposition Bio-Enecgy 80 April 1980 Atlanta Georgia
This paper reviews the existing energy uses of crop and animal residues with particular reference to their use in rural areas The present role of these energy sources in relation to both other tradishytional (woodfuel) and commercial energy sources is then presented
An illustration of the complexity of irillage resource systems is presented outlining the diverse often competing uses of organicresidues food fertilizer fiber and fuel In this context the issues and probleas associated with the use of traditional energy sources are discussed
The potential for increased use of organic residues for energy ispresented for a variety of alternative country settings In light of this potential a framework for examining village energy needs and energy related technologies is discussed The presentation indicates the importance of integrating physical environmental social and economic issues in the evaluation of proposed intervention usingorganic residues (such as biogas) A sample analysis of such an intershyvention is presented based on recent work on Thailand with particular emphasis on differential class impacts
Paper available from R deLucia Meta Systems Inc
-160-
Alcohol Production from Biomass Potential and Prospects in the Developin- Countries Report No 3021 Industrial Project Department World Bank June 4 1980
This monograph is an extensive review of many of the issues assocshyiated with the potential for biomass based alcohol production in develshyoping countries Its focus is ethanol methanol is not discussed in any detail The treatment includes a discussion of ethanol charactershyistics in relation to current and potential uses such as boiler fuel gasoline substitute diesel substitute and chemical feedstock (or final product) The report reviews historic production and consumption figures of ethanol and discusses both alternative raw materials (sugarsstarches celluloses) and production technology The economics of ethanol production and use are considered for a series of generalized cases (high mnedium and low cost country groupings) based on capital costs for different raw material based alternatives and scales of production The analysiF includes a discussion of the relative attracshytiveness of ethanol depending on use A discussion of overall prospectsfor alcohol production is presented While the document does include a limited discussion of some wider econonic policy issues such as the food-versus-energy crop competition and the need for integrated policiesthe report does not sufficiently highlight these broad questions they are left to the closing section of the document
At that date this was a Gray Colored Cover ForltOfficialUse Only document It may subsequently receive aider distributiion
-161-
MJ Groeneveld and KR Westerterp Social and Economic Aspects of the Introduction of Gasification Technology in Rural Areas of Developing Countries (Tanzania) in Thermal Conversion of Solid Wastes and Biomass Jerry L Jones and Shirley B Radding editorzi ACS Symposium Series 130 American Chemical Society Washington DC 1980
This study describes gasification processes in general terms outshylines how a system can be assembied and organized and reports on a pilotplant using 25 Kg fuel per Kwh (mechanical) The authors have presented a sketch of the gasifier unit but no dimensions or scale are shown thus making it difficult to judge on the size of the unit In analyzing the social and economic costs and benefits of adoption of such a plant the authors argue the following evaluation criteria should be used a) that wastes for use as a fuel are available and useable without damaging the agricultural system of the environment b) that the technology be congraent with the existing social and cultural system so as to facilitate adoption c) that among the alternatives available the technology chosen has the largest positive impact on the conditions of the poorest stratum in the society d) that profitability criteria for the owners and users of technology are met and finally e) general and overall considerations of national interest and agreement with national economic and other objectivesThey then describe the applicability of such a technology in a Tanzanian village -1hey examine different production possibilities (of different crops) for their potential useability in the biomass fueled plant they report that three products -- corn (cobs) coffee (skin) and wood (sawshymill wastes) -- look promising whereas the other five -- sorghum (straw plume) millet (strawchaff) cotton (strawseedspress residue) wheat (strawchaff) and groundnuts (shells) -- need further study Since currently there is no other use for corncobs they argue they are suitshyable candidates for use as fuel The authors then carry out a social benefit cost analysis for a20 Kw corn mill run on a gasifier costingabout $300 (1977) The analysis and presentation are fairly confusing but they result in showing (i) a net benefit of $118125 per year (atmarket price) and (ii) a net benefit of $]94730 per year (at estimated shadow prices) Hence they conclude that gasification of corncobs is economically and socially beneficial in Tanzania this particularly so since the technology presented here is relatively simple and can be locally manufactured While the study shows no great light on the ecoshynomic evaluation methodologies for either biogas projects or for choice of technology in general its chief merit lies in being a relatively rare and certainly new attempt at asking such questions in African contexts
SECTION VI
GENERAL BIBLIOGRAPHY
Adler HA Economic Appraisal of Transport Projects A Manual with Case Studies Indiana University Press 1971
Averical Physical SocietyAmerican Institute of PhysiLs Efficient Use of Ener (The APS Studies on the Technical Aspects of the More Efficiert Use of Energy) AIP Conference Proceedings No 25 Washington DC 1975
Bacha E and L Taylor Foreign Exchange Shadow Prices A Critical Review of Current Theories Quarterly Journal of Economics 1971
Balassa B The Effects Method of Project Evaluation Oxford Bulletin of Economics and Statistics November 1976 pp 219-231
Barnett A L Pyle and SK Subramanian Biogas Technology in the Third World A Multidisciplinary Review International Development Research Center Ottawa 1978
Beyer J An Economic Framework for P2oject Analysis in India Mineo Ford Foundation New Delhi 1972
bull Estimating the Shadow Price for Foreign Exchange An Illusshytration from India Journal of Development Studies July 1975 pp 302-315
Bhatia JR Economic Appraisa of Biogas Units in India Framework for Social Benefit Cost Analysis Economic and Political Weekly August 1977
Energy Alternatives for Irrigation Pumping Some Results for Small Farms in North Bihar Paper presented at International Seminar on Energy Hyderbad January 1979
_ An Analytical Framework for Socio-Econcmic Assessments of Technological and Policy Alternatives Paper prepared for the East-West Center Honolulu January 1980 (Draft)
and M Mehta Tubewell Irrigation in India An Economic Analysis of Technical Alternatives Economic and Political Weekly August 1977
and M Niamir Renewable Energy Sources The CommunityBiogas Plant Paper presented in a seminar at Harvard Univershysity Department of City and Regional Planning November 1979
Bhavani S Biogas for Fuel and Fertilizers in Rural India -- A Social Benefit Cost Analysis Indian Journal of Agricultural Economics July-September 1976
-163-
Biswas TD Cow Dung Gas Plant for Energy Manure Fertilizer News September 1974
Brannon R Agricultural Sector Assessment -- Thailand January 1978
Briscoe J The Political Economy of Energy Use in Rural Bangladesh Population and Development Review December 1979
Bruno M Domestic Resource Costs and Effective Protection Clarifishycation and Synthesis Journal of Political Economy 1972 pp 16-33
Cecelski E J Dunkerley and W Ramsay Household Energy and the Poor in the Third World Resources for the Future Washington DC July 1979
Cullison AE Feeds and Feeding Reston Publishing Co Restcn VA 1975
Dasgupta A and SW Peace Cost Benefit Analysis Theory and Practice MicMillan London 1972
Dasgupta P A Comparative Analysis of the UNIDO Guidelines and the OECD Manual Bulletin of the Oxford University Institute of Economic Statistics pp 33-51
Dattachandhuri M and AK Sen An Economic Evaluation of the Durgapur Fertilizer Project Indian Economic Review April 1970
deLucia RJ HD Jacoby etal LDC Energy Planning A Study of Bangladesh Submitted for prepublication review Manuscript available from RJ deLucia President Meta Systems Inc Cambridge MA June 1980
and Sector-wide Analysis and Investment Program Design Chapter 10 in deLucia Jacoby etal opcit June 1980
and M Lesser Energy from Organic Residues in Developshying Countries Present Use Potentials and Observations on Feasibility Paper presented at the World Bio-Energy Conference Atlanta GA April 1980 To be published in the proceedings
and R Tabors Traditional and Renewable Energy Reshysources Chapter 4 in deLucia Jacoby etal op cit June 1980
Disney R Economics of Gobar-Gas versus Fertilizer A Critique of Intermediate Technology Development and Change Vol 8 (1977) pp 77-102
-164-
Eckstein 0 Water Resources Deelo ment The Economics of ProjectEvaluation Harvard University Press Cambridge MA 1958
Food and Agricultural Organization of the UN (FAO) Timber Trends Study Thailand Rome 1972
rTropical Feeds Feeds Information Services and Nutritive Values (by Bo Gchl) Rome 1975
_ Economic Analysis of Forestry Projects FAO Forestry Paper 17 and Case Study No 2 Village Fuelwood Plantations in Korea Rome 1979
French D The Economics of Renewable Energy Systems for Developing Countries mimeo US Agency for International Development January 1979
Geertz C Agricultural Involution University of California Press Berkeley 1963
Ghate PB Biogas A Pilot Project to Investigate a Decentralized Energy System Paper presented at the International Seminar on Energy Hyderabad January 1979
Biogas A Decentralized Energy System Economic and Political Weekl July 7 1979
Gittinger JP Economic Analysis of Agricultural Projects Johns Hopkins University Press Baltimore for the World Bank Washington DC 1972
Groeneveld MJ and KR Westerterp Social and Economic Aspectsof the Introduction of Gasification Technology in Rural Areas of Developing Countries (Tanzania) in Thermal Conversion of Solid Wastes and Biomass JL Jones and SB Radding ed ACS Symposium Series 130 American Cheinical Society Washingshyton DC 1980
Harberger AE On the Uses of Distributional Weights in Social Cost Benefit Analysis Journal of Political Economy September 1968 pp 87-120
_ Project Evaluation Collected Papers Markham Publishing Co Chicago 1971
_ Taxation and Welfare Chicago University of Chicago Press 1978
Harrington J Alternative Sources of Energy in the Rural Environment mimeo Paper presented at Seminar on Energy Conversion and Audit Madras July 1977
Hodam Associates California Cogeneration of Process Heat andElectricity from Rice Hulls in the Philippines Reportprepared for USAID Washington DC January 1980
Indian Council of AgriculturalResearch The Economics of Cow Dun Gas Plants A Report New Delhi 1976
Jacoby HD and JJ Stern Economic Cbjectives Parameters andAssumptions Chapter 7 in deLucia Jacoby et al 92 citJune 1980
Jenkins GP Theozy and Estimation of the Social Cost of ForeignExchange Using a General Equilibrium Model with Distortionsin All Markets miriteo HIID Development Discussion Paper 26Cambridge MA 1979
KVIC (Khadi and Village Industries Commission) India Gobar GasWhy and How (Revised) New Delhi January 1977
Lal D Wells and Welfare Organization of Economic Cooperation and Development Paris 1972
Disutility of Effort Irrigation and the Shadow Wage Rate Oxford Economic Papers March 1973
_ Methods of Project Analysis A Review World Bank StaffOccasional Papers No 16 Johns Hopkins University Press Baltishymore for the World Bank Washington DC 1974
Little IMD and JA Mirrlees Project Appraisal and Plaining forDeveloping Countries Basic Books Inc New York 1974
and M Fg Scott Using Shadow Prices Heinemann Edushycational Banks London 1976
Marglin SA Public Investment Criteria Allen and Unwin London 1967
Value and Price in theLabor Surplus Economy Oxford at the Clarendon Press 1976
McGauhey SE Investment Criteria for Agricultural and Rural Developshyment Projects The Measurement of Their Multiple Economic andSocial Consequences pp 1-62 in Economic Analysis of ForestryProjects Readings FAO Forestry Paper 17 Supplement 2 Policyand Planning Service Forestry Department FAO of the UN Rome 1980
Mishan EJ Cost Benefit Analysis Praeger New York 1976
-166-
Mishra SN and J Beyer Cost Benefit Analysis A Case-Study of the Ratnagiri Fisheries Project (India) [Appendix III on Methodology and Estimates for Social Rate of Discount Accountshying Price of Investment (Savings) Accounting Price of ForeignExchange and Accounting Price of Unskilled Labor] Hindustan Publishing Co Delhi 1976
Moulik TK and UK Srivastava Biogas Plants at the Village Level Problems and Prospects in Gujarat Indian Institute of Manageshyment Ahmedabad 1976
Mubayi V J Lee and R Chatterjee The Potential of Biomass Conshyversion in Meeting the Energy Needs of the Rural Populations of Developing Countries An Overview Brookhaven National Laborshyatory September 1979 mimeo
National Council for Applied Economic Research (NCAER) India Domestic Fuel Consumption in Rural India New Delhi 1965
Organization for Economic Cooperation and Development (OECD) Manual of Industrial Project Analysis Volume II by IMD Little and JA Mirrlees OECD Development Center Paris 1968
Overseas Development Administration UK A Guide to Project Appraisal in DevelopingCountries London 1972
Oxford Economic Papers Symposium on Shadow Exchange Rates July 1974
Parikh J Assessment of Solar Applications for Transfer of Technology Solar Energy 1978
Parikh KS and J Parikh Potential of Biogas Technology IASA Vienna 1977
Prasad CR K Krishna Prasad and AKN Reddy Biogas Plants Prospects Problems and Tasks Economic and Political Weekly August 1974
Reynolds LG ed Agriculture in Development Theory Yale University 2ress New Haven 1975
Roemer M and JJ Stern The Appraisal of Development ProjectsA Practical Guide to Project Analysis with Case Studies and Solutions Praeger New York 1975
Reutlinger S Techniques for Project Appraisal under UncertaintyWorld Bank Occasional Staff Paper Johns Hopkins University Press Baltimore 1970
Sanghi AK and Dekle Day A Cost Benefit Analysis of Biogas Producshytion in Rural India Some Policy Issues in W Lockeretz edProceedings of the Conference on Energy and Agriculture Academic Press New York 1977
-167-
Sathianathan MA Bio-gas - Achievements and Challenges AVARD New Delhi 1975
Schwartz H and R Berney eds Social and Economic Dimensions of Project Evaluation Inter-American Development BankWashington DC 1977
Sen Amartya K 1972 Control Areas and Accounting Prices An Approach to Economic Evaluation Economic Journal pp 486-501
bull Employment Technology and Development Oxford at the Clarendon Press 1975
Singh Inderjit Smiall Farmers and the Landless in South Asia World Bank Staff Working Paper No 320 February 1979
Sinha B and R Bhatia Economic Appraisal of Irrigation Projectsin India A Social Benefit Cost Analysis of Auranga Reservoir
Hopkins University Press Baltimore for the World Bank Washington
Project in Bihar mimeo Harvard University Cambridge MA 1976
Squire L and HG Van der Tak Economic Analysis of Projects Johns
DC 1975
Smith Douglas V Photovoltaics in the Third World MIT Energy Labshyoratory Working Paper 79-045 Cambridge MA 1979
Subramaniam SK (1976) Biogas System in Asia Management Development Institute 1977
Tabors R The Economics of Water Lifting for Small Scale Irrigation in the Third World Traditional and Photovoltaic Techniques MIT Energy Laboratory Report No 79-011 (Available from NIIS) 1979
Tyner Wallace E and John Adams Rural Electrification in India Biogas versus Large-Scale Power Asian Survey August 1977
United Nations Industrial Development Organization (UNIDO) Guidelines for Project Evaluation New York 1972
_ Guide to Practical Projecct Appraisal Social Benefit Cost Analysis in Developing Countries New York 1978
United States Agency for International Development (USAID) Appraisal for Development Washington DC 1979
_ Philippines ReforestationRural Energy Project AID Project Paper Washington DC July 1980
World Bank Economic and Social Analysis of Projects A Case Study of Ivor Coast Staff Working Paper No 253 Washington DC 1977
World Bank Thailand Toward a Development Strategy of Full Partici_a tion - A Basic Economic Report Washington DC September 1978
Estimatin Shaduw PFcices for Colombia in an Input-Output Table Framework Staff Working Paper No 357 Washington DC 1979
_ Alcohol Production from Biomass Potential and Prospects in the Developing Countries Report No 3021 Industrial Projects Department Washington DC 1980
ANNEXES
A Economic Evaluation of a Village Level Community Biogas Plant
B Electricity Generation from a Village-Scale Biogas Plant
C Estimates of Calorific Value Parameters
Annex A
Economic-Evaluation of a Village Level Community Biogas Plant 1
There have been a number of studies on technical and economic aspects
cf biogas technolugy in India and other developing countries A detailed
analysis of the various techno-economic-social aspects is found in Barnett
et al (1978) Bhatia (1977 1979) French (1979) Ghate (1979) Cecelski
et aL (1979) Tyner and Adams (1977) Disney (1977) and Parikh amp Parikh
(1977) It has been pointed out that private biogas plants to meet the
energy demands of a particular household would restrict the technology to
a relatively richer stratum of the rural communities who own more than
three heads of cattle per household Community biogas systems have been
suggested as one of the most efficient and equitable ways of meeting the
energy needs of the poor in the villages Such community plants are said
to have the following advantages
(i) These units being large scale plants should have economies of scale in capital costs while having smaller heat losses requiring less precision in temperature mainshytenance and feeding and permitting design modifications to improve efficiency more easily than small plants
(ii) The community plant would provide employment through laborshyintensive dung collection and by-product fertilizer distribushytion as well as on account of increased labor demand resultingfrom irrigation and small industries powered by gas
(iii) The benefits of such a plant in the form of cooking and lightingfuels will be available to the relatively poorer sections of the community who for various reasons are unable to install individshyual household plants
(iv) The large scale plant can generate enough gas to run dual-fuel engine for running of tubewell for drinking water and irrigationfor operation of flourmill chaff-cutter and thresher It could also produce enough gas to run an electric generator to provide
For further details see Bhatia and Niamir (1979)
A-2
electricity for street lighting house lighting and television as well as for running various machines
cv) The comunity plants can serve as a vehicle for the cooperativecommunity action and can provide a forum for decision-making for the benefit of a large number of people
As against these advantages it is mentioned that community plants
have significant diseconomies of scale on account of higher costs of
distribution of gas and collection of cow dung and there would be considshy
erable problems in implementing a scheme which requires management skills
cooperative action and decision-making in a rural setup characterized by
unequal access to resources
Although there have been reports of successful operation of large
scale biogas plants in India Korea and Philippines (See Barnett et al
1978) there are relatively few known cases of comnunity biogas plants
in operation Researchers have pointed out that the organizational and
technical problems of establishing and running either private or cooperashy
tive biogas systems are formidable but there is absolutely no literature
based on an actual experience in the field Although the problems connected
with collecting cow dung maintenance of the plants and collection of gas
are recognized there is no documentation available on the nature of these
problems in different community settings It is imperative to analyze the
techno-economic and social aspects of this technology if the great potential
of community biogas plants as an efficient and equitable source of energy in
rural area tQ be exploited The present case study is an attempt to
fill this crucial gap in the available literature on renewable energy sources
A-3
Tables A-1 and A-2 provide data on the major characteristics of the
village as well as sore main components of the project It is recognized
that these conditions will vary from one region to the other and a project
can be varied from one location to the other on the basis of the perceptions
of the planners as to which aspects are important for the village in question
It is hoped that this case study will provide some lessons for determining
the various cowponents of the project on the basis of explicit priorities
in allocation of gas for different activities
Benefit Cost Analysis
The methodology of Social benefit cost analysis has been used to
answer some of the questions raised above The analysis is done in two
stages first it is assumed that the maximum amount of cow dung (100)
will be diverted to the community biogas plant and the allocation of gas
is done as stipulated in the project In other words the plant is
analyzed under best conditions In the second stage of analysis an
attempt is made to study the case when there is a reduction in available
cow dung This can happen in situations where the number of cattle
decreases Another possibility is that villagers contribute less than the
total available dung to the plant because of their preference for using
dungcake for specific cooking needs
In the cases of Benefit Cost Analysis (BCA) of a biogas plant estimashy
tion of benefits is very crucial Since the capital and operating costs
are quite straightforward the results of BCA depend on the assumptions
A-4
made regarding benefits For the purposes of demonstration we have
discussed alternative measures of benefits both from the point of view
of the users as well as from that of the society The objective of this
is to make explicit all the assunptions involved and to see their implications
for different plans of utilization of gas from the plant
Tables A-3 and A-4 give details of present pattern of energy use in the
village Table A-5 provides per hour gas requirements for the operation of
different activities These are standardized requirements and do not equal
the present use of gas for different operations necessarily It can be
seen that cooking requires the heaviest use of gas followed by flour
milling and threshing The percentages vary slightly in daily use
because of the varying hours of use It can be seen from Table 22 that
cooking (by all households) uses more than half of the daily gas availability
in the summer but almost 34 of the availability in the winter
Quantification and Valuation of Benefits
Estimation of Benefits of Cooking
Alternative estimates of benefits of using gas for cooking under
different assumptions are detailed below
Assumption 1 Saving in Labor Cost or Time
The opportunity cost of laborhours released from collecting
firewood and plant residue and for making dungcakes cannot be quantishy
fied since there is no reliable data for how much labor energy is
A-5
expended on these activities Besides labor will still be used in
transporting cow dung daily to the biogas plant and removing slurry
from the plant to the slurry pits This method has not been used
in order to avoid the arbitrariness involved in quantification and
valuation of labor
Assumption 2 Opportunity Cost in Terms of Value of Alternative Use Plant Residue Firewood and Dung
In this context the basic question to be answered is what is
the benefit of using these resources when these are released from
their present use as a consequence of availability of biogas
a Plant Residue A total amount of 27334 kgmonth or an equivalent of 18 million kilocalories (net) are currently used for all households This constitutes approximately 60 of the total net energy used for cooking If this quantity of plant residues is released from cooking there will not be any economic value added since the villagersdo not perceive a market for it It can be used for liveshystock fodder but no data are available on fodder consumpshytion to assess this benefit Finally a possible benefit is the agricultural use of the plant residue but again there are not enough data to evaluate this benefit It is not known whether the villagers perceive a need for using plant residue as organic fertilizer It may be that there is no alternative use for plant residue since soil characteristics and cropping patterns may not indishycate any benefit from it and so burning plant residue for cooking may be the most efficient use of these resources
b Fuelwood A total of 442 kgmonth of fuelwood (or equivalent of 028 million kcal) is presently used If this amount is released from cooking there can be two forms of benefits The first would depend on whether the wood which is still being collected is now sold in the market The price of firewood in small towns (including transportation costs) is estimated at $038 per kg therefore the total value
A-6
1added is $166 per year This represents the maximum gain although it is nct known whether all the firewood released will be sold and hence this benefit will in fact be attained by the villagers
The second form of benefit is the ecological benefits of not cutting the wood There are no data to evaluate this benefit It is not known what t of firewood is collected Cutting branches collecting fallen branches and twigs or cutting bushes may not have as much of an adverse impact on the ecology as is generally associated with felling trees for firewood
c Dung With the total dung production of 1392 kgday 445 or 619 kgday dung was used for producing dungcakes (1238 kg dry dung x 5) Thus with the biogas plant this quantity of 619 kgday is released and can potentially be used for manure Assuming that approximately 4 is still used for cleaning and other domestic uses 1336 kgday is the total slurry available for manure which is the equivalent of 126 kgacrc of operashytional agricultural landholding per day whereas before the introduction of the biogas plant a total of 700 kgday of dung or 66 kgacre was used For each household it would have differential impact since size of holding varies from one to the other It must be noted that all of the dung released may not necessarily be used as manure This will depend on whether he farmers were using the dung primarily for its NPK content or for its soil building characteristics (in which case they may use more dung if it is released) Alternatively if their priority was on using dung for manure then presumably the use of 555 of the dung proshyduced may be the optimal amount and so the farmers may not use more dung for manure than they already do In case all of the dung released is assumed to be used as manure there will be a value added in terms of N which is estimated as follows N content is 1 per kg of slurry dung therefore with a total o- 619 kgday or 18570 kg per month of wet dung or 1857 kg of nitrogen per month is available The net import cost of N is $07 per kg Assuming N content
IAi the calculations here as well as those made in Tables A-7 to A-13 were originally made using figures in Rupees These have been converted into US dollar figures using $1 = Rs8 rate Due to rounding the numbers here and in tables do not match exactly
A-7
of urea is 45 and import cost of 1 kg urea is $025 per kg and local transport and distribution cost is $012 per kg Therefore the value added by N is $125 per nionth or $1500 per year3 (See
Talle A-7Y
However it should be mentioned that with the present information on hand it is difficult to judge which resource has a perceived benefit in alternative uses If however there are no alternative uses for any of the released reshysources then it would be more efficient not to intervene at all into the village energy system and to allow present cooking habits to continue The usual argument used to justify biogas plants namely that gas must be used for cooking o that the valuable manure can be diverted for use as fertilizer would no longer apply And the biogas plant would provide much higher benefits if gas is used for other operations such as tubewell etc The details of the latter assumption are examined later in this case study
Assumption 3 Resource Cost in Terms of Equivalent Soft Coke
Under this assumption benefits from the use of biogas in cooking
are estimated in terms of the resource costs of providing alternative
fuels for plant residue dung and firewood This method assumes that
plant residues and dung have better uses than being burnt and hence
the society should provide some alternative fuel (say soft coke) to
villagers Since the choice from the viewpoint of the society is to
employ either soft coke or biogas for cooking and if both fuels are
Thishowever assumes that the N content per kg of digested slurry (1) is the same as that for ordinary organic manure (non-scientific composted) since 96 of total dry dung produced is used as opposed to 527 (or the amount added to existing use) There is some disagreement on this point as discussed in detail in Bhatia (1977) Besides it is also pointed out even though the quantity of N per kg remains the same it is the quality that is improved Digested slurry is reported to have more ammoniated N (which is picked up easier by the plant than ordinary manure Since the quality of N in biogas slurry will depend on the handling practices and in dry farming slurry is usually dried for months before it is used on the field we have assumed that N content remains the same as in cow dung
A-8
considered of equal quality by planners (not by users) the
benefits to the society from biogas used in cooking are the
savings in resources
a Cost of Soft Coke -- Plant Residue Assuming that there is a definite benefit in releasing all of the plant residue from cooking we can convert the energy from the plant residue (1765766 kcalmonth) to an eauivalent of 17285 kg of soft coke per month or 20742 kgyear (Soft coke has a gross energy content of 5772 kcalkg which at an effishyciency rate of 177 gives a net energy content of 10216 kcalkg) The cost of soft coke (including transportation) has been estimated at $17 per ton (see Ehatia 1977) TIerefore the resource cost of equivalent quantity of soft coke is $350 per year and this can be used as the benefit to the society of providing gas for cooking
b Fuelwood A total of 442 kg of fuelwcod is used monthly by all households Most of this is used for cooking but an insignificant amount is also used for crafts and conshystruction It is not at all certain what type of fuelwood is collected Probably most of it is in the formof twigs and branches which do not create as much of an environmental hazard as cutting logs From the societal point of view the benefits of replacing fuelwood with biogas can be quantified by finding the cost of the equivalent amount of soft coke required 442 Kg of fuelwood is equivalent to 284736 kcal of energy every month This is equal to 2787 kg of soft coke per month or 33446 kg of soft coke per pear At a cost of $17 per ton the benefits amount to $57 per year
c Dung The resource cost of dung from a societal point of view is substantially higher than for fuelwood A total of 37147 kg of dry dung is used by all households per month This is the equivalent of 1 million kcal of net energy Converted to soft coke it would take 995 kg of soft coke per month to replace it giving the resource cost of $200 per year The resulting estimates of benefits in terms of resource costs of substitute (soft coke) are given in Table A-13
A-9
Estimation of Benefits in Lighting
Table A-4 shows actual use of kerosene for lighting In total there
is a need for an equivalent of 4916 cft of gas per day for lighting in
the houses A total of 5994 litres of kerosene was used per month At
a purchase cost of $025 per litre (including transportation and marketing)
the total saving in the cost of kerosene is $15 per month $180 per year
Furthermore there is the additional benefit of having street lightshy
ing Street lighting if provided through petromaxes using kerosene may
be assumed to give equivalent quality of lighting as is available from
electricity The resource cost in terms of kerosene is as follows with
the assumption that one litre kerosene produces the same lighting requireshy
ment as two kwh of electricity and the total energy required for street
lighting is 288 kwh per day (72 kw for four hours) therefore 144 litres
of kerosene per day or 5184 litres per year are needed Thus the equivashy
lent resource cost is $130 per year for street lighting To this we should
add the annualized capital costs of petromaxes However this is ignored
since no data is available
Another important benefit that cannot be quantified is that kerosene
used for lighting may be seen as a superior product than electricity or
lighting Kerosene is more flexible and can be turned on and off by each
individual household at will and there is less wastage of the resource
Besides kerosene lamp is more mobile and can be easily taken outdoors for
various uses Biogas lighting whether from the generator or direct gas
lamps is controlled by a central committee The houts of operation are
open to collective discussion but it can never have the flexibility that
kerosene can provide
A-10
Estimation of Benefits from Tubewell Irrigation
Before the introduction of the community biogas plant a man from
outside the village was supplying water for irrigation by hooking his
pump to the existing stream He was charging $125 per hour for his
services In the winter period the tubewell run by biogas will supply
irrigation for 25 hours per day therefore the savings for the village
is $3 per day or $365 for four winter months The savings will be less
in the summer time since normally the canal would overflow and provide
free irrigation for at least half the acreage theretore the savings can
be estimated to be $365 for the eight summer months giving a total of
$730 per year
Another way of estimating the benefits from biogas is in terms of
savings (to the society) of diesel oil estimated as follows a total of
1560 litres of diesel fuel is used per year in the pump Since the
tubewell continues to use 20 diesel (ie 312 liter per year) the total
savings are 1248 liter of diesel and at a cost of $025 per liter a
total of $312 per year is saved But the annualized capital and 0 amp M
cost of the diesel engine are $115 which should be excluded from operating
costs or added to the benefit side Therefore the benefit from the tubeshy
well is $427 per year The second alternative is used since in the former
case the hours of operation used are potential and not necessarily the
actual use Furthermore computing by wage may give the wrong impression
that there is a cost in terms of one less person employed although the
pump man does not belong to the village in any case
ln the project report it was assumed that a mixture of 20 diesel and 80 gas will be used for running for dual-fuel engine for the tubewell Actual consumption of diesel turned out to be different A mix of oneshythird diesel and two-thirds gas
A-Il
Table A-10 provides a breakdown of the quantificable benefits of the
community biogas plant under the two assumptions discussed above
Estimation of Costs
Table A-II presents capital costs of the plants while Table A-12 gives
details of operating costs It may be noted that of the total capital
costs of $17293 at shadow prices biogas plants (including gas distribushy
tion network) account for 60 percent Electricity generatox and the
distribution network account for another 20 percent In the case of
operating costs skilled labor for supervision accounts for about half
the costs while fuel costs (diesel plus lubricating oil) account only
for about 14 percent
Benefit Cost Ratios
Table A-13 presents the Net Present Values (NPV) and Benfit Cost Ratios
for the two alternatives The results show that under the assumptions outshy
lined above from the societys point of view investment in community
biogas plant is not profitable If Assumption 3 is considered ie if
the value of gas is taken in terms of resource costs of providing equivalent
soft coke the B-C ratio is very low ie only 0012 The NPV will be
marginally positive if the annual benefit is on the order of $3386
in place of $1585 This would be the case if the price of soft coke is
doubled and the import cost of kerosenediesel also increases approximately
by 100 Hence the investment in community biogas plant would become
socially profitable only when fuel costs increase by 100 from their present
levels In the case of Assumption 2 the BC ratio is 0596 and it would be
A-12
marginally greater than unity if the annual benefit is higher by $
or so ie by about 27 of the present estimate However it must be
remembered that in this method of Assumption 2 sbout half of the estishy
mated annual benefits are from value of additional N content of manure
which may or may not be available to the farms or may not be as beneficial
to the farms as is assumed here This indicated that there is immediate
need to firming up data on NPK contents of cow dung dried cow dung manure
dried slurry from biogas plant etc under field conditions
Conclusion
The analysis above shows that if priority is given to cooking and
lighting in utilization of gas the benefits of a community biogas plant
do not outweigh its costs
The method of Alternative Uses in estimating benefits provides a
better BC ratio than using Resource Cost Analysis but both methods are
based on equally shaky assumptions It is clear that there is a need
for more in-depth observation of the circumstances surrounding the
introduction of this community biogas plant
The present analysis was based on the assumption that there will be
a 100 availability of dung to be used in the biogas plant Such an
assumption may be unrealistic If the dung is reduced less gas is
supplied and thus already precarious benefits from the plant are reduced
even further while the costs will remain the same
A-1 3
It is interesting to note that the economics of biogas technology
depend- on the following assumptions
(i) The calorific content of different fuels such as cow dungcakes fuelwood used in cooking plant residues kerosene and biogas
(ii) The efficiencies with which these fuels are being used currently or the possible equipments which could lead to higher efficiencies
(iii) The NPK contents of different organic fertilizers and the yieldshyfertilizer response functions for organic fertilizers under different agronomic conditions and crop rotations
(iv) The behavioral aspects of use of energy sources or organic fertilshyizers such as present use pattern-s actual and perceived conshystraints to their use etc
It is not clear how the benefits of the project are perceived and
received by different beneficiaries The richer farmers view lighting
benefits as most important while others do not attach too much importance
to lighting and are not willing to payRs five per month per household for
the bulbs Benefits from cooking and tubewell operation are also distributed
It must be keptin id tliatthis village is not a typical village
in India It provides particularly favorable conditions in which a biogas
plant was implemented There are ample supplies of cow dung the distribution
of land and income is relatively even and the literacy rate is higher than
average If a conmunity biogas plant is uneconomic and difficult to
operate in such favorable conditions it is difficult to justify its use
in other situations
A-14
TABLE A-I
MAJOR CHARACTERISTICS OF THE VILLAGE
LOCATION About 4 miles from a railway station in Etawah district of Uttar Pradesh India
POPULATION Adults 81
Minors 96
Total 177
Number of Households - 27 Number of Cultivative Households - 25
LIVESTOCK
Cows and Bullocks 41
Buffaloes (male and female) 35
Young Calf and Buffaloes 35
Goats 25
136
DUNG PRODUCTION
Kgs per day 1362
Tons per year 490
LAND USE AND CROPS
Total Land Area (operated) 106 acres
Irrigated Area 25 acres
Major Crops Paddy Ashar (Lentils) Mustard
ENERGY SOURCES
No Electricity
Kerosene for Lighting
Plant Residues Dung Cakes and Fuelwood for Cooking
Animals for Crop Production
A-15
TABLE A-2
MAJOR OMPONENTS 01 THE VILLAGE LEVEL
CC$4MUNITY PIOGAS PROJECT
A BiOas Plants
Two units 35 M3 + 45 M3 per day capacity
or 2800 F3 (cft) per day capacity
B Dual-Fuel Engine and Related Machinery
Duel-Fuel Engine
Tubewell
Flour Mill
Thresher
Chaff-cutter
C Electricity Generator
Electricity generator
a dual-fuel engine
5 HP
4 HP
5 HP
5 HP
2 HP
coupled with
35 HP
D Distribution System
Gas through pipes for cooking for 27 households and
electricity through distribution lines for street
lighting and houses
A-16
TABiLE A-3 KCAL EQUIVALENTS OF PRESENT ENERGY USE BY DIFFERENT
SOURCE FOR EACH CATEGORY OF HOUSEHOLDS PER MONTH
Dung Cake Plant Residue Firewood Total
Category (Size of No of Net Net Net Net Operational Land House- Kcal of Kcal of Kcal of Kcal of
Holding holds Month Total Month Total Month Total Month Total
Small 5 216223 213 406908 23 0 0 623203 (Less than 1 ha)
of total small 35 65 0 100 203 category energy consumption
Medium 11 324253 319 610470 346 46383 163 981105 J( ha - 2 ha)
of total medium 33 62 5 100 32 category energy consumption
Large 10 476238 468 748326 424 238354 837 1462918 (gt 2 ha)
1 of total large 33 51 16 100 477 category energy consumption
Total 26 1016714 100 1765776 100 284736 100 3067226 100
A-17
TABLE A-4 CONSUMPTION OF FUELS FOR COOKING AND LIGHTING
PER MONTH PER HOUSEHOLD
Cooking Needs Lighting
Category of Net Farmer (Size Plant Total Useful Useful of Operational Dung Cakes Residues Fuelwood Energy (Net) Kerosene EnergyHolding) (kilograms) (kgs) (kgs) (Thousand kcals) (litres) (Kcal)
Small 1580 1260 1246 160 2752 (Less than 23 acres)
Medium 1077 899 36 892 154 2649 (231 to 449 acres)
Large 2175 1448 74 1463 350 6020 (More than 45 acres)
Total 4832 3607 110 3601 11421664
NOTES 1 Effective heat available is estimated on following assumptions
Dungcakes 2444 kcalkg 122 efficiency = 2737 kcalkg
Plant Residues 3800 kcalkg at 17 efficiency = 646 kcalkg
Fuelwood 4702 kcalkg at 137 efficiency = 6442 kcalkg
Kerosene 11110 kcalkg or 7936 kcallitre 217 = 1720 kcallitre
2 For assumptions and further discussion SEE Bhatia (1977) Harrington (1977) NCAER (1965)
3 Every Household does not consume each fuel in the same quantities Hence the totals only indicate average consumption
A-18
TABLE A-5 GAS REQUIREMENTS PER HOUR OF
DIFR=ENT OPERATIONS (IN CUBIC FEET)
Case II Case I Without With (Using 1 Of the total water in over-
Operation I____
Electricitv Generator
Gas For Lighting
head tank 53f 3 is uJed to mix wich slurry - sbince it takell total of 66f 3 zof
Cooking 2 126 Burners I_
Licfting (26 I
Homes)
247
41
247
117
gas (60f gashr 66 minutes to fill tank then only 04f3 of gas is used for slurry water and restfor drinking water
i(l 0 Watt) 4 2 Each burner requires 95
2ighting (Streets)f(20 Watt)4
115 63
3
cfthour of operation
Flour milling threshing
jrinking Water 7From Tubewell
1 656 656 chaff cuttng and tubewell require 15fiHPhr estimated total based on
___HP actually used
Slurry Water 1 04 04 From Tubewell 4 Generator -es total of
525 cft gashr - ie
Tubewell For tIrrigation
534 534 15cftHPhr and only 35 HP used For gas lamps 45 cftlamp hr is used
o 4 HP Used)5
5 In the first hour of Flour Milling i(5 HP Actually Used)
75 75 operation 66 cft used for drinking and slurry water and 534 cft for
Threshing (5HP)
75 75 irrigation shy in all other remaining hours of day all of tubewell operates(60cft) is used for irrishy
-haff-Cutting 30 30 gation
(2 HP Used)
A-19
TABLE A-6 DAILY USE OF GAS BY TYPE OF ACTIVITY IN
SUMMER AND WINTER
SUMMER WINTER (Mar-Oct ) (Nov - Feb )
of of
Type Of Total Total Total Total OTES Activity (cftday) Demand (cftday) Demand 1 Dual-fuel engine runs a
thresher (4 hrsday in summer
Cooking7L 482 543 13585 729 chaffcutter (2hrsday in summ and winter each) flour mill (4 hrsday in winter and
Genernr 261 or Lighting
r oject case 210 77 2363 127
_rjctcae1
hrday in summer) and tubeshywell (25 hrsday in winter 6 hrsday in summer) and hrday (winter) 5 hrday
Tubewell (Sumzmer) extra thus the totil
For irrigation 3204 117 1335 7 gas required for dual-fuel enshygine in summer is 885 cft and
Flour MillA3 1125 41 75 4 in winter is 285 cft
09 2 46 x 40 watt bulbs for houses
and 18 x 40 watt tubelights
for street lighting 2560 Chaff Cutter 60 22 60 32
watt = (746 kwHP) =3
100 1863 100 or 35 HP (+ loss) x 15fTotal Demand 2485 = 525 cft gashr used by
1893 generatorTotal Supplyw 2728
3 75 f3hr
4 30 f3 hr each
Only 66 minutes used for filling overhead sank of 357 f3 capacity (9 f3sec) assumption still held that it requires 60 f gashr to run tubewell
Alternative 2 One lamp per household used 4 hrsday requiring 45 f3
of gashr that is 468 cftday in both swnmer amp winter
1 burner per household used 6 hrsday requiring 95 f3 hr
From 2 plants (one of 35 m and other 45m3) - summe5 conversion rate of 196 f kgday winter conversion rate of 136 f kg and total of 1392 kg gobarday
Total capacity of plants is 2857 f3day but since gas is being continually used and generated more gas than above can be produced
A-20
TABLE A-17 YEARLY VALUE ADDED FROM THREE SOURCES OF
ENERGY FOR COOKING BY HOUSEHOLD CATEGORY
tegory (Size of irational Land 1ding
all (Less Than 1 ha)
Number of Households
5
N Content of Dung $
320
Plant Residue $ Fuelwood Total$
320
ditun (Between 2 ha)
1 ha 11 480 27 507
rge (More Than 2 ha) 10 705 139 844
tal 26 1505 166 1671
Note 1 see text for calculations
A-21
TABLE A-8 SAVINGS IA COST OF KEROSENE FOR HOME LIGHTING PER HOUSEHOLD
Category Savings In (Size Of Number Kerosene Per Average For
Operationql Of Year Households Holding Households $ $
Small (Less Than 5 24 48 23 Acres)
Medium (231 -449 Acres) 11 508 46
Large (More Than 45 acres) 10 108 101
TOTAL 26 1828
A-22
TABLE A-9 YEARLY RESOURCE COSTS BY HOUSEHOLD CATEGORIES FOR COOKING
Category (size of number soft coke soft coke soft coke Total
operational land of replacing replacing replacing
holding) households dung plant fuelwood cakes residue $
$ $
Small (less than 1 ha) 5 66 1145 184 1989
Medium (between 1 ha-2 ha)
11 45 78 1216 1356
Large (more
than 2 ha) 10 907 1575 254 2736
Total 26 2017 3S0 564 6081
A-23
TABLE A-10 YEARLY QUANTIFIABLE BENEFITS BY ACTIVITY
Activity Alternative Resource Use Method Cost Method$ $
Cooking 1670 608
Lighting 281 281
Tubewell 427 427
Flour Mill2 272 272
Total 2650 1588
Notes 1 See text for calculations
2 Assuming that Rs 5 or $063 will be earned for grinding a quintal of
wheat in an hour It is assumed that the flour mill will be operated
for 435 hours per year
A-24
TABLE A-Il CAPITAL COSTS OF VARIOUS UNITS AT MARKET AND SHADOW PRICES
At Market Prices At Shadow Prices
Per cent
Unit(s) Per cent of of Total $ Total Costs _ _ _ Costs
1 Bio-Gas Plants 8908 455 7159 414
2 Gas Distribution 3325 1 3540 205
3 Dual-fuel Engine and Related Machinery 3598 184 3265 189
4 Electricity Generator 2794 143 2533 146
5 Electricity 46Distribution 938 48 797
Total 19563 100 17294 100
SOURCE For details of assumptions see Annex Table 1 in Bhatia and Niamir (1979)
1 There is a subsidy for 54 burners (two per household) at an
approximate cost of Rs 20-25 (or $25-3) each which is not included in the capital cost since it is relatively marginal
2 Excludes cost of chaff cutter and threasher
A-25
TABLE A-12 ANNUAL OPERATING COSTS OF COMMUNITY BIO-GAS PLANT
At Market Prices At Shadow Prices
Units $ Percent of Total Percent of Total
1 Bio-Gas Plants 700 343 256 164
2 Fuel Cost of Duel Fuel Engine and Related Machinery 2 1082 53 1066 68
3 Fuel Cost of Generator and Electricity Generation 246 12 228 146
4 Kerosene Cost For One Month of Lighting 15 7 15 1
Total 2043 100 1565 100
A-26
TABLE A-13 NET PRESENT VALUES AND BENEFIT COST RATIOS UNDER ALTERNATIVE ASSUMPTIONS
Assumption 2 Alternative 3 (Benefits in Alter- (Resource Cost of native Use) Soft Coke)
1 Annual Benefits (B) $ 2649 1587
2 Present Value of Benefits Over a 20 Year Life PV (B) $ 25169 15077
3 Annual Operating Costs (C) $ 1565 1565
4 Present Value of Operating Costs PV (C) $ 14869 14869
5 Present Value of Capital Costs PV (I) $ 17292 17292
6 Net Present Value NPV=P(B)-P(C)-P(I) $ 6992 17084
7 Benefit Cost Ratio B P(B)-P(C) C P(I) $ 596 012
Excluding the costs of chaffcutter and thresher machines except the fuel costs which are treated as benefits from the bio-gas plant
Annex B
Electricity Generation from a Village-Scale Biogas Plant
In this case study we-will present some results of the economic analysis
of electricity generation from a village-scale biogas plant It may be
mentioned that the size of the electricity generation equipment in this
village is limited by the availability of cow dung and other animal wastes
in the village since the present technology does not enable the use of
crop residues or water hyacinth as biogas input Based on the availabilshy
ity of 1400 kgs of wet dung per day the gas production in summer has been
calculated as 2760 ft3day ( 196 ft3kg) and in winter as 1900 ft3day
( 136 ft3kg) If it is assumed that a 15 HP dual-fuel engine coupled
with an electricity generator will be used and fuel inputs would be in
the ratio of one-third diesel and two-thirds biogas then the available
quantity of gas can be used to run a 15 HP engine for 12 hoursday during
winter and 175 hoursday during summer
The capital and operating costs of electricity generation are set out
in Table B-1 It may be noted that annualized capital charges account for
a little over 50 percent of the total annual costs Using the figures of
annual electricity generation (implying a load factor of 66 percent) the
unit costs of Llectricity generation from biogas are $00584kwh at market
prices and $0054kwh at shadow prices
For the sake of comparison one can estimate the costs of central
electricity generation from a conventional coal-based thermal power plant
(100-200 IN capacity) in India Average capital costs of generation and
high voltage transmission are assumed at $1000kw while the capital costs
B-2
of distribution lines (LT lines) are estimated at $2000 per kilometer
Assuming a 66 load factor (5880 hoursyear as in biogas unit) 114 kgs of
coalkwh and $20 per ton of coal the average costs of generation and
transmission can be estimated at $0046 per kwh excluding the costs of
LT distribution lines The effect of costs of LT lines on the unit cost
of electricity generation would he site specific and wouPK -pend on the
additional power demand that is served by this LT line If it is assumed
that the extension of the LT line for a distance of one kilometer is
undertaken exclusively for the village where the biogas plant is to be
installed the entire capita cost of $2000 (for a length of one km)
should be attributed to the delivered cost of electricity made available
to this village from a central generating staticn The additional annual
costs on this account are estimated as $00031kwh giving a total cost
of $00494kwh which is somewhat lower than the costs of generation
of $00584kwh at market prices using biogas for electricj2 generation
The costs of central electricity generation would be lower than those for
electricity from biogas unit if the length of distribution (LT) lines is
less than 35 kilometers This shows that under the assumptions outlined
above decentralized electricity generation from biogas will be economic
vis-a-vis central generation based on coal if biogas plant is located
more than 35 kilometers away from the nearest HTLT distribution line
Similar calculations can be made for regionalcentral electricity generation
based on fuel oil or biomass or with hydroelectric power
It is recognized that the above cost estimates as well as load factor
assumptions may have to be modified for other regionscountries However
the above calculations are intended to show the type of economic calculations
B-3
that should be made in order to pr6vide background for the role of
biomass-based electricity generation
Electricity Generation from Biomass Comparative Cost Estimates for 3MW
and 20 MW Units
In this section an attempt is made to illustrate the use of economic
principles involved in estimating costs of electricity generation from
biomass sources especially fuelwood Two examples have been studied
(i) A 3MW unit using fuelwood produced under a Social Forestry type of scheme and meeting the electricity demand of a few villages and
(ii) A 20MW unit using fuelwood from a forest area and catering to the electricity demand of one or two large scale industrial units a few small scale units and agricultural demand of a few villages
Ideally the illustrative economic analysis performed below should be
done in the context of location-specific details about capital costs of
equipment and transmission fuelwood costs 0 amp M costs costs of transshy
portation of fuelwood etc However such information for site-specific
projects in developing countries is not readily available Hence the
calculations made below on the basis of available project reports have to
be considered in the nature of order of magnitude figures and should be
modified for specific projects
The following points may be noted from the data on costs of electricity
generation from fuelwocrdpresented in Tables B-2 and B-3
i) In the case of capital costs per kw the figures used are $1400kw for a 3MW unit and $1361kw for a 20MW unit This does not show any appreciable economies of scale which are known to exist in
B-4
power plants of this range This may be due to differences in sources of data number of items included in capital costs andthe methods of calculation of costs and differences in locationGiven the lack of disag~regation in available data it was notpossible to make these data comparable However these data do indicate order of magnitude figures
One other aspect of cost data that needs to be looked into carefully is the mark-ups of capital costs which are builtinto the estimates of capital costs of imported machinery in adeveloping country For example in this case the cost figureused is $1400kw which may be inclusive of these mark-ups
Cii) The major difference in costs is in terms of fuelwood costs Inthe case of a 3MW plant it is assumed that it will use fuelwoodwhich will be specially grown for this unit in a social forestrytype of scheme This would require diversion of existing landfrom other uses to fuelwood plantations It is generally assumed that marginal land for fuelwood is available free of cost sincethis land would have no alternative economic use for the periodof the project It must be emphasized that this is a very imshyportant assumption since in the case of most of the land-scarcedeveloping countries land may be in current use as pastures or as low-yielding crop land In the case of 2389 hectares of landrequired to produce fuelwood for the 3MW plant it is difficult to assume that such land would be available which has no altershynative economic use Hence it is assumed that land is either being used or can be potentially used to grow low-yielding food crops (or equivalent fodder) giving a cropfodder output of one ton per hectare valued at $200ha This is the figure that has been used in these calculations The costs would be locationshyspecific and would have to be modified in the context of a particular siteproject2
In the case of a 20MW plant which is using fuelwood availableby cutting existing forests the valuation of opportunity cost offuelwood becomes very difficult If wood from the concerned forshyest area could be used for timber or paper industries the opporshytunity cost of this wood be equal to benefit foregone in thesealternative use(s) If however the quality of wood is such that it can be used only as fuelwood the opportunity cost offuelwood has to be estimated in terms of opportunity costs ofinputs used in fuelwood ie land labor and other resources
For example see the FAO case study on Village Fuelwood Plantations inKorea FAO Forestry Paper 17 FAO Rome 1979
2he estimation of opportunity cost of land and other inputs used is a very complex issue and is discussed elsewhere in the report
B-5
The opportunity cost of land would in turn depend on the value added in using this land for growing crops or for growing fodder for livestock The opportunity cost of labor can be estimated in terms c4iits shadow price Since such valuation would require a detailed economic analysis of alternative uses of land labor and other resources it is considered beyond the scope of this case study For the sake of illustration we have used a figureof $20 per ton as the cost of fuel as indicated in the PhilippinesReforestationRural Energy Project cited earlier In addition we have used a transport cost of fuelwood of $5ton in line with the data used in the case of a 3MW unit
(iii) The 0 amp M costs of electricity generation plants have been taken from their individual source reports
The results of the cost estimates in the two cases are presented in
Tables B-I and B-2 The following points about these results may be noted
Ci) The costs for 3MW unit range between 1087 centskwh at market prices to 96 centskwh at shadow prices This difference is mainly on account of shadow wage rate of zero used for unskilled labor for weeding maintenance and transport
(ii) The costs for a 20MW unit are 85 centskwh at market pricesabout 20 percent lower than in the case of a 3MW unit As was pointed out earlier this difference is not on account of economies of scale in capital costs This is arising mainly on account of costs of input which go into fuelwood productionIn the case of a 3MW unit opportunity cost of land was valued as benefit foregone in terms of value of agricultural cropsHowever in the case of the 20MW unit similar estimates were not used and a national figure of $20ton was used reflecting the costs of inputs in fuelwood production
(iii) The costs of electricity from fuelwood in the above examples is considerably higher (40-50 percent) than the cost of electrictiy from biogas in the earlier example Although capital costs andother assumptions are not strictly comparable and an analysis for a site-specific case should be done the above results do indicate the need for a careful comparison of available alternatives
B-6
TABLE B-I COSTS OF ELECTRICITaY GENERATION FROM A VILLAGE-SCALE BI(GAS PLANT
Market Prices Shadow Prices
A Capital Costs
15 hp generator set 4560 4190civil works for 1000 884distribution cost 900 800Biogas plants 12233 10697
18693 16571
B Annualized Capital Charges at 10 discount rate 1869 1657
C OampM Costs
Fuel costs (including lube oil)1 10811081 generator maintenance 420 376(including biogas maintenance) 1457150
D Annual Costs (BampC) 3370 3114
E Annual electricitygeneration (kwh) 57685 57685
F Cost of electricity generation $00584kwh $00540kwh
iGas Production 2760 ft3day during Sunmer (March-October) 1900 ft3day in Winter (November-February) due to lower output of gas per kg of cow dung
2Summer operation 210 days at 175 hoursday producers 41400 kwh Winter operation 120 days at 12 hoursday produces 16285 kwh
(Enginegenerator capacity 15 hp Gas consumption 14 cftkwh)
DieselPrice - 025 $liter 005 literhp-hr (diesel consumption)Lube Oil Price shy 0375 $liter 0017 literhp-hr (lube oil consumption)
B-7
TABLE B-2 COSTS OF-ELECTRICITY GENERATION FROM FUELWOOD 3MW PLANT
Market Prices Shadow Prices
A Capital Cost
$1400kw $ 42 million $ 495 million
B Annualized Capital Cost $ 042 million $ 0495 million
(at 10 discount rate)
C 0 and M Costs
Fuelwood Costs
Opportunity Cost of Land $ 477800 $ 477800 ($200ha for 2389 ha)
Labour Costs $ 143340 0 ($60ha)
Transportation of Fuelwood $ 95550 $ 38220 ($5 - $2ton)
Operation and Maintenance of
the Plant $ 6517 $ 1997
D Total Annualized Cost (C + B) $ 11428 million $1013017
E Annual Electricity Generation $10512 million $10512 million (kwhr)
F Overall Cost $kwhr $ 01087 $ 0096
SOURCE ReforestationRural Energy Project for Phillippines USAID ProjectPaper July 1980 and Survey of Rural Energy Consumption in Northern India by NCAER (1978)
ASSUMPTIONS
1 Foreign exchange is given a premium of 25 under shadow prices while unskilled labor is valued at zero
2 Wood production 8 tonshayear 6000 Btulb of wood load factor 40 system efficiency 151
3 It has been assumed that benefit foregone from land used for fuelwood is one ton per hectare of food grains valued at $200ton
B-8
TABLE B-3 COST OF ELECTRICITY GENERATION FUELWOOD 20MW PLANT
(Million $)
Market Prices Shadow Prices
A Capital Costs
$(136kw) $ 2722 $ 3222
B Annualized Costs at 10 $ 272 $ 3222
C 0 and M Costs
1 Input Costs for Fuelwood Production (excluding Land) $20ton $ 2548 $ 2548
2 Opportunity Cost of Land
3 Transportation Costs of Fuelwood ($5 - $2ton) $ 0637 $ 0254
o2peration and Maintenance of the Plant $043 $ 0013
D Total Annual Cost (B + C) $ 5948 $ 6037
E Annual Electricity Generated $ 7008 $ 7008 (kw-hr)
F CostKw-hr (DE) $ 0085 $ 0086
Discussed separately in the text
SOURCE Data obtained from North-West Pacific Corporation Seattle USA for a unit in Oak Ridge USA on load factor
ASSUMPTIONS
1 System utilization 40 system efficiency 15
WOOD PRODUCTION
127400 tons from 15900 hectares assuming 8 tonshayr and 6000 Btulb Shadow price of unskilled labor zero 25 premium on Foreign exshychange in capital cost
Annex C
stimates of Calorific Value Parameter
In this appendix we descri[ the various estimates of values of
important parameters used in different studies The objective of this
note is to show that the available information is rather inadequate
on crucial parameters which determine the social profitability of biogas
plants The estimates of the following parameters are discussed
calorific value of biogas efficiency of biogas utilization calorific
value of soft coke and its utilization efficiency calorific value of
cow dung cake and its utilization
Calorific Values of Gas
The fuel value of biogas is directly proportional to the amount
of the methane it contains since other gases (carbon dioxide hydrogen
nitrogen) are not combustible Most of the studies assume a thermal
value of biogas instead of indicating how much combustible methane is
in the gas ICAR (1976) has quoted fzcm a paper by Biswas (1974) saying
that the appropriate composition (by volume) of the gas evolved from
a cow dung gas plant is as follows Methane 50-60 Carbon dioxide 30-40
hydrogen 5-10 and nitrogen 4-6 The gas burns with a smokeless blue
flame and has a calorific value of 550 BTUs per ft3 or 135 kilocalories
-3 per ft
1 On an average methane has a fuel value of 950-1050 BTUs (BritishThermal Units) per cubic foot (cft or ft3 ) If the biogas contains 60 percent methane its value will be between 570-630 BTUs (One BTU is the amount of heat required to raise the temperature of onepound of water by 10 F at STP)
-171shy
C-2
No experimental data has been reported in the paper indicating calorific
value of biogas actually obtained from the plant
Parikh (1976) has also accepted the assumption of 135 kcal per
ft NCAER (1965) have assumed a methane content of 60 percent implying
a calorific value of 575 BTUcft or 141 kcal per ft3 KVIC (1975) says
that gobar gas consists of approximately 55 percent methane and 45
percent carbon dioxide
Sathianathan (1975) has pointed out that compared with other gases
biogas has very low fuel value though like most other gases the efficiency
is 60 percent He has indicated a range for fuel value of biogas as
540-700 BTUs per ct3 as against the ft3 the fuel value of 2900-3400 BTUs per
ft3 for butane He has quoted J Patel who gives the following calorific
values for the various compositions of digestion gas
Net Calorifi9S No Proportion Value per ft
CH4 H2 CO2 (Methane) (Hydrogen) (Carbon dioxide) BTU Kcal
1 60 10 30 5792 145
2 50 10 40 4922 124
3 45 10 45 4412 110
4 40 10 50 3592 90
5 35 10 55 3492 87
It is not very clear if these values have been estimated from some exshy
perimental data or these are just hypothetical estimates He has also
mentioned that in many so-called family plants about half of the total
C-3
gas produced is carbon dioxide and sometimes its proportion is even
higher This would imply a 40 percent methane ratio giving a calorific
value of 359 BTUs (90 Kcal) per ft3 Bhavani (1976) has calculated
a median value of the figures given by Sathianathan and used a calorific
value of 1112 kcalft3 Harrington (1977) has noted that calorific
values range between 87 and 145 kcalft3 and pointed out that an assumption
of 135 kcalft3 would imply rather good digestion conditions
Efficiency of Gas Utilization
Regarding the efficiency of gas utilization no estimates of actual
utilization are available Alnost all the studies have assumed a 60
percent thermal efficiency KVIC (1975) indicates that special burners
developed by the Commission have to be used to get 60 percent efficiency
It has also pointed out that if coal gas or Burshane burners are used
for gobar gas the efficiency is very low (35 percent instead of 60 pershy
cent) NCAER (1965 p 114) gives results of two experiments on fuel
efficiency in which the calorific value of gas is taken as 473 BTU (or
118 kcal) per ft3 and utilization efficiency ranges between 548 percent
and 559 percent In view of lack of reliable data on the actual efficiency
of utilization with the burners being used currently it is difficult
to accept the assumed value of 60 percent However we have not changed
the value of this parameters in our sensitivity analysis Instead
we have assumed an effective heat utilization of 70 kcalft 3 in one
which may be obtained by a number of combinations such as 1177 kcalft3
with 60 percent efficiency or 1208 kcalft3 with 55 percent efficiency
and so on
C-4
Calorific Value of Soft Coke and the Efficiency of Utilization
KVIC (1975 p 13) has used a calorific value of 6292 kilocalories
per kilogram The Commission has not indicated any source for these figires
It has indicated a thermal efficiency of 28 percent NCAER (1965 p 112)
has quoted figures for efficiency of various appliances as per experiments in
Shri Ram Research Institute New Delhi Out of the ten experiments conducted
on soft coke the calorific value in nine experiments was taken as 6297 kcalkg
(or calgms) The percentage of heat utilized in eight out of ten experiments
ranged between 222 percent and 287 percent Parikh (1976) has also used a
figure of 28 percent efficiency of coal burning However NCAER (1965 p 110)
has given the following figures one tonne soft coke heat content of 5772000
kilocalories (ie 5772 kcalkg) and the efficiency of utilization in domestic
oven is 177 percent These figures are also in line with those used in the Reshy
-ort of the Energy Survey Committee of India submitted in 1965 On account of
the significant variations in these two estimates we have used the first estimate
in our Reference Results and the second estimate (lower figures) in our
sensitivity analysis
Calorific Value of Cow Dung Cakes and Efficiency of Utilization
KVIC (1975 p i3) has assumed that the calorific value of cow dung cakes
is 2092 kcalkg and the efficiency of utilization in open chulah is 11 percent
NCAER (1975 p 114) uses a figure of 2130 kcalkg and gives efficiency figures
of 107 and 101 percent In its conversion factors given on p 110 NCAER (1965)
gives a value of 2440 kcalkg and 112 efficiency of utilizations Parikh
(1976 p 98) has given a calorific value of 3300 kcal per kg (dry weight) for
dung cakes and burning efficiency of 11 percent
C-5
It may be seen from the above discussion that there is need to conduct
experiments under different field conditions and standardize the values of
these parameters for various regions in the country
In addition the calorific content of other energy sources are as
follows
plant residue = 3800 kcalkg at 17 efficiency = 646 kcalkg
fuel wood = 4702 kcalkg at 137 efficiency = 6442 kcalkg
kerosene = 11110 kcalkg or 7936 kcallitre at 217 = 1720 kcallitre
The other assumptions made in the paper are summarized below
1 Daily dung production rates by type of animal by household
category
cowbullock 1273 kg (small category)
12 7 kg (medium category)
1275 kg (large category)
buffalo 1845 kg (small category
1442 kg (medium category)
1843 kg (large category)
young cattle 9 kg (small category)
9 kg (medium category)
75 kg (large category)
2 Gas requirements per operation
cooking burner 95 cfthour
to fill water tank 66 cftday
tubewell irrigation 534 cft for first hour of day 60 cfthour
rest of day
flour milling threshing and chaff cutting each 15 cftHPhour
generator 15 cftHPhour
gas lamps 45 cftlamphour
C-6
3 Gas production from a combined capacity of 35m3 plant and 45m3
plant
summer ccnversion rate =
winter conversion rate =
4 1 kg dry dung = 5 kg wet
5 Nitrogen content of dung
196 cftkgday
136 cftkgday
dung
N content = 1 per kg of wet dung (since it is used after being
dried in the open)
6 1 litre kerosene = 2 kwathrs of lighting
7 Costs (including transportation)
net import cost of nitrogen = Rs 54kg
net import cost of urea = Rs 2kg
price of fuel wood in small towns = Rs 25kg
cost of soft coke = Rs 135kg
cost of kerosene = Rs 2litre