Embed Size (px)
Citation preview

STATE OF NEW HAMPSHIRE
DEPARTMENT OF LABOR
61st
Biennial Report
July 1, 2013 – June 30, 2015

State of New Hampshire
Department of Labor
March 2016
Her Excellency Governor Margaret Wood Hassan
and the Honorable Executive Council
Dear Governor Hassan and Members of the Executive Council:
The New Hampshire Department of Labor is pleased to present you its 61st Biennial Report
reflecting the period of July 1, 2013 through June 30, 2015 pursuant to RSA 273:10 and RSA
281:A:61. The information contained in this report reflects the many activities and
accomplishments of our department.
We are pleased to continue to promote our mission of serving the needs of labor, business,
healthcare providers, school districts, and the citizens of New Hampshire. To that end, one of
the greatest tools that we’ve instituted is our email alert system which provides updated labor
law information as well as news on the ever increasing number of labor law seminars that we
offer throughout the state. This renewed push for customer outreach has been the primary factor
in increased compliance with New Hampshire labor laws.
Thank you for your support and we look forward to continuing to work with you as we serve and
protect the interests and dignity of the New Hampshire workforce.
Respectfully submitted,
James W. Craig
Commissioner of Labor
Hugh J. Gallen State Office Park Spaulding Building 95 Pleasant Street Concord, NH 03301 603/271-3176 TDD Access: Relay NH 1-800-735-2964 FAX: 603/271-6149 http://www.nh.gov/labor
James W. Craig Commissioner of Labor
Kathryn J. Barger Deputy Labor Commissioner
STATE OF NEW HAMPSHIRE
DEPARTMENT OF LABOR
61st BIENNIAL REPORT
JULY 1, 2013 – JUNE 30, 2015
MARCH 2016
RSA 273:10 AND 281-A:61
STATE OF NEW HAMPSHIRE
GOVERNOR AND EXECUTIVE COUNCIL
THE HONORABLE MARGARET WOOD HASSAN
GOVERNOR
THE HONORABLE JOSEPH D. KENNEY
EXECUTIVE COUNCILOR - FIRST DISTRICT
THE HONORABLE COLIN VAN OSTERN
EXECUTIVE COUNCILOR - SECOND DISTRICT
THE HONORABLE CHRISTOPHER T. SUNUNU
EXECUTIVE COUNCILOR - THIRD DISTRICT
THE HONORABLE CHRISTOPHER C. PAPPAS
EXECUTIVE COUNCILOR - FOURTH DISTRICT
THE HONORABLE DAVID K. WHEELER
EXECUTIVE COUNCILOR - FIFTH DISTRICT

State of New Hampshire Department of Labor
Mission Statement and Vision Statement
Mission Statement To serve and protect the interests and dignity of the
New Hampshire workforce.
Vision Statement
Our vision is to be recognized by the public as:
1. Being a proactive and accessible resource to employees
and employers
2. Ensuring fair and consistent labor practices
3. Utilizing progressive technologies
4. Having efficient and responsive processes
5. Treating all individuals with respect and courtesy
6. Being competent and professional
Staff of NH DOL

State of New Hampshire Department of Labor
Statement of Guiding Principles
Guiding Principles
1. We believe that proactive communication is helpful
in the education of the NH workforce.
2. We are dedicated professionals who are committed
to serving the public in a fair and objective manner.
3. We believe that showing respect and courtesy to
others will inspire others to do the same.
4. We believe our fullest potential is realized through
teamwork and cooperation.
5. We are committed to the belief that we can always
do better and will strive towards that end.

TABLE OF CONTENTS
I. Statutes Administered by this Department
II. Organizational Charts
III. Personnel Data
IV. Council & Boards
V. Receipts & Expenditures
VI. Legislation
VII. Workers Compensation Division
VIII. Inspection Division
Appendix A: Wage & Hour
Appendix B: Boiler & Elevator
Appendix C: Safety
Appendix D: Training
IX. Physical Plant & Property

I. Statutes Administered by this Department

STATUTES ADMINISTERED BY THIS DEPARTMENT The New Hampshire Department of Labor was established by Chapter 48 of the Laws of 1893.
RSA 273. Provides for the operation of the Department of Labor and covers the mediation
and arbitration of labor disputes.
RSA 157-A. Boiler and Pressure Vessel Inspection Law. The Department of Labor issues
licenses for all boiler inspectors. This department also certifies boilers and pressure vessels for safe
operation.
RSA 157-B. Elevator & Accessibility Lift Law. Elevators and accessibility lifts are certified
for safe operation. Elevator and accessibility lift inspectors and mechanics are licensed by this
department.
RSA 275. Protective Legislation. Governs the conditions of employment such as lunch
periods, fringe benefits and access to personnel files. Collection of wages due employees is also covered
under this act.
RSA 275-A. Citizens Job Protection. This law addresses labor strikes and employment of
aliens.
RSA 275-E. Whistleblowers’ Protection Act. This act protects employees who report
violations of law or refuse to execute illegal directives.
RSA 275-F. WARN Act. Worker Adjustment and Retraining Notification Act protects
workers by requiring advance notice of significant employment losses at large employers
numbering seventy-five or more employees.
RSA 276-A. Youth Employment. The purpose of this statute is to encourage the
employment of youth while safeguarding them from excessive hours and specific hazardous employment
opportunities.
RSA 277. Safety and Health of Employees. The Department of Labor is responsible for
assuring that all employees in the public sector have safe and healthy working conditions.
RSA 277-A. Workers’ Right to Know Law. This law guarantees employees in the public
sector who are exposed to toxic substances the right to know from their employer the effect of being
exposed to the substance.
RSA 277-B. Employee Leasing Companies. Regulates Employee Leasing Companies in
order to protect employer’s and employee’s payroll and benefits including tax payments.
RSA 279. Minimum Wage Law. Enforcement of minimum wage and overtime payments
as provided by statute.
RSA 281-A. Workers’ Compensation Law. All work related injuries are reported to this
department. These claims are processed to ensure that there is prompt payment of benefits, with hearings
conducted promptly to assure that services such as medical and vocational rehabilitation are provided to
the injured worker. All employers of one or more persons (either full or part-time) must have workers’
compensation insurance coverage.

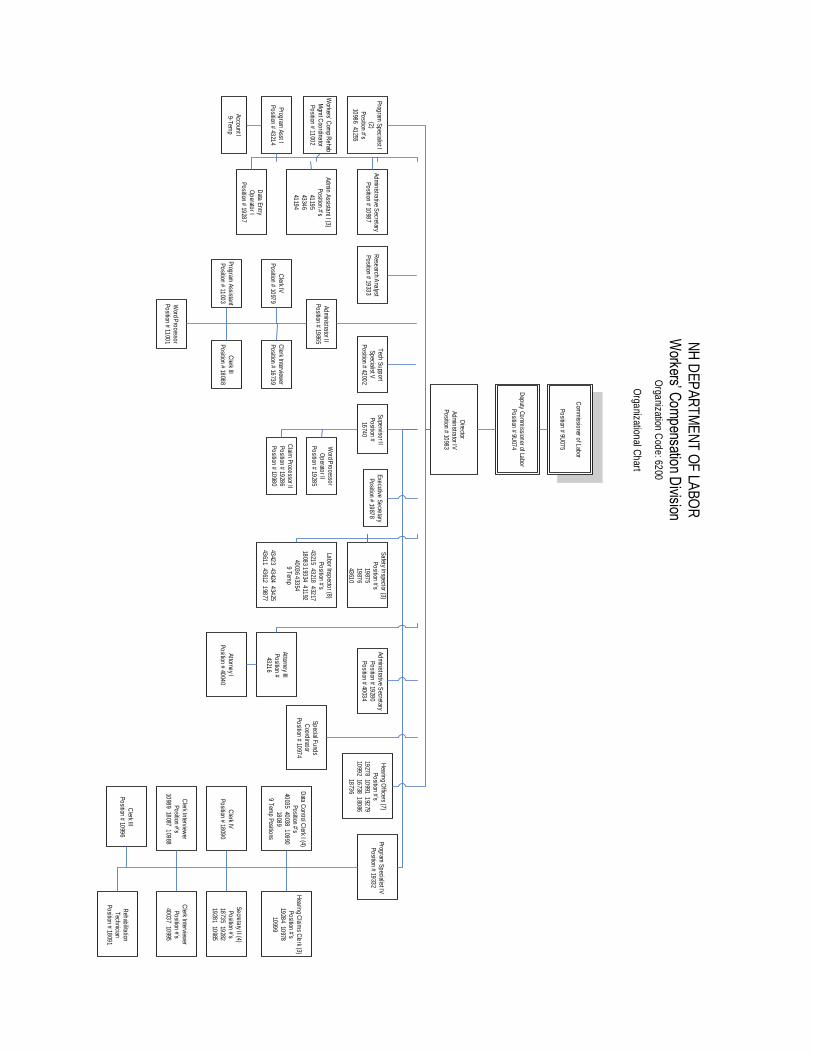
II. Organizational Charts

Commissioner of Labor
Position # 9U075
Deputy Commissioner of Labor
Position # 9U074
Business Administrator I
Position # 18733
Payroll Officer I
Position # 10977
NH DEPARTMENT OF LABORAdministration and Support
Organization Code: 6000
Organizational Chart

Commissioner of Labor
Position # 9U075
Deputy Commissioner of Labor
Position # 9U074
Wage & Hour Administrator
Position # 11000
Supervisor IV
Position # 10976
NH DEPARTMENT OF LABOR
Inspection DivisionOrganization Code: 6100
Organizational Chart
Date: 11/16/2015
Hearings Officer
Position # 18085
Chief Boiler Inspector (1)
Position # 10973
Boiler Inspector
Position # 43060
Chief Elevator Inspector (1)
Position # 43059
Elevator Inspector (2)
Position #’s
41306
10981
Secretary I I (3)
Position #’s
11005
10997
10993
Labor Inspectors (8)
Position #’s
16737
10982
10994
19872
43061
30090
11004
18084
Com
missio
ner of L
abor
Po
sition # 9U07
5
Dep
uty Co
mm
issioner of La
bor
Po
sition # 9U07
4
Dire
ctor
Ad
min
istrator IV
Po
sition # 1098
3
NH
DE
PA
RT
ME
NT
OF
LAB
OR
Workers’ C
ompensation D
ivisionO
rganization
Cod
e: 6200
Orga
nizational C
hart
Prog
ram S
pecialist I
(2)
Po
sition #’s
1098
6 41255
Workers’ C
omp R
ehab
Mgm
t Coo
rdinator
Po
sition # 1100
2
Prog
ram A
sst I
Po
sition # 4321
4
Ad
min
istrative S
ecretary
Po
sition # 1098
7
Ad
min
Assista
nt I (3)
Po
sition #’s
4119
5
4334
6
4119
4
Data
En
try
Op
erator I
Po
sition # 1928
7
Rese
arch Ana
lyst
Po
sition # 1933
3
Tech
Su
pport
Sp
ecialist V
Po
sition # 4200
2
Su
perviso
r II
Po
sition #
1674
0
Word P
rocesso
r
Op
erator II
Po
sition # 1928
5
Claim
Proce
ssor II
Po
sition # 1928
6
Po
sition # 1098
0
Exe
cutive S
ecre
tary
Po
sition # 1987
8
Sa
fety Inspector (3)
Po
sition #’s
1987
5
1987
6
4361
0
Labo
r Inspecto
r (8)
Po
sition #’s
4321
5 43218
432
17
1808
3 193
34 4
1192
4003
6 433
54
9 Tem
p
4342
3 43424
434
25
4361
1 43612
198
77
Acco
unt I
9-Tem
p
Attorne
y III
Po
sition #
4321
6
Reh
abilita
tion
Tech
nician
Po
sition # 1809
1
Clerk In
terviewer
Po
sition #’s
4003
7 10995
Se
creta
ry II (4)
Po
sition #’s
1873
5 19282
1928
1 10985
Hea
ring C
laims C
lerk (3)
Po
sition #’s
1928
4 10978
1099
9
Data
Con
trol Clerk I (4)
Po
sition #’s
4003
5 40038
109
90
1808
9
9 Tem
p Positio
ns
Clerk III
Po
sition # 1099
6
Clerk In
terviewer
Po
sition #’s
1098
9 18087
109
88
Clerk IV
Po
sition # 1809
0
Prog
ram S
pecialist IV
Po
sition # 1933
2
Hea
ring O
fficers (7)
Po
sition #’s
1927
8 10991
192
79
1099
2 16738
180
86
1873
6
Sp
ecial Fu
nds
Coo
rdinator
Po
sition # 1097
4
Ad
min
istrative S
ecretary
Po
sition # 1928
0
Po
sition # 4003
4
Attorne
y I
Po
sition # 4004
0
Ad
min
istrator II
Po
sition # 1986
5Clerk In
terviewer
Po
sition # 1673
9
Clerk III
Po
sition # 1808
8
Clerk IV
Po
sition # 1097
9
Prog
ram A
ssistant
Po
sition # 1100
3
Word P
rocesso
r
Po
sition # 1100
1

III. Personnel Data

PERSONNEL DATA
NUMBER OF AGENCY EMPLOYEES AS OF:
6/30/14 6/30/15
UNCLASSIFIED 2 2
CLASSIFIED 93 93
TEMPORARY 6 6
________________________________________________________________________
TOTAL 101 101

IV. Council & Boards

COMPENSATION APPEALS BOARD
DENNIS E. ADAMS – LABOR
DEERFIELD, NH
MARY ASHCROFT - MANAGEMENT
DERRY, NH
BENJAMIN C. BAROODY - LABOR
MANCHESTER, NH
JOSEPH A. DICKINSON, ESQ. - NEUTRAL
CONCORD, NH
MAUREEN E. DWYER-HEINRICHS – MANAGEMENT
KINGSTON, NH
ANNE EATON - LABOR
CONCORD, NH
DAVID FOSTER - MANAGEMENT
NEW LONDON, NH
ROGER E. GAGNON – LABOR
MANCHESTER, NH
SUSAN JEFFERY - MANAGEMENT
MANCHESTER, NH
LEO D. KELLY - LABOR
GOFFSTOWN, NH
HAMILTON R. KRANS, JR., ESQ. - NEUTRAL
DOVER, NH
RONALD E. LUDWIG – MANAGEMENT
MANCHESTER, NH
MARK MACKENZIE - LABOR
MANCHESTER, NH
DANIEL MANNING - LABOR

MANCHESTER, NH
RICHARD MITCHELL, ESQ. - NEUTRAL
CANDIA, NH
ROBERT MORNEAU - LABOR
WOLFEBORO, NH
DENNIS E. MURPHY, JR. - LABOR
CTR HARBOR, NH
ROBERT C. NORTON - MANAGEMENT
CONCORD, NH
HARRY G. NTAPALIS – MANAGEMENT
MANCHESTER, NH
DENIS W. PARKER – LABOR
HOOKSETT, NH
THOMAS F. PARKS, JR. – MANAGEMENT
DOVER, NH
NORMAN PATENAUDE, ESQ. – NEUTRAL
PORTSMOUTH, NH
CHRISTOPHER T. REGAN, ESQ. - NEUTRAL
DOVER, NH
CONSTANCE ROY - MANAGEMENT
WOLFEBORO, NH
WILLIAM J. SCHUBERT, ESQ. - NEUTRAL
MANCHESTER, NH

DAVID SIFF, ESQ. - NEUTRAL
CONCORD, NH
DENNIS TERAVAINEN - MANAGEMENT
HOOKSETT, NH
TIMOTHY S. WHEELOCK, ESQ. - NEUTRAL
PORTSMOUTH, NH

WORKERS’ COMPENSATION ADVISORY COUNCIL
DR. DOUGLAS GOUMAS
MANCHESTER, NH
CJ STONE
DEPARTMENT OF LABOR
STATE REP. BRIAN G. SEAWARTH
PEMBROKE, NH
SALLY MACFADDEN
DEPARTMENT OF INSURANCE
STATE SEN. GARY DANIELS
MILFORD, NH
MARGARET CROUCH, CHAIR
BEDFORD, NH
EILEEN BERNARD
HOOKSETT, NH
WILLIAM MCQUILLEN, VICE CHAIR
LONDONDERRY, NH
MARIAN MITCHELL
HOOKSETT, NH

BOARD OF CONCILIATION AND ARBITRATION
EDWARD CLANCY, ESQ.
DOVER, NH
ROBERT CRICENTI
NEW LONDON, NH
R. BRUCE GAGNON
CHESTER, NH
PENALTY APPEALS BOARD
BETH A. DERAGON, ESQ
MANCHESTER, NH
GAYLE TROY
DUNBARTON, NH
DAVID W. LAUGHTON
AUBURN, NH
V. Receipts & Expenditures

RECEIPTS AND EXPENDITURES
FISCAL YEAR 2014 FISCAL YEAR 2015
7/1/13 TO 6/30/14 7/1/14 TO 6/30/15
RECEIPTS
GENERAL FUND $ 1,562,446.00 $ 1,235,632.00
003 REVOLVING FUND $ 14,227,150.00 $ 15,291,169.00
006 AGENCY INCOME $ 1,266,478.00 $ 1,149,784.00
009 ADMINISTRATION FUND $ 6,027,184.00 $ 6,901,291.00
ARRA FUNDS $ -
FEDERAL FUNDS $ -
TOTAL RECEIPTS $ 23,083,258.00 $ 24,577,876.00
EXPENDITURES
10 PERSONAL SERVICES PERM. $ 3,594,573.00 $ 3,682,240.00
20 CURRENT EXPENSES $ 179,975.00 $ 177,758.00
22 RENTS + LEASES OTHER THAN STATE $ 29,866.00 $ 28,782.00
24 MAINTENANCE OTHER THAN BUILDING $ 5,972.00 $ 6,773.00
26 ORGANIZATIONAL DUES $ 3,489.00 $ 3,890.00
27 TRANSFER TO DOIT $ 891,469.00 $ 1,072,359.00
28 TRANSFER TO GENERAL SERVICES $ 241,063.00 $ 283,573.00
30 EQUIPMENT & REPLACEMENT $ 92,065.00 $ 21,417.00
35 SHARED SERVICES SUPPORT $ 4,592.00 $ 2,720.00
39 TELECOMMUNICATIONS $ 40,409.00 $ 39,088.00
40 INDIRECT COSTS $ 121,499.00 $ 121,499.00
46 CONSULTANTS $ - $ -
49 TRANSFER TO OTHER STATE AGENCIES $ 2,300.00 $ 2,300.00
50 PERSONAL SERVICE TEMP. $ 308,155.00 $ 354,340.00
54 TRUST FUND EXPENDITURES $ 14,227,114.00 $ 15,291,169.00
57 BOOKS, PERIODICALS & SUBSCRIPTIONS $ 4,346.00 $ 1,159.00
59 FULL TIME TEMP. $ - $ -
60 BENEFITS $ 1,931,130.00 $ 1,914,321.00
61 UNEMPLOYMENT COMPENSATION $ 2,172.00 $ 869.00
62 WORKERS COMPENSATION $ 55,534.00 $ 3,394.00
64 RETIREE-PENSION BENEFIT-HEALTH INS $ 283,954.00 $ 316,857.00
70 IN STATE TRAVEL REIMBURSEMENT $ 51,727.00 $ 59,084.00
80 OUT OF STATE TRAVEL REIMBURSEMENT $ 102.00 $ 1,220.00
92 CONTRACTUAL/TRAINING $ - $ -
TOTAL EXPENDITURES $ 22,071,506.00 $ 23,384,812.00

VI. Legislation

LEGISLATIVE CHANGES
Significant Legislative Changes During this Biennium to the Statutes Administered by the
Department Of Labor
157-A:6 – amended to clarify that certain boiler inspection exemptions apply only to private residences.
Effective 9/19/2014
157-B:8-a – elevator mechanics certification reciprocal with other states. Effective 9/22/2013
273:11-a – clarifies Commissioner of Labor’s power to enforce statutes in title XXIII. Effective
7/26/2014
273:11-b, I – amended to clarify that the Penalty Appeal Board has jurisdiction over any civil penalty
imposed by the Commissioner of Labor. Effective 8/4/2015
275:37 to 41 – amended generally to define and enforce pay equity protection. Effective 1/1/2015
275:41-b – adds protection for an employee who discloses own wages. Effective 1/1/2015
275:43 – amended to permit equalized, but less frequently than weekly, pay to school district employees,
if collectively bargained. Effective 8/25/2015
275:48 – amendment permits withholding from wages of a charity employee for the benefit of that
charity. Effective 7/26/2014
275:49 – requires a new poster in the workplace about pay equity. Effective 1/1/2015
275:71 and 72 – adds workplace protections for victims of domestic violence. Effective 9/9/2014
275:74 and 75 – adds protection for employee, preventing compelled disclosure of social media and
email. Effective 9/30/2014
275-A:4-a – amended to modernize language to prove an employee’s eligibility to work in the U.S.
Effective 8/15/2014
277-A – amended generally to follow language of federal law regarding handling and transport of toxic
substances. Effective 1/1/2016
279:21 – amended to allow employees at ballrooms to be treated as tipped employees. Effective
4/10/2015
279:22-a and 22-aa – amended to forbid subminimum wages for persons with disabilities. Effective
7/6/2015
281-A:23 – amended to assure the injured worker has the right to choose a pharmacy; but unless
“medically necessary”, prescriptions will be generic. Effective 1/1/2014
281-A:24 – amended to require that health providers have the burden of proof in any dispute as to the
reasonable value of medical services to be paid on behalf of an injured worker. Effective 9/4/2015
281-A:32-a – adds a special payment by the state for certain permanent impairments to municipal first
responders. Effective 7/21/2014

281-A:38 – amend independent medical examination procedure to give notice to injured worker that the
exam is at opponent’s request and not for treatment. Effective 1/1/2014
281-A:42-aa – corrects name of attorney group “NH Association for Justice.” Effective 5/23/2014
VII. Workers’ Compensation Division

WORKERS’ COMPENSATION
The Workers’ Compensation Division of the New Hampshire Department of Labor was created
in 1947 and has the responsibility for administration of the State’s Workers’ Compensation Law
(RSA 281-A). This law originally enacted in 1911, requires employers to maintain insurance
coverage to provide no fault workers’ compensation for employees in case of accidental injury,
death or occupational disease, “arising out of and in the course of employment” (RSA 281-A:2
XI).
The law specifies the level of medical and wage replacement income benefit to be paid to injured
workers and at the same time bars the employee from suing the employer for the injury. The
division’s coverage section is responsible for ensuring that all employers maintain this specific
insurance coverage. The claims section’s duties include scheduling and conducting hearings on
contested cases, and monitoring the service of the insurance carriers to determine that benefit
payments are provided timely. The Vocational Rehabilitation section is responsible for
monitoring the vocational rehabilitation process.
Administering and enforcing the many provisions of the workers compensation law is the
division’s primary objective. Educational efforts to inform all parties involved of the workers’
compensation process have been a top priority of this division. It is crucial that employers,
employees and insurers understand their rights and responsibilities under the law. An annual
educational conference sponsored by the New Hampshire Adjusters’ Association with assistance
from the Department of Labor, business community round table meetings and periodic special
topic workshops, along with over 9,862 individual contacts each year comprise the division’s
educational efforts.
To further educate employees and employers alike, the division has developed a web site. The
website address is www.NH.gov/labor. Included in this web site are the laws and regulations,
frequently asked questions, forms and explanations as to benefits, rights and responsibilities of
all parties involved.
The legislative initiatives over the last 25 years have provided a significant opportunity to
improve the overall performance of the New Hampshire Workers’ Compensation System.
Employers have demonstrated strong efforts in consistently providing alternative work for
employees who are unable to perform the duties of their regular job. Employees have joined
management staff in addressing workplace safety issues with the formation of joint loss
management committees. The division continues to receive input as a result of this effort on
behalf of both parties.

REPORTED INJURIES AND COMPENSABLE DISABILITIES
COMPARED WITH AVERAGE ANNUAL EMPLOYMENT IN FISCAL
YEARS 2011-2015
Injuries reported to the Department of Labor increased to 39,408 in FY 2014 from injuries
reported for 2013 with a low incidence rate of 6.1. In FY 2015, the number of injuries reported
was 38,864 with an incidence rate of 5.9. The chart below represents a decrease in the incidence
rate of injuries reported over the past 5 years with an increase in non-agricultural employment in
fiscal year 2015.
The pattern of incidence rates of lost time cases seems to be consistent over the period of the last
five fiscal years, which is reflected in the section below. In FY 2014 there were 3,529 injuries
that represented cases where the employee was disabled from work or out of work due to their
injury for four or more days. There were 3,437 lost time cases in FY 2015.
REPORTED INJURIES COMPENSABLE DISABILITIES
FISCAL NON-AGRICULTURAL INJURIES INCIDENCE LOST INCIDENCE
YEAR EMPLOYEE REPORTED RATE TIME RATE
2011 631,200 39,954 6.3 3,810 0.95
2012 641,600 39,502 6.2 3,535 0.89
2013 644,000 38,998 6.1 3,530 0.91
2014 640,300 39,408 6.1 3,529 0.90
2015 647,800 38,864 5.9 3,437 0.88
NON-AGRICULTURAL EMPLOYMENT BASED ON NH DEPARTMENT OF EMPLOYMENT
SECURITY, BUREAU OF LABOR STATISTICS FINAL MONTHLY ESTIMATES, AS REVISED.
INCIDENCE RATE IS PER HUNDRED OF EMPLOYMENT.

OCCUPATIONAL INJURY AND DISEASE STATISTICS
The following three reports include statistics developed from the First Reports of Injury (FROI)
received from employers. The first report breaks the FROI up by body part injured as reported by
the employer. The second report represents the cause of the injury, and the third report represents
the outcome of the injury as best described by the employer.
These reports must be sent in within 5 days of the employer receiving notice of the injury. The
reporting of first reports is now done electronically through EDI.

INJURY BY BODY PART
Code Body Part FY 2012 FY 2013 FY 2014 FY 2015
00 Unknown- Zeros 123 119 227 138
01 NonApplicable 300 292 262 243
10 Neck 47 40 43 62
11 Back 952 975 926 828
12 Lower Back 4,188 3,991 3,936 4,021
13 Buttocks 154 166 207 165
20 Heart 55 45 46 45
21 Brain 55 84 126 102
30 Thumb 1,211 1,221 1,207 1,210
31 Finger 4,655 4,552 4,517 4,541
32 Hand 2,875 2,764 2,737 2,613
33 Wrist 1,755 1,688 1,590 1,765
34 Arm 2,306 2,420 2,357 2,260
35 Elbow 795 728 793 741
36 Shoulder 2,086 2,181 2,156 2,152
40 Toe 358 303 339 351
41 Foot 1,082 1,115 1,042 1,039
42 Ankle 1,398 1,292 1,388 1,387
43 Leg 275 278 270 268
44 Lower Leg 967 966 1,015 926
45 Knee 2,785 2,777 2,941 2,747
46 Upper Leg 23 15 22 23
47 Hip 318 324 339 368
50 Head 1,809 1,939 1,991 2,063
51 Mouth 252 240 235 218
52 Nose 220 188 200 180
53 Eye 1,616 1,541 1,455 1,509
54 Ear 102 112 136 118
60 Lungs 158 137 164 145
70 Neck & Head 12 11 14 10
71 Neck & Shoulders 17 11 11 5
72 Neck & Back 14 18 24 15
73 Back & Leg 12 3 7 5
74 Hip & Leg 4 5 2 4
75 Foot& Ankle 6 6 11 5
76 Hand & Wrist 215 189 199 182
77 Other Multiples 3,802 3,601 3804 3,707
97 Other 2,580 2,653 2,652 2,688
99 Fatal 10 8 17 15
Totals 39,502 38,998 39,408 38,864

INJURY BY CAUSE
Code Cause Description FY 2012 FY 2013 FY 2014 FY 2015
AL Animal 693 687 679 721
AP Airborne Particles 883 930 819 800
CA Criminal Act 126 83 68 62
CL Chemicals 173 187 147 168
EL Electricity 59 47 53 56
HL Hot Liquid 722 720 719 683
HO Hit by Object 4,180 4,101 3,729 3,668
IN Insect 42 35 47 55
LA Lifting Action 7,606 7,359 6,882 6,890
MV Motor Vehicle Accident 688 737 752 747
MY Machinery 420 416 374 371
NA NonApplicable 1,449 1,364 1,236 1,255
ND Needle 43 86 64 81
OT Other 4,219 4,371 4,329 4,161
PL Plant 417 386 425 465
PR Person 2,488 2,663 2,689 2,931
PS Pinch/Squeeze 839 826 780 778
QA Quality of Air 89 34 42 48
RP Repetitious 1,286 1,221 1,225 1,095
SL Slip or Fall 7,539 7,617 9,110 8,566
SO Sharp Object 2,187 2,120 2,205 2,280
TO Tool 2,153 1,883 1,884 1,908
TW Twist 991 952 840 804
UK Unknown 206 175 306 265
WE Weather 4 4 4 6
Totals 39,502 38,998 39,408 38,864

INJURY BY OUTCOME
Code Outcome Description FY 2012 FY 2013 FY 2014 FY 2015
100 Unknown 4,622 4,266 4,450 4,344
101 NonApplicable 1,114 1,093 1,199 1,051
102 Cut or Puncture 7,671 7,703 7,550 7,543
104 Bruise 6,301 6,888 7,174 7,000
105 Muscle Pull/Strain 15,257 13,926 13,783 13,473
106 Burn 64 762 865 851
107 Bites and/or Scratches 230 240 224 332
108 Broken or Fractured Bone 1,120 1,029 1,154 1,127
109 Amputation 43 34 36 33
110 Splinter 1,099 1,040 987 1,022
120 Heart Attack 76 52 53 57
121 Stroke or Seizure 8 2 2 4
130 Carpal Tunnel 141 180 148 120
131 Tendonitis 5 2 3 2
132 Frost Bite 2 9 9 15
140 Heat Exhaustion 20 19 33 18
141 Occupational Disease (Other) 297 281 307 421
142 Hepatitis Exposure 0 6 5 4
143 Cancer or Exposure (asbestos) 1 1 1 2
144 Body Fluid Exposure 25 36 44 32
145 Electrical Shock 60 58 66 69
146 Hernia 103 116 99 119
147 Rash or Dermatitis 202 193 179 160
148 Allergic Reaction 10 9 18 11
149 Stress 779 838 767 822
160 Fumes, Dust, Smoke Inhale 44 17 24 19
161 Other Respiratory 122 104 104 89
170 Eyeglasses & Contacts 0 1 2 2
171 Vision 43 51 62 66
180 Hearing Aid 18 13 18 22
181 Hearing Loss 15 21 25 19
199 Death 10 8 17 15
Totals 39,502 38,998 39,408 38,864
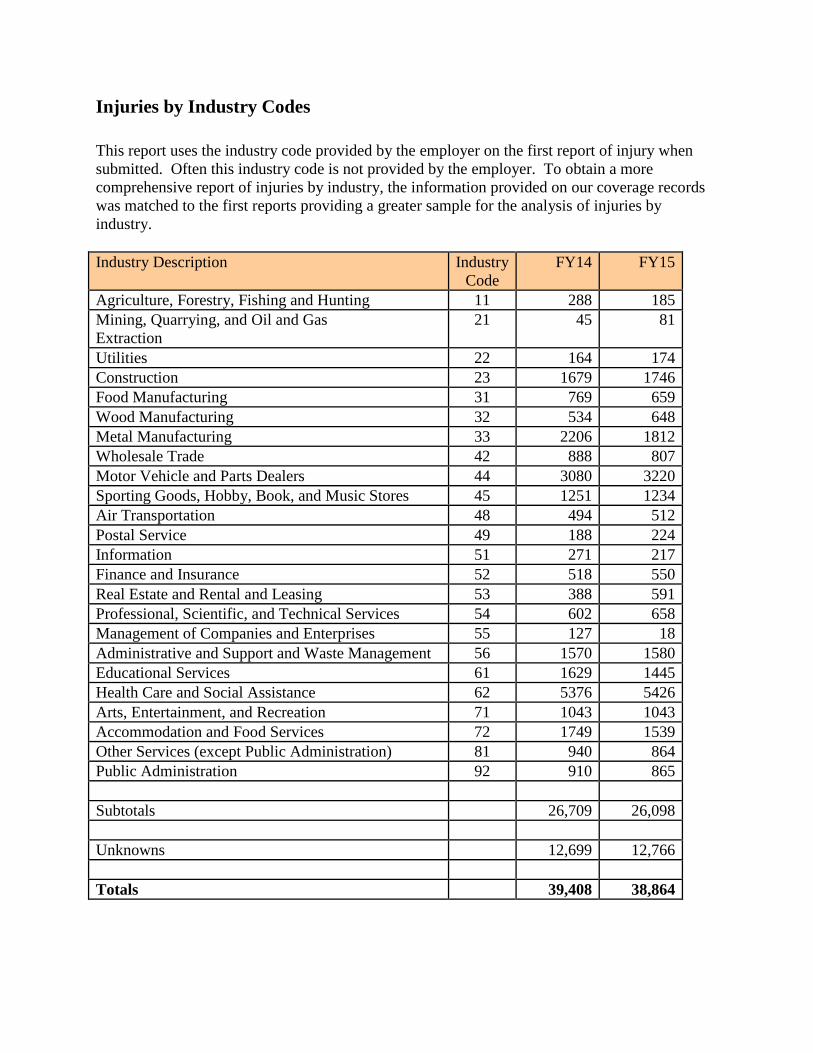
Injuries by Industry Codes
This report uses the industry code provided by the employer on the first report of injury when
submitted. Often this industry code is not provided by the employer. To obtain a more
comprehensive report of injuries by industry, the information provided on our coverage records
was matched to the first reports providing a greater sample for the analysis of injuries by
industry.
Industry Description Industry
Code
FY14 FY15
Agriculture, Forestry, Fishing and Hunting 11 288 185
Mining, Quarrying, and Oil and Gas
Extraction
21 45 81
Utilities 22 164 174
Construction 23 1679 1746
Food Manufacturing 31 769 659
Wood Manufacturing 32 534 648
Metal Manufacturing 33 2206 1812
Wholesale Trade 42 888 807
Motor Vehicle and Parts Dealers 44 3080 3220
Sporting Goods, Hobby, Book, and Music Stores 45 1251 1234
Air Transportation 48 494 512
Postal Service 49 188 224
Information 51 271 217
Finance and Insurance 52 518 550
Real Estate and Rental and Leasing 53 388 591
Professional, Scientific, and Technical Services 54 602 658
Management of Companies and Enterprises 55 127 18
Administrative and Support and Waste Management 56 1570 1580
Educational Services 61 1629 1445
Health Care and Social Assistance 62 5376 5426
Arts, Entertainment, and Recreation 71 1043 1043
Accommodation and Food Services 72 1749 1539
Other Services (except Public Administration) 81 940 864
Public Administration 92 910 865
Subtotals 26,709 26,098
Unknowns 12,699 12,766
Totals 39,408 38,864
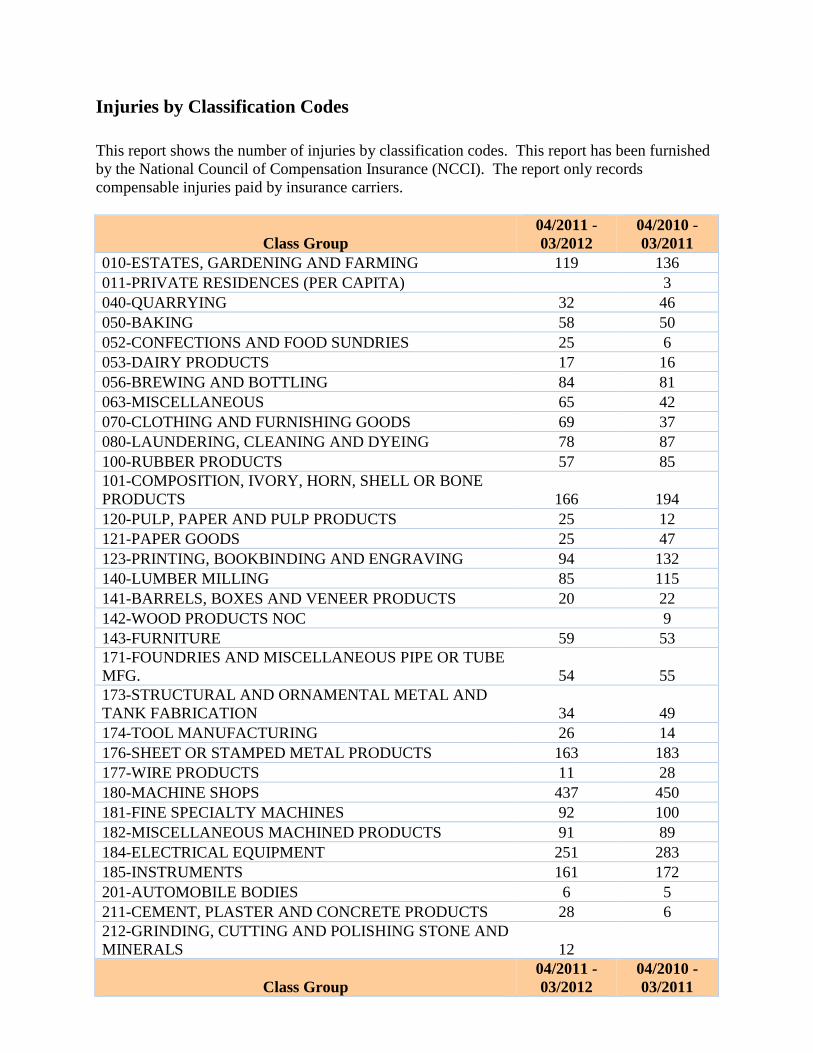
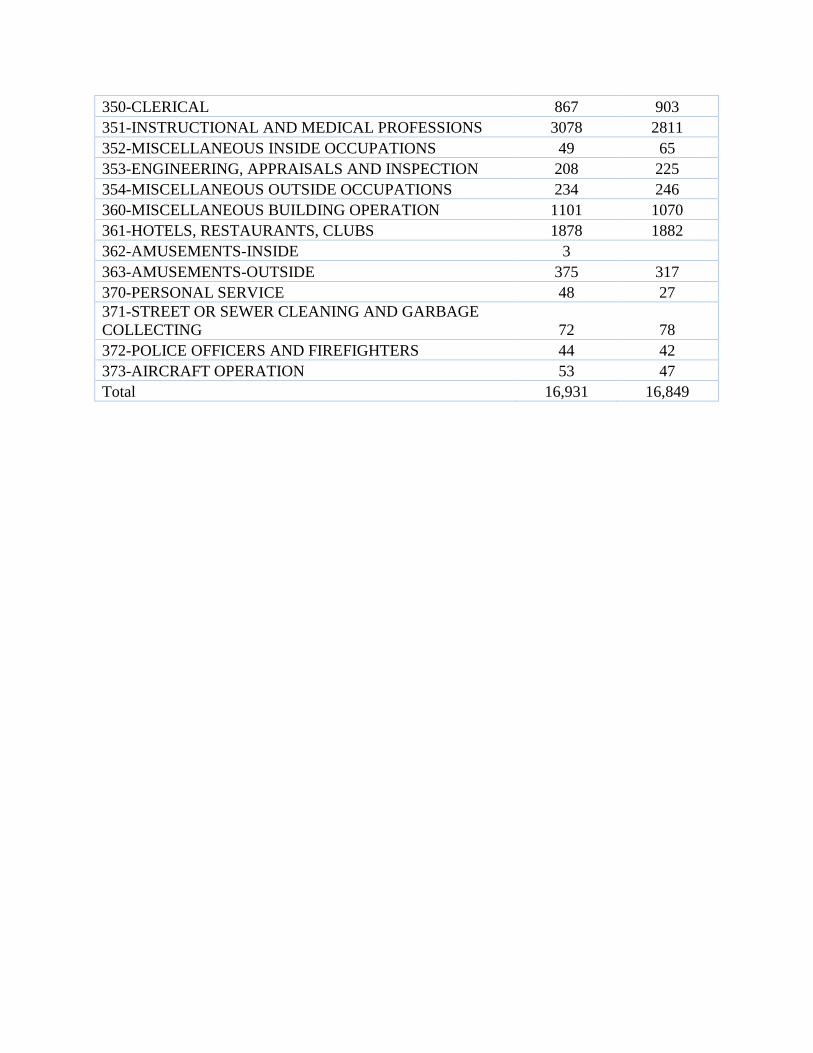
Injuries by Classification Codes
This report shows the number of injuries by classification codes. This report has been furnished
by the National Council of Compensation Insurance (NCCI). The report only records
compensable injuries paid by insurance carriers.
Class Group
04/2011 -
03/2012
04/2010 -
03/2011
010-ESTATES, GARDENING AND FARMING 119 136
011-PRIVATE RESIDENCES (PER CAPITA)
3
040-QUARRYING 32 46
050-BAKING 58 50
052-CONFECTIONS AND FOOD SUNDRIES 25 6
053-DAIRY PRODUCTS 17 16
056-BREWING AND BOTTLING 84 81
063-MISCELLANEOUS 65 42
070-CLOTHING AND FURNISHING GOODS 69 37
080-LAUNDERING, CLEANING AND DYEING 78 87
100-RUBBER PRODUCTS 57 85
101-COMPOSITION, IVORY, HORN, SHELL OR BONE
PRODUCTS 166 194
120-PULP, PAPER AND PULP PRODUCTS 25 12
121-PAPER GOODS 25 47
123-PRINTING, BOOKBINDING AND ENGRAVING 94 132
140-LUMBER MILLING 85 115
141-BARRELS, BOXES AND VENEER PRODUCTS 20 22
142-WOOD PRODUCTS NOC
9
143-FURNITURE 59 53
171-FOUNDRIES AND MISCELLANEOUS PIPE OR TUBE
MFG. 54 55
173-STRUCTURAL AND ORNAMENTAL METAL AND
TANK FABRICATION 34 49
174-TOOL MANUFACTURING 26 14
176-SHEET OR STAMPED METAL PRODUCTS 163 183
177-WIRE PRODUCTS 11 28
180-MACHINE SHOPS 437 450
181-FINE SPECIALTY MACHINES 92 100
182-MISCELLANEOUS MACHINED PRODUCTS 91 89
184-ELECTRICAL EQUIPMENT 251 283
185-INSTRUMENTS 161 172
201-AUTOMOBILE BODIES 6 5
211-CEMENT, PLASTER AND CONCRETE PRODUCTS 28 6
212-GRINDING, CUTTING AND POLISHING STONE AND
MINERALS 12
Class Group
04/2011 -
03/2012
04/2010 -
03/2011

231-MISCELLANEOUS GLASS PRODUCTS 29 17
240-CHEMICAL PRODUCTS NOC AND DYESTUFF
RATING PLAN 13
241-GASES AND MISCELLANEOUS INORGANIC
CHEMICALS 6
242-EXTRACTS, DRUGS AND MEDICINES 35 29
243-PAINTS, INK AND POLISHES 27 33
251-PHARMACEUTICAL OR SURGICAL PRODUCTS 7 27
252-PAINTING AND UPHOLSTERING 9 13
261-STREET AND ROAD CONSTRUCTION 34 41
263-DRILLING 11 12
264-CLEARING, GRADING AND EXCAVATING 216 199
265-PILE DRIVING 32 30
268-WELDING 5
269-ELECTRIC POWER AND COMMUNICATION LINE
CONSTRUCTION 5
270-RIGGING, STRUCTURAL AND ORNAMENTAL
METAL ERECTION 29 21
271-PLUMBING AND SHEET METAL ERECTION 323 353
272-INSTALLATION OF MACHINES AND EQUIPMENT 237 242
273-CONCRETE CONSTRUCTION 105 94
274-CARPENTRY 334 393
275-PAINTING AND DECORATING 58 45
276-MASONRY AND PLASTERING 50 47
277-ROOFING AND WATERPROOFING 29 35
279-MISCELLANEOUS CONSTRUCTION AND
ERECTION 123 119
280-SHIP OR BOAT BUILDING OR REPAIRING 20 25
320-OPERATION OF VEHICLES 703 697
330-PUBLIC UTILITIES 193 192
331-MISCELLANEOUS PUBLIC WORKS OPERATION 16 18
340-FOOD AND PROVISION DEALERS 381 354
341-STORES-LIGHT MERCHANDISE 409 422
342-STORES-HEAVY MERCHANDISE 579 614
343-STORES-MISCELLANEOUS 1138 1182
344-DEALERS IN ICE, FUEL, BUILDING MATERIALS
AND FEED 387 360
345-DEALERS IN SCRAP METALS AND JUNK 8
346-DEALERS IN SECONDHAND MATERIALS 401 412
347-AUTOMOBILE SERVICE AND ACCESSORIES
DEALERS 454 430
Class Group
04/2011 -
03/2012
04/2010 -
03/2011
348-LIVESTOCK
14
349-WAREHOUSING AND STORAGE 71 59
350-CLERICAL 867 903
351-INSTRUCTIONAL AND MEDICAL PROFESSIONS 3078 2811
352-MISCELLANEOUS INSIDE OCCUPATIONS 49 65
353-ENGINEERING, APPRAISALS AND INSPECTION 208 225
354-MISCELLANEOUS OUTSIDE OCCUPATIONS 234 246
360-MISCELLANEOUS BUILDING OPERATION 1101 1070
361-HOTELS, RESTAURANTS, CLUBS 1878 1882
362-AMUSEMENTS-INSIDE 3
363-AMUSEMENTS-OUTSIDE 375 317
370-PERSONAL SERVICE 48 27
371-STREET OR SEWER CLEANING AND GARBAGE
COLLECTING 72 78
372-POLICE OFFICERS AND FIREFIGHTERS 44 42
373-AIRCRAFT OPERATION 53 47
Total 16,931 16,849

Lowest Experience Modifications
In accordance with RSA 281-A: 61, Reports of the Commissioner and in conjunction with the
National Council of Compensation Insurance (NCCI), below is a list of the best performers
based on the experience modification factors promulgated by NCCI.
Employer Rating
Effective
Date
Experience
Modification
Employer Location
HITCHINER MANUFACTURING
CO INC 12/31/2014 0.60
MILFORD, NH 030554306
PEOPLES LINEN SERVICE 1/1/2014 0.62
KEENE, NH 034312019
ST PAUL'S SCHOOL 4/1/2014 0.63
CONCORD, NH 033012552
ANDROSCOGGIN VALLEY
HOSPITAL INC 10/01/2014 0.63
BERLIN, NH 035703531
SEACOAST REDICARE 1/1/2014 0.63
SOMERSWORTH, NH
038781433
FRISBIE MEMORIAL
HOSPITAL 1/1/2014 0.63
ROCHESTER, NH 038673226
FELTON INC 1/1/2014 0.64
LONDONDERRY, NH
030537435
EPSOM MANOR 1/1/2014 0.65 EPSOM, NH 032344329
MAPLE LEAF HEALTHCARE
CENTR 1/1/2014 0.65
MANCHESTER, NH
031044357
VILLA CREST HEALTH CARE
CENTER 1/1/2014 0.65
MANCHESTER, NH
031045623
NORTH BRANCH
CONSTRUCTION 1/1/2014 0.66 CONCORD, NH 033015242
AREA AGENCY OF GREATER
NASHUA 7/1/2014 0.66 NASHUA, NH 030642886
BAYSIDE DISTRIBUTING INC 7/1/2014 0.67
BRENTWOOD, NH
038336026
H & M METALS LLC 9/30/2014 0.67 AMHERST, NH 030312306
TIMELINESS OF FILING
Employers are required by law to file an injury report with the Department of Labor within five
days of being notified by the employee that an occupational injury or illness requiring medical
attention has occurred. Failure to file in a timely manner results in delays in payments owed to
claimants and health care providers alike. To discourage this, the statute provides this
department with authority to assess civil penalties of up to $2,500 to employers for each late
report. The division monitors the filing process and contacts employers who fail to report within
the required time. An “Employer’s Guide to Workers’ Compensation” is enclosed with these
contact letters to help the employer handle claims properly in the future. First time offenders are
assessed a civil penalty of $100, with the penalty increasing on a graduated basis to $2,500 for
repeat offenders.
In fiscal years 2014 and 2015, the division assessed 2,504 civil penalties on employers who had
exceeded the maximum time allowed for their injury reporting. This breaks down to 1,320
penalties assessed in FY 2014 totaling $95,150. In FY 2015, 1,184 penalties totaling $98,600
were issued to employers who sent late first reports. The number of civil penalties assessed
decreased significantly in this biennia due to electronic filings of first reports by employers and
carriers. If an employer does not pay the fine within a month, the fine will be raised and is
represented within the figures given. Since the pool of New Hampshire employers is in a
constant flux and these businesses undergo staff changes as well, a continued effort is ongoing in
educating employers about their obligations under the Workers’ Compensation Law.
INDEMNITY BENEFITS
The maximum and minimum levels of workers’ compensation benefits are tied to the State’s
Average Weekly Wage (SAWW), a figure calculated annually by the Department of
Employment Security. The SAWW in calendar year 2012 was $922.00 increasing to $936.00 in
calendar year 2013. The maximum workers compensation rate is determined by multiplying the
State’s Average Weekly Wage by 150%, as such, the associated maximum compensation rates
were $1,383 in FY2014 and $1,404 in FY 2015.
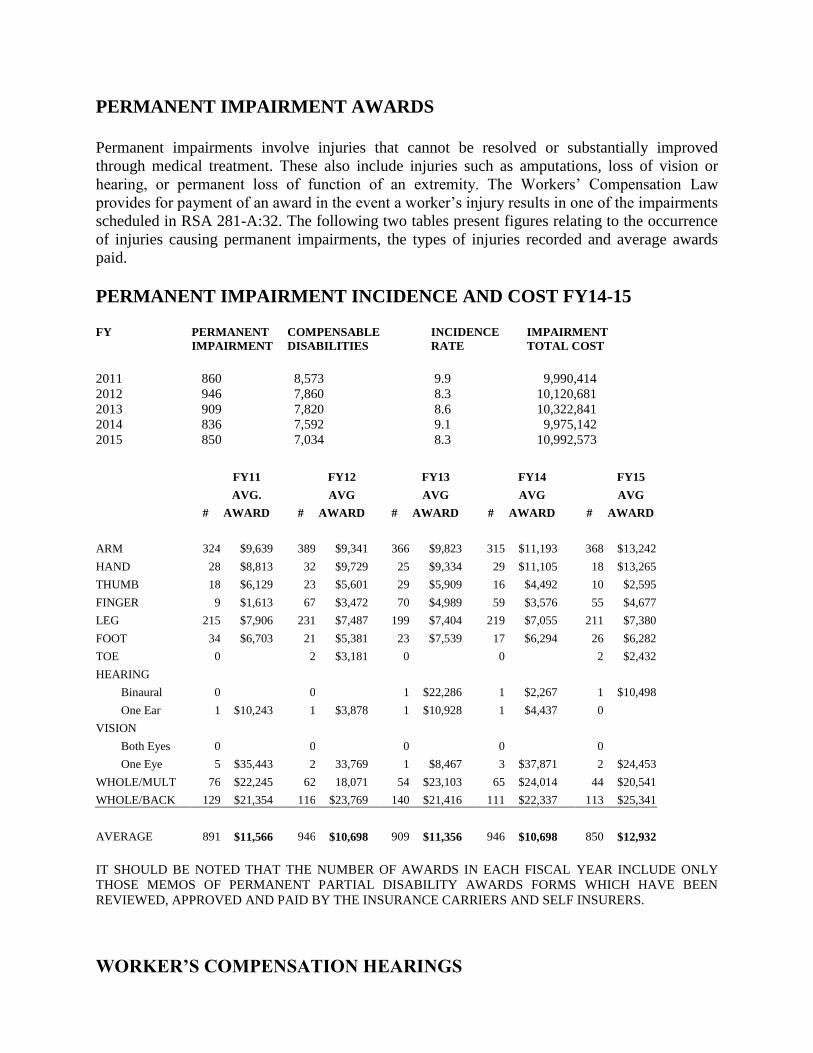
PERMANENT IMPAIRMENT AWARDS
Permanent impairments involve injuries that cannot be resolved or substantially improved
through medical treatment. These also include injuries such as amputations, loss of vision or
hearing, or permanent loss of function of an extremity. The Workers’ Compensation Law
provides for payment of an award in the event a worker’s injury results in one of the impairments
scheduled in RSA 281-A:32. The following two tables present figures relating to the occurrence
of injuries causing permanent impairments, the types of injuries recorded and average awards
paid.
PERMANENT IMPAIRMENT INCIDENCE AND COST FY14-15 FY PERMANENT COMPENSABLE INCIDENCE IMPAIRMENT
IMPAIRMENT DISABILITIES RATE TOTAL COST
2011 860 8,573 9.9 9,990,414
2012 946 7,860 8.3 10,120,681
2013 909 7,820 8.6 10,322,841 2014 836 7,592 9.1 9,975,142
2015 850 7,034 8.3 10,992,573
FY11 FY12 FY13 FY14 FY15
AVG. AVG AVG AVG AVG
# AWARD # AWARD # AWARD # AWARD # AWARD
ARM 324 $9,639 389 $9,341 366 $9,823 315 $11,193 368 $13,242
HAND 28 $8,813 32 $9,729 25 $9,334 29 $11,105 18 $13,265
THUMB 18 $6,129 23 $5,601 29 $5,909 16 $4,492 10 $2,595
FINGER 9 $1,613 67 $3,472 70 $4,989 59 $3,576 55 $4,677
LEG 215 $7,906 231 $7,487 199 $7,404 219 $7,055 211 $7,380
FOOT 34 $6,703 21 $5,381 23 $7,539 17 $6,294 26 $6,282
TOE 0 2 $3,181 0 0 2 $2,432
HEARING
Binaural 0 0 1 $22,286 1 $2,267 1 $10,498
One Ear 1 $10,243 1 $3,878 1 $10,928 1 $4,437 0
VISION
Both Eyes 0 0 0 0 0
One Eye 5 $35,443 2 33,769 1 $8,467 3 $37,871 2 $24,453
WHOLE/MULT 76 $22,245 62 18,071 54 $23,103 65 $24,014 44 $20,541
WHOLE/BACK 129 $21,354 116 $23,769 140 $21,416 111 $22,337 113 $25,341
AVERAGE 891 $11,566 946 $10,698 909 $11,356 946 $10,698 850 $12,932
IT SHOULD BE NOTED THAT THE NUMBER OF AWARDS IN EACH FISCAL YEAR INCLUDE ONLY
THOSE MEMOS OF PERMANENT PARTIAL DISABILITY AWARDS FORMS WHICH HAVE BEEN
REVIEWED, APPROVED AND PAID BY THE INSURANCE CARRIERS AND SELF INSURERS.
WORKER’S COMPENSATION HEARINGS

Hearings are scheduled to resolve disputes, which arise between the parties under the New
Hampshire Worker’s Compensation Law, RSA 281-A. In fiscal year 2014, 2,224 hearings were
scheduled and in fiscal year 2015, 2,210 hearings were scheduled. The table that follows
illustrates the number of hearings actually concluded either by decision or lump sum settlement.
NUMBER OF FORMAL HEARINGS
FY2012 FY2013 FY2014 FY2015
TOTAL SCHEDULED 2410 2333 2224 2210
HEARING/DECISION 1741 1688 1649 1622
LUMPSUM SETTLEMENT 719 725 728 677
TOTAL HEARINGS CANCELLED 102 108 67 127
$ OF SETTLEMENTS (MILLIONS) $30.8 $33.9 $36.0 $34.0
TOTAL CONCLUDED 2460 2413 2377 2299
The injured employees request the bulk of hearings as the carrier has the obligation to review the
claim and either accept or deny the claim within 21 days of the receipt of the claim. Claims are
often denied because the carrier has not received the requested records from the treating
physician. Often times after a claim has been denied, the carrier will reverse their denial and
accept the claim upon receipt of the medical documentation.
A review of the total sample of all requests for hearings indicates that in FY 2014, 63.6% of the
hearings were requested by claimants, 36.3% by the carriers and .1% by another party. In 2015,
62.9% of requests were made by claimants, 37.0% by the carriers and less than .1% by another
party. The most common issues requested by injured workers are causal relationship to
employment (did the injury happen out of and in the course of employment), extent of disability
(is the injured employee entitled to indemnity benefits) and medical, hospital and remedial care
(are the medical bills related to the injury). Carrier requested hearings are mostly on the issue of
extent of disability (is the employee still disabled as a result of the injury) and non-cooperation
with vocational rehabilitation (is the injured employee cooperating with the vocational
rehabilitation process).
Decisions rendered in FY 2014 reflect that 35.6% favored the claimant and that 56.6% favored
the carrier with 7.8% producing a split decision in which both parties won on some aspect.
Statistics for FY 2015 show 39.8% for the claimant, 53.6% for the carrier and 6.6% for both.
An analysis of the time that elapses between the request for the hearing and the date on which the
hearing was first scheduled reflects that an average of 70.49 days elapsed from request to

scheduled hearing date in FY 2014 with the time decreasing to 66.59 days in FY 2015. The time
delay generally occurs in clarifying issues and parties needed for attendance at the hearing.
In New Hampshire, parties to workers compensation hearings are not required to be represented
by legal counsel, but many choose to retain an attorney. At the time of hearing, 83.2% of the
claimants retained counsel in FY2014, with 81.4% retaining counsel in FY2015. Carriers
retained counsel 95.5% of the time in FY2014, and 95.7% of the time in FY2015.
WORKERS’ COMPENSATION APPEALS
The Compensation Appeals Board began conducting appeal hearings on April 12, 1991.
APPEAL HEARINGS FY2012 FY2013 FY2014 FY2015
APPEALS REQUESTED 631 610 569 586
APPEALS SCHEDULED 550 525 535 525
APPEALS CANCELLED* 324 308 349 323
DECISIONS RENDERED 226 217 186 202
DECISIONS SUSTAINED 139 145 121 132
DECISIONS REVERSED 87 72 65 70
(* Appeals Cancelled also includes appeals that were Continued and Withdrawn.)
Since the appeal to the Compensation Appeals Board results in a new or de novo hearing at
which additional evidence may be introduced, the decision of the appeal board may be different
from the one issued by the hearing officer at the department level. For statistical purposes if the
board decision is substantially different, it is counted as reversed. If it is substantially similar, it
is counted as sustained.

WORKERS’ COMPENSATION COVERAGE The goal of the coverage unit is to educate and elicit compliance with New Hampshire Workers
Compensation Laws to ensure that all employers in the State of NH provide their employees with
workers compensation coverage. The coverage unit within the Department of Labor tracks
employers through their coverage activity and allows the department to identify and pursue
employers in violation of coverage requirements. The following charts are demonstrative of the
activity within the coverage area.
FY 2012 FY 2013 FY 2014 FY 2015
COVERAGE ACTIVITY:
VOLUNTARY COVERAGE 67,306 64,725 65,821 60,584
ASSIGNED RISK 20,591 22,969 25,372 25,793
SELF INSURED 910 868 1,085 897
REINSTATEMENTS 19,508 18,924 19,958 19,644
TOTALS 108,315 107,486 112,236 106,918
TERMINATION ACTIVITIES:
1. CHANGE OF CARRIER 2,008 1,686 1,655 1,548
2. OUT OF BUSINESS 437 488 429 450
3. BUSINESS SOLD 290 195 237 227
4. NO EMPLOYEES 307 299 289 299
5. PREMIUM PAYMENT DUE 15,066 14,977 14,910 13,627
6. REQUEST OF CARRIER 11,419 11,060 11,920 12,424
TOTALS 29,527 28,705 29,440 28,575
.
The following amounts reflect a summary of statistical data for civil penalties collected in the
Workers’ Compensation Coverage Division. These penalties are collected from carriers for
failure to accurately file coverage forms with the department and are collected from employers
for failure to obtain or maintain workers’ compensation coverage.
COLLECTED FROM FY2012 FY2013 FY2014 FY2015
CARRIERS $571,520 $595,603 $502,841 $449,120
EMPLOYERS $245,952 $247,183 $290,895 $196,944
GRAND TOTAL $817,472 $842,786 $793,736 $646,064
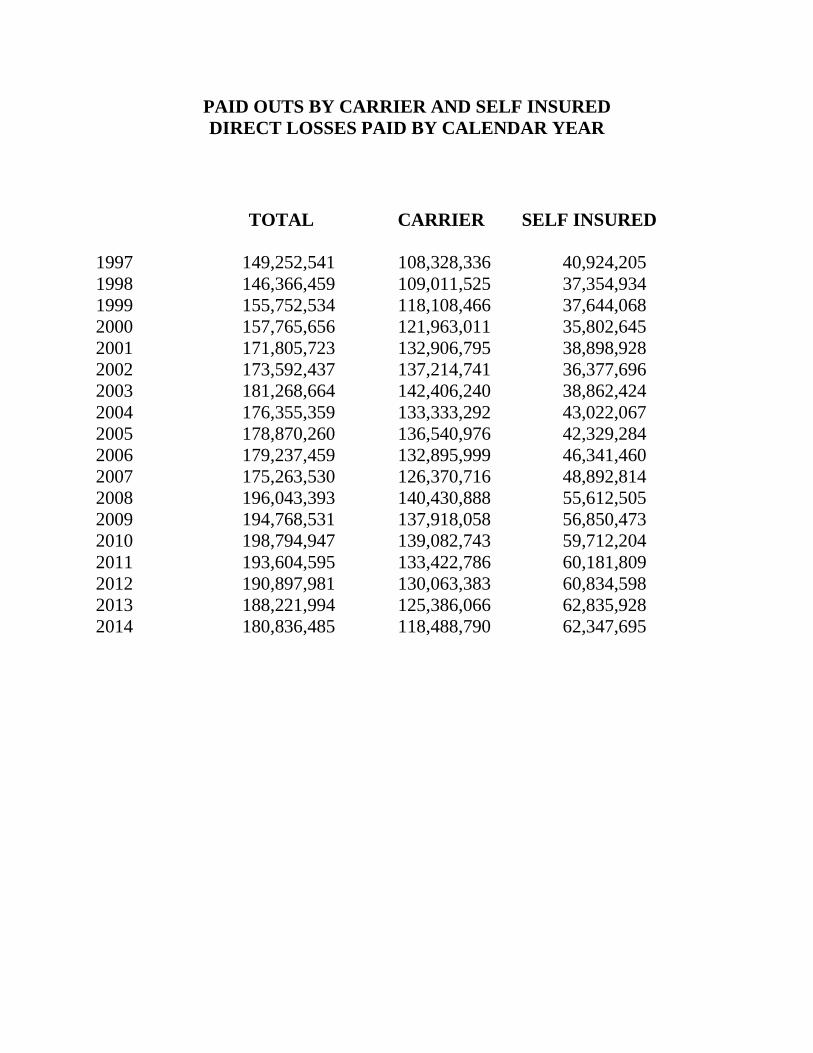
PAID OUTS BY CARRIER AND SELF INSURED
DIRECT LOSSES PAID BY CALENDAR YEAR
TOTAL CARRIER SELF INSURED
1997 149,252,541 108,328,336 40,924,205
1998 146,366,459 109,011,525 37,354,934
1999 155,752,534 118,108,466 37,644,068
2000 157,765,656 121,963,011 35,802,645
2001 171,805,723 132,906,795 38,898,928
2002 173,592,437 137,214,741 36,377,696
2003 181,268,664 142,406,240 38,862,424
2004 176,355,359 133,333,292 43,022,067
2005 178,870,260 136,540,976 42,329,284
2006 179,237,459 132,895,999 46,341,460
2007 175,263,530 126,370,716 48,892,814
2008 196,043,393 140,430,888 55,612,505
2009 194,768,531 137,918,058 56,850,473
2010 198,794,947 139,082,743 59,712,204
2011 193,604,595 133,422,786 60,181,809
2012 190,897,981 130,063,383 60,834,598
2013 188,221,994 125,386,066 62,835,928
2014 180,836,485 118,488,790 62,347,695
VOCATIONAL REHABILITATION SERVICES
It is the understanding and philosophy of the department that the vocational rehabilitation of
occupationally disabled individuals is the most efficient and economical approach to the
resolution of problems experienced by injured employees to establish an alternative to their
previous occupation. It is the department's goal to ensure that, when appropriate, full
rehabilitation is afforded to each individual, with a return to suitable employment as the eventual
outcome. The department monitors and, as necessary, directs the process.
All referrals of injured employees by the insurance companies for vocational rehabilitation are
reported to the department. Other documents required are the Individual Written Rehabilitation
Plan (IWRP), as of 01/01/91, and the notification of the closure of services. In FY12, the
rehabilitation unit staff received 85 referrals, and the injured employees were contacted via mail
to reinforce their cooperation with the process. All cases are now closed in the following
statuses: 19 have returned to work; 19 received lump sum settlements; 10 cases were closed
because the injured employee was too disabled for services; 25 referrals were closed at the
carrier's request; and, 12 were closed for “other reasons”. This last category includes reasons
such as relocation out of state, refused service, death, Labor Department Hearing Decision,
medical management only, and other circumstances not elsewhere classified.
In reviewing FY13, there were 81 referrals. All but one of these cases are currently closed.
(One injured employee is finishing school.) The closure breakdown is: 13 have returned to
work; 23 have received lump sum settlements; 3 cases were closed because the injured employee
was too disabled; 15 referrals were closed at the carrier's request; and, 26 were closed for “other
reasons”.
In FY12, the average length of time from date of injury to date of referral has increased to 747
days. In FY13, the average increased to 788 days. To achieve a positive outcome, VR referrals
need to be made much, much earlier in the process. The average duration of services (from date
of referral to date of closure) increased to 190 days in FY12 and decreased to 214 days in FY13.
The time frame needed for a vocational rehabilitation case to progress from the date of injury to
the date of closure has increased to 31.3 months in FY12 and to 32.7 months in FY13. Since the
vocational rehabilitation statistics are based on the date of referral to vocational rehabilitation,
the data collected reflect the FY12 and FY13 years even though some closures may have
occurred during 2014. Data for the fiscal years 2014 and 2015 will be available in the next
biennial report.
The following is a summary of the services being provided in the Individual Written
Rehabilitation Plans filed with the department on behalf of the employees receiving vocational
rehabilitation services. In FY12 and 13, job placement occurred in 38.5% of the cases, while
9.5% were receiving vocational counseling, exploration, and/or testing. Educational and skill
training in FY12 and FY13 occurred in 9% of the cases, an increase of 4.5% from the previous
biennium. Many injured employees still continue to need various skills training to enhance their
job placement. There have been 13 formal Training Agreements approved by the department in
FY12, and 14 in FY13. This is a very slight increase from the previous biennial report. The
percentage of cases having no IWRPs written for service was 47% of all the referrals in FY12
and 37% for referrals in FY13.

Other functions of the vocational rehabilitation staff include dispute resolution, review of
requests for job modification reimbursement, and review of reports of extended disability (form
74 WCA). Most dispute resolution is done via the telephone. However, there were occasions
when rehabilitation meetings were held at the department. In this biennium, the number of
hearings scheduled for non-cooperation with vocational rehabilitation has decreased by 75%
while the number of hearings scheduled on eligibility for vocational rehabilitation has decreased
by 30%. On the Appeal level, the number of hearings has risen by 42% for eligibility for VR
and remains the same for non-cooperation with VR.
All requests for reimbursement for job modification are reviewed and approved or denied by this
office. In calendar year 2012, 28 applications were approved, and 3 were denied. A total of
$9,700.28 was reimbursed to 17 employers, none of whom received the maximum
reimbursement of $5000.00. In 2013, 37 applications were approved, and none were denied.
The 21 employers received a total of $23,300.02. Only one employer received the maximum
reimbursement of $5000.00. Even though the application process is simple, the number of
employers taking advantage of this program continues to be very small.
With regards to Reports of Extended Disability (74WCA), 101 were reviewed in FY12 and 84
were done in FY13. The number of cases submitted for review in this biennium dropped by
37%. But as the number of First Reports continues to drop, so will the number of 74 WCA’s
submitted.
Effective 01/01/95, any person providing vocational rehabilitation services under RSA 281-A:25
as a vocational rehabilitation provider has to be certified by the Department of Labor. The
governor appoints a Vocational Rehabilitation Provider Advisory Board. The responsibilities of
this Board include the review of the applications and renewals. Currently, there are 38 Certified
Vocational Rehabilitation Providers (CVRP) in 7 states serving injured employees from NH.
The number of available CVRPs continues to decrease every biennium. Many providers are
seeking other areas of work because of the lack of Workers’ Compensation referrals. Training
sessions are provided several times a year to these individuals by the department’s Vocational
Rehabilitation staff.
Formal presentations and informal discussions are on going. The educational effort is
continuous. With all the parties being well informed, the injured employee should benefit by
being returned to the employment world with a restored earning capacity.

WORKERS’ COMPENSATION MANAGED CARE
Workers’ Compensation Managed Care has been providing case management to injured workers
since 1994. There are currently seven (7) approved Managed Care Organizations in New
Hampshire that provide case management services statewide. Approval to operate a managed
care organization in NH is granted by the Workers’ Compensation Advisory Council on the
recommendation of the Department of Labor.
The program criteria and approval process is outlined in the Workers’ Compensation Managed
Care rules, LAB 703. The organization is required to submit to the Department of Labor a copy
of their managed care program. The Commissioner reviews the program criteria to confirm that
it meets the necessary components as specified in managed care rules. Additionally, the
commissioner shall review each managed care program for purposes of determining the
program’s continued compliance with the standards for approval and delivery of service prior to
the expiration of 3 years from the date the program’s approval was ratified by the advisory
council. Subsequent reviews shall take place at least once every 5 years thereafter, or whenever
the commissioner determines that such a review is required.
Managed Care Organizations offer the services of an injury management facilitator (IMF) and a
comprehensive network of medical providers to assist the employee with their workers’
compensation claim. The IMF is able to provide education on the workers’ compensation
process to employers and employees. These services are the keys to successful implementation
of managed care.
Injury management facilitators, who are approved by the WC Advisory Council, provide case
management to the injured employee. The IMF’s role is to coordinate among the injured
employee, health care professional and insurer to provide the employee with timely, effective
and appropriate health care services in order to achieve maximum medical improvement and an
expeditious return to work. They must follow the protocols of the Managed Care Organization
who has retained their services.
The Department of Labor closely monitors the performance and impact of managed care
organizations in NH. Injury management facilitators are required to participate in training
seminars and/or use training tapes on the laws and rules of Managed Care and benefit provisions
of the Workers’ Compensation law.

VIII. Inspection Division

INSPECTION DIVISION
The Inspection Division is responsible for administering and enforcing the NH Protective
Legislation Law, NH Citizens Job Protection Law, NH Whistleblowers’ Protection Act, NH
Youth Employment Law, NH Minimum Wage Law, NH WARN Act (Worker Adjustment and
Retaining Notification Act), NH Boiler and Pressure Vessel Law, NH Elevator and Accessibility
Lift Law, Safety & Health Laws, and the Worker’s Right to Know Law. Along with these laws,
the division also enforces administrative rules dealing with the payment of wages, safety and
health, whistleblowers’ protection, youth employment, boilers, pressure vessels, and elevators.
The division staff processes and adjudicates wage claims and whistleblowers’
complaints. Hearings are held concerning the claims as well as the disbursement of checks
secured concerning the disputes. The division also settles many disputes via telephone and e-mail
when possible.
The division conducts full inspections to ensure employers are in compliance with all NH
labor laws, which may result in payment of wages due to employees as well as civil penalties
assessed against employers. The Division has implemented an informal settlement process for
employers to attend to show compliance and settle civil penalties often without the need for a
formal hearing.
Education has been a major objective of the Inspection Division through seminars being
held throughout the state as well as e-mail alerts sent out to employers.
Monitoring of all workers under 18 is another task of the Division, by checking for
compliance with the NH Youth Employment laws concerning permits, hours worked and type of
occupations held.
Students participating in school-sponsored work programs are being afforded the
protections provided by labor laws. Such programs as School-To-Work, Co-op Programs,
Internships and Building Trades Programs are required to be registered and approved by the
Division to ensure a safe quality learning experience.
Another part of the Division’s responsibility is to ensure continued compliance with
elevator, accessibility lift, boiler, and pressure vessel safety codes adopted by New Hampshire.
This is done by inspection, enforcement, administration and licensing processes, which protect
employees and other citizens who may go into a building where there are elevators and/or
accessibility lifts, boilers, or pressure vessels.
Along with performing safety related inspections in various work places, the Division
performs safety related training seminars throughout the state to inform employers of the law and
their responsibilities. The staff assists employers on developing their own personalized safety
program. Also, Safety Summary Forms required to be filed with the Department of Labor are
monitored and reviewed for compliance with NH safety laws and rules.
Information is available at www.NH.gov/labor.
VIII. Inspection Division
Appendix A: Wage & Hour

W&H TOTAL COLLECTED
WAGE CLAIM PROCESS
Written claims are filed by employees for unpaid wages, commissions and unpaid fringe
benefits, such as vacation pay, holiday pay, severance pay, sick pay, bonuses, expenses, etc. The
process is by mail and/or online and may or may not include a hearing.
FY 2014 FY 2015
TOTAL EMPLOYERS 653 585
TOTAL EMPLOYEES 752 620
WAGES COLLECTED $ 447,577 $ 871,174
FY 2014 FY 2015
WAGE CLAIMS $ 447,577 $ 871,174
WAGE COMPLAINTS $ 140,946 $ 134,126
WAGE ADJUSTMENTS $ 322,284 $ 569,764
TOTAL MONIES TO EMPLOYEES
$ 910,807 $ 1,575,064

WAGE COMPLAINT PROCESS
The wage complaint process occurs when an employee notifies the division via telephone or
email with a wage complaint and an inspector calls the employer. As a result of a call, the
employer subsequently pays the wages.
FY 2014 FY 2015
TOTAL EMPLOYEES 353 356
TOTAL COLLECTED $ 140,946 $ 134,125
WAGE ADJUSTMENTS
FY 2014 FY 2015
NUMBER OF EMPLOYERS FOUND IN VIOLATION 148 136
DOLLARS COLLECTED $ 322,284 $ 569,794

.
ONSITE INSPECTIONS
INSPECTIONS CONDUCTED FY 2014 FY 2015
FIRST INSPECTION 639 831
COMPLAINT 1
REINSPECTION 17 4
SPECIAL 43 79
TOTAL INSPECTIONS 700 914
% BREAKDOWN OF VIOLATIONS
FY 2014 FY 2015
YOUTH EMPLOYMENT 6.9 11.8
PROTECTIVE LEGISLATION 61.8 58.3
MINIMUM WAGE 23.6 25.8
BOILERS 0 0
ELEVATORS 0 0
CITIZEN PROTEC TIVE LEG ISLATIVE 6.5 3.5
SAFETY .8 .3
WORKERS COMP .4 .3
TOTAL % 100 100
FY 2014
1 2 3 4 5
FY 2015
1
2
3
4
5

WHISTLEBLOWERS’ PROTECTION ACT
The Whistleblowers’ Protection Act process allows employees who feel they were discriminated
against or discharged for either reporting an alleged violation of law, or that they participated in
an investigation regarding the violation, or for refusal to execute an illegal directive to file a
claim. These employees could be seeking back wages, benefits, reinstatement of their job,
seniority level or any other injunctive relief the department believes should be provided. The
Departments issue a decision after the hearing is held.
FY 2014 FY 2015
HEARING- CLAIM VALID 0 0
HEARING- CLAIM INVALID 4 6
HEARING- NO APPEARANCES 0 0
NO JURISDICTION 1 0
APPEAL 0 0
CLAIMANT DID NOT PURSUE 2 1
SETTLED 0 0
TOTAL CASES CLOSED 7 7
HEARINGS
One of the functions of the Department is to hold hearings regarding the wage claim,
Whistleblowers’ and Civil Penalty assessments. *The Civil Penalty process also allows an
informal meeting to occur previous to a formal hearing. This process has been very successful
which has decreased the necessary for formal hearings, including employers with many locations
and multiple cases. In response to the wage claims, we did additional Orders for Payments,
which do not involve holding a hearing, as allowed by the statute. Also, civil penalty appeals
board hearings are held by the appeals board at the department.
FY 2014 FY 2015
WAGE CLAIM HEARINGS 338 299
CIVIL PENALTY HEARINGS 153 110
CIVIL PENALTY APPEALS BOARD HEARING 5 15
WHISTLEBLOWERS’ HEARINGS 4 4
WAGE ADJUSTMENT HEARINGS 34 23
TOTAL HEARINGS CONDUCTED 534 451
INFORMAL MEETINGS HELD 296 193
ORDERS FOR PAYMENT 31 20

CIVIL PENALTIES
Civil penalties are assessed to employers when violations of the New Hampshire Labor Laws
have been cited.
ASSESSMENTS-COLLECTED: FY 2014 FY 2015
SAFETY $ 58,075 $ 28,865
YOUTH EMPLOYMENT 66,492 76,000
MINIMUM WAGE 17,050 45,230
PROTECTIVE LEGISLATION 170,240 294,390
BOILER 19,150 17,850
ELEVATOR 26,700 68,100
PRESSURE VESSEL 11,375 11,850
CITIZENS PROTECTION 6,800 20,525
WORKERS COMPENSATION 829,906 689,019
TOTAL $1,205,788 $1,251,829

YOUTH EMPLOYMENT
To ensure that minors are not placed in hazardous jobs, the Division monitors all NH Youth
Employment Certificates issued by the school principals and superintendents. The NH Youth
Employment Law does not require certificates for 16 and 17 year old minors to be reported to
this division. Written parental permission is required to be kept on file at each employer for 16
and 17 year old minors.
FY 2014
AGE MALES FEMALES TOTALS
12 & 13 77 114 191
14 & 15 1476 1622 3,098
TOTAL: 3,289
FY 2015
AGE MALES FEMALES TOTALS
12 & 13 69 88 157
14 & 15 1,670 1,813 3,483
TOTAL: 3,640

VIII. Inspection Division
Appendix B: Boiler & Elevator Inspections
BOILER AND ELEVATOR ACTIVITY
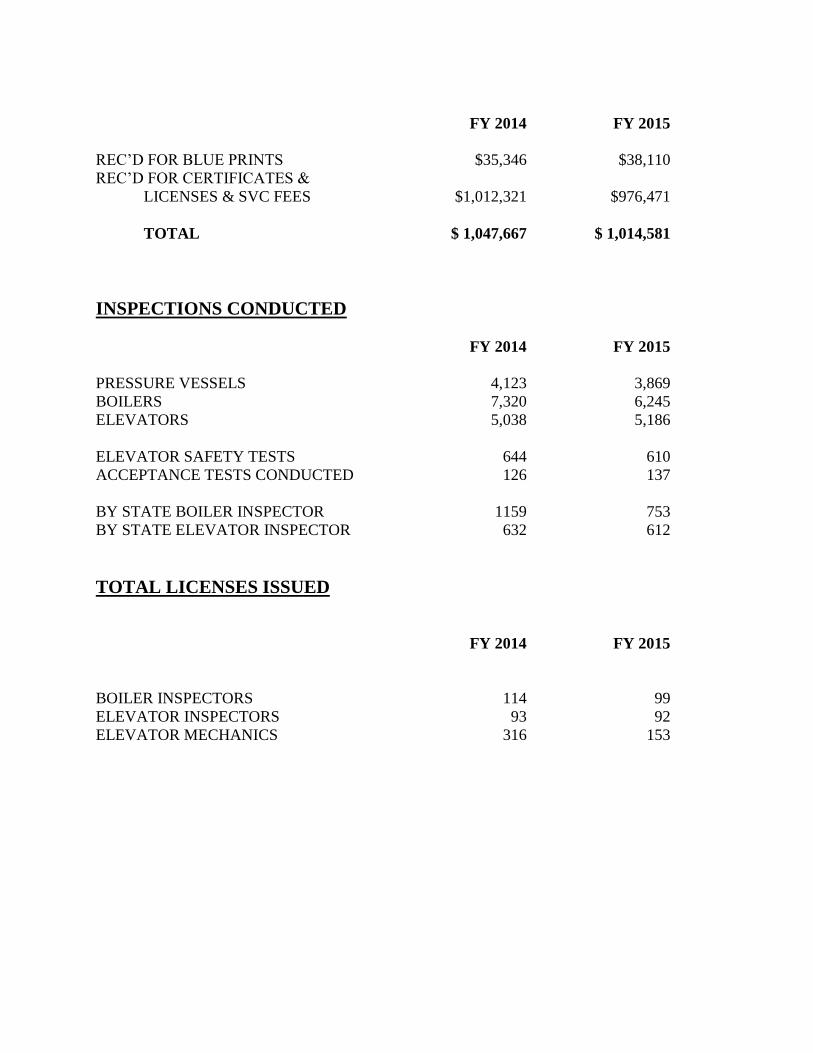
FY 2014 FY 2015
REC’D FOR BLUE PRINTS $35,346 $38,110
REC’D FOR CERTIFICATES &
LICENSES & SVC FEES $1,012,321 $976,471
TOTAL $ 1,047,667 $ 1,014,581
INSPECTIONS CONDUCTED
FY 2014 FY 2015
PRESSURE VESSELS 4,123 3,869
BOILERS 7,320 6,245
ELEVATORS 5,038 5,186
ELEVATOR SAFETY TESTS 644 610
ACCEPTANCE TESTS CONDUCTED 126 137
BY STATE BOILER INSPECTOR 1159 753
BY STATE ELEVATOR INSPECTOR 632 612
TOTAL LICENSES ISSUED
FY 2014 FY 2015
BOILER INSPECTORS 114 99
ELEVATOR INSPECTORS 93 92
ELEVATOR MECHANICS 316 153

VIII. Inspection Division
Appendix C: Safety

SAFETY INSPECTIONS
Safety and health inspections and safety and health training sessions continue to be an important
function of the Inspection Division. We continually provide these services to numerous public
and private employers. Compliance inspections conducted in the public sector encompass all
municipalities and public schools.
SAFETY COMPLIANCE INSPECTIONS
FY 2014 FY 2015
Initial 32 40
Re-Inspection 11 25
Complaints 2 5
Accident Investigation 2 0
No Safety Summary Form 493 190
Investigations 475
Other 26 15
Totals 566 750

VIII. Inspection Division
Appendix D: Training
STATE APPRENTICESHIP ADVISORY COUNCIL
Report 7/1/2013– 6/30/2015
The State Apprenticeship Advisory Council is established by RSA chapter 278. It is composed
of representatives from the Department of Labor, Department of Employment Security, and the
Department of Education along with two appointed members who represent employers and two
who represent employees. The Council meets quarterly or as often as needed to establish,
maintain, review and recommend the approval of apprenticeship programs and assist the USDOL
Office of Apprenticeship in any way necessary.
During the period of July 1, 2013 to June 30, 2015, the State Apprenticeship Advisory Council
met 7 times and reviewed and recommended 276 program sponsors. In addition, 3,367
apprentices were served of which 786 completed with an average wage of 21.60.
The Council approves curriculum, reviews credit requests, receives information on the progress
of ongoing apprenticeship programs, and stays up-to-date on changes in the federal regulations
regarding apprenticeship, and also discuss many other topics that affect the apprenticeship
program.

LABOR LAW TRAINING
The Inspection Division held seminars in different locations around the State offering training to
employers, both in the public and private sectors in order to assist them in understanding how to
stay in compliance with NH labor laws. Free packets consisting of the NH Labor laws,
Administrative Rules, Posters and other forms are supplied to all participants.
FY14 FY15
TRAINING SESSIONS 27 27
EMPLOYERS TRAINED 1,648 1,649

IX. Physical Plant & Property
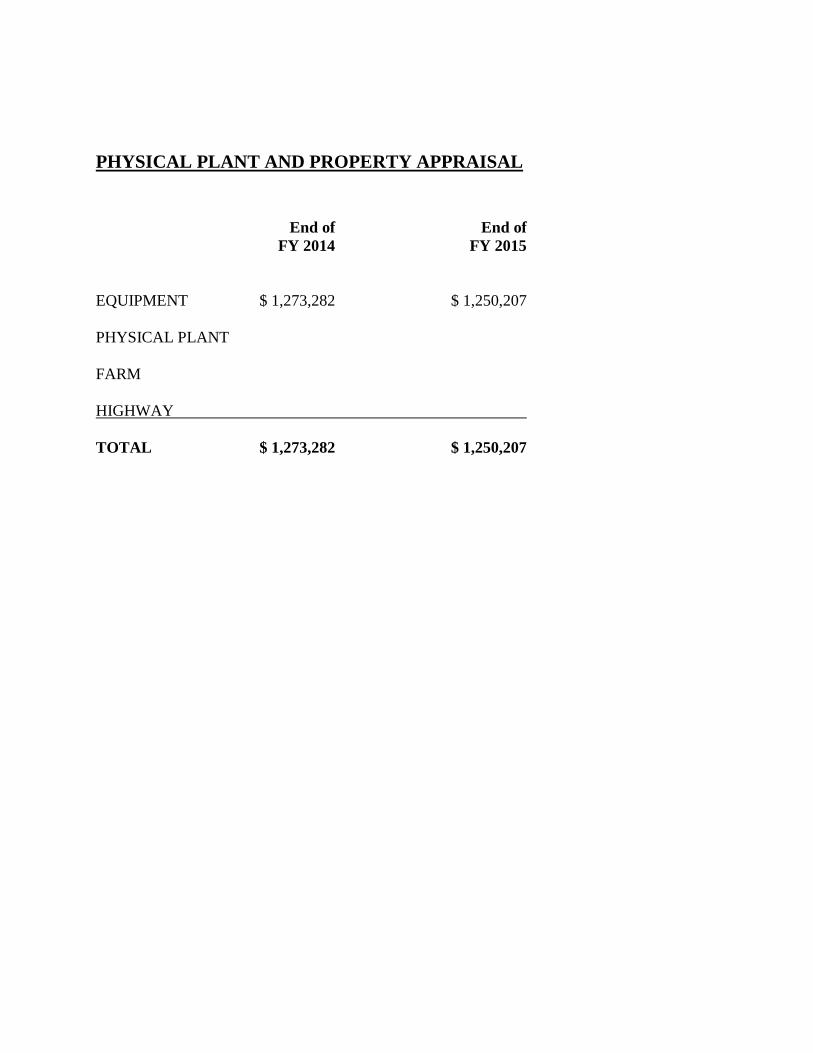
PHYSICAL PLANT AND PROPERTY APPRAISAL
End of End of
FY 2014 FY 2015
EQUIPMENT $ 1,273,282 $ 1,250,207
PHYSICAL PLANT
FARM
HIGHWAY
TOTAL $ 1,273,282 $ 1,250,207


![NEW HAMPSHIRE ARTS NEWS 2004 - NH.gov...NEW HAMPSHIRE ARTS NEWS 2004 Katherine Min Fiction Writer Plymouth 2004 Fellow [ Volume XXII Number 2 Summer 2004 ] Photo by Julie Mento T ABLE](https://img.dokumen.tips/doc/110x75/5f08fa2e7e708231d424a3f4/new-hampshire-arts-news-2004-nhgov-new-hampshire-arts-news-2004-katherine.jpg)